Article

Assessment of Gravity Deportment of Gold-Bearing Ores: Gravity Recoverable Gold Test

1
Department of Environmental Engineering, Faculty of Mining and Geology, VSB—Technical University of Ostrava, 708 00 Ostrava, Czech Republic
2
Department of Mining Engineering and Safety, Faculty of Mining and Geology, VSB—Technical University of Ostrava, 708 00 Ostrava, Czech Republic
*
Author to whom correspondence should be addressed.
Minerals 2024, 14(12), 1279; https://doi.org/10.3390/min14121279
Submission received: 21 November 2024 / Revised: 10 December 2024 / Accepted: 12 December 2024 / Published: 16 December 2024

Abstract

:
This study investigated the potential of low-grade gold deposits in modern mining, particularly in the context of declining high-grade resources. The primary method for processing these ores was gravity separation with the Knelson concentrator. A GRG test (gravity recoverable gold test) was conducted on two gold-bearing samples: a polymetallic Cu-Zn-Au ore from Zlaté Hory–Západ (Czech Republic) containing refractory gold and an ore with free gold from Kašperské Hory (Czech Republic). The study evaluated the effectiveness of the GRG test for gold recovery from these ores. The results showed that the Kašperské Hory sample predominantly contained relatively large gold grains, with recovery rates dropping significantly upon finer comminution. In the sample from the Zlaté Hory–Západ deposit, the greatest GRG release occurred in the first and last test stages, suggesting that larger sulfide grains with bound gold passed predominantly in the first stage, while fine gold with residual sulfides passed in the third. Both samples achieved high overall GRG recovery rates, with 64.2% for Kašperské Hory and more than 66% for Zlaté Hory–Západ, demonstrating the efficacy of centrifugal concentrators for both ores.

1. Introduction

Gold is recognized as a critical raw material due to its multifaceted applications across various industries, including electronics, jewelry, and finance. Its unique properties, such as high conductivity, resistance to corrosion, and malleability, make it indispensable in the manufacturing of electronic components, where it is used in connectors, switches, and other critical parts [1,2]. The growing demand for gold, driven by its use in electronics, jewelry and as an investment vehicle, underlines its importance in the global economy [3]. In addition, gold’s role in the production of high-value alloys and its use in advanced technologies further cement its status as a critical raw material [4]. The European Critical Raw Materials Act (CRMA) is a significant regulatory framework that aims to ensure secure and sustainable access to CRMs, which are essential for various industries, including those involved in the mining and processing of gold ores. CRMA seeks to mitigate supply risks and promote critical raw Materials materials’ (CRMs’) domestic potential, which is in line with the broader sustainability goals of the EU Green Industrial Plan and the Net Zero Industry Act [5,6]. The geopolitical and economic implications of CRMs also play a crucial role in the mining sector. The uneven geographical distribution of CRMs can lead to supply vulnerabilities, which is why it is crucial for countries to develop domestic sources of these materials, including those derived from low-value gold ores [7,8]. The CRMA aims to increase the resilience of supply chains by supporting local mining initiatives and reducing import dependency, which is particularly relevant for the EU as it seeks to secure its technological and economic future [5,7].
Gold is a relatively inert metal that occurs naturally in its free state or combined with small amounts of other metals, most commonly silver. In minerals, it can be found as atomic gold, surface gold, and colloidal gold. Atomic gold is present in the crystalline lattice of sulfur minerals, and its distribution within these minerals is often non-uniform. It is most commonly found in the mineral arsenopyrite. Surface gold can be detected on the surface of minerals, while colloidal gold consists of particles ranging from 5 to 500 nm, typically incorporated into the crystalline lattice of minerals and often found in pyrite and arsenopyrite [9].
Low-grade gold ores often contain lower concentrations of gold, and their mineralogy is usually more complex, which can complicate the mining and post-processing processes. Centrifugal gravity processing methods, especially those using equipment such as Knelson concentrators, have come to the fore in low-grade gold ore processing. These methods use gravitational separation principles enhanced by centrifugal force to achieve efficient recovery of gold particles that may be too fine or dispersed for traditional gravitational methods to capture effectively [10,11,12]. The centrifugal force generated in these concentrators significantly increases the separation efficiency, making it possible to extract gold from ores that would otherwise be considered uneconomical to process [13,14,15,16,17].
One of the primary advantages of centrifugal gravity treatment methods over other gold recovery technologies is their ability to achieve high recovery rates with minimal environmental impact. Unlike cyanidation, which involves toxic chemicals, centrifugal gravity methods primarily rely on physical separation processes, making them more environmentally friendly [18,19,20,21]. Additionally, these methods are typically less energy-intensive compared with flotation or hydrometallurgical processes, which often require extensive reagent use and energy input [14,22,23]. The simplicity of operation and the ability to function under a wide range of conditions further enhance their appeal, particularly in remote mining locations where infrastructure may be limited [24,25].
Moreover, centrifugal gravity concentrators excel in recovering fine gold particles, which are often lost in conventional gravity separation methods. The GRG test is widely employed in the industry to assess the amenability of ores to gravity recovery, and the results indicate that centrifugal methods can recover a significant portion of the gold present in low-grade ores [11,26]. The GRG test evaluates the ore’s ability to be efficiently processed using gravitational techniques. The principle of the GRG test lies in the fact that the gradual grinding of the ore allows for the stepwise release of precious metals without overgrinding or abrasion of large metal particles. The GRG test is conducted in three consecutive stages of mineral release and three stages of their concentration. This stepwise grinding accurately determines the amount of gold that can be recovered using gravitational methods [12,27,28,29,30]. This capability allows for the economic processing of ores that would otherwise be discarded or require more complex and costly extraction methods.
This article focuses on the application of the GRG test on samples of low-grade ores. In the research, two different samples of gold-bearing ores were analyzed. The first was a polymetallic sample from the Zlaté Hory–Západ deposit (Czech Republic), containing gold bound in a sulfide ore of the Zn-Cu-Au type, with a predominance of copper over zinc. The second sample, containing free gold, came from the Kašperské Hory (Czech Republic). The aim of this work was to verify the effectiveness of this method for increasing the gold recovery in both types of tested samples.

2. Materials and Methods

This chapter focuses on the methodology used to process and analyze samples from the Zlaté Hory–Západ and Kašperské Hory deposits in the Czech Republic. The GRG test, together with mineralogical and elemental analyses using X-ray diffraction (XRD) on a Bruker D8 Advance powder diffractometer (Bruker Corp., Billerica, MA, USA) and atomic absorption spectroscopy (AAS) on the Solaar M6 spectrometer (Thermo Fisher Scientific, Waltham, MA, USA), were performed to determine the composition and recovery of valuable metals, including base metal sulfides and gold.

2.1. Location: Zlaté Hory–Západ in the Czech Republic

The Zlaté Hory ore district is the largest in the Jeseniky region and one of the most significant in the Czech Republic. The mining of local ores dates back to the 13th century. However, the period of the most intensive mining activities and ore extraction occurred during the second half of the 20th century, as part of Czechoslovakia’s efforts to achieve resource self-sufficiency. During this time, copper, zinc, and gold ores were sequentially mined. The mining of gold-bearing ores ended in 1993, leaving the deposit partially unexploited, as comprehensive exploration of the gold-bearing ore bodies remained incomplete.
For the Zlaté Hory–Západ deposit, a mining concession was established in 1985 for polymetallic ores containing gold (Au), zinc (Zn), copper (Cu), lead (Pb), and silver (Ag). The concession covers an area of 0.377 km2 and is vertically limited to the third mining level. The deposit predominantly consists of quartzites of the Příčná hora formation, with various types of acidic metavolcanic rocks. The overburden and footwall consist mainly of muscovite-chlorite schists. Structurally, the deposit extends approximately 2.5 km and comprises ore bodies rich in Pb, Cu, Zn, and Au [31].
From a petrographic perspective, the area features two main rock types: schists and siliceous rocks. The footwall of the Příčná hora quartzite belt consists of chlorite-muscovitic schists, occasionally interspersed with quartzitic schists containing intercalations of metakeratophyres, metabasalts, secondary quartzites, or calcareous schists of metavolcanosedimentary origin. The overburden is dominated by metasedimentary chlorite-muscovitic to muscovite-chloritic quartzitic schists.
In terms of mineralization, the deposit’s footwall has been categorized into eight types based on paragenesis. The overburden hosts ore bodies rich in pyrite and chalcopyrite, constituting the Cu mineralization. Other ore types include chalcopyrite-pyrite bodies, occasionally containing sphalerite or galena, and quartzites with elevated Au content. The “Zlatý sloup” (Golden Column) within ore body 4 is noted for massive accumulations of Au mineralization. The deposit exhibits significant variability in elemental composition, ranging from complex associations to polymetallic and monometallic Cu or Zn ores. Of particular importance is the polymetallic mineralization, which is a hallmark of the ZH–Z deposit. Other types of mineralization include irregularly shaped, scattered ore formations and lens-like Zn ore bodies, the latter being uneconomical due to their dispersal. Polymetallic mineralization is found in areas of significant deformation, while the lowest layer (type 8) contains Ag, Pb, and Zn. Minerals such as tetrahedrite, arsenopyrite, and pyrrhotite occur in small quantities across nearly all layers [32].

2.2. Location: Kašperské Hory in the Czech Republic

The Kašperské Hory ore district is one of the most historically significant gold-bearing regions in Bohemia, with the peak of mining activity occurring in the 14th century. This area lies within a regional shear zone trending east–west to east–southeast–west–northwest, at the boundary between the diverse and monotonous units of the Šumava Moldanubicum, which underwent polyphase deformation and metamorphism. Mineralized structures are organized into vein zones forming various types of extensional and shear veins. The gold-quartz mineralization spans approximately 30 km2, concentrating into three main east–west-trending zones identified through historical mining and modern geological surveys.
The gold-bearing ore samples derive from mesothermal quartz-gold mineralization (T = 200–310 °C), structurally controlled and associated with zones of bedding-parallel mylonitization. This mineralization is bound to lens-shaped quartz veins and silicified zones in biotitic plagioclase paragneisses. Quartz veins are predominantly bedding-parallel (east–west) or slightly discordant (WNW–ESE to NW–SE) with dips typically ranging from 20° to 40°, occasionally reaching 80° to the north-northeast and even 70°–90° to the south-southwest (stratabound type mineralization). The vein thickness varies widely, from a few centimeters to 5 m, typically averaging around 0.3 m. These veins frequently cluster into parallel zones, with quartz fillings (gray, dark blue-gray to milky white quartz) showing signs of intense deformation. Older quartz, partially of metamorphic origin, is often finely impregnated with graphite. Younger epigenetic quartz, cutting through earlier quartz generations, hosts the gold mineralization. The richest gold concentrations occur in gray to dark blue-gray quartz, tinged with ore minerals and graphite.
Gold, predominantly of high purity, is accompanied by bismuth and tellurium minerals, with sulfide content generally below 5% (pyrite; pyrrhotite; arsenopyrite; locally molybdenite, galena, chalcopyrite, and sphalerite; and rare gersdorffite, glaucodot, and ullmannite). Other associated minerals include scheelite, graphite, sericite, chlorite, calcite, zircon, apatite, and occasionally fluorite. Gold is predominantly fine-grained, with particle sizes ranging from a few micrometers to 60 µm, rarely up to tenths of a millimeter, and is often accompanied by minerals of similar grain size. Chemical analyses of gold particles show consistent composition, although the silver content varies from 1.5% to 10.5% by weight. The identified microscopic bismuth and tellurium minerals include maldonite, jonassonite, native bismuth, bismuthinite, and cosalite [33].

2.3. XRD Difraction

Samples of low-grade gold ores (Zlaté Hory–Západ, Kašperské Hory) were ground to <5 μm using a McCrone Micronizing Mill with isopropanol (5 min/g) and homogenized in a vibratory mill. To quantify the amorphous content, ZnO (10%–20%) was added as an internal standard, homogenized, and pressed into a 2 mm sample holder.
Measurements were performed on a Bruker-AXS D8 Advance diffractometer with 2θ/θ geometry, a LynxEye detector, and CuKα/Ni-filtered radiation (40 kV, 40 mA). Scans were conducted in step mode (0.014° 2θ steps, 1.25 s/step) with digital data processing using Bruker Diffrac Suite software (version 4.1). Qualitative analysis employed the PDF-2 diffraction database (2011, ICDD, Newtown Square, PA, USA). The results of the semi-quantitative analyses are provided in the Supplementary Files S3–S6.

2.4. AAS

Gold determination was carried out using a dual atomic absorption spectrophotometer Solaar M6. The samples were digested using hydrofluoric acid (HF) and aqua regia, and the resulting residue was dissolved in a solution of nitric acid (HNO3). The gold measurement via AAS was carried out at a wavelength of 242.8 nm, using an acetylene air flame, a deuterium lamp, and triplicate measurements for accuracy. The sensitivity of AAS Solaar M6 for gold detection was 0.12 mg/L, and measurements were carried out within the optimal calibration curve range of 2.4–24 mg/L. The measurement uncertainty, based on repeated calibration and standard solution analyses, was estimated at ±2%. Validation parameters included repeatability, assessed by standard deviations across triplicate measurements, and accuracy, confirmed by certified reference materials.

2.5. SEM Microscopy and Microanalysis

In order to identify individual minerals, their distribution, and the degree of heterogeneity in both ore samples, electron microscopy and microanalysis were applied. To acquire photographic documentation and identify individual minerals, an FEI Quanta-650 FEG autoemission electron microscope from FEI (now Thermo Fisher Scientific, Waltham, MA, USA) was used, equipped with the following analyzers: energy dispersive analyzer (EDS)-EDAX Octane plus, wavelength dispersive analyzer (WDA)-EDAX LEX, cathodoluminescence detector (CL)-Gatan MonoCL4, and electron backscatter diffraction detector (EBSD).
Only standard-free EDS analyses were performed using correction of light element contents based on a set of standard materials. The microscope worked under the following conditions: voltage 20 kV, current 8–10 nA, beam diameter 6 μm, reduced vacuum with chamber pressure 50 Pa, and samples without plating. Under these conditions, energy-dispersive microanalyses need to be considered only semi-quantitative. The identification of spectral lines was performed using spectral decomposition using the halographic peak deconvolution function. WDX (wavelength dispersive X-ray microanalysis) was not performed, mainly due to non-compliance with the measurement geometry.

2.6. GRG Test

The GRG test, also known as the Knelson test, was performed on the Knelson concentrator KC-MD3 (FLSmidth Knelson, Vancover, BC, Canada) to verify the suitability of gravity methods for processing gold-bearing ores from the Zlaté Hory–Západ and Kašperské Hory deposits.
The maximum solid feed rate was 40 kg per hour of minus 10 mesh (<1.7 mm) dry solids. The residual volume of MD3 concentrate, after the feed had filled the cone rings, was approximately 58 mL. MD3 can typically achieve a concentrate of 5%–10% gold weight without significantly sacrificing recovery efficiency [34]. Other parameters are listed below.
A procedural flowsheet for the GRG test is shown in Figure 1.
  • First Step: Sample Preparation
The maximum grain size of the input samples was 36 mm. Samples were crushed using a laboratory jaw crusher, Retsch BB 200 (Retsch GmbH, Haan, Germany), to obtain particles smaller than 850 µm, which were required for the GRG test. To achieve the desired particle size, an AS 450 analytical sieve shaker (Retsch GmbH, Haan, Germany) was used. The sample was mixed with water, and the resulting suspension was introduced into the concentrator’s feed funnel using a measuring cup. The fluidization water flow rate was set to 3.5 L/min, and the centrifugal acceleration was adjusted to 60 G. The result of each separation was the concentrate (KC-MD3 concentrate) and the tailings (KC-MD3 tails). The concentrate (KC-MD3 concentrate) was then panned to obtain the final concentrate (pan concentrate) and pan tail. The separation products were filtered using a laboratory vacuum pump PS20 (KNF Group, Freiburg, Germany) and dried to a constant weight in a laboratory Memmert UF 110 oven (Memmert GmbH + Co. KG, Schwabach, Germany).
A 200 g sample was taken from the tailings (KC MD3 tails 1) by repeated quartering for sieve analysis. After determining the particle size distribution of the tailings, it was ground so that 45%–60% of the output consisted of particles smaller than 75 µm. The grinding was carried out in a SKTM 60 FU steel ball mill (dry process) (GERMATEC GMBH, Ransbach-Baumbach, Germany).
  • Second Step
The input material was the gravity tailings from the previous phase (KC MD3 tails 1), ground to the desired particle size. The next phase was carried out according to the same principles as in the previous step. The result of the gravitational separation was a concentrate (KC MD3 concentrate 2) and tailings (KC MD3 tails 2). The concentrate was panned to obtain the final concentrate (pan concentrate 2). The tailings (KC MD3 tails 2) were further ground in a ball mill after sieve analysis, ensuring that 75%–80% of the output had a particle size of less than 75 µm. All three products were subjected to XRD and AAS analyses to determine their metal content.
  • Third Step
The input material was the tailings of the previous phase (KC MD3 tails 2), ground to the desired particle size. The procedure was similar to that of the previous steps. The result of the gravitational separation was a concentrate (KC MD3 concentrate 3) and tailings (KC MD3 tails 3). The concentrate (KC MD3 concentrate 3) was panned to obtain the final concentrate (pan concentrate 3) and the pan tail (pan tail 3). Metal content was also determined for the three products.
Thus, the result of each step of the GRG test was three products: the final concentrate from panning (pan concentrate), the pan tail (pan tail), and the gravity tailings from the Knelson concentrator KC-MD3 (KC MD3 tails). The parameters for the proper execution of the GRG test are presented in Table 1.
To provide a comprehensive analysis of the particle size distribution, granulometric curves were constructed for both the feed materials and the waste products from the GRG test for the samples from the Kašperské Hory and Zlaté Hory deposits. These curves illustrate the variation in particle size distribution before and after processing and its potential influence on gold recovery. The granulometric composition of the feed and waste samples can be found in the Supplementary Materials (Figures S1 and S2).

3. Results

In this section, the results of the GRG test on samples containing free gold and gold bound in sulfides will be evaluated.

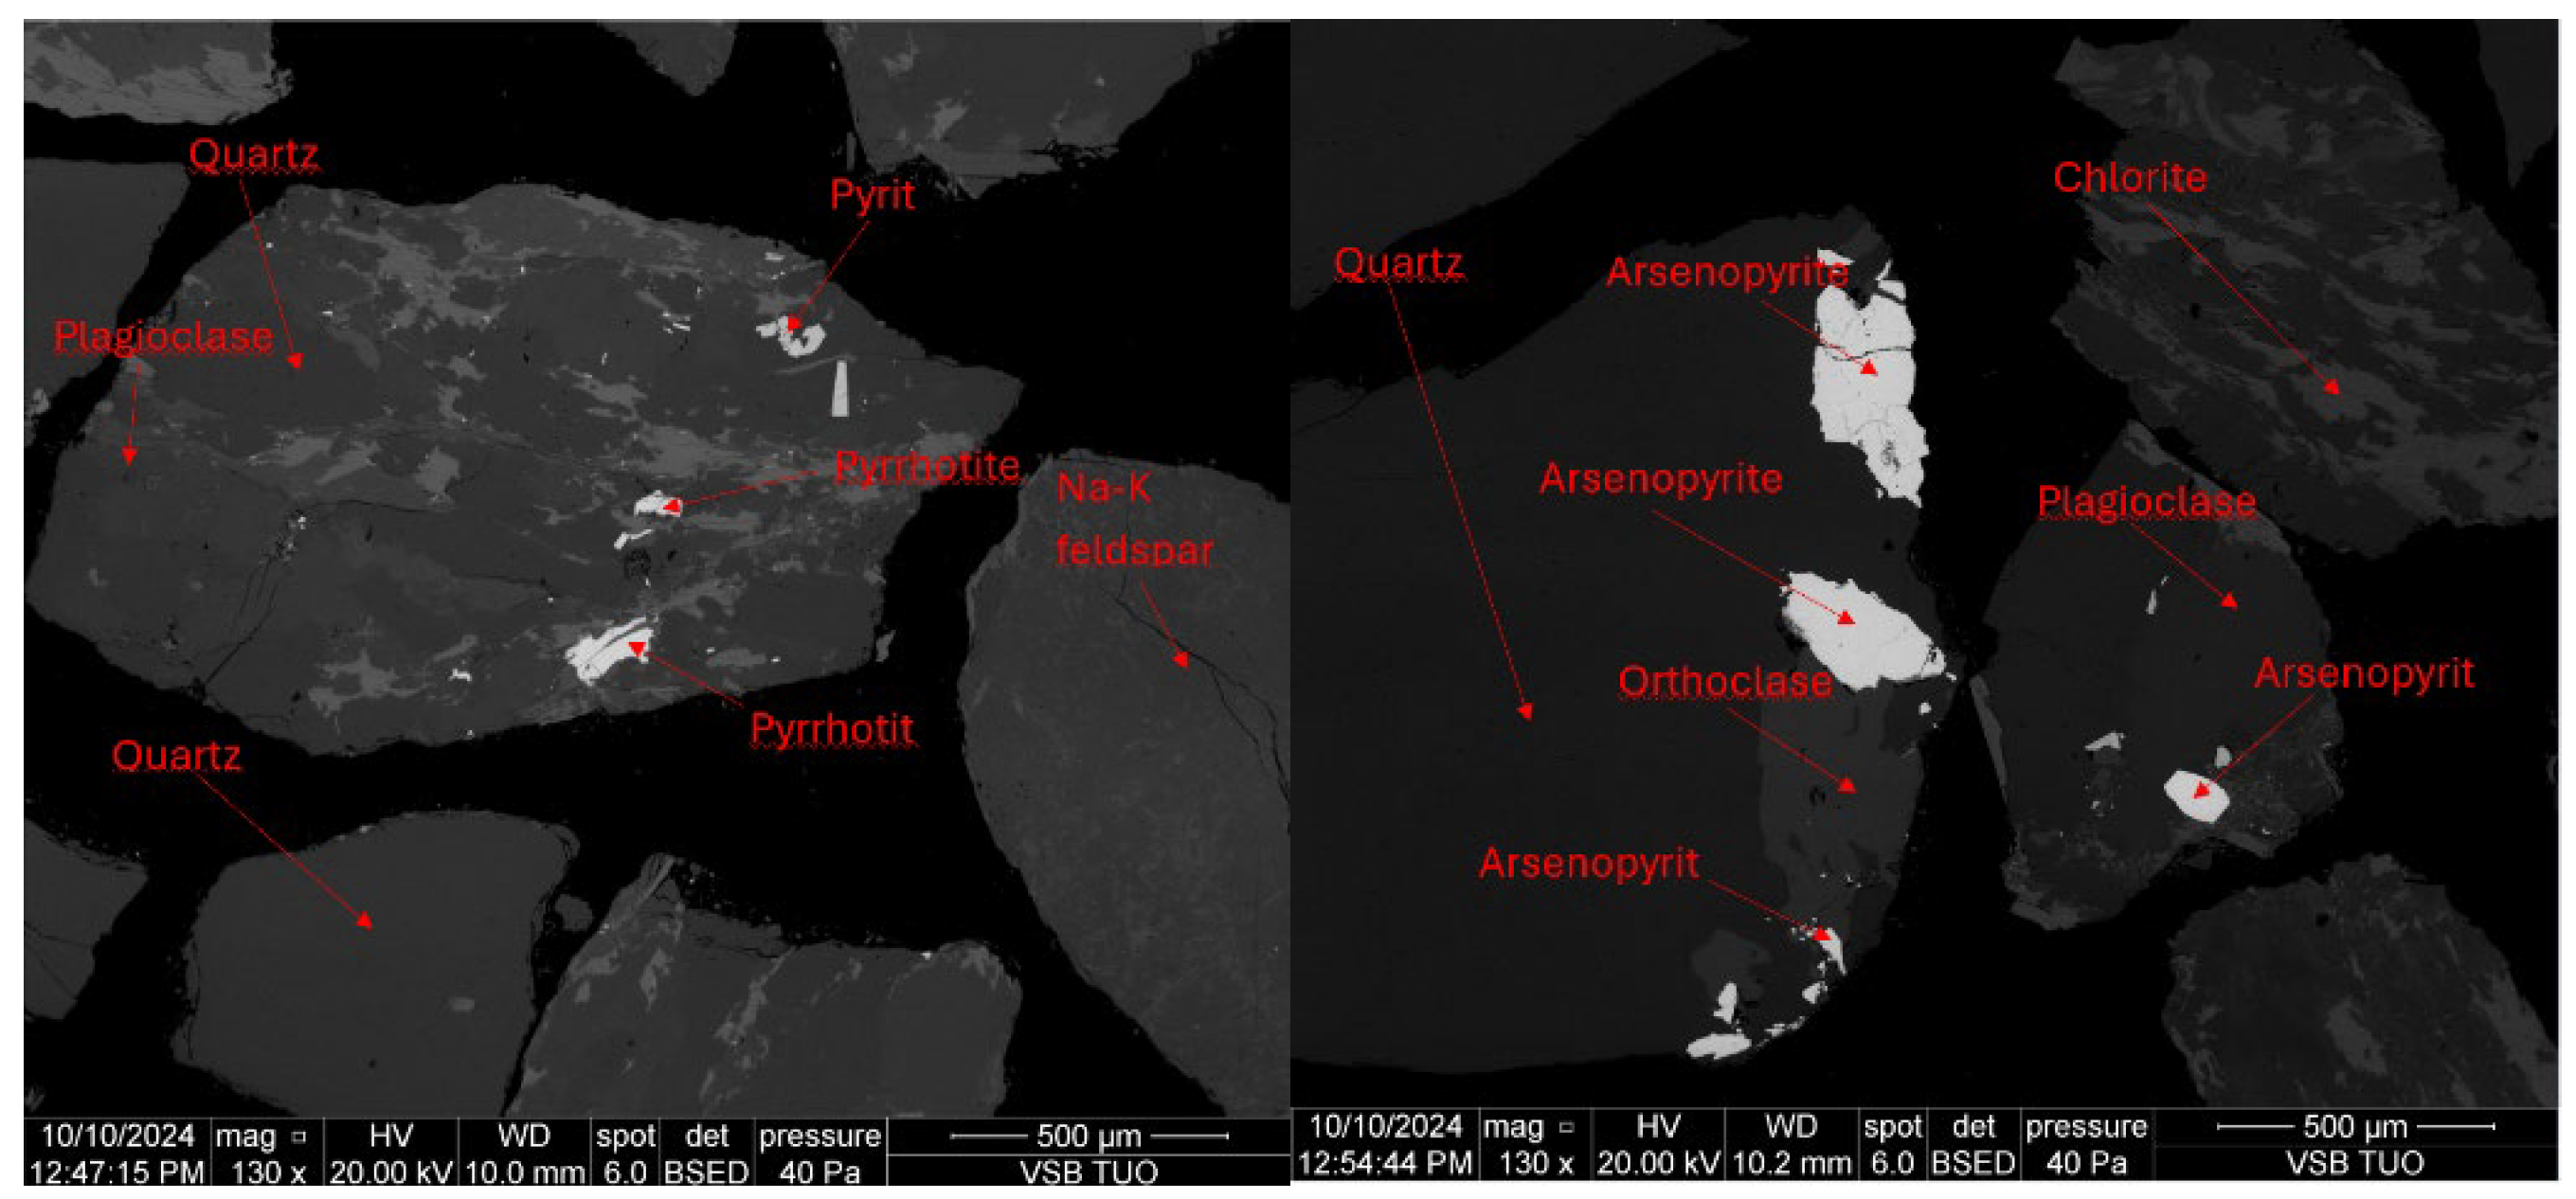
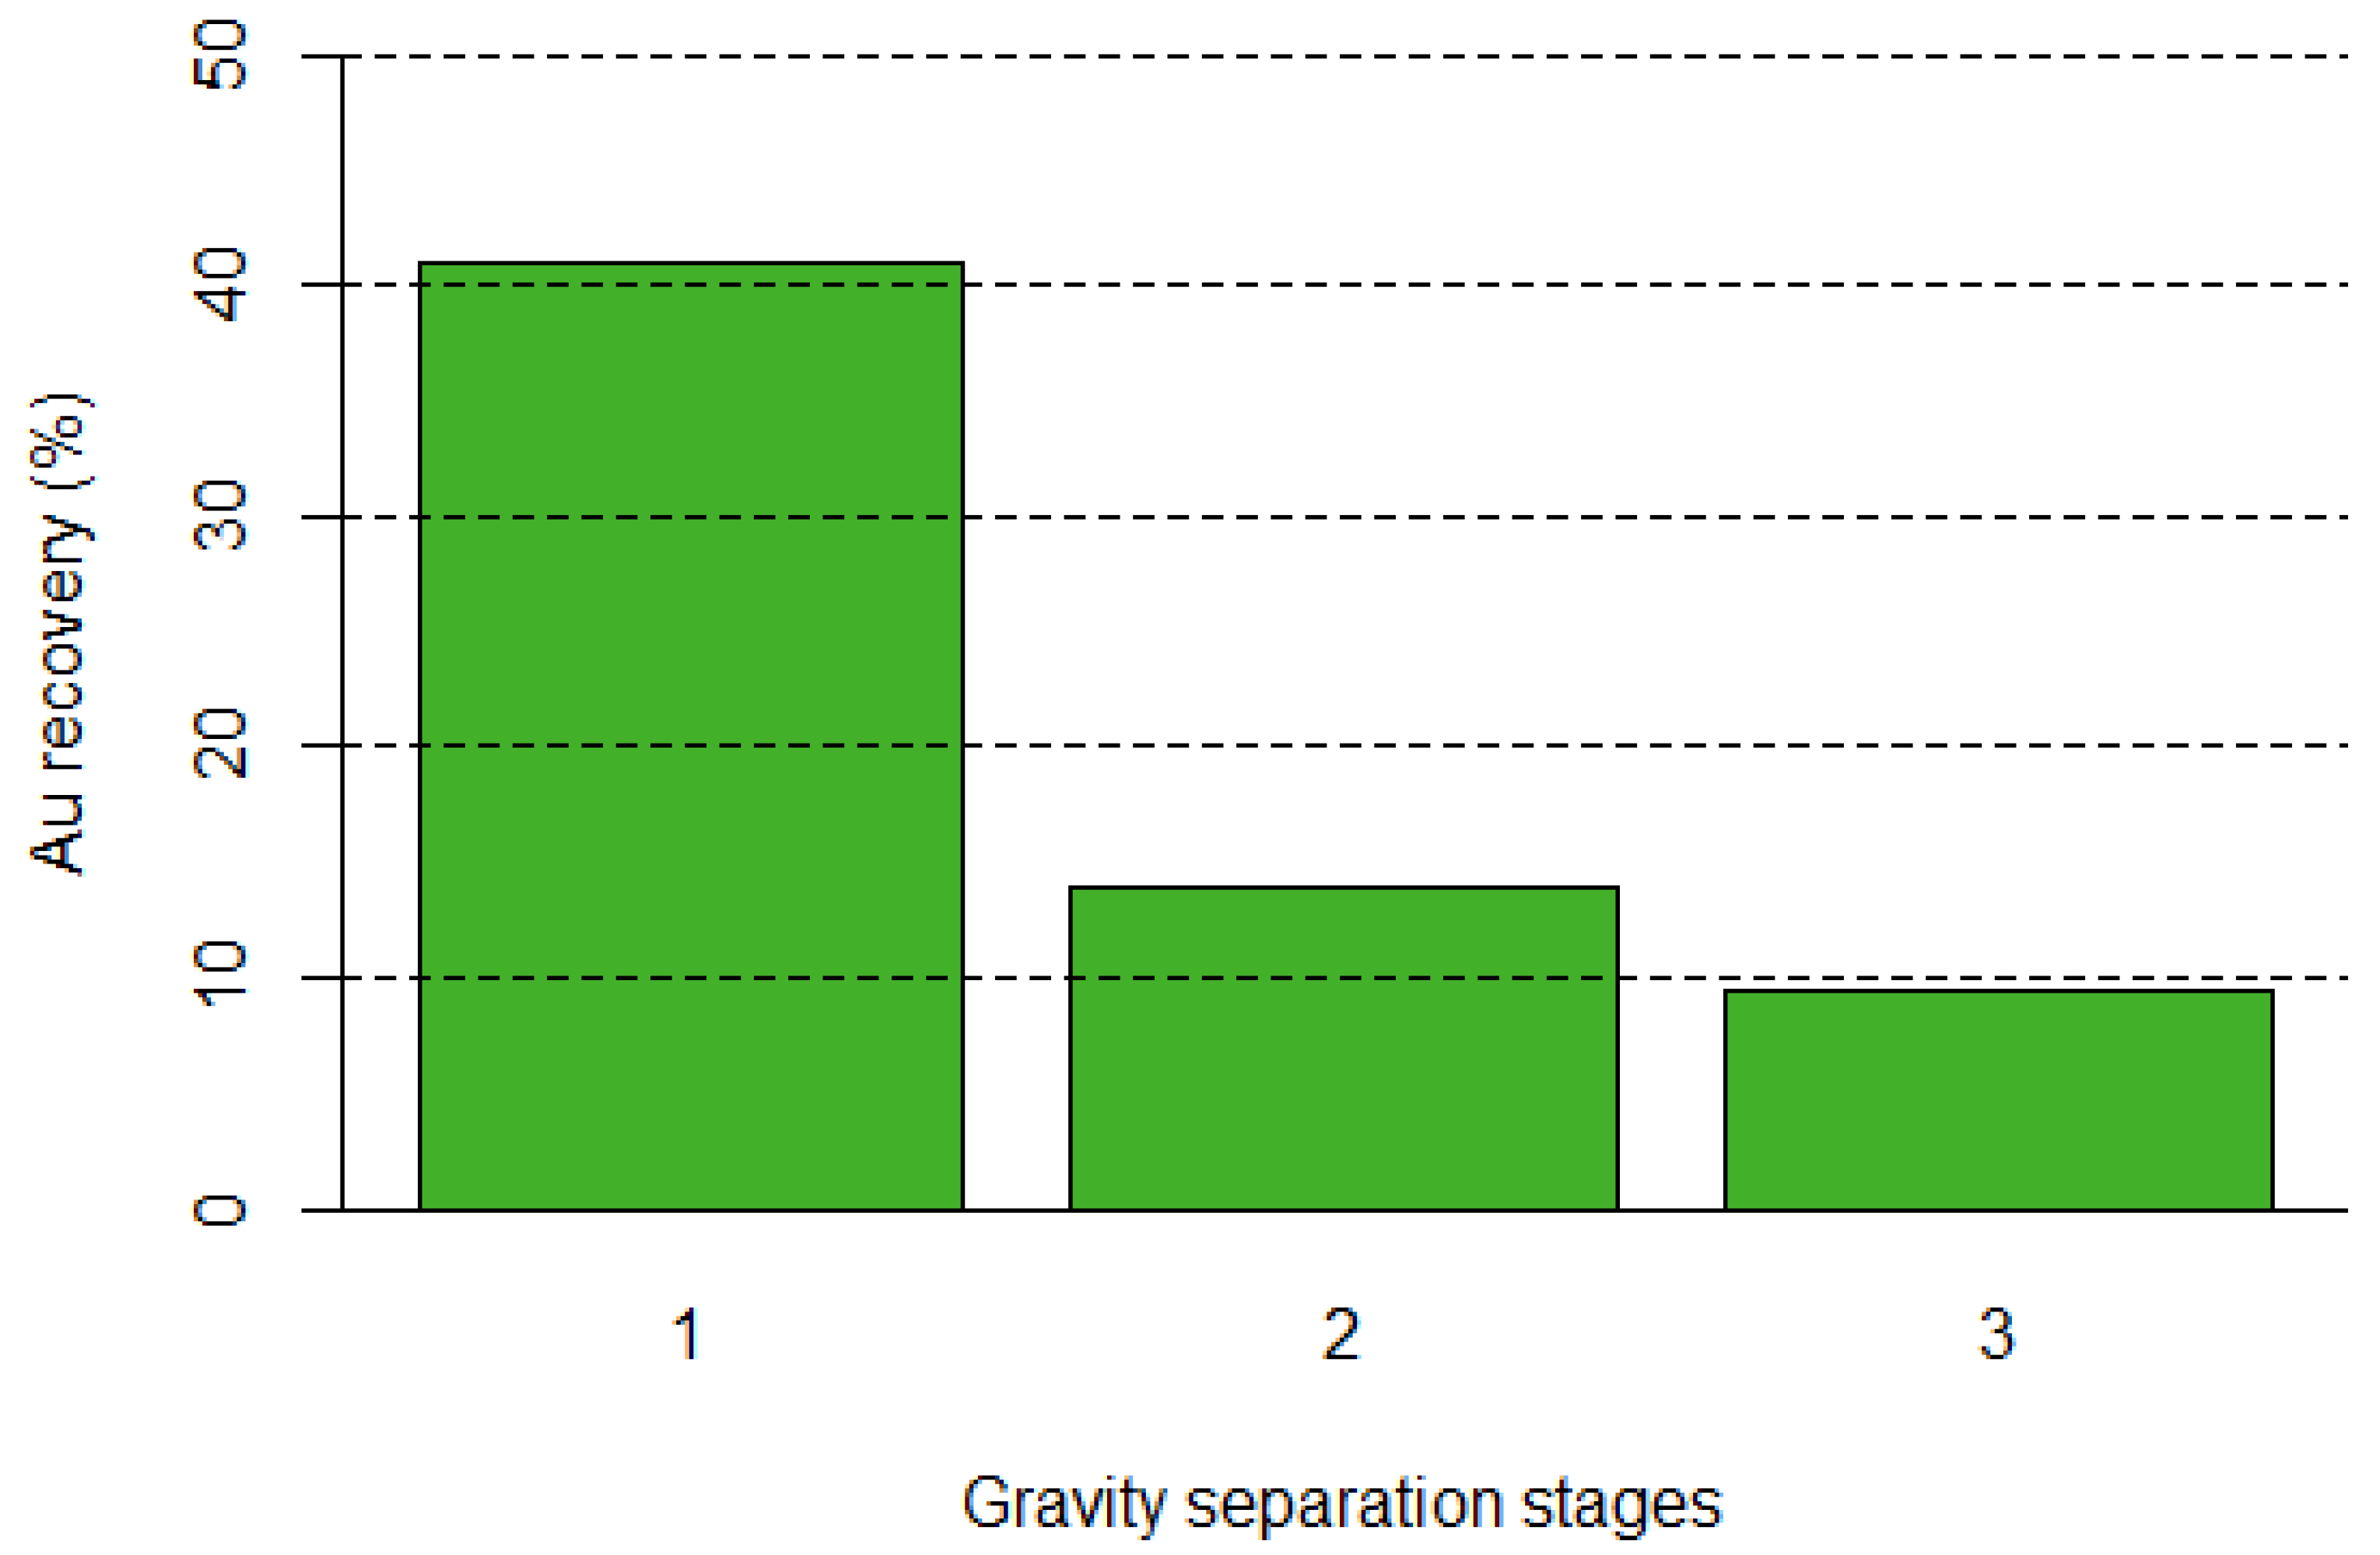
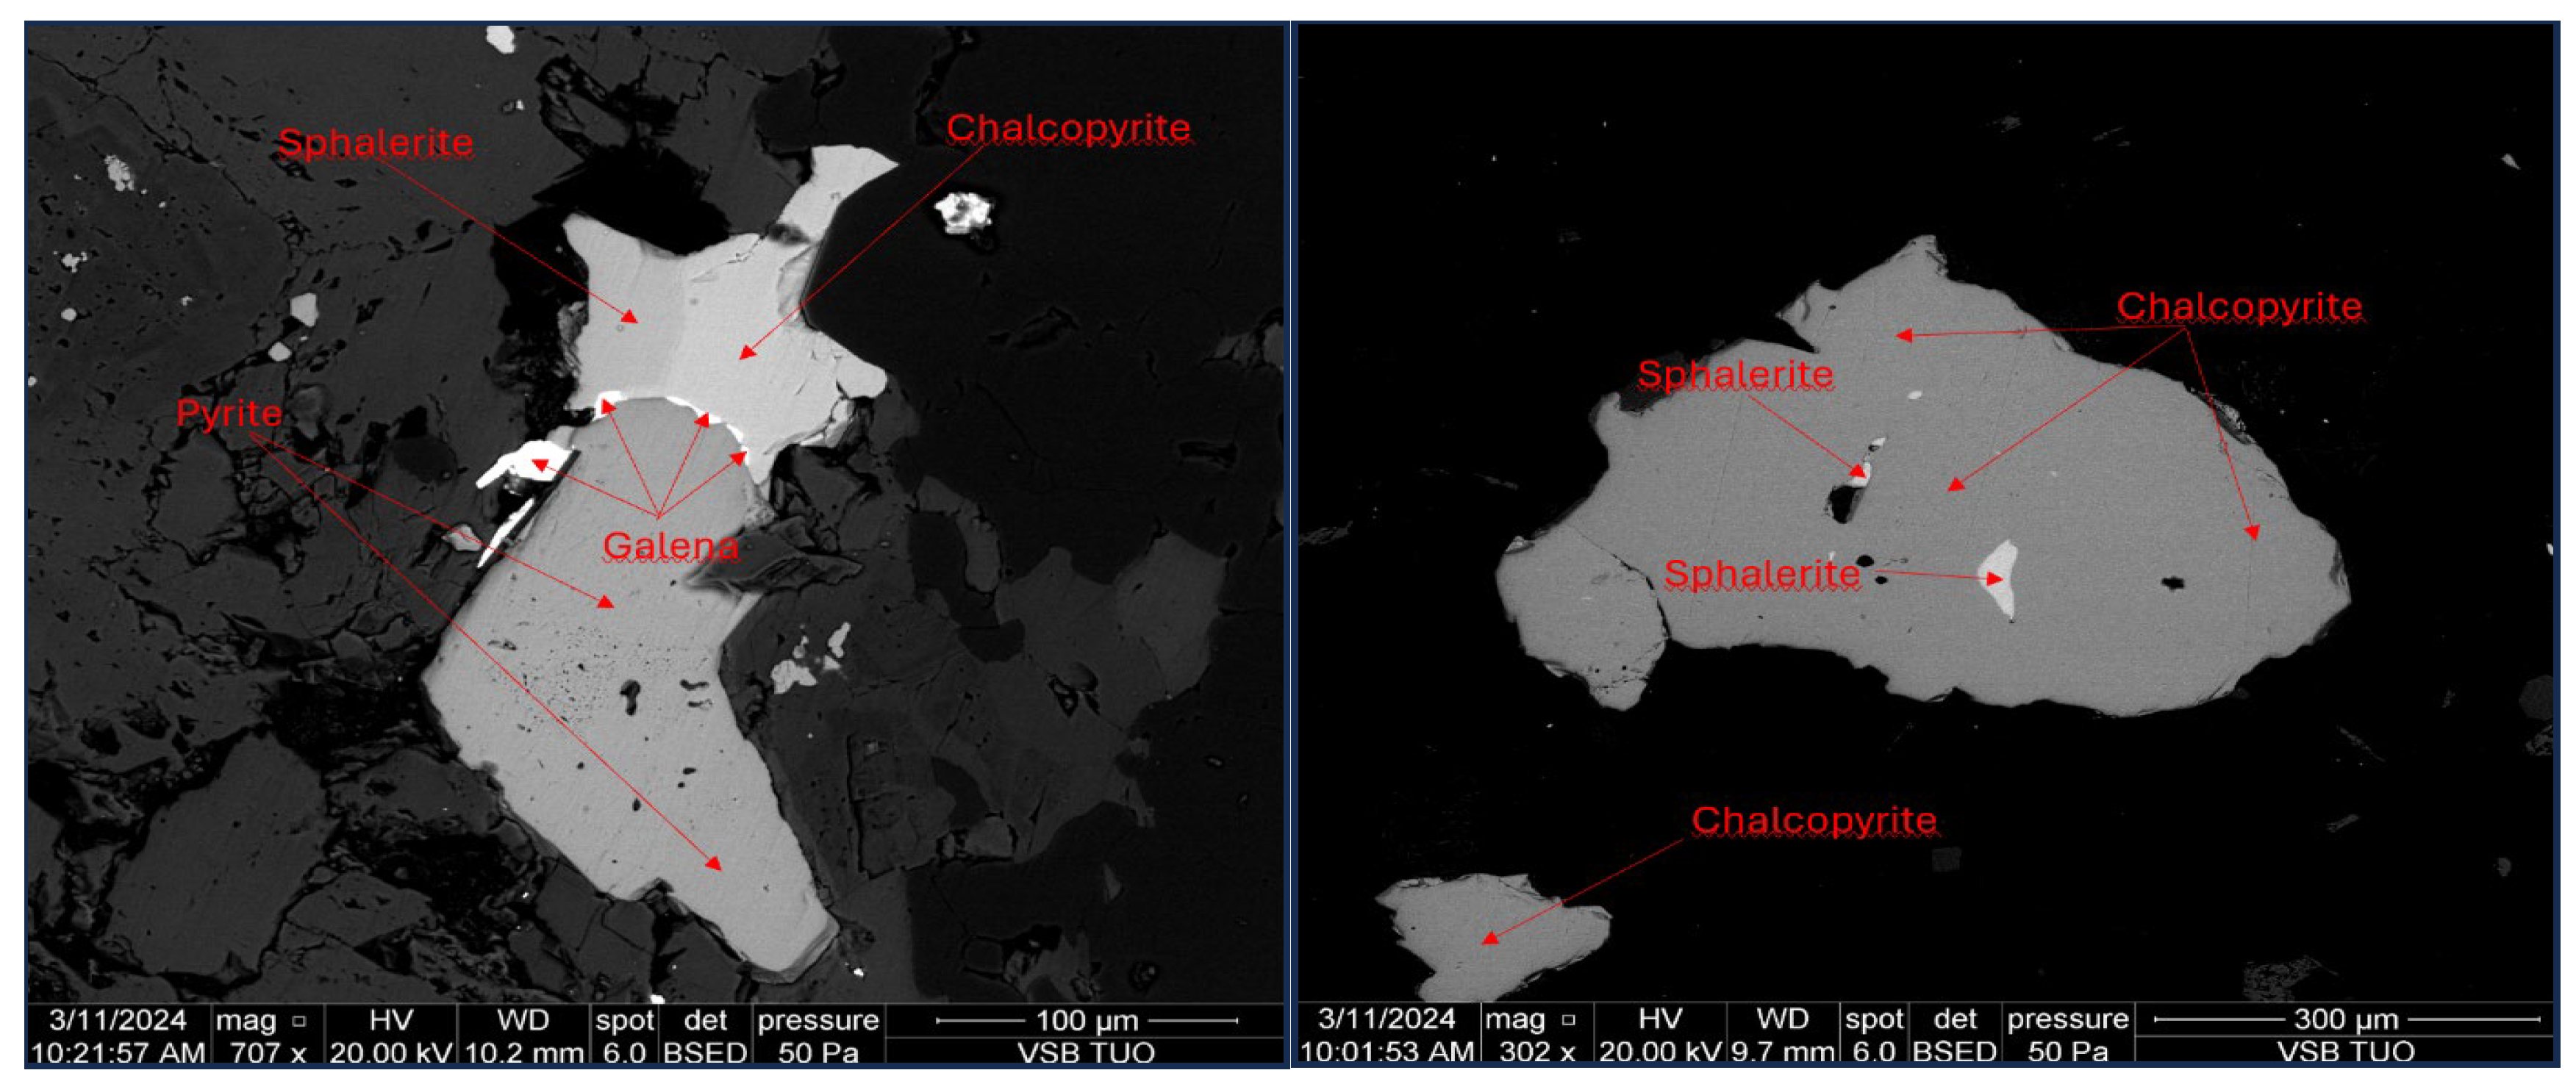
3.1. Sample from Kašperské Hory

In order to identify individual minerals, their distribution, and the degree of heterogeneity in both ore samples, electron microscopy and microanalysis were applied. The results of the Kašperské Hory sample can be seen in Figure 2.
The input sample from Kašperské Hory (Figure 2) showed grains of sulfides such as pyrite, pyrrhotine, and arsenopyrite. The main share was older quartz. The quartz filling showed signs of intense deformation. Gold-bearing mineralization, which unfortunately was not captured in the images, was associated with the youngest epigenetic quartz, which penetrated into older generations of quartz. The proportion of sulfides was low. In addition to sulfides, chlorite, sodium-potassium feldspar, plagioclase, and orthoclase were also found.
The results of the XRD and AAS analyses for the input sample from Kašperské Hory are presented in Table 2.
The XRD and AAS results from the Kašperské Hory sample provided an in-depth look at the mineral composition and elemental content. The primary mineral detected was quartz, which constituted 56.14% of the sample, indicating the dominance of silicate minerals in the geological profile. Chlorite was the second most abundant mineral with 19.63%, followed by albite with 17.88% and muscovite with 6.36%, all of which were typical of metamorphic rock formations.
In terms of elemental content, gold was present in trace amounts, with a concentration of 2.9 g/t. This extremely low gold content suggested that the sample contained only minor quantities of free or bound gold, which would likely require advanced concentration methods for economic recovery. The presence of these minerals, particularly chlorite and muscovite, may indicate the involvement of hydrothermal processes in the formation of the sample.
The results of the GRG test are presented in Table 3. The yields of the concentrate from panning were very low in all three steps of the GRG test. Panning was terminated at the moment when a visible product of separation was observed on the pan. The aim was to obtain a concentrate with a gold content as high as possible.
In the first phase of the process, a concentrate (KC-MD3 concentrate 1) was obtained, which contained 40.89% of total gold with an average concentration of 7.7 g/t. With further grinding of the sample, the GRG yield to the concentrate gradually decreased. This suggested that relatively large gold grains were predominantly present in the ore, or it was gold bound to non-liberated gold borne by heavy minerals. The second concentrate (KC-MD3 concentrate 2) exhibited a higher gold concentration, specifically 10.1 g/t, and contained 13.93% of the total gold. The third concentrate (KC-MD3 concentrate 3) had the highest gold content, at 14.4 g/t, and contained 9.37% of total gold. Overall, 64.21% of the gold was captured in the concentrates, indicating the high efficiency of gravitational separation. Figure 3 graphically illustrates the recoveries of the individual steps of the GRG test.
In terms of metal content, the most interesting concentrate was from the second step of the test, which achieved a metal content of 151 g/t with a concentrate yield of 0.04%.
The pan concentrates were subjected to re-analysis of the mineralogical composition and atomic absorption spectrometry, in order to better understand the relationship between the mineralogical composition and the gold content.
Table 4 presents the mineralogical composition of the pan concentrate 1 product from the Kašperské Hory deposit and the gold content in this product. This product was analyzed because it yielded the highest gold recovery in the KC-MD3 concentrate 1 during this step of the GRG test. XRD results indicated that quartz was the dominant phase, comprising 56.42% of the total sample composition. Other significant components included albite (17.14%), arsenopyrite (10.50%), and muscovite (7.33%), with minor concentrations of biotite, pyrite, chlorite, and scheelite.
The mineralogical composition of the product was nearly identical to that of the feed sample, except for the increased concentrations of some minerals (arsenopyrite, biotite, and pyrite). AAS revealed a gold content of 59 g/t in the product.
Comparing the feed data (Table 2) with the results after gravity separation (Table 4), the following can be stated: The quartz content remained relatively stable in the concentrate. This stability indicated that in the first phase of the GRG test, larger and heavier quartz grains along with finer heavy mineral particles were transferred to KC-MD3 concentrate 1. This stability suggested that quartz, being a low-density mineral, was not significantly affected by gravity separation, as it did not contribute to gold recovery. There was an enrichment of pyrite in the concentrate (2.13%). The presence of pyrite in the concentrate indicated the efficiency of the gravity separation process. The notable increase in arsenopyrite (10.50%) was also significant. According to the authors of study [33], the occurrence of arsenopyrite in the Kašperské Hory deposit was typically up to 5%, and due to its high natural density, arsenopyrite became enriched in pan concentrate 1. In contrast, the light fractions, particularly chlorite, were significantly reduced, with its content dropping from 19.63% to 0.54%. The presence of muscovite (7.33%), albite (17.14%), and biotite (5.57%) in the concentrate reflected the diverse mineral composition. The increase in these minerals suggested that the gravity separation process may have concentrated not only gold but also some lighter coarse particles of gangue minerals.
The significant increase in gold content from 2.9 g/t to 59 g/t after gravity separation indicated that the process was successful in concentrating gold.

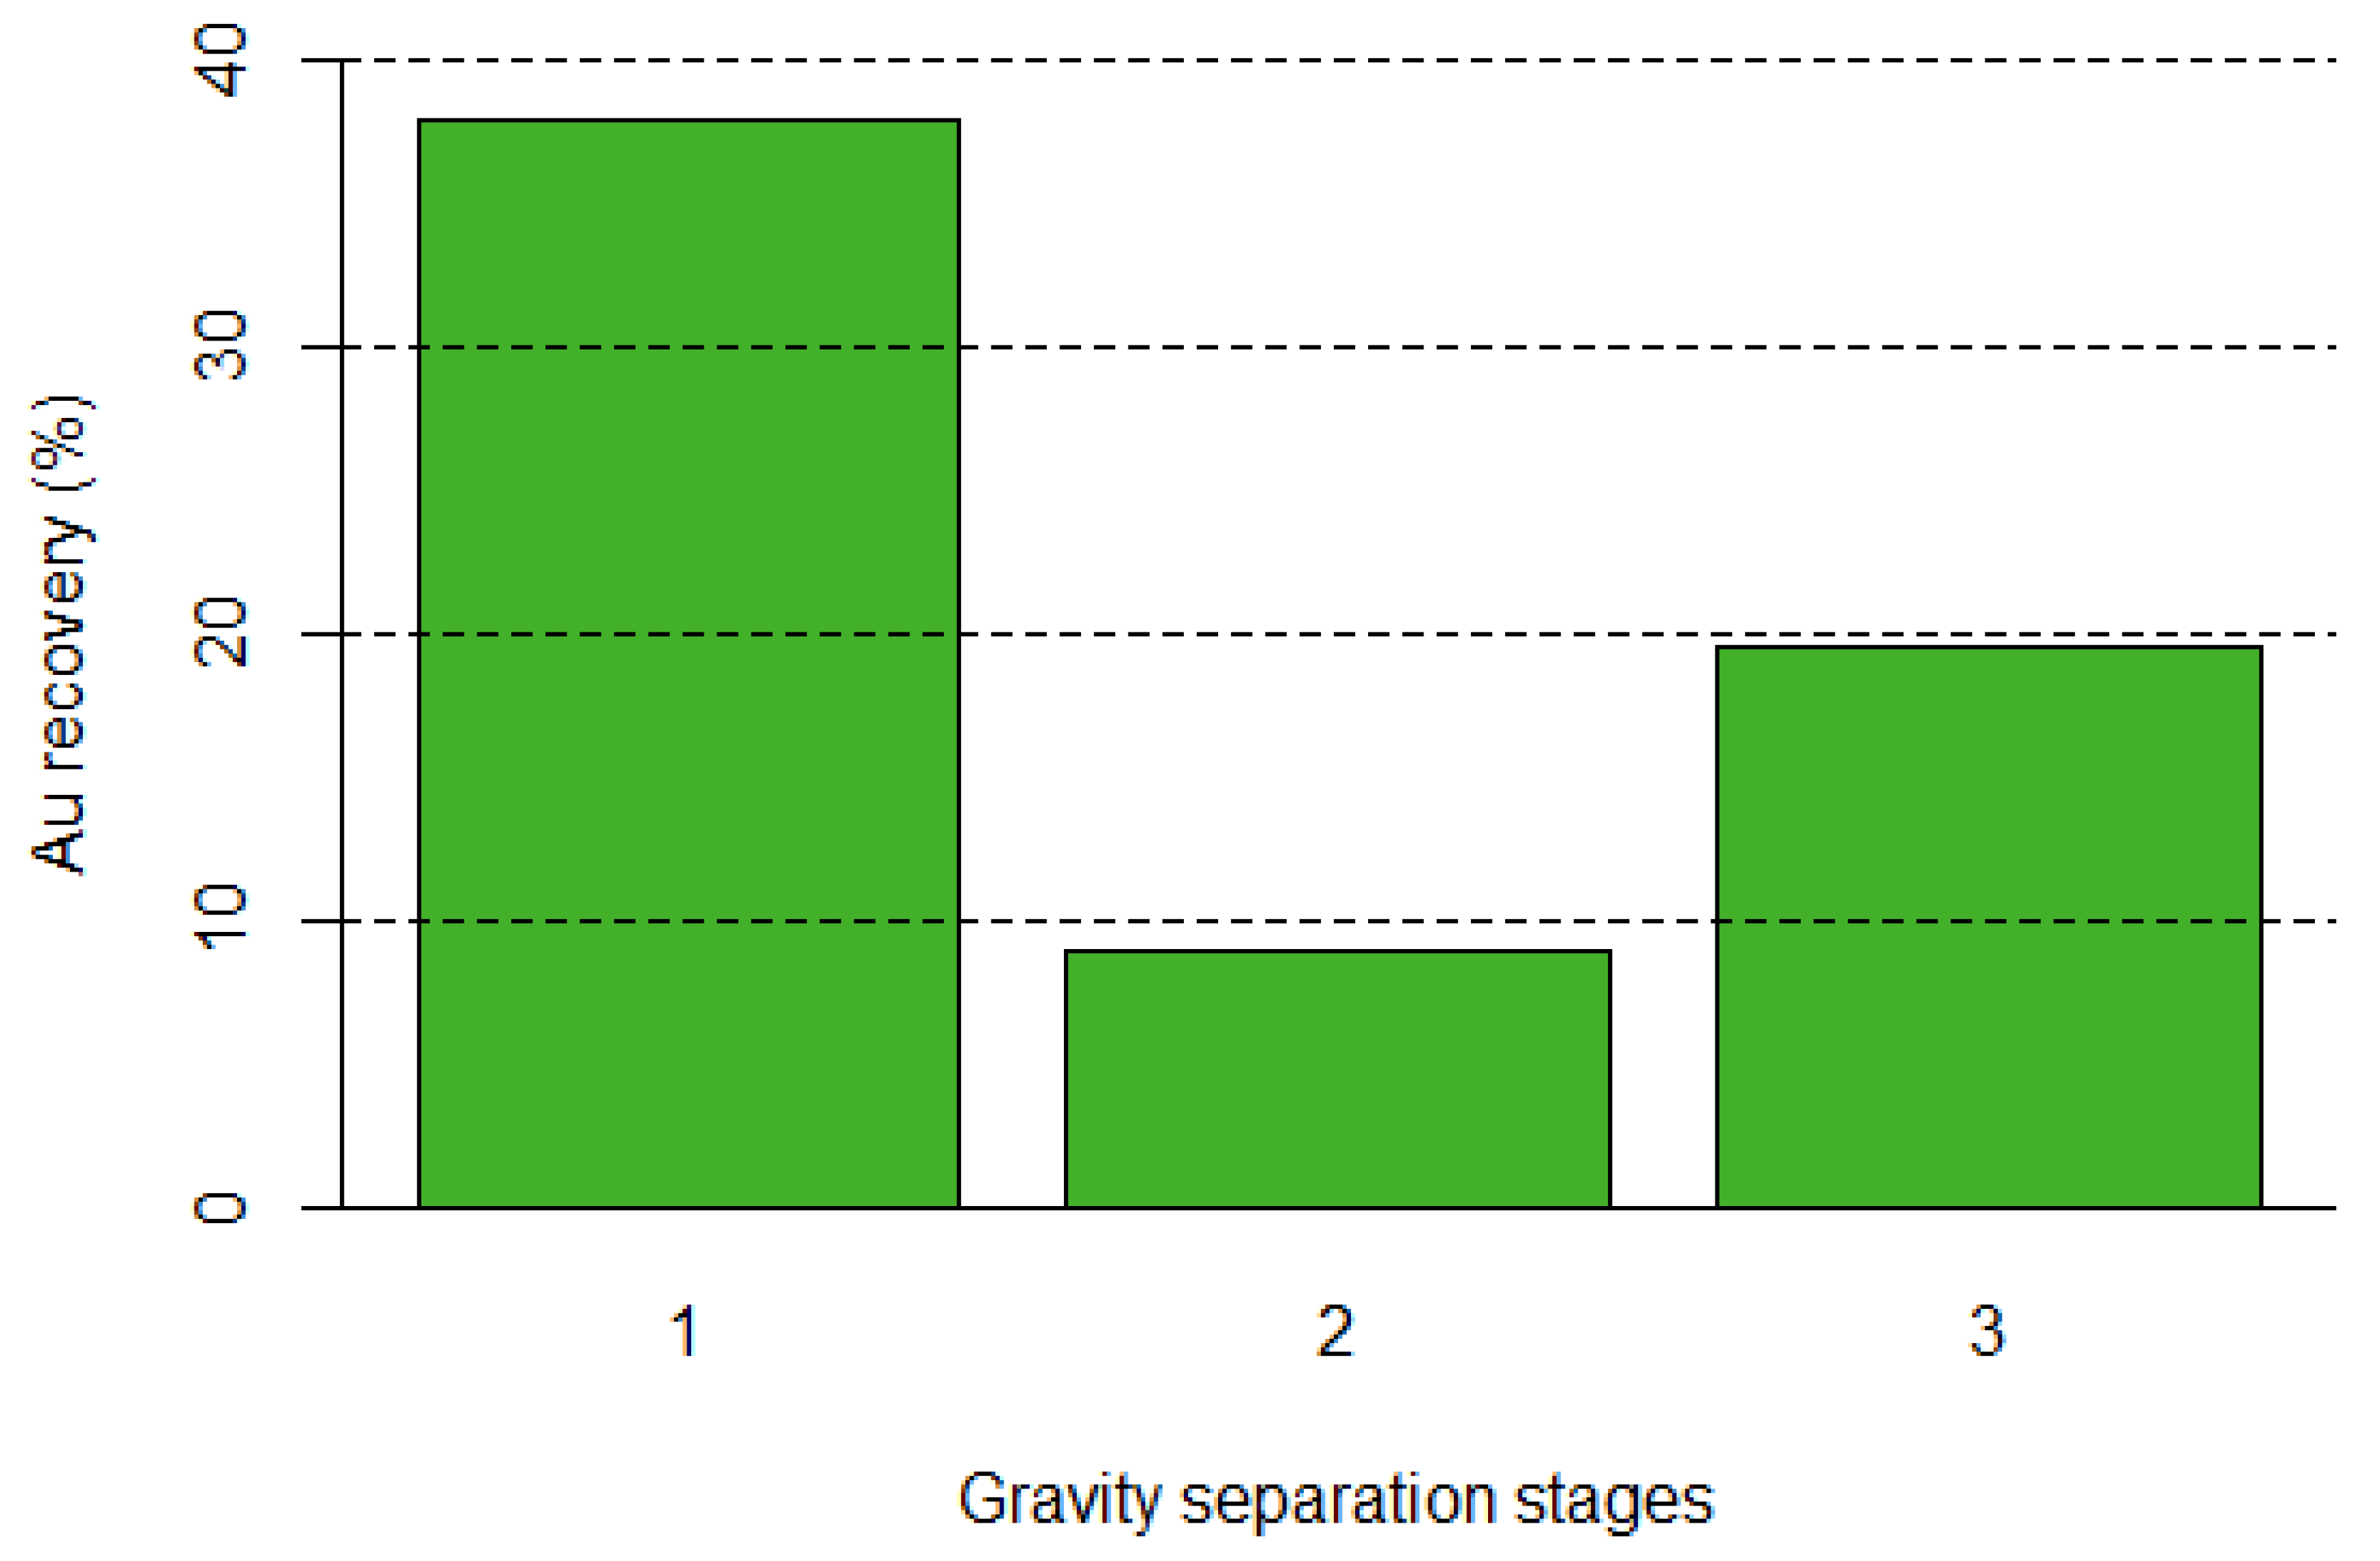
3.2. Sample from Zlaté Hory—Západ

The results of the XRD and AAS analyses for the input sample from the Zlaté Hory–Západ deposit are presented in Table 5. In order to identify individual minerals, their distribution, and the degree of heterogeneity in both ore samples, electron microscopy and microanalysis were applied. The results of the Zlaté Hory–Západ sample can be seen in Figure 4.
The images in Figure 4, taken using an autoemission electron microscope, show the distribution of sulfide grains and their mutual growth in a sample of polymetallic Cu-Zn-Au ore from the Zlaté Hory–West deposit. The images also show considerable heterogeneity of sulfide grains. Due to the very low gold content in the sample (6 g/t), gold was not detected on any of the analyzed sections (electron microscope images), but the AAS results confirmed its presence in the ore.
Table 5 presents the mineralogical composition of the sample from the Zlaté Hory–Západ deposit based on XRD and AAS analyses. The XRD results showed that the dominant phase was quartz, which accounted for approximately 60.93% of the total sample composition. Other significant components included chlorite (13.26%), dolomite (7.74%), and pyrite (6.45%), with lower concentrations of albite, chalcopyrite, calcite, and muscovite.
AAS revealed a very low gold content of 6 g/t, consistent with the characteristics of low-grade deposits. The presence of pyrite and chalcopyrite suggested that some of the gold may be bound as submicroscopic or “invisible” gold within sulfide minerals. The data confirmed the complex nature of the gold-bearing system, highlighting the suitability of centrifugal separation methods, such as the Knelson concentrator, for efficient gold recovery.
The results of the GRG test are presented in Table 6. The yields of the concentrates were very low in all three steps of the GRG test.
Table 6 shows that the highest GRG recovery for this sample occurred in the first and third steps of the test. The first concentrate of KC-MD3 contained 37.84% of total gold with a concentration of 25.1 g/t, indicating a high separation efficiency in the initial phase. This suggested that primarily larger sulfide grains, in which gold was bound, may have been released in the first step. The second concentrate had a lower gold content (5.8 g/t) and contained 8.93% gold. The third concentrate had a gold content of 11.7 g/t, with a recovery of 19.51% of the total gold. This indicated that in the third step, where the sample particle size was 75%–80% <75 µm, fine gold was released along with remnants of sulfides. In general, 66.28% of the gold was recovered in the concentrates, demonstrating the effectiveness of gravitational separation using this equipment. Figure 5 graphically illustrates the recoveries of the individual steps of the GRG test.
In terms of metal content, the most interesting concentrate was from the first step of the test, which achieved a metal content of 152.5 g/t.
The pan concentrates were subjected to a re-analysis of the mineralogical composition and atomic absorption spectrometry, in order to better understand the relationship between the mineralogical composition and the gold content.
Table 7 presents the mineralogical composition of pan concentrate 1 from the Zlaté Hory–West deposit and the gold content of this product. Research has shown that the efficiency of gravity separation is influenced by the mineralogical properties of the ore and the specific gravity differences between gold and accompanying minerals. In this step, the highest gold yield was achieved in KC-MD3 concentrate 1, and at the same time, pan concentrate 1 was the concentrate with the highest metal content. XRD results showed that pyrite was the dominant phase, accounting for 67.93% of the total composition of the sample. Other important components included quartz (16.88%) and dolomite (9.53%), with calcite and chlorite occurring in smaller concentrations.
AAS revealed a relatively high gold content, namely, 152.5 g/t, due to the very low metal content of the input material. The high pyrite content suggested that gold may occur in the ore as colloidal gold, which is part of the pyrite crystal lattice, which could complicate subsequent extraction processes.
The comparative analysis of the mineralogical and elemental compositions before (Table 5) and after (Table 7) gravity separation revealed significant changes in both the heavy mineral content and the concentration of gold. The raw ore primarily consisted of quartz (60.93%), followed by chlorite (13.26%) and dolomite (7.74%). Pyrite, which was a notable heavy mineral in the ore, constituted 6.45% of the total composition. After gravity separation, the pan concentrate showed a substantial increase in the pyrite content (67.93%), indicating that the Knelson concentrator effectively concentrated this heavy mineral.
In the first pan concentrate, there was also a significant reduction in quartz (16.88%), which, together with other gangue minerals such as chlorite and calcite, further complicated the separation process. Coarse quartz particles without gold content negatively affected the separation process as they settled in the concentration cone due to their weight. On the other hand, some quartz particles were gold-bearing, mainly coarse particles without liberation, contributing to gold recovery. Studies have shown that the effectiveness of Knelson concentrators can be affected by the particle size distribution and specific gravity of the minerals present [35,36]. Understanding the mineralogical composition is therefore crucial to optimizing the gold extraction process.
The pan concentrate from Zlaté Hory showed a promising gold content and a high proportion of pyrite but also a higher presence of other tailings minerals, which required an individual approach to processing. Future studies will focus on optimizing these processes based on the ore’s specific mineralogical properties to increase the overall efficiency of gold extraction.
Pyrite, a common sulfide mineral, often hosts gold in a finely disseminated state, making it refractory to conventional gravity separation methods. This aligns with findings from various studies that highlight the challenges of extracting gold from sulfide-rich ores. For instance, Toktar et al. noted that a significant portion of gold can be locked within sulfide matrices, necessitating additional processing steps beyond gravity concentration [37]. This is particularly relevant in the context of Knelson concentrators, which are effective for free gold but may require optimization for ores with high sulfide content [38].
Other studies highlight that although Knelson concentrators are effective, their performance can be optimized by adjusting operating parameters such as fluidization water and particle size distribution [4]. Subasinghe’s work on optimizing fluidization water for Knelson concentrators suggests that dynamics within a concentrator can significantly affect recovery rates, suggesting that empirical testing is necessary to maximize gold yields from specific ore types [11]. In addition, the integration of gravity separation with other methods, such as flotation or leaching, has been shown to improve overall recovery rates, especially for refractory ores where gold is not easily released [39,40]. For example, Liu et al. discuss the recovery of gold from leaching residues using gravity methods, suggesting that a combination of techniques can increase the recovery of gold locked in complex mineral matrices [41]. This is especially important when taking into account the mineral composition of the pan concentrate, where the presence of multiple minerals requires a comprehensive approach to extraction.

4. Conclusions

The results of the GRG test demonstrated that the use of the Knelson centrifugal concentrator was an effective method for pre-concentration even in the case of low-grade gold ores. This technology allows for a more environmentally friendly approach compared with traditional flotation processing and can be applied as an efficient pre-concentration step, thereby eliminating several flotation stages. The flotation method could then be used to extract residual gold from waste products and pan tails, leading to even more efficient utilization of the ores.
Our experimental results showed that gravitational separation at the locations of Kašperské Hory and Zlaté Hory achieved yields of 64.21% and 66.3%. This fact confirmed that the Knelson concentrator was capable of effectively extracting gold from these ores.
Furthermore, the GRG test was proven to be an effective method for assessing the gold content in various grain size fractions, which is crucial for subsequent optimization of the mining process. Although we did not achieve excellent yields above 80%, the results obtained indicated that gravitational separation was very effective and could be further optimized to reduce gold losses in waste. Such optimization could increase the overall yield and approach excellent values, leading to even greater efficiency in processing operations and better utilization of the raw material.

Supplementary Materials

The following supporting information can be downloaded at https://www.mdpi.com/article/10.3390/min14121279/s1: Figure S1: Granulometric analyses of ZH; Figure S2: Granulometric analyses of KH; Figure S3: XRD diffraction of the input sample of KH; Figure S4: XRD diffraction of the K1 sample of KH; Figure S5: XRD diffraction of the input sample of ZH; Figure S6: XRD diffraction of the K1 sample of ZH.

Author Contributions

Conceptualization, I.J., O.Š. and T.Š.; investigation, V.Č. and O.Š.; formal analysis, I.J., O.Š. and T.Š.; data curation, R.S.; visualization, R.S.; writing—original draft preparation, I.J., O.Š. and T.Š.; writing—review and editing, V.Č. and O.Š. All authors have read and agreed to the published version of the manuscript.

Funding

This research was funded by the Student Grant Competition financed by the Faculty of Mining and Geology, VSB, Technical University of Ostrava, within project “Treatment options for gold-bearing polymetallic ore” (No. SP2024/106).

Data Availability Statement

Data are contained within the article.

Conflicts of Interest

The authors declare no conflicts of interest.

References

  1. Petrova, V. Exploring the Opportunities for Sustainable Management of Critical Raw Materials in the Circular Economy. Eurasia Proc. Sci. Technol. Eng. Math. 2023, 26, 664–671. [Google Scholar] [CrossRef]
  2. Yang, J.; Zhu, H.L.; Ma, L.W.; Li, Z. An Evaluation of Critical Raw Materials for China. Adv. Mater. Res. 2013, 773, 954–960. [Google Scholar] [CrossRef]
  3. Li, H.; Xiao, W.; Jin, J.; Han, Y. Oxidation Roasting of Fine-Grained Carbonaceous Gold Ore: The Effect of Aeration Rate. Minerals 2021, 11, 558. [Google Scholar] [CrossRef]
  4. Richmond, K.A.; Zanin, M.; Gascooke, J.; Skinner, W.; Addai-Mensah, J. Refractory Gold Ores and Concentrates Part 1: Mineralogical and Physico-Chemical Characteristics. Miner. Process. Extr. Metall. 2021, 130, 240–252. [Google Scholar] [CrossRef]
  5. Hool, A.; Helbig, C.; Wierink, G. Challenges and Opportunities of the European Critical Raw Materials Act. Min. Econ. 2024, 37, 661–668. [Google Scholar] [CrossRef]
  6. Tomala, J.; Urbaniec, M. Towards Sustainable Development in the European Union: A Critical Raw Materials Perspective. Econ. Environ. 2024, 88, 654. [Google Scholar] [CrossRef]
  7. Pommeret, A.; Ricci, F.; Schubert, K. Critical Raw Materials for the Energy Transition. Eur. Econ. Rev. 2022, 141, 103991. [Google Scholar] [CrossRef]
  8. Tkaczyk, A.H.; Bartl, A.; Amato, A.; Lapkovskis, V.; Petranikova, M. Sustainability Evaluation of Essential Critical Raw Materials: Cobalt, Niobium, Tungsten and Rare Earth Elements. J. Phys. D Appl. Phys. 2018, 51, 203001. [Google Scholar] [CrossRef]
  9. Chryssoulis, S.L.; McMullen, J. Mineralogical Investigation of Gold Ores. In Developments in Mineral Processing; Adams, M.D., Wills, B.A., Eds.; Advances in Gold Ore Processing; Elsevier: Amsterdam, The Netherlands, 2005; Volume 15, pp. 21–71. [Google Scholar]
  10. Zhou, M.; Kokkilic, O.; Langlois, R.; Waters, K. A Preliminary Investigation of Dry Gravity Separation with Low Specific Gravity Ores Using a Laboratory Knelson Concentrator. Physicochem. Probl. Miner. Process. 2023, 59, 165992. [Google Scholar] [CrossRef]
  11. Subasinghe, G.K.N. Performance Curve Approach to Optimising Fluidising Water for Knelson Concentrators. Miner. Process. Extr. Metall. 2012, 121, 205–210. [Google Scholar] [CrossRef]
  12. Laplante, A.; Gray, S. Advances in Gravity Gold Technology. In Developments in Mineral Processing; Adams, M.D., Wills, B.A., Eds.; Advances in Gold Ore Processing; Elsevier: Amsterdam, The Netherlands, 2005; Volume 15, pp. 280–307. [Google Scholar]
  13. Munganyinka, J.P.; Habinshuti, J.B.; Ndayishimiye, J.C.; Mweene, L.; Ofori-Sarpong, G.; Mishra, B.; Adetunji, A.R.; Tanvar, H. Potential Uses of Artisanal Gold Mine Tailings, with an Emphasis on the Role of Centrifugal Separation Technique. Sustainability 2022, 14, 8130. [Google Scholar] [CrossRef]
  14. Roostaei, H.; Kordparijaei, M.; Mesroghli, S. Iron Oxide Gold-Bearing Ore Processing Based on Ore Characterization: Gravity Pre-Concentration and Cyanide Dissolution. Preprint 2023. [Google Scholar]
  15. Lins, F.F.; Veiga, M.M.; Stewart, J.A.; Papalia, A.; Papalia, R. Performance of a new centrifuge (Falcon) in concentrating a gold ore from texada island, B.C., Canada. Miner. Eng. 1992, 5, 1113–1121. [Google Scholar] [CrossRef]
  16. Burt, R. The Role of Gravity Concentration in Modern Processing Plants. Miner. Eng. 1999, 12, 1291–1300. [Google Scholar] [CrossRef]
  17. Chen, Q.; Yang, H.; Tong, L.; Niu, H.; Zhang, F.; Chen, G. Research and Application of a Knelson Concentrator: A Review. Miner. Eng. 2020, 152, 106339. [Google Scholar] [CrossRef]
  18. Veiga, M.; Gunson, A.J. Gravity Concentration in Artisanal Gold Mining. Minerals 2020, 10, 1026. [Google Scholar] [CrossRef]
  19. Sakuhuni, G.; Altun, N.E.; Klein, B.; Tong, L. A Novel Laboratory Procedure for Predicting Continuous Centrifugal Gravity Concentration Applications: The Gravity Release Analysis. Int. J. Miner. Process. 2016, 154, 66–74. [Google Scholar] [CrossRef]
  20. Rouchalova, D.; Rouchalova, K.; Janakova, I.; Cablik, V.; Janstova, S. Bioleaching of Iron, Copper, Lead, and Zinc from the Sludge Mining Sediment at Different Particle Sizes, pH, and Pulp Density Using Acidithiobacillus Ferrooxidans. Minerals 2020, 10, 1013. [Google Scholar] [CrossRef]
  21. Kovarikova, H.; Janakova, I.; Cablik, V.; Vrlikova, V. Bacterial Leaching of Polymetallic Ores from Zlatý Chlum Locality. Inżynieria Miner. 2019, 21, 145–148. [Google Scholar]
  22. Ghaffari, A.; Farzanegan, A. An Investigation on Laboratory Knelson Concentrator Separation Performance: Part 1: Retained Mass Modelling. Miner. Eng. 2017, 112, 57–67. [Google Scholar] [CrossRef]
  23. Surimbayev, B.; Bolotova, L.; Mishra, B.; Baikonurova, A. Intensive Cyanidation of Gold From Gravity Concentrates in a Drum-Type Apparatus. News Natl. Acad. Sci. Repub. Kazakhsta 2018, 431, 32–37. [Google Scholar] [CrossRef]
  24. Fedotov, P.S.; Fedotov, K.V.; Burdonov, A.E.; Senchenko, A.E. A Study of Gold Ore for Processability by Gravity Separation Techniques. Ore Met. 2021, 2, 8–16. [Google Scholar] [CrossRef]
  25. Oediyani, S.; Triana, T.; Ifzan, I.; Mamby, H.E. Centrifugal Concentration of Mandailing Natal North Sumatera Gold Ores Using Knelson Concentrator. World Chem. Eng. J. 2021, 5, 44–49. [Google Scholar] [CrossRef]
  26. Surimbayev, B.N.; Kanaly, E.S.; Bolotova, L.S.; Shalgymbayev, S.T. Assessment of Gravity Dressability of Gold Ore—GRG Test. Gorn. Nauk. I Tekhnologii = Min. Sci. Technol. 2020, 5, 92–103. [Google Scholar] [CrossRef]
  27. Zhou, M.; Paris, J.; Kökkılıç, O.; Langlois, R.; Waters, K.E. An Investigation into the Dry Processing of Low Specific Gravity Ores Using a Laboratory Knelson Concentrator. Can. Metall. Q. (Can. J. Metall. Mater. Sci.) 2024, 63, 508–529. [Google Scholar] [CrossRef]
  28. Fullam, M.; Watson, B.; Laplante, A.; Gray, S. Chapter 19—Advances in Gravity Gold Technology. In Gold Ore Processing, 2nd ed.; Adams, M.D., Ed.; Elsevier: Amsterdam, The Netherlands, 2016; pp. 301–314. ISBN 978-0-444-63658-4. [Google Scholar]
  29. Koppalkar, S.; Bouajila, A.; Gagnon, C.; Noel, G. Understanding the Discrepancy between Prediction and Plant GRG Recovery for Improving the Gold Gravity Performance. Miner. Eng. 2011, 24, 559–564. [Google Scholar] [CrossRef]
  30. Myrzaliev, B.M.; Nogaeva, K.A.; Molmakova, M.S. Determination of Jamgyr Deposit Ore Gravity Concentration Feasibility. Ipolytech J. 2018, 22, 153–165. [Google Scholar] [CrossRef]
  31. Vávra, V. Největší Rudní Revír Zlata a Polymetalických Rud Na Moravě (Translate: The Largest Ore District of Gold and Polymetallic Ores in Moravia). Available online: http://pruvodce.geol.morava.sci.muni.cz/zlate_hory/taborske_skaly.html (accessed on 7 August 2024).
  32. Zelinger, O.; Grygárek, J. RD Jeseník 1958–1998; REP Tisk: Jeseník, Czech Republic, 1998; Translate Jeseník Ore District. [Google Scholar]
  33. Litochleb, J.; Sejkora, J.; Šrein, V.; Malec, J. Kašperskohorské Zlato (Šumava, Česká Republika). Bull. Miner.-Petrol. Odd. Nár. Muz. (Praha) 2009, 17, 1–13, Translate: Gold in the Kasperske Hory Mountain. [Google Scholar]
  34. Knelson. KC-MD3 User Manual Rev. 4.0. Scribd. 2017. Available online: https://www.scribd.com/document/615133333 (accessed on 7 August 2024).
  35. Mkandawire, N.P.; McGrath, T.; Bax, A.; Eksteen, J. Potential of the Dense Media Cyclone for Gold Ore Preconcentration. Miner. Process. Extr. Metall. 2020, 129, 87–95. [Google Scholar] [CrossRef]
  36. Marion, C.; Langlois, R.; Kökkılıç, O.; Zhou, M.; Williams, H.; Awais, M.; Rowson, N.A.; Waters, K.E. A Design of Experiments Investigation into the Processing of Fine Low Specific Gravity Minerals Using a Laboratory Knelson Concentrator. Miner. Eng. 2019, 135, 139–155. [Google Scholar] [CrossRef]
  37. Toktar, G.; Magomedov, D.R.; Koizhanova, A.K.; Abdyldaev, N.N.; Bakraeva, A.N. Extraction of Gold from Low-Sulfide Gold-Bearing Ores by Beneficiating Method Using a Pressure Generator for Pulp Microaeration. Kompleks. Ispolz. Miner. Syra = Complex Use Miner. Resour. 2023, 325, 62–71. [Google Scholar] [CrossRef]
  38. Sen, S. Gold Recovery by KC from Grinding Circuit of Bergama CIP Plant. Rem Rev. Esc. Minas 2010, 63, 539–545. [Google Scholar] [CrossRef]
  39. Wang, X.; Qin, W.; Jiao, F.; Yang, C.; Cui, Y.; Li, W.; Zhang, Z.; Song, H. Mineralogy and Pretreatment of a Refractory Gold Deposit in Zambia. Minerals 2019, 9, 406. [Google Scholar] [CrossRef]
  40. Win Tun, N.; Godirilwe, L.L.; Batnasan, A.; Haga, K.; Shibayama, A. Process Development for Gold Concentrate Recovery by Multi-Stage Flotation Using Optimized Conditions. Int. J. Soc. Mater. Eng. Resour. 2022, 25, 235–242. [Google Scholar] [CrossRef]
  41. Liu, Q.J.; Deng, R.D.; Yang, J.L. Using Plain Chute to Recovery Gold from Leaching Residue. Adv. Mater. Res. 2012, 530, 3–8. [Google Scholar] [CrossRef]
Figure 1. A procedural flow sheet for the GRG test.
Minerals 14 01279 g001
Figure 2. Microstructure of the input sample from Kašperské Hory (SEM and microanalysis).
Minerals 14 01279 g002
Figure 3. Recovery of gold by concentration stage (Kašperské Hory).
Minerals 14 01279 g003
Figure 4. Microstructure of the input sample from Zlaté Hory–Západ (SEM and microanalysis).
Minerals 14 01279 g004
Figure 5. Recovery of gold by concentration stage (Zlaté Hory–Západ).
Minerals 14 01279 g005
Table 1. Parameters of the GRG test [34].
Input Particle Size
[µm]
Feed Rate
[g/min]
Fluidization Flow Rate of Water [L/min]
Step 190%–100% < 850800–10003.5
Step 245%–60% < 75600–9003.5
Step 375%–80% < 75400–6003.5
Table 2. Input sample—XRD and AAS results (Kašperské Hory).
MineralContent [%]ElementContent [g/t]
Quartz56.14Gold2.9
Chlorite19.63
Albite17.88
Table 3. GRG test results (Kašperské Hory).
ProductWeightAssayRecovery
[g][%]Au [g/t]Au [%]
Pan concentrate 1200.01.159.015.75
Pan tail 13766.019.95.025.14
KC-MD3 concentrate 13966.021.07.740.89
Pan concentrate 28.20.04151.01.65
Pan tail 21022.05.49.012.28
KC-MD3 concentrate 21030.25.4410.113.93
Pan concentrate 36.50.0346.00.39
Pan tail 3480.02.514.08.97
KC-MD3 concentrate 3486.52.514.49.37
Total KC-MD3 concentrate 35482.729.08.764.21
KC-MD3 tails13,404.071.02.035.79
Calculated head18,886.7100.03.9100.00
Assayed head 2.9
Table 4. Pan concentrate 1—XRD and AAS results, Kašperské Hory.
MineralContent [%]ElementContent [g/t]
Pyrite2.13Gold59.0
Chlorite0.54
Quartz56.42
Muscovite7.33
Albite17.14
Scheelite0.38
Arsenopyrite10.50
Biotite5.57
Table 5. Input sample—XRD and AAS results (Zlaté Hory–Západ).
MineralContent [%]ElementContent [g/t]
Quartz60.93Gold6.0
Chlorite13.26
Dolomite7.74
Pyrite6.45
Albite5.21
Chalcopyrite2.16
Calcite2.14
Muscovite2.11
Table 6. GRG test results (Zlaté Hory–Západ).
ProductWeightAssayRecovery
[g][%]Au [g/t]Au [%]
Pan concentrate 1148.80.8152.525.78
Pan tail 11179.26.29.012.06
KC-MD3 concentrate 11328.06.925.137.84
Pan concentrate 2345.01.811.04.31
Pan tail 21017.65.34.04.62
KC-MD3 concentrate 21362.67.15.88.93
Pan concentrate 3399.22.135.015.87
Pan tail 31065.85.63.03.63
KC-MD3 concentrate 31465.07.711.719.51
Total KC-MD3 concentrate 34155.621.914.266.28
KC-MD3 tails14,826.078.12.033.72
Calculated head18,981.6100.04.6100.00
Assayed head 6.0
Table 7. XRD and AAS results (pan concentrate 1, Zlaté Hory–Západ).
MineralContent [%]ElementContent [g/t]
Quartz16.88Gold152.5
Chlorite0.18
Dolomite9.53
Pyrite67.93
Calcite5.47
Disclaimer/Publisher’s Note: The statements, opinions and data contained in all publications are solely those of the individual author(s) and contributor(s) and not of MDPI and/or the editor(s). MDPI and/or the editor(s) disclaim responsibility for any injury to people or property resulting from any ideas, methods, instructions or products referred to in the content.

