1. Introduction
Nanoparticles (whose size ranges from a few to 100 nm) are of great interest as the properties of such particles may significantly differ from those of larger fragments of the same phases (e.g., [
1]). The possible involvement of Au and Ag nanoparticles in endogenic ore-forming processes is interesting because of their ability to transport appreciably greater concentrations of ore components than is possible in solutions as inorganic complexes. Thus, nanoparticle transport offers an alternative to traditional explanations for the transport of precious metals by hot aqueous mineral-forming fluids, especially in bonanza deposits [
2]. State-of-the-art techniques applied in studying various materials (high-resolution scanning electron microscopy (SEM HR), transmission electron microscopy (TEM), scanning transmission electron microscopy (STEM), focused ion beam-scanning electron microscopy (FIB-SEM), secondary ion mass spectrometry (SIMS), scanning tunneling microscopy (STM), atom probe tomography (APT), etc.) make it possible to visualize the shape of gold inclusions hosted in various minerals. Based on the circular morphologies of the gold nanoparticles, many researchers discuss the possible involvement of such particles in processes that form different types of gold deposits [
1,
3,
4].
However, the circular shapes of gold inclusions in solid mineral phases are not indisputable proof that such particles were contained in fluids because gold particles of this morphology may have formed by precipitation from solution on the surface of crystals when gold complexes break down. More reliable evidence that nanoparticles can be carried by hydrothermal solutions would be furnished if such particles were identified in fluid inclusions (FIs) representing the ore-forming fluid system [
5] or solutions with artificially produced nanoparticles [
6]. Maintaining the stability of nanoparticles in solutions over a long period of geological time is problematic as nanoparticles can rapidly lose their individuality, aggregate with one another, and eventually form larger gold particles. It is now difficult (if at all possible) to estimate the scale of these processes and phenomena, but they evidently reduce the scope of minerals suitable for nanoparticle search in FIs. It is difficult to identify nanoparticles in FIs without their destruction because of the small volumes of the fluid that can be searched. One of the available techniques to identify Au and Ag nanoparticles in solutions is from the UV–Vis spectrum of the plasmon absorption of nanoparticles with confocal microscopy [
7,
8]. This technique has previously shown that Au–Ag nanoparticles occur in quartz-hosted aqueous FIs from the gold-bearing interval penetrated by the SD-3 Kola Superdeep Borehole [
5]. Our further studies of these samples are aimed at determining if Au and Ag nanoparticles are present in high-density pure CO
2 FIs and not restricted to aqueous FIs.
The Kola Superdeep Borehole was drilled to a depth of 12,262 m and recovered Proterozoic and Archean age metamorphic rocks that contain ore mineralization [
9,
10]. Gold mineralization, averaging 6.7 ppm, was detected by neutron activation between 9.5–11 km in Archean (2.6–2.8 Ga) amphibolites and muscovite–biotite gneisses. The mineralized host rocks were affected by regional metamorphism at 500–650 °C and 3.5–6 kbar [
11]. The gold mineralization comprises native gold (up to 10 μm, fineness 760‰) hosted in quartz and other minerals [
9]. Quartz contains small (1–200 microns) muscovite ingrowths (
Figure 1a), which indicates the presence of quartz–muscovite (phyllite) mineral association formed under acidic conditions (pH 3–5).
2. Materials and Methods
Fluid inclusions were previously found in quartz veinlets from the gold-bearing interval, and their characteristics were reported [
5]. Four types of FI were identified: (1) dense carbon dioxide, (2) two-phase liquid–vapor saline solutions, (3) three-phase brines with cubic NaCl crystals, and (4) saline H
2O–CO
2 solutions.
LA-ICP-MS studies of individual inclusions revealed high Au concentrations (up to 8000 ppm) in individual FI over the whole depth interval, from 9050 to 11,000 m. Optical spectroscopy of types 3 and 4 FI showed these contained gold nanoparticles, which were especially concentrated around the vapor phase in the FI [
5]. This study aimed to determine the role of CO
2 and whether the nanoparticles were transported by aqueous fluids or dense CO
2. Hence, our detailed study of type 1 FI containing dense CO
2 (
Figure 1 and
Figure 2), which was found in quartz throughout the whole gold-bearing depth interval (dominant at the deepest levels) and also above it. Dense CO
2 FI occurs both uniformly dispersed in the quartz (
Figure 1b) and also within cracks and zones of quartz recrystallization (
Figure 1c). In general, the former contains the densest CO
2 FI. Not all muscovite crystals are surrounded by haloes of CO
2 FI, but such associations are quite common (
Figure 1a). Typically, muscovite is surrounded by the earliest inclusions, with higher density CO
2. There are also similar inclusions not related to muscovite crystals, indicating that CO
2 was not released from the muscovite.
Experimental methods for fluid inclusion investigations such as microthermometry, Raman spectroscopy, laser ablation, and local transmission spectroscopy were used in this work using the same equipment and experimental protocols as were previously described in [
5]. We present here only the main details.
Fluid inclusion microthermometry. The microthermometric study of the FIs was carried out at a laboratory of the Institute of Geology of Ore Deposits, Petrography, Mineralogy and Geochemistry, Russian Academy of Sciences, in Moscow, Russia. Double-polished 0.3–0.5 mm thick sections were made from quartz samples for visual, thermometric, and cryometric studies of fluid inclusions. Fluid inclusions were studied using an Olympus BX51 optical microscope. Microthermometry of fluid inclusions was performed with a THMSG-600 heating stage (Linkam, Waterfield, UK) attached to the Olympus microscope equipped with long-focal-length lenses, a video camera, and a control computer.
Raman spectroscopy. The composition of the gas phase of individual FIs was analyzed by Raman spectroscopy at room temperature and upon heating to 140 °C at the Sobolev Institute of Geology and Mineralogy, Siberian Branch, Russian Academy of Sciences, in Novosibirsk, Russia, using a Jobin Yvon LabRAM HR800 spectrometer (Horiba Jobin Yvon Raman Division, Longjumeau, France). The mole fractions of the gases were calculated based on data in [
12]. However, direct determination of the water content in fluids with large CO
2/H
2O ratios by Raman spectroscopy is difficult [
13]. At room temperature and pressures up to 100 bar, CO
2 and H
2O are largely immiscible, and any single-phase FIs that initially trapped a H
2O–CO
2 mixture will contain two phases at room temperature, almost pure CO
2 and almost pure H
2O. Due to the different wetting behaviors of CO
2 and H
2O, the H
2O phase will exist as a thin film on the walls of the inclusion. Therefore, the FI may contain a significant amount of H
2O that would not be detected, and thus, some amount of H
2O may be present in a FI with dense CO
2 and not be observed. To overcome this, we have measured the Raman spectra for FIs with dense CO
2 in samples at 140 °C in order to convert all the water inside the inclusion into a vapor state and more suitable for studying the H
2O/CO
2 ratio by Raman spectroscopy [
14].
Laser ablation ICP-MS of fluid inclusions and quartz. The chemical analysis of individual FIs, or groups of small, related FIs, was made by Laser ablation inductively-coupled–mass spectrometry (LA-ICPMS) using an Agilent 7500c mass spectrometer combined with a Geolas laser ablation system. This system uses a Compex 103 ArF excimer laser, producing a wavelength of 193 nm with an energy density typically 10 Jcm
−2 at the sample surface. The operating frequency of the laser was 5 Hz with spot sizes of 25 μm and occasionally 50 μm, the main criteria being that the size was greater than that of the inclusions. For the analysis of fluid inclusions, element/Na intensity ratios were converted to weight/weight ratios using the NIST glass standard SRM-610 [
15] and the soda lime standard SRM-1412 [
16] (for K/Na ratios close to 1) for calibration. For the analysis of quartz, 50 μm ablation spots were used, and the elements were determined against Si as the internal standard element. NIST SRM-610 was used to check for instrumental drift, which was insignificant over each day’s analysis. To integrate the standard and sample signals, the SILLS software package, version 1.0.1, was used [
17]. Full details of the analytical protocols and calibration of the instrument are presented in [
18].
Additional FI analysis was made with a laser ablation time-of-flight mass spectrometer system courtesy of TOFWERK in Thun, Switzerland. The advantage of this system is the simultaneous determination of the analytical signal for all the elements present and the much greater number of signals per unit time due to the faster configuration of the ablation and mass transport system. The full details of the system are presented in [
19]. Element sensitivities were determined using the NIST SRM-610 glass standard.
High-resolution local transmission spectroscopy. The transmission spectra of individual portions of the fluid phase, with a volume of 1 μm3, located inside the FIs, were measured using confocal scanning microscopy. The plane-parallel, 0.4 mm thick quartz plates with the FIs located inside them were placed on a 3-axis stage (Thorlabs, MBT616D/M, Thorlabs, Newton, NJ, USA). This allowed for the precise movement of FIs along the z-axis for analysis of the transmission spectra at different locations.
The FIs were illuminated by white light (halogen lamp HL2000 FHSA Ocean Optics, Dunedin, FL, USA), and the transmitted optical signal was collected by an objective (Mitutoyo M Plan APO HR 100Ч, 0.9 NA, Mitutoyo, Japan). This signal was then analyzed using a commercial confocal spectrometer Horiba LabRam HR (Horiba Scientific, Hamamatsu, Japan) with a cooled CCD camera (Andor DU 420A-OE 325, Oxford Instruments Andor Ltd, London, UK) and 600 g/mm diffraction grating. The spectra of the white lamp and the inclusion-free optical path were measured in advance as a baseline for the signal transmitted through the sample. The conversion of the measured transmission (T) to absorption (A) spectra was carried out arithmetically (A = 1 − T) with the assumption that the scattering and reflection from the nanoparticles and surface roughness do not significantly affect the absorption spectra.
3. Results
The microthermometry data show that CO2 in the type-1 large FIs homogenizes to liquid at temperatures of −45.0 to +30.8 °C. In some FIs (in sample K-10205.8), CO2 homogenizes to gas at a temperature of +30.5 °C. The melting point of solid CO2 varies from −56.7 to −60.3 °C, which indicates that the CO2 contains minor amounts of other gases. The density of the carbon dioxide is 0.37–1.14 g/cm3. The textural position of the FI is related to the time and nature of trapping. The earliest FIs are largely uniformly distributed throughout the quartz, while later ones are located in areas of fracturing or recrystallization of quartz. Only FIs without signs of leakage were selected for measurement. The wide range of CO2 homogenization temperatures and the associated density variations are caused primarily by changes in fluid density with time due to tectonic processes.
The composition of the gas phase of the FI was studied by Raman spectrometry (
Table 1) at room temperature. The data indicate that the CO
2 of the type-1 FIs contains minor (0.3−1.3 mol %) amounts of nitrogen throughout the whole length of the mineralized zone and that the FIs do not contain either CH
4 or H
2S (the detection limits were 0.1 mol %).
Additional confirmation that the FIs contain high-density CO
2 was obtained from the Raman spectra. As it is known [
20], the distance between the Fermi doublet (Δ) depends on the density. In the studied samples, this distance was about 105 cm
−1 (peak positions were 1281.0 ± 0.1 cm
−1 and 1386.0 ± 0.1 cm
−1) and corresponds to a density of about 1 g/cm
3 [
20]. The accuracy of this determination is low, but it can serve as an independent confirmation of the data obtained by microthermometry.
At a temperature of 140 °C, the Raman spectra of the same gaseous FIs of high-density CO2 peaks for H2O, which allowed us to evaluate the H2O concentration in the high-density gas fluid (0.1–0.4 mol %). The fluid composition is dominated by carbon dioxide (98.2–99.5 mol %), which contains a nitrogen admixture (0.4–1.8 mol %).
Our LA-ICP-MS data indicate that the fluid of the homogeneous FIs with high-density carbon dioxide (samples from depths of 9052–10,744 m) contains high concentrations of gold (1–2611 ppm, 62 analyses) and silver (1–4389 ppm, 58 analyses) (
Figure 3). The Au/Ag ratio is 3/1 on average.
To verify the presence of nanoparticles in the FIs, we used the Tyndall effect. CO
2 in the FIs was illuminated by red laser light at a wavelength of 657 nm at a shallow angle relative to the plane of the quartz plates containing the FIs (side illumination). Any light reflected by the FIs was observed from above using a conventional microscope. Side laser illumination of the FIs produced intense light scattering in the interior CO
2, an even red glow from the whole of the interior (
Figure 2d). As was shown in [
5], it is the presence of nanoparticles in the FIs that produces such scattering. In [
5], the FIs studied were H
2O–CO
2 and showed a red scattering from the H
2O phase but a more intense white reflection from the much greater accumulation of nanoparticles around the gaseous phase. This is not the case for a true solution (where components are dissolved), as the only red reflectance observed results from the quartz–liquid, and liquid–vapor bubble interfaces in such FIs [
5]. If there are no nanoparticles in the solution, no glow occurs. The glow (light scattering) of dense carbon dioxide observed in this case (
Figure 2d), as well as for the FIs of another composition described in [
5], indicates the presence of nanoparticles inside FIs and confirms that nanoparticles are associated with the CO
2 phase.
Figure 3.
Laser-ablation profile across three CO2 FIs. Au is within the fluid inclusions and is present as particles and not in solution (presence of Au-spikes).
Figure 3.
Laser-ablation profile across three CO2 FIs. Au is within the fluid inclusions and is present as particles and not in solution (presence of Au-spikes).
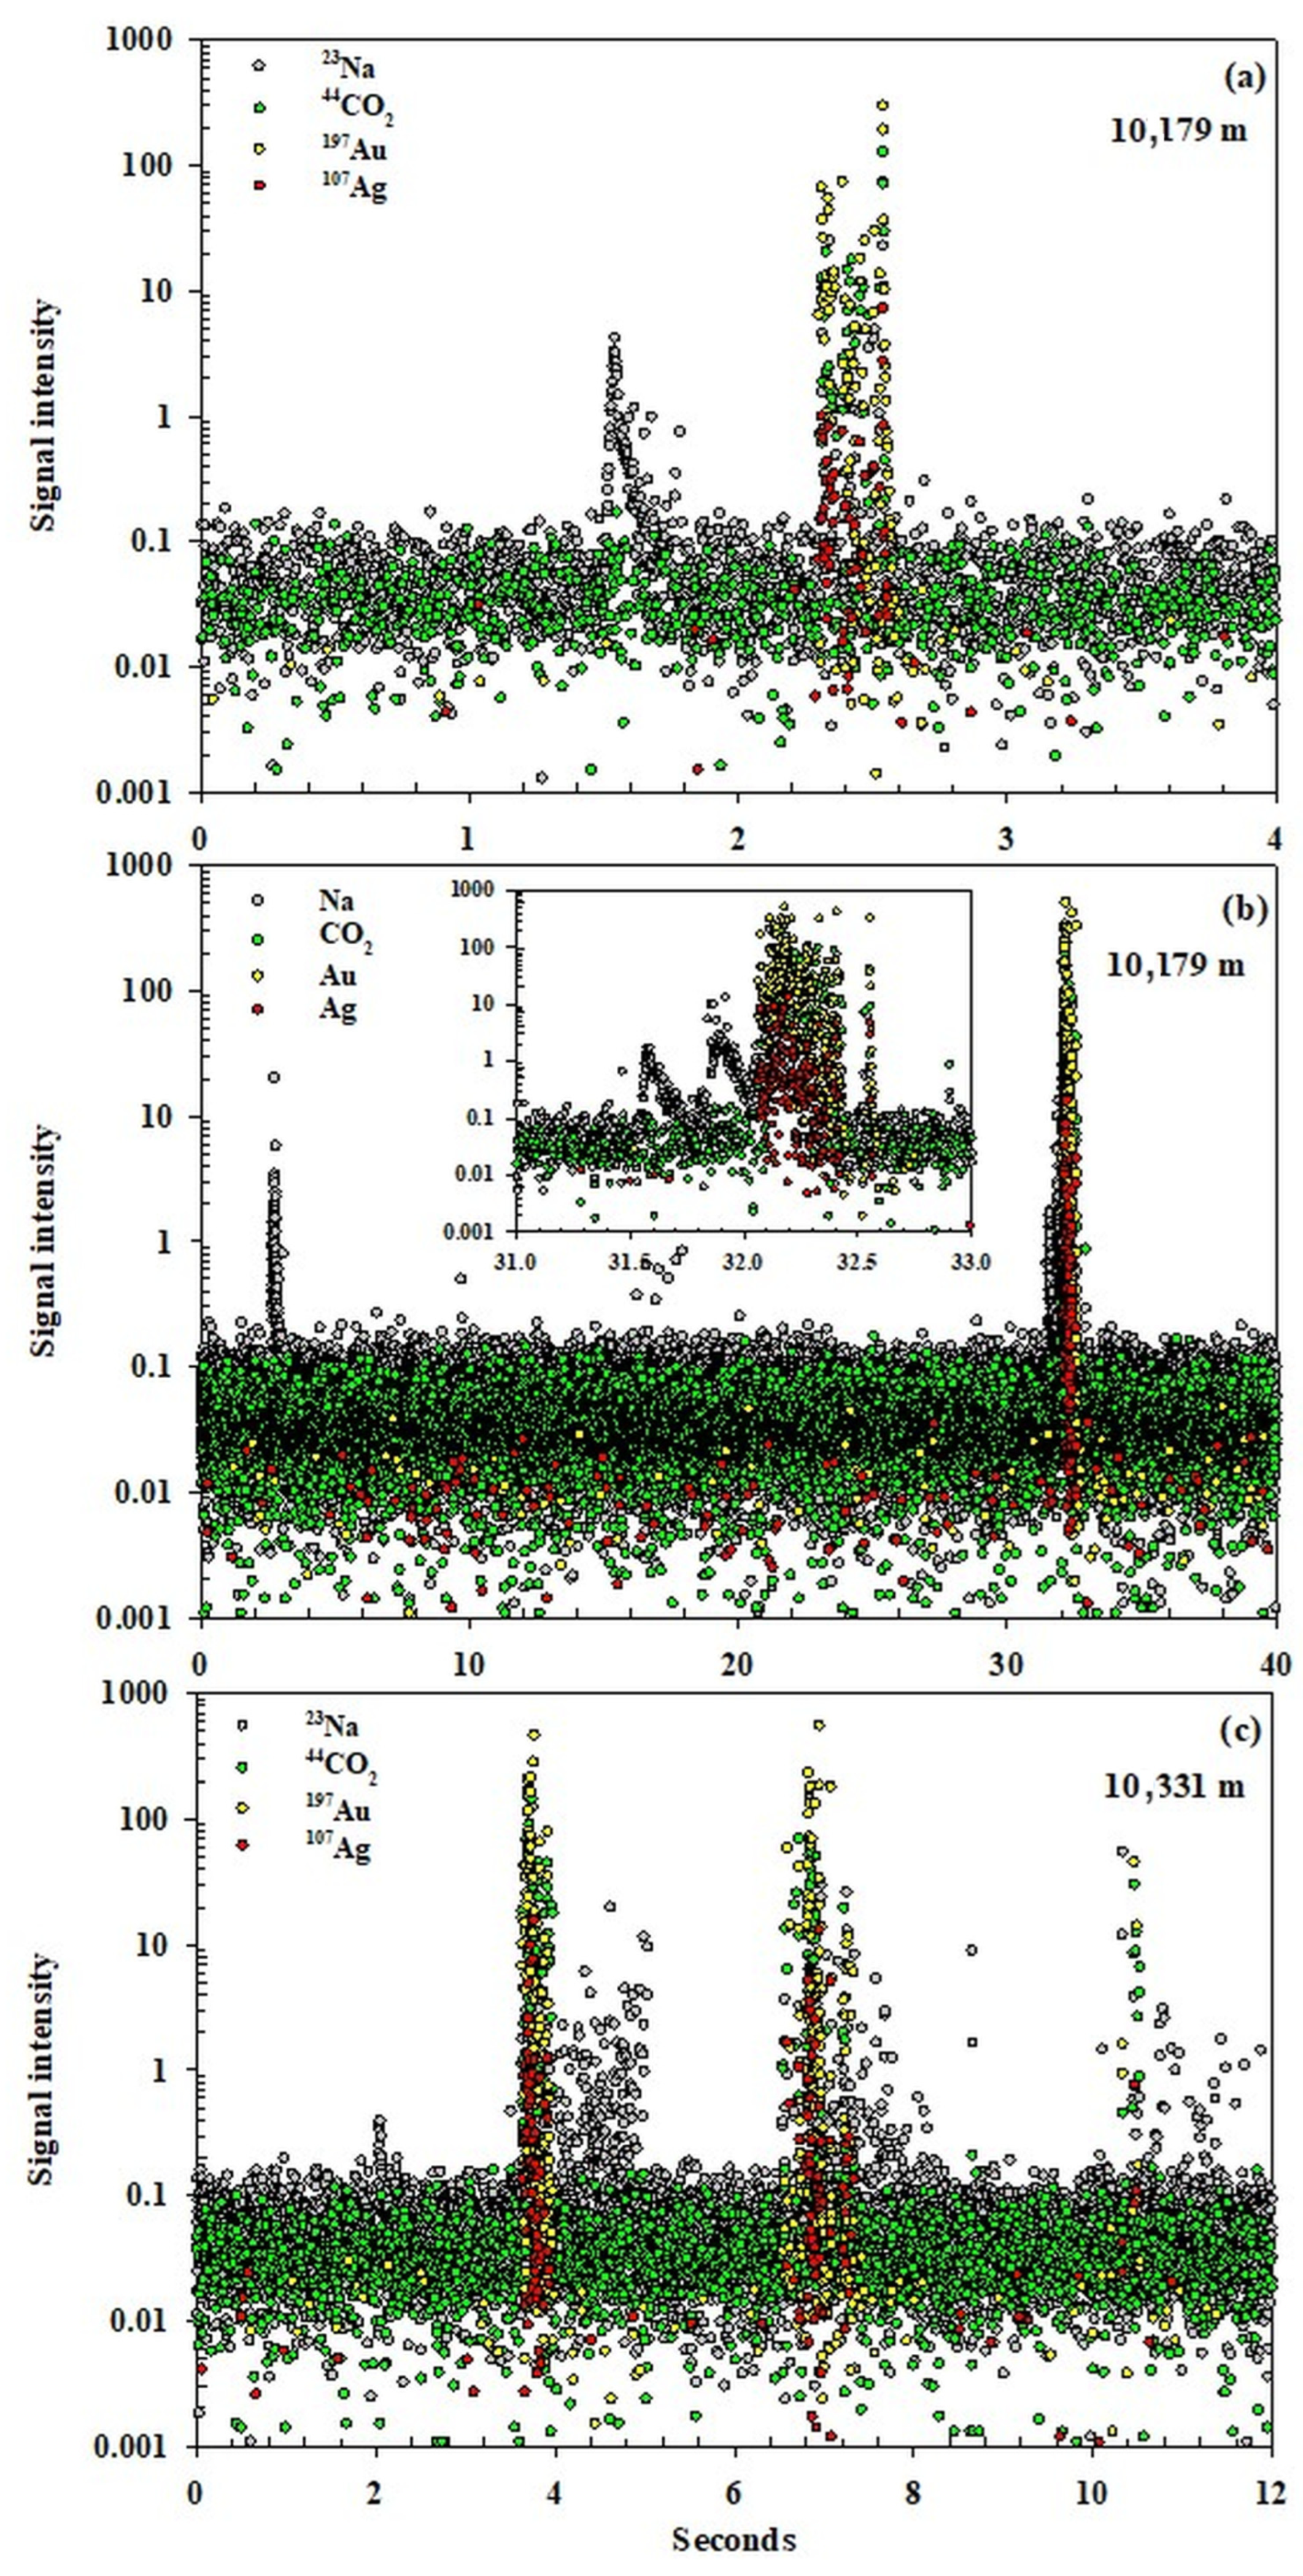
Unlike the quadrupole mass spectrometry systems, which measure each element selected sequentially, the time-of-flight (ToF) spectrometer effectively measures each isotope present at the same time. This provides an increased number of data points, resolution, and the ability to detect element associations. In
Figure 4, three ToF ablation spectra for Na, CO
2 Ag, and Au are shown, where a number of FIs have been ablated. In these, we have used Na to indicate the presence of aqueous saline fluids and CO
2 for the high-density phase that we propose transports the Au–Ag nanoparticles. In
Figure 4a, there is a Na-only peak that shows no Au–Ag particles. In later inclusions from both depths, a strong presence of Au–Ag associated with CO
2 is observed
. In
Figure 4b, there is again a Na peak from a FI and later a more intense peak with Au and Ag associated with CO
2. The Na signal, just prior to the Au–Ag, is from two small distinct aqueous FIs and is not associated with the main peak of the nanoparticles. In
Figure 4c (at 10331 m compared with 10,179 m for
Figure 4a,b), there is again a sharp, intense peak associated with Au–Ag and CO
2, followed by significant Na and no other elements. Au and Ag only occur when CO
2 is also present. When Na alone appears from FIs, there are no nanoparticles present. In the FIs with the high-density CO
2, we also detect small amounts of Na, which agrees with the Raman spectroscopy analysis. It is clear from the ToF data that at these depths, Au–Ag nanoparticles are transported by the high-density CO
2 and not by the aqueous saline fluids.
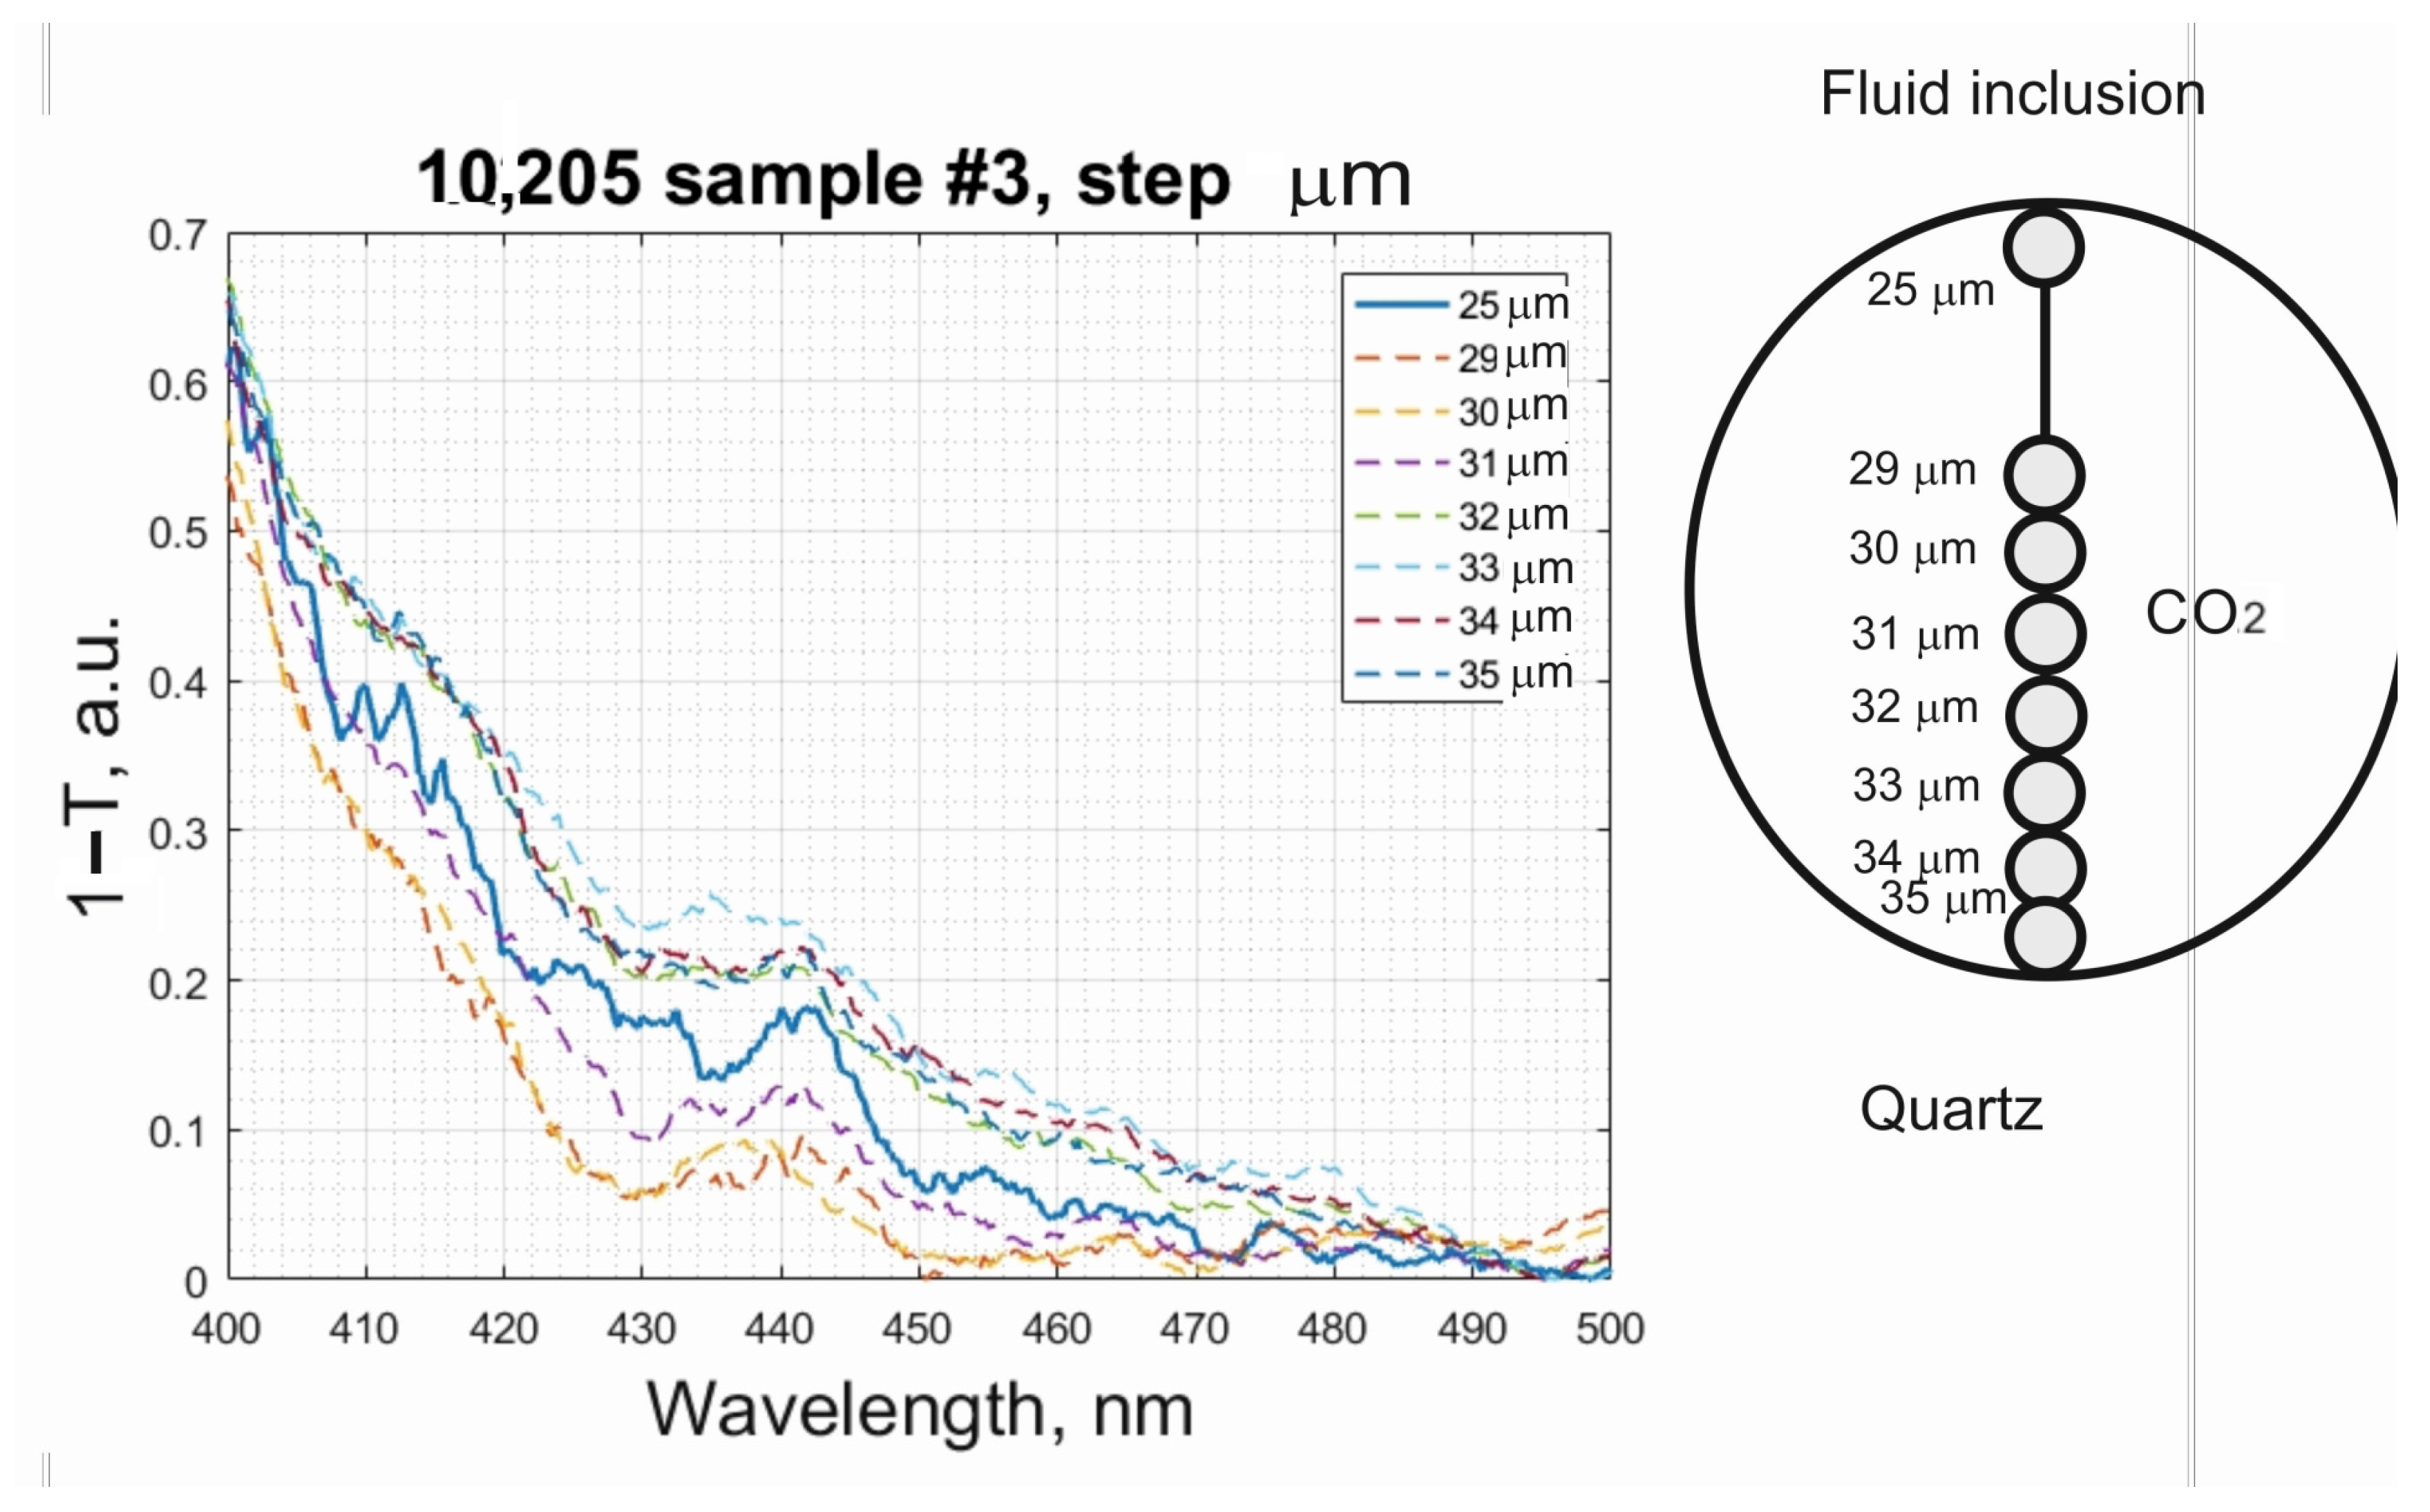
Details of the size and composition of the nanoparticles can be obtained from the UV–Vis transmission spectra measured for various parts of the FI at depth increments of 1 μm. From the spectra of high-density CO
2 of the Type 1 FI, we observe that all parts of the FI show a well-defined band at 440 nm, the peak intensity of which reaches a maximum near the liquid/quartz interface (
Figure 5). This band is typical of the plasmonic absorption of spherical nanoparticles approximately 10 nm in diameter and containing close to 75% Ag [
21]. This means that we are dealing with a quantum-dimensional metallic colloidal system. The spectra from other areas within the FI and the host quartz show no such bands. Similar data were acquired from three other FIs. These data display analogous trends and unambiguously indicate that the FIs near the fluid/quartz interface contain the highest concentrations of Ag−Au nanoparticles. Such accumulations of nanoparticles near the solid/liquid interface are also typical of nanosystems. Some discrepancies between the proportions of Au and Ag nanoparticles inferred from the ICP-MS data and confocal transmission spectra may be explained by the enrichment of the nanoparticle surface with Ag, which is characteristic of core (Au)/shell (Ag) type particles. Moreover, the formation of nanoparticles of such type can be easily explained by the difference in melting/crystallization temperatures of gold and silver. Gold, whose melting temperature is much higher, is the first to crystallize out of the melt rising from the mantle, while silver condenses on its surface during further cooling of the system.
4. Discussion
FIs filled with high-density CO
2 associated with aqueous FIs are usually interpreted as evidence that the H
2O–CO
2 fluid is heterogeneous (boiled). However, it was also suggested [
22] that assemblages of gaseous and aqueous FIs could be formed by mixing. A review of data on the composition and density of mineral-hosted FIs in crustal and mantle rocks [
23] indicates that upper mantle rocks typically host gaseous fluid consisting mostly of high-density CO
2. Conversely, minerals from the upper levels of the Earth’s crust usually host FIs filled with aqueous solutions. To date, there are only a few known and described gold deposits (i.e., Carara, Brasil; Ashanti, Ghana; deposits hosted in amphibolite-granulite rocks in the Limpopo belt of South Africa), whose gold mineralization was presumably formed by dense CO
2 fluid without the participation of aqueous fluid [
24,
25,
26,
27]. Since most waters occur at or close to the Earth’s surface, the global transfer of gases from the mantle toward shallow levels should be associated with interactions between the deep gaseous and crustal aqueous fluids. The gold mineralization recorded in the SD-3 Borehole was formed in the middle crust at 17 km or deeper, which corresponds with the current understanding of the depths at which the deepest hypozonal orogenic gold deposits were formed [
28].
The following conceptual model for the transport of Au–Ag nanoparticles by dense, aqueous-free CO
2 fluid can be proposed (
Figure 6). We suggest that Au–Ag nanoparticles are formed in the mantle by evaporation—condensation [
29]. During the interaction of CO
2 with deep hot rocks, gold and silver vaporize into the gas phase. As the CO
2 cools, the vapor condenses, and nanoparticles are formed. Our data demonstrate that high-density CO
2 fluid can transport Au and Ag from the Earth’s mantle to the crust, where the nanoparticles are redistributed between different types of fluids. At the depth of gold mineralization in the Kola Superdeep Borehole, the interaction between different fluids, aqueous saline brine, and dense CO
2 has occurred [
5], and the transfer of nanoparticles from CO
2 to CO
2—water fluid is quite possible. A similar fluid has formed the mined gold mineralization in this region, which is closer to the surface [
30]. Such a scheme is in good agreement with the modern model for the origin of orogenic mineral deposits [
31].
It should be noted that the characteristics of nanoparticles detected in dense carbon dioxide are markedly distinct from those observed in aqueous fluids [
5]. They vary significantly in size and architecture and also in aggregation propensity. Currently, we can only assume that such changes occur as a result of the interaction of nanoparticles with water during the above-mentioned mixing of gas and water fluids and deal with different solubility of metals in water and differences in the stabilizing capacity of the medium.


 ,
, 


