Article

The Impacts of Molybdenum Exploration on Cd and Zn Contents in Surface Water: Evidence from a Molybdenum Mine in the Xiaoqinling Mountains

1
School of Resources Engineering, Xi’an University of Architecture and Technology, Xi’an 710055, China
2
Xi’an Geological Survey Center of China Geological Survey, Xi’an 710054, China
3
Field Observation Base for Environmental Geology of Typical Mines in Shaanxi Province, Ministry of Natural Resources, Xi’an 710054, China
*
Authors to whom correspondence should be addressed.
Minerals 2023, 13(9), 1207; https://doi.org/10.3390/min13091207
Submission received: 22 August 2023 / Revised: 8 September 2023 / Accepted: 12 September 2023 / Published: 13 September 2023
(This article belongs to the Special Issue Environmental Impact of Mining: Soil and Water Contamination)

Abstract

:
In order to study the impact of molybdenum ore development in a large molybdenum mining area in the Xiaoqinling Mountains on the water and sediment quality of the Wenyu stream, surface water, sediment, and surrounding rock samples were collected, and the Cd and Zn contents were analyzed. The pollution status and ecological risk degree of river water and sediment samples in the Wenyu stream watershed were evaluated using the single element pollution index method, geoaccumulation index method, Hakanson potential ecological risk assessment method, potentially toxic elements (PTEs) health risk assessment, and PTEs pollution comprehensive index method. Finally, the impact of mining development on the contents of Cd and Zn in the Wenyu stream were discussed, and the sources of pollution were identified. The study revealed that the levels of Cd and Zn in 23 water samples collected from the primary channel of the Wenyu stream were markedly higher compared to the unaffected contrast area. Similarly, the concentrations of Cd and Zn in the 17 sediment samples were significantly elevated compared to the average values in the reference area. These findings indicated that The Wenyu stream was heavily impacted by the molybdenum mining activities, resulting in a high ecological risk associated with the sediment in the primary channel. Acid mine drainage in the mining area, sediment release activities, and atmospheric dust fall are considered to be the main sources of PTEs polluting the Wenyu stream watershed. Relevant personnel should complete a thorough river water quality investigation and perform ecological environment restoration so as to ensure sustainable economic development.

1. Introduction

China’s demand for mineral resources is growing, and the contradiction between supply and demand is worsening. Unreasonable and unscientific development of mining resources has also introduced a series of environmental degradation problems to the local water and soil environment, such as vegetation damage, soil loss, groundwater level decline, river and sediment pollution, and excessive PTEs in crops [1,2,3,4]. The problems of PTEs in river water and sediments have been focused on by many environmental studies because they involve the lives of coastal residents and concern crop irrigation and food safety [3]. Studies have shown that contamination with Cd, Zn, Mn, and Ni in river sediment was serious, and Cd and Cu were the main risk factors [4,5]. In addition, by analyzing the PTEs such as Cu, Zn and As in the smelting waste dump distributed in the alunite mining area near the Lujiang River, the degree of pollution of the Lujiang River watershed caused by human activities was evaluated. The study findings revealed that Cd and As were the primary pollutants identified [5]. Another research effort focused on analyzing the levels of PTEs in river and sediment samples collected from three different types of rivers within the Xiaoqinling area. Results indicated that four rivers in mining regions exceeded the national standard limit, with seven PTEs in the river surpassing the national water quality limit [6]. Hengshi River, located in South China and heavily impacted by polymetallic mining, was studied extensively. Researchers divided the water system of the Dabaoshan Mining Area into a kilometer grid, collected and analyzed 60 water samples, and examined the distribution characteristics of PTEs such as Cd, Co, Zn, and others in the mining area [7]. In investigating the impact of acid mine drainage from the Dabaoshan Polymetallic Mine in the mountainous region of northern Guangdong on Hengshi River, previous research analyzed the spatial distribution of concentrations of PTEs, namely Mn, Cu, Zn, As, Cd, and Pb, and found that the discharged wastewater from the Dabaoshan mining area was the primary cause of severe river pollution [8]. Additionally, other researchers examined the migration and transformation of toxic elements at the source of the Dabaoshan mining area, focusing on Cd, Zn, Cr and Ni in samples such as soil, tailings, and plants [8]. The analysis showed that the main pollution sources in this area were pit soil, tailings, and waste rock dumps, and it was necessary to focus on the exposure path of inhaled soil particles [9]. Predecessors have extensively analyzed the mining area environment, surrounding rivers, and sediment samples distributed nationwide, which has provided strong data support for preventing and controlling river pollution in various regions [10]. However, this study found that the current research idea of PTEs in the rivers in the mining area is only limited to the use of sediment to speculate on the pollution of river water [7,8,9]. We can still help broaden the comprehensive pollution analysis of the whole area by only testing the river and supplementing the analysis of PTEs in surrounding rock and water sediment.
Cadmium (Cd) is known for its high toxicity, slow degradation, and tendency to accumulate, posing a threat to human health [11]. Mining, mineral processing, and smelting processes can easily cause the entry of Cd into soil, rivers, vegetation, and other ecological environments. The presence of Cd heavy metal elements not only harms the environmental quality but also threatens people’s health via the food chain [12]. The global electrolytic industry began to develop and grow in 1920, so the annual output of Cd increased year by year, followed by various environmental pollution problems [13]. The most famous public hazard of the carcinogen Cd is the “bone pain disease” event in the Shentongchuan watershed, Fuchuan County, Japan [14,15].
Zinc (Zn) is an important element in the human body, and its content in the human body is second only to that of iron. However, many experiments and studies have proven that excessive zinc in the human body will cause more harm than good to health [16]. When zinc is about 5–10 times higher than the necessary intake of the human body, it leads to abdominal pain, nausea, and other symptoms; long-term accumulation in the human body leads to copper deficiency and even zinc poisoning [17]. Research has shown that in recent years, the mining activities of various types of mines in China have been frequent, and the cumulative effect of zinc in the soil caused by mining activities of mineral resources is becoming increasingly serious. When the supply of zinc in the soil is insufficient, the yield and quality of crops may be affected; at the same time, excessive accumulation of zinc due to mining activities may enrich elements in nearby vegetation, soil, rivers, and sediment and eventually spread through the food chain and affect people’s health [18].
Qinling is an important water source supply area in China, so its important position is self-evident. In the process of carrying out ecological and environmental protection, the problem of acid water and its pollution in mining areas caused by mining activities in southern Shaanxi is becoming increasingly serious. The central supervision team and the Shaanxi Provincial Party committee and government require all localities to carry out mine surveys and river management [19]. While developing the mining economy and heavy metal industry, the impact of developing a large molybdenum mine on the Wenyu stream and sediment in Luonan County was explored. By analyzing the content of Cd and Zn in the Wenyu stream, river sediment, and primary geological background, the pollution status of Cd and Zn was evaluated using the single element pollution exceeding multiple method. At the same time, the comprehensive risk level of water quality was evaluated using the health risk analysis method recommended by the USEPA. The pollution status of cadmium and zinc in sediment were studied using the geoaccumulation index, potential ecological risk, and heavy metal comprehensive pollution index, and the sources and pollution of PTEs in river water were discussed in order to give a reference for the development of the mining activities in the region and provide a scientific basis and data support for the prevention of PTEs pollution.

2. Materials and Methods
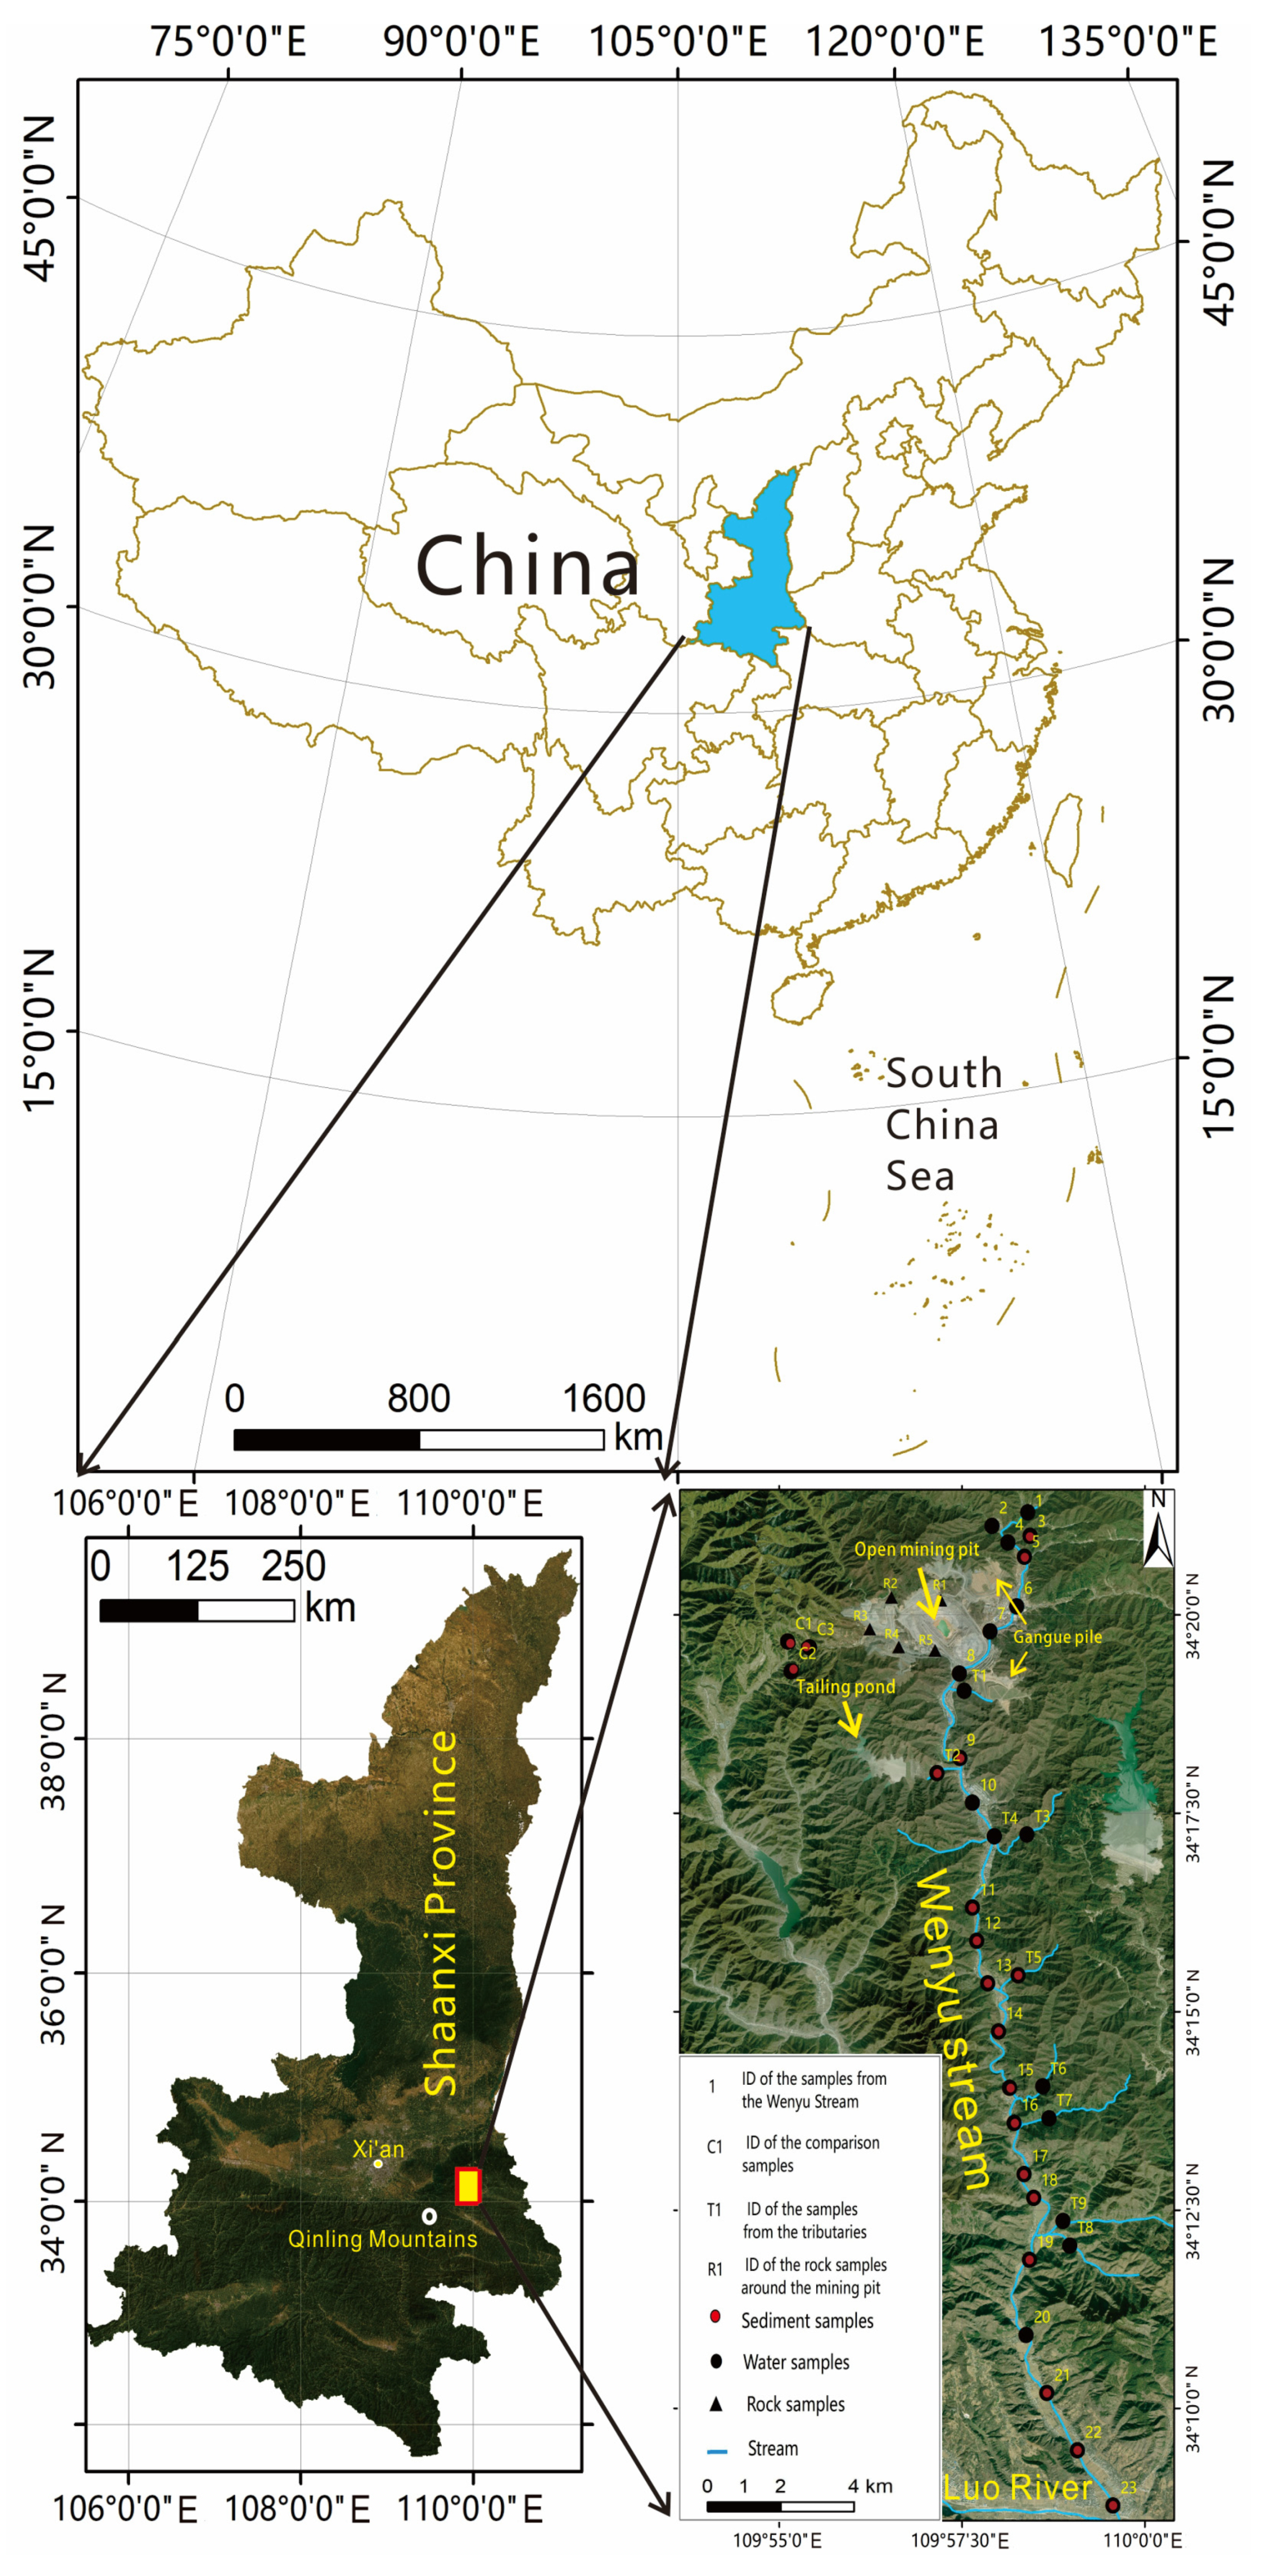
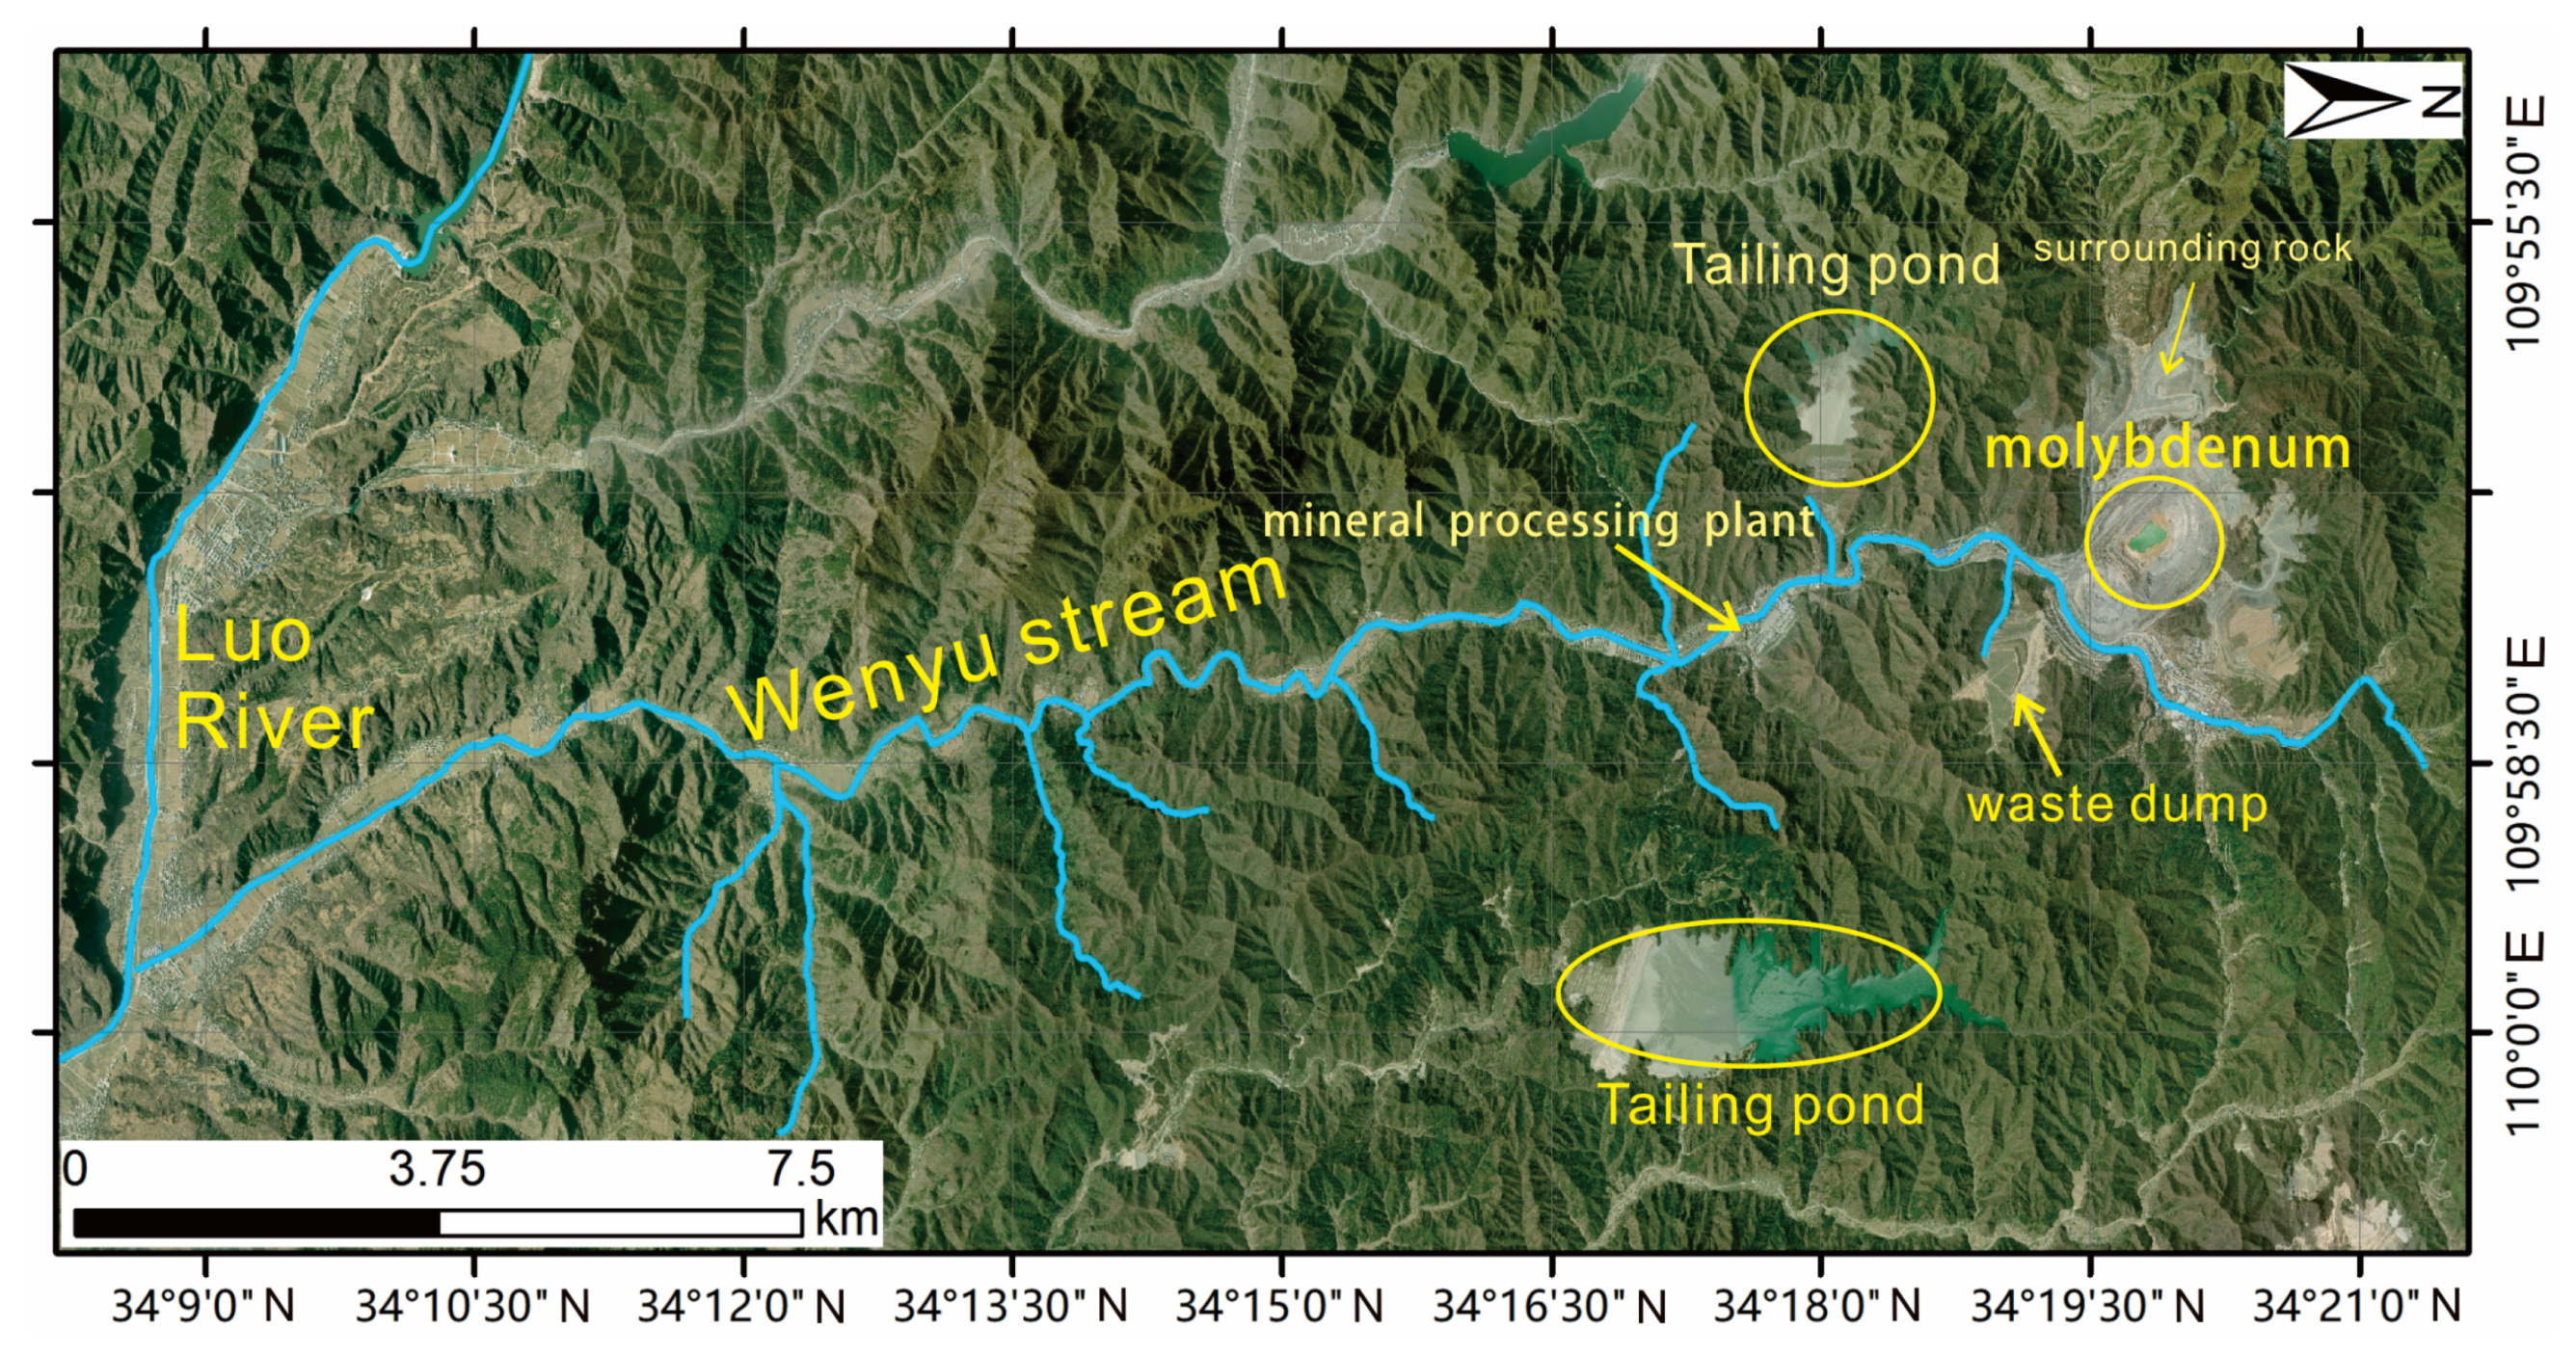
2.1. Study Area

The Wenyu stream originates from the southeastern slope of the Xiaoqinling Mountains, located approximately 5 km northwest of Jinduicheng in southeastern Shaanxi Province, China [20]. The Jinduicheng molybdenum deposit is situated in the southern margin of the North China Platform and the Qinling Orogenic Belt. This deposit belongs to a type of molybdenum deposit that is rich in veins in China. The crystalline basement in the area is composed of the Archean Taihua Group metamorphic rocks, mainly consisting of amphibolite-migmatite gneiss, mixed alteration biotite plagioclase schist, and mixed alteration Huanggang granite [20]. The Wenyu stream is composed of multiple streams, with a total length of approximately 33 km. The mining area is about 26 km away from the mainstem of the Luo River in Shangluo (Figure 1). The upstream valley of the Wenyu stream is narrow, with fast-flowing water and only a small amount of sand and gravel deposition at the riverbed. Some parts of the watershed have exposed bedrock, and there is less arable land. The middle and lower reaches of the river have a flat terrain, wider riverbeds, and slower water flow due to the inflow of tributaries from both sides. As a result, the riverbed accumulates more sand, gravel, and sediment. Large-scale open-pit molybdenum mines and ore processing plants are distributed near the upper reaches of the Wenyu stream watershed. Facilities related to mining, tailings ponds, and ore processing plants are concentrated on both sides of the watershed, with a length of approximately 7 km from north to south. The Wenyu stream region has a warm temperate climate with a moist monsoon climate on the southern edge. The mining area has an annual average temperature of 11.5 °C and an average annual rainfall of 770 mm, with most of the rainfall occurring from July to October. The prevailing winds are northwest winds and east winds, with an average annual wind speed of 1.5 m/s. The main metallic minerals in the area are molybdenite and pyrite, followed by magnetite and chalcopyrite [20]. The ore structure is mainly composed of skarn and porphyry structures [21]. Figure 2 shows a schematic analysis of the molybdenum mining area. The surrounding rock samples are mainly mineralized with pyrite and molybdenite. Pyrite is widely developed in the ore, with a content generally ranging from 1% to 5%. The main economically valuable mineral is molybdenite, with a content generally ranging from 0.06% to 0.40% [20,21].

2.2. Methods

2.2.1. Sample Collection

This paper found that mining activities in the Wenyu stream watershed may affect rivers, farmland, and living areas within about 26 km of Shangnan County. Therefore, the average distribution density of 1 sample/km from north to south was used to collect river water and sediment samples. Multiple surrounding rock samples, river samples, and sediment samples were collected at the beginning of the upstream area of the Wenyu stream. Through field work, 32 river samples and 17 sediment samples were collected (refer to Figure 1). To assess the influence of extensive molybdenum mining on the accumulation of PTEs in river water and sediment within watershed, as well as to determine the sources of pollutants, three water and sediment samples were collected from a mining-free area in the source region of the watershed (Figure 1, C1, C2, and C3). In addition, five surrounding rock samples were collected near the upstream mining area (Figure 1, R1–R5).

2.2.2. Sample Analysis

When collecting river samples in the main channel and direct flow channel of the Wenyu stream, the instantaneous sampling method was adopted [19]. A high-density polyethylene bottle was used to collect water samples from 32 water sample points in the Wenyu stream from the upper layer of the river. After collecting samples with a moistened collector, a 0.45 micron filter membrane was used to filter the water samples, and the water samples were acidified with 1% superior pure nitric acid to pH < 2 and sealed for testing. A small shovel collected the fine silt at the bottom of the Wenyu stream riverbed and put it into a sealed polyethylene bag. The pH value of surface water samples were measured on-site before being acidified, using the REX PHS-3C pH meter from Shanghai INESA Scientific Instrument Co., Ltd., Beijing, China. The pH meter had a measurement resolution of 0.01 pH and an accuracy of approximately ± 0.01 pH. The analysis of heavy metal elements in the river water samples was performed using an inductively coupled plasma mass spectrometer (ICP-MS) from Thermo Fisher Scientific Inc., Waltham, MA, USA. The determination of PTEs content in river water samples was mainly carried out using Thermal Fisher inductively coupled plasma atomic emission spectrometer (ICP-AES) (Thermo Fisher Scientific Inc., Waltham, MA, USA). The sediment sample was air-dried, ground with a mortar, and sieved through a 200 mesh sieve for analysis. The surrounding rock samples underwent a series of processing steps, including coarse crushing, medium crushing, shrinkage, and fine grinding to 200 mesh, to prepare them for analysis. The determination of rock samples was performed using an atomic fluence spectrometer (AFS-2202E) from Beijing Haiguang Instrument Co., Ltd., Beijing, China. The analysis of Cd in both sediment and surrounding rock samples was conducted by the Xi’an Geological Survey Center of China Geological Survey. All testing procedures were strictly carried out in accordance with the Technical Standards for Geological Survey of China Geological Survey (DD2005-03) [22]. The test procedures for sediment and surrounding rock samples are strictly in accordance with GB T 14353.4-2010 [23].

2.2.3. Single Element Pollution Index

The evaluation of the water quality of water samples adopted the single-element pollution index [24]. According to the functional zoning objectives of the Wenyu stream water body, it was designated as a first-class protected area for drinking water sources. Therefore, the water quality of the Wenyu stream must meet the Class II environmental quality standards for surface water [19]. Evaluation with the single element pollution index method was performed as follows:
P C i = C i C 0 / C 0
In the formula, pci is the single-element pollution index for a certain pollutant; C i represents the measured content of a certain pollutant (μg/L); C 0 represents the standard limits for Class II surface water quality (μg/L), the average content of surface water pollutants in the unaffected area (μg/L), the homogeneous content of sediment pollutants in the unaffected area (mg/kg), or the contrast standard for agricultural sludge (mg/kg). Among them, the agricultural sludge contrast standard for Cd is 20 mg/kg, and the agricultural sludge contrast standard for Zn is 1000 mg/kg. The multiples of a single element exceeding the standard can be shown in Table 1.

2.2.4. Geoaccumulation Index

Seventeen sediment samples from the Wenyu stream were analyzed using the geoaccumulation index. The geoaccumulation index was first developed by Mǜller in 1969 [9] and is a quantitative research method used to study the pollution degree of PTEs in water environment sediments. The formula is:
I g e o = log 2 C n k B n .
where Bn represents the geochemical background value of clay and other sediments; Cn represents the measured value of PTEs in sediments; k is a constant, taken as 1.5, which is used to analyze the change of background value caused by differences in sedimentary characteristics and rock geological characteristics in different regions. The geoaccumulation index is usually evaluated with seven levels, which indicate the scope of the pollution degree. Table 2 gives details.

2.2.5. Potential Ecological Risk Index

The potential ecological risk index was used to evaluate the ecological risk level of PTEs in the sediment. This method, initially introduced by Swedish scholar Hakanson in 1980, evaluates the pollution and ecological hazards caused by PTEs in sediment. In this molybdenum mining area, heavy metal pollution primarily occurs through river sediment, which serves as a pathway for PTEs pollutants to reach crops and, eventually, the human body. When sediment acts as a source of heavy metal pollution and is absorbed by crops, it can pose ecological risks to organisms [25]. In this study, the potential ecological hazard index of a single pollutant was mainly employed to evaluate the sediment samples collected from the Wenyu stream. The specific calculation formula is as follows:
E r i = T r i × E s i C n i .
where E r i indicates the potential ecological hazard index of single pollutant; T r i indicates the toxicity response coefficient of a heavy metal element; E s i is the measured mass fraction of sediment sample; C n i refers to the background reference value of sediment samples. According to previous research results, the toxicity response coefficient T r i of Cd and Zn is 30 and 1, respectively. The background reference value C n i is the average content of sediment samples in the unaffected area, i.e., 0.74 mg/kg (Cd) and 187.333 mg/kg (Zn). The relationship between the potential ecological risk index and the degree of ecological risk is shown in Table 3.

2.2.6. USEPA Water Health Risk Assessment

The health risk assessment of surface water used the model recommended by USEPA to calculate the health risks caused by chemical non-carcinogenic heavy metal elements via skin and drinking water intake [26]. In this study, the health risk assessment model for non-carcinogens is calculated as follows:
R i s k f = 2 × 10 3 × k × C i × 6 × τ × T E π × A × F E × E F × E D × 10 6 W × A T × f × R f D i × 70.6 .
R i s k n = W D U × C i × 10 6 W × R f D i × 70.6 .
where R i s k f indicates the health risk index caused by skin contact with non-carcinogens, and R i s k n indicates the health risk index of non-carcinogens caused by drinking water. The number 70.6 represents the life expectancy, and the unit is a. Table 4 shows the detailed formula analysis.
The calculation method of health risk assessment model for carcinogens [26] is as follows:
R i s k i c = [ 1 e x p ( D i × Q i ) ] / A g e
D i = 2.2 × C i / 70
where D i refers to the daily average exposure dose per unit body weight of chemical carcinogens through drinking water, the unit is mg/(kg·d); 2.2 is the recommended average daily drinking water for adults, the unit is L;   C i is the mass concentration of chemical carcinogen, the unit is mg/L; 70 refers to the average weight of a person; the unit is kg; age is the average life span of human beings, the value is 70, and the unit is a; Q i refers to the carcinogenic coefficient of chemical carcinogen I through drinking water containing chemical carcinogen i—the study shows that the chemical carcinogen intensity coefficient of Cd and Cd is 6.1, and the unit is mg/(kg·d).
In the water environment health risk model, the health risks generated in different ways can be calculated by superposition, so the total health risk (Risk) of Cd and Zn in the water body of the Wenyu stream watershed on human body is R i s k f + R i s k n + R i s k i c . The maximum acceptable risk level specified by the Swedish Environmental Protection Agency is 1 × 10 6 a 1 , the maximum acceptable risk level specified by the Netherlands Ministry of Construction and Environmental Protection and the Royal Society of England is 1 × 10 4 a 1 , the maximum acceptable risk level specified by USEPA is 1 × 10 4 a 1 , and the maximum acceptable value of the National Radiation Protection Commission is 0.5 × 10 4 a 1 .
The pollution index method [27] is used to evaluate the pollution degree of PTEs in river sediment, and the comprehensive pollution index P is used to express the comprehensive pollution degree of pollutants to the sediment, and the specific formula is as follows:
P = ( 1 n ) i = 1 n P i 2 .
where P i = C i / C 0 , P i refers to the pollution index;   C i indicates the mass concentration of element i in sediment; C 0 indicates the concentration of element i in the background sediment; P refers to the comprehensive pollution degree of pollutants in the sediment. Table 5 lists the corresponding relationship between the comprehensive index of PTEs pollution in the sediment and the pollution degree.

3. Results

3.1. Results of the Samples in the Wenyu Stream

The water quality data and sediment data measured in the Wenyu stream watershed in this paper are shown in Table 6 and Table 7.

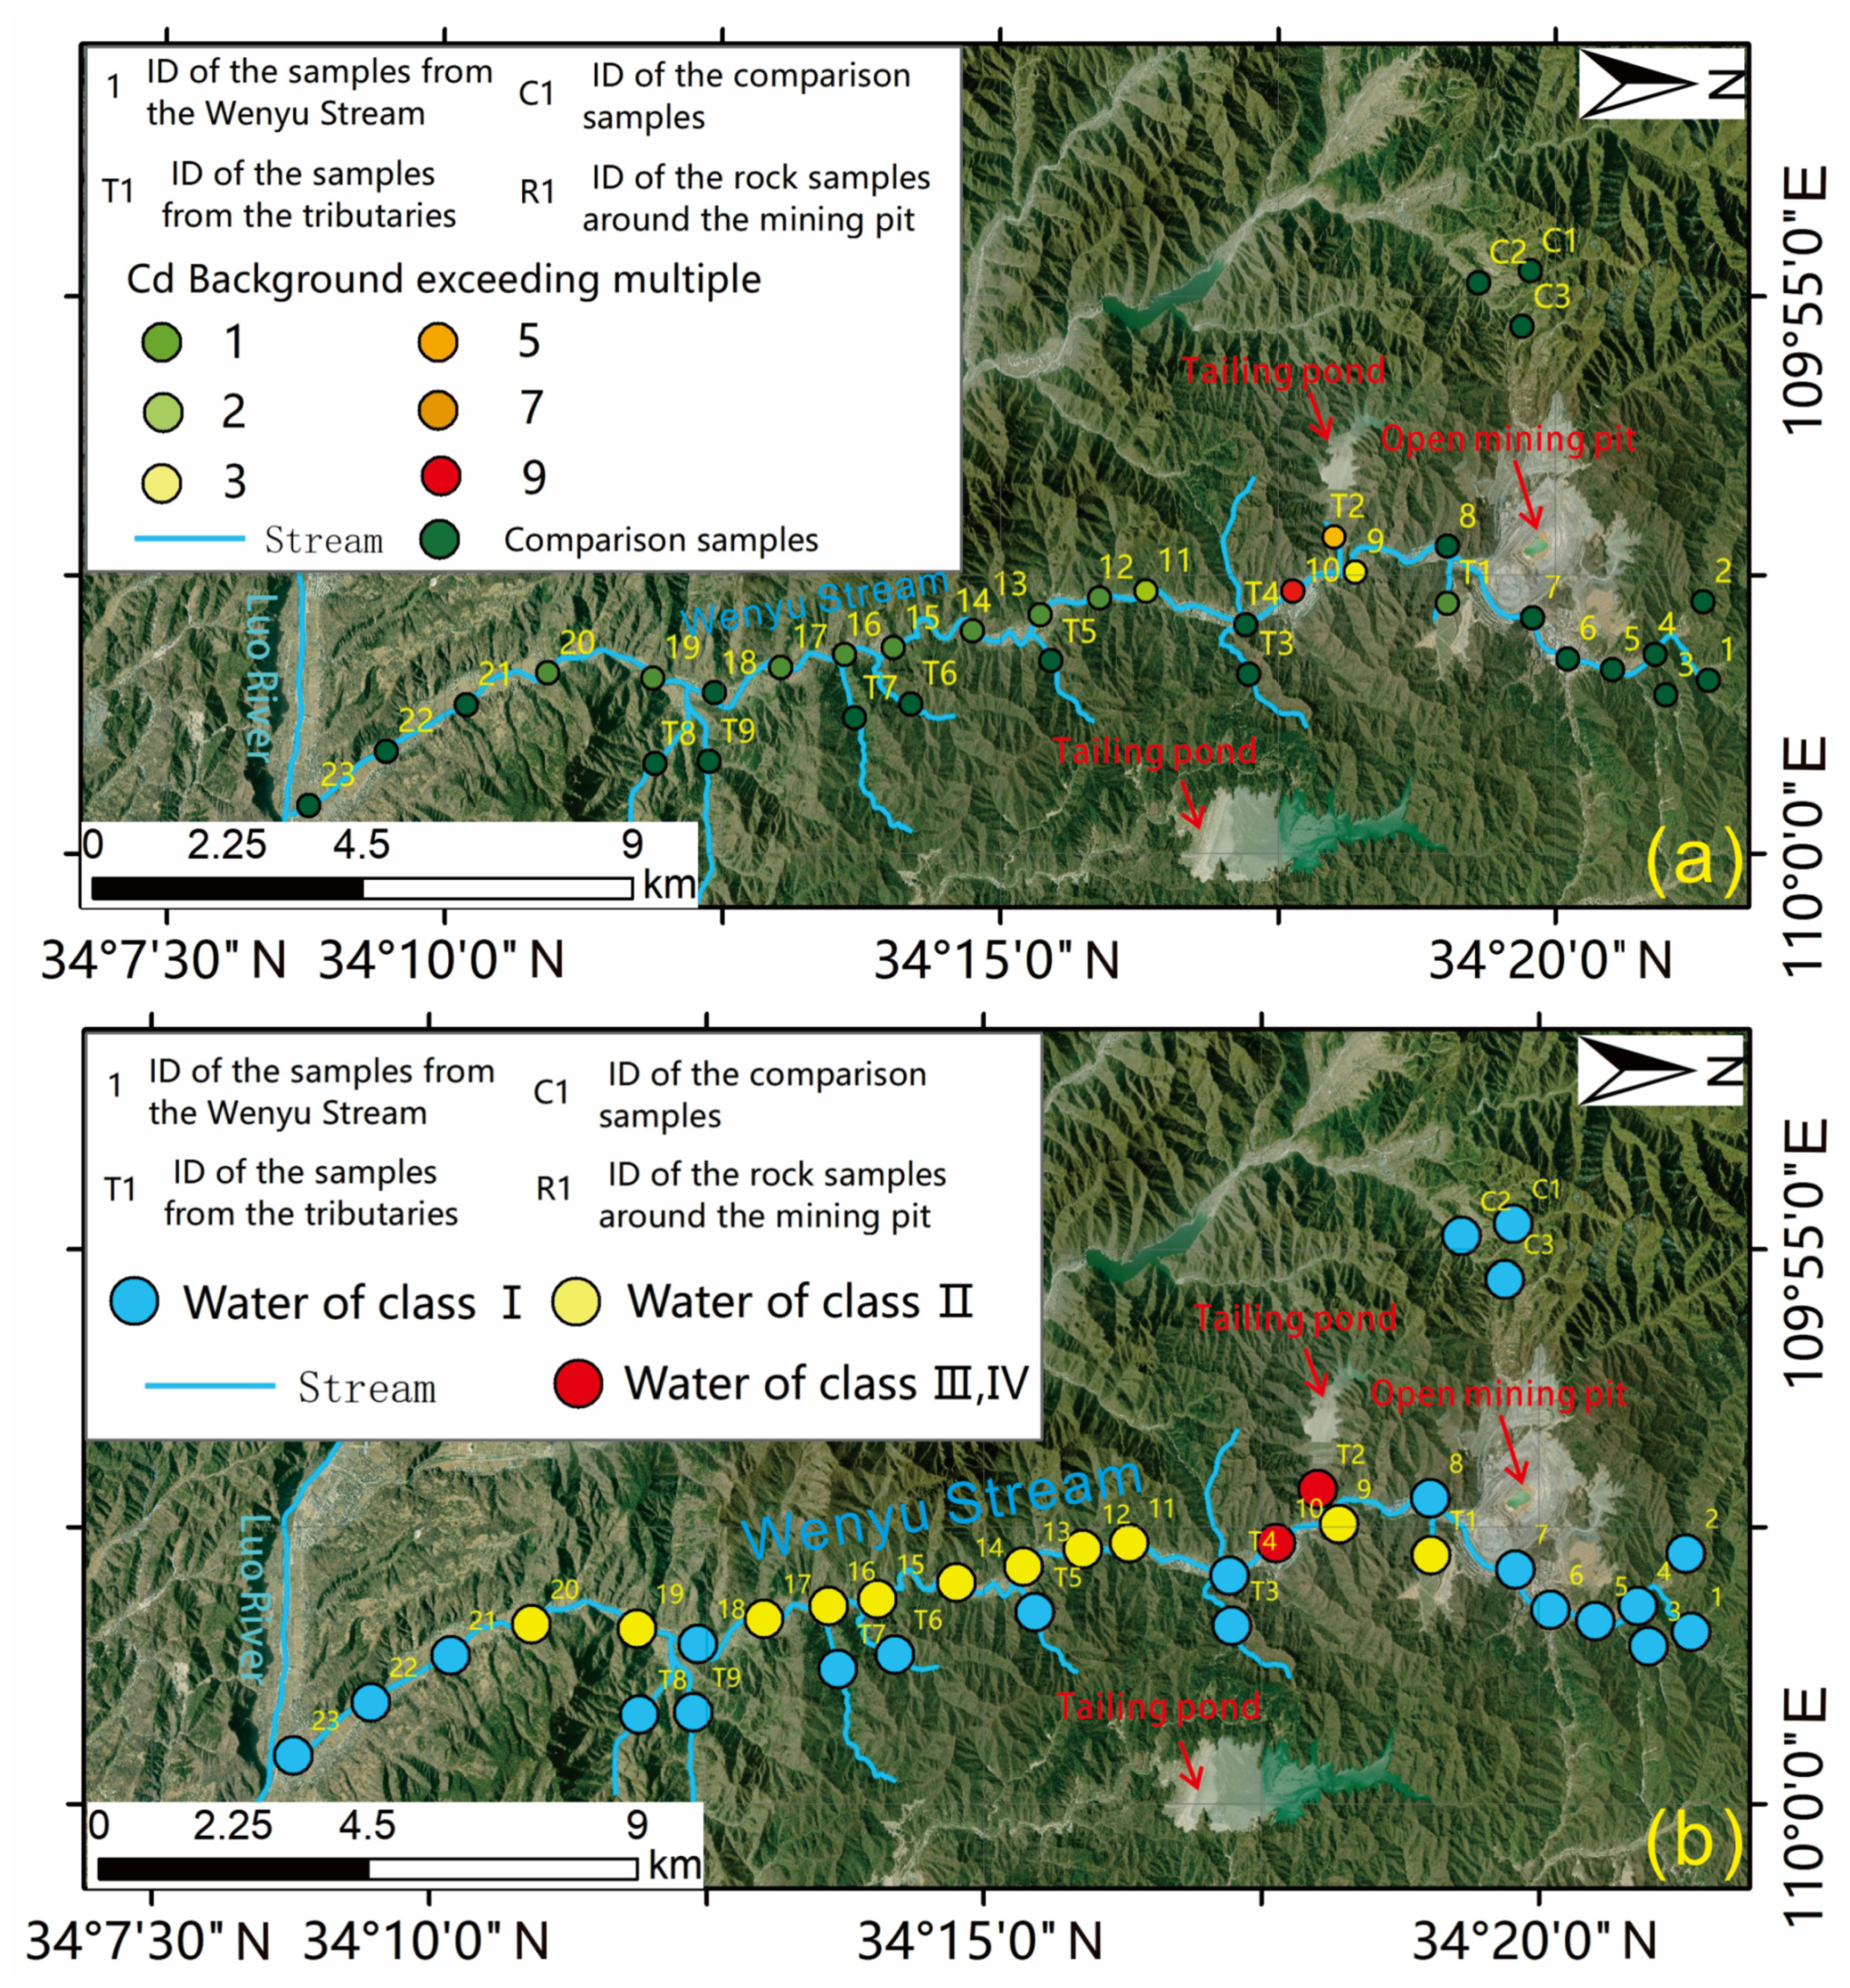
3.2. Excessive Cd Content in the Wenyu Stream

The distribution of Cd content in 35 river samples from the Wenyu stream watershed and the unaffected area are shown in Figure 3. Among the 23 sampling points in the main channel of the stream, Cd content in the river water exceeded that of the contrast area (background area) unaffected by mineral development activities at 11 points. The average Cd content in the main channel of the Wenyu stream was twice as high as that of the unaffected area, and the maximum value was nine times higher. This indicates a significant cumulative effect of Cd heavy metal in the Wenyu stream watershed resulting from mining activities. In the tributary stream, seven of the nine water sample points did not exceed the Cd content of each point in the contrast area. Only T1 and T2 sampling points exceeded the average Cd content of the unaffected area by two and five times, respectively. Furthermore, the variability analysis of the integrated statistical data showed a coefficient of variation of 99.44% for Cd content. The Cd content at each point, from upstream to downstream, exhibited a skewed distribution, suggesting a significant influence of human activities on the Cd heavy metal content in the Wenyu stream watershed, as summarized in Table 8.
Referring to the standard value of Cd (5 μg/L) for class II water in the environmental quality standards for surface water (GB3838-2002), it can be observed that among the 23 sampling points in the main channel of the Wenyu stream, 22 points meet the standards for class I and class II water in surface water, accounting for 95.65% compliance. This indicates that the overall water quality of the Wenyu stream meets the domestic water standard for residents and is considered good. Out of these points, 12 are classified as class I water, accounting for 52.17% of the total, specifically points 1, 2, 3, 4, 5, 6, 7, 8, 18, 21, 22, and 23 in Figure 3b. Additionally, 43.48% of the points are classified as class II water, namely points 9, 11, 12, 13, 14, 15, 16, 17, 19, and 20 in Figure 3b. Only one point, point 10 in Figure 3b, does not meet the class II water standard, accounting for 6.25% of the total points. In the tributary stream, out of the nine sampling points, seven are classified as class I water, specifically T3, T4, T5, T6, T7, T8, and T9. Sampling point T1 is classified as class II water, while sampling point T2 is classified as class III and IV water. According to Figure 3, the Cd pollution at midpoints 9 and 10 in the main channel of the Wenyu stream exceeds the standard by three and nine times, indicating moderate and severe pollution, respectively. The remaining water samples generally meet the class II standard for surface water. In the tributary channel, T1 and T2 exhibit light and heavy pollution levels, respectively. This analysis suggests that the proximity of these points to the mineral processing and production area, as well as their proximity (2.0–3.0 km) to mining pits, waste dumps, and other mining activity sites, contribute to their abnormal Cd content. Additionally, there is a large tailings pond located approximately 1 km upstream in the west bank branch channel, which likely contributes to the wastewater seepage affecting the Cd content at T2.

3.3. Excessive Zn Content in the Wenyu Stream

The statistical findings of the zinc content in 35 river samples collected from both the Wenyu stream watershed and the unaffected area are depicted in Figure 4. From Figure 4a, it can be observed that among the 23 sampling points in the main stream, the zinc content in the river water at 13 points is not greatly higher than that in the unaffected area, which is unaffected by mineral development activities. However, the Zn concentration in the river water below a tailings pond is approximately 80 times greater than the average value of the contrast area. Additionally, the Zn concentration within a specific watershed exhibits significant variation with the flow, as depicted in Figure 3a at points 10–17. This indicates a significant cumulative effect of Zn heavy metal in the Wenyu stream watershed resulting from mining activities. Among the nine water sample points in the tributary stream, seven points do not exceed the Zn content value of each point in the contrast area. However, sampling points T1, T2, and T4 exceed the average Zn content of the unaffected area by 10, 80, and 3 times, respectively. According to the analysis, the leakage of tailings pond wastewater upstream of T2 may contribute to the abnormal Zn content.
Referring to the standard value of Zn (1000 μg/L) in class II water in environmental quality standards for surface water (GB3838-2002), it can be seen that among the 23 sampling points in the main ditch of the Wenyu stream, 22 Cd contents meet the class I water standard of surface water, accounting for 95.65%. Therefore, it can be judged that the overall water quality of the Wenyu stream meets the domestic water standard in terms of Zn content, as shown in Figure 4b. The water quality of eight water samples from nine sampling points in the Wenyu stream branch ditch is class I water, including T1, T3, T4, T5, T6, T7, T8, and T9. Sampling point T2 is class II and III water.

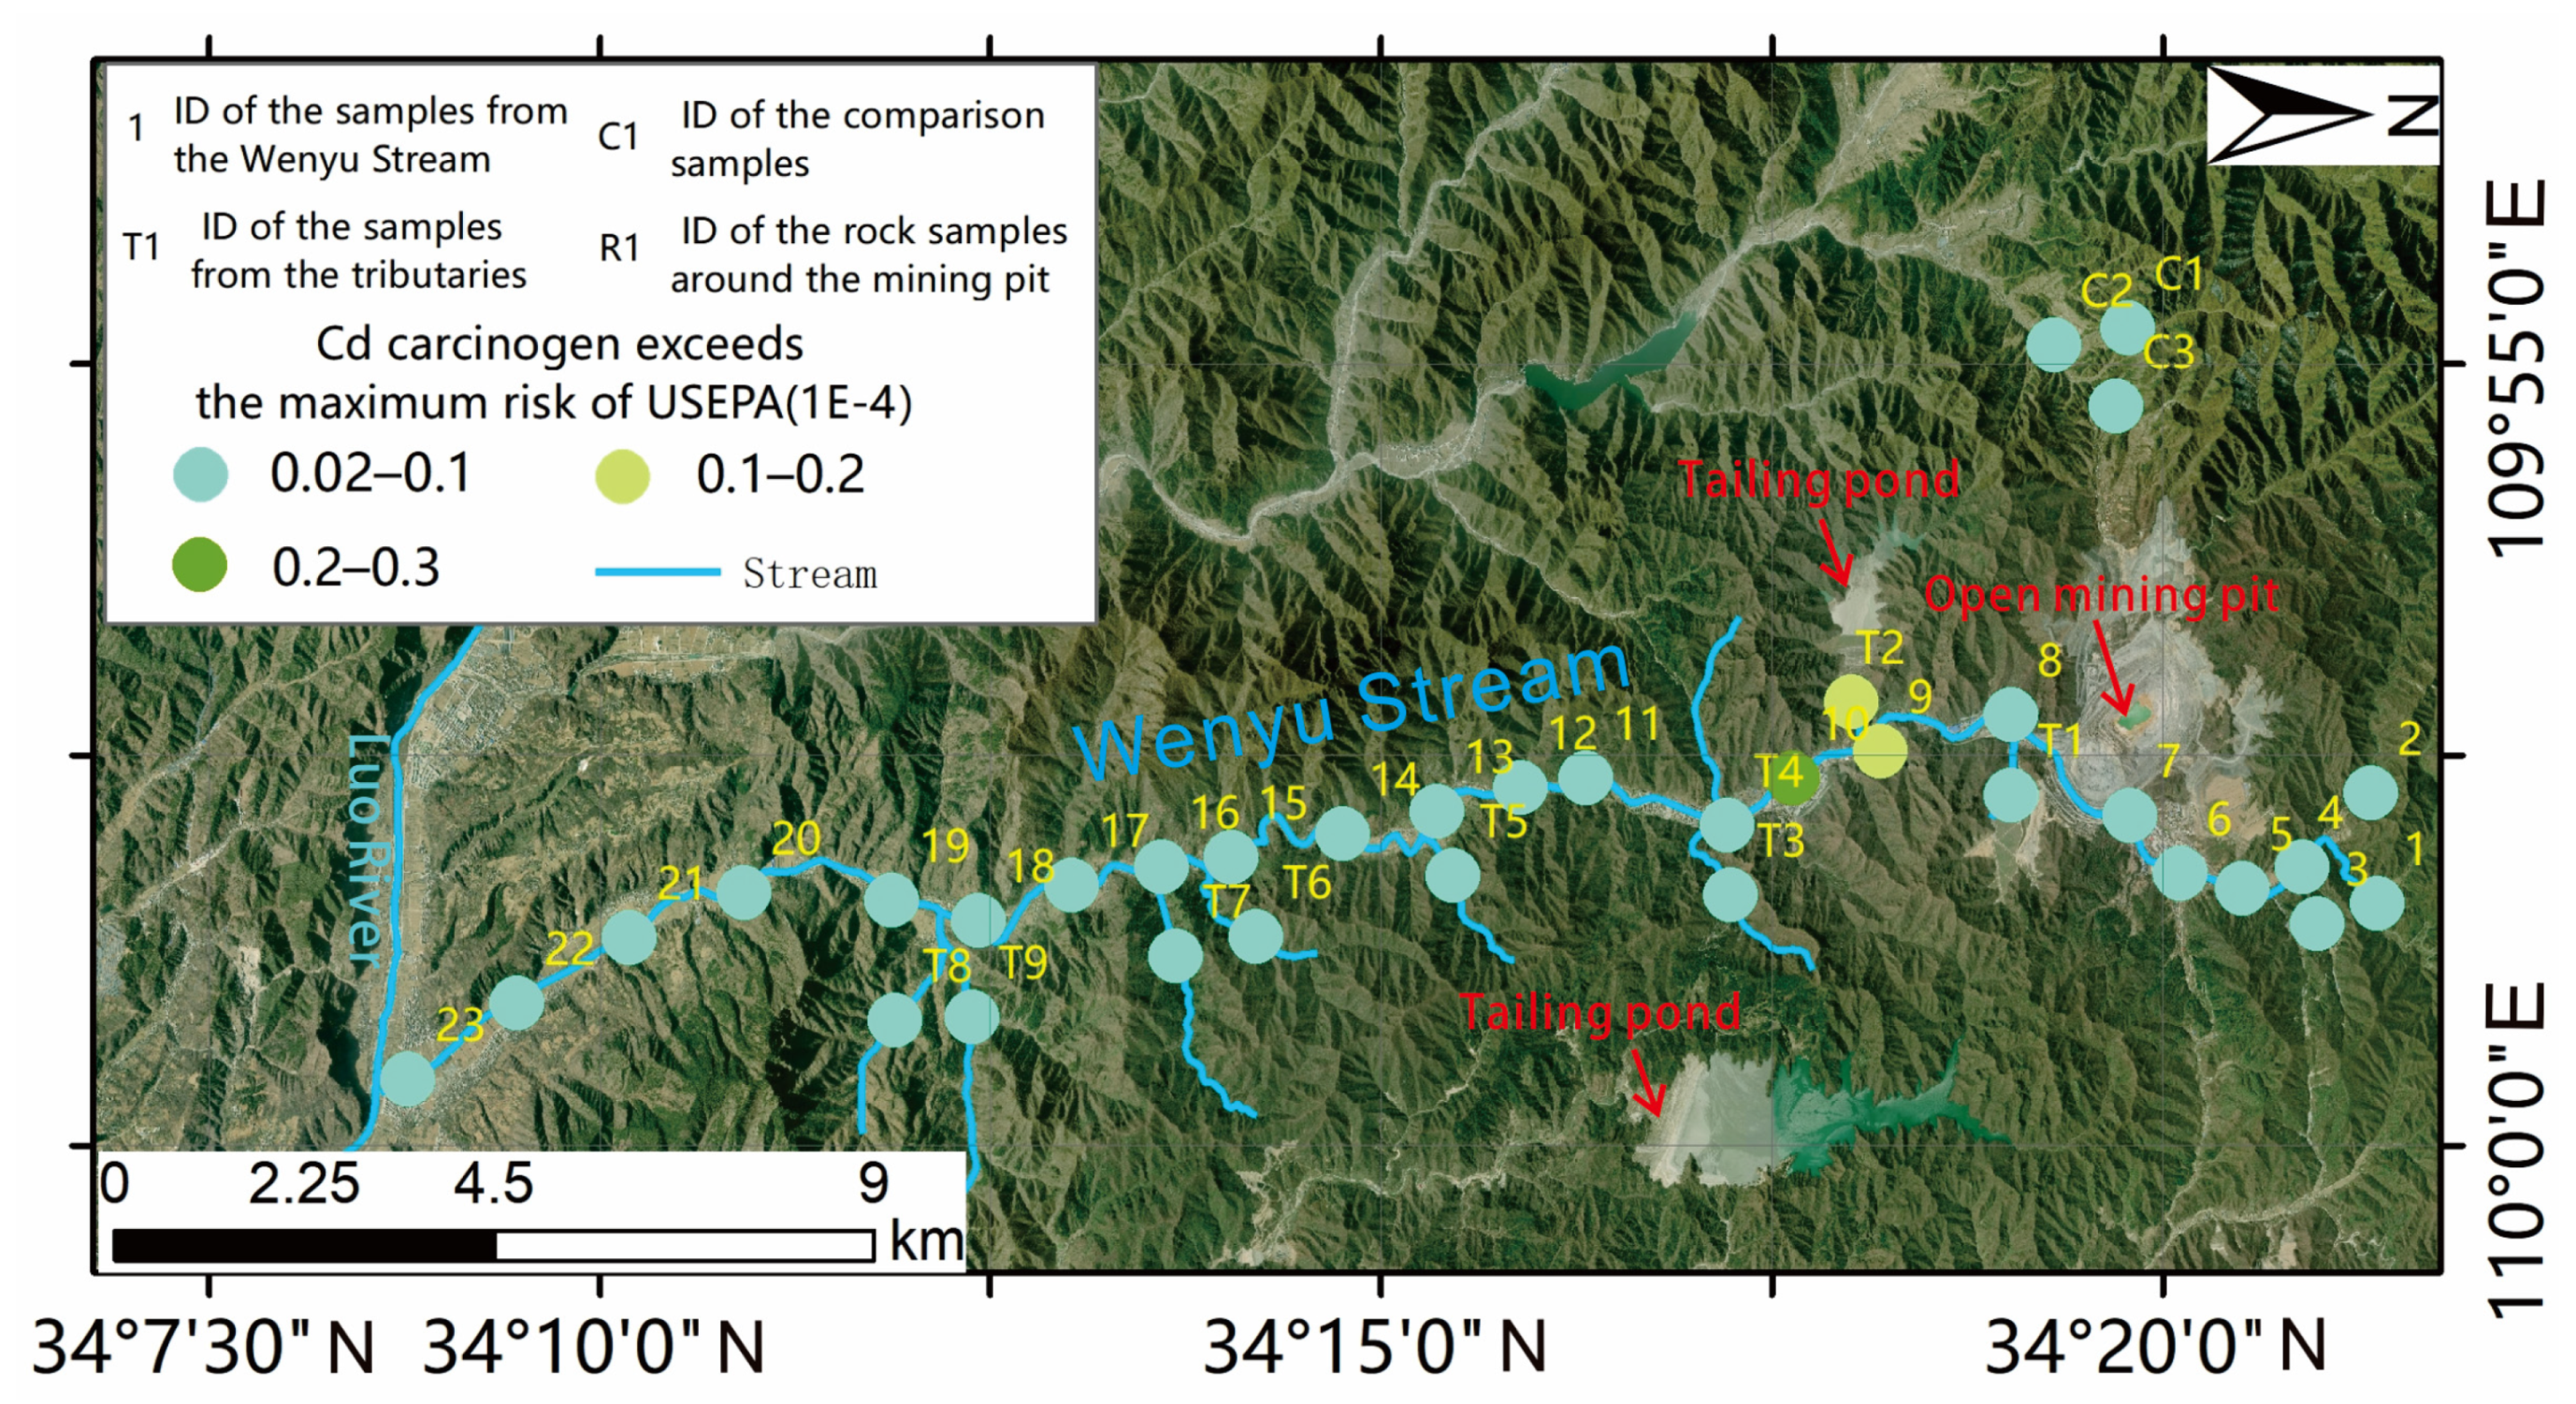
3.4. Evaluation of Cd Carcinogens

We can analyze the health risk of Cd carcinogen on the human body via the river route in Figure 5. It can be seen that essentially all points in the main stream channel were in the range of 0.02 × 10 4 –0.1 × 10 4 , but points 9 and 10 were in the range of 0.1 × 10 4 –0.3 × 10 4 a 1 , which was close to the maximum acceptable value of the National Radiation Protection Commission ( 0.5 × 10 4 a 1 ). In the main stream channel of the Wenyu stream, only point T2 was between 0.1 × 10 4 –0.2 × 10 4 a 1 , and the other points met the limits specified by the National Radiation Protection Commission [28] (1 × 10 4 a 1 ).

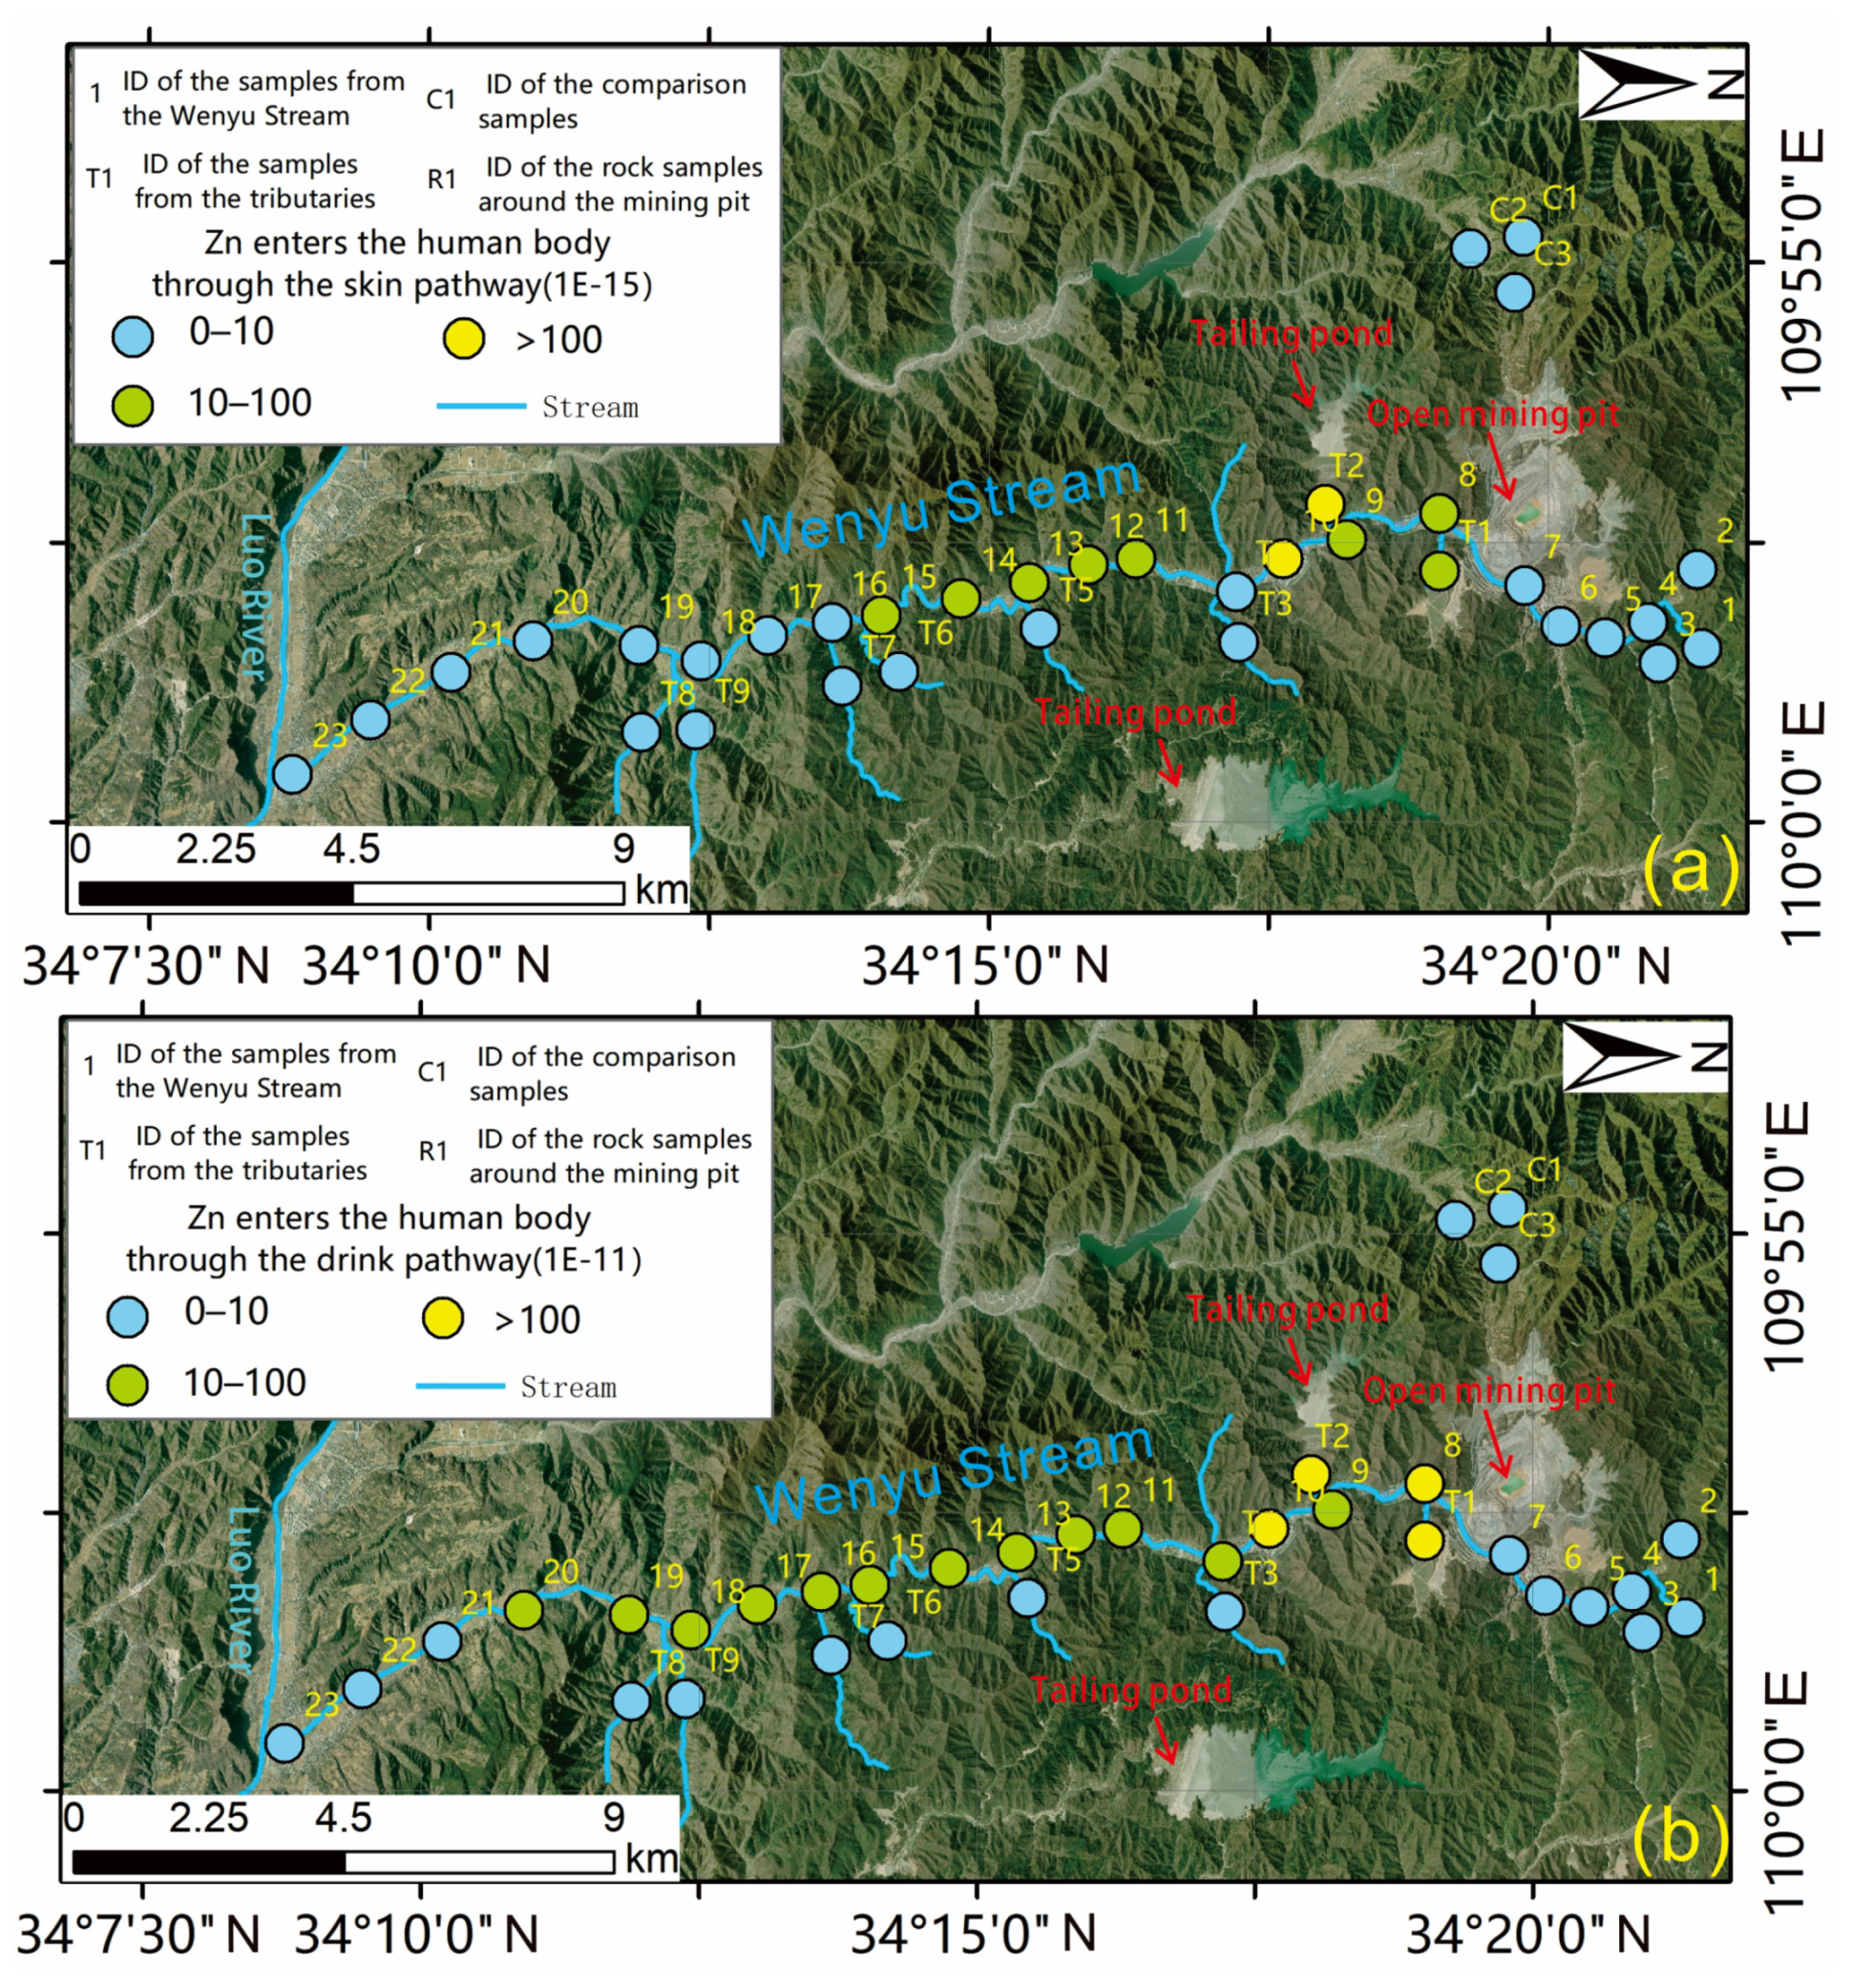
3.5. Health Risk Assessment of Zn through Skin and Drinking Water

The results of Zn health risk assessment are shown in Figure 6a,b. At points 11–16 in the main ditch of the Wenyu stream, the health risks caused by Zn absorbed through drinking water and skin are high. The health risks caused by skin contact with Zn were mainly distributed in points 8–16, with an average distribution in the range of 10 × 10 15 –100 × 10 15 ; the health risks caused by Zn drinking water were mainly distributed in points 8–20. The health risk of Zn caused by drinking water was four orders of magnitude higher than that caused by skin contact, so the total health risk of non-carcinogen Zn was determined by the health risk caused by drinking water. The risk caused by Zn in Wenyu stream water was far lower than the maximum acceptable value ( 1 × 10 4 a 1 ) [29] recommended by the USEPA and the maximum acceptable value ( 5 × 10 5 a 1 ) [27] recommended by the National Radiation Protection Commission (ICRP), which indicated that the health risk caused by Zn in Wenyu stream water was generally at a safe level, but it was necessary to strengthen the monitoring and management of areas with a high Zn concentration.

3.6. Comprehensive Risk Assessment and Analysis

The comprehensive risk assessment of water environmental health in the Wenyu stream is a collection of risks caused by chemical carcinogens and non-carcinogens [27]; by analyzing the comprehensive health risks caused by non-carcinogen Zn absorption through the skin and drinking water, as well as carcinogen Cd, we can reflect the impact of the development of this large molybdenum mine on the surrounding water environment and analyze the potential risks to human health, animals, and plants, as shown in Figure 7.
The health risk of non-carcinogens was much lower than that of chemical carcinogens, with a difference of about 7 to 11 orders of magnitude. Therefore, the change trend of the overall risk was roughly similar to that of carcinogens. It can be seen in Figure 6 that the comprehensive risk of points 9, 10, and T2 in the main and branch ditches of the Wenyu stream was relatively high, but it was also slightly lower than the limit value specified by the National Radiation Protection Commission and the maximum acceptable risk level specified by the USEPA (1 × 10 4 a 1 ).

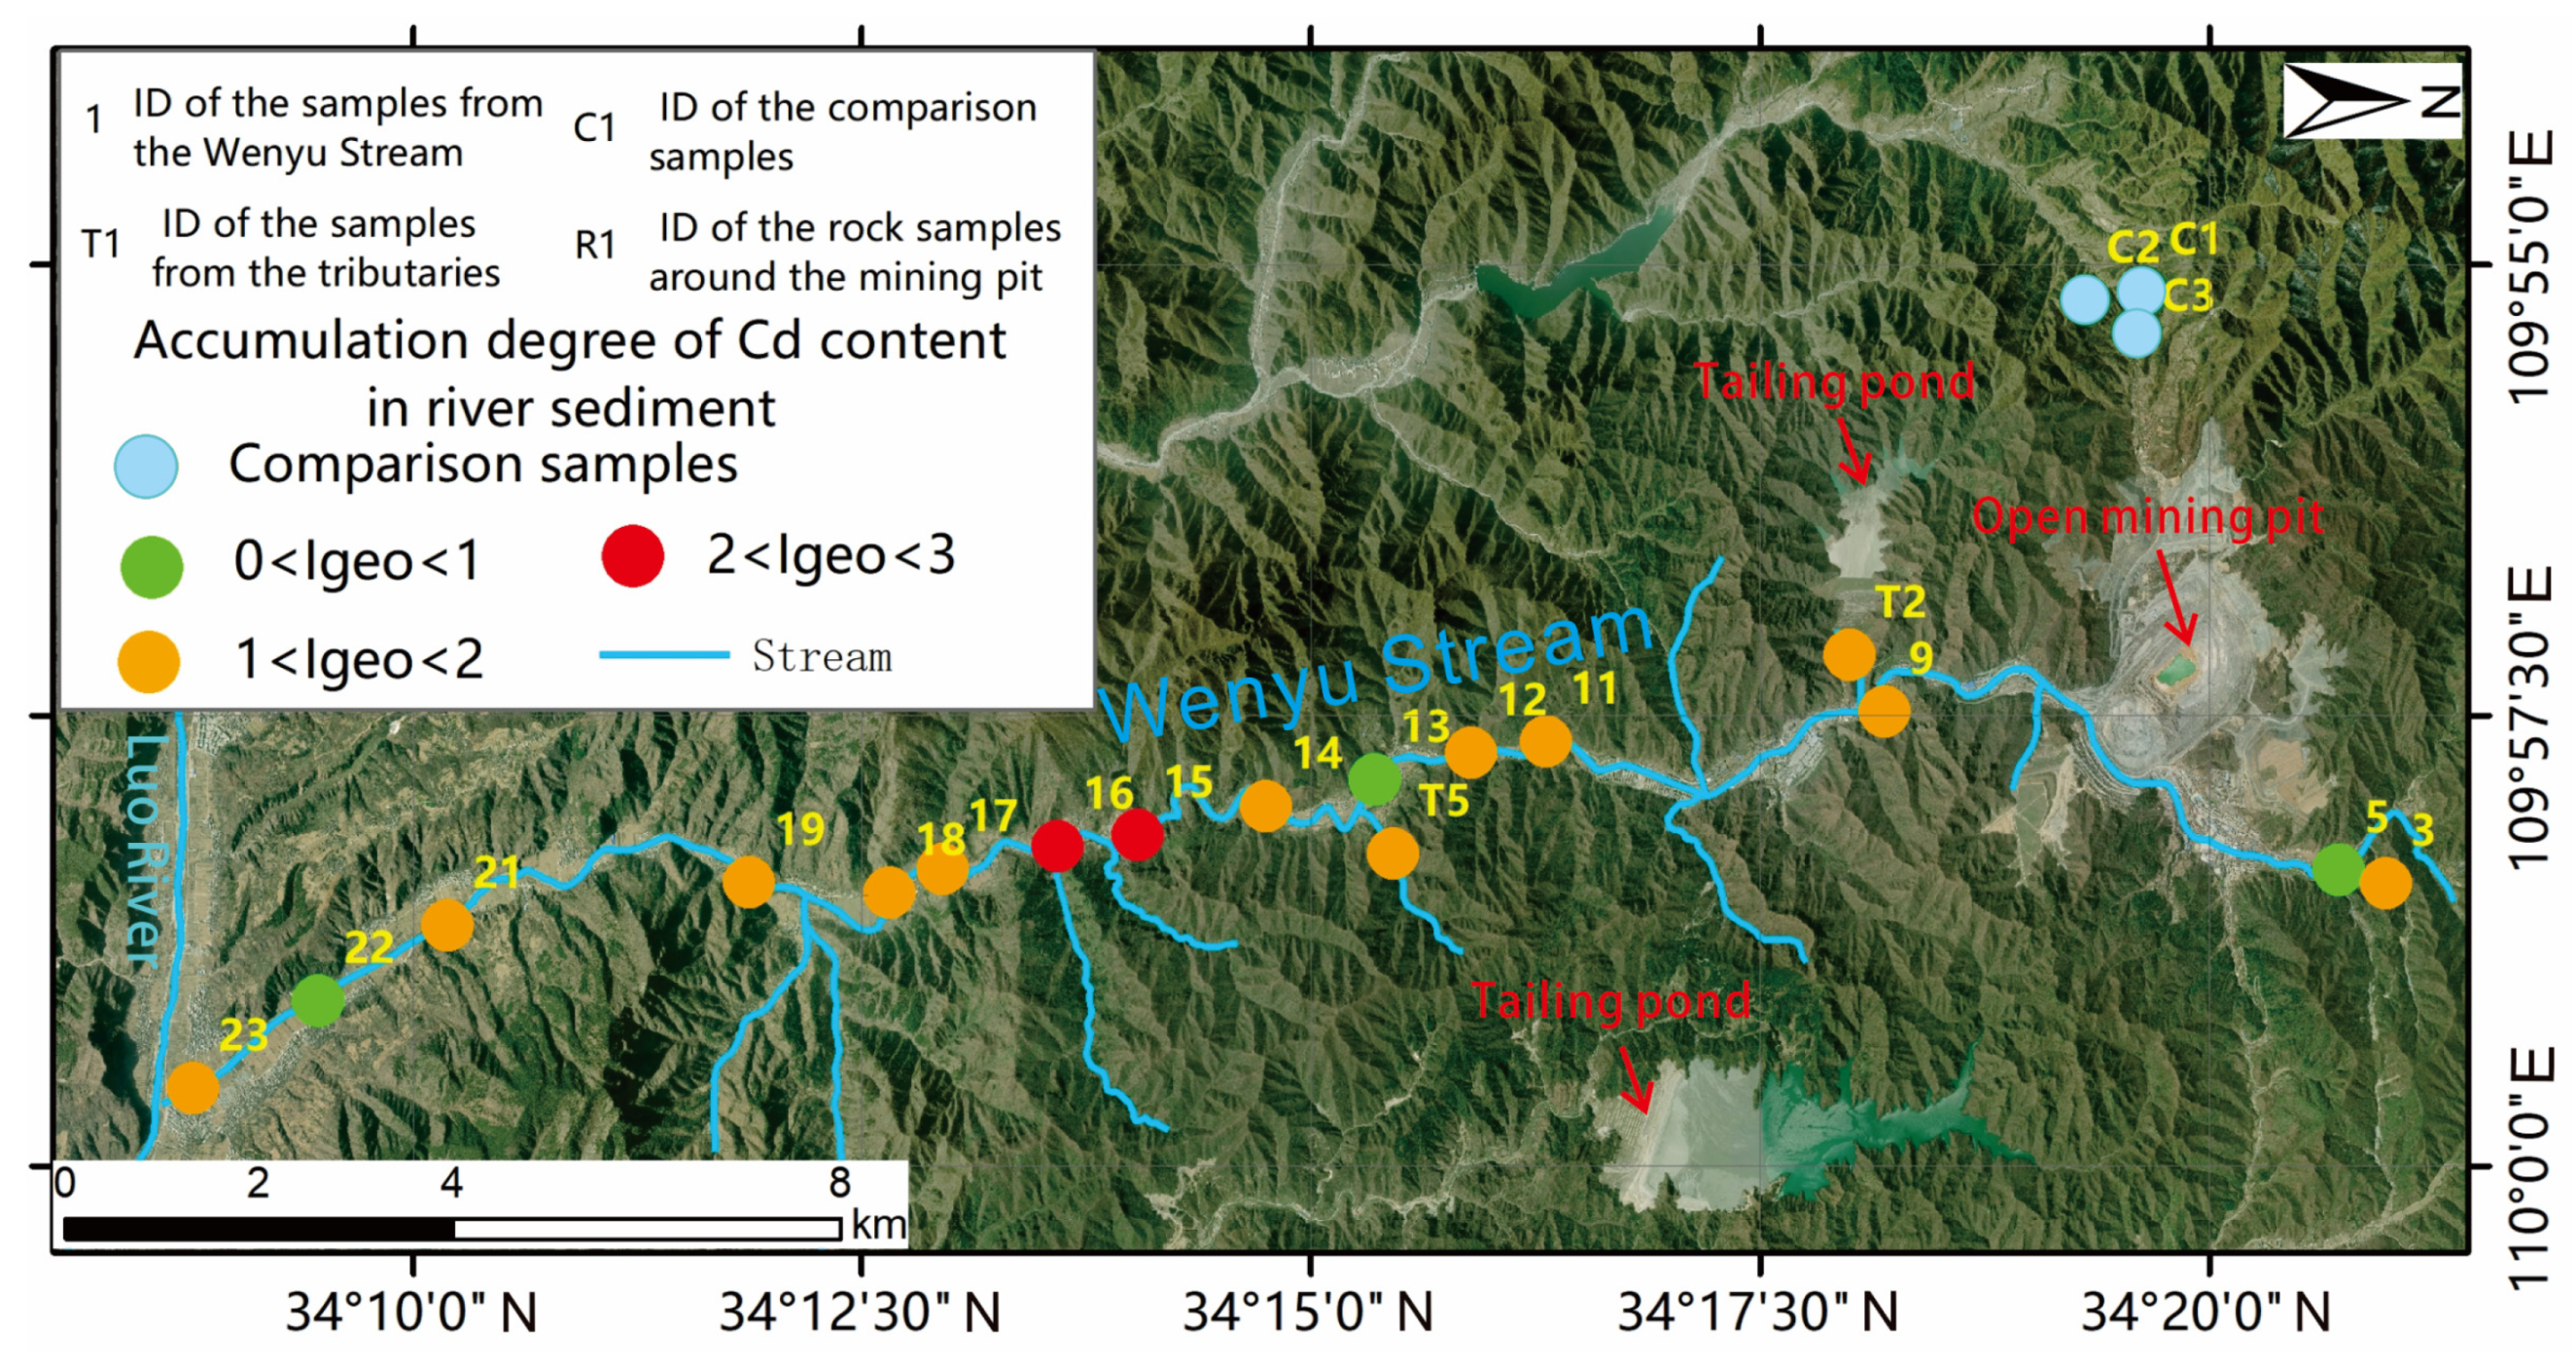
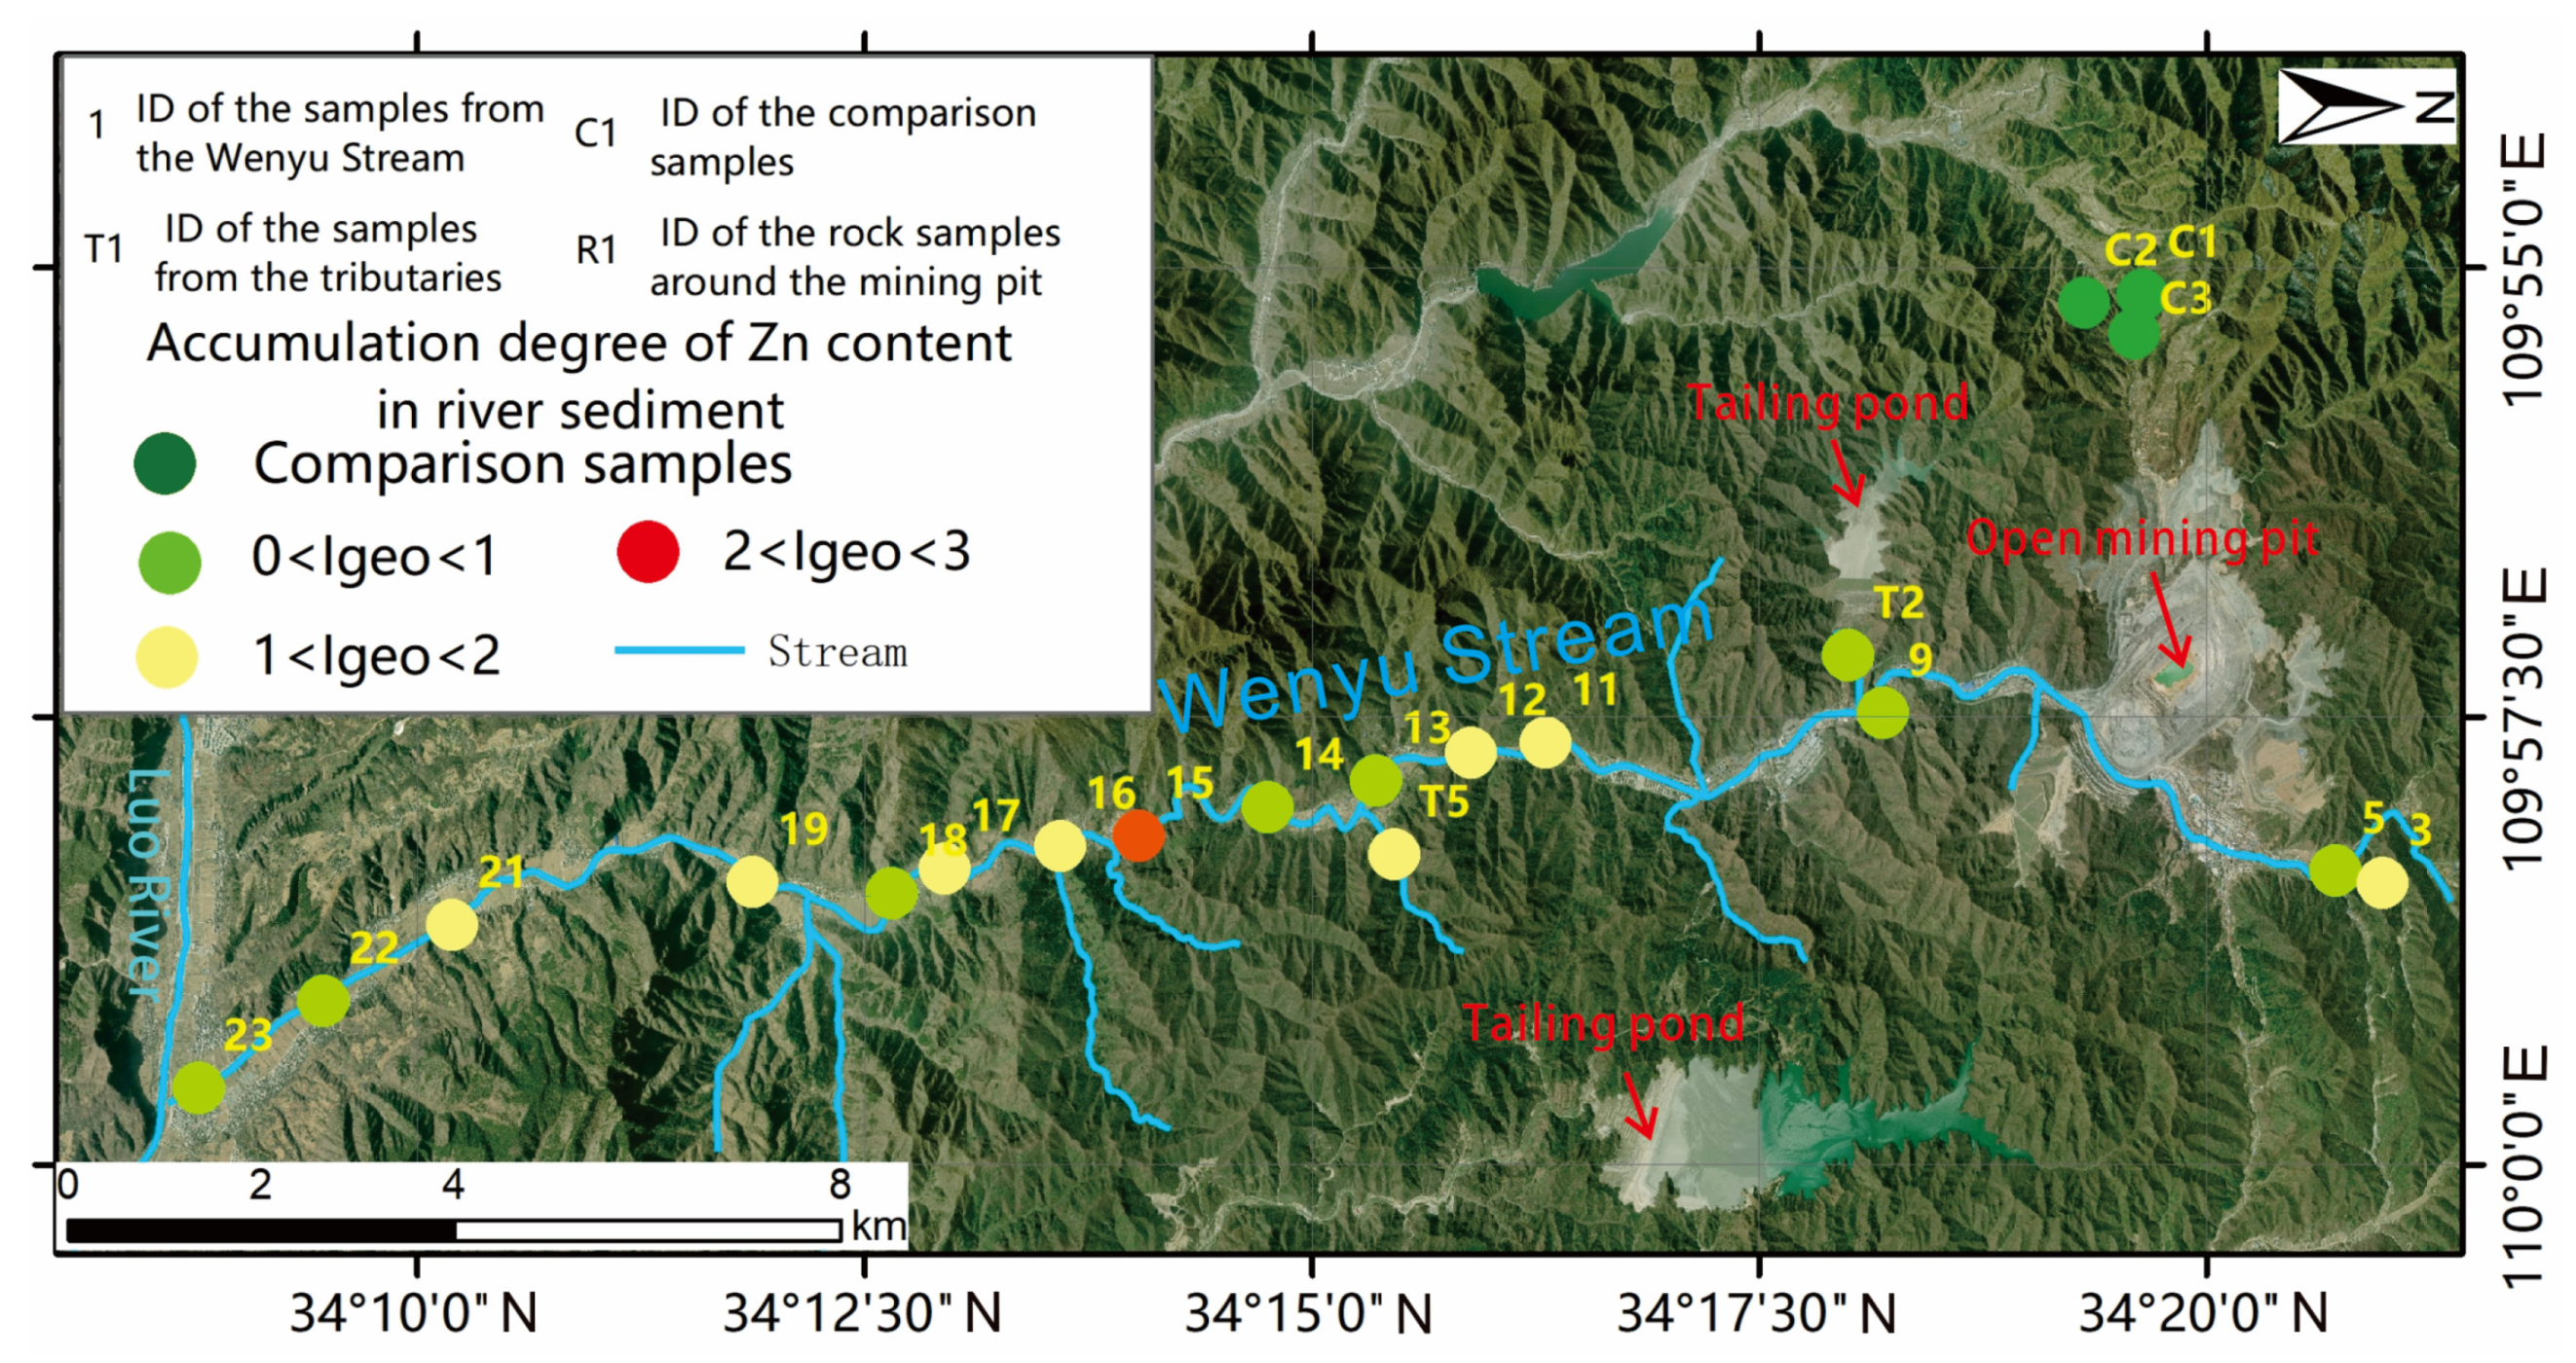
3.7. Degree of Accumulation of Cd and Zn in River Sediment

The geoaccumulation index was used to analyze 17 sediment samples collected from the Wenyu stream. The results, depicted in Figure 8, indicate varying degrees of pollution in both the main stream and tributary channels of the Wenyu stream. The most heavily polluted sites, No. 15 and No. 16, exhibited moderate to severe pollution. On the other hand, the least-polluted sites, No. 5, No. 13, and No. 22, ranged from non-polluted to severely polluted, while most sites showed moderate pollution levels. The sediment samples from the T2 and T5 sampling points in the tributary channel were moderately polluted. Furthermore, the Cd content in all sediment samples from the Wenyu stream watershed in Shangnan County was greatly higher than that in the unaffected area. This indicates that the area has been heavily impacted by the input of heavy metals from mining activities, leading to the enrichment of Cd in river sediments.
The accumulative degree of Zn in river sediment is shown in Figure 9. In the main Wenyu stream, point 15 was at the level of moderate to severe pollution; points 3, 11, 12, 16, 17, 19, and 21 were at the level of moderate pollution; only six points, 5, 13, 14, 19, 22 and 23, were at the level of no pollution to moderate pollution. In the tributary channel, T2 had no pollution–moderate pollution, and T5 had moderate pollution. The sediment samples from the Wenyu stream watershed in Shangnan County showed that the content of Zn in the sediment in this watershed was higher than that in the control area, indicating that mining activities have caused a certain degree of pollution to the Wenyu stream watershed. The above research results showed that the development of mineral resources is an important reason for the enrichment in heavy metals in the river sediments in the mining area, and it is of great significance to study the pollution degree of heavy metals in the sediments to reflect the pollution of river water.

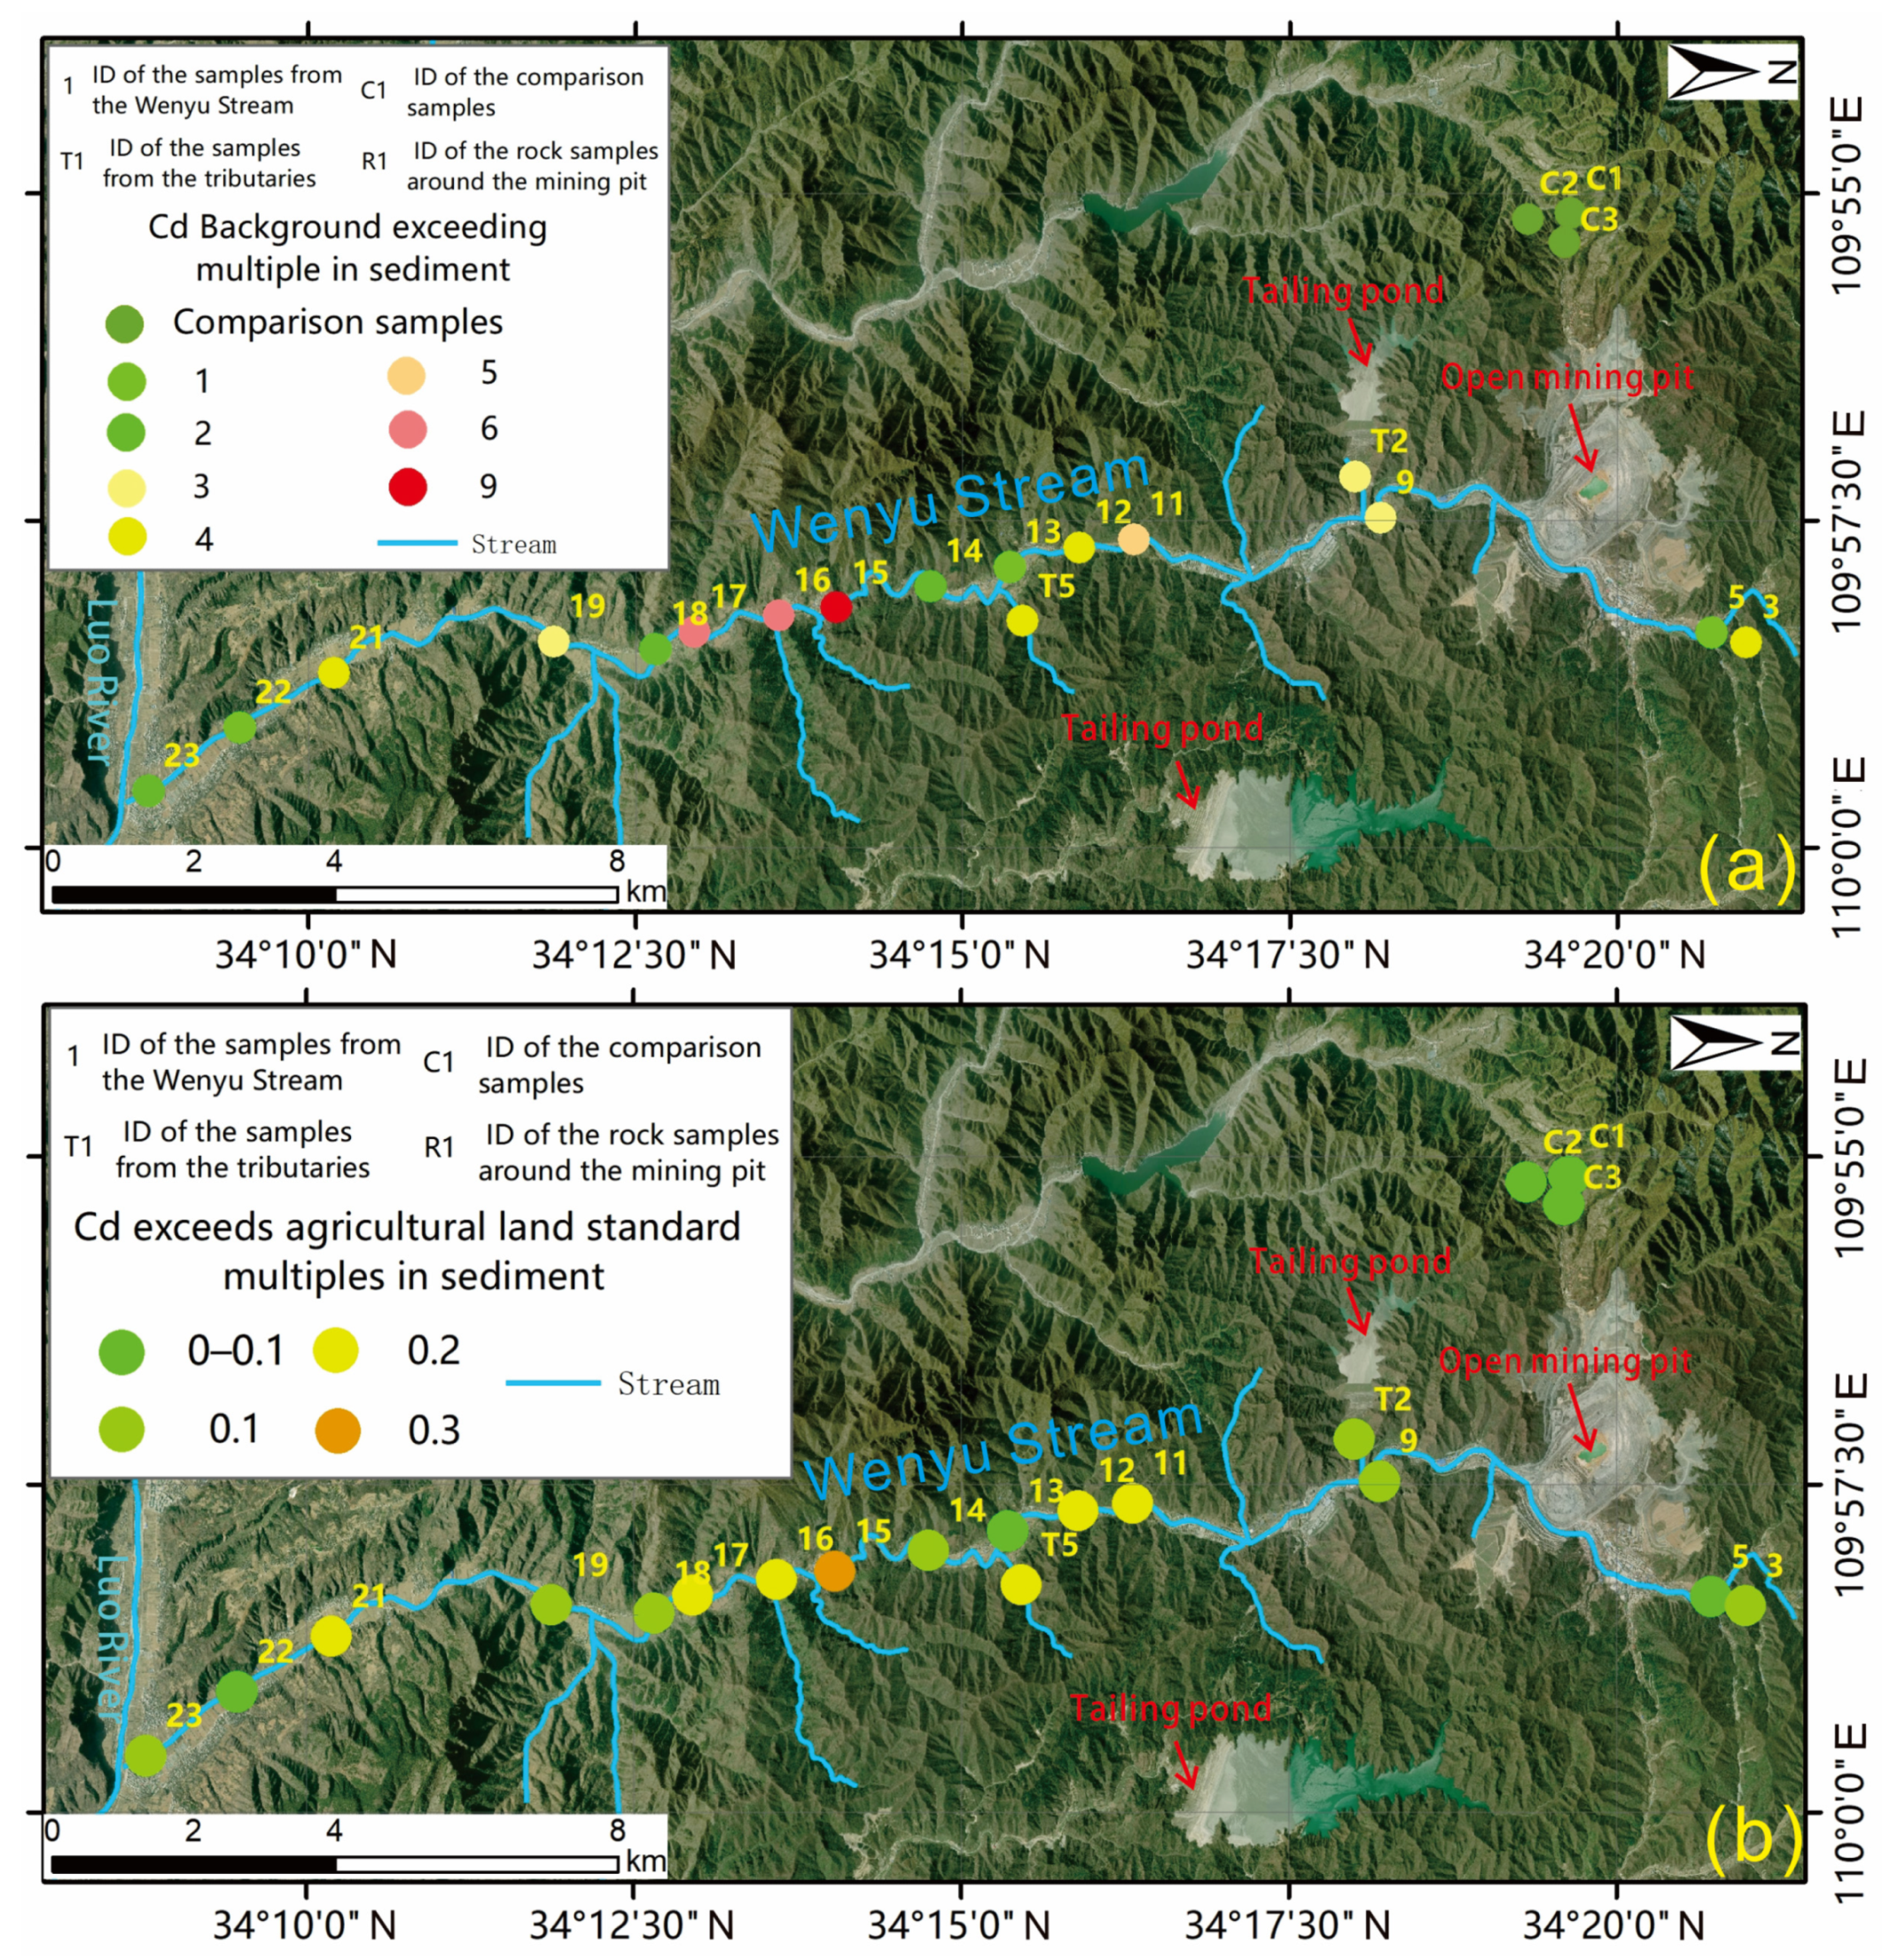
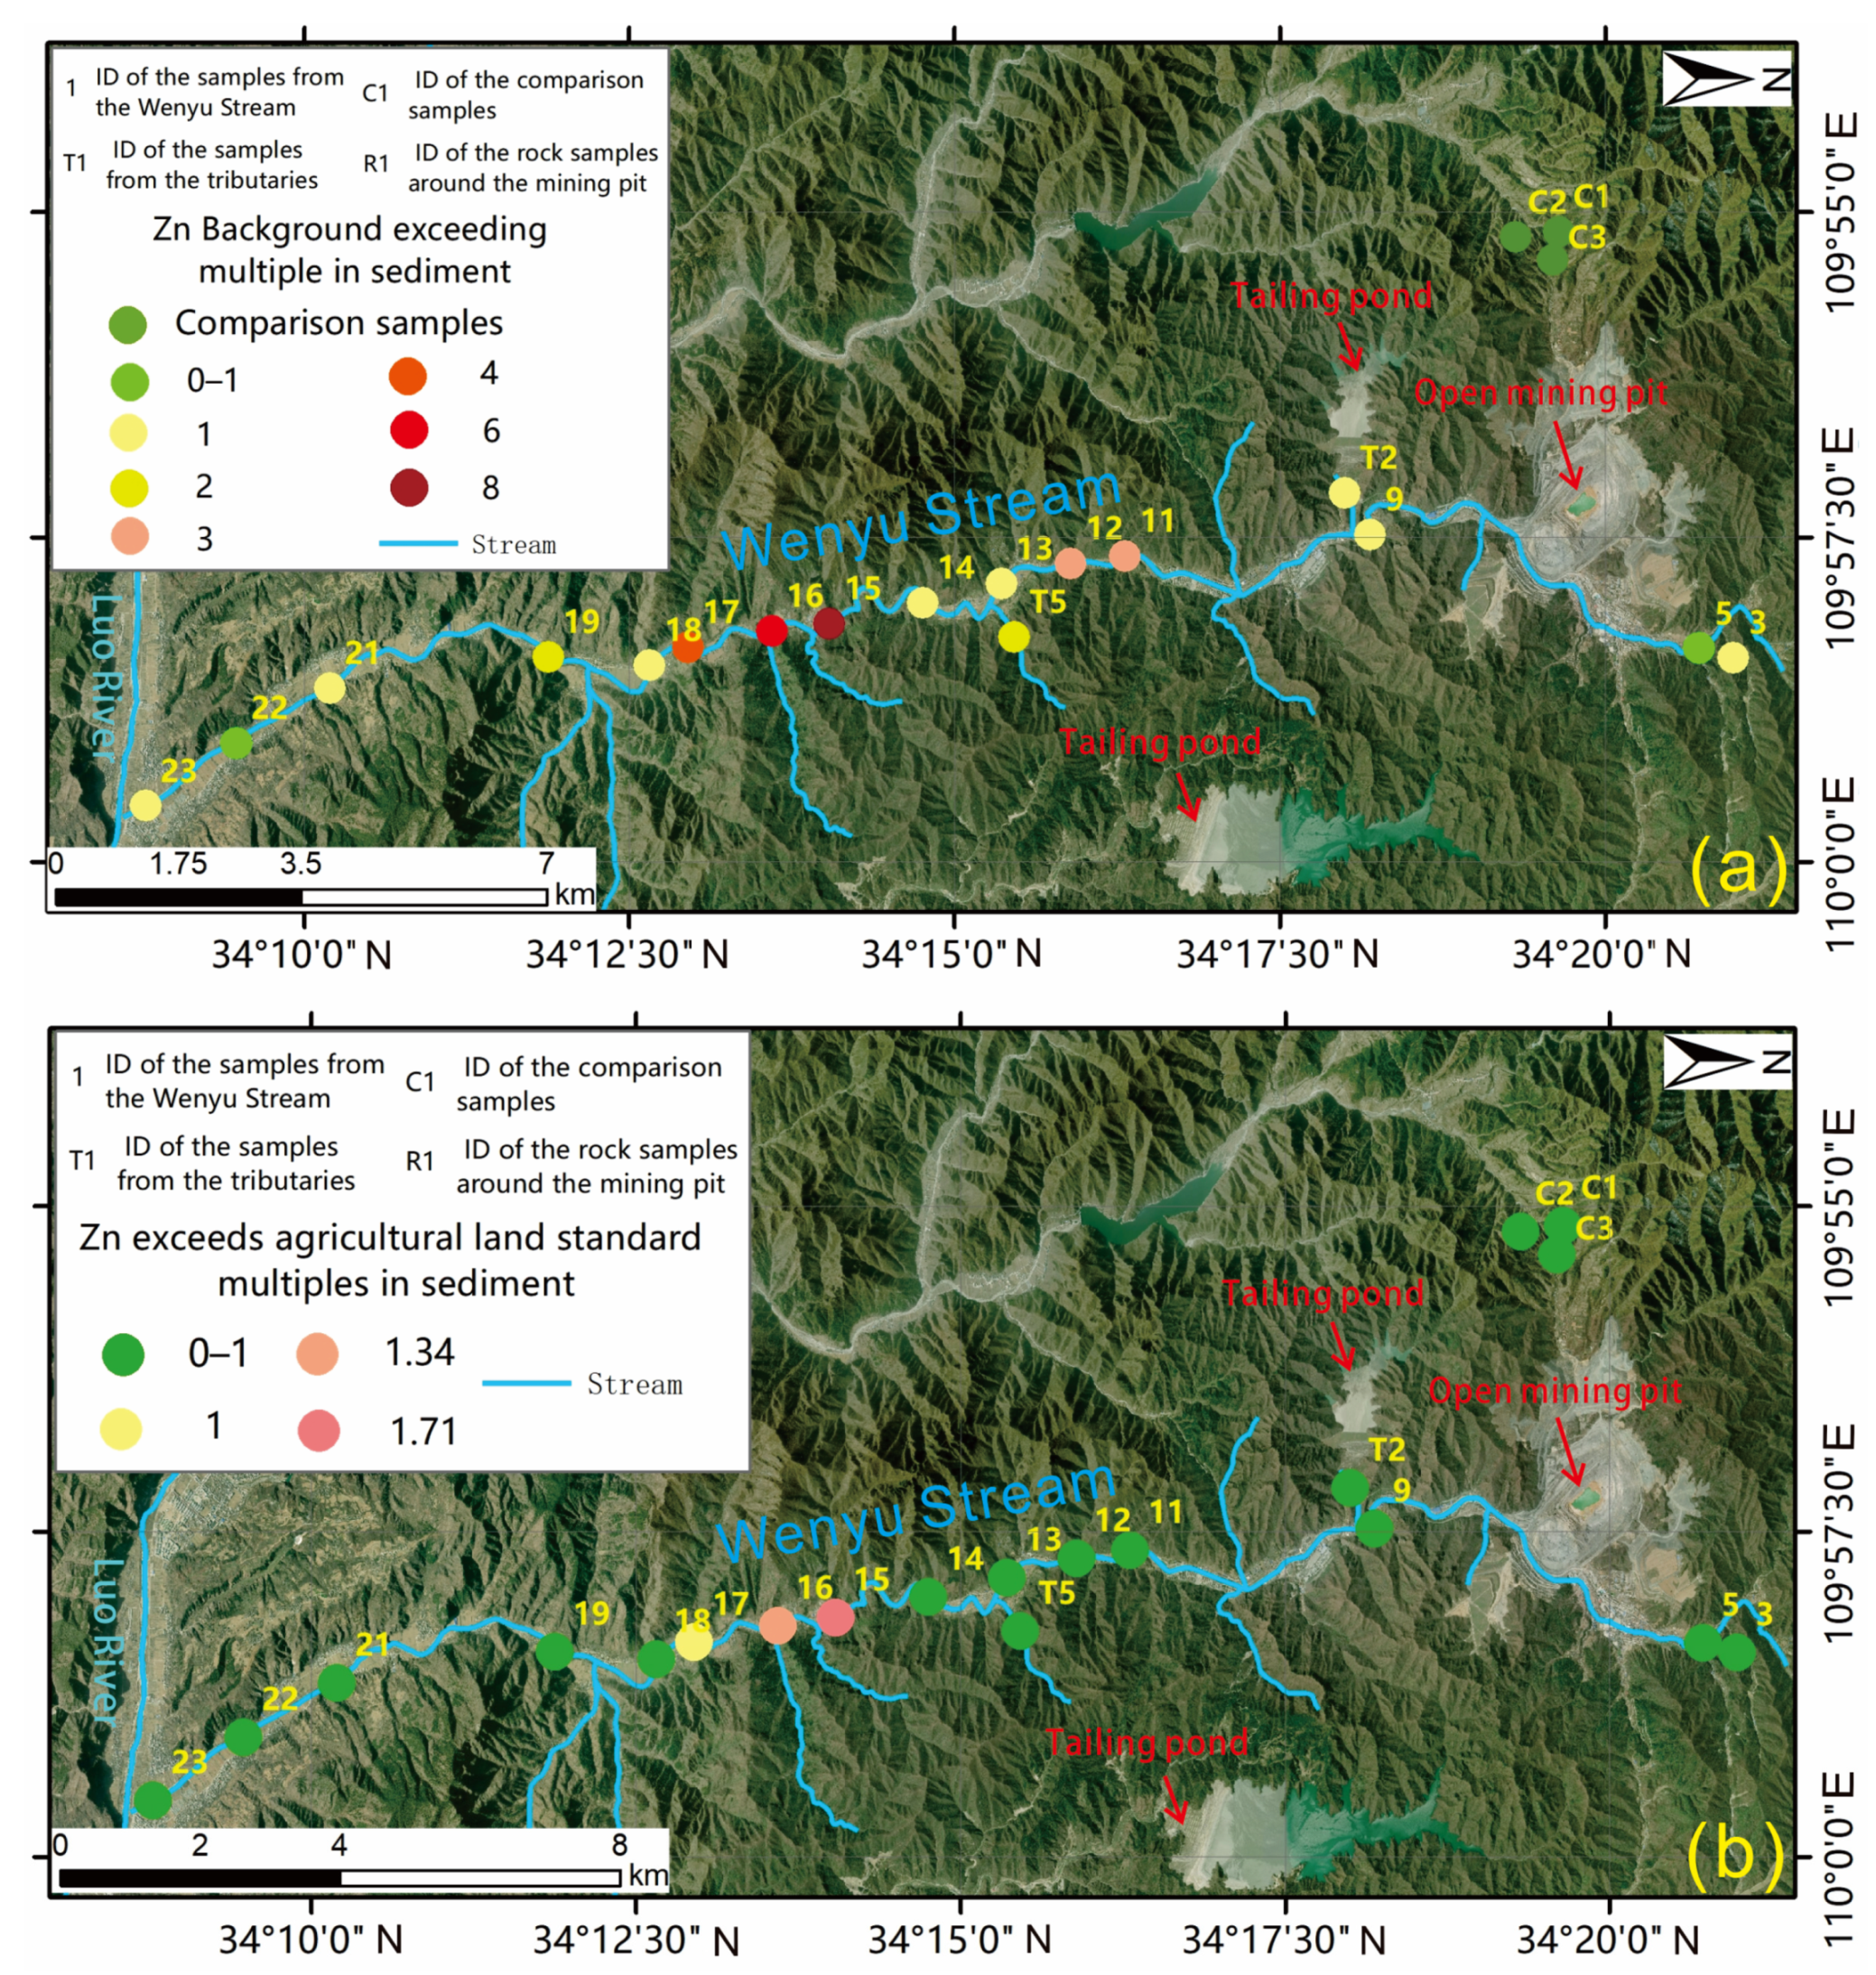
3.8. Excessive Cd and Zn in River Sediment

The cadmium content in 20 sediment samples from the stream watershed and the unaffected area are presented in Figure 10. As depicted in Figure 10a, the cadmium content in 17 sediment samples from the main stream exceeded that of the contrast area to varying degrees. The most heavily contaminated points, 15, 16, and 17, were nine, six, and six times higher than the cadmium content in the unaffected area, respectively. The next significant points, 3, 9, 11, 12, 19, and 21, were generally three to five times higher than the cadmium content in the unaffected area. The remaining points, 5, 13, 14, 18, 22, and 23, exhibited Cd content that was approximately equal to that of the contrast area. The above results showed that the cumulative effect of Cd content in sediment is affected by mining activities.
The background value in Figure 10b refers to the agricultural sludge contrast standard [6], and Cd is 20 mg/kg. It can be seen in Figure 10b that only point 15 was 0.3 times the standard, and the rest were about 0.1–0.2 times. This shows that the sediment samples in the Wenyu stream watershed essentially met the agricultural sludge contrast standard, and the overall sediment condition is good.
The Zn content in 20 sediment samples from the Wenyu stream watershed and the unaffected contrast area are illustrated in Figure 11. As depicted in Figure 11a, the Cd content in 17 sediment samples collected was found to be higher than that of the contrast area to varying extents. The most serious points, 15, 16, and 17, are eight, six, and four times higher than that of the contrast area, respectively; the second most serious points, 11 and 12, are three times higher than that of the contrast area; the remaining sediment samples were one to two times higher than that of the contrast area not affected by mining activities. The above results show that the cumulative effect of the Zn content in sediment was significantly affected by mining activities. The background value in Figure 10b refers to the agricultural sludge contrast standard [6], and the value of Zn is 1000 mg/kg. In Figure 11b, it can be seen that points 15, 16, and 17 exceed the standard by 1.71, 1.34, and 1 time, and did not meet the agricultural sludge control standard (20 mg/kg). The rest of the points were essentially normal.

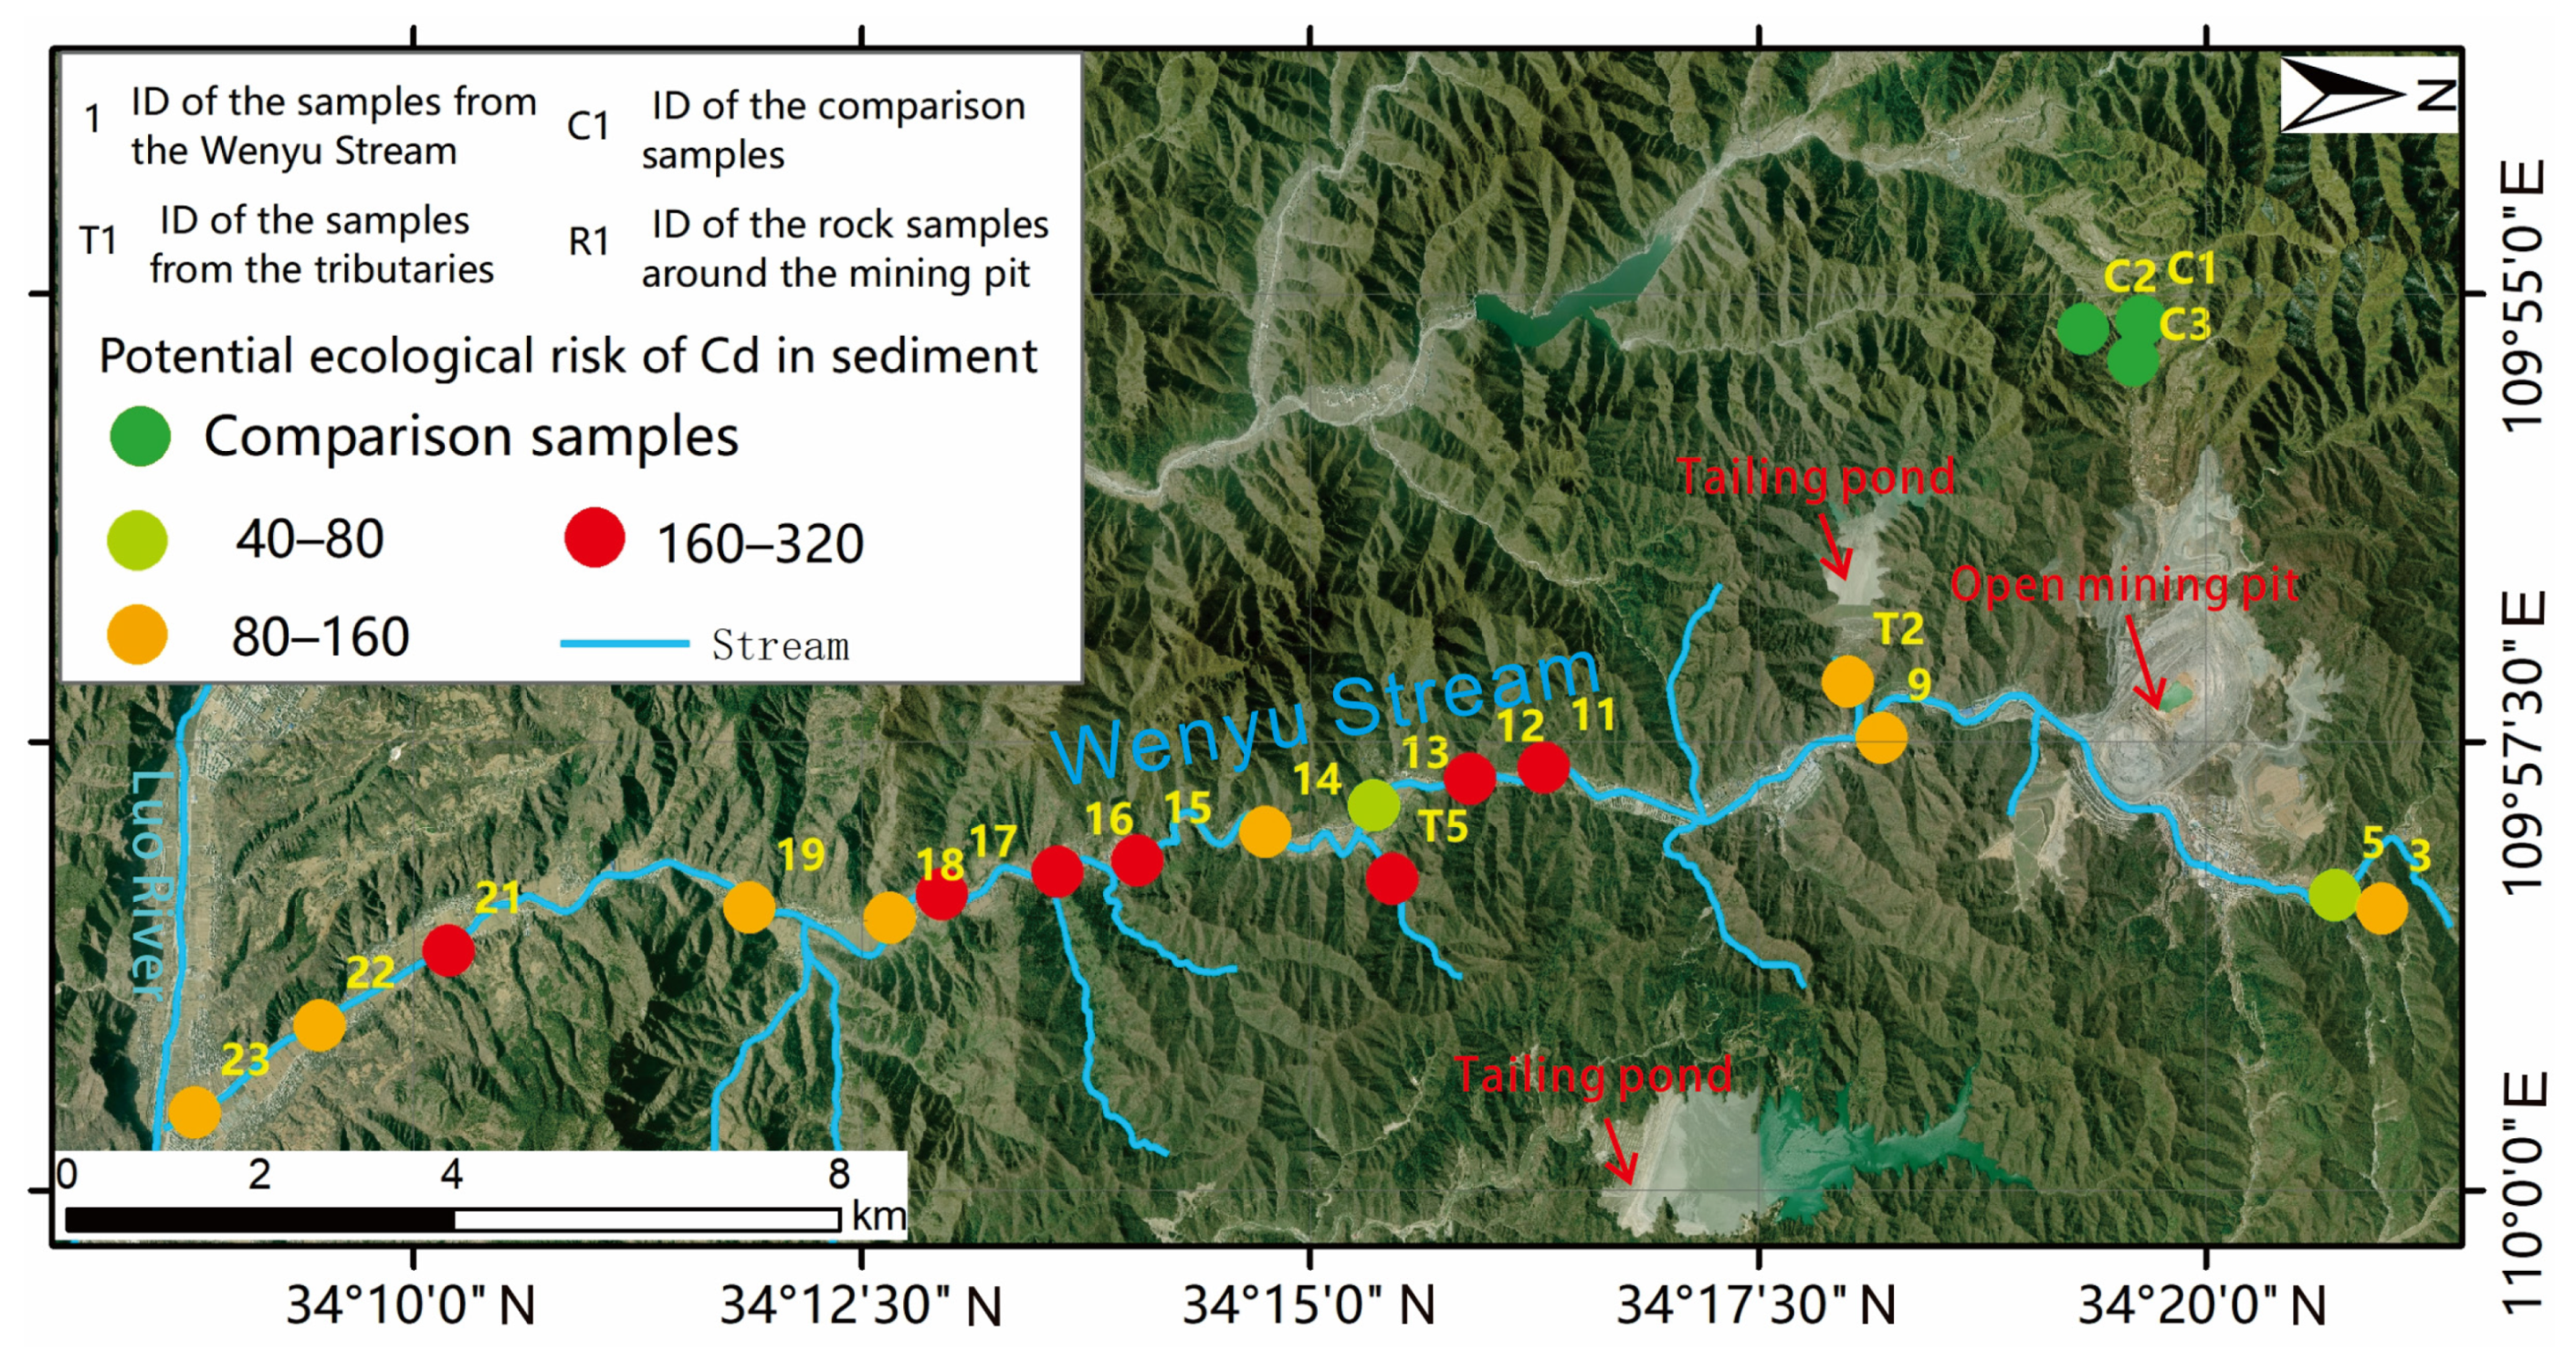
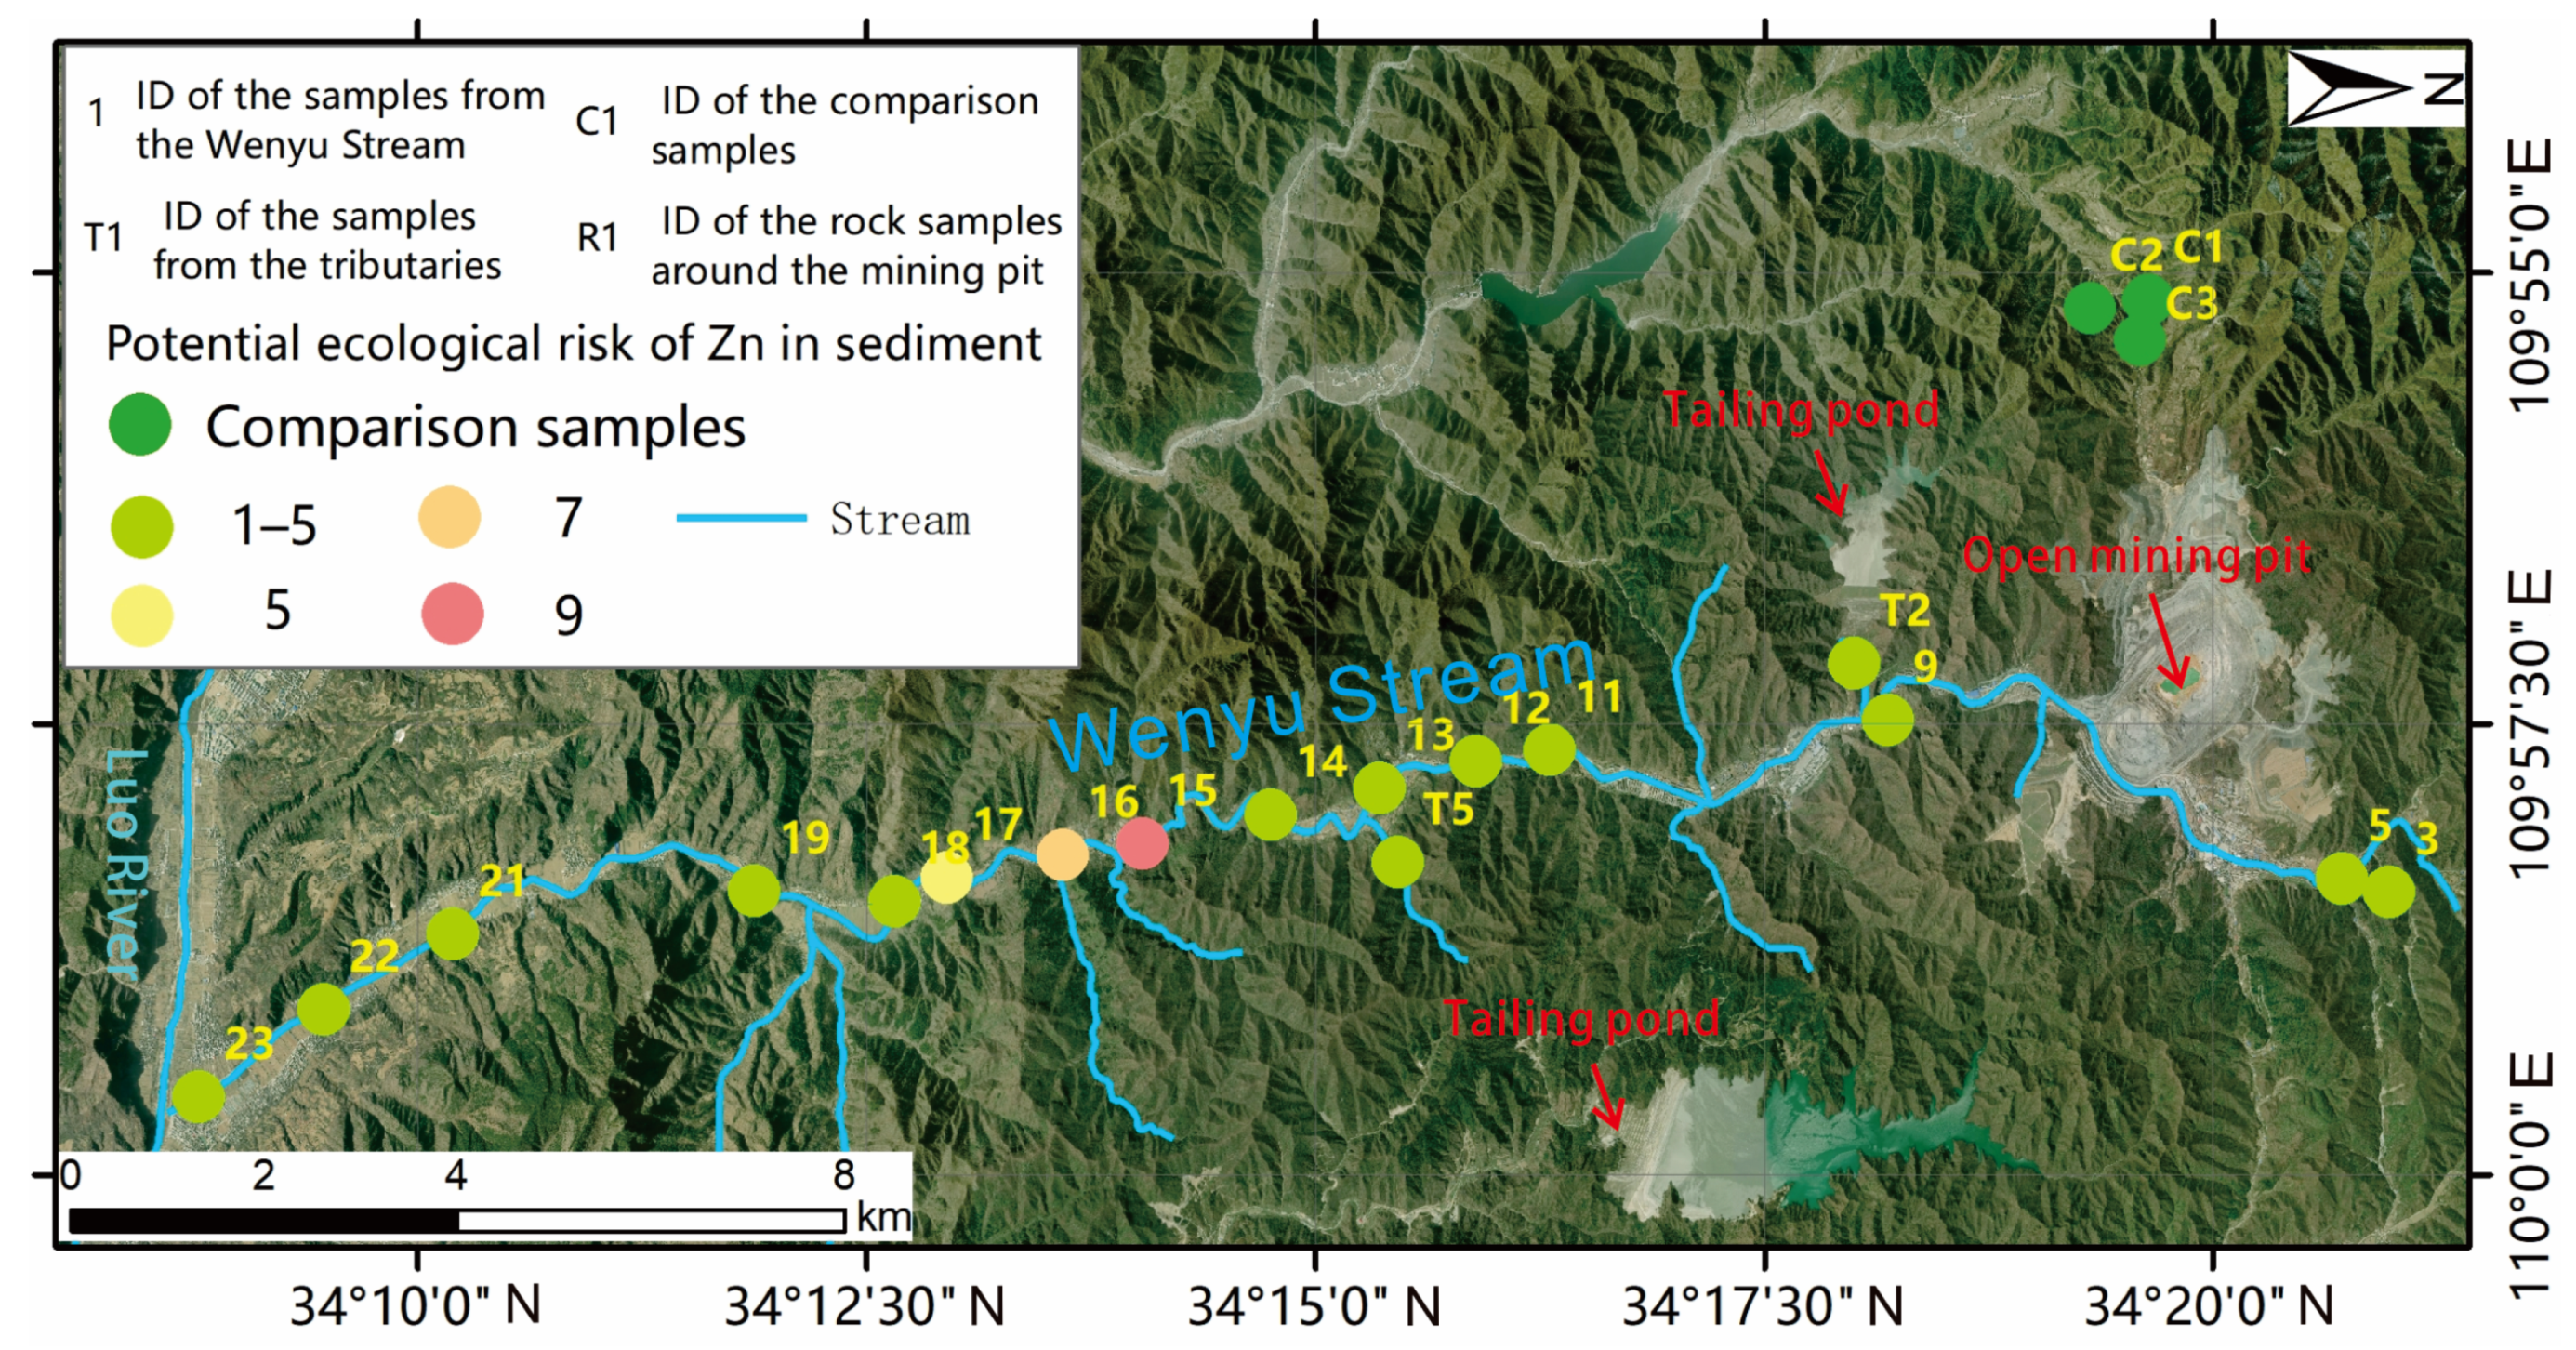
3.9. Potential Ecological Risk of Cd and Zn in Sediment

Based on the Hakanson’s potential ecological risk index method, the potential ecological risk index E r i for Cd was calculated at each sediment sampling point. Figure 12 illustrates that the potential ecological risk index for PTE Cd in 15 sediment samples from the main stream ranged from moderate risk to very high risk. This indicates that the sediment in the main stream poses a strong ecological risk as a whole. Referring to the classification principle in Table 3, we could find that samples with strong ecological risk, samples with strong ecological risk, and samples with moderate ecological risk accounted for 40.00%, 46.67%, and 13.33%, respectively. In the tributary stream, point T2 exhibited a strong potential risk, while point T5 had a very strong potential risk. Based on the analysis of these results, the pollution of Cd in the sediment of the Wenyu stream watershed poses a severe threat to the ecological security of the watershed. This can be attributed to two possible reasons. On one hand, the Cd content in river sediment is notably higher than the average value of the contrast area, indicating a significant cumulative effect of elements resulting from mining activities. On the other hand, this can be attributed to the high toxicity response coefficient of Cd, which is unique to this element. It is important to note that, in this study, the average value of sediment in the unaffected area is utilized as the background reference value when selecting the environmental background value C n i . By default, this selection ignores the impact of the primary geological background of the study area on the Cd content in the sediment and only considers the impact of mining activities, which is consistent with the overall research idea of this paper. Using the study area’s heavy metal background value as a reference can provide a better reflection of the pollution level caused by mining activities on the environment.
The potential ecological risk index of Zn at each sediment sample point in the Wenyu stream watershed is shown in Figure 13. It can be seen in Figure 13 that the potential ecological risk index of PTE Zn in 17 sediment samples from the main stream was relatively low, all at a slight level, and the highest levels of points 15, 16, and 17 are nine, seven, and five—that is, the pollution degree of Zn in the Wenyu stream watershed has not seriously affected the ecological security in the watershed.

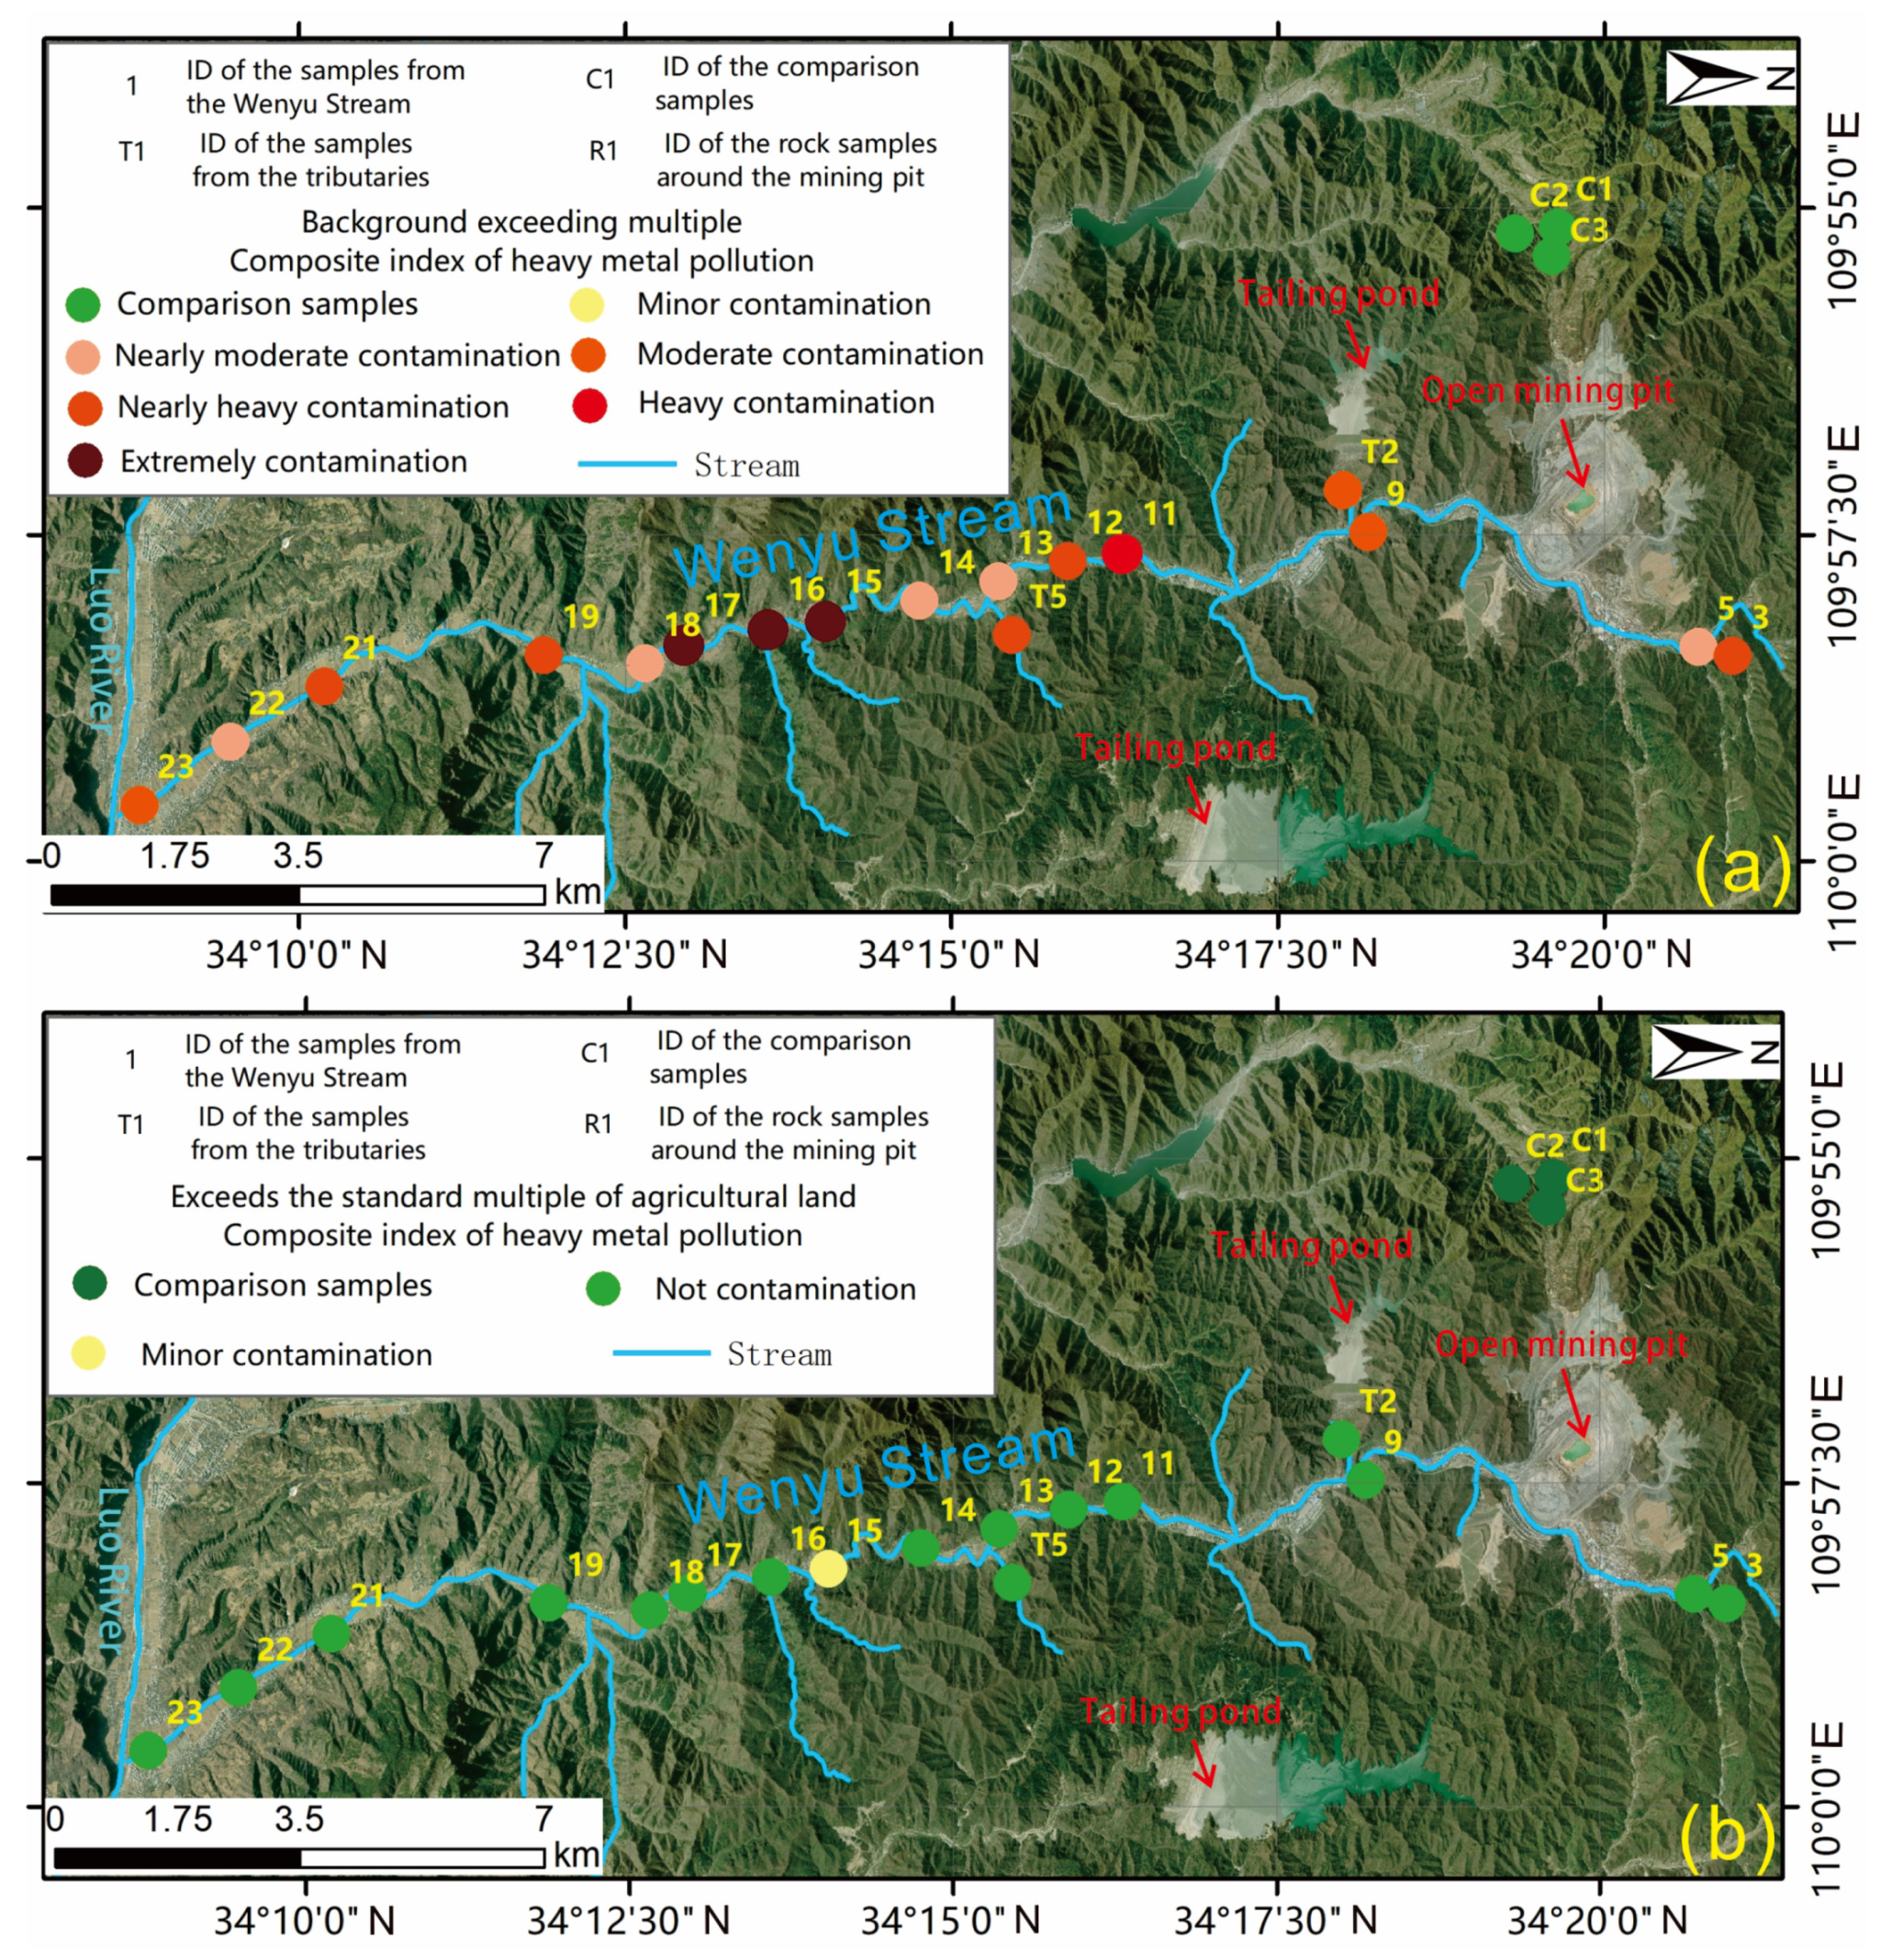
3.10. Comprehensive Index of Heavy Metal Pollution in Sediment

The evaluation of PTEs pollution in the sediment of the Wenyu stream watershed does not solely rely on higher concentrations of PTEs to determine the severity of pollution caused by these elements. The pollution level of PTEs in the sediment is closely linked to the background value of the contrast area and the reference standard. When assessing the overall pollution degree of Cd and Zn in the sediment, a comprehensive pollution index should be utilized to express the pollutant’s impact. By employing the average value of the unaffected area as the background value in Figure 14a, it is evident that the 17 sediment sampling points in the Wenyu stream watershed exhibited varying degrees of pollution. The main ditch’s most severely affected points, 15, 16, and 17, experienced extreme pollution. Points 3, 9, 11, 12, 19, 21, and 23 displayed moderate to severe pollution, while only points 5, 13, 14, 18, and 22 demonstrated moderate pollution. T2 and T5 of the two points in the branch ditch had moderate pollution, indicating that the cumulative effect of human activities on the PTEs in the Wenyu stream was significant, which is speculated to be closely related to the dense mining yards and concentrators in the area. In Figure 14b, the agricultural pollution contrast standard was used as the background value to comprehensively analyze the pollution degree of Cd and Zn on the bottom mud of the Wenyu stream. Only point 15 achieved slight pollution, which was the main ditch and branch ditch of the Wenyu stream and essentially met the use standard of agricultural sludge. The above research results show that different background values are selected for comprehensive analysis of PTEs in sediment, and the pollution degree is also different. That is to say, the results of this study are different due to different human activities, original geological backgrounds, and agricultural land standards.

3.11. Content of Cd and Zn in Surrounding Rock

The average cadmium and zinc content in the five surrounding rock samples collected near the large open-pit molybdenum mine pit (see Table 9)was found to be 4.1 times higher than the environmental background value of cadmium in Shaanxi Province [29], and 4.90 times higher than the environmental background value of Cd in Lou soil in Guanzhong, Shaanxi Province [15]. These findings indicate that the geological background value of Cd is significantly elevated within a specific range of the molybdenum mine pit in the upper reaches of the Wenyu stream. Previous research on the geochemical area of Southern Shaanxi has revealed a high concentration of copper-loving elements and tungsten-molybdenum group elements (such as Cu, Zn, Cd, and Ti), indicating enrichment characteristics. Notably, Cd was highly enriched in certain sections, with local concentrations even surpassing five times the background average value, resulting in the formation of a trace element surplus area [30]. These findings align with the outcomes of the present study.
Table 10 reveals that the average Zn content in the five surrounding rock samples collected near the large molybdenum mine pit was 2.35 times higher than the environmental background value of Zn in Shaanxi Province and 2.53 times higher than the environmental background value of Zn in Lou soil in Guanzhong, Shaanxi Province. These findings indicate that, within a specific range of the molybdenum mine pit in the upper reaches of the Wenyu stream, the geological background value of Zn is relatively high. In addition, previous studies on the geochemical region of Southern Shaanxi have also demonstrated a high Zn content in this area, exhibiting characteristics of enrichment.

4. Discussion

By analyzing the Cd and Zn contents in the river and sediment of the Wenyu stream watershed downstream of a large molybdenum mine in Luonan County, Shangluo City, Shaanxi Province, this paper creates a detailed evaluation and analysis of the pollution caused by mining activities as much as possible and finds that mining sites, concentrators, and other mineral resource development sites are mainly concentrated and distributed in this area, which leads to major pollution problems. The main sources of pollutants were analyzed, and the possible pollution sources were investigated. At present, there are two levels involved in the analysis of PTEs pollution sources. The first level is to determine the source type of the main PTEs in the environmental medium using only qualitative judgment—that is, source identification [32]; the second level is to quantitatively calculate the impact degree of various PTEs pollution sources based on source identification, which is called source apportionment [33]. This paper mainly discusses the identification of PTEs pollution sources in river and sediment of the Wenyu stream watershed and provides a data reference for environmental governance and sustainable development of mining areas.

4.1. Source of Acid Drainage from Mines Polluting the Wenyu Stream

It can be seen in Figure 15 that the abnormal pH values in the Wenyu stream watershed were found at point T2 and point 10, and the pH values of both were between 5.0 and 6.5, which is acidic water quality. A tailings pond about 0.5 km to the west of the river basin was considered to be one of the possible reasons for the abnormal pH of the river, as it featured acidic mine-polluted wastewater with excessive heavy metal content discharged to the main stream upstream of point T2 [34]. According to previous research and analysis, the main formation of acid drainage in mines occurs as follows: first, in the mineral processing process of mining activities, different grades of ores need to be purified to a high grade, which can be achieved by adding a large number of acid reagents. The wastewater discharged after the completion of ore processing activities is the main acidic water in mining areas; second, sulfide minerals stacked in the open air in the mine waste dump and tailings pond can easily oxidize and form sulfate ions and heavy metal ions after contacting with the air. In the case of precipitation or transportation treatment, they are enriched in the mining area through leaching and form acidic wastewater; third, groundwater seepage and tailings pond waste leakage are inevitable in mining activities [35], and there may be rocks and soils containing sulfur or heavy metal elements in the underground strata, which may dissolve and form acidic mine water in long-term mining activities. In this study, developing this large molybdenum mine may produce acid mine drainage in these three ways. Combined with the previous research results and the analysis of the local original geological background, the acid wastewater produced by mining activities in the mining area and its unqualified discharge was another important reason for the heavy metal Cd and Zn pollution in the Wenyu stream. The main solutions for acid wastewater are to block the source of pollution, control the migration of wastewater, and actively (passively) treat the end of water inflow [36]. When studying the pollution of coal mines in Guizhou, predecessors proposed that filling the mined-out area with carbonate rocks can be used in the mining area to avoid the discharge of acid water in the mining area [37]. From the biological point of view, other researchers have suggested that the domesticated microbial population can be used to treat acidic wastewater [38].

4.2. Source of Surrounding Rock Polluted by the Wenyu Stream

Based on the test results in Table 6 and Table 7, the distribution of Cd and Zn contents in the rock samples was different. The surrounding rock sample with the highest Cd content was a pyrite-rich pit wall rock, while the surrounding rock sample with the highest Zn content was a metamorphic slate. The average abundance of Cd in the crust was 0.2 mg/kg, one of the trace heavy metal elements in rocks. Under different oxidation conditions, such as strong oxidation, Cd formed CdO, CdCO3, and other oxidized minerals, or CdSO4 entered the aqueous solution; for example, under weak oxidation conditions, sphalerite is oxidized and dissolved rapidly, and Cd remains as cadmium sulfide (CdS). For a long time, there were many kinds of Cd and Zn elements remaining in the primary occurrence environment of mineral processing plants, mining yards, transportation yards, and other mining activities, which were released from minerals and rocks and migrated and transformed in the primary geological environment, eventually accumulating and enriching in the whole watershed and causing pollution effects on the river and its sediment.

4.3. Impact of Heavy Metal Release from Sediment on River Water

The process of river pollution caused by the release of potential toxic elements in sediment is now a hot point. A study was conducted to analyze the concentration of eight PTEs (Cu, Pb, Zn, Cd, Ni, Cr, As, and Hg) in sediment samples from the BeiJiang River and its tributaries in Guangdong Province, China. The researchers used the geoaccumulation index to assess PTEs pollution in that area. The study revealed that the main stream had higher levels of PTEs compared to the branch ditch, primarily due to the presence of mining yards and smelters in the vicinity [39]. In a study on the release kinetics of potential toxic elements from urban water-polluted sediments in Guangzhou, the first stage involved the rapid desorption of PTEs from the sediment surface, while the second stage involved the slow diffusion of PTEs from the micropores inside sediments to the external solution [40]. In a study on the release of elements in river sediments in the Songhua River, it was observed that factors such as temperature, pH, water disturbances, and salt concentrations have different influence on the release of PTEs [41]. Following the extraction of molybdenum ore in the study area, heavy metal ions such as cadmium and zinc were released into the Wenyu stream. A comparison of the Cd content exceeding the standard in Figure 3a and Figure 10a revealed that the average Cd content in sediment samples was 4.55 times higher than in stream samples. The release of PTEs into the river through different pathways resulted in changes in the pH, water quality, and function of the river water body as it migrated, transformed, and accumulated from downstream to upstream. When the released heavy metal ions infiltrated into the groundwater [42], suspended solids became sediment and affected the water quality. Previous studies conducted in the Guangdong Province have demonstrated that various methods can be employed to remediate heavy metal elements in river sediment. These methods include physical techniques like artificial dredging, chemical approaches utilizing remediation agents, as well as biological methods involving microorganisms and plant communities [43]. In order to control and restore the rivers in mining areas, it is crucial for relevant personnel to prioritize the treatment of river sediment pollution, know the types and treatment methods of PTEs in sediment, and strike a balance between China’s economic development and environmental protection.

4.4. Sources of Heavy Metal Pollution from Atmospheric Dust Fall in the Wenyu Stream

Many pieces of heavy equipment in the mining area will produce dust during operation. Fresh mining faces, waste dumps, and refuse soil dumps will produce dust particles through geological weathering under open conditions. The entire mining process may produce many heavy metal ions and sulfate ions which finally directly enter the river through wind transport. According to the geographical distribution characteristics of the large molybdenum mine in Figure 1 and Figure 3, the Wenyu stream watershed was densely covered with mining yards, concentrators, and tailings ponds. The most seriously polluted main ditch points were points No. 10–16, and the branch ditch points were points No. T2 and T4. These positions may be within 0.5–1 km downwind of a large number of dust-raising mines [44]. When predecessors studied the spatial distribution, source, and migration of PTEs in the sediment of the Beiyun River, the main source was the enrichment of PTEs in atmospheric particles. It was speculated that the metals in the sediment mainly entered the river and were deposited by rainwater runoff, similar to the basis of atmospheric dust sources studied in this paper [45]. Research on the flux characteristics of heavy metal elements imported into the urban system showed that the spatial distribution of atmospheric dust pollution was closely related to the distribution of pollution sources [46]. Combined with the research of this study, it showed that the development and utilization of mineral resources produce significant dust movement and sedimentation, which may be another important reason for PTEs pollution in the stream. In order to reduce the impact of atmospheric fugitive dust on the health of the ecological environment, previous studies have suggested that the economically sustainable development goal of ecological environment treatment and regeneration could be achieved by controlling the length of the dry beach of the tailings pond, strengthening the management and capital investment in the multi-pipe discharge of the tailings pond, using a dust-covering agent [47] to inhibit wind erosion on key road sections, and building a special spray pipe network to increase fugitive dust agglomeration or using soil-covering methods [48].

4.5. Health Risks of Cd and Zn

Cadmium [49] is a toxic, carcinogenic element known to easily accumulate in the human body for a long time. Cadmium poison from floating dust is continuously deposited in the deep lung due to human respiration. Excessive cadmium content in the water will cause joint pain in the short term and cause death due to the induced syndrome after several years [50]. A small amount of zinc [51] can promote the growth of brain cells and is one of the essential elements in the human body. However, a large amount of zinc supplementation and long-term accumulation in the human body will lead to copper deficiency and even zinc poisoning [17]. In the water pollution of rivers, the substances harmful to the human body in the water environment are usually divided into two categories depending on how they enter the body—drinking water and skin—which may cause health risks to the human body. By using the model recommended by USEPA to calculate the health risk of Zn on the human body through skin and drinking water and the health risk of chemical carcinogen Cd [52], this study found that the risk level of Zn on human health through skin and drinking water in the Wenyu stream watershed was low, but the average content of Cd carcinogen was only slightly lower than the limit value specified by the National Radiation Protection Commission. This has a significant impact on the health of surrounding residents and the ecological environment. When previous works studied the treatment of PTEs in rivers and sediment, they usually used the methods of centrifugal removal of cadmium dust, sulfide precipitation of cadmium sewage, and cement solidification treatment of cadmium waste to prevent the impact of heavy metal element cadmium on human health [48]; chemical precipitation [53], reverse osmosis, electrodialysis [54], and other methods were used to reduce the zinc in rivers and sediment to prevent the possible harm of excessive zinc [55] to the human body [51]. While developing the mining economy and heavy metal industry, we require people to make efficient and planned use of heavy metal resources on the one hand; on the other hand, we should ensure environmental protection and environmental restoration to achieve sustainable economic development [56].

5. Conclusions

The mineral exploitation in large-scale metal mining regions has a significant impact on the water quality of downstream rivers and the environmental management of river sediment. This study conducted on-site sample collection and indoor testing to analyze the concentrations of potential toxic elements Cd and Zn in surface water, sediment, and surrounding rock samples from the Wenyu stream watershed. The stream water samples were assessed using the single-element pollution index method and a health risk assessment of potential toxic elements. The sediment samples were analyzed using the single-element pollution index, geoaccumulation index, Hakanson potential ecological risk assessment, and heavy metal pollution comprehensive index method. Consequently, a comprehensive evaluation was conducted to determine the pollution status and ecological risk level of river water and sediment samples in the watershed. The study also examined the impact of molybdenum mine development on the Cd and Zn content in the Wenyu stream. Additionally, various potential sources of pollution and corresponding treatment measures were analyzed.
(1) Among the 23 river water sample points in the main stream, the Cd content at 11 points was notably higher than that of the control area unaffected by mining activities. Additionally, the Zn content at 10 points exceeded the average content of the contrast area. The average Zn content in the main channel was higher, and the average Cd content in the cancer region was double that of the unaffected area. These findings indicate a significant impact of PTEs pollution in the Wenyu stream watershed.
(2) The river water and sediment samples collected from the main ditch of the Wenyu stream generally met the Class II standard for surface water and the standard for agricultural sludge land. Out of the samples, 22 points met the Class I and Class II standards for surface water, accounting for approximately 95.65% compliance. The overall water quality and sediment condition of the Wenyu stream were relatively satisfactory for Cd, while only three points slightly exceeded the agricultural sludge control standard for Zn. The comprehensive risk assessment analysis of the water environment indicated that the overall level of the Wenyu stream watershed was below the maximum acceptable risk level set by USEPA. The comprehensive index for heavy metal pollution in sediment revealed that the sediment in the Wenyu stream was significantly influenced by mining activities, but it generally complied with the agricultural sludge usage standard.
(3) The primary sources of heavy metal pollution in the Wenyu stream watershed include high concentrations of PTEs in ores and surrounding rocks, acid drainage from mining activities, sediment release, and atmospheric deposition of dry and wet dust.

Author Contributions

All authors participated in the development of this study. Conceptualization, M.Y. and H.C.; methodology, A.Z.; software, W.F.; validation, X.Z.; formal analysis, H.C.; investigation, H.C.; writing—original draft preparation, M.Y.; writing—review and editing, W.F.; project administration, Y.X.; funding acquisition, A.Z. All authors have read and agreed to the published version of the manuscript.

Funding

This research was funded by the National Natural Science Foundation of China, grant number 42272342, the China Geological Survey Foundation, grant number DD20230457, the Social Science Foundation of Shaanxi, grant number 2021D068 and the Natural Science Basic Research Program of Shaanxi, program number 2021JM-350.

Data Availability Statement

Raw data are available upon reasonable request addressed to the corresponding author on reasonable request.

Acknowledgments

We are thankful to the Key Laboratory for Geohazards in Loess Areas, the Chinese Ministry of Natural Resources, and the Xi’an Geological Survey Center of China Geological Survey for their contributions to this research. The authors would like to thank the reviewers and editors for their very helpful and constructive reviews of this manuscript.

Conflicts of Interest

The authors declare no conflict of interest.

References

  1. Xu, Y. Investigation and research on the mine geological environment: Present status and outlook. Geol. Bull. China 2008, 27, 1235–1244. [Google Scholar]
  2. Wang, X.; Yang, J.; Guo, H. Study on heavy metals in soil contaminated by coal waste rock pile. J. China Coal Soc. 2006, 31, 808–812. [Google Scholar]
  3. Wu, D.; Li, C.; Deng, Q.; Qin, F.; Jiang, X.; Wu, K.; Guo, W. Research on the Content of Heavy Metal in Crop Planting System in Typical Lead-zinc Soil and its Pollution Characteristics WUDietal. J. Anhui Agric. 2010, 38, 849–851. [Google Scholar]
  4. Zhou, F.Q.; Wang, X.; Zhao, X.; Li, X.; Huang, T.; Sun, Q. Heavy metal distribution and pollution evalution of rivers along mining area in Lujiang County, Anhui Province. Environ. Chem. 2020, 39, 2792–2803. [Google Scholar]
  5. Zuo, D.; Huang, J.; Wen, G.; Yue, M.; Liu, S. Morphological characteristics and ecological risk assessment of soil heacy metals in Lujiang alumite mine. Ecol. Sci. 2019, 38, 86–91. [Google Scholar]
  6. Zhang, J.; Wang, K.; Xu, Y.; Wu, Y.; Chen, H. Ecological hazard assessment of heavy metal pollution in sediments of Taiyu water system in Xiaoqinling. Geol. Bull. China 2018, 37, 2224–2232. [Google Scholar]
  7. Chen, Q.; Zhang, X.; Hu, M. Assessment of Aquatic Pollution of Heavy Metals in a Copper-iron Area. Environ. Sci. Technol. 2006, 29, 64–65. [Google Scholar]
  8. Huang, J.; Qin, M.; Ma, W.; Yu, J.; Peng, X.; Yang, L. Characteristics analysis and ecological risk assessment of heavy metals contamination in suspended solids in a river affected by acid mine drainage. Environ. Chem. 2016, 35, 2315–2326. [Google Scholar]
  9. Cai, Z. Migration, Transformation and Pollution Effects of Heavy Metals in Dabaoshan Mining Region. Master’s Thesis, Jinan University, Guangzhou, China, 2021. [Google Scholar]
  10. Ye, H.; Hong, X.; Zhao, J. Spatial migration and environmental effects of heavy metals in river sediments from in the Tongling mining area, Anhui province. China Environ. Sci. 2012, 32, 1853–1859. [Google Scholar]
  11. Fang, Y.; Sun, J.; Sun, M.; Shi, X.; He, Z.; Gong, Z.; Yao, M.; Sun, Y.; Xu, X.; Sui, H.; et al. Research progress on cadmium toxicity hazards and their prevention and control measures. J. Toxical 2022, 36, 517–520. [Google Scholar]
  12. Shi, Y.; Shi, G. Cadmium Pollution Characteristics and Health Risk of Soil Around Coal Mines in China. J. Huaibei Norm. Univ. 2022, 43, 56–63. [Google Scholar]
  13. Wang, Y.; Yang, J. Research and application of micro-electrolysis technology to industrial wasterwater treatment. Tech. Equip. Environ. Pollut. Control 2002, 4, 69–73. [Google Scholar]
  14. Shao, H. Bone pain in Japan. Geogr. Transl. 1984, 1, 64. [Google Scholar]
  15. Xu, D.; Zhang, J.; Ke, H.; Chen, H.; Liu, R. Analysis on Cd contamination in farmland soil in Tongguan goldmining area. Gold 2010, 31, 53–56. [Google Scholar]
  16. Wang, P.; Liu, H. Zinc imbalance and human health. Food Nutr. China 2007, 7, 50–51. [Google Scholar]
  17. Xiang, Z. The harm of excessive zinc supplementation to the human body. Mod. Med. Hyg. 2001, 9, 727. [Google Scholar]
  18. Ye, L.; Gao, W.; Yang, Y.; Liu, T.; Peng, S. Trace elements in sphalerite in Laochang Pb-Zn polymetallic deposit, Lancang, Yunnan Province. Acta Petrol. Sin. 2012, 28, 1362–1372. [Google Scholar]
  19. Zhang, Y.; Wang, B.; Duan, L.; Fu, X.; Qi, S. Practice of Ecological Restoration of Water Environment in Middle of Northern Foothills of Qinling Mountains. Environ. Sci. Manag. 2023, 48, 150–154. [Google Scholar]
  20. Ren, T.; Zheng, J. Geological characteristics of the deep orebody in the north open pit of Jinduicheng molubdenum deposit, Huanxian County, Shannxi Province. World Nonferrous Met. 2019, 19, 252–254. [Google Scholar]
  21. Jiao, J.; Yuan, H.; He, K.; Sun, T.; Xu, G.; Liu, R. Zircon U-Pb and Molybdenite Re-Os Dating for the Balipo Porphyry Mo Deposit in East Qinling, China, and Its Geological Implicatin. Acta Geol. Sin. 2009, 83, 1159–1166. [Google Scholar]
  22. DD2005-03; Technical Code for China Geological Survey-Technical Requirements for Analysis of Ecological Geochemical Evaluation Samples (DD2005-03). China Geological Survey: Beijing, China, 2005.
  23. GB/T 14353. 4-2010; Methods for Chemical Analysis of Copper Ores, Lead Ores and Zinc Ores. China Environmental Science Press Co., Ltd.: Beijing, China, 2010.
  24. Hua, L.; Hua, L.; Gao, J.; Zhang, Z.; Yin, X.; Zhu, F.; Wang, X. Heavy Metal Pollution of Sediments of Lakes in China. Soils 2006, 38, 366–373. [Google Scholar]
  25. Li, Z.; Hou, J.; Wang, J. Potential ecological risk assessment model for heavy metal contamination of agricultural soils in mining areas. Adv. Earth Sci. 2008, 23, 509–516. [Google Scholar]
  26. Qin, H.; Huang, L.; Gao, B. Content, distribution characteristics and ecological risk assessment of Cu and Zn in the water body of Lhasa River. Environ. Pollut. Prev. 2023, 45, 363–369. [Google Scholar]
  27. Tian, X.; Ding, W.; Zhang, H.; Xu, D.; Guo, X. Water environment health risk assessment in part of Gansu Province from 2011 to 2015. Environ. Chem. 2019, 38, 142–151. [Google Scholar]
  28. Guo, C.; Fang, H.; Wang, J.; Liu, J.; Zhang, F.; Liu, X. Characteristics and potential ecological risk evaluation of heavy metal pollutant in sediment of black-odorous water. Yangtze River 2022, 53, 20–26. [Google Scholar]
  29. Sun, S.; Hu, G.; Wang, Y.; Li, C. Water environmental health risk assessment of Xiangjiang River. J. Saf. Environ. 2006, 6, 12–15. [Google Scholar]
  30. Pan, A.; He, Y.; Ma, R. Zoning of environmental geochemistry in shaanxi province. Adv. Earth Sci. 2004, 19, 439–443. [Google Scholar]
  31. Xue, D.; Xiao, L.; Wu, Q.; Li, D.; Wang, K.; Li, H.; Wang, R. Study on the background values of ten elements in the main agricultural soils of Shaanxi Province. J. Northwest AF Univ. 1986, 3, 30–53. [Google Scholar]
  32. Dwivedi, A.; Vankar, P.S. Source identification study of heavy metal contamination in the industrial hub of Unnao, India. Environ. Monit. Assess. 2014, 186, 3531–3539. [Google Scholar] [CrossRef]
  33. Zhang, Z.; Lu, Y.; Li, H.; Tu, Y.; Liu, B.; Yang, Z. Assessment of heavy metal contamination, distribution and source identification in the sediments from the Zijiang River, China. Sci. Total Environ. 2018, 645, 235–243. [Google Scholar] [CrossRef]
  34. Wang, X.; Gao, Y.; Jiang, X.; Zhang, Q.; Liu, W. Analysis on the characteristics of water pollution caused by underground mining and research progress of treatment technology. Adv. Civ. Eng. 2021, 2021, 9984147. [Google Scholar] [CrossRef]
  35. Zhao, H.; Yang, Z.; Zhang, H.; Meng, J.; Jin, Q.; Ming, S. Emergency Monitoring of a Tailings Pond Leakage Accident Based on the GEE Platform. Sustainability 2022, 14, 8558. [Google Scholar] [CrossRef]
  36. Yang, K.; Wang, Q.; Jin, Y. Brief analysis of the effectiveness of water inrush treatment in an acid mine in eastern Sichuan. China Met. Bull. 2022, 3, 237–239. [Google Scholar]
  37. Zhang, R.; Wu, P.; Yang, Y. Study on New Methods for Treating Acid Mine Drainage with Passive Treatment Technology. Earth Environ. 2010, 38, 250–254. [Google Scholar]
  38. Lin, Q.; Liao, B.; Yang, R. Recent advances on the comprehensive treatments of wasted mne soils and waters. Tech. Equip. Environ. Pollut. Control 2000, 6, 7–10. [Google Scholar]
  39. Wang, S.; Wu, W.; Liu, F.; Liao, R.; Hu, Y. Accumulation of heavy metals in soil-crop systems: A review for wheat and corn. Environ. Sci. Pollut. Res. 2017, 24, 15209–15225. [Google Scholar] [CrossRef] [PubMed]
  40. Wei, J.; Wu, D.; Peng, J. Release and kintics of heavy metals from the contaminated sediments. Ecol. Environ. 2003, 12, 127–130. [Google Scholar]
  41. Gong, K.Y. Study on the Release Law and Pollution Features of Heavy Metals in the Sediments of Harbin Section of SongHua River. Master’s Thesis, Harbin Institute of Technology, Harbin, China, 2014. [Google Scholar]
  42. Shi, M.; Wang, Z.; Wang, J. Assessment for ecological risk of soil heavy metals with Hakanson index method: A review. J. Soil Sci. 2019, 50, 1002–1008. [Google Scholar]
  43. Xu, L.; Deng, S.; Chen, J. River sediment pollution and its control and restoration. Ecol. Environ. Sci. 2014, 23, 1708–1715. [Google Scholar]
  44. Entwistle, J.A.; Hursthouse, A.S.; Reis, P.A.M.; Stewart, A.G. Metalliferous mine dust: Human health impacts and the potential determinants of disease in mining communities. Curr. Pollut. Rep. 2019, 5, 67–83. [Google Scholar] [CrossRef]
  45. Ding, H. Study of Heavy Metal Pollution od the Sediment in BeiYunHe River in Beijing. Master’s Thesis, Capital Normal University, Beijing, China, 2009. [Google Scholar]
  46. Ling, S.; Yu, C.; Lu, S. Flux characteristics of heavy inputted by atmospheric dry and wet deposition to a city system—A case study of Shenyang city. J. Anhui Agric. 2013, 41, 10764–10765+10792. [Google Scholar]
  47. Zhang, S.; Bi, M.; Jiang, H.; Gao, W. Inhibition evaluation of gas inhibitors in micron-sized aluminum dust explosion. J. Hazard. Mater. 2020, 393, 122524. [Google Scholar] [CrossRef] [PubMed]
  48. Li, R.; Yu, M.; Zhu, W.; Zhang, R. Research of Comprehensive Control Measures for Tailings Dust. Met. Mine 2011, 1, 142–146. [Google Scholar]
  49. Hayat, M.; Nauman, M.; Nazir, N. Environmental hazards of cadmium: Past, present, and future. In Cadmium Toxicity and Tolerance in Plants; Academic Press: Cambridge, MA, USA, 2019; pp. 163–183. [Google Scholar]
  50. Huang, B. Biological toxicity of cadmium and its prevention and control strategies. Bull. Biol. 2005, 11, 26–28. [Google Scholar]
  51. Elshama, S.S.; Abdallah, M.E.; Abdel-Karim, R.I. Zinc oxide nanoparticles: Therapeutic benefits and toxicological hazards. Open Nanomed. J. 2018, 5, 16–22. [Google Scholar] [CrossRef]
  52. Zhou, B.; Zeng, Y.; Benjamin, F. Spatial and temporal health risk assessment of water environment in urban area. Geogr. Geo-Inf. Sci. 2009, 25, 94–98. [Google Scholar]
  53. Chen, Q.; Yao, Y.; Li, X. Comparison of heavy metal removals from aqueous solutions by chemical precipitation and characteristics of precipitates. J. Water Process Eng. 2018, 26, 289–300. [Google Scholar] [CrossRef]
  54. Mei, Y.; Tang, C. Recent developments and future perspectives of reverse electrodialysis technology: A review. Desalination 2018, 425, 156–174. [Google Scholar] [CrossRef]
  55. Zheng, Y.; Peng, Y.; Le, H. Separation and recovery of Zn, Fe and Mn in acid mine drainage. J. Cent. South Univ. (Sci. Technol.) 2011, 42, 1858–1864. [Google Scholar]
  56. Zakari, A.; Khan, I.; Tan, D.; Alvarado, R.; Dagar, V. Energy efficiency and sustainable development goals (SDGs). Energy 2022, 239, 122365. [Google Scholar] [CrossRef]
Figure 1. The map of the study area.
Minerals 13 01207 g001
Figure 2. The concept map of the study area.
Minerals 13 01207 g002
Figure 3. The evaluation maps of the Cd background exceeding multiple (a) and the water of class (b) from surface water in the Wenyu stream.
Minerals 13 01207 g003
Figure 4. The evaluation maps of the Zn background exceeding multiple (a) and the water of class (b) from surface water in the Wenyu stream.
Minerals 13 01207 g004
Figure 5. The evaluation maps of the health risk of Cd carcinogen on human body.
Minerals 13 01207 g005
Figure 6. The evaluation maps of the results of Zn health risk assessment. (a) Zn enters the human body through the skin pathway (b) Zn enters the human body through the drink pathway.
Minerals 13 01207 g006
Figure 7. The evaluation maps of the results of the comprehensive risk assessment.
Minerals 13 01207 g007
Figure 8. The evaluation maps of the accumulation degree of Cd content in river sediment.
Minerals 13 01207 g008
Figure 9. The evaluation maps of the accumulation of Cd content in river sediment.
Minerals 13 01207 g009
Figure 10. The evaluation maps of the excessive degree of Cd in sediment. (a) Cd background exceeding multiple in sediment; (b) Cd exceeds agricultural land standard multiples in sediment.
Minerals 13 01207 g010
Figure 11. The evaluation maps of the excessive degree of Zn in sediment. (a) Zn background exceeding multiple in sediment; (b) Zn exceeds agricultural land standard multiples in sediment.
Minerals 13 01207 g011
Figure 12. The evaluation maps of the potential ecological risk of cadmium in sediment.
Minerals 13 01207 g012
Figure 13. The evaluation maps of the potential ecological risk of Zn in sediment.
Minerals 13 01207 g013
Figure 14. The evaluation maps of comprehensive index of heavy metal pollution. (a) Background exceeding multiple composite index of heavy metal pollution; (b) Exceeds the standard multiple of agricultural land composite index of heavy metal pollution.
Minerals 13 01207 g014
Figure 15. The evaluation maps of the pH value in the Wenyu stream.
Minerals 13 01207 g015
Table 1. The relationship between single element pollution index and the pollution degree level.
Pollution LevelUncontaminatedSlightly
Polluted
Moderately
Polluted
Heavy
Polluted
Extreme
Polluted
Single-element pollution index ( P C i ) P C i ≤ 0 0   <   P C i ≤ 1 1   <   P C i ≤ 4 4   <   P C i ≤ 10 10   <   P C i
Table 2. Geoaccumulation index and pollution classification.
Pollution LevelPollution-FreeNo Pollution–
Moderate Pollution
Moderately PollutedModerate to
Severe Pollution
Severe
Pollution
Severe Pollution–Extreme PollutionExtreme Pollution
Index rangeIgeo ≤ 00 < Igeo ≤ 11 < Igeo ≤ 22 < Igeo ≤ 33 < Igeo ≤ 44 < Igeo ≤ 55 < Igeo
Level0123456
Table 3. The relationship between the potential ecological risk index of a single pollutant and the degree of ecological risk.
Ecological Risk DegreeSlightMediumStrongVery StrongExtremely Strong
Index range<40 40     E r i < 80 80     E r i < 160 160     E r i < 320 320     E r i
Table 4. The main symbols used in the formulae.
SymbolMeaningValueUnit
kThe skin adsorption coefficient0.001cm/h
C i The mass concentration of non-carcinogen element I-mg/L
τ The hysteresis time in water1h
TEThe duration of human wading behavior0.4h
AThe surface area of human body16,600cm2
FEThe frequency of wading behavior0.3time/d
EFExposure frequency365d/a
EDExposure delay35a
WAverage body weight70kg
ATThe average exposure time12,775d
fIntestinal absorption rate1-
R f D i The reference dose of non-carcinogenic pollutant I through drinking water0.14mg/(kg·d)
WDUDaily drinking water consumption per person2.2L/d
Table 5. The relationship between the pollution index and the degree of pollution.
DegreeUncontaminatedSlightly
Polluted
Nearly Moderate PollutionModerate PollutionNearly Heavy PollutionHeavy
Pollution
Extreme
Pollution
P≤11~22~33~44~55~6>6
Pollution level0123456
Table 6. The results of the water.
Number (in Water)Cd (μg/L)Zn (μg/L)pH Value
11.0008.0007.750
21.00012.0007.320
31.0008.0008.150
41.0005.0007.200
51.00015.0007.440
61.00030.0007.320
71.0007.0007.030
81.000710.0006.760
94.000290.0006.780
1010.0001360.0005.210
113.000170.0007.430
122.000110.0007.440
132.000110.0007.470
142.000110.0007.740
152.00095.0007.820
162.00075.0007.550
172.00064.0007.720
181.00042.0007.800
192.00047.0008.280
202.00037.0007.780
211.0009.0007.420
221.00016.0007.830
231.00019.0006.960
C11.00031.0007.260
C21.00012.0007.560
C31.0001.0007.620
T12.000690.0006.730
T26.0001210.0006.000
T31.00021.0006.930
T48.0001210.0006.130
T51.00023.0007.890
T61.00018.0007.330
T71.00013.0007.610
T81.0002.0007.770
T91.0005.5008.270
Table 7. The result of the sediment.
Number (in Sediment)Cd (mg/kg)Zn (mg/kg)
33.780532.000
51.760333.000
93.490527.000
115.100886.000
124.120796.000
131.950466.000
142.220518.000
157.6601710.000
165.8901340.000
175.2001000.000
182.320449.000
193.410677.000
214.060556.000
222.000363.000
232.940464.000
C10.900200.000
C20.600141.000
C30.720221.000
T23.170420.000
T54.040704.000
Table 8. Statistical characteristics of Cd content in surface water of the Wenyu stream.
ModeMedianRangeRange/ModeRange/AverageStandard DeviationCoefficient of Variation
0.0010.0010.00994.2990.00299.440%
Table 9. The average content and background value of Cd in surrounding rock.
IDCd Content (mg/kg)Mean (mg/kg)The Cd Background of Shaanxi Province [30] (mg/kg)The Cd Background of Soils of Guanzhong Basin [15] (mg/kg)
R10.200.580.140.118
R20.24
R30.36
R40.11
R52.00
Table 10. The average content and background value of the Zn in surrounding rock.
IDZn Content (mg/kg)Mean (mg/kg)The Zn Background of Shaanxi Province [30] (mg/kg)The Zn Background of Soils of Guanzhong Basin [31] (mg/kg)
R184.7162.3469.164.05
R2231
R3143
R4174
R5179
Disclaimer/Publisher’s Note: The statements, opinions and data contained in all publications are solely those of the individual author(s) and contributor(s) and not of MDPI and/or the editor(s). MDPI and/or the editor(s) disclaim responsibility for any injury to people or property resulting from any ideas, methods, instructions or products referred to in the content.

