Article

Origin of Quartz Diorite and Mafic Enclaves in the Delong Gold-Copper Deposit and Evaluation of the Gold-Copper Mineralization Potential

1
State Key Laboratory of Nuclear Resources and Environment, School of Earth Sciences, East China University of Technology, Nanchang 330013, China
2
Faculty of Earth Resources, China University of Geosciences, Wuhan 430074, China
3
CAS Key Laboratory of Mineralogy and Metallogeny/Guangdong Provincial Key Laboratory of Mineral Physics and Materials, Guangzhou Institute of Geochemistry, Chinese Academy of Sciences, Guangzhou 510640, China
*
Authors to whom correspondence should be addressed.
Minerals 2023, 13(9), 1202; https://doi.org/10.3390/min13091202
Submission received: 5 July 2023 / Revised: 29 August 2023 / Accepted: 11 September 2023 / Published: 13 September 2023
(This article belongs to the Section Mineral Deposits)

Abstract

:
The Triassic Paleo-Tethyan magmatic belt in the East Kunlun Orogen (EKO) hosts a small number of porphyry-skarn deposits. The controls of these deposits, especially those in the eastern EKO, are poorly understood. In this contribution, we report new petrological, zircon U-Th-Pb-Hf isotopic, whole-rock elemental with Sr-Nd isotopic, and mineral chemistry data of the Delong quartz diorite and mafic enclaves to constrain their petrogenesis and metal fertility. The quartz diorite and mafic enclaves are emplaced in the Late Triassic (ca. 234 Ma). They are medium-K, metaluminous, enriched in large-ion lithophile elements (e.g., Rb, Ba, Th) and light rare earth elements (e.g., La, Ce, Nd), and relatively depleted in high field strength elements (e.g., Nb, Ta, Ti, P) and heavy rare earth elements (e.g., Gd, Er, Tm, Yb). The quartz diorite show similar (87Sr/86Sr)i (0.712584~0.713172) and more depleted εNd(t) (−6.4~−5.7) and εHf(t) (−2.3~+2.6) to those of mafic enclaves ((87Sr/86Sr)i = 0.712463~0.713093; εNd(t) = −6.4~−6.0; εHf(t) = −9.4~−4.8). Geochemical compositions of zircon, amphibole, and biotite yield high water content (5.3 wt.%~6.9 wt.% and 6.1 wt.%~7.3 wt.% based on amphibole, respectively) and high redox state for both the quartz diorite and mafic enclaves. These data, together with petrography, indicate the Delong intrusion was formed by mingling of magmas from enriched mantle and lower continental crust with juvenile materials. The oxidized and water-rich features of these magmas denote they have potential for porphyry Cu (±Au ± Mo) deposits, as do some Triassic magmatic rocks in the eastern EKO that show similar geochemical and petrographic characteristics with the Delong intrusion.

1. Introduction

Porphyry Cu ± Au ± Mo systems host a significant proportion of the world’s Cu, Au, and Mo deposits [1]. Multiple factors such as source region, intra-crustal magmatic process, water content, oxygen fugacity, magma chamber size, and metal precipitation efficiency may play significant roles in generating porphyry Cu ± Au ± Mo deposits, and appropriate post-mineralization uplift and exhumation are vital to expose and avoid removal of the orebodies [2,3,4]. It is believed that the causative intrusions of porphyry deposits are generally derived from the enriched mantle in arc settings or lower continental crust (LCC) in collision settings [3,5,6]. These causative magmas always show hydrous and oxidized characteristics in order to inhibit the dispersion of Cu (Au) by sulfide saturation in the magmatic process. Prolonged crystallization on their way to the subsurface is necessary to transform the basaltic magma to andesitic-granitic magma as well as to focus the fluid and metal [4,6].
The East Kunlun Orogen (EKO) had experienced Carboniferous-Triassic Paleo-Tethys-related oceanic expansion, subduction, collision, and post-collisional extension [7,8]. These processes result in an east-west trend magmatic belt in the EKO compared with the Gangdese magmatic belt in the southern Qinghai-Tibet Plateau in volume [9]. A number of collision-related super-large to medium-size porphyry Cu-Mo deposits (e.g., Qulong and Jiama) and Cu-Au deposits (e.g., Xietongmen and Newtongmen) have been uncovered in the Gangdese magmatic belt, with the former being related to high Sr/Y granodiorite porphyries and granite porphyries and the latter being related to quartz diorite and granodiorite porphyries [5,6]. It is noted that collision-related magmatic rocks (Middle-Late Triassic) also prevail in the EKO [8,10]; however, only a few small to medium-size porphyry-skarn Cu ± Au ± Mo deposits, such as Tongyugou, Saishitang, and Yuzigou, have been discovered in the EKO [11,12]. Whether there is potential for large porphyry Cu ± Au ± Mo deposits in the EKO—especially the eastern part, where a few small to medium-size porphyry-skarn Cu ± Au ± Mo deposits occur—is poorly understood. The reasons for the lack of records of large to super-large porphyry Cu ± Au ± Mo deposits in the EKO are also still enigmatic.
In this contribution, we carry out research on zircon geochronology and Hf isotopes, whole-rock elements and isotopes, and mineral chemistry of the quartz diorite and mafic enclaves in the Delong Cu-Au deposit. The source region, magmatic process, and physico-chemical conditions will be discussed in detail. From the perspective of magma water and oxygen fugacity, the gold-copper mineralization potential of the Delong intrusion and the eastern part of the EKO will be evaluated based on our data and those compiled from previous research.

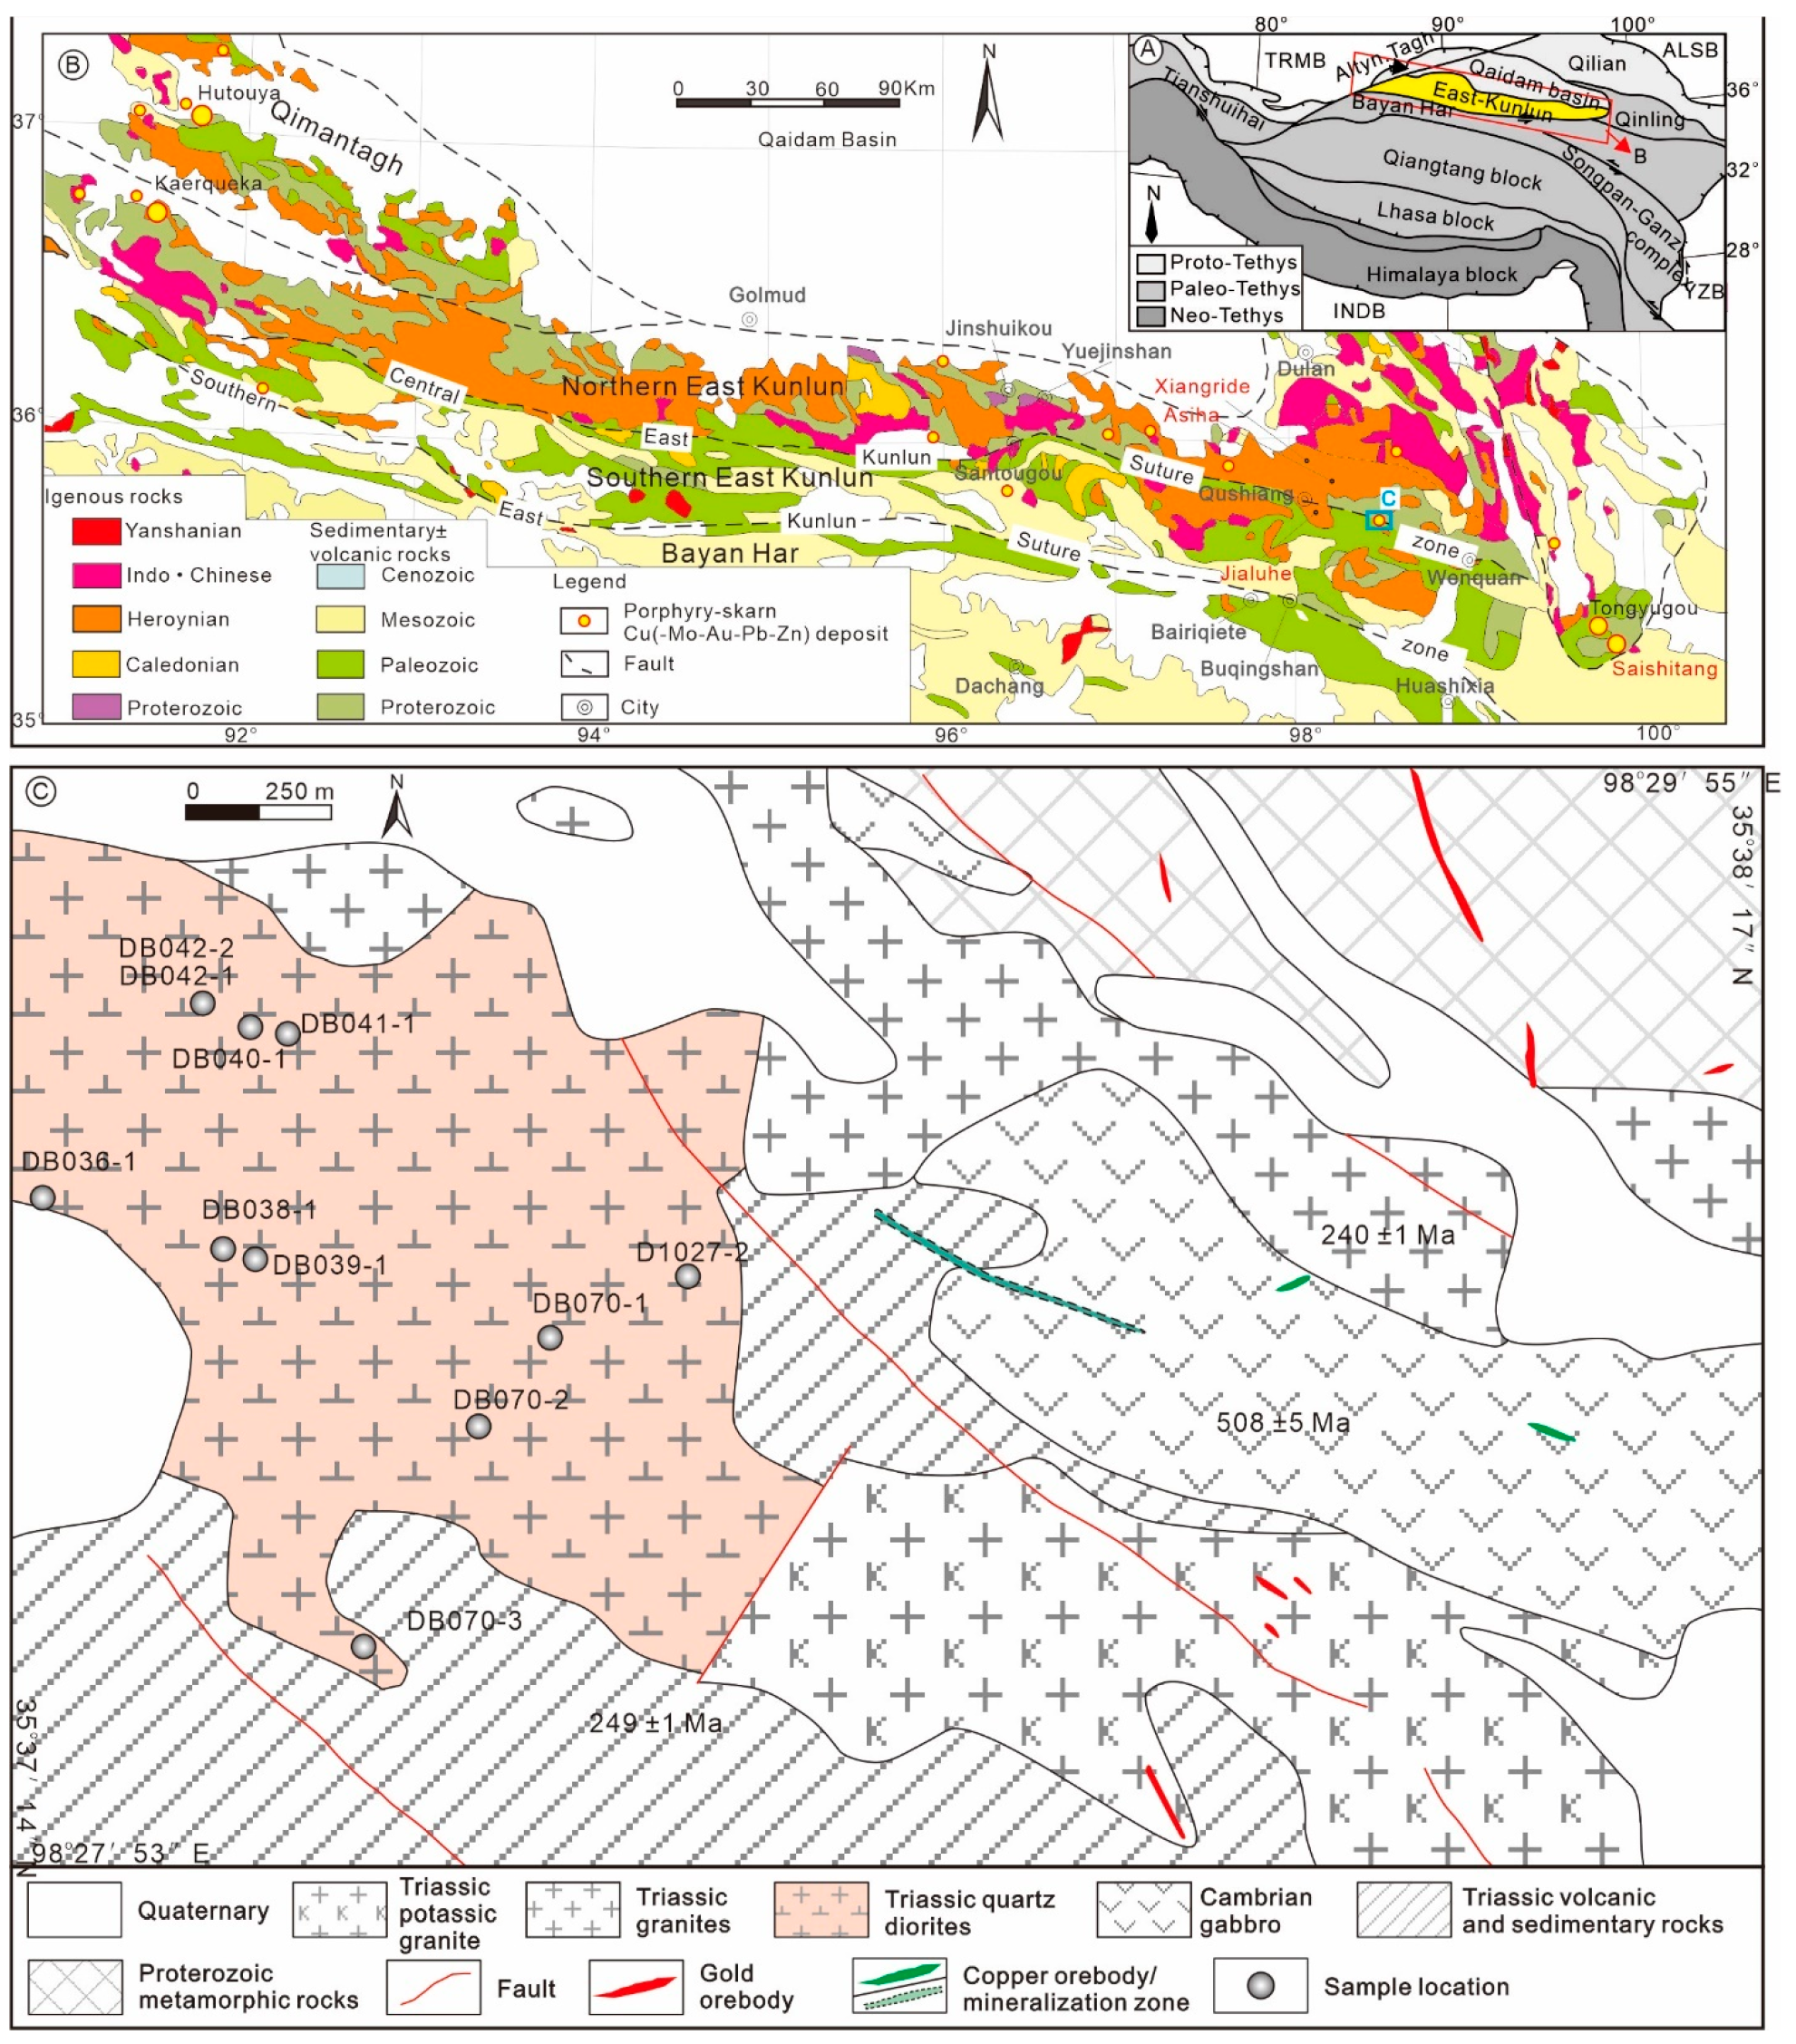
2. Geological Setting and Deposit Geology

The EKO is located in the northern part of the Qinghai-Tibet Plateau and is connected with the Qinling Orogen to the east and the Bayan Har terrain to the south (Figure 1A). Three tectonic units, including Qimantagh, Northern East Kunlun, and Southern East Kunlun from north to south, compose the EKO (Figure 1B). Two east-west suture zones, including the Central Eastern Kunlun suture zone and the Southern East Kunlun suture zone, traverse across the EKO (Figure 1B). These two suture zones are products of ocean-continent transformation related to the Cambrian-Devonian Proto-Tethys and Carboniferous-Triassic Paleo-Tethys, respectively [7,13]. The Paleo-Tethys Ocean should be closed before ca. 240 Ma, and the continental collision could last 10 Ma (ca. 240 Ma~230 Ma), after which the post-collisional extension occurred (ca. 230 Ma) [7,8,14,15,16].
The basement of the EKO is composed of Proterozoic medium-high grade metamorphic rocks. Overlying the basement are Ordovician-Silurian low-grade metamorphic sedimentary and volcanic rocks. Devonian conglomerate, sandstone, and volcanic rocks are sparsely distributed in the whole EKO. Carboniferous-Permian sedimentary and volcanic rocks mainly occur to the south of and in the Central Eastern Kunlun suture zone. Intermediate-felsic intrusions are widespread in the EKO, with most of them crystallizing during the Ordovician-Devonian and the Late Permian-Triassic, the latter of which are products of the subduction, continental collision, and post-collision extension related to the Paleo-Tethys Ocean [8,13]. Some of these intrusions show adakitic features [7,8,13,17,18]. A small number of Triassic porphyry Cu ± Au ± Mo and skarn Fe ± Cu ± Pb ± Zn deposits occur in the EKO [19,20], with the former mainly distributing in the east and the latter in the northwest (Qimantagh) of the EKO (Figure 1B).
The Delong Au-Cu deposit is located at the east end of the EKO. The basement rocks, in the north-eastern district, are composed of Proterozoic schist and gneiss (Figure 1C). Early Triassic volcanic (including dacite porphyry and volcaniclastic rocks; Figure S1A,B; 249 ± 1 Ma, unpublished report) and sedimentary rocks (including limestone and clastic rocks) can be found in the middle and south of the ore district, with some of them having undergone metamorphism. Intrusive rocks are widespread in the ore district, including Cambrian gabbro in the east central, Middle Triassic granite and potassic granite (240 ± 1 Ma [14]), and Late Triassic quartz diorite.
Several copper and gold orebodies/mineralization zones have been discovered in the Delong deposit. In the outcrops, these orebodies crosscut the Proterozoic basement rocks, the Early Triassic volcanic rocks (dacite porphyry and volcaniclastic rocks), and the Middle Triassic potassic granite (Figure 1C). These crosscutting relationships can be also observed in deep drill core samples (Figure S1E,F), implying the later formation of orebodies than the Early-Middle Triassic magmatic rocks. Potassic alteration are intensive in the study area, especially some granites (Figure 1C and Figure S1C). Chloritization and epidotization can be observed in the granites, quartz diorites, and enclosed mafic enclaves (Figure 1C,D). Quartz-sulfide-bearing veinlets and stockworks can be observed in the (potassic) granites and volcanic rocks (Figure S1E,F). These veinlets and stockworks are mainly composed of quartz, pyrite, arsenopyrite, chalcopyrite, sphalerite, and bornite. The alteration and mineralization characteristics of this deposit together suggest a possible porphyry mineralization in the deep, which is likely related to the quartz diorite according to the crosscutting relationships. To evaluate the possible potential of porphyry Cu-Au mineralization in the deep of the studied area, this study focuses on the Delong quartz diorite and enclosed mafic enclaves.

3. Petrography

The Delong quartz diorite intrusion is located in the western part of the Delong gold-copper deposit (Figure 1C). Mafic enclaves sparsely distributed in the intrusion. The mafic enclaves are mainly ellipsoid-shaped and occasionally display an elongated shape (Figure 2A). Minerals in the mafic enclaves occasionally show linear arrangement (Figure 2B).
The Delong quartz diorite is mainly composed of plagioclase (50%~60%), alkali-feldspar (5%), quartz (10%~18%), amphibole (10%~15%), biotite (10%), and minor apatite, zircon, magnetite, and so on (Figure 2A–F,H). In the QAP diagram, the Delong quartz diorite is plotted in the quartz-diorite and quartz-gabbro area based on the estimated mineral volume abundances (Figure S2). The plagioclase with grain sizes ranging from 1 mm to 5 mm occasionally shows zonal structure. Some of the zonal plagioclase grains locally display argillic and sericitic alterations. The grain sizes of amphibole vary between 0.5 mm and 4 mm and biotite between 0.2 mm and 3 mm (Figure 2A–F,H).
The mafic enclaves show similar mineral composition with the quartz diorite (Figure 2A–G,I), but different mineral proportions and smaller grain sizes. The proportions of plagioclase, amphibole, and biotite are 40%~50%, 35%~50%, and 5~10%, respectively, and the mineral grain sizes range from 0.2 mm to 2 mm, 0.2 mm to 1 mm, and 0.1 mm to 0.8 mm, respectively. It can be observed that both amphibole and biotite from the quartz diorite and mafic enclaves show chloritization and epidotization occasionally (Figure 2C,D).

4. Analytical Methods

4.1. Zircon U–Th-Pb-Hf Isotopes and Trace Element Analyses

Zircons from two samples (DB042-2 and DB041-1) were handpicked after sample crushing and magnetic and gravity concentration. The zircon separations were then mounted in epoxy resin and polished to expose core regions. Detail microscopic observation of the zircons using microscope and Cathodoluminescence (CL) was carried out to select inclusion- or crack-free areas for in-situ analyses.
Zircon U-Th-Pb isotopes and trace elements were analyzed simultaneously using laser ablation inductively coupled plasma mass spectrometry (LA-ICP-MS) at the Wuhan SampleSolution Analytical Technology Co., Ltd., Wuhan, China. Laser sampling was performed using a GeolasPro laser ablation system and an Agilent 7900 instrument was used for ionization, ion filtration, and ion-signal collection. The laser spot size was set to 32 μm and the laser frequency was set to 5 Hz; 91500 (zircon) and Nist610 (glass) were used as external standards for U-Pb dating and trace element calibration. Zircon GJ-1 and PLE were analyzed to monitor the data quality. The detailed analytical procedure and conditions have been described by Zong et al. (2017) [21]. ICPMSDataCal (v.12.2) software was used for data reduction [22], including integration of background and analyzed signals, correction, quantitative calibration, and signal selection (using elements such as REE, P, and Ca) to avoid effect of inclusion. IsoplotR was used for data calculation and visualization [23].
Zircon Hf isotope analyses were carried out using LA-MC (multi-collector)-ICP-MS at the State Key Laboratory of Geological Processes and Mineral Resources (GPMR), China University of Geosciences, Wuhan. Laser sampling was performed using GeoLas 2005 laser ablation system and an instrument Neptune Plus was used for signal acquisition. The laser spot size was set to 44 μm, with energy density of 15~20 J/cm2; 91500 and GJ-1 were analyzed simultaneously. The detailed analytical procedure and working conditions have been described by Hu et al. (2012) [24]. The parameters used in our calculations for Hf two-stage model ages and εHf(t) are as follows: (176Lu/177Hf)CHUR = 0.0332, (176Hf/177Hf)CHUR = 0.282772 [25]; (176Lu/177Hf)DM = 0.0384, (176Hf/177Hf)DM = 0.28325 [26]; λ(176Lu) = 1.867 × 10⁻¹¹ a−1 [27]. The 176Lu/177Hf (C) = 0.015 [26].

4.2. Mineral Composition Analyses

Mineral composition analyses were conducted at the State Key Laboratory of Nuclear Resources and Environment using electron probe micro-analysis (EPMA). The instrument model is JXA-8530F Plus. The accelerating voltage and beam current are 15 kV and 20 nA, respectively. The beam diameter is 1~2 μm. The peak analysis time of the major elements is 20 s (Si, Fe, Mg) or 10 s (other major elements) and the background time is 10 s (Si, Fe, Mg) or 5 s (other major elements). The standard samples for calibration the contents of major elements use 53 kinds of mineral standard samples and 44 kinds of elemental standard samples. The ZAF correction method is used to correct data.

4.3. Whole Rock Major, Trace Elements, and Sr-Nd Isotope Analyses

Rock blocks were cut to remove weathered surface and altered parts. Then, the fresh samples were crushed into 200-mesh powders for whole rock geochemical analyses. Major elements were analyzed using X-ray fluorescence (XRF) spectrometry at the Australian Laboratory Services’ (ALS) Chemex (Guangzhou) Co. Ltd., Guangzhou, China, with analytical precision better than 5%. Trace elements were analyzed using Agilent 7500a ICP-MS after powder samples digested by HF + HNO3. Standards OU-6 (slate), AMH-1 (Andesite), and GBPG-1 (plagiogneiss) were analyzed simultaneously to monitor the data quality. The analytical precisions for most elements are better than 10%.
Whole rock Sr-Nd isotopes were analyzed using Finnigan Triton thermo-ion mass spectrometer at the GPMR following procedure of Gao et al. (2004) [28]. 146Nd/144Nd and 88Sr/86Sr values were normalized to 0.7219 and 8.3752, respectively, to correct mass fractionation. Standard samples of NBS987 and BCR-2 were analyzed to monitor the instrument working conditions. The precisions for 87Rb/86Sr, 147Sm/144Nd are better than 1% and 0.5%, respectively. The present-day (147Sm/144Nd)DM (0.2137) and (143Nd/144Nd)DM (0.51315), and decay constants of 87Rb (1.42 × 10⁻¹¹ year−1) and 147Sm (6.54 × 10⁻¹² year−1), are used for calculating Nd two-stage model ages (T2DMNd), initial 87Sr/86Sr and εNd(t) [29,30].

5. Results

5.1. Zircon U–Pb Ages

Zircon U–Th-Pb isotopic data of the Delong quartz diorite (DB042-2; N 35°38′00″, E 98°28′17″) and mafic enclave (DB041-1; N 35°37′58″, E 98°28′20″) are summarized in Table S1 and are illustrated together with CL images of representative zircons in Figure 3. Zircon grains from the quartz diorite and mafic enclave are transparent and colorless, with most of those from the quartz diorite being euhedral and those from mafic enclave being subhedral. Most of the zircon grains from the quartz diorite are prismatic in shape and many of those from the mafic enclave are columnar. The lengths of the zircons from the two samples are about 100~300 µm. Ring-like oscillatory zonings are notable for zircons from the quartz diorite, while band-like zonings are always observed in zircons from the mafic enclave (Figure 3A).
Zircons from both samples show high Th/U ratios (0.49~1.10 and 0.42~1.43, respectively; Table S1), implying that they are magmatic in origin [31]. Sixteen zircon grains from the quartz diorite were selected for U-Th-Pb analyses and gave 206Pb/238U ages of ca. 231~236 Ma and a weighted mean 206Pb/238U date (excluded one discordant spot) of ca. 234 ± 1 Ma (MSWD = 0.26; n = 15; Figure 3B). Twenty-two spots of zircon grains from the mafic enclave were analyzed and yielded a 206Pb/238U age of ca. 231~236 Ma, producing a weighted mean 206Pb/238U age of ca. 234 ± 1 Ma (MSWD = 0.42; n = 22; Figure 3C). This age is identical with that of the quartz diorite within the error range. These ages imply that the quartz diorite and mafic enclaves crystallized contemporaneously.

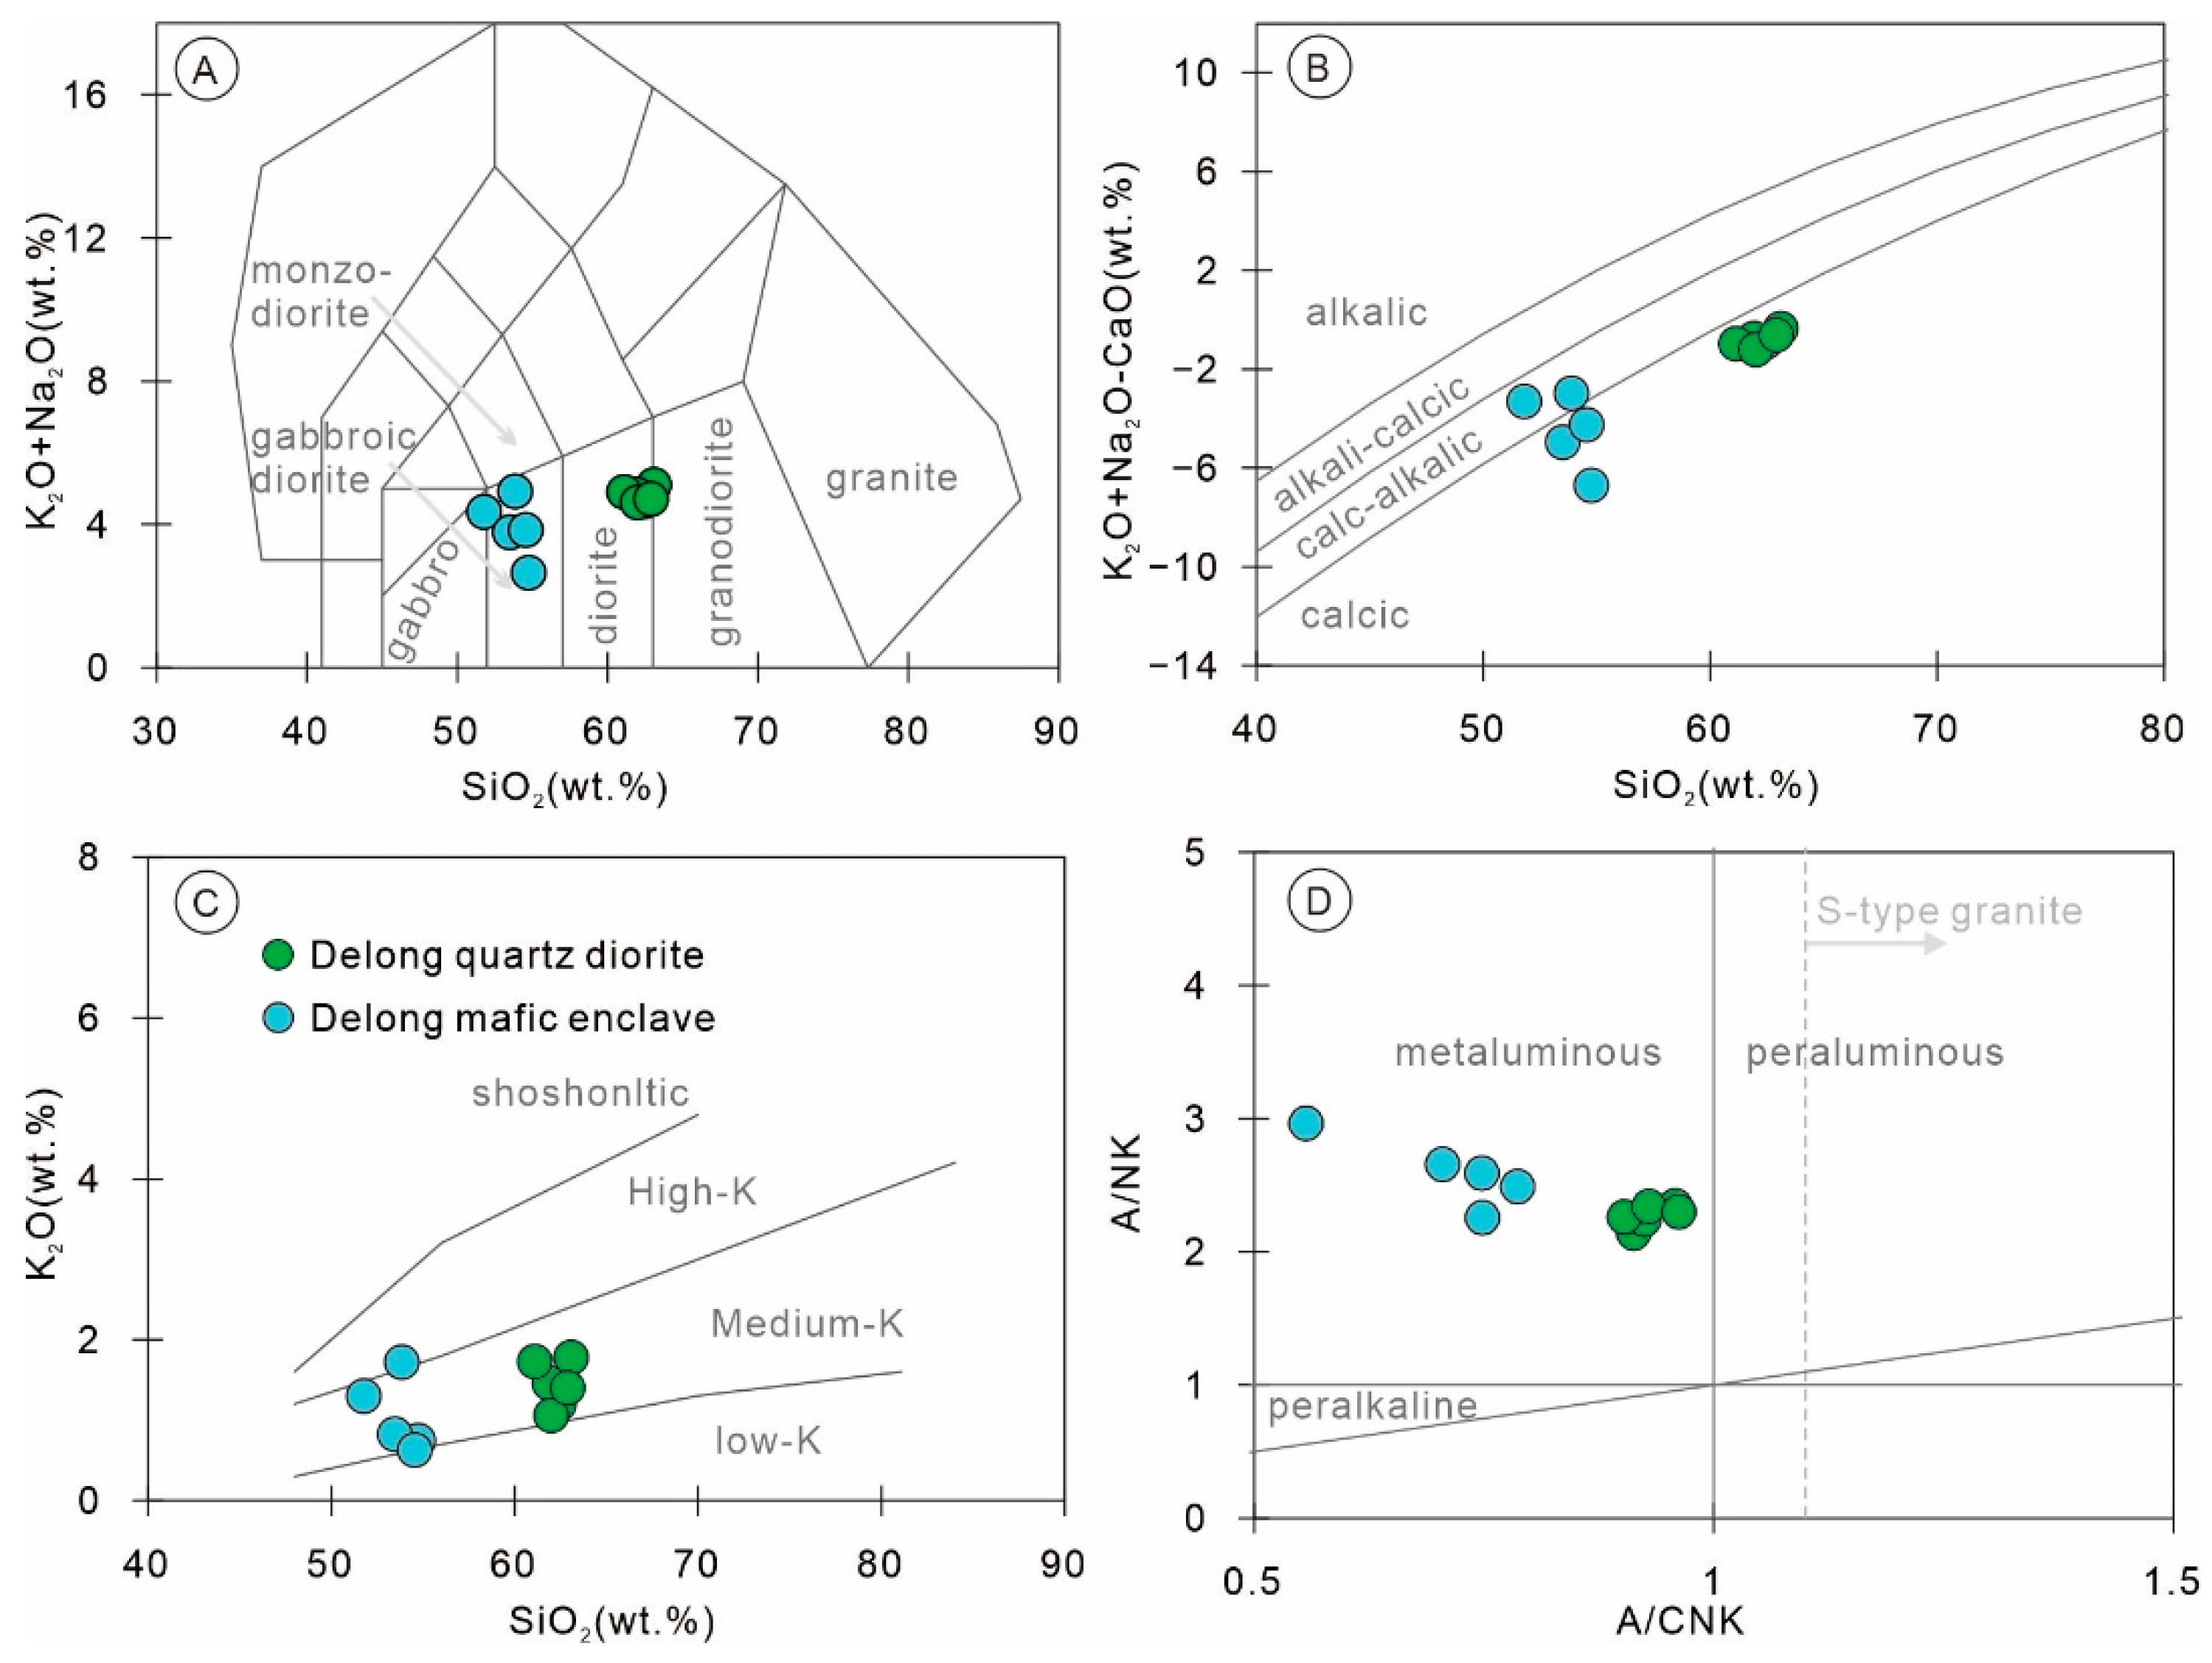
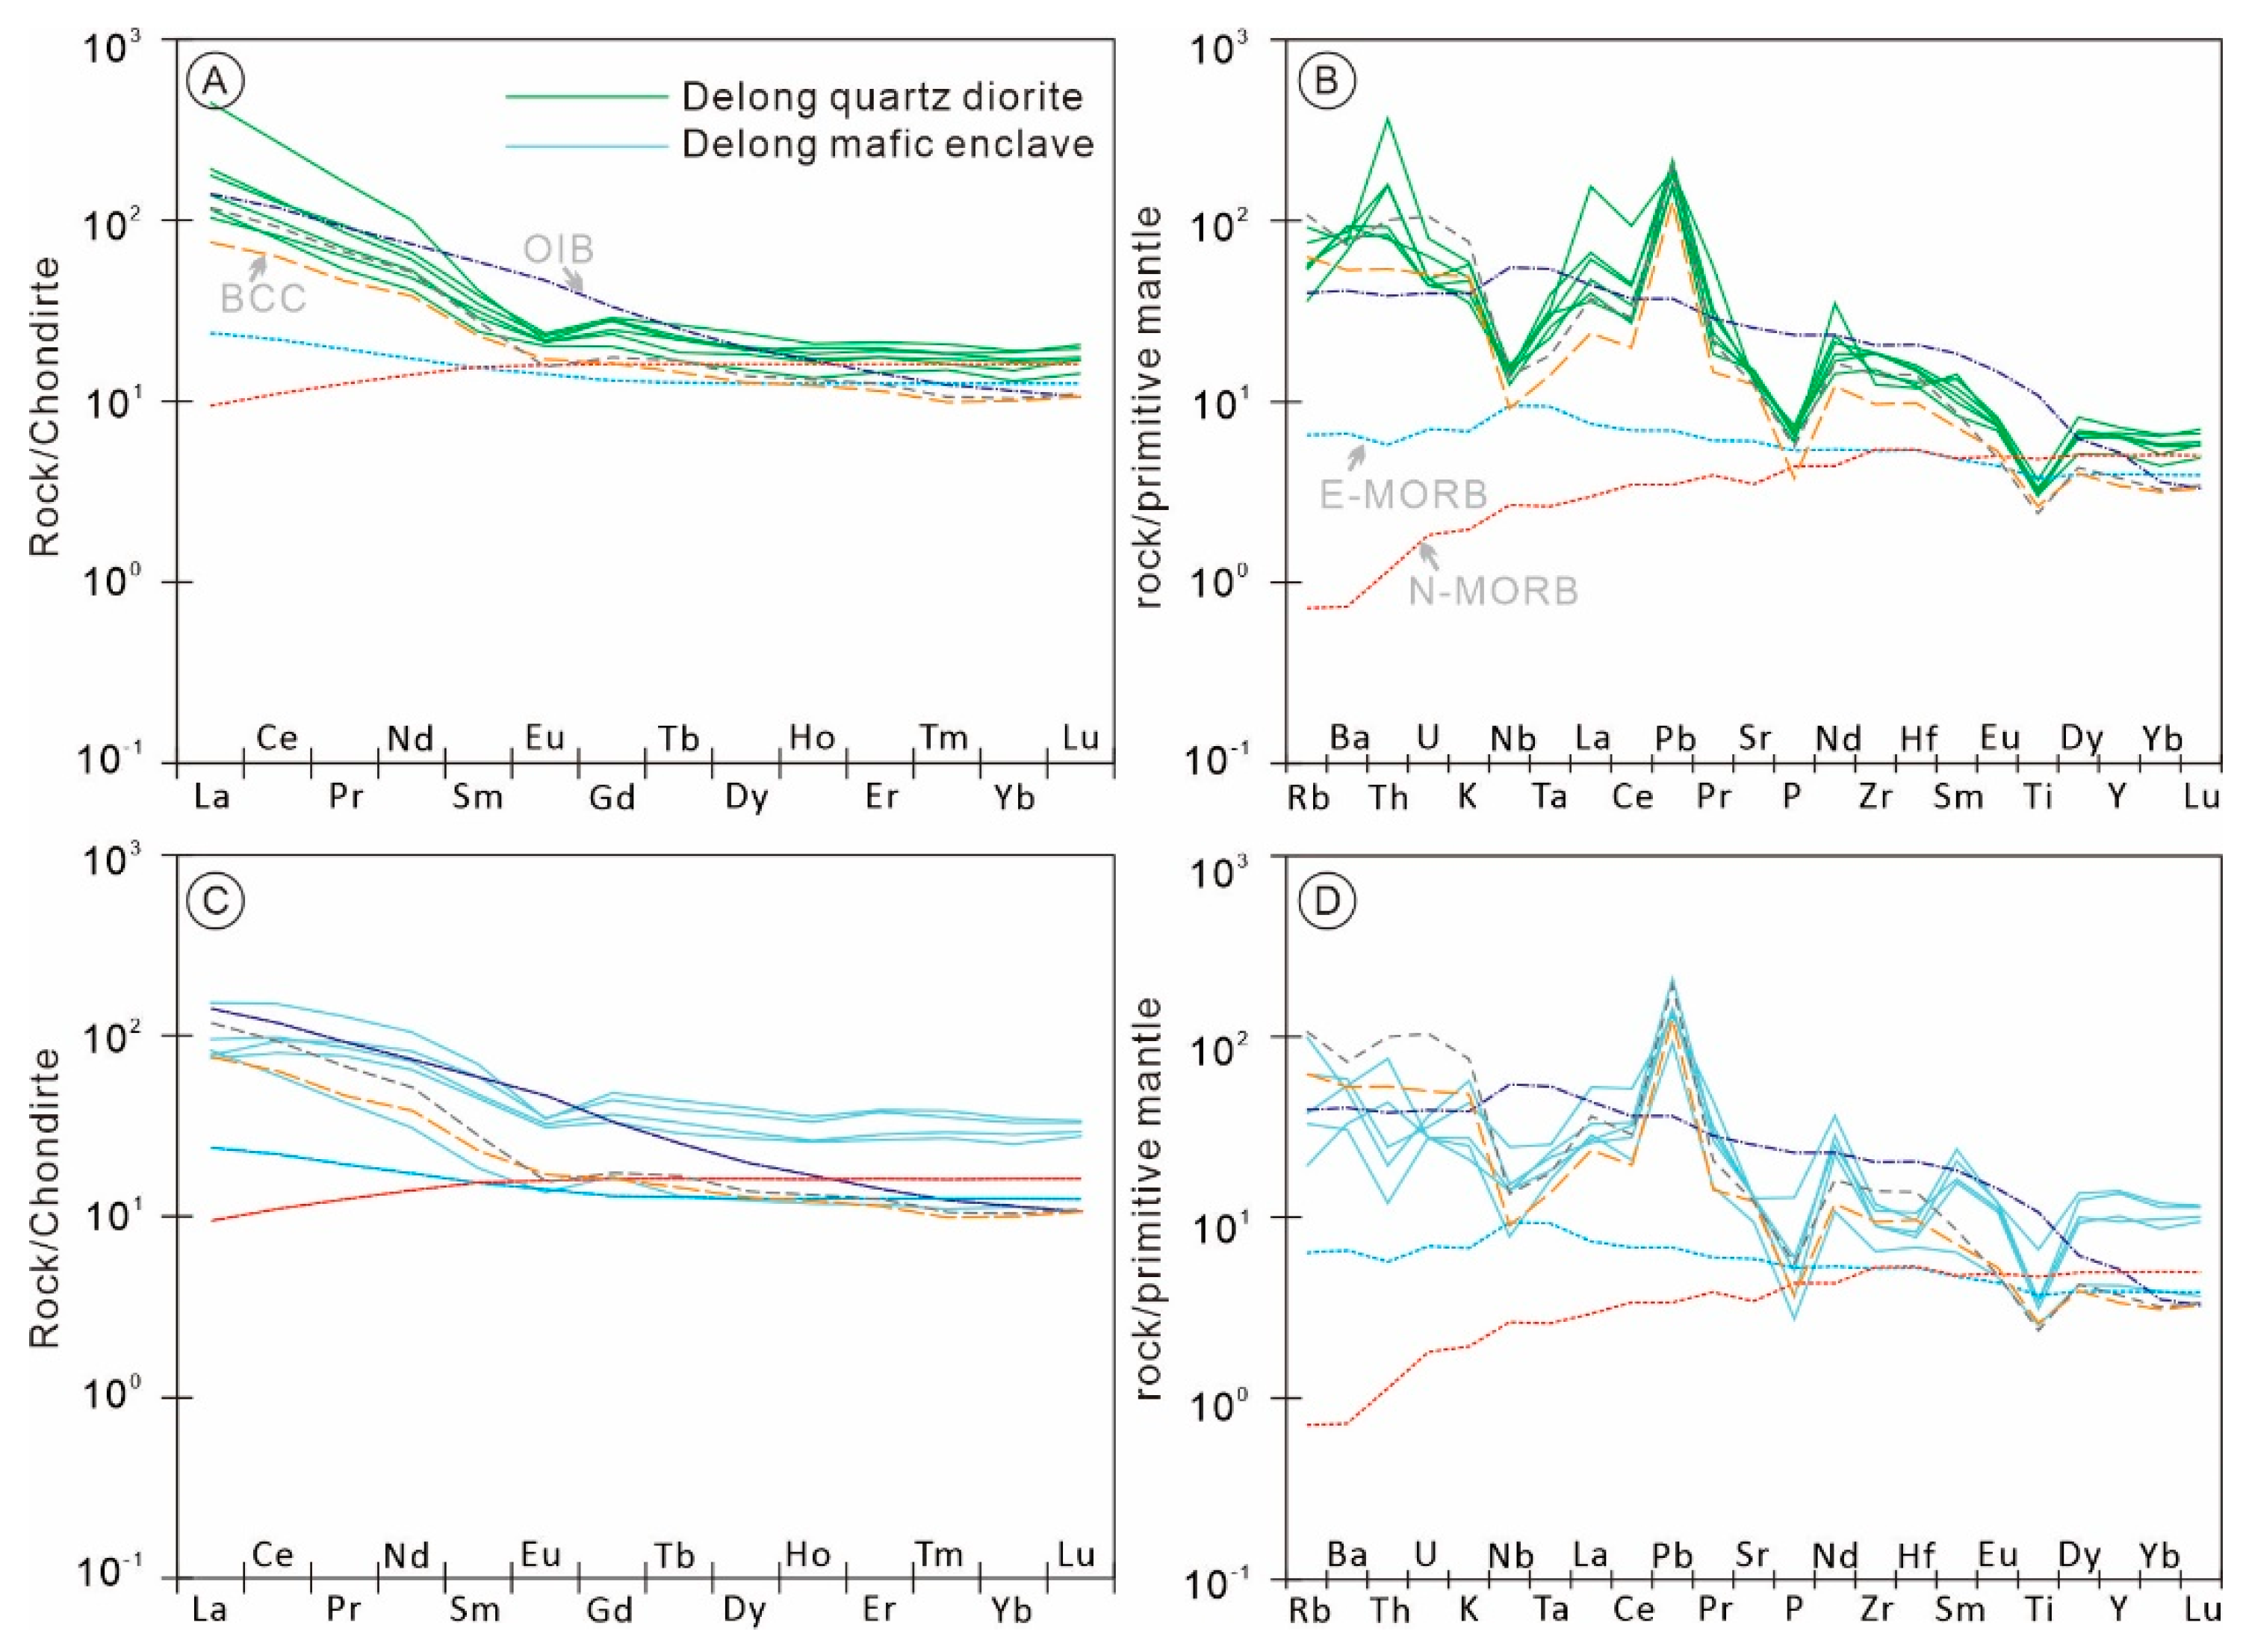
5.2. Major and Trace Element Geochemistry

Major and trace element data for the Delong quartz diorite and mafic enclaves are listed in Table S3 and illustrated in Figure 4 and Figure 5. Samples from the quartz diorite show small variation in SiO2 contents (61.1~63.1 wt.%), with moderate variation in Fe2O3T (6.02~7.16 wt.%), CaO (5.33~5.88 wt.%), and total alkali (Na2O + K2O = 4.62~5.11 wt.%), and high variation in MgO (1.95~2.79 wt.%). In the Na2O + K2O vs. SiO2 (TAS) diagram, all samples are plotted in the diorite field or the boundary between diorite and granodiorite (Figure 4A). The diorite shows calcic (Figure 4B), medium-K (Figure 4C), and metaluminous (Figure 4D) characteristics. In comparison, the mafic enclaves have lower SiO2 (51.8~54.7 wt.%) and total alkali (2.65~4.92 wt.%) and higher Fe2O3T (8.56~12.08 wt.%), CaO (7.67~9.36 wt.%), and MgO (4.30~9.34 wt.%). In the TAS diagram, all mafic enclaves fall in the gabbroic diorite field or the boundary between gabbroic diorite and gabbro (Figure 4A). The mafic enclaves also display medium-K (Figure 4C) and metaluminous (Figure 4D) characteristics, but are more alkalic (Figure 4B).
The quartz diorites and mafic enclaves have total rare earth element (REE) contents of 119.59~361.26 ppm and 90.69~238.90 ppm (Table S2), respectively. Both of them show negative Eu anomalies (Eu/Eu* = 0.62~0.91 and 0.59~0.79, respectively), enrichment, and notable fractionation of light REE (LREE), but inapparent fractionation of heavy REE (HREE) in the chondrite-normalized REE diagrams (Figure 5A,C). In the primitive mantle-normalized trace elements spider diagrams, the quartz diorites and mafic enclaves notably display negative Nb, Ta, P, and Ti anomalies, and positive Pb anomalies, which are similar to that of arc-related rocks (Figure 5B,D).

5.3. Mineral Chemistry and Crystallization Conditions
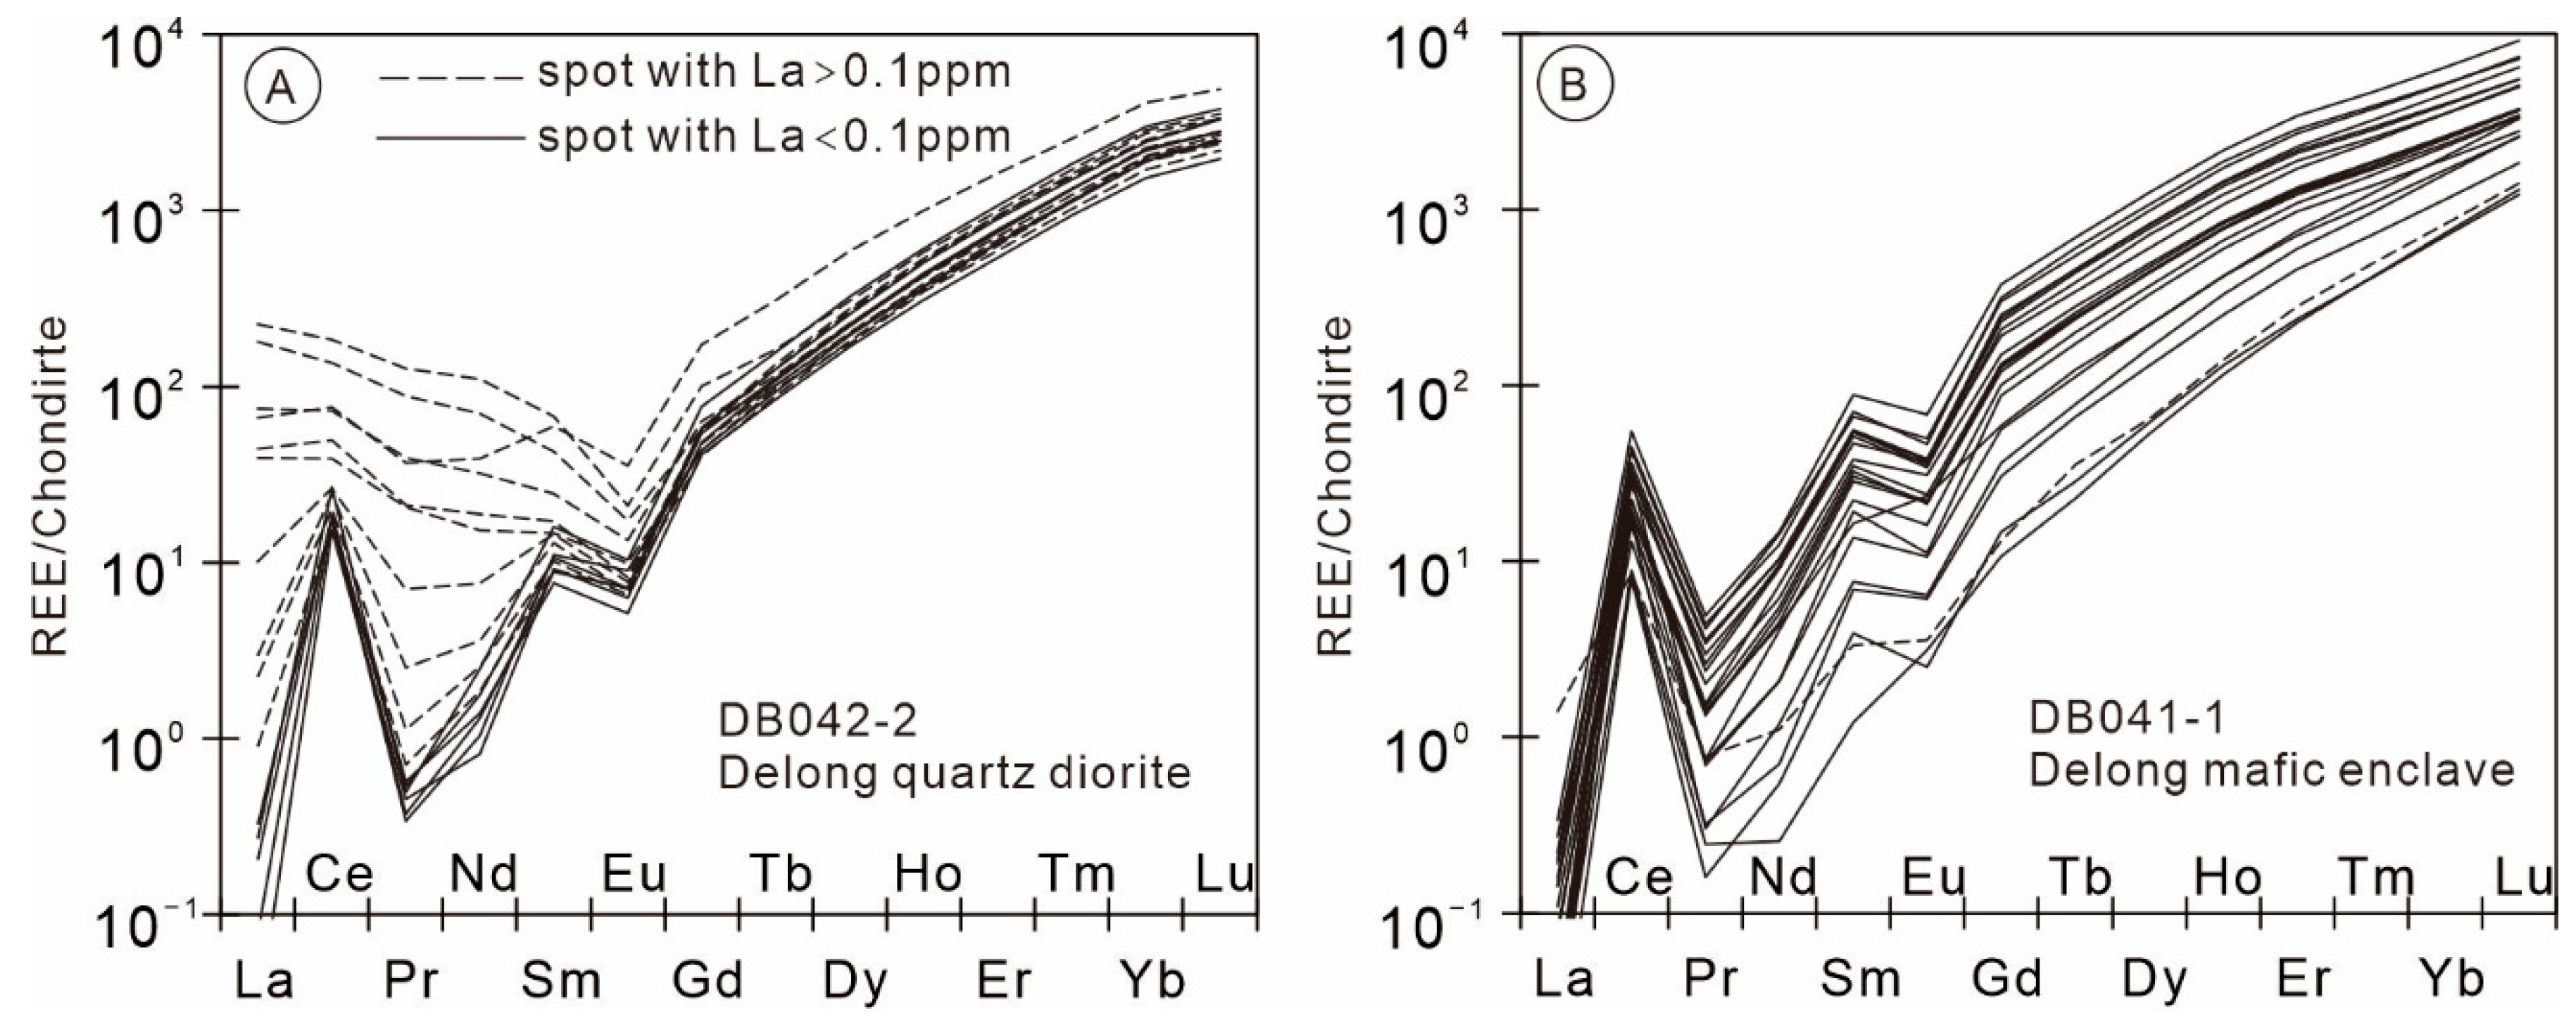
5.3.1. Zircon

Zircon grains from both the Delong quartz diorite and mafic enclave show relatively higher HREE than LREE and negative Eu anomalies (Figure 6 and Table S3). All zircons from the mafic enclave display positive Ce anomalies, while some of those from the quartz diorites show weak to no positive Ce anomalies (Figure 6). The zircon Nb/Ta ratios of the quartz diorite and mafic enclave are of 1.45~2.10 and 1.04~2.69, respectively. Based on Ti contents of the zircons, the zircon crystallization temperature (TZircon-Ti) is estimated at 638~741 °C for the quartz diorite and 627~817 °C for the mafic enclave [38]. The zircon Ce(IV)/Ce(III) ratios are estimated based on zircon REE contents and Lattice strain model [39,40] and are of 17.6~351.5 for the quartz diorite and 44.4~451.6 (except one spot with very high value of 1906.2) for the mafic enclave (Table S3; Figure 7). The Logf(O2) values of the quartz diorite and mafic enclave are calculated follow the formula described by Trail et al. (2011) [41] and estimated at −19.28~−7.7 and −15.58~−5.33, respectively. The ∆NNO (nickel–nickel oxide buffer) of the quartz diorite and mafic enclave, calculated based on zircon Eu anomalies [41], are of 1.46~4.34 and 2.06~7.34, respectively.

5.3.2. Hornblende

Hornblende grains from the quartz diorite and mafic enclaves show similar chemical compositions. They are calcic (Figure 8A) and have Mg/(Mg + Fe2+) around 0.5, belonging to magnesiohornblende and ferrohornblende [47] (Figure 8B). Based on chemical composition of the hornblende grains, the crystallization pressure and temperature, oxygen fugacity (Log(fO2)), and water contents of corresponding melts are estimated at 113~203 Mpa, 791~845 °C, −13.56~−12.50, and 5.3~6.9 wt.% for the quartz diorite, and 122~146 Mpa, 782~816 °C, −13.83~−13.35, and 6.1~7.3 wt.% for the mafic enclaves (Table S4 and Figure 9), respectively. For the same amphibole grains from the quartz diorite, the inner zones always show slightly higher Mg/(Mg + Fe2+) (0.47~0.67 vs. 0.50~0.51) and ∆NNO (0.24~0.78 vs. −0.22~−0.14), and lower crystallization temperature (791~828 °C vs. 836~845 °C) than the corresponding outer zones, the latter of which are similar with those of amphibole from the mafic enclaves (Table S4).

5.3.3. Biotite

The biotite from the quartz diorite and mafic enclaves have relatively high FeO (20.72~28.82 wt.%) and low MgO (8.92~12.38 wt.%) and are classified as siderophyllite (Figure 10A). Most of the biotite grains show high contents of TiO2, indicating their primary origin (Figure 10B). One biotite grain from the mafic enclaves maybe altered and thus display low TiO2 content (Figure 10B). The biotite crystallization temperature and pressure, calculated by the following formulas described by Henry et al. (2005) [51] and Uchida et al. (2007) [52], are of 680~710 °C and 134~161 Mpa (excluding altered grain), respectively. The oxygen fugacity of the melt from which the biotite crystallized is around NNO (Figure 11A).

5.3.4. Plagioclase

Plagioclase from the quartz diorite and mafic enclaves (plagioclase xenocryst) show variable anorthite (An) contents, with those from the quartz diorite between 34~49 and mafic enclaves between 36~47 (Table S6). Generally, plagioclase grains from both the quartz diorite and mafic enclaves show variable An for a single grain, with some mantles displaying higher An than the corresponding rims and cores (Table S6 and Figure 11B).

5.4. Whole Rock Sr-Nd Isotopes and Zircon Lu–Hf Isotopes

The samples from the Delong quartz diorite show 87Rb/86Sr ratios of 0.32~0.62 with high initial 87Sr/86Sr (0.712584~0.713182; t = 234 Ma) and enriched εNd(t) (−6.4~−5.7; t = 234 Ma; Figure 12A). The Nd two-stage model ages (T2DMNd) vary from 1468 to 1527 Ma (Table S7). In comparison, the mafic enclaves have wider range of 87Rb/86Sr ratios (0.13~0.67), similar initial 87Sr/86Sr (0.712463~0.713093, t = 234 Ma), but more enriched εNd(t) (−6.0~−6.4; Figure 12A) and older T2DMNd (1496–1524 Ma; Table S7).
176Hf/177Hf of the quartz diorite and mafic enclave are of 0.282576~0.282717 and 0.282393–0.282505, respectively. The quartz diorites have enriched to depleted εHf(t) of −2.3~+2.6 and Hf two-stage model ages (T2DMHf) of 967~1241 Ma. In contrast, the mafic enclaves have more enriched εHf(t) (−4.8~−9.4) and older T2DMHf (1378~1632Ma).

6. Discussion

6.1. Magma Mixing/Mingling

Mafic enclaves are prevailing in many Permian-Triassic intermediate-felsic intrusions in the EKO [7,8,67]. Most of these mafic enclaves show typical igneous textures, precluding their xenolith (captured from country rocks) or restite (captured from source regions) origins, but of rather magmatic origin [7,8,15,67]. These magmatic mafic enclaves together with their host intrusions are interpreted to be formed by mixing/mingling of magmas from different sources (e.g., crust and mantle) [7,15] or by self-mixing of co-genetic cumulates and magma [67].
The mafic enclaves in the Delong quartz diorite exhibit an elongated shape with no evidence of solid-state deformation (Figure 2A–E). Quartz and feldspar xenocrysts likely from the quartz diorite occur occasionally in the mafic enclaves (Figure 2A,B). Some small felsic enclaves, which should be from the host quartz diorite, can also be observed in the mafic enclaves (Figure 2E). These pieces of petrographic evidence imply that the Delong mafic enclaves are magmatic in origin and magmas deriving the mafic enclaves and the quartz diorite should mix/mingle before solidification, similar with most of those enclaves and corresponding host intrusions in the EKO [7,8,15,67].
Isotopes are robust tool for distinguishing between the aforementioned two mechanisms (mixing/mingling of magmas from different sources vs. self-mixing) for the Delong intrusion. The Delong quartz diorite and mafic enclaves show consistent zircon U-Pb ages (Figure 3) but distinct zircon εHf(t) values (−2.3~+2.6 vs. −9.4~−4.8; Figure 12B), indicating that they crystallized from magmas derived from different sources. Several observations supporting the above contention are listed as follows: (1) the higher εNd(t) (−5.8~−5.7; Table S7) of the quartz diorite samples (exclude DB040-1) than that of mafic enclaves (−6.4~−6.0; Table S7) in general; (2) the distinct Nb/Ta ratios of the mafic enclaves (averaging 12.3) and quartz diorite (averaging 8.6); (3) the higher An of some plagioclase mantles than corresponding cores and rims (inverse zoning) of the same grains [68] (Figure 11B); (4) the lower crystallization temperature of the cores than mantles (791~828 °C vs. 836~845 °C) of amphiboles from the quartz diorite; (5) zircons from the mafic enclave show higher Ti (5.16 ppm vs. 3.73 ppm) and TZircon-Ti (725 °C vs. 699 °C), lower Nb (1.21 ppm vs. 1.99 ppm) and Ta (0.60 ppm vs. 1.15 ppm) contents, and lower δYb (δYb = YbN/(TmN × LuN)0.5; 1.17 vs. 1.35) than that of zircons from the quartz diorite in general (Table S3 and Figure 6). Taken together, we conclude that the Delong quartz diorite and mafic enclaves were formed by mixing/mingling of magmas from different sources rather than through self-mixing of co-genetic cumulate and magma.
As mentioned above, the magmas of the mafic enclaves and quartz diorite mixed/mingled during magma evolution. It is unclear whether the magmatic process is dominated by mixing or mingling. We tend to believe that mingling instead of mixing could play significant role during the magma evolution considering the notably compositional gap between the mafic enclaves and quartz diorite (Figure 4 and Table S2). The narrow compositional variation of major elements of the mafic enclaves and quartz diorite also suggest mingling dominated the magmatic process (Figure 4 and Table S2). The distinct zircon εHf(t) for the Delong mafic enclaves and quartz diorite further suggest that chemical mixing is limited. Moreover, it is believed that magma mixing is limited during injection of mafic magma into felsic magma because of the high viscosity of felsic magma [69,70]. Overall, we believe mingling instead of mixing may dominate the magmatic process and that the quartz diorite and mafic enclaves can by and large represent the compositions of the felsic causative magma and mafic causative magma, respectively.

6.2. Sources of the Mafic Enclaves and Quartz Diorite

6.2.1. Sources of the Mafic Enclaves

The mafic enclaves in the Delong quartz diorite are gabbroic diorite in composition (Figure 4A) and the corresponding rock-forming magma should be more mafic (maybe basaltic) considering magma mingling. In comparison to the host quartz diorite, the higher Fe2O3 (8.56~12.08 wt.%), MgO (4.30~9.34 wt.%), and Mg# (42~69), together with the nearly basaltic composition of the mafic enclaves, indicate that the rock-forming magma should originate from mantle. However, the enriched initial 87Sr/86Sr (0.712463~0.713093), εNd(t) (−6.0~−6.4), and εHf(t) (−4.8~−9.4) of the mafic enclaves, distinct from mantle-derived mid-ocean ridge basalt (MORB) and ocean island basalt (OIB) from the EKO [71], imply crust material should also be involved (Figure 12).
Crust assimilation during magma evolution or partial melting of a mantle source region incorporating enriched terrigenous materials could generate magma with the observed enriched Sr-Nd-Hf isotope composition. The concentrated whole rock initial 87Sr/86Sr and εNd(t) of the mafic enclaves imply that crust assimilation should play a limited role during magma evolution (Table S7). The scarcity of inherited zircon in the mafic enclaves also implies limit crust assimilation (Figure 3). In addition, the enrichment of LREE, depletion of HREE and Nb, Ta, Ti, Zr, Hf, and P indicate that the mafic enclaves could be sourced from enriched mantle (Figure 5), which always has enriched terrigenous sediments involved [8,67]. The mafic enclaves display similar (87Sr/86Sr)i and εNd(t) with the contemporaneous enriched mantle-derived mafic rocks from the EKO, indicating their enriched mantle origin (Figure 12). The Sr-Nd-Hf isotopic characteristics of the mafic enclaves, which could be explained by partial melting of a mixture of a depleted end-member and an enriched end-member (Figure 12), also support the enriched-mantle (with enriched subducting sediment involved) origin of the mafic enclaves.

6.2.2. Sources of the Diorite

The Permian-Triassic intermediate-felsic intrusions are widespread in the EKO [9] and their source regions are discussed in detail [7,8,14,15,67]. Three possible source regions including subducting slab, enriched mantle, and LCC are at present proposed for as their rock-forming magmas, although these rocks share similar Sr-Nd-Hf isotopic compositions [7,8,14,15,67]. These source regions should also be applied to the Delong quartz diorite, which displays similar Sr-Nd-Hf isotope characteristics with contemporaneous intermediate-felsic intrusions in the EKO ([7,14,61,67] and references therein). In the following, we will discuss which of the three aforementioned source regions is the most reasonable source for the Delong quartz diorite.
It is proposed that the Paleo-Tethys Ocean in the EKO had closed before ~240 Ma and continental collision and subsequent post-collisional extension occurred during 240~215 Ma [7,8,10,16], and thus it is unlikely for the slab to melt at ~234 Ma to produce the Delong quartz diorite. Moreover, subducting slab-derived rocks always show high Sr/Y and (La/Yb)N [72], as do those contemporaneous slab-derived rocks in the adjacent area of the Delong [8]. However, the Sr/Y (8.6~13.5) and (La/Yb)N (5.6~27.2) of the Delong quartz diorite are very low (Table S2), precluding the subducting slab as the source region of the quartz diorite. Melting of enriched mantle usually produces basaltic magma, such as the Annage hornblende gabbro (242 ± 2 Ma) in adjacent area of the Delong [61], and crystal fractionation of this magma could generate andesitic to granodioritic magma similar to Delong quartz diorite. However, based on numerical calculation [73], crystal (e.g., amphibole) fractionation of water-rich basaltic magma would significantly increase the Sr/Y and La/Yb ratios of the residual magma, which is opposite to the extremely low Sr/Y (8.6~13.5) and (La/Yb)N (5.6~27.2) features of the Delong quartz diorite (Table S2). In addition, the enriched mantle-derived mafic enclaves discussed above show distinct Nd-Hf isotopic compositions with the Delong quartz diorite (Figure 12), being against a shared source for them.
The low MgO content (1.95~2.79 wt.%; Table S2) and Mg# (38~44; Table S2) of the Delong quartz diorite are identical to those of granodiorites (Mg# = 41~46) derived from mafic lower continental crust [7], but distinct from the Wulonggou enriched mantle-derived diorite (~215Ma, Mg# = 49~54) in the EKO [74], implying that LCC instead of enriched mantle is a more plausible source for the andesitic to granodioritic Delong quartz diorite [7]. In addition, the Sr-Nd isotopes of the Delong quartz diorite are indistinguishable from the LCC-derived granitoids in the EKO (Xiong et al., 2014 [7] and reference therein; Figure 12), suggesting a sharing source for them. Moreover, considering the relatively high εHf(t) of the Delong quartz diorite (Figure 12; εHf(t) = −2.3~+2.6), a model of melting of LCC with mixed depleted mantle-derived juvenile and old (enriched) material could explain the observed Sr-Nd-Hf isotopic signatures of the Delong quartz diorite (Figure 12). It should be added that the EKO had experienced multi-stage ocean-continent transitions [7,8,13] and depleted mantle-derived juvenile material should be added to the LCC commonly during these processes. Thus, source regions with mixed juvenile and old materials are common in the LCC in the EKO. In summary, we preclude enriched mantle and subducting slab, but tend to contend LCC with mixed old and juvenile material as the source of the Delong quartz diorite.

6.3. Magma Fertility and Gold-Copper Mineralization Potential of the Eastern EKO

As mentioned above, factors such as magma source region, intra-crustal magmatic process, water content, and oxygen fugacity control generation of porphyry deposits. The Delong quartz diorite and mafic enclaves were derived from enriched mantle and lower continental crust with juvenile materials, as discussed above. These source regions are also favorable for porphyry deposits [5,75]. Here, we estimate the water content and redox state of the Delong intrusion and similar contemporary rocks in the eastern EKO to evaluate the mineralization potential there.

6.3.1. Water Content

The water contents of primary magmas are difficult to be accurately estimated; however, a few methods based on mineral composition and geochemistry are used to impose rough constraint on magmatic water contents [48,76]. Both the Delong quartz diorite and mafic enclaves show high abundance of dark hydrous minerals (amphibole and biotite) (Figure 2). Some of the dark grains (amphibole and biotite) are enclosed by plagioclases (Figure 2C,G), implying their no later crystallization than plagioclases. This phenomenon indicates that both the Delong quartz diorite and mafic enclaves should come from hydrous melts, since high water content would suppress crystallization of plagioclase [77,78]. In addition, the nearly negative correlation between Dy/Yb and SiO2, and positive correlation for Eu/Eu* versus SiO2 and Sr/Y versus SiO2, suggest no notable plagioclase but abundant amphibole fractionation during early magma evolution (Table S2). This further prove the quartz diorite and mafic enclaves derived from hydrous melts. Further, water contents calculated based on amphibole composition are 5.3%~6.9% and 6.1%~7.3% for the quartz diorite and mafic enclaves, respectively (Table S4), indicating water-rich characteristics for both causative magmas (Figure 9C).

6.3.2. Oxygen Fugacity

Mineral compositions can impose first-level constraint on magma redox state. The occurrence of magnetite in the Delong quartz diorite and the mafic enclaves suggest that the causative magmas should be oxidized (Figure 2G–I).
Trace elements with variable valences can also be used to estimate the redox state of a magma. Among them, Eu and Ce in zircon are generally used to quantitively calculate the oxygen fugacity of a magma, especially in porphyry-copper systems [39,44]. In magmatic systems, both Eu and Ce show two valences (Eu3+/Eu2+ and Ce4+/Ce3+) and the high valence cations of them substitute into zircon lattice more easily than the low valence cations [44]. Oxidized conditions would increase the Eu3+/Eu2+ and Ce4+/Ce3+ ratios of magmas and thus could enlarge both the partition coefficients of the Eu and Ce in zircon/magma systems. Based on the above theory, it is reasonable to calculate oxygen fugacity by using partitioning anomalies of Eu and Ce in zircon/magma systems [39,44]. Using the above method, the Delong quartz diorite and mafic enclaves yield an average ΔNNO of 2.65 and 3.70, respectively (calculated from Eu anomalies), indicative of oxidized conditions (Figure 7C). However, their Log(fO2) values calculated from Ce partitioning anomalies show wide ranges, which could be caused by incorrect data due to mineral inclusions enclosed in zircons or fluid-zircon interaction [40,42]. Here, as shown in Figure 7, we apply zircon La contents (La < 0.1ppm for inclusion-free zircon) and Y/Ho ratios (>34 for fluid involvement) as an index to preclude possible incorrect analysis data [40,42]. After the above data screening, the Log(fO2) values of the Delong quartz diorite concentrate are between −14.20 and −7.70, while that of the mafic enclaves are between −15.58 and −5.33, indicating oxidized conditions. Another method calculating oxygen fugacity from zircon U, Ti, and Ce is also applied to our samples [79] and yield an average ΔFMQ (fayalite–magnetite–quartz buffer) of 0.66 and 0.60 (inclusion-free zircons) for the Delong quartz diorite and mafic enclaves (Table S3), respectively, adding evidence to the above conclusion.
Major elements of mafic minerals, such as amphibole and biotite, can also offer some information for the magmatic redox states. The amphiboles from the Delong quartz diorite and mafic enclaves yield an average ΔNNO of 0.18 and 0.28, respectively, implying oxidized conditions during amphibole crystallization (Figure 9B; Table S4). The biotites from them yield a redox state around NNO (Figure 11A), similar to that of the amphiboles. Although the trace elements of zircons and major elements of amphiboles and biotites from the Delong quartz diorite and mafic enclaves yield slightly different oxygen fugacity, taken together they indicate oxidized conditions for the causative magmas.

6.3.3. Gold-Copper Mineralization Potential of the Eastern EKO

Late Permian-Triassic intermediate-felsic magmatic rocks with mafic enclaves enclosed are widespread in the EKO [8,10] (Figure 1B). These rocks were formed during the subduction of the Paleo-Tethys Ocean and subsequent syn- to post-collision [8,67]. A small number of porphyry and skarn mineralization occurrences/deposits genetically related with the Triassic syn- to post-collisional magmatic rocks are reported in the west and east of the EKO (Figure 1A); among them, only two located in the east end of the EKO are medium-size porphyry deposits [11,12,19]. The scarcity of large to super-large porphyry Cu (Au-Mo) deposits in the west of the EKO could be due to the low magmatic oxidation states and low water contents of the Triassic syn- to post-collisional magmatic rocks there [12]. Whether there is potential for large/super-large porphyry deposits in the eastern EKO and the reasons for a lack of large to super-large porphyry Cu (Au-Mo) deposits in the eastern EKO are still unclear.
The Delong quartz diorite and mafic enclaves from the east of the EKO show water-rich and oxidized characteristics, as discussed above (Figure 7 and Figure 9). Generally, the amphibole compositional data and zircon trace elemental data compiled from the Middle-Late Triassic magmatic rocks in the eastern EKO also indicate their water-rich and oxidized characteristics (Figure 7 and Figure 9), although these rocks are compositionally different from the Delong intrusion to some extent [8,11,49,80]. These characteristics are notably different from those of Triassic magmatic rocks with low magmatic oxidation states and low water content in the west of the EKO [12], implying better potential for porphyry deposits in the eastern EKO. Although many intrusions in the eastern EKO have no available data for evaluating their oxygen states and water contents, our data together with available published data indicate that the partial melting of the sub-continental mantle and lower crust underlying the eastern EKO could generate primary magmas favorable for metal (e.g., Cu and Au) to retain and enrich during magmatic evolution [4] and thus indicate potential for porphyry deposits in the eastern EKO. The occurrence of the two Late Triassic medium-size porphyry Cu (-Au) deposits (Tongyugou and Saishitang; Figure 1B) and the Delong Au-Cu deposit (Figure 1C) in the east end of the EKO also support the above speculation. It also should be noticed that several Middle-Late Triassic gold deposits in the east and middle areas of the EKO are considered to be magmatic-origin [81,82,83], which imply that the Middle-Late Triassic magmas could reserve metal during magmatic evolution. Some fertility indicators are also applied to zircons from the Middle-Late Triassic magmatic rocks in the eastern EKO (Figure 13). Among them the zircon Eu/Eu* (>0.3) and (Eu/Eu*)/Y (>0.0001) are the best fertility indicators [84]. Most of the Middle-Late Triassic magmatic rocks in the eastern EKO show high Eu/Eu* and (Eu/Eu*)/Y, which is consistent with fertile porphyry Cu ± Au ± Mo systems [78,84]. The low zircon Dy/Yb (<0.3) and positive correlation between (Eu/Eu*)/Y and (Ce/Nd)/Y also indicate the fertility of these magmatic rocks (Figure 13B), although some of these rocks show relatively low (Ce/Nd)/Y [84]. We also have plotted Eu/Eu* and temperature (T(°C)) vs. Hf commons for zircon data (Figure S3). These figures show the following: (1) positive relationship between temperature and Hf content; (2) relatively constant Eu/Eu* as the zircon Hf content increasing for individual intrusion. These characteristics are consistent with ore-forming intrusions of large/super-large porphyry deposits referred to by Dilles et al. (2015) [85]. Taken together, the eastern EKO have the potential to generate Middle-Late Triassic large to super-large porphyry deposits. The reason why no large to super-large porphyry systems discovered in the eastern EKO so far could be inadequate exploration work, excessive post-ore denudation, and so on, which requires further study to determine and is beyond the scope of this study.

7. Conclusions

A comprehensive study of petrography, whole-rock elemental and isotopic signatures, and mineral geochemical and isotopic characteristics of the Delong quartz diorite and mafic enclaves in the EKO, together with published data, leads to the following conclusions:
The Delong quartz diorite and mafic enclaves intruded in the Late Triassic (~234 Ma). They are calc-alkalic, medium-K, and metaluminous. A notable compositional gap and different Nd-Hf isotopic compositions have been observed between them, indicating the mingling of magmas from distinct sources formed the Delong quartz diorite and mafic enclaves.
The Delong quartz diorite shows relatively high SiO2 content and low Mg#. It holds enriched Sr-Nd isotopic characteristics, but relatively depleted Hf isotopes, indicating that it is sourced from the lower continental crust with juvenile materials. In addition, the mafic enclaves hold more enriched isotopic compositions, lower SiO2, and higher Mg#, indicating an enriched mantle source region for them.
The Late Triassic Delong intrusion contains water-rich minerals and magnetite. These, together with chemical compositions of amphibole, biotite, and zircon, indicate water-rich and oxidized characteristics of their rock-forming magmas, as do some Middle-Late Triassic magmatic systems in the eastern EKO. These characteristics imply the potential for porphyry deposits in the eastern EKO.

Supplementary Materials

The following supporting information can be downloaded at: https://www.mdpi.com/article/10.3390/min13091202/s1, Figure S1: (A) Outcrop of the dacite porphyry vein; (B) Outcrop of the dacite porphyry; (C) Potassic granite from drill hole; (D) Sulfide stockworks in potassic granite; (E) Sulfide-vein in granite; (F) Quartz-sulfide stockworks in tuff; Figure S2: QAP diagram for the Delong quartz diorite (after International Union of Geological Sciences). Q-Quartz; A-Alkali-Felspar; P-Plagioclase; Figure S3: (A) T(oC) vs. Hf (ppm) and (B) Eu/Eu* vs. Hf (ppm) diagrams for zircons. Filled labels represent data points with La < 0.1 ppm and Y/Ho < 34 and the unfilled represent the opposite. Data sources, and method for calculating temperature and Eu/Eu* are the same as in Figure 7; Table S1: LA-ICP-MS Zircon U-Pb data of the Delong quartz diorite and mafic enclave; Table S2: Major (%) and trace elements (ppm) data of the Delong quartz diorite and mafic enclaves [37,86]; Table S3: Trace elements (ppm) data of zircons extracted from the Delong quartz diorite and mafic enclaves [37,38,40,41,44,79]; Table S4: Electron microporbe analysis results of amphibole in Delong quartz diorite and mafic enclaves; Table S5: Electron microporbe analysis results of biotite in Delong quartz diorite and mafic enclaves; Table S6: Electron microporbe analysis results of Plagioclase in Delong quartz diorite and mafic enclaves; Table S7: Sr-Nd isotopic compositions of Delong quartz diorite and mafic enclaves [29,30]; Table S8: Hf isotopic data for zircons of the Delong quartz diorite and mafic enclaves [25,26,27].

Author Contributions

Conceptualization, J.C., L.F. and C.L.; investigation, J.C., X.Z., Y.X. and H.G.; writing—original draft preparation, J.C.; writing—review and editing, J.C., L.F. and J.M.; funding acquisition, J.C. and L.F. All authors have read and agreed to the published version of the manuscript.

Funding

This research was supported by the National Natural Science Foundation of China (No. 42102088) and funds from the East China University of Technology (2022NRE33 and DHBK2018009).

Data Availability Statement

The original contributions presented in the study are included in the article/Supplementary Material.

Acknowledgments

We appreciate the valuable help of Huiwen Bai, Deding Kong, Guanghong Chen, Yongjun Qi from the China University of Geosciences and Wenjun Li from the third Nonferrous Geological Exploration Institute of Qinghai Province during the fieldwork. We also thank the editor and the four anonymous referees for their constructive reviews and suggestions.

Conflicts of Interest

The authors declare no conflict of interest.

References

  1. Sillitoe, R.H. Porphyry Copper Systems. Econ. Geol. 2010, 105, 3–41. [Google Scholar] [CrossRef]
  2. Chiaradia, M. Gold endowments of porphyry deposits controlled by precipitation efficiency. Nat. Commun. 2020, 11, 248. [Google Scholar] [CrossRef]
  3. Lee, C.A.; Tang, M. How to make porphyry copper deposits. Earth Planet. Sci. Lett. 2020, 529, 115868. [Google Scholar] [CrossRef]
  4. Richards, J.P. Porphyry copper deposit formation in arcs: What are the odds. Geosphere 2021, 18, 130–155. [Google Scholar] [CrossRef]
  5. Wang, R.; Weinberg, R.F.; Collins, W.J.; Richards, J.P.; Zhu, D. Origin of postcollisional magmas and formation of porphyry Cu deposits in southern Tibet. Earth-Sci. Rev. 2018, 181, 122–143. [Google Scholar] [CrossRef]
  6. Hou, Z.Q.; Yang, Z.M.; Wang, R.J.; Zheng, Y.C. Further discussion on porphyry Cu-Mo-Au deposit formation in Chinese mainland. Earth Sci. Front. 2020, 27, 20–44, (In Chinese with English Abstract). [Google Scholar]
  7. Xiong, F.; Ma, C.; Zhang, J.; Liu, B.; Jiang, H.A. Reworking of old continental lithosphere: An important crustal evolution mechanism in orogenic belts, as evidenced by Triassic I-type granitoids in the East Kunlun orogen, Northern Tibetan Plateau. J. Geol. Soc. Lond. 2014, 171, 847–863. [Google Scholar] [CrossRef]
  8. Chen, J.J.; Wei, J.H.; Fu, L.B.; Li, H.; Zhou, H.Z.; Zhao, X.; Zhan, X.F.; Tan, J. Multiple sources of the Early Mesozoic Gouli batholith, Eastern Kunlun Orogenic Belt, northern Tibetan Plateau: Linking continental crustal growth with oceanic subduction. Lithos 2017, 292–293, 161–178. [Google Scholar] [CrossRef]
  9. Mo, X.X.; Luo, Z.H.; Deng, J.F.; Yu, X.H.; Liu, C.D.; Chen, H.W.; Yuan, W.M.; Liu, Y.H. Granitoids and crustal growth in the East-Kunlun Orogenic Belt. Geol. J. China Univ. 2007, 13, 403–414, (In Chinese with English Abstract). [Google Scholar]
  10. Dong, Y.; He, D.; Sun, S.; Liu, X.; Zhou, X.; Zhang, F.; Yang, Z.; Cheng, B.; Zhao, G.; Li, J. Subduction and accretionary tectonics of the East Kunlun orogen, western segment of the Central China Orogenic System. Earth-Sci. Rev. 2018, 186, 231–261. [Google Scholar] [CrossRef]
  11. Zhang, J.Y.; Yang, Z.B.; Zhang, H.; Ma, C.Q.; Li, J.W.; Pan, Y.M. Controls on the formation of Cu-rich magmas: Insights from the Late Triassic post-collisional Saishitang complex in the eastern Kunlun Orogen, western China. Lithos 2017, 278, 400–418. [Google Scholar] [CrossRef]
  12. Zhong, S.; Li, S.; Feng, C.; Liu, Y.; Santosh, M.; He, S.; Qu, H.; Liu, G.; Seltmann, R.; Lai, Z.; et al. Porphyry copper and skarn fertility of the northern Qinghai-Tibet Plateau collisional granitoids. Earth-Sci. Rev. 2021, 214, 103524. [Google Scholar] [CrossRef]
  13. Chen, J.J.; Fu, L.B.; Wei, J.H.; Selby, D.; Zhang, D.H.; Zhou, H.Z.; Zhao, X.; Liu, Y. Proto-Tethys magmatic evolution along northern Gondwana: Insights from Late Silurian–Middle Devonian A-type magmatism, East Kunlun Orogen, Northern Tibetan Plateau, China. Lithos 2020, 356–357, 105304. [Google Scholar] [CrossRef]
  14. Chen, J.; Leng, C.; Fu, L.; Zhao, X.; Xing, H. Genesis of Delong Granite in East Kunlun Orogen and Its Implication on the Evolution of Paleo–Tethys Ocean. Earth Sci. 2023, 1–17, (In Chinese with English Abstract). [Google Scholar] [CrossRef]
  15. Xia, R.; Wang, C.; Qing, M.; Li, W.; Carranza, E.J.M.; Guo, X.; Ge, L.; Zeng, G. Zircon U–Pb dating, geochemistry and Sr–Nd–Pb–Hf–O isotopes for the Nan’getan granodiorites and mafic microgranular enclaves in the East Kunlun Orogen: Record of closure of the Paleo-Tethys. Lithos 2015, 234–235, 47–60. [Google Scholar] [CrossRef]
  16. Li, R.; Pei, X.; Li, Z.; Pei, L.; Chen, G.; Liu, Z.; Chen, Y.; Liu, C.; Wang, M.; Zhang, M. Paleo-Tethyan Ocean Evolution and Indosinian Orogenesis in the East Kunlun Orogen, Northern Tibetan Plateau. Minerals 2022, 12, 1590. [Google Scholar] [CrossRef]
  17. Chen, J.; Fu, L.; Wei, J.; Tian, N.; Xiong, L.; Zhao, Y.; Zhang, Y.; Qi, Y. Geochemical characteristics of Late Ordovician granodiorite in Gouli area, Eastern Kunlun Orogenic Belt, Qinghai province: Implications on the evolution of Proto-Tethys Ocean. Earth Sci. 2016, 41, 1863–1882, (In Chinese with English Abstract). [Google Scholar]
  18. Kong, J.; Niu, Y.; Hu, Y.; Zhang, Y.; Shao, F. Petrogenesis of the Triassic granitoids from the East Kunlun Orogenic Belt, NW China: Implications for continental crust growth from syn-collisional to post-collisional setting. Lithos 2020, 364–365, 105513. [Google Scholar] [CrossRef]
  19. Xia, R.; Wang, C.; Qing, M.; Deng, J.; Carranza, E.J.M.; Li, W.; Guo, X.; Ge, L.; Yu, W. Molybdenite Re-Os, zircon U-Pb dating and Hf isotopic analysis of the Shuangqing Fe-Pb-Zn-Cu skarn deposit, East Kunlun Mountains, Qinghai Province, China. Ore Geol. Rev. 2015, 66, 114–131. [Google Scholar] [CrossRef]
  20. Qu, H.; Friehauf, K.; Santosh, M.; Pei, R.; Li, D.; Liu, J.; Zhou, S.; Wang, H. Middle–Late Triassic magmatism in the Hutouya Fe–Cu–Pb–Zn deposit, East Kunlun Orogenic Belt, NW China: Implications for geodynamic setting and polymetallic mineralization. Ore Geol. Rev. 2019, 113, 103088. [Google Scholar] [CrossRef]
  21. Zong, K.; Reiner, K.; Yuan, Y.; He, Z.; Guo, J.; Shi, X.; Liu, Y.; Hu, Z.; Zhang, Z. The assembly of Rodinia: The correlation of early Neoproterozoic (ca. 900 Ma) high grade metamorphism and continental arc formation in the southern Beishan Orogen, southern Central Asian orogenic belt (CAOB). Precambrian Res. 2017, 290, 32–48. [Google Scholar] [CrossRef]
  22. Liu, Y.S.; Hu, Z.C.; Gao, C.G.; Gao, S.; Günther, D.; Xu, J.; Gao, C.G.; Chen, H.H. In situ analysis of major and trace elements of anhydrous minerals by LA-ICP-MS without applying an internal standard. Chem. Geol. 2008, 257, 34–43. [Google Scholar] [CrossRef]
  23. Vermeesch, P. IsoplotR: A free and open toolbox for geochronology. Geosci. Front. 2018, 9, 1479–1493. [Google Scholar] [CrossRef]
  24. Hu, Z.; Liu, Y.; Gao, S.; Liu, W.; Yang, L.; Zhang, W.; Tong, X.; Lin, L.; Zong, K.; Li, M.; et al. Improvedin situ Hf isotope ratio analysis of zircon using newly designed X skimmer coneand Jet sample cone in combination with the addition of nitrogen by laser ablation multiple collector ICP-MS. J. Anal. Atom. Spectrom. 2012, 27, 1391–1399. [Google Scholar] [CrossRef]
  25. Blichert-Toft, J.; Albarède, F. Separation of Hf and Lu for high-precision isotope analysis of rock samples by magnetic sector-multiple collector ICP-MS. Contrib. Mineral. Petrol. 1997, 127, 248–260. [Google Scholar] [CrossRef]
  26. Griffin, W.L.; Pearson, N.J.; Belousova, E.; Jackson, S.E.; Achterbergh, E.V.; O’Reilly, S.Y.; Shee, S.R. The Hf isotope composition of cratonic mantle: LAM-MC-ICPMS analysis of zircon megacrysts in kimberlites. Geochim. Cosmochim. Acta 2000, 64, 133–147. [Google Scholar] [CrossRef]
  27. Söderlund, U.; Patchett, P.J.; Vervoort, J.D.; Isachsen, C.E. The 176Lu decay constant determined by Lu–Hf and U–Pb isotope systematics of Precambrian mafic intrusions. Earth Planet. Sci. Lett. 2004, 219, 311–324. [Google Scholar] [CrossRef]
  28. Gao, S.; Rudnick, R.L.; Yuan, H.L.; Liu, X.M.; Liu, Y.S.; Xu, W.L.; Ling, W.L.; Ayers, J.; Wang, X.C.; Wang, Q.H. Recycling lower continental crust in the North China craton. Nature 2004, 432, 892–897. [Google Scholar] [CrossRef]
  29. Steiger, R.H.; Jäger, E. Subcommission on geochronology: Convention on the use of decay constants in geo- and cosmochronology. Earth Planet. Sci. Lett. 1977, 36, 359–362. [Google Scholar] [CrossRef]
  30. Lugmair, G.W.; Marti, K. Lunar initial 143 Nd/144 Nd: Differential evolution of the lunar crust and mantle. Earth Planet. Sci. Lett. 1978, 39, 349–357. [Google Scholar] [CrossRef]
  31. Wu, Y.B.; Zheng, Y.F. Genesis of zircon and its constraints on interpretation of U-Pb age. Chin. Sci. Bull. 2004, 49, 1589–1604, (In Chinese with English Abstract). [Google Scholar] [CrossRef]
  32. Middlemost, E.A.K. Naming materials in the magma/igneous rock system. Earth-Sci. Rev. 1994, 37, 215–224. [Google Scholar] [CrossRef]
  33. Frost, B.R. A geochemical classification for granitic rocks. J. Petrol. 2001, 42, 2033–2048. [Google Scholar] [CrossRef]
  34. Peccerillo, R.; Taylor, S.R. Geochemistry of Eocene calc-alkaline volcanic rocks from the Kastamonu area, Northern Turkey. Contrib. Mineral. Petrol. 1976, 58, 63–81. [Google Scholar] [CrossRef]
  35. Maniar, P.D.; Piccoli, P.M. Tectonic discrimination of granitoids. Geol. Soc. Am. Bull. 1989, 101, 635–643. [Google Scholar] [CrossRef]
  36. Rudnick, R.L.; Gao, S. Composition of the continental crust. In The Crust; Holland, H.D., Turekian, K.K., Eds.; Elsevier-Pergamon: Oxford, UK, 2003; pp. 1–64. [Google Scholar]
  37. Sun, S.S.; McDonough, W.F. Chemical and isotopic systematics of oceanic basalts: Implications for mantle composition and processes. Geol. Soc. Lond. Spec. Publ. 1989, 42, 313–345. [Google Scholar] [CrossRef]
  38. Ferry, J.M.; Watson, E.B. New thermodynamic models and revised calibrations for the Ti-in-zircon and Zr-in-rutile thermometers. Contrib. Mineral. Petrol. 2007, 154, 429–437. [Google Scholar] [CrossRef]
  39. Li, W.; Cheng, Y.; Yang, Z. Geo-fO2: Integrated Software for Analysis of Magmatic Oxygen Fugacity. Geochem. Geophys. Geosyst. 2019, 20, 2542–2555. [Google Scholar] [CrossRef]
  40. Zou, X.; Qin, K.; Han, X.; Li, G.; Evans, N.J.; Li, Z.; Yang, W. Insight into zircon REE oxy-barometers: A lattice strain model perspective. Earth Planet. Sci. Lett. 2019, 506, 87–96. [Google Scholar] [CrossRef]
  41. Trail, D.; Watson, E.B.; Tailby, N.D. The oxidation state of Hadean magmas and implications for early Earth’s atmosphere. Nature 2011, 480, 79–82. [Google Scholar] [CrossRef]
  42. Li, S.; Liu, X.; Lu, Y.; Zhang, S.; Liu, S.; Chen, J.; Li, Z.; Yu, H.; Zhang, C. Indication of Zircon Oxygen Fugacity to Different Mineralization Control Factors of Porphyry Deposits in Zhongdian Ore-Concentrated Area, Southern Yidun Arc. Earth Sci. 2022, 47, 1435–1458, (In Chinese with English Abstract). [Google Scholar]
  43. Chen, G.C.; Pei, X.Z.; Li, R.B.; Li, Z.C.; Liu, C.J.; Chen, Y.X.; Pei, L.; Zhang, Y.M.; Wang, M.; Li, X.B.; et al. Age and Petrogenesis of Jialuhe Basic-Intermediate Pluton in Xiangjia’nanshan Granite Batholith in the Eastern Part of East Kunlun Orogenic Belt, and its Geological Significance. Geotecton. Metallog. 2017, 41, 1097–1115, (In Chinese with English Abstract). [Google Scholar]
  44. Trail, D.; Bruce Watson, E.; Tailby, N.D. Ce and Eu anomalies in zircon as proxies for the oxidation state of magmas. Geochim. Cosmochim. Acta 2012, 97, 70–87. [Google Scholar] [CrossRef]
  45. Lu, Y.; Loucks, R.R.; Fiorentini, M.L.; McCuaig, T.C.; Evans, N.J.; Zhiming, Y.; Zengqian, H.; Kirkland, C.L.; Parra-Avila, L.A.; Kobussen, A.; et al. Zircon compositions as a pathfinder for porphyry Cu ± Mo ± Au mineral deposits. Spec. Publ. Soc. Econ. Geol. 2016, 19, 329–348. [Google Scholar]
  46. Shen, P.; Hattori, K.; Pan, H.; Jackson, S.; Seitmuratova, E. Oxidation Condition and Metal Fertility of Granitic Magmas: Zircon Trace-Element Data from Porphyry Cu Deposits in the Central Asian Orogenic Belt. Econ. Geol. 2015, 110, 1861–1878. [Google Scholar] [CrossRef]
  47. Leake, B.E. Nomenclature of Amphiboles: Report of the Subcommittee on Amphiboles of the International Mineralogical Association Commission on New Minerals and Mineral Names. Can. Mineral. 1997, 61, 295–321. [Google Scholar]
  48. Ridolfi, F.; Renzulli, A.; Puerini, M. Stability and chemical equilibrium of amphibole in calc-alkaline magmas: An overview, new thermobarometric formulations and application to subduction-related volcanoes. Contrib. Mineral. Petrol. 2010, 160, 45–66. [Google Scholar] [CrossRef]
  49. Xiong, F.H. Spatial-Temporal Pattern, Petrogenesis and Geological Implications of Paleo-Tethyan Granitoids in the East Kunlun Orogenic belt (Eastern Segment); China University of Geosciences: Wuhan, China, 2014; pp. 1–191. [Google Scholar]
  50. O’Neill, H.S.C.; Pownceby, M.I. Thermodynamic data from redox reactions at high temperatures. I. An experimental and theoretical assessment of the electrochemical method using stabilized zirconia electrolytes, with revised values for the Fe-“FeO”, Co-CoO, Ni-NiO and Cu-Cu2O oxygen buffers, and new data for the W-WO2 buffer. Contrib. Mineral. Petrol. 1993, 114, 296–314. [Google Scholar]
  51. Henry, D.J.; Guidotti, C.V.; Thomson, J.A. The Ti-saturation surface for low-to-medium pressure metapelitic biotites: Implications for geothermometry and Ti-substitution mechanisms. Am. Mineral. 2005, 90, 316–328. [Google Scholar] [CrossRef]
  52. Uchida, E.; Endo, S.; Makino, M. Relationship Between Solidification Depth of Granitic Rocks and Formation of Hydrothermal Ore Deposits. Resour. Geol. 2007, 57, 47–56. [Google Scholar] [CrossRef]
  53. Foster, M.D. Interpretation of the Composition of Trioctahedral Micas; U.S. Geological Survey Professional Paper 354-B; U.S. Government Publishing Office: Washington, DC, USA, 1960; pp. 1–146. [Google Scholar]
  54. Nachit, H.; Ibhi, A.; Abia, E.H.; Ben Ohoud, M. Discrimination between primary magmatic biotites, reequilibrated biotites and neoformed biotites. Comptes Rendus Geosci. 2005, 337, 1415–1420. [Google Scholar] [CrossRef]
  55. Wones, D.R.; Eugster, H.P. Stability of biotite; experiment, theory, and application. Am. Mineral. 1965, 50, 1228–1272. [Google Scholar]
  56. Vervoort, J.D.; Patchett, P.J.; Blichert-Toft, J.; Albarède, F. Relationships between Lu–Hf and Sm–Nd isotopic systems in the global sedimentary system. Earth Planet. Sci. Lett. 1999, 168, 79–99. [Google Scholar] [CrossRef]
  57. Guo, A.L.; Zhang, G.W.; Sun, Y.G.; Cheng, S.Y.; Yao, A.P. Geochemistry and spatial distribution of late-Paleozoic mafic volcanic rocks in the surrounding areas of the Gonghe Basin: Implications for Majixueshan triple-junction and east Paleotethyan archipelagic ocean. Science China. Earth Sci. 2007, 50, 292–304. [Google Scholar] [CrossRef]
  58. Yu, N.; Jin, W.; Ge, W.C.; Long, X.P. Geochemical study on peraluminous granite from Jinshuikou in East Kunlun. Glob. Geol. 2005, 24, 123–128, (In Chinese with English Abstract). [Google Scholar]
  59. Long, X.P. The Research of Zircon Chronology in Orogenic Belts—A Case Study in Jinshuikou Zone. Master’s Thesis, Jilin University, Changchun, China, 2004; p. 129. [Google Scholar]
  60. He, D.F.; Dong, Y.P.; Zhang, F.F.; Yang, Z.; Sun, S.S.; Cheng, B.; Zhou, B.; Liu, X.M. The 1.0 Ga S–type granite in the East Kunlun Orogen, Northern Tibetan Plateau: Implications for the Meso–to Neoproterozoic tectonic evolution. J. Asian Earth Sci. 2016, 130, 46–59. [Google Scholar] [CrossRef]
  61. Zhao, X.; Fu, L.; Wei, J.; Zhao, Y.; Tang, Y.; Yang, B.; Guan, B.; Wang, X. Geochemical characteristics of the An’nage hornblende gabbro from East Kunlun Orogenic Belt: Constraints on the evolution of Paleo-Tethys Ocean. Earth Sci. 2018, 43, 1–23, (In Chinese with English Abstract). [Google Scholar]
  62. Hu, Y.; Niu, Y.; Li, J.; Ye, L.; Kong, J.; Chen, S.; Zhang, Y.; Zhang, G. Petrogenesis and tectonic significance of the late Triassic mafic dikes and felsic volcanic rocks in the East Kunlun Orogenic Belt, Northern Tibet Plateau. Lithos 2016, 245, 205–222. [Google Scholar] [CrossRef]
  63. Xiong, F.; Ma, C.; Jiang, H.; Liu, B.; Zhang, J.; Zhou, Q. Petrogenetic and tectonic significance of Permian calc-alkaline lamprophyres, East Kunlun orogenic belt, Northern Qinghai-Tibet Plateau. Int. Geol. Rev. 2013, 55, 1817–1834. [Google Scholar] [CrossRef]
  64. Zhang, Z.; Wang, Y.; Qian, B.; Liu, Y.; Zhang, D.; Lü, P.; Dong, J. Metallogeny and tectonomagmatic setting of Ni-Cu magmatic sulfide mineralization, number I Shitoukengde mafic-ultramafic complex, East Kunlun Orogenic Belt, NW China. Ore Geol. Rev. 2018, 96, 236–246. [Google Scholar] [CrossRef]
  65. Zhao, X.; Fu, L.; Wei, J.; Bagas, L.; Santosh, M.; Liu, Y.; Zhang, D.; Zhou, H. Late Permian back-arc extension of the eastern Paleo-Tethys Ocean: Evidence from the East Kunlun Orogen, Northern Tibetan Plateau. Lithos 2019, 340–341, 34–48. [Google Scholar] [CrossRef]
  66. Kong, H.; Li, Y.; Li, J.; Jia, Q.; Guo, X.; Wang, Y.; Yao, X. Petrogenesis of Xiwanggou olivine gabbro in East Kunlun Mountains: Constraints from geochemistry, zircon U-Pb dating and Hf isotopes. Geol. China 2021, 48, 173–188, (In Chinese with English Abstract). [Google Scholar]
  67. Huang, H.; Niu, Y.; Nowell, G.; Zhidan, Z.; Xuehui, Y.; Dicheng, Z.; Xuanxue, M.; Shuo, D. Geochemical constraints on the petrogenesis of granitoids in the East Kunlun orogenic belt, northern Tibetan Plateau; implications for continental crust growth through syn-collisional felsic magmatism. Chem. Geol. 2014, 370, 1–18. [Google Scholar] [CrossRef]
  68. Fu, L.; Wei, J.; Tan, J.; Santosh, M.; Zhang, D.; Chen, J.; Li, Y.; Zhao, S.; Peng, L. Magma mixing in the Kalaqin core complex, northern North China Craton: Linking deep lithospheric destruction and shallow extension. Lithos 2016, 260, 390–412. [Google Scholar] [CrossRef]
  69. Ma, C.Q. Advances in Study on the Interaction between Mafic and Felsic Magmas in Orogenic Suites. Geol. Sci. Technol. Inf. 2003, 22, 1–8, (In Chinese with English Abstract). [Google Scholar]
  70. Zhang, Q.; Pan, G.Q.; Li, C.D.; Jin, W.J.; Jia, X.Q. Granitic magma mixing versus basaltic magma mixing: New viewpoints on granitic magma mixing precess: Song crucial quertions on granite study (1). Acta Petrol. Sin. 2007, 23, 1141–1152, (In Chinese with English Abstract). [Google Scholar]
  71. Guo, A.L.; Zhang, G.W.; Sun, Y.G.; Cheng, Y.S.; Qiang, J. Sr-Nd-Pb isotopic geochemistry of late-Paleozoic mafic volcanic rocks in the surrounding areas of Gonghe basin, Qinghai Province and geological implications. Acta Petrol. Sin. 2007, 23, 747–754, (In Chinese with English Abstract). [Google Scholar]
  72. Defant, M.J.; Drummond, M.S. Derivation of some modern arc magmas by melting of young subducted lithosphere. Nature 1990, 347, 662–665. [Google Scholar] [CrossRef]
  73. Chen, S.; Niu, Y.L.; Li, J.Y.; Sun, W.L.; Zhang, Y.; Hu, Y.; Shao, F.L. Syn-collisional adakitic granodiorites formed by fractional crystallization: Insights from their enclosed mafic magmatic enclaves (MMEs) in the Qumushan pluton, North Qilian Orogen at the northern margin of the Tibetan Plateau. Lithos 2016, 248–251, 455–468. [Google Scholar] [CrossRef]
  74. Ding, Q.; Jiang, S.; Sun, F. Zircon U–Pb geochronology, geochemical and Sr–Nd–Hf isotopic compositions of the Triassic granite and diorite dikes from the Wulonggou mining area in the Eastern Kunlun Orogen, NW China: Petrogenesis and tectonic implications. Lithos 2014, 205, 266–283. [Google Scholar] [CrossRef]
  75. Richards, J.P. Postsubduction porphyry Cu-Au and epithermal Au deposits: Products of remelting of subduction-modified lithosphere. Geology 2009, 37, 247–250. [Google Scholar] [CrossRef]
  76. Li, W.; Yang, Z.; Cao, K.; Lu, Y.; Sun, M. Redox-controlled generation of the giant porphyry Cu–Au deposit at Pulang, southwest China. Contrib. Mineral. Petrol. 2019, 174, 12. [Google Scholar] [CrossRef]
  77. Moore, G.; Carmichael, I.S.E. The hydrous phase equilibria (to 3 kbar) of an andesite and basaltic andesite from western Mexico; constraints on water content and conditions of phenocryst growth. Contrib. Mineral. Petrol. 1998, 130, 304–319. [Google Scholar] [CrossRef]
  78. Zhu, J.; Hu, R.; Bi, X.; Hollings, P.; Zhong, H.; Gao, J.; Pan, L.; Huang, M.; Wang, D. Porphyry Cu fertility of eastern Paleo-Tethyan arc magmas: Evidence from zircon and apatite compositions. Lithos 2022, 424–425, 106775. [Google Scholar] [CrossRef]
  79. Loucks, R.R.; Fiorentini, M.L.; Henríquez, G.J. New magmatic oxybarometer using trace elements in zircon. J. Petrol. 2020, 61, egaa034. [Google Scholar] [CrossRef]
  80. Chen, G.C.; Pei, X.Z.; Li, R.B.; Li, Z.C.; Liu, C.J.; Chen, Y.X.; Pei, L.; Zhang, Y.M.; Wang, M.; Zhang, Y.; et al. Mineralogical features of the amphiboles and biotites on the quartz xenocrysts rim of Jialuhe intermediate-basic pluton, eastern East Kunlun Orogen: Constraints on the magma mixing and mingling process. Earth Sci. Front. 2017, 24, 10–24, (In Chinese with English Abstract). [Google Scholar]
  81. Zhang, J.; Ma, C.; Li, J.; Pan, Y. A possible genetic relationship between orogenic gold mineralization and post-collisional magmatism in the eastern Kunlun Orogen, western China. Ore Geol. Rev. 2017, 81, 342–357. [Google Scholar] [CrossRef]
  82. Liang, G.; Yang, K.; Sun, W.; Fan, H.; Li, X.; Lan, T.; Hu, H.; Chen, Y. Multistage ore-forming processes and metal source recorded in texture and composition of pyrite from the Late Triassic Asiha gold deposit, Eastern Kunlun Orogenic Belt, Western China. J. Asian Earth Sci. 2021, 220, 104920. [Google Scholar] [CrossRef]
  83. Wu, J.; Zeng, Q.; Santosh, M.; Fan, H.; Wei, Z.; Yang, K.; Zhang, Z.; Li, X.; Liang, G. Intrusion-related orogenic gold deposit in the East Kunlun belt, NW China: A multiproxy investigation. Ore Geol. Rev. 2021, 139, 104550. [Google Scholar] [CrossRef]
  84. Lu, Y.; Kerrich, R.; Kemp, A.I.S.; McCuaig, T.C.; Zengqian, H.; Hart, C.J.R.; Li, Z.; Cawood, P.A.; Bagas, L.; Zhiming, Y.; et al. Intracontinental Eocene-Oligocene porphyry Cu mineral systems of Yunnan, western Yangtze Craton, China; compositional characteristics, sources, and implications for continental collision metallogeny. Econ. Geol. 2013, 108, 1541–1576. [Google Scholar] [CrossRef]
  85. Dilles, J.H.; Kent, A.J.R.; Wooden, J.L.; Tosdal, R.M.; Koleszar, A.; Lee, R.G.; Farmer, L.P. Zircon compositional evidence for sulfur-degassing from ore-forming arc magmas. Econ. Geol. 2015, 110, 241–251. [Google Scholar] [CrossRef]
  86. Watson, E.B.; Harrison, T.M. Zircon saturation revisited: Temperature and composition effects in a variety of crustal magma types. Earth Planet. Sci. Lett. 1983, 64, 295–304. [Google Scholar]
Figure 1. (A) Map of the Qinghai-Tibetan plateau showing the location of the EKO (after Chen J. et al., 2017 [8]); (B) Geological map of the EKO showing the distribution of Triassic porphyry-skarn deposits (after Chen et al., 2017 [8]); (C) Geological map of the Delong gold-copper deposit area showing the sampling locations. INDB-Indian block; YZB-Yangtze block; ALSB-Alashan block; TRMB-Tarim block. The zircon U-Pb ages labelled in (C) are from our unpublished report.
Minerals 13 01202 g001
Figure 2. Field photo (A), hand sample photo (B), and microphotographs (CI) of the Delong quartz diorite and mafic enclaves. (C,G) collected under transmitted plane-polarized light; (DF) collected under transmitted cross-polarized light; (H,I) are backscattered photos. Bt–biotite; Pl–plagioclase; Qz–quartz; Amp-amphibole; Chl-Chlorite; Epi-Epidote; Mt-Magnetite; Py-Pyrite; Sphe-Sphene; Ilm-ilmelite.
Minerals 13 01202 g002
Figure 3. Representative CL images and U–Pb concordia plots of the Delong quartz diorite (A,B) and mafic enclave enclosed (A,C). The locations of U-Pb age and Lu-Hf isotope (yellow solid circles) analyses are also shown on the corresponding CL images. MSWD: mean square of weighted deviation. The yellow numbers in (A) are spot numbers for U-Pb and Lu-Hf isotope analyses.
Minerals 13 01202 g003
Figure 4. Plots of (A) K2O + Na2O (wt.%) versus. SiO2 (wt.%) (after Middlemost, 1994 [32]); (B) Na2O + K2O-CaO (wt.%) versus SiO2 (wt.%) (after Frost, 2001 [33]); (C) K2O (wt.%) versus SiO2 (wt.%) (after Peccerillo and Taylor, 1976 [34]) and (D) A/NK [molar ratio Al2O3/(Na2O + K2O)] versus A/CNK [molar ratio Al2O3/(CaO + Na2O + K2O)] (after Maniar and Piccoli, 1989 [35]) for the Delong quartz diorite and mafic enclaves.
Minerals 13 01202 g004
Figure 5. Chondrite-normalized rare earth element patterns (A,C) and primitive mantle-normalized trace element spider-diagrams (B,D) for the Delong quartz diorite and mafic enclaves. The data of bulk continental crust (BCC) [36], ocean island basalt (OIB) [37], enriched mid-ocean ridge basalt (E-MORB) [37], and normal mid-ocean ridge basalt (N-MORB) [37] are shown for comparison. Chondrite and primitive mantle values used for normalization are from Sun and McDonough (1989) [37].
Minerals 13 01202 g005
Figure 6. Chondrite-normalized rare earth element diagrams for zircons from the Delong quartz diorite (A) and enclosed mafic enclave (B). Chondrite values used for normalization are from Sun and McDonough (1989) [37]. Data for spot with La > 0.1 ppm may be affected by mineral inclusion as proposed by (Zou et al. (2019) [40] and Li et al. (2022) [42].
Minerals 13 01202 g006
Figure 7. Plots of zircon (A) CeIV/CeIII versus Eu/Eu*, (B) Log(fO2) versus T(°C) and (C) ∆NNO versus T(°C) for Delong quartz diorite and mafic enclave. Data from the Asiha [8] and Jialiuhe [43] are also shown for comparison. The Log(fO2) and ∆NNO values are calculated based on zircon CeIV/CeIII [41] and zircon Eu anomalies [44], respectively. The formula for calculating temperature (T(°C)) is after Ferry and Watson (2007) [38]. Common solid oxygen buffers are shown in (B). HM = magnetite–hematite buffer; NNO = nickel–nickel oxide buffer; FMQ = fayalite–magnetite–quartz buffer; WM = wüstite–magnetite buffer; IW = iron–wüstite buffer. Field for fertile systems (porphyry Cu) are compiled from Lu et al. (2016) [45] and Shen et al. (2015) [46]. Filled labels represent data points with La < 0.1 ppm and Y/Ho < 34 and the unfilled represent the opposite.
Minerals 13 01202 g007
Figure 8. Diagrams for classification of calcic amphiboles (after Leake, 1997 [47]). (A) (Na)B versus (Ca+Na)B diagram; (B) Mg/(Mg + Fe2+) versus Si (apfu) diagram.
Minerals 13 01202 g008
Figure 9. P(Mpa) versus T(°C) (A), Log(fO2) versus T(°C) (B) and T(°C) versus H2Omelt (wt.%) (C) diagrams for the selected amphiboles as determined by amphibole compositions (after Ridolfi et al., 2010 [48]). Data from the Saishitang [11] and Xiangride [49] are also shown for comparison. The dashed curve in A roughly divides consistent experimental products with different crystallinity and the solid curves represent the maximum relative P errors ranging from 11% to 25% [48]. The NNO and NNO+2 curves calculated following [50] are shown in B. The dashed and the solid curves in C are maximum thermal stability and lower limit of consistent amphiboles [48].
Minerals 13 01202 g009
Figure 10. (A) Triangular classification diagram of biotite (after Foster, 1960 [53]) and (B) TiO2-FeO + MnO-MgO ternary diagram of biotite (after Nachit et al., 2005 [54]) for the Delong quartz diorite and mafic enclaves.
Minerals 13 01202 g010
Figure 11. (A) Fe2+-Fe3+-Mg2+ ternary diagram of biotites for the Delong quartz diorite and mafic enclaves (after Wones and Eugster, 1965 [55]) and (B) An variations of plagioclase grains from the Delong quartz diorite and mafic enclaves.
Minerals 13 01202 g011
Figure 12. Plots of (A) εNd(t) versus (87Sr/86Sr)i, (B) εHf(t) versus T(Ma), and (C) εNd(t) versus εHf(t) for the Delong quartz diorites and mafic enclaves. The black curves with grey circles in A and C are mixing trends between depleted mantle-derived basalt (A’neymaqen MORB) and Proterozoic granulite (Jinshuikou granulite) or S-type granites (Bokelilai S-type granite) in the EKO. The continental crust array in C is from Vervoort et al. (1999) [56]. Sr-Nd-Hf isotopic data of some rocks from the EKO are also shown for composition and they refer to the following resources: A’neymaqen MORB and OIB-[57]; Jinshuikou S-type granite-[58]; Jinshuikou granulite-[59]; Bokelila S-type granite-[60]; enriched mantle-derived mafic rocks from Bairiqili-[49], Annage-[61], Yeniugou-[62], Jinshuikou-[63]; asthenosphere-derived mafic rocks from Shitoukengde-[64], Kengdenongshe-[65], Xiwanggou-[66].
Minerals 13 01202 g012
Figure 13. Zircon Dy/Yb versus Eu/Eu* (A) and (Ce/Nb)/Y versus (Eu/Eu*)/Y (B) diagrams for Delong quartz diorite and mafic enclave. Data from the Asiha [8] and Jialiuhe [80] are also shown for comparison. The fertile systems areas are compiled by Lu et al. (2013) [84]. Filled labels represent data points with La < 0.1 ppm and Y/Ho < 34 and the unfilled represent the opposite.
Minerals 13 01202 g013
Disclaimer/Publisher’s Note: The statements, opinions and data contained in all publications are solely those of the individual author(s) and contributor(s) and not of MDPI and/or the editor(s). MDPI and/or the editor(s) disclaim responsibility for any injury to people or property resulting from any ideas, methods, instructions or products referred to in the content.

