Abstract
Shale in the third member of the Jiufotang Formation at the Lujiapu Rift Basin is a new potential target for shale oil exploration and has rarely been studied before. In order to study pore structure and its controlling factors, shale compositions are mainly analyzed by X-ray Diffraction (XRD), and the characterization of full-scale pore structures is studied by the field-emission scanning electron microscope (FE-SEM), low-temperature N2 adsorption, and high-pressure mercury intrusion porosimetry (high-pressure MIP). According to composition and micro-texture, shale samples in the third member of the Jiufotang Formation are classified into three types: laminated organic matter-lean shale (TOC < 2%), unlaminated organic matter-intermediate shale (2% < TOC < 4%) and laminated organic matter-rich shale (TOC > 4%). Most shale samples are dominated by interparticle pores, with many of them filled by diagenetic minerals. All the shale samples are most developed in mesopores, whose development is mainly controlled by quartz content. And macropores with a diameter of 10,000 nm~100,000 nm are the secondary developed pores, which are influenced by both the paleoenvironment and diagenesis (especially clay transformation). Full-scale pore variations in laminated organic matter-lean shale, unlaminated organic matter-intermediate shale, and laminated organic matter-rich shale are ultimately related to their paleoenvironments.
1. Introduction
At the Lujiapu Rift Basin, the Jiufotang Formation was previously studied for its sedimentary facies and hydrocarbon-generating potential as a source rock [1]. As production of conventional hydrocarbons is declining in this area, looking for unconventional oil and gas is urgent. In 2020, the third member of the Jiufotang Formation was first assessed as a promising shale oil target through lithology and organic geochemistry. Hydrocarbon generation in the upper section of the Jiufotang Formation had undergone a bio-lipid generation stage and an oil generation stage. The asphalt “A” and S1 of the upper Jiufotang Formation were assessed to be 0.05%~0.91% and 1 mg/g~14.6 mg/g, respectively [1]. Moreover, laminated shale is considered to have substantial oil potential, with a moveable shale oil amount of 0.18 × 10⁸ t. However, it has not been investigated about the full-scale pore distributions, which are a key factor for oil mobility in pore networks at the microscale and nanoscale.
Organic and inorganic pores generally form complicated and heterogenous pore networks in shales [2,3,4,5,6]. Pore structure, including pore types, surface area, and pore size distribution, is the key petrophysical parameter for storage capacity, hydraulic conductivity, and fluid mobility [7]. Previous studies indicate that pore structure is significantly influenced by clay minerals and organic matter in shales [8,9,10]. Thermochemical simulated experiments and organic petrography are applied to study the effects of TOC, kerogen types, thermal maturity, and minerals on the formation of organic pores [5,11,12,13,14]. For the marine shales, organic pores could contribute 50% to the total porosity in the highly matured North American shales [3,4]. In contrast, the lacustrine shales may not have so many secondary organic pores because of the high content of terrigenous organic matter with low hydrocarbon generation potential [15,16]. The development of organic pores is mainly controlled by pore generation, preservation, and destruction during burial and diagenetic processes [4,11]. These processes are still unclear in the third member of the Jiufotang Formation at the study area.
Interparticle pore (InterP), intraparticle pore (intraP), and inter-crystal pore (inter-C) have been defined for the inorganic pores whose forming mechanisms are complicated and tightly relevant to sedimentary environments and diagenesis [3,5,17,18,19,20,21]. Compression and cementation could reduce about 60%~80% of the porosity in the original loose sediments; however, enrichment of rigid minerals such as quartz and pyrite can protect many pores from further compression [5,22,23,24]. Under burial conditions, quartz, feldspar, clay, calcite, and dolomite can dissolve, transform, and reprecipitate, hence complicated studies about the evolution of inorganic pores [15,20,25,26]. Moreover, the mineral assemblages of shale is proven to be related to the paleoenvironmental conditions. For example, in the Longmaxi Formation at the Sichuan Basin and the Youganwo Formation at the Maoming Basin, TOC of shales is controlled by paleo-redox conditions, paleo-productivity, sedimentary rate, and fluctuation of water level [27,28]. Overall, previous studies about controlling factors for pore development in shale are mainly focused on mature to overmature shale, specifically about the effects of thermal evolution of organic matter, mineral compositions, and diagenetic processes. However, the mechanisms of developing pores in shales are very complicated because of their complex compositions, multiple stages and types of diagenesis, and structures related to the sedimentary environment. To compensate for the gap in mechanisms of pore development between low-matured shale, matured shale, and over-matured shale, compositions and pore characters for the third member of the Jiufotang Formation are analyzed. Finally, based on studies about pore types, full-scale pore distributions, and shale compositions, key controlling factors for the development of pores in low-matured shale will be deduced in this research.
2. Geology Background
The study area is located at the southwest edge of the Songliao Basin, where the Lujiapu Rift Bsin Group, Kailu Rift Bsin Group, and Zhangwu Rift Bsin Group are developed (Figure 1a,b). The lower Cretaceous strata are classified into four formations (Figure 1d). (1) The Yixian Formation was mainly composed of andesite. (2) The Jiufotang Formation was deposited when the water level of the basin rose largely as a consequence of rapid basin sinking. At the center of the Lujiapu Rift Basin, dark shales with abundant organic matter were deposited. Around the basin, a series of turbidite fans, pro-fan deltas, fan delta fronts, and fan delta plains were formed due to the steep terrain (Figure 1c). The Jiufotang Formation, with a thickness ranging from 240 m to 1230 m, was composed of tuffaceous sandstones, tuffaceous mudstones, oil shales, and carbonate rocks. (3) The Shahai Formation was dominated by mudstones with a small amount of oil shale. (4) The Fuxin Formation was mainly composed of interbedded mudstones and siltstones (Figure 1d).
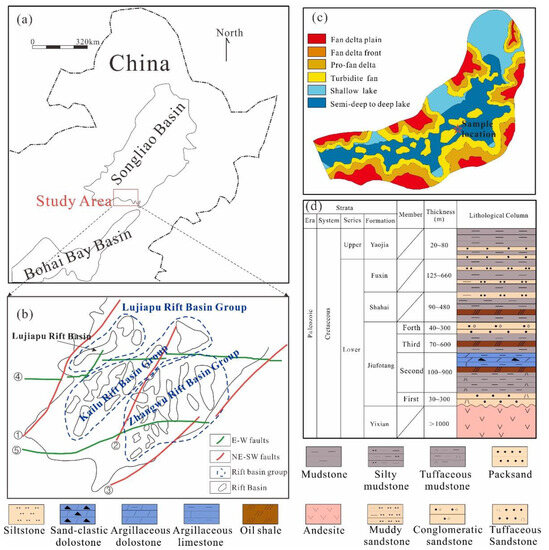
Figure 1.
(a) Location of the Songliao Basin and the study area. The dotted line indicates country boundary and solid line indicates basin boundary. (b) Structural map of the Lujiapu Rift Basin. Blue dotted lines indicate basin groups, black solid lines refer to small sags, green lines are East-West direction faults (E-W faults), red lines represent Northeast-Southwest direction faults (NE-SW faults). ① the Hongshan-Balihan Fault, ② the Anle-Linghai Fault, ③ the Yilan-Yitong Fault, ④ the Xilamulun Fault, ⑤ the Chifeng-Kaiyuan Fault. (c) Distribution of sedimentary facies of the Jiufotang Formation at the Lujiapu Rift Basin. (d) Lithological column of the Cretaceous Strata at the Lujiapu Rift Basin.
3. Sampling and Methods
Shale samples were obtained and measured from the third member of the Jiufotang Formation. The X-ray computerized tomography (CT) images were collected from the PetroChina Liaohe oilfield to observe macroscopic sedimentary structures and heterogeneity. In order to determine microscopic structures and heterogeneity, solid samples with a size of about 2 cm3 were made into thin sections with a thickness of 0.03 mm and then observed with a Zeiss Axio Image Z1 polarizing microscope.
For the measurement of TOC, a 0.01 g powdered sample with a grain size of 0.075 mm~0.18 mm was weighted, and inorganic carbon was removed by a dissolution of 1 HCl: 7 H2O. Then, the sample was dried and burned to measure TOC with a LEC CS-230 carbon-sulfur analyzer. For the analysis of mineral compositions, two grams of powdered samples of around 300 meshes were put in an aluminum box bedded with a flat glass slice and compressed into a solid specimen. The flat side of the specimen was then measured by a D8 DISCOVER X-ray diffractometer scanned with CuKα radiation, under a voltage of 40 kV and an intensity of 100 mA, and then analyzed by Diffrac Plus EVA software to give the mineral composition.
In order to study pore structures, solid samples of 0.5 cm3~1 cm3 were milled by argon ions and then observed with field emission scanning electron microscopy (FE-SEM), according to Gou et al. (2019) [29]. And the low-temperature N2 adsorption was carried out by the Micromeritics ASAP 2020 apparatus for quantitative analysis of pores with diameters ranging from 2 nm to 100 nm. During the adsorption and desorption processes, temperature, relative pressure range (P/P0), and equilibrium interval are set to 77.35 K, 0.005~1.0 and 30 s, respectively. Quantitative pore volumes were calculated by the Density Functional Theory (DFT) according to Gregg & Sing (1982) [30]. To characterize macropores, solid samples were cut into 1 cm3 to measure high-pressure mercury intrusion carried on the AutoPore IV 9500 Micrometeric instrument at the China University of Geoscience (Wuhan). The pressure range is set to be 0.23 psia~50,000 psia for this experiment. Macropore distributions were calculated according to the Washburn formula [31].
4. Results
4.1. Lithology of the Shales
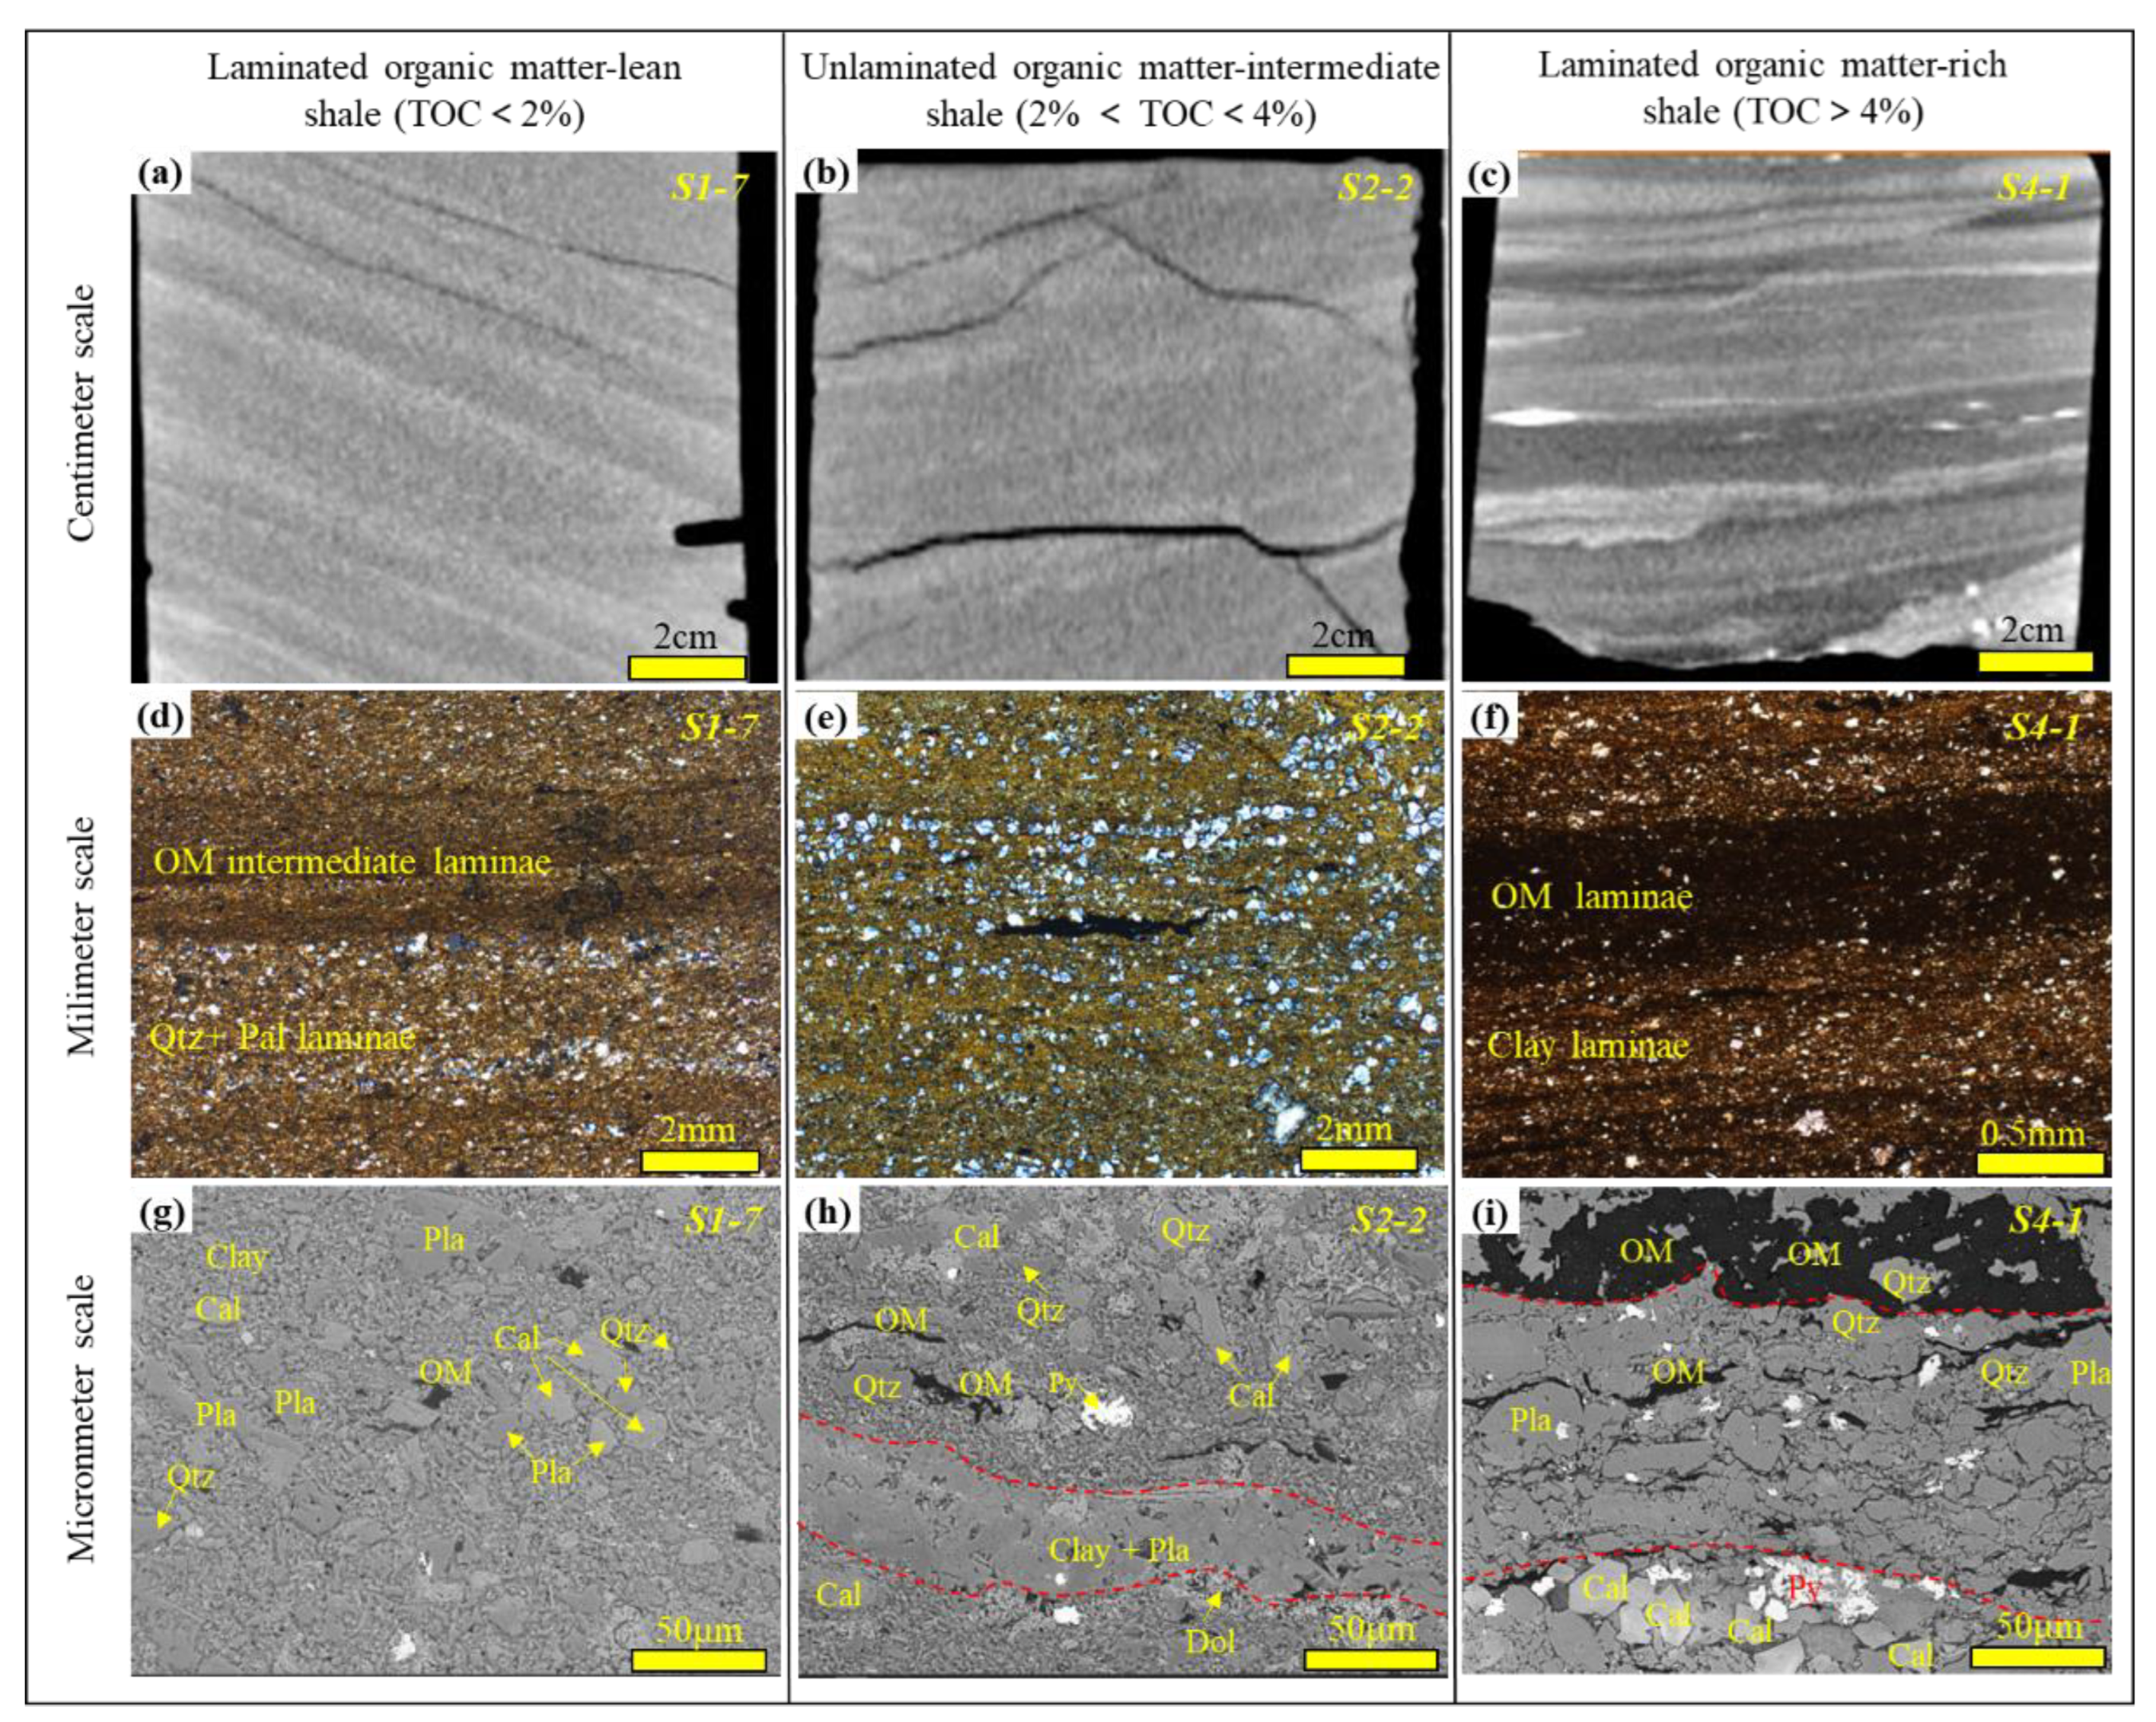
Laminated organic matter-lean shales show the lowest organic matter content (TOC < 2%), highest quartz content (average of 30.2%), and lowest plagioclase content (average of 24.7%) (Table 1). A CT image of this type of shale shows bright, continuous, parallel laminations with thickness less than 1 cm interbedding with gray laminations with thickness about 1 cm~2 cm (Figure 2a). Interbedded laminae, with thicknesses of about 2.5 mm, are composed of laminae of organic + clay and quartz + plagioclase (Figure 2d). Organic matter is scattered among mineral particles (Figure 2d,g).

Table 1.
Mineral compositions and TOC of shales in the third member of the Jiufotang Formation.
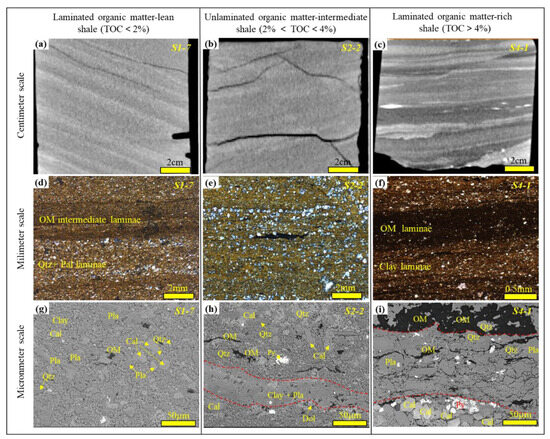
Figure 2.
Microtextural characteristics of the three types of shales. (a) Parallel and continuous laminations from CT images. Most laminations show a thickness of 1 cm~2 cm. (b) No clear lamination is observed from CT images. (c) Curvy and continuous laminations from CT images. Most laminations show a thickness of around 1 cm. (d) OM + clay laminae combined with Qtz + Pal laminae. (e) No obvious laminae. (f) OM laminae combined with OM + clay laminae. (g) Scattered organic matter fragments. (h) Scattered and elongated organic matter. (i) Elongated and aggregated organic matter. Abbreviations: OM—organic matter, Pla—plagioclase, Cal—calcite, Qtz—quartz, Dol—dolomite, Py—pyrite.
Unlaminated organic matter-intermediate shales show intermediate organic matter content (2% < TOC < 4%), moderate quartz content (average of 25.9%), and plagioclase content (average of 30.3%) (Table 1). They have poorly developed laminations (Figure 2b,e). Organic matter is usually squeezed into an elongated shape by minerals (Figure 2h).
Laminated organic matter-rich shales show the highest organic matter content (TOC > 4%), the lowest quartz content (average of 23.8%), and the highest plagioclase content (average of 30.4%) (Table 1). They have many continuous curvy laminations showing dark gray and gray colors (Figure 2c). OM + clay laminae and OM laminae show thicknesses around 0.5 mm~0.8 mm (Figure 2f). Organic matter distributes continuously like a sheet or curvy lines (Figure 2i).
4.2. Pore Types from FE-SEM
4.2.1. Organic Pores and Fractures
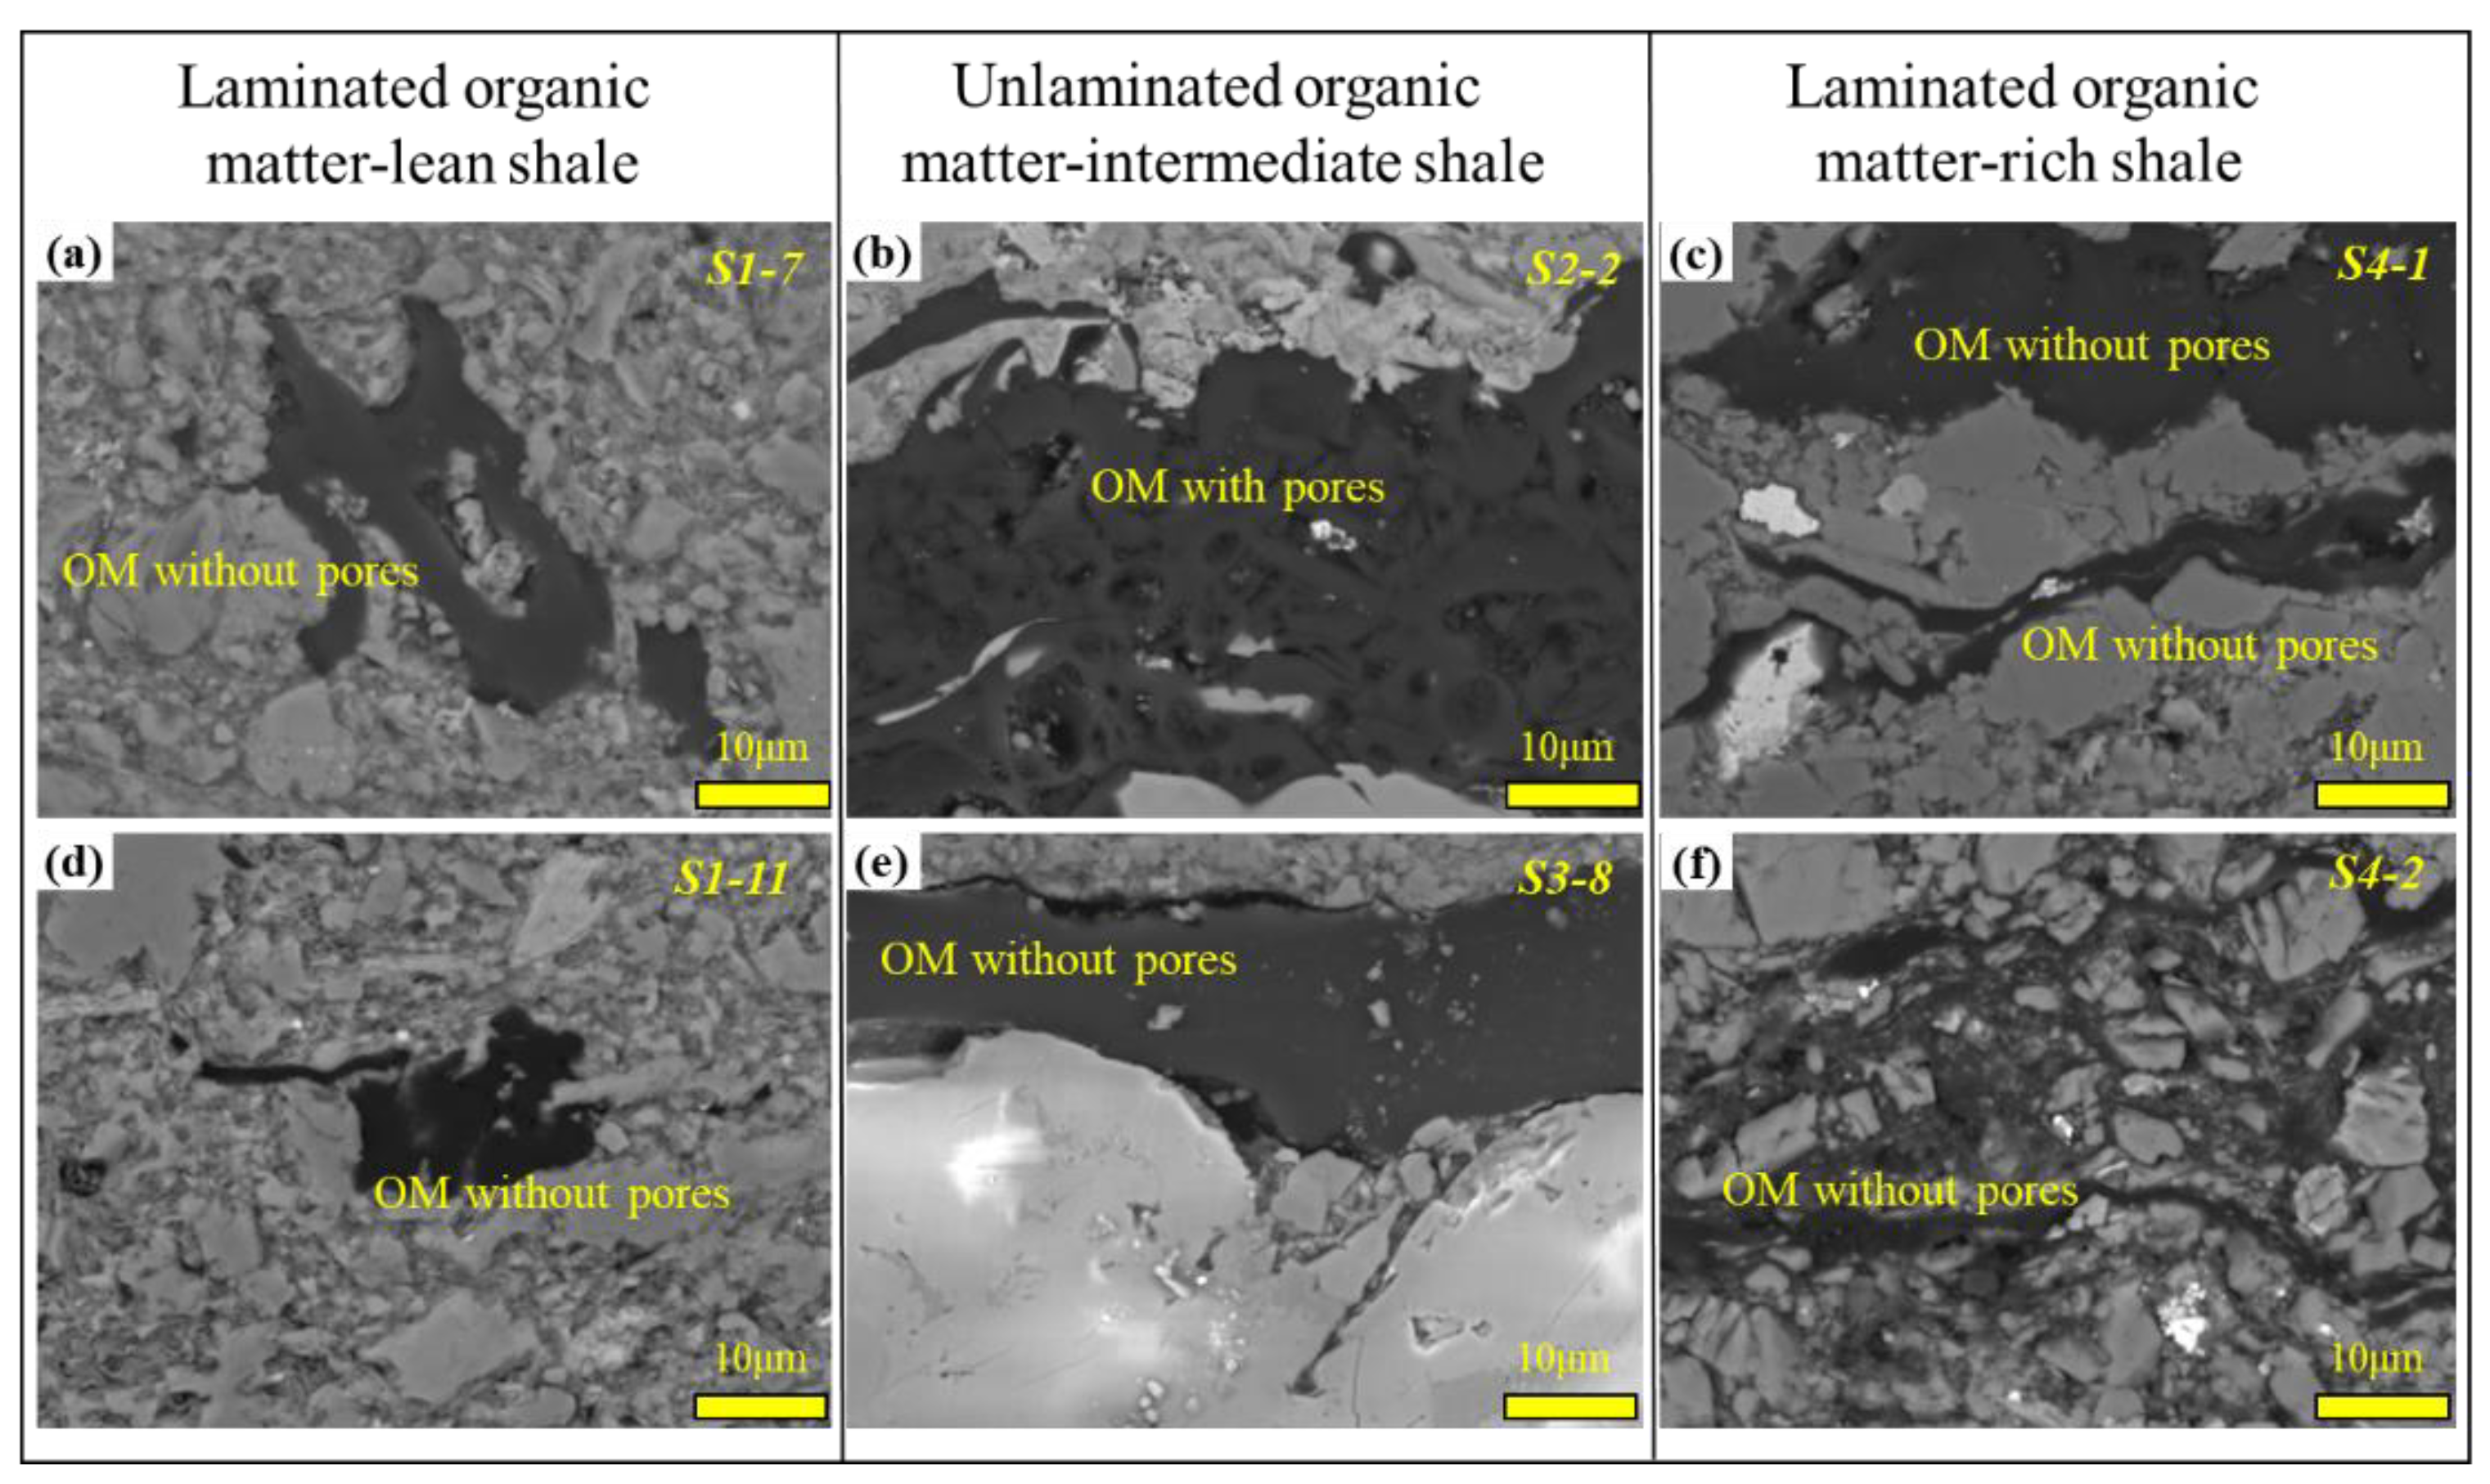
The laminated organic matter-lean and laminated organic matter-rich shales show no obvious organic pores (Figure 3a,c,d,f). This is possibly related to the specific organic matter type [32]. The unlaminated organic matter-intermediate shales develop some ellipsoidal, narrow, and irregular organic pores that are isolated from each other (Figure 3b). Most of these organic pores have a diameter less than 5 μm. Organic fractures are occasionally developed (Figure 3e), which is probably related to the shrinkage or dehydration of organic matter at some thermal maturity [3,32]. The widths of organic fractures are estimated to be less than 2 μm (Figure 3e). Overall, organic pores and fractures are not very common in the studied samples.
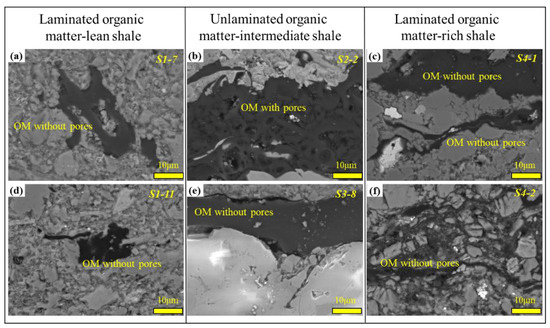
Figure 3.
Organic pores and fractures. (a) Organic matter without pores, S1-7. (b) Aggregated organic matter develops pores, S2-2. (c) aggregated and squeezed organic matter shows no pore, S4-1. (d) Fragments of organic matter without pores, S1-11. (e) Banded organic matter without pores, S3-8. (f) Squeezed organic matter without pores, S4-2.
4.2.2. Inorganic Pores and Fractures
Interparticle (interP) pores, intraparticle (intraP) pores, and inter-crystal (inter-C) pores are all observed in the three types of shales. InterP pores show clear variation in sizes and are commonly distributed among quartz, plagioclase, clay, and calcite (Figure 4). The maximum interP pore, up to 80 μm, is observed in the laminated organic matter-lean shales, which is wider than that in the unlaminated organic matter-intermediate shales and laminated organic matter-rich shales (Figure 4a–c). All the primary interP pores are filled by quartz, dolomite, and pyrite and then partitioned into small pores (Figure 4a–d,f,h). IntraP pores, which commonly show small sizes and poor connectivity, are only observed within some dolomite and calcite, which may result from dissolution (Figure 4a). Inter-C pores are mainly observed between clay minerals (Figure 4b). Inorganic fractures generally distribute along the rims of quartz or clay laminae (Figure 4e,g–i).
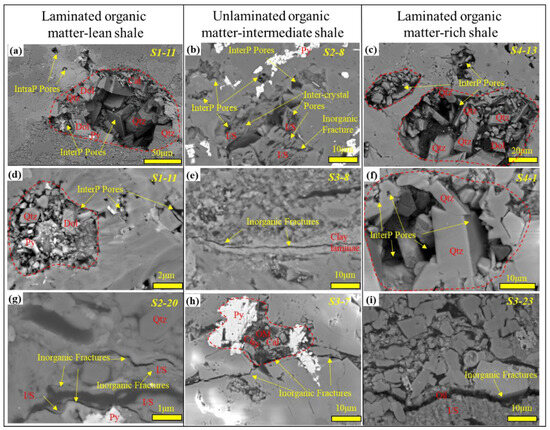
Figure 4.
Inorganic pores and fractures. (a) Organic matter without pores, S1-11. (b) Aggregated organic matter develops pores, S2-8. (c) aggregated and squeezed organic matter shows no pore, S4-13. (d) Fragments of organic matter without pores, S1-11. (e) Banded organic matter without pores, S3-8. (f) Squeezed organic matter without pores, S4-1. (g) Inorganic fracture located among pyrite, quartz and mixed layer of illite and smectite, S2-20. (h) Inorganic fracture located among quartz, S3-7. (i) Inorganic fracture developed along mixed layer of illite and smectite, S3-23. Red dotted lines indicate primary interP pores filled by diagenetic minerals. Dol—dolomite, Qtz—quartz, Cal—calcite, Py—pyrite, I/S—mixed layer of illite and smectite.
4.3. Pore Characterization from Low-Temperature N2 Adsorption
Low-temperature N2 adsorption is used to quantify pores with a diameter of 2 nm~100 nm. As the IUPAC recommended, hysteresis loops are divided into H1 (cylinder pores), H2 (ink-bottle-shaped pores), H3 (slit-shaped pores), and H4 (narrow slit-like pores) types based on their shapes [29]. H1 type shows the two branches approximately paralleling the gas adsorption axis (adsorbed volume), while H4 type shows the two branches almost paralleling the relative pressure axis (P/Po). H2 and H3 are intermediate cases between H1 and H4 [33,34].
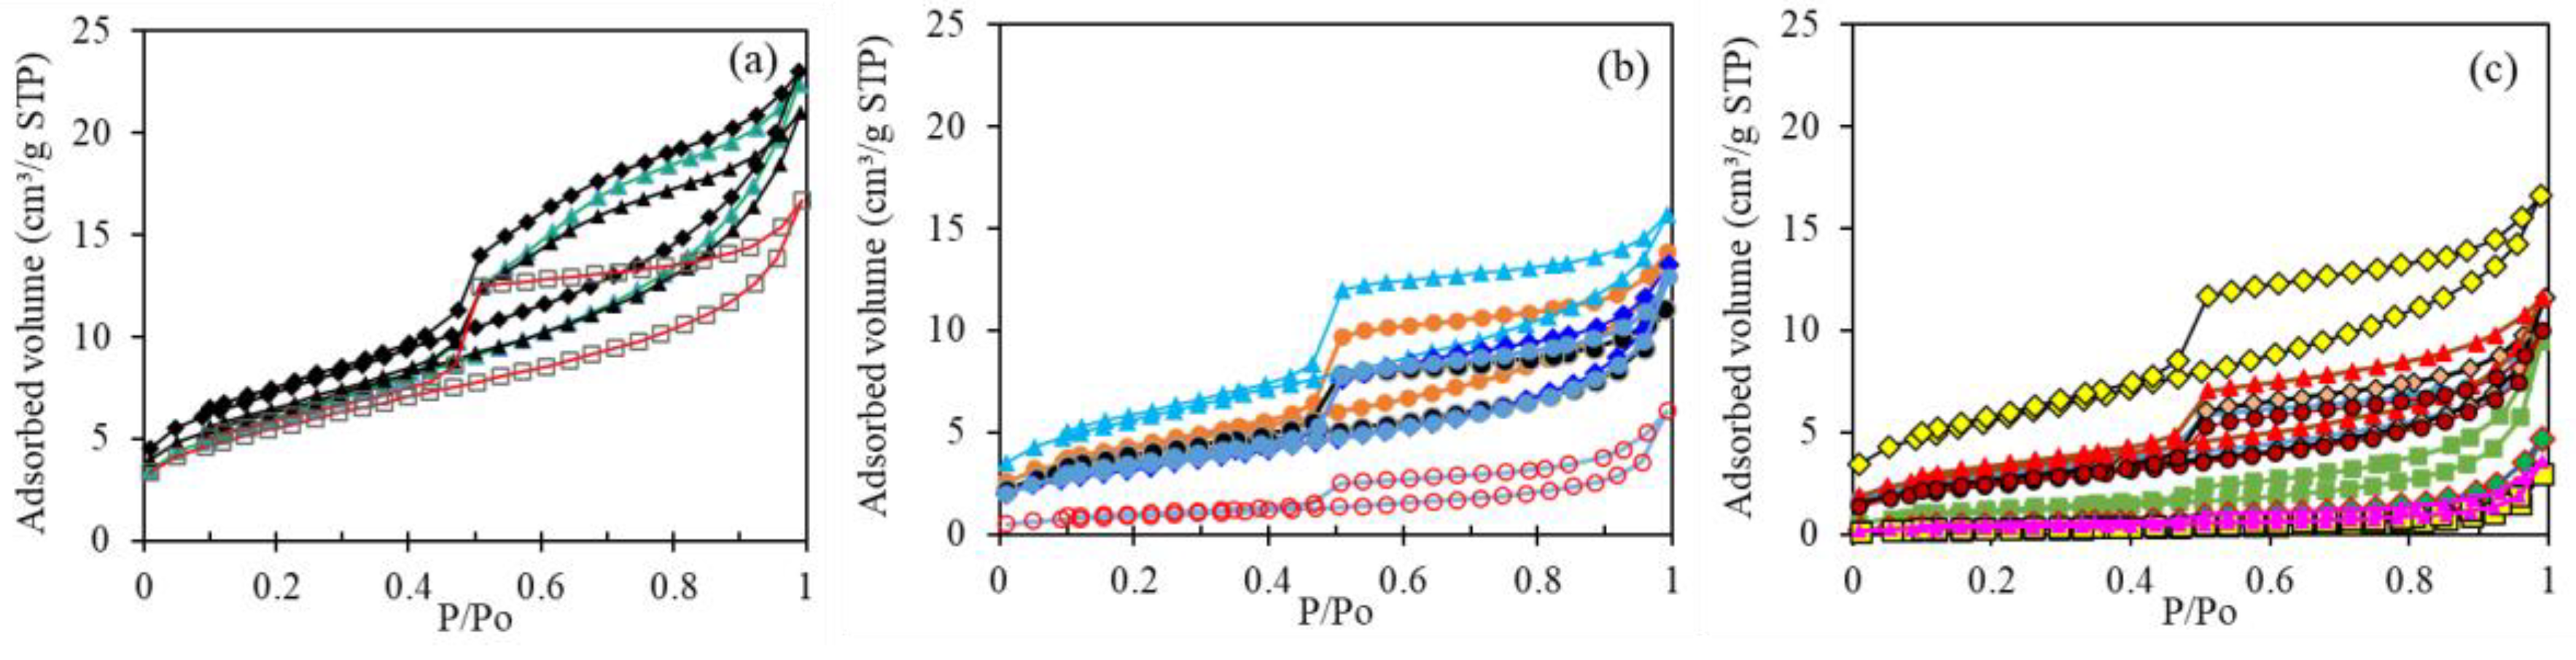
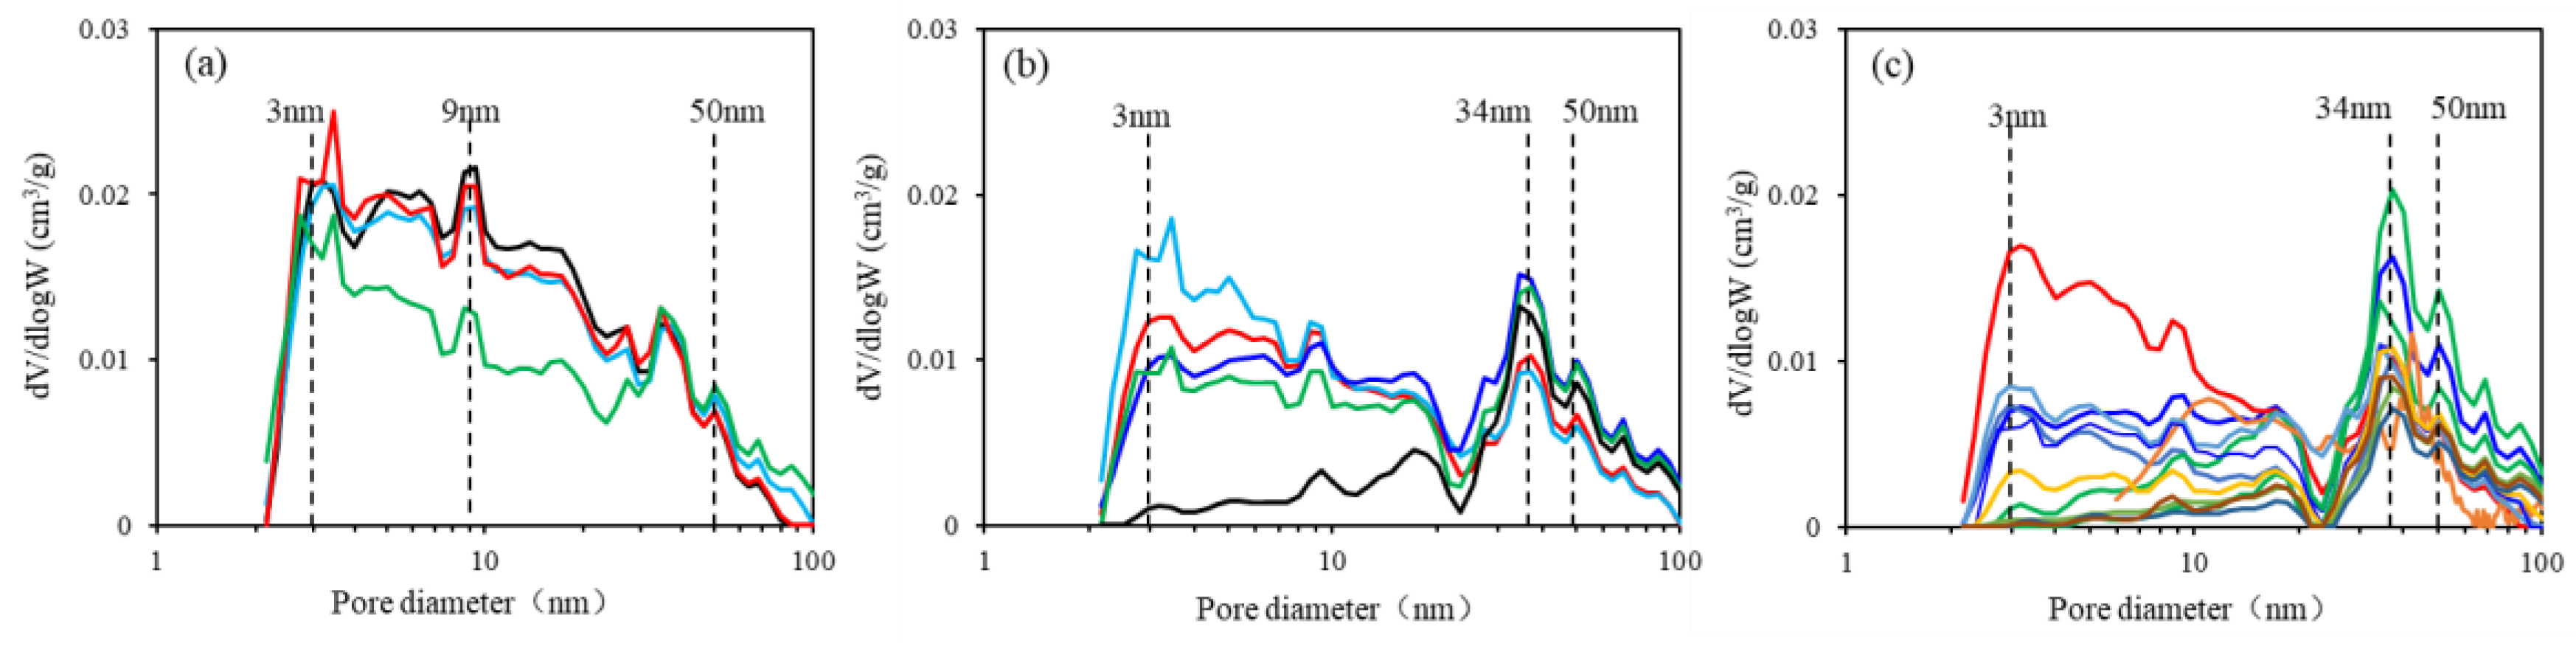
The laminated organic matter-lean shales show desorption isotherms steeper than adsorption isotherms and form wide hysteresis loops at P/Po around 0.5, which indicates mainly pore types of H2 that represent open pores and micro-fractures (Figure 5a). All of them have adsorbed volumes greater than 15 cm3/g, which are much higher than those in the unlaminated organic matter-intermediate shales and laminated organic matter-rich shales (Figure 5). Pore diameters dominantly distribute between 3 nm~9 nm (Figure 6a). The dV/dlogW values are decreasing as pore diameter increases (Figure 6a).

Figure 5.
Low-temperature N2 adsorption-desorption isotherms. (a) Laminated organic matter-lean shale. (b) Unlaminated organic matter-intermediate shale. (c) Laminated organic matter-rich shale.
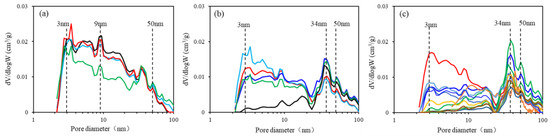
Figure 6.
Pore diameter distributions obtained from low-temperature N2 adsorption. (a) Laminated organic matter-lean shale. (b) Unlaminated organic matter-intermediate shale. (c) Laminated organic matter-rich shale.
Most of the unlaminated organic matter-intermediate shales have smaller hysteresis loops and show N2 adsorption volumes less than 15 cm3/g, suggesting mixed pore types of H2 and H3. There is only one sample that represents the pore type of H4 (Figure 5b). There are two mainly pore distribution crests at 3 nm and 34 nm with approximate dV/dlogW values (Figure 6b).
The laminated organic matter-rich shales show increasing pore types of H4, which indicate slit-shaped pores and narrow slit-like pores. At the same time, N2 adsorbed volumes are lower than the aforesaid two types (Figure 5c). There are also two pore distribution peaks at 3 nm and 34 nm; however, they show higher dV/dlogW values at 34 nm (Figure 6c).
4.4. Pore Characterization from High-Pressure MIP
High-pressure MIP is used to quantify macropores (D > 100 nm) in this study. For the high-pressure MIP, a certain pressure corresponds to a specific pore diameter. The volume of mercury intrusion under a specific pressure reflects the pore volume within the corresponding pore size. All the studied samples exhibit similar shapes of mercury intrusion curves but different cumulative intrusion volumes (Figure 7).
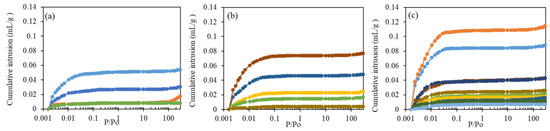
Figure 7.
Mercury intrusion curves. (a) Laminated organic matter-lean shale. (b) Unlaminated organic matter-intermediate shale. (c) Laminated organic matter-rich shale.
The laminated organic matter-lean shale exhibits two different mercury intrusion trends. For the first category (the green and orange curves), intrusion volumes hardly increase with P/Po. For the second category (the blue curves), intrusion volumes increase to 0.02 mL/g~0.05 mL/g when P/Po reaches 0.02, and then almost remain the same intrusion volumes even though P/Po is increasing (Figure 7a). This indicates that the first category almost develops no macropores, and the second category consists of some macropores with a diameter of 5000 nm~100,000 nm (Figure 8a).
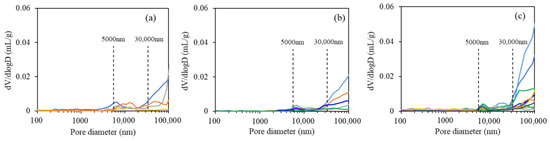
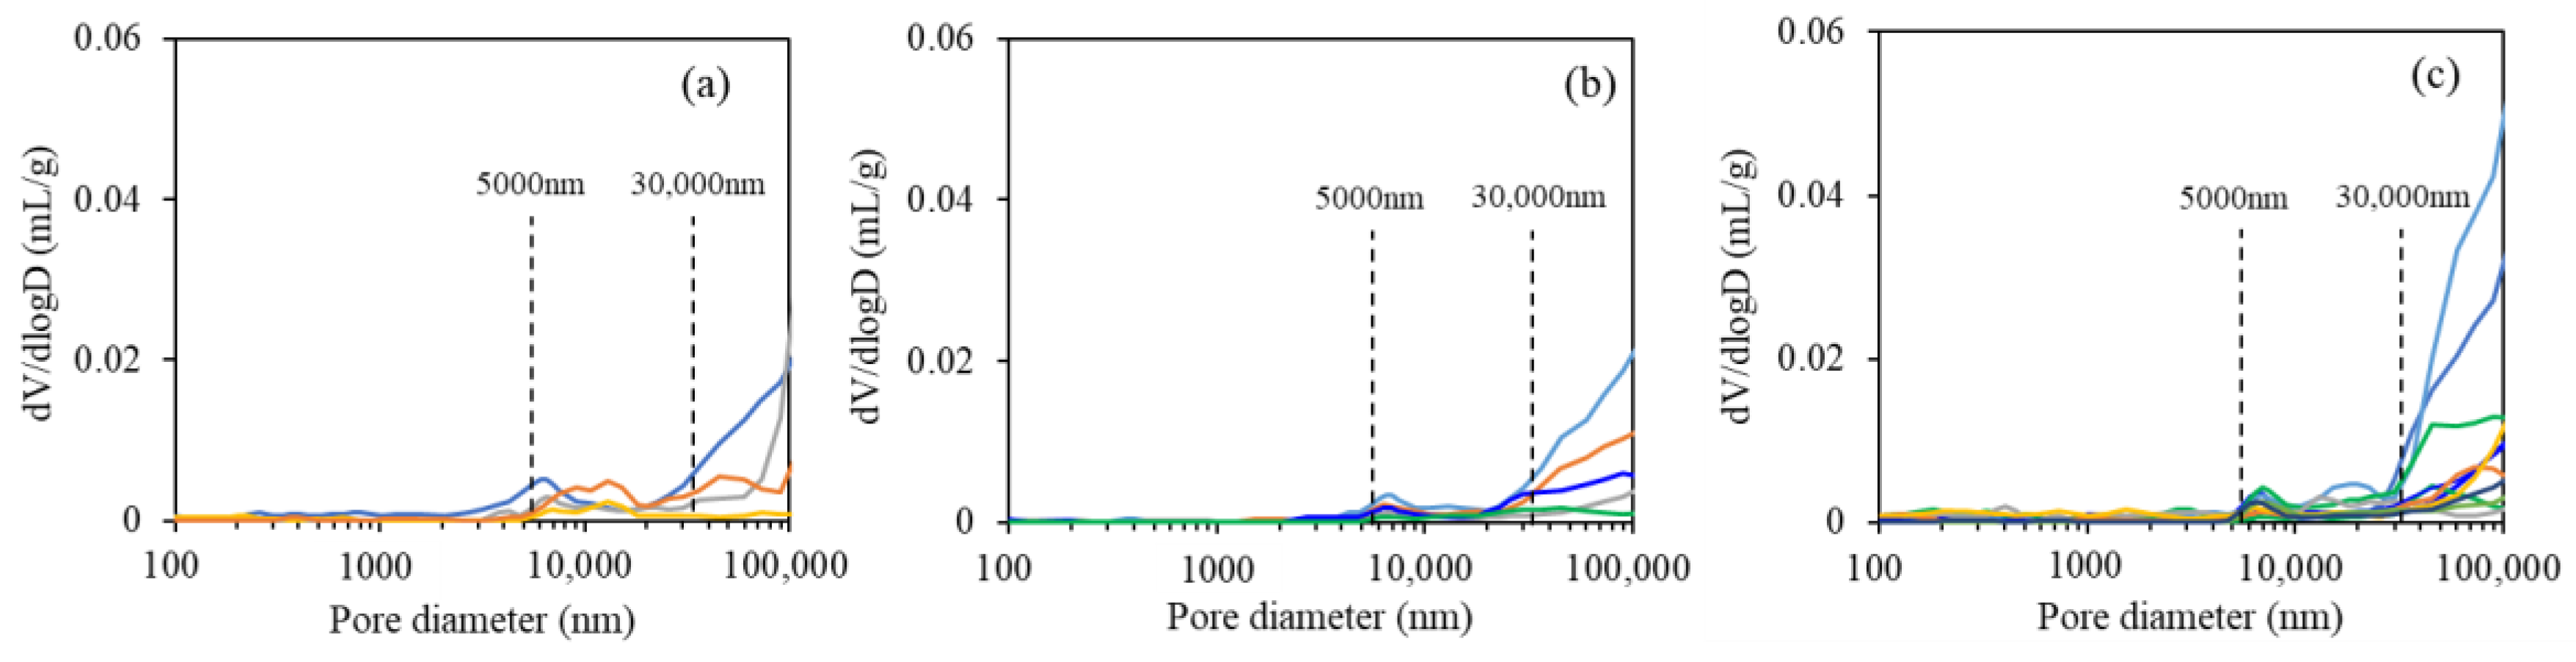
Figure 8.
Pore diameter distributions obtained from high-pressure MIP. (a) Laminated organic matter-lean shale. (b) Unlaminated organic matter-intermediate shale. (c) Laminated organic matter-rich shale.
When coming to the unlaminated organic matter-intermediate shale and laminated organic matter-rich shale, cumulative intrusion volumes for three samples can exceed 0.05 mL/g when P/Po reach 0.02 (Figure 7b,c). Correspondingly, the quantity of macropores with a diameter of 30,000 nm~100,000 nm is higher (Figure 8b,c).
5. Discussion
5.1. Full-Scale Pore Structure Characterization
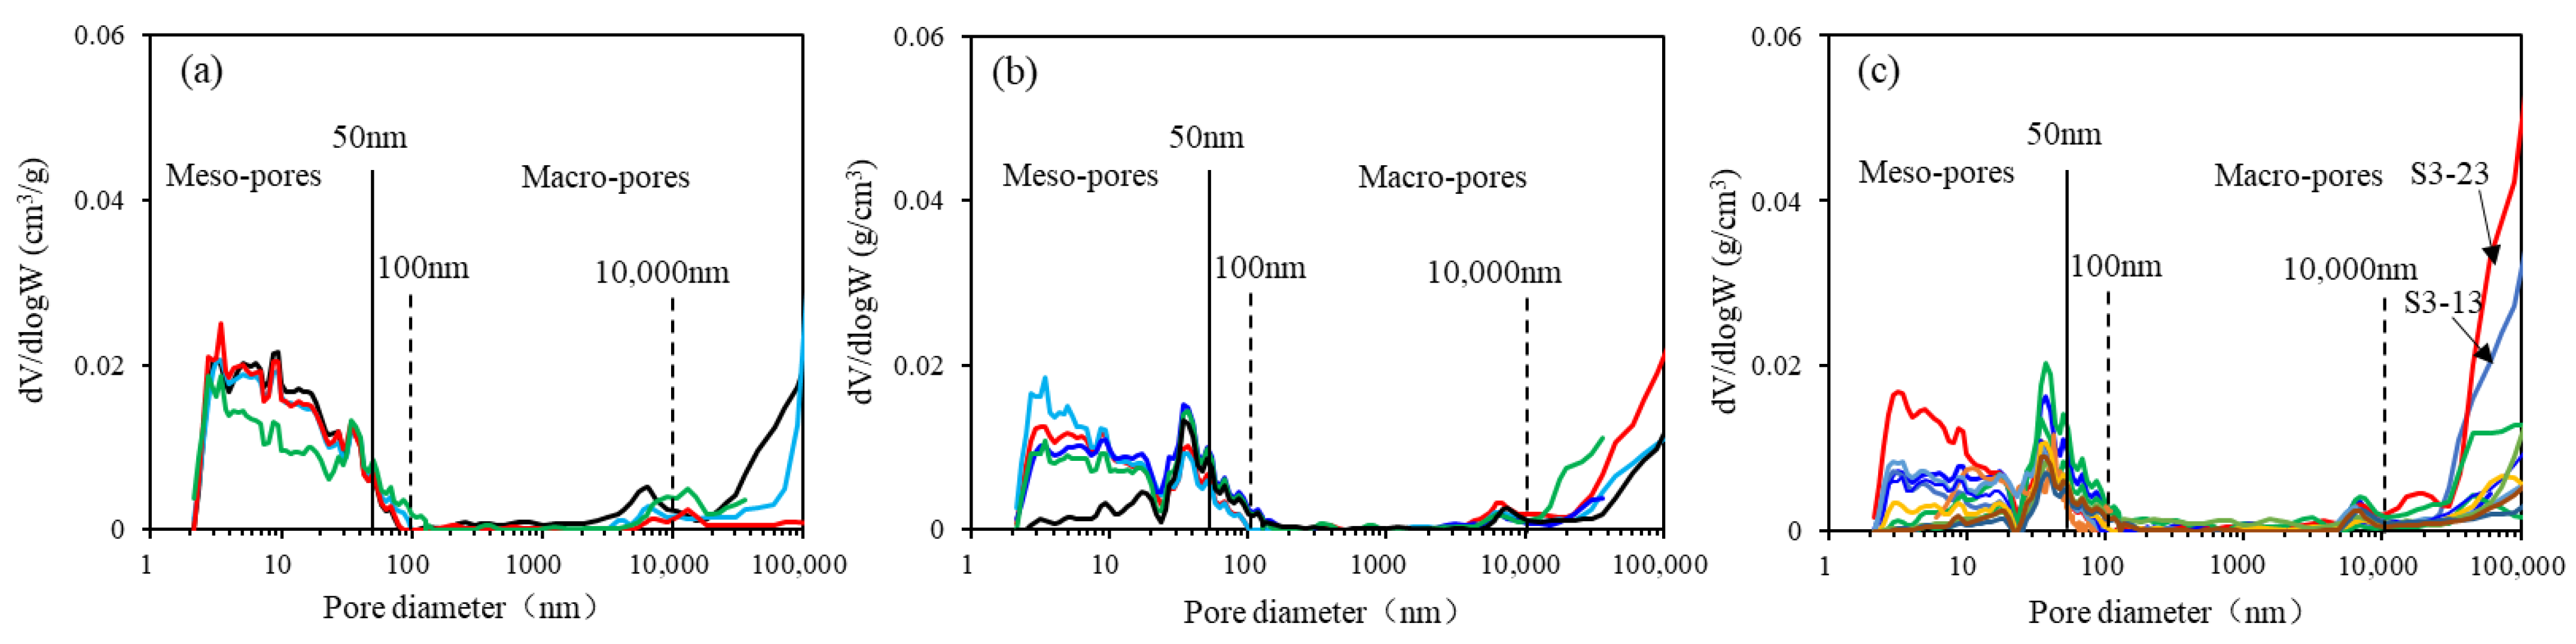
According to results from low-temperature N2 adsorption and high-pressure MIP, full-scale pore structures are represented (Figure 9). Theoretically, high-pressure MIP can be used to detect pore structures with pore diameters ranging from 3.6 nm to 100,000 nm [35,36]. However, in shale samples with high amounts of organic matter and clay minerals, pore volumes estimated from pores of 3.6 nm~100 nm are always overestimated by the high-pressure MIP method. The reasons are, on the one hand, that micropores related to organic matter and clay minerals will be formed due to very high pressure; on the other hand, ink bottle-shaped pores with a pore throat less than 100 nm are not detected accurately [37]. Thus, we use low-temperature N2 adsorption and high-pressure MIP to analyze pores with diameters of 2 nm~100 nm and 100 nm~100,000 nm, respectively. To better evaluate pore distributions, pore diameter is divided into four categories according to mesopore/macropore boundaries (the solid line) and distributing peaks (the dotted lines) in Figure 9. Table 2 presents the pore volumes of the four categories, which are referred to as Volume 1 (2 nm < D < 50 nm), Volume 2 (50 nm < D < 100 nm), Volume 3 (100 nm < D < 10,000 nm) and Volume 4 (10,000 nm < D < 100,000 nm).
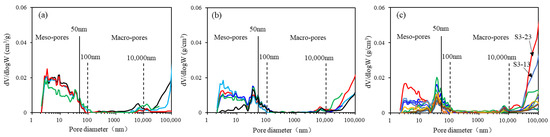
Figure 9.
Full-scale distribution of log differential pore volumes obtained by MIP and low-temperature N2 adsorption for the shale of the third member of the Jiufotang Formation. (a) Laminated organic matter-lean shale. (b) Unlaminated organic matter-intermediate shale. (c) Laminated organic matter-rich shale. The solid line at 50 nm is the boundary between mesopore and macropore. The dotted lines at 100 nm and 10,000 nm are drawn according to pore distribution peaks.
Table 2.
Volumes of full-scale pores of shales in the third member of the Jiufotang Formation.
Each sample shows a higher Volume 1 than Volume 2, Volume 3, and Volume 4 (Table 2). Average Volume 1 for the laminated organic matter-lean shale is 0.029 cm3/g, which is higher than that for the unlaminated organic matter-intermediate shale (0.019 cm3/g) and laminated organic matter-rich shale (0.011 cm3/g) (Figure 10a). Whereas, average volumes 2, 3, and 4 for the laminated organic matter-lean shale are 0.0019 cm3/g, 0.0011 cm3/g, and 0.0030 cm3/g, which are close to those for the unlaminated organic matter-intermediate shale and laminated organic matter-rich shale (Figure 10a). This indicates that mesopore is the dominant pore type for all the shale, as the percents of Volume 1 are 82.9%, 73.7%, and 62.5% for the laminated organic matter-lean shale, unlaminated organic matter-intermediate shale, and organic matter-rich shale (Figure 10b). Percentages of Volume 4 are 8.6%, 16.4%, and 21.1% for the laminated organic matter-lean shale, unlaminated organic matter-intermediate shale, and laminated organic matter-rich shale (Figure 10b). Therefore, the pore space of the low-matured shale in the third member of the Jiufotang Formation is mainly contributed by mesopores, followed by macropores with diameters of 10,000 nm~100,000 nm.
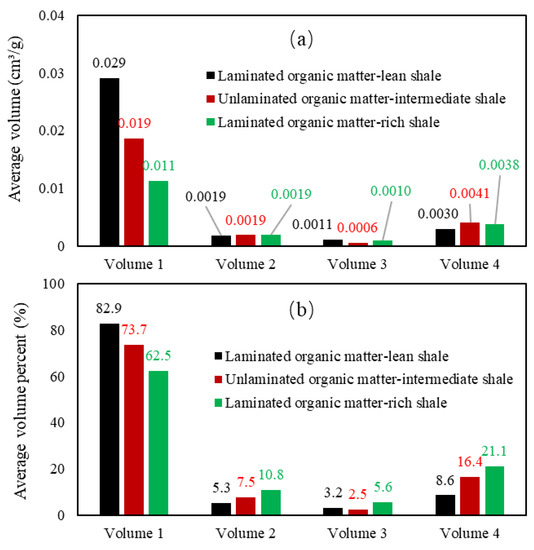
Figure 10.
(a) average total pore volumes and (b) average total pore volume percents for pores of different size. Volume 1, 2, 3, and 4 are respectively calculated from pore diameters of 2 nm~50 nm, 50 nm~100 nm, 100 nm~10,000 nm, and 10,000 nm~100,000 nm.
5.2. Controlling Factors for Full-Scale Pore Development from Shale Compositions
5.2.1. Controlling Factors for the Development of Mesopores
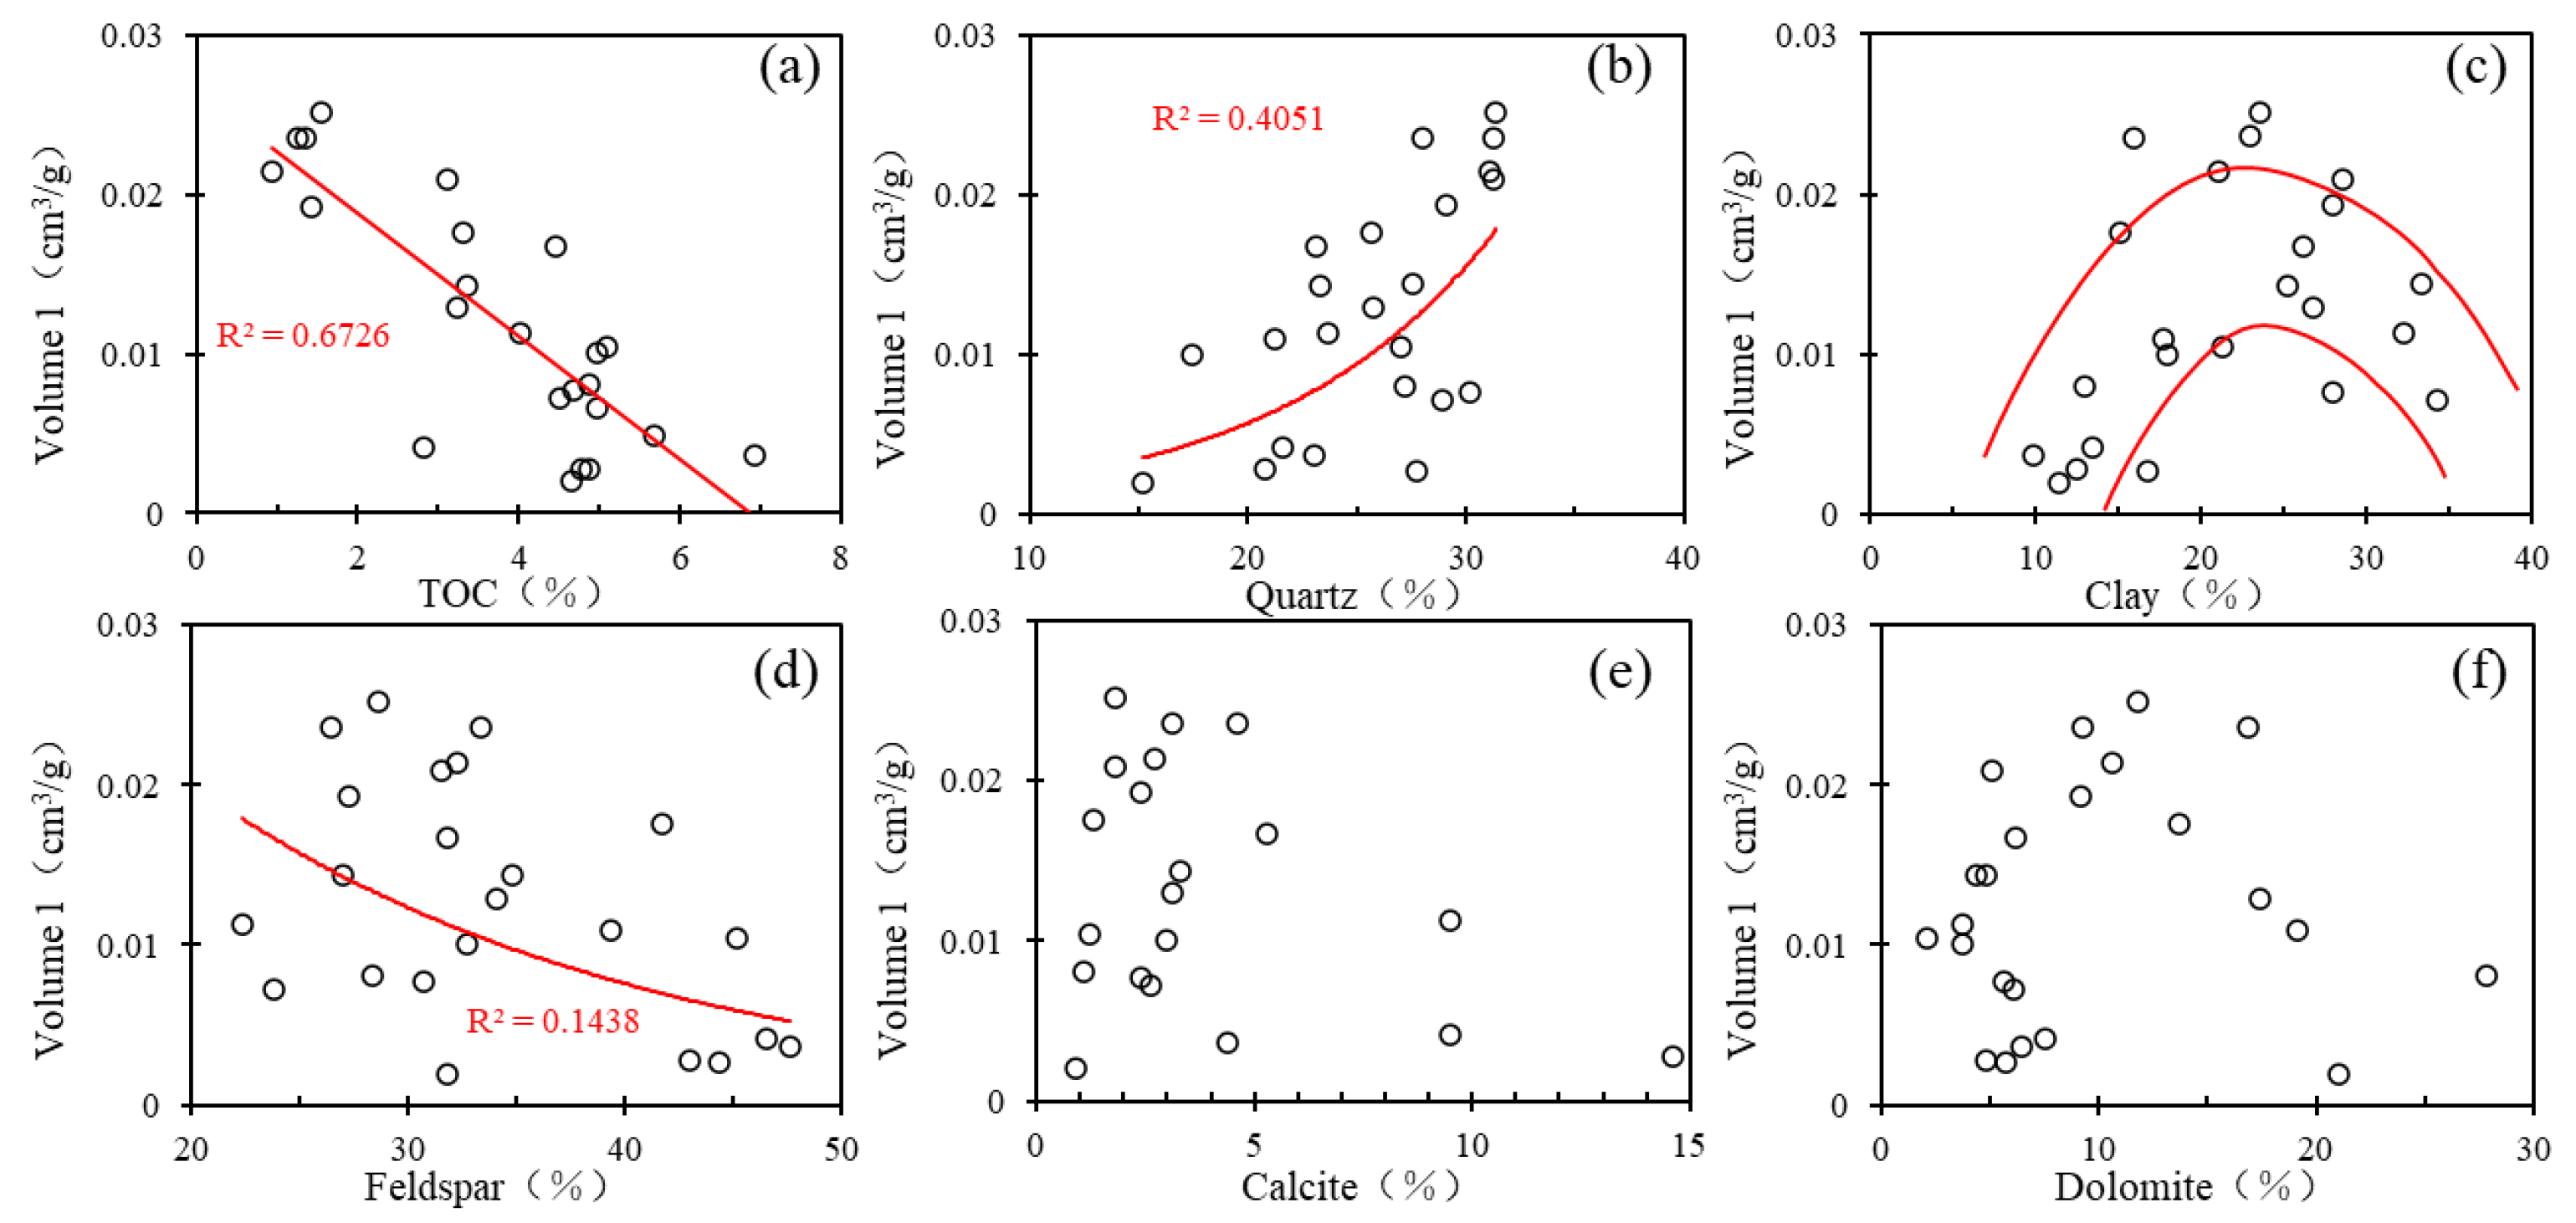
Volume 1, representing mesopore, is negatively correlated to TOC (R2 = 0.6726); however, shows a positive trend with quartz (Figure 11a,b). At the same time, Volume 1 shows no relevance with feldspar, calcite, and dolomite (Figure 11d–f). This indicates that the development of mesopores is mainly related to organic matter and quartz. The abundance of organic pores is usually related to TOC, thermal maturity, and kerogen type [14,16]. They even contribute more than 50% porosity in mature North American shales [2,3]. Primary organic pores are commonly observed in type Ⅲ kerogen during the immature to low-mature stage, as they are inherited from biological structures of the maceral, such as inertinite [12,16]. whereas secondary organic pores, formed as a result of hydrocarbon generation and expulsion, are generally developed in type II kerogen during the mature to overmature stage [3,5,37,38,39]. Shale samples in the third member of the Jiufotang Formation show Ro of 0.66%~0.68%, kerogen type of II1 and maceral compositions of amorphous organic matter (AOM, 73.67%~82.33%), inertinite (12%~18.67%), vitrinite (3.33%~6.33%), and alginite (1.67%~3%) (Table 3). Thus, in the studied shale, primary organic pores are rarely developed due to the depletion of inertinite, and secondary organic pores are neither generated in quantity nor generated in quantity due to the low thermal maturity. According to Li et al. (2018) [40], the generation peak of organic acids is in the middle thermal maturation stage (Ro = 0.89%~1.25%). The dissolution of shale reservoirs by organic acids does not have an overall significance; it only occurs if organic acids move along fractures and dissolve adjacent minerals. Although dissolution pores in shales of the Wufeng Formation and the Longmaxi Formation at the Sichuan Basin are common [41], their size is too small compared to the primary interP pores. In addition, the negative correlation between TOC and Volume 1 demonstrates that organic matter had occupied some pore spaces and restrained the development of mesopores (Figure 4h). Therefore, we think the effect of the thermal evolution of organic matter on improving the porosity of the shale reservoir in this study is minor.
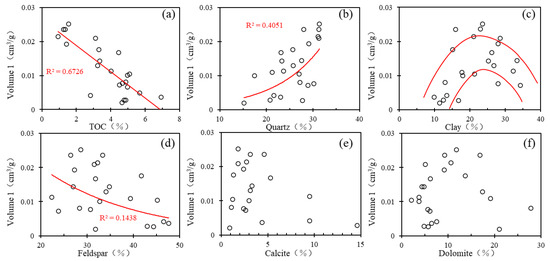
Figure 11.
Interrelationships between Volume 1 and shale compositions. Volume 1 is the total volume calculated from the pore diameter located at 2 nm~50 nm. (a) Volume 1 vs. TOC, (b) Volume 1 vs. quartz content, (c) Volume 1 vs. clay mineral content, (d) Volume 1 vs. feldspar content, (e) Volume 1 vs. calcite content, (f) Volume 1 vs. dolomite content.
Table 3.
Maceral compositions and Ro for shales in the third member of the Jiufotang Formation.
The abundance of inorganic pores is both related to sedimentation and diagenesis. InterP pores, distributed among quartz, plagioclase, and clay minerals, are the most common inorganic pore type (Figure 4). During compression, interP pores can be preserved among rigid quartz and carbonate minerals [13,21]. On the other side, interP pores adjacent to flexible compositions such as clay and organic matter will be squeezed, minished, and even disappear under strong compression [42]. Compression exerts an obvious influence on large mesopores [43] and rarely shows an effect on small mesopores [6]. A clearly positive correlation between quartz and Volume 1 reveals that quartz has played a key role in protecting mesopores from compression.
Notably, Volume 1 increases with the content of clay minerals when it is less than 25% and shows a descending trend when it is more than 25% (Figure 11c). These increased mesopores related to clay minerals are probably inter-C pores (Figure 4b), while those decreased mesopores are probably primary interP pores. Although calcite, dolomite, and feldspar are rigid minerals, they are easily dissolved, re-crystallized, and filled up in the pores during diagenesis [25,26]. Their complicated behavior during diagenesis may explain why there is no clear relationship between them and Volume 1.
5.2.2. Controlling Factors for the Development of Macropores
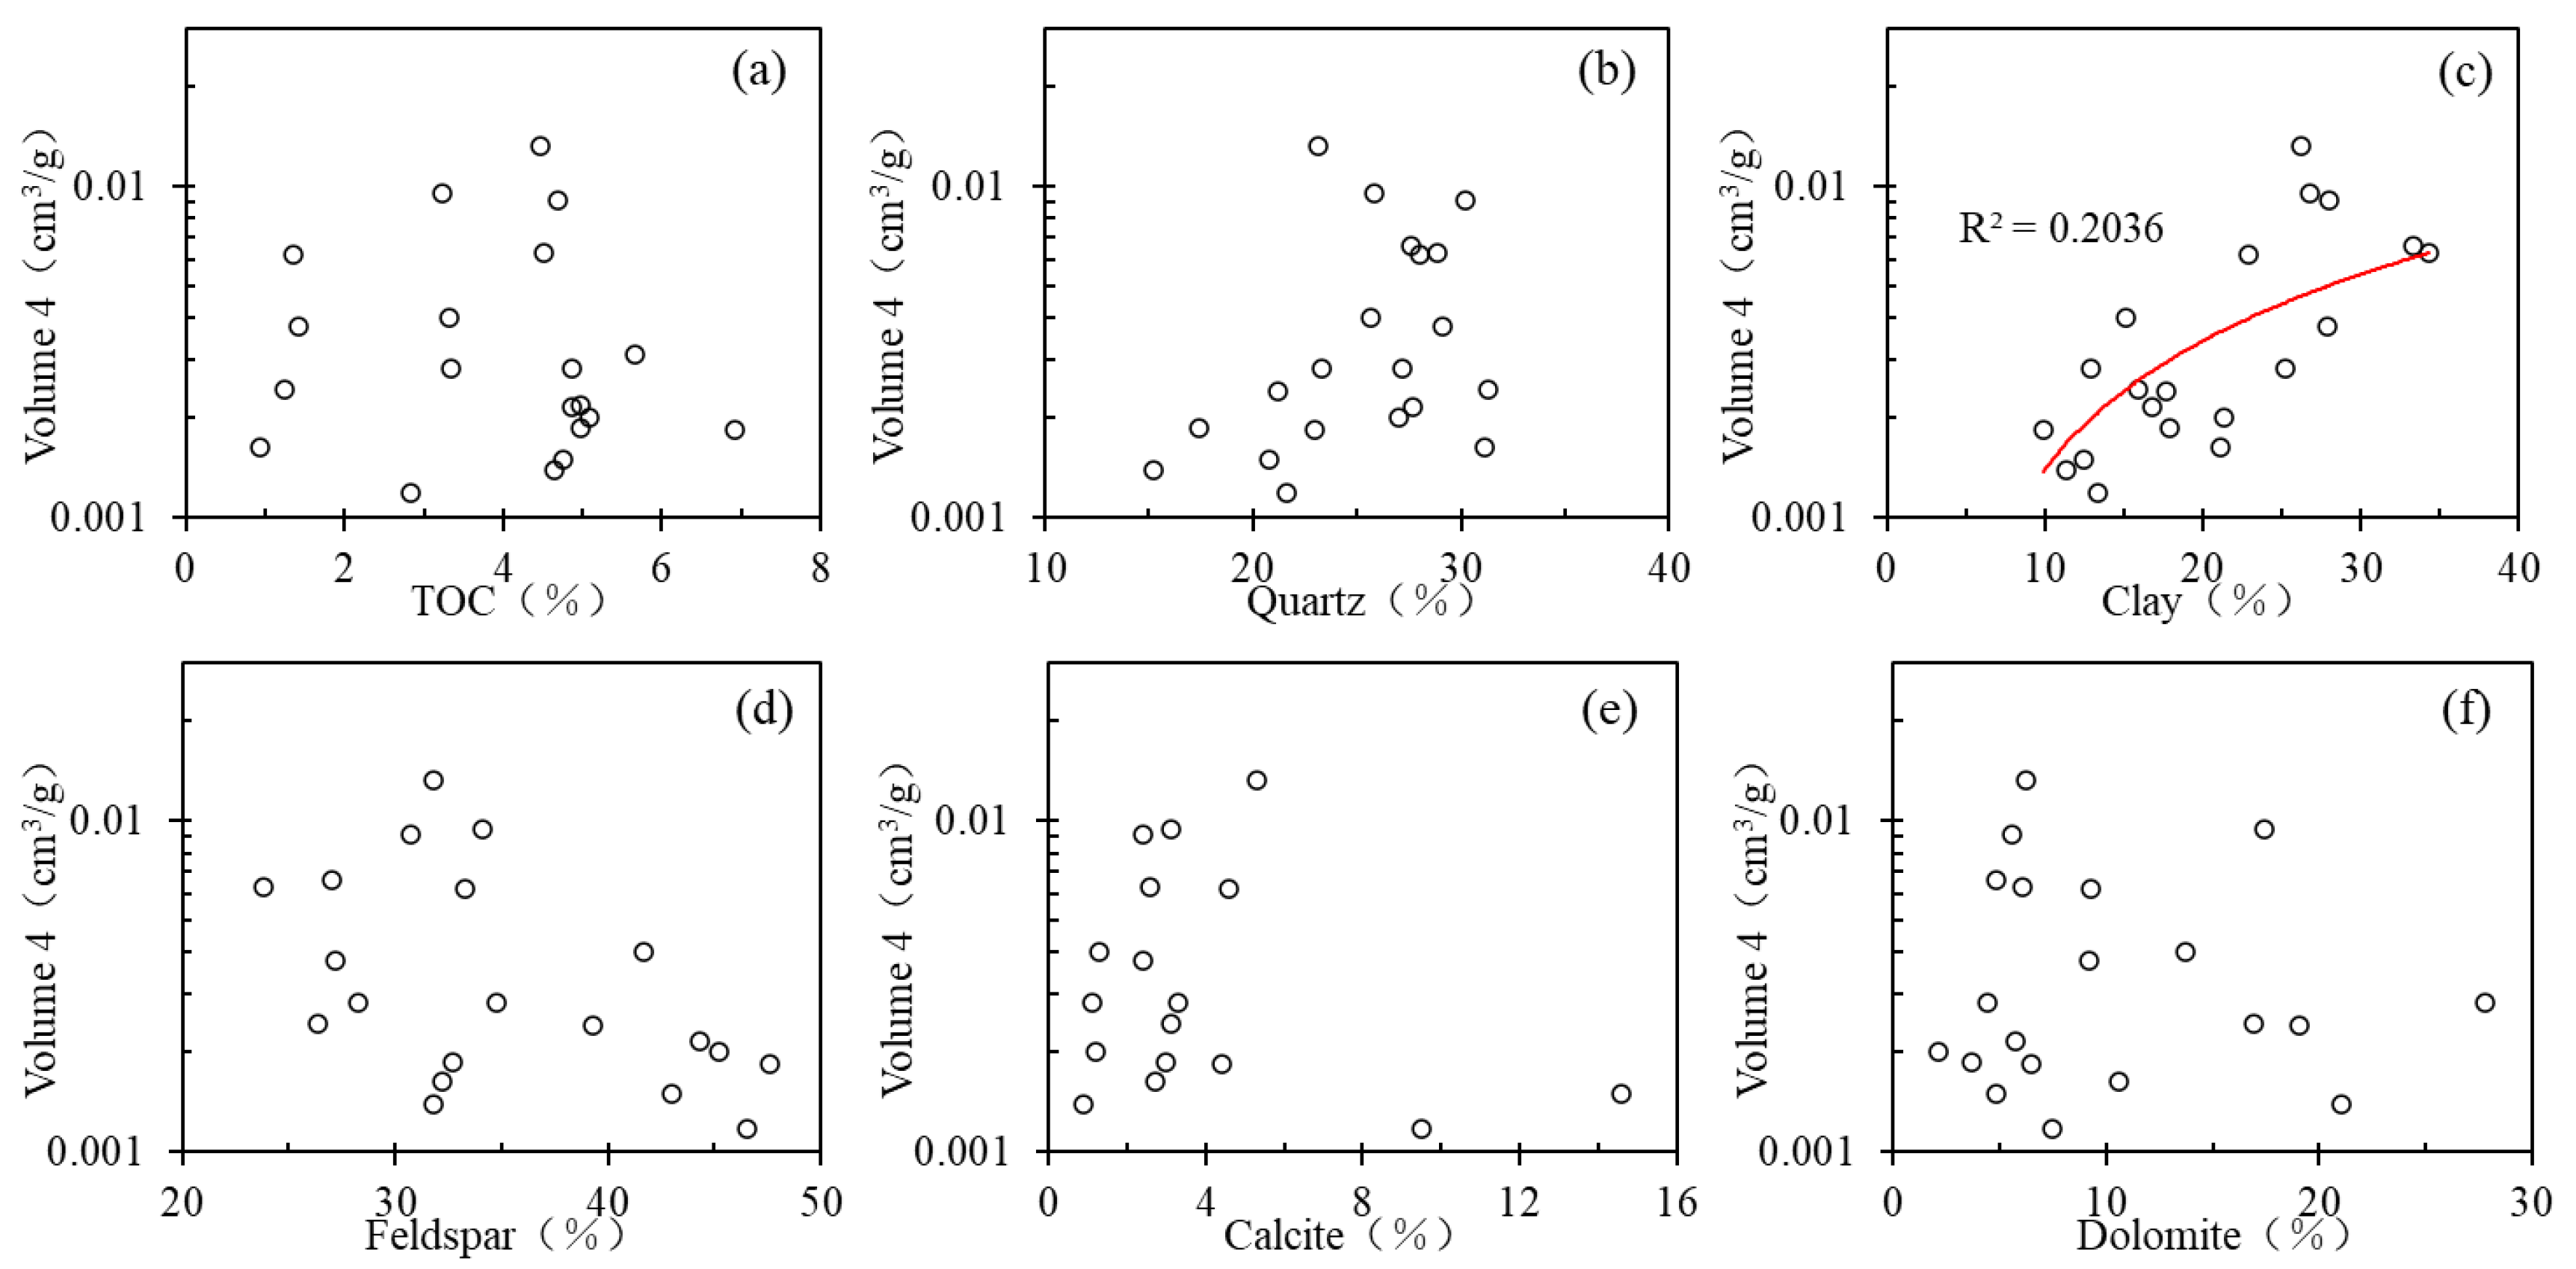
Volume 2 and Volume 3 averagely contribute less than 15% of the total pore volume (Figure 10b). Therefore, it is not necessary to discuss controlling factors for Volume 2 and Volume 3. Volume 4 shows no obvious correlation with TOC, quartz, feldspar, calcite, or dolomite (Figure 12a,b,d–f). Primary interP pores, outlined by red dotted lines in Figure 4, distribute among anhedral and subhedral minerals that suffered abrasion during transportation and sedimentation (Figure 4a,c,d,f,h). Most of them are filled with micron-euhedral diagenetic pyrite, dolomite, and quartz, which have greatly reduced pore spaces. whereas these diagenetic minerals are rigid and present a point or line contact relationship, and interP pores have been preserved due to their support. This indicates that the development of macropores is both related to sedimentation and diagenesis and cannot be simply clarified by shale compositions, especially when detrital and diagenetic minerals are not distinguished.
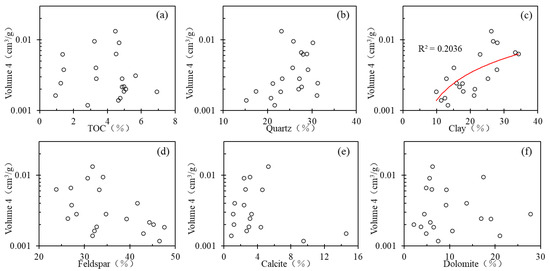
Figure 12.
Interrelationships between Volume 4 and shale compositions. Volume 4 is the total volume calculated from the pore diameter located at 10,000 nm~100,000 nm. (a) Volume 4 vs. TOC, (b) Volume 4 vs. quartz content, (c) Volume 4 vs. clay mineral content, (d) Volume 4 vs. feldspar content, (e) Volume 4 vs. calcite content, (f) Volume 4 vs. dolomite content. Volume 4 shows a weakly positive association with clay minerals, with R2 = 0.2036 (Figure 12c). Ro of the third member of the Jiufotang Formation ranges from 0.66% to 0.68% and indicates the mesogenetic A stage during which quantities of smectite are transforming to illite [44]. Microfractures or pores can be generated during smectite-illite transformation due to crystal shrinkage [18], and they are commonly observed in shales at the first member of the Qingshankou Formation [19,20]. Moreover, curvy inorganic microfractures can be observed within clay lumps (Figure 4b), clay laminae (Figure 4e,g), or between clay laminae and other minerals (Figure 4i). Consequently, we consider the limited increase in Volume 4 to result from the transformation of smectite to illite [45,46,47].
5.3. Controlling Factors for Full-Scall Pore Development from Paleo-Environment
Sedimentary structure and texture are good indicators for hydrodynamics and water depth. Shallow water with a high flow rate possesses strong hydrodynamic force and tends to deposit coarse particles and form thick laminae or homogeneous textures. On the other side, deep water with a low flow rate tends to deposit fine sediments and form thin laminae. At centimeter and millimeter scales, laminae in the laminated organic matter-lean shale are thicker than those in the laminated organic matter-rich shale (Figure 3a,c,d,f). The unlaminated organic matter-intermediate shale shows a homogeneous texture (Figure 3b,e). Moreover, detrital quartz and plagioclase show bigger sizes in the laminated organic matter-lean shale and unlaminated organic matter-intermediate shale (Figure 3d,e). Thus, the laminated organic matter-lean shale and unlaminated organic matter-intermediate shale were deposited in shallow water, and the laminated organic matter-rich shale was deposited in deep water.
Pyrite commonly developed in organic-rich sediments is always considered to be related to organo-clastic sulfate reduction (OSR, 2CH2O + SO42− → 2HCO3− + H2S) or anaerobic oxidation of methane (AOM, CH4 + SO42− → HCO3− + HS− + H2O) in anoxic to sulfidic water [47,48,49]. Laminated organic matter-rich shale has a higher content of pyrite and organic matter compared to laminated organic matter-lean shale and unlaminated organic matter-intermediate shale (Table 1, Figure 2g–i). This indicates that laminated organic matter-lean shale and unlaminated organic matter-intermediate shale were probably deposited in anoxic water, while laminated organic matter-rich shale was deposited in sulfidic water.
Meanwhile, many calcites are accompanied by pyrites and organic matter (Figure 2i and Figure 4g,h). This is possibly related to water alkalization, as HS− and H2S generated by OSR and AOM were consumed by pyrite mineralization [50]. Calcite precipitation is found to be promoted by pyrite mineralization in the Amazon shelf sediments [51]. In addition, high productivity from algal blooms could stimulate calcite precipitation as nutrient-rich surface water will promote CO2 assimilation and lead to calcite supersaturation [52,53]. Consequently, the increasing contents of organic matter, pyrite, and calcite from the laminated organic matter-lean shale and unlaminated matter-intermediate to laminated matter-rich shale may suggest increasing productivity, reducibility, and alkalinity of the corresponding water when they were deposited.
5.4. Conceptual Model for the Full-Scale Pore Development
Shale in the third member of the Jiufotang Formation was formed in the early Cretaceous in accordance with a high level of atmospheric CO2. During this period, the climate was hot and humid, which led to deeper seawater [54,55]. Sporopollen in this area records a semi-humid subtropical climate at this stage [56]. Thus, we set a shallow to deep water background for the sedimentation of shale. Based on the aforesaid analysis of full-scale pore distribution, shale composition, and paleoenvironment, we outline a conceptual model for the development of full-scale pores (Figure 13).
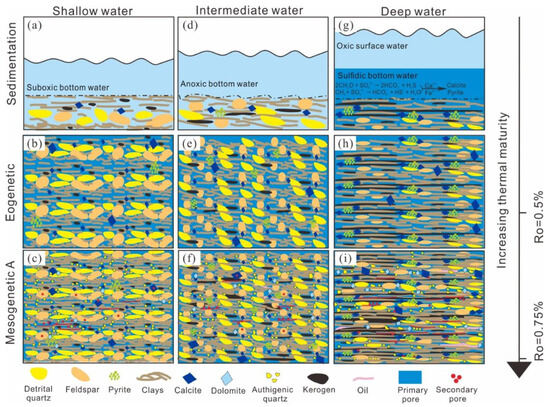
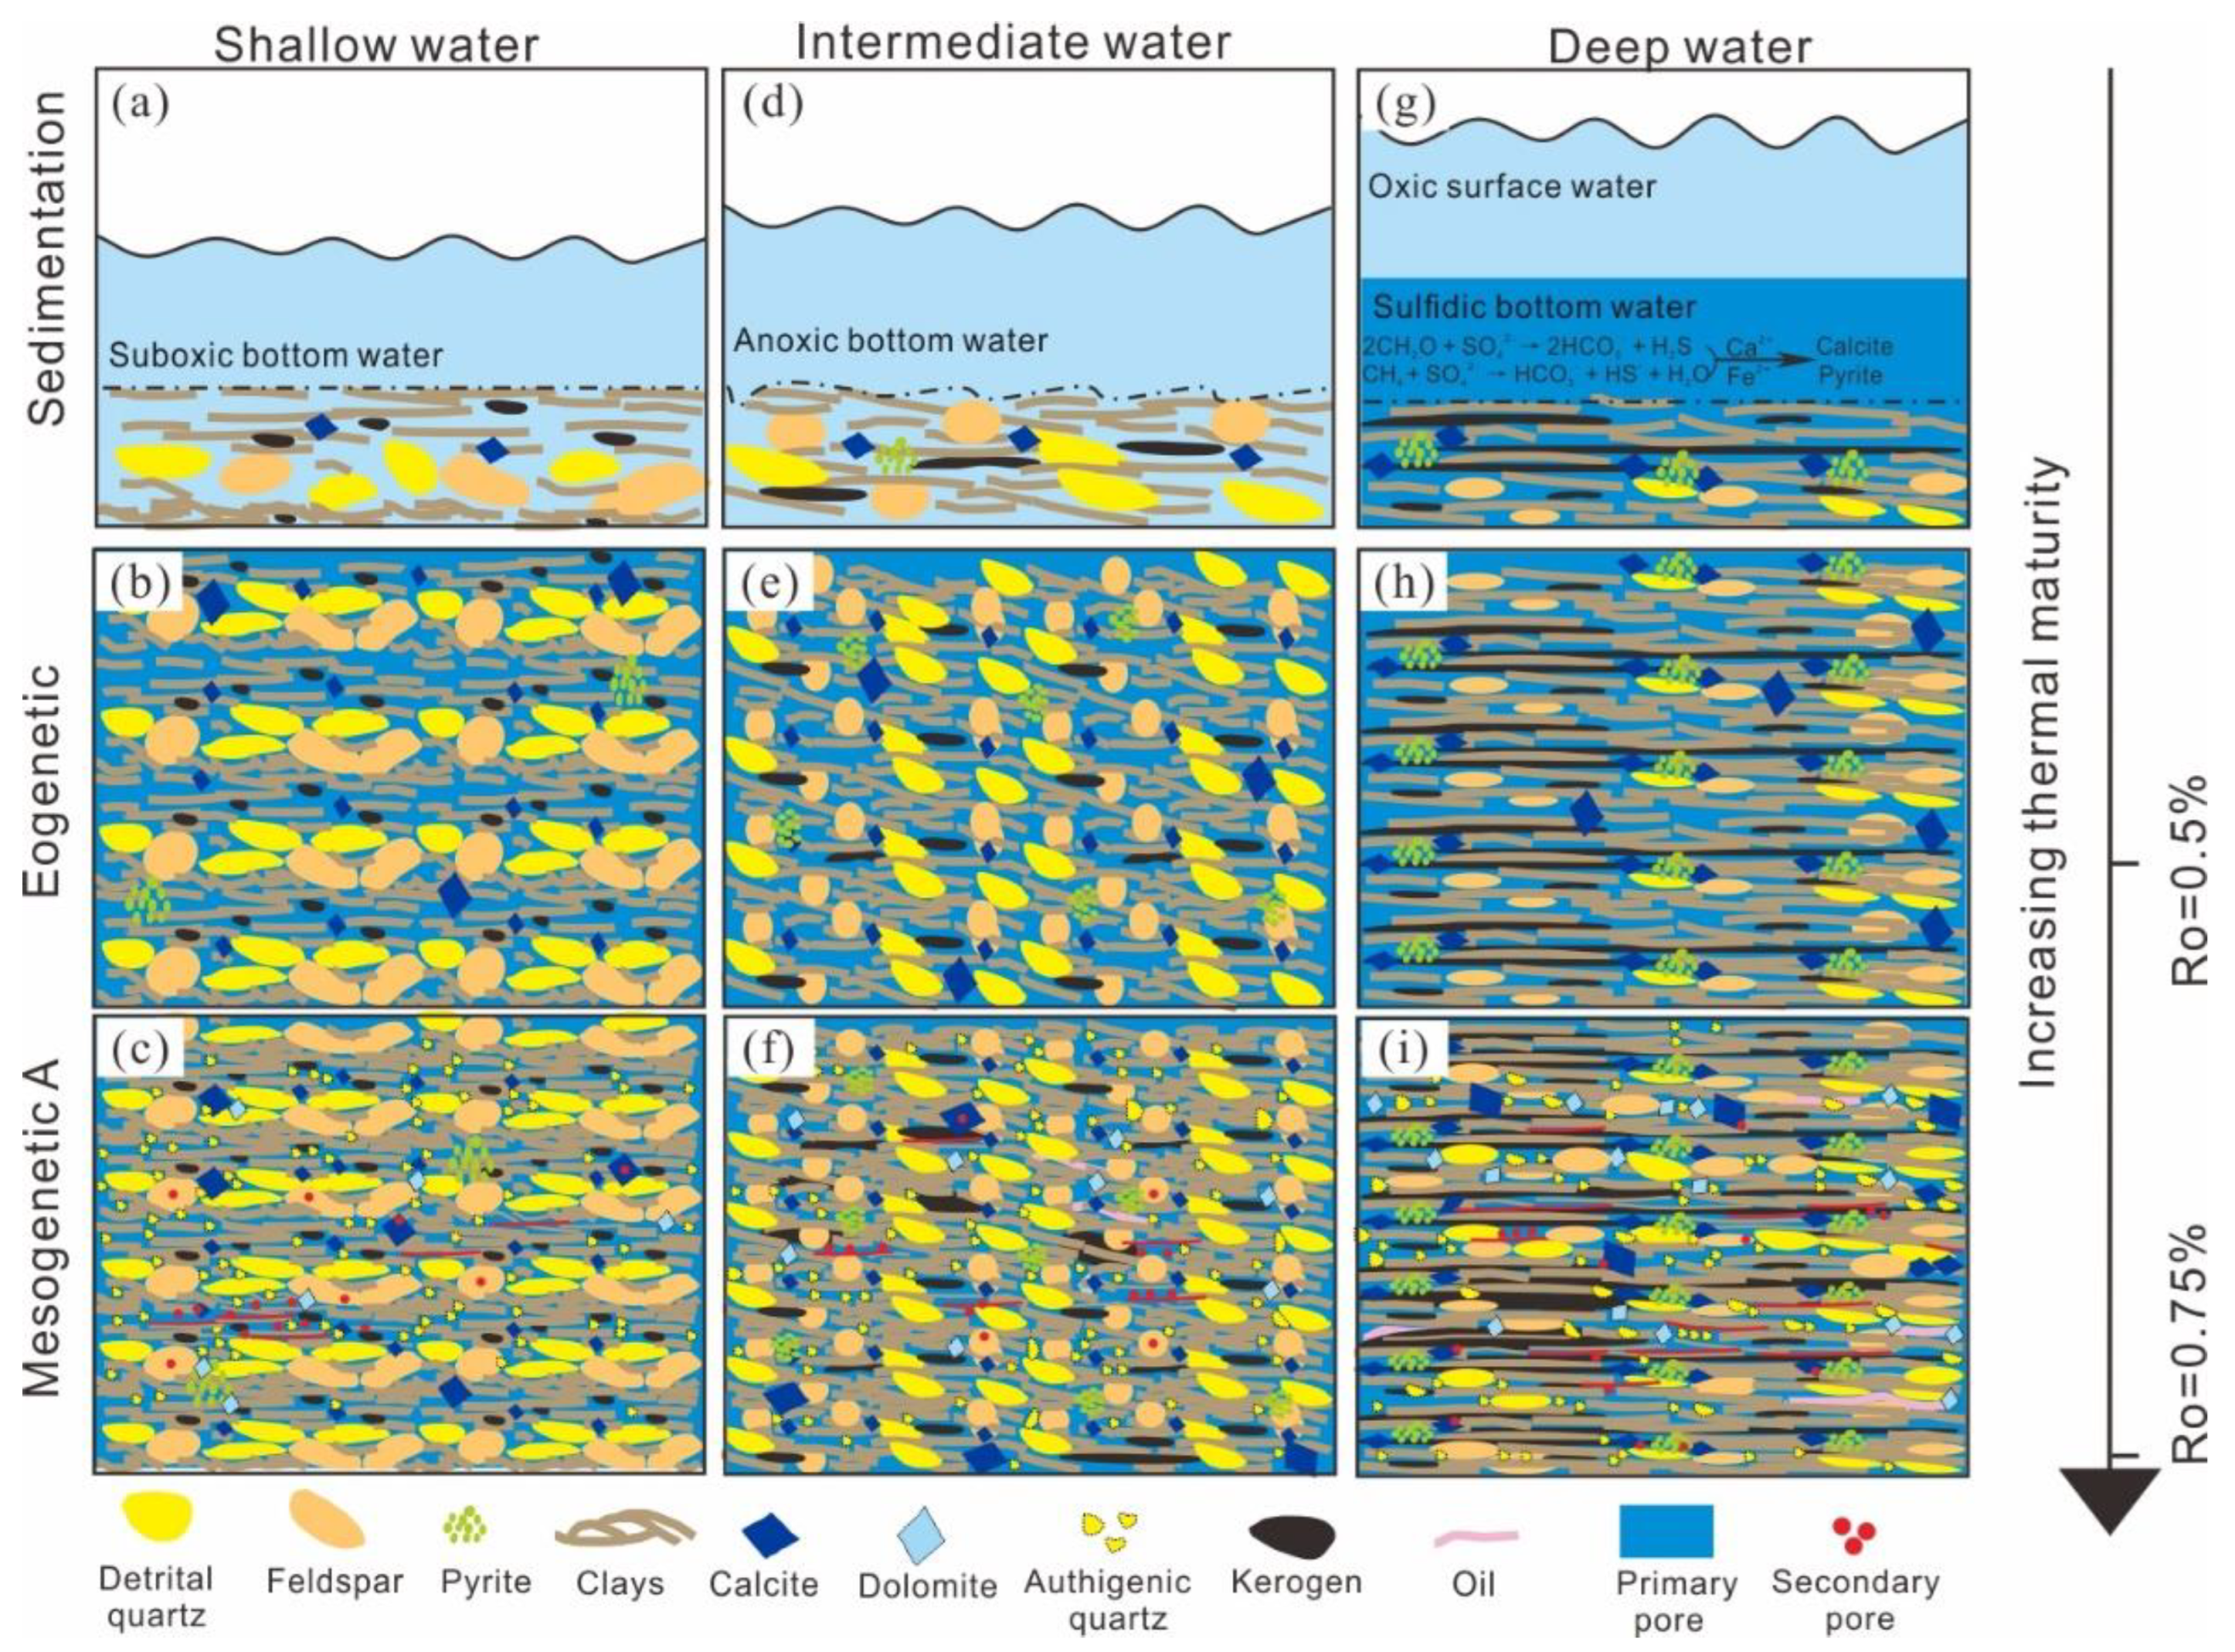
Figure 13.
Conceptual model for the development of full-scale pores in the shale of the third member of the Jiufotang Formation. (a–c) are evolution model for shale formed in shallow water. (d–f) are evolution model for shale formed in intermediate water. (g–i) are evolution model for shale formed in deep water.
The laminated organic matter-rich shale was deposited in the shallow water. Moderate hydrodynamic force led to the formation of thick parallel laminae and a high content of coarse particles (especially quartz). At the same time, bottom water overturning was relatively strong and increased dissolved oxygen, which resulted in a low content of organic matter due to oxidative decomposition (Figure 13a). During sedimentation, primary macropores were formed among large particles, and primary mesopores were formed among the mixture of clay minerals, organic matter, and fine particles. During the eogenetic stage, pore water was expelled and pore volume largely decreased because of compression (Figure 13b). When coming to the mesogenetic stage, many diagenetic quartz and dolomite grains were formed in the primary interP pores. In return, these diagenetic, rigid minerals set up pore frameworks within the primary interP pores and retained many pores from further compression (Figure 13c). Once the macropores were compressed into mesopores, compression would show a rare influence on small mesopores with a main diameter of 2 nm~10 nm. The higher content of rigid quartz and lower content of flexible organic matter were good for the development of mesopores in the laminated organic matter-lean shale.
The unlaminated organic matter-intermediate shale was deposited in the intermediate water. Homogeneous texture and coarse particles were probably related to underflow, which was very common in this area during the Jiufotang stage [49]. Dissolved oxygen in the bottom water decreased to an anoxic state as the water depth increased, leading to a moderate content of organic matter and some scattered pyrite (Figure 13d). At the eogenetic stage, primary macropores largely decreased, and minerals turned to point-contact relationships due to compression (Figure 13e). As we entered the mesogenetic A stage, organic matter and clay minerals were squeezed into the primary macropores, in which diagenetic quartz, pyrite, and dolomite precipitated. Occasionally, secondary pores and fractures developed due to the dissolution of carbonate minerals and the transformation of smectite to illite (Figure 13f). The increased content of flexible organic matter had resulted in a decrease in mesopores in the unlaminated organic matter-intermediate shale.
The laminated organic matter-rich shale was deposited in the deep stratified water, which was critical for organic matter accumulation. In the water with weak hydrodynamic force, thin, curvy, and continuous laminae were formed by OM laminae and clay laminae (Figure 13g). In the sulfidic bottom water, H2S, HS− and HCO3− were generated due to AOM or OSR, and then pyrite was precipitated as H2S and HS− were consumed by Fe2+, which was followed by calcite precipitation due to increased alkalinity (Figure 13g). At the eogenetic stage, primary macropores significantly decreased due to compression without the support of coarse particles (Figure 13h). When we reach the mesogenetic A stage, macropores and mesopores further decrease due to the continuing compression and diagenetic mineral precipitation. The highest content of organic matter resulted in the lowest development of mesopores. However, secondary fractures (D > 10 μm) near the weak interfaces between clay laminae and OM laminae were developed, which may be related to the clay transformation rather than the thermal maturation of organic matter (Figure 13i).
6. Conclusions
Shale pore space in the third member of the Jiufotang Formation is dominated by mesopores, with volume values ranging from 0.0027 cm3/g~0.0336 cm3/g. Quartz content has significant impacts on the abundance of mesopores due to its support at the low thermal maturity stage.
Macropores with a diameter of 10,000 nm~100,000 nm are secondary developed, which is both controlled by sedimentation and diagenesis. Diagenesis of clay minerals (I/S) may form some pores/micro-fractures and lead to an increase in the quantity of macropores when the content of clay minerals is lower than 25%.
Unlike the matured and over-matured shales, the paleoenvironment is the ultimate controlling factor for the development of full-scale pores in the low-matured shales. because they usually go through relatively simple diagenetic processes and suffer weak alternations from hydrocarbon generation and organic acid-related water-rock interactions during the thermal maturation of organic matter. The laminated organic matter-lean shale, deposited in shallow and suboxic water, shows a high content of coarser quartz that retained many mesopores from burial. On the other side, the laminated organic matter-rich shale, deposited in deep and sulfidic water, would develop more organic matter, which would fill up some mesopores.
Author Contributions
Data curation, L.G.; Formal analysis, L.C.; Methodology, X.F. and R.J.; Investigation, X.L.; Writing—original draft, H.L. All authors have read and agreed to the published version of the manuscript.
Funding
This research is supported by the National Natural Science Foundation of China (Grant No. U2244207, Grant No. 42202153, Grant No. U20A2093, and Grant No. 2022MD723758).
Data Availability Statement
All the data are listed in the tables of this paper. If more data are required, please contact the first author.
Acknowledgments
A lot of thanks should be given to the PetroChina Liaohe Oilfield Company for supporting this study and to the editors and anonymous reviewers for their valuable suggestions to make this paper better for publication and understanding.
Conflicts of Interest
The authors declare no conflict of interest.
References
- Guo, R.B. Assessment of Shale Oil Potential and Prediction of Movable oil of the Upper Jiufotang Formation in Ludong Sag, Kailu Basin. Ph.D. Thesis, China University of Geosciences, Beijing, China, 2020. [Google Scholar]
- Loucks, R.G.; Reed, R.M.; Ruppel, S.C. Morphology, genesis, and distribution of nanometer-scale pores in siliceous mudstones of the Mississippian Barnett Shale. J. Sediment. Res. 2009, 79, 848–861. [Google Scholar] [CrossRef]
- Loucks, R.G.; Reed, R.M.; Ruppel, S.C. Spectrum of pore types and networks in mudrocks and a descriptive classification for matrix-related mudrock pores. AAPG Bull. 2012, 96, 1071–1098. [Google Scholar] [CrossRef]
- Curtis, M.E.; Cardott, B.J.; Sondergeld, C.H. Development of organic porosity in the woodford shale with increasing thermal maturity. Int. J. Coal Geol. 2012, 103, 26–31. [Google Scholar] [CrossRef]
- Ko, L.T.; Ruppel, S.C.; Loucks, R.G. Pore-types and pore-network evolution in upper Devonian–lower Mississippian Woodford and Mississippian Barnett mudstones: Insights from laboratory thermal maturation and organic petrology. Int. J. Coal Geol. 2018, 190, 3–28. [Google Scholar] [CrossRef]
- Ma, Y.; Ardakani, O.H.; Zhong, N.; Liu, H.; Huang, H.; Larter, S.; Zhang, C. Possible pore structure deformation effects on the shale gas enrichment: An example from the lower Cambrian shales of the Eastern Upper Yangtze Platform, South China. Int. J. Coal Geol. 2020, 217, 103349. [Google Scholar] [CrossRef]
- Iqbal, M.A.; Rezaee, R.; Smith, G.; Ekundayo, J.M. Shale lithofacies controls on porosity and pore structure: An example from Ordovician Goldwyer Formation, Canning Basin, Western Australia. J. Nat. Gas Sci. Eng. 2021, 89, 103888. [Google Scholar] [CrossRef]
- Yuan, Y.; Rezaee, R.; Al-Khdheeawi, E.A.; Hu, S.Y.; Verrall, M.; Zou, J.; Liu, K. Impact of composition on pore structure properties in shale: Implications for micro-/mesopore volume and surface area prediction. Energy Fuels 2019, 33, 9619–9628. [Google Scholar] [CrossRef]
- Iqbal, M.A.; Rezaee, R. Porosity and Water Saturation Estimation for Shale Reservoirs: An Example from Goldwyer Formation Shale, Canning Basin, Western Australia. Energies 2020, 13, 6294. [Google Scholar] [CrossRef]
- Zhao, D.; Zhang, J.; Guan, X.; Liu, D.; Wang, Q.; Jiao, W.; Zhou, X.; Li, Y.; Wang, G.; Guo, Y. Comparing the Pore Networks of Coal, Shale, and Tight Sandstone Reservoirs of Shanxi Formation, Qinshui Basin: Inspirations for Multi-Superimposed Gas Systems in Coal-Bearing Strata. Appl. Sci. 2023, 13, 4414. [Google Scholar] [CrossRef]
- Milliken, K.L.; Rudnicki, M.; Awwiller, D.N. Organic matter-hosted pore system, Marcellus Formation (Devonian), Pennsylvania. AAPG Bull. 2013, 97, 177–200. [Google Scholar] [CrossRef]
- Reed, R.M. Organic-matter pores: New findings from lower-thermal-maturity mudrocks. Gulf Coast Assoc. Geol. Soc. Trans. 2017, 67, 635–636. [Google Scholar]
- Dong, T.; Harris, N.B.; Knapp, L.J.; McMillan, J.M.; Bish, D.L. The effect of thermal maturity on geomechanical properties in shale reservoirs: An example from the Upper Devonian Duvernay Formation, Western Canada Sedimentary Basin. Mar. Pet. Geol. 2018, 97, 137–153. [Google Scholar] [CrossRef]
- Katz, B.J.; Arango, I. Organic porosity: A geochemist’s view of the current state of understanding. Org. Geochem. 2018, 123, 1–16. [Google Scholar] [CrossRef]
- Liu, B.; Maria, M.; Juergen, S. SEM petrography of dispersed organic matter in black shales: A review. Earth-Sci. Rev. 2022, 224, 103874. [Google Scholar] [CrossRef]
- Liu, B.; Wang, Y.; Tian, S.; Guo, Y.; Wang, L.; Yasin, Q.; Yang, J. Impact of thermal maturity on the diagenesis and porosity of lacustrine oil-prone shales: Insights from natural shale samples with thermal maturation in the oil generation window. Int. J. Coal Geol. 2022, 261, 104079. [Google Scholar] [CrossRef]
- Pytte, A.M.; Reynolds, R.C. The thermal transformation of smectite to illite. In Thermal History of Sedimentary Basins; Springer: New York, NY, USA, 1989; pp. 133–140. [Google Scholar]
- Liu, J.; Ding, W.; Wang, R.; Wu, Z.; Gong, D.; Wang, X. Quartz types in shale and their effect on geomechanical properties: An example from the lower Cambrian Niutitang Formation in the Cen’gong block, South China. Appl. Clay Sci. 2018, 163, 100–107. [Google Scholar] [CrossRef]
- Feng, Z.H.; Liu, B.; Shao, H.M.; Wang, C.; Hong, S. The diagenesis evolution and accumulating performance of the mud shale in Qingshankou Formation in Gulong area, Songliao Basin. Pet. Geol. Oilfield Dev. Daqing 2020, 39, 72–85. [Google Scholar]
- Shao, H.; Gao, B.; Pan, H. Diagenesis-pore evolution for Gulong shale in Songliao Basin. Pet. Geol. Oilfield Dev. Daqing 2021, 40, 56–67. [Google Scholar]
- Aldega, L.; Carminati, E.; Scharf, A.; Mattern, F. Thermal maturity of the Hawasina units and origin of the Batinah Mélange (Oman Mountains): Insights from clay minerals. Mar. Pet. Geol. 2021, 133, 105316. [Google Scholar] [CrossRef]
- Corrado, S.; Aldega, L.; Zattin, M. Sedimentary vs. tectonic burial and exhumation along the Apennines (Italy). J. Virtual Explor. Electron. Ed. 2010, 36, 1441–8142. [Google Scholar] [CrossRef]
- Qiu, Z.; Liu, B.; Lu, B.; Shi, Z.; Li, Z. Mineralogical and petrographic characteristics of the Ordovician-Silurian Wufeng-Longmaxi Shale in the Sichuan Basin and implications for depositional conditions and diagenesis of black shales. Mar. Pet. Geol. 2022, 135, 105428. [Google Scholar] [CrossRef]
- Bridge, J. Earth Surface Processes, Landforms and Sediment Deposits; Cambridge University Press: Cambridge, UK, 2008. [Google Scholar]
- Cavelan, A.; Boussafir, M.; Rozenbaum, O. Organic petrography and pore structure characterization of low-mature and gas-mature marine organic-rich mudstones: Insights into porosity controls in gas shale systems. Mar. Pet. Geol. 2019, 103, 331–350. [Google Scholar] [CrossRef]
- Xu, H.; Zhou, W.; Hu, Q. Quartz types, silica sources and their implications for porosity evolution and rock mechanics in the Paleozoic Longmaxi Formation shale, Sichuan Basin. Mar. Pet. Geol. 2021, 128, 105036. [Google Scholar] [CrossRef]
- Zhang, B.; Yan, D.; Drawarh, H.J. Formation Mechanism and Numerical Model of Quartz in Fine-Grained Organic-Rich Shales: A Case Study of Wufeng and Longmaxi Formations in Western Hubei Province, South China. J. Earth Sci. 2019, 6, 302–312. [Google Scholar] [CrossRef]
- Xie, W.; Wang, M.; Wang, H. Diagenesis of shale and its control on pore structure, a case study from typical marine, transitional and continental shales. Front. Earth Sci. 2021, 15, 378–394. [Google Scholar] [CrossRef]
- Li, Y.F.; Zhang, T.W.; Ellis, G.S.; Shao, D.L. Depositional environment and organic matter accumulation of Upper Ordovician-Lower Silurian marine shale in the Upper Yangtze Platform, South China. Palaeogeogr. Palaeoclimatol. Palaeoecol. 2017, 466, 252–264. [Google Scholar] [CrossRef]
- Zhao, D.; Guo, Y.; Wang, G.; Zhou, X.; Zhou, Y.; Zhang, J.; Ren, G. Organic matter enrichment mechanism of Youganwo Formation oil shale in the Maoming Basin. Heliyon 2023, 9, 13173. [Google Scholar] [CrossRef] [PubMed]
- Gou, Q.; Xu, S.; Hao, F.; Yang, F.; Zhang, B.; Shu, Z. Full-scale pores and micro-fractures characterization using FE-SEM, gas adsorption, nano-CT and micro-CT: A case study of the Silurian Longmaxi Formation shale in the Fuling area, Sichuan Basin, China. Fuel 2019, 253, 167–179. [Google Scholar] [CrossRef]
- Gregg, S.J.; Sing, K.S.W. Adsorption, Surface Area and Porosity, 2nd ed.; Academic Press: London, UK, 1982. [Google Scholar]
- Washburn, E.W. The Dynamics of Capillary Flow. Phys. Rev. 1921, 17, 273–283. [Google Scholar] [CrossRef]
- Loucks, R.G.; Reed, R.M. Scanning-electron-microscope petrographic evidence for distinguishing organic matter pores associated with depositional organic matter versus migrated organic matter in mudrocks. Gulf Coast Assoc. Geol. Soc. Trans. 2014, 3, 51–60. [Google Scholar]
- Sing, K.S.W. Reporting physisorption data for gas/solid systems with special reference to the determination of surface area and porosity. Pure Appl. Chem. 1985, 57, 603–619. [Google Scholar] [CrossRef]
- Yurdakal, S.; Garlisi, C.; Özcan, L. (Photo) catalyst characterization techniques: Adsorption isotherms and BET, SEM, FTIR, UV-Vis, photoluminescence, and electrochemical characterizations. In Heterogeneous Photocatalysis; Elsevier: Amsterdam, The Netherlands, 2019; pp. 87–152. [Google Scholar] [CrossRef]
- Wang, M.; Guan, Y.; Li, C.M. Qualitative description and full-pore-size quantitative evaluation of pores in lacustrine shale reservoir of Shahejie Formation, Jiyang Depression. Oil Gas Geol. 2018, 39, 1107–1119. [Google Scholar] [CrossRef]
- Yu, Y.; Wang, Z.; Zhang, K. Advances in quantitative characterization of shale pore structure by using fluid injection methods. J. Geomech. 2020, 26, 201–210. [Google Scholar] [CrossRef]
- Wang, Y.; Liu, L.; Zheng, S.; Luo, Z.; Sheng, Y.; Wang, X. Full-scale pore structure and its controlling factors of the Wufeng-Longmaxi shale, southern Sichuan Basin, China: Implications for pore evolution of highly overmature marine shale. J. Nat. Gas Sci. Eng. 2019, 67, 134–146. [Google Scholar] [CrossRef]
- Zhang, Y.; Liu, L.; Geng, C.; Cheng, Z.; Fang, X. Paleoenvironment, Geochemistry, and Pore Characteristics of the Postmature to Overmature Organic-Rich Devonian Shales in Guizhong Depression, Southwestern China. Geofluids 2021, 2021, 7947116. [Google Scholar] [CrossRef]
- Wang, T.; Tian, F.; Deng, Z.; Hu, H.; Xie, Z. The Pore Structure of Marine to Continental Transitional Shales in the Permian Shanxi Formation on the East Margin of the Ordos Basin, China. Geofluids 2022, 2022, 1424. [Google Scholar] [CrossRef]
- Li, J.J.; Ma, Y.; Huang, K.Z.; Zhang, Y.N.; Wang, W.M.; Liu, J.W.; Li, Z.; Lu, S. Quantitative characterization of organic acid generation, decarboxylation, and dissolution in a shale reservoir and the corresponding applications—A case study of the Bohai Bay Basin. Fuel 2018, 214, 538–545. [Google Scholar] [CrossRef]
- Nie, H.; Sun, C.; Liu, G.; Du, W.; He, Z. Dissolution pore types of the Wufeng Formation and the Longmaxi Formation in the Sichuan Basin, south China: Implications for shale gas enrichment. Mar. Pet. Geol. 2019, 101, 243–251. [Google Scholar] [CrossRef]
- Knapp, L.J.; Ardakani, O.H.; Uchida, S.; Nanjo, T.; Otomo, C.; Hattori, T. The influence of rigid matrix minerals on organic porosity and pore size in shale reservoirs: Upper Devonian Duvernay Formation, Alberta, Canada. Int. J. Coal Geol. 2020, 227, 103525. [Google Scholar] [CrossRef]
- Rouquerol, J.; Avnir, D.; Fairbridge, C.W.; Everett, D.H.; Haynes, J.M. Recommendations for the characterization of porous solids (Technical Report). Pure Appl. Chem. 1994, 66, 1739–1758. [Google Scholar] [CrossRef]
- Wang, X. Diagenetic evolution of Montmorillonite and primary migration of petroleum. Acta Sedimentolgica Sin. 1985, 3, 81–90. [Google Scholar]
- Wei, H.; Chen, D.; Wang, J.; Yu, H.; Tucker, M.E. Organic accumulation in the lower Chihsia Formation (Middle Permian) of South China: Constraints from pyrite morphology and multiple geochemical proxies. Palaeogeogr. Palaeoclimatol. Palaeoecol. 2012, 353–355, 73–86. [Google Scholar] [CrossRef]
- Zhang, Y.; Wu, Z. Sedimentary Organic Carbon Mineralization and Its Contribution to the Marine Carbon Cycle in the Marginal Seas. Adv. Earth Sci. 2019, 34, 202–209. [Google Scholar]
- Li, L. High-Resolution Research on Organic Matter Accumulation Mechanisms of Oil Shales in the Lower Cretaceous Jiufotang Formation, Chaoyang Basin, Western Liaoning Province. Ph.D. Dissertation, Jilin University, Changchun, China, 2021. [Google Scholar]
- Krause, S.; Liebetrau, V.; Löscher, C.R. Marine ammonification and carbonic anhydrase activity induce rapid calcium carbonate precipitation. Geochim. Cosmochim. Acta 2018, 243, 116–132. [Google Scholar] [CrossRef]
- Aller, R.C.; Blair, N.E.; Xia, Q. Remineralization rates, recycling, and storage of carbon in Amazon shelf sediments. Cont. Shelf Res. 1996, 16, 753–786. [Google Scholar] [CrossRef]
- Stabel, H.H. Calcite precipitation in Lake Constance: Chemical equilibrium, sedimentation, and nucleation by algae. Limnol. Oceanogr. 1986, 31, 1081–1093. [Google Scholar] [CrossRef]
- Gruber, N.B.; Wehrli, W.A. The role of biogeochemical cycling for the formation and preservation of varved sediments in Soppensee (Switzerland). J. Paleolim. 2000, 24, 277–291. [Google Scholar] [CrossRef]
- Immenhauser, A. Estimating palaeo-water depth from the physical rock record. Earth-Sci. Rev. 2009, 96, 107–139. [Google Scholar] [CrossRef]
- Larson, R.L.; Erba, E. Onset of the mid-cretaceous greenhouse in the Barremian-Aptian: Igneous events and the biological, sedimentary, and geochemical responses. Paleoceanogr. Paleoclinatology 1999, 14, 663–678. [Google Scholar] [CrossRef]
- Wan, X.; Wu, H.; Xi, D. Terrestrial biota and climate during Cretaceous greenhouse in NE China. Earth Sci. Front. 2017, 24, 18–31. [Google Scholar]


Disclaimer/Publisher’s Note: The statements, opinions and data contained in all publications are solely those of the individual author(s) and contributor(s) and not of MDPI and/or the editor(s). MDPI and/or the editor(s) disclaim responsibility for any injury to people or property resulting from any ideas, methods, instructions or products referred to in the content. |
© 2023 by the authors. Licensee MDPI, Basel, Switzerland. This article is an open access article distributed under the terms and conditions of the Creative Commons Attribution (CC BY) license (https://creativecommons.org/licenses/by/4.0/).