Abstract
Although electrocoagulation combined with zeolite (ECZ) shows higher efficiency in wastewater treatment, the actual contribution of zeolite particle size has not been fully explored. In this work, the influence of particle size of synthetic zeolite SZ (<90, 90–160, and 160–600 μm) on ECZ treatment of compost leachate with very high organic load is investigated together with different electrode materials (Fe, Al, and Zn), current densities (0.003, 0.009 and 0.018 A/cm2), and contact times (10, 20 and 30 min). The results positively highlight that the largest particle size should be used in ECZ, as it leads to a lower increase in pH and temperature, a higher decrease of chemical oxygen demand (COD) and turbidity, and a lower electrode consumption, while causing more damage to the electrode surface. The estimated energy costs ranged from 3.960 kW/m3–1313.657 kW/m3. The Taguchi L9 orthogonal configuration showed the highest COD and turbidity decrease under the conditions of 160–600 µm zeolite particles. The powder X-ray diffractometer (PXRD) analysis shows that interplanar spacing decreases when smaller and medium SZ particle sizes are used, while this effect was not observed with larger zeolite particle size. SEM-EDS shows that oxygen, silicon, and aluminium are the predominant elements in electrogenerated sludge coupled with zeolite.
1. Introduction
Zeolites are natural or synthetically produced hydrated aluminosilicates that are widely used as catalysts, ion exchangers, and molecular sieves due to their specific properties and characteristic structure of cavity channels [1,2]. Most technologies using zeolites for water purification are based on their ability to exchange and adsorb cations from the water solution, especially heavy metals [3,4,5], ammonium [6], and radioactive ions [7] with alkaline and alkaline–earth exchangeable cations from the zeolite structure. In addition to the removal of cations, modified zeolite forms are also efficient in the removal of various anionic and organic compounds [2,8,9,10,11,12,13]. After their use as adsorbents and ion exchangers, zeolites can be easily regenerated and reused without significantly losing their original capacity [14,15,16]. Moreover, natural zeolites are relatively cheap, environmentally friendly, and easy to use [17].
Although zeolites are recognized as minerals of natural origin, there are currently more than one hundred synthetic zeolite species produced under laboratory conditions [1,17]. Current research on zeolite synthesis is ecologically oriented, which implies the use of natural or already used raw materials for this purpose [18]. Compared to natural zeolites, synthetic zeolites have higher purity and more uniform quality [1,19]. Due to industrialization and the limitation of environmental standards, increasing amounts of wastewater with complex composition is generated, for which more complex treatment processes must be applied [20]. Therefore, the focus is on the development of hybrid processes that combine or integrate two or more different physical, chemical, and biological processes [21,22,23]. In this paper, the hybrid process of electrocoagulation combined with zeolite addition is analysed.
Electrocoagulation is a sustainable alternative for the treatment of water and wastewater, in which an electric current is applied to the immersed metal electrode in the electrocoagulation cell and reactions occur at the anode and cathode [24,25,26,27,28,29]. At the anode, oxidation of the metal occurs in a short time, causing the metal anode to dissolve (or corrode). The resulting metal cations are immediately converted into various metal (oxy)hydroxides by further reactions. At the same time, an anodic oxygen evolution reaction takes place, while a hydrogen evolution reaction occurs at the cathode [24]. The pollutants from the solutions are mainly removed by the formed flocs of metal hydroxides through the sweep-floc mechanism. Thus, EC combines the advantages of coagulation, flocculation, flotation, and electrochemistry in one system [24,25,26,27,28,29].
Up to today, only few authors have combined electrocoagulation and zeolite (ECZ) in their studies (simultaneously or sequentially), and they include ammonia removal from landfill leachate [30,31,32], reduction in the bacterial content and turbidity in industrial wastewater treatment [33], remediation of phosphate from calcium phosphate solutions [34], ammonia removal from gold mine wastewater [35], reduction in the chemical oxygen demand (COD), total Kjeldahl nitrogen, electrical conductivity, and the turbidity of municipal wastewater with saltwater infiltrates [36], and COD and reduction in the turbidity of moderately polluted compost leachate [37,38,39].
Although the addition of zeolite in the EC process may increase treatment efficiency [36,37,38,39], the actual contribution of zeolite particle size has not been fully clarified. Zeolite is not only a good adsorbent and an ion exchanger [30,31,32,34,35], but also has an abrasive effect on the electrode surface and contributes to reducing the passivation effect [36,37,38,39]. Therefore, the focus of this work is to analyse the influence of different particle sizes of synthetic zeolite SZ on the efficiency of the hybrid ECZ treatment process of compost leachate with very high organic load. The studies are accompanied by microscopic electrode surface analyses, SEM and PXRD analyses of the zeolite used, and the electrogenerated sludge. Since the Taguchi method is known as a special orthogonal array design developed to study the effects of process parameters with a small number of experiments [40,41,42,43,44], it was used to optimize the ECZ process, and finally, the total electrode and power costs were compared for different experimental conditions.
2. Materials and Methods
The compost leachate: collected from composting of biowaste in the C-EcoForHome manual home composter using anaerobic microorganisms “Compost Help”. After completion of composting, the collected leachate was mixed and the following indicators were determined according to the Standard Water and Wastewater Testing Methods [45]: pH of 4.03, electrical conductivity of 3.54 mS/cm, turbidity of 397 NTU, chemical oxygen consumption (COD) of 10427.6 mg O2/L, and total solids (TS) of TS = 10,330 mg/L.
The synthetic zeolite (SZ): purchased from the manufacturer Alfa Aesar, crushed and sieved to three different zeolite particle sizes (<90 μm, 90–160 μm, 160–600 μm).
The electrode materials: Aluminium alloy AA2007 series 2000n with copper as the main alloying element (Al = 92.58%, Cu = 3.84%); carbon steel with main elements of iron and copper (Fe = 98.27%, Cu = 1.17%) and commercial zinc sacrificial anodes with main elements of zinc and aluminium (Zn = 99.31%–99.76%, Al = 0.1%–0.5%) [37]. The cube shaped electrodes are fabricated by cutting larger pieces of material with a band saw cooled with coolant, to prevent local overheating of the alloys during cutting. Electrical contact was made by drilling and making M3 threads in the centre of the electrode samples and inserting M3 threaded rods made of a copper alloy with high electrical conductivity. The threaded rods and the contacts between the rod and the alloy are insulated with a polyacrylate compound and a flexible polymer tube. The surface of the electrodes is ground with a Metkon Forcipol 1V grinder using sandpaper up to P800 and then ultrasonically cleaned in 70% ethanol and deionized water. After drying and weighing on an analytical balance KERN ABS 320-4N, the electrodes were used in ECZ experiments.
Hybrid process of electrocoagulation and synthetic zeolite addition planned according to Taguchi L9 (34) orthogonal array: The compost leachate treatment was performed using a hybrid process of electrocoagulation and addition of synthetic zeolite in three different particles sizes (<90 μm, 90–160 μm and 160–600 μm). The experiments were carried out in a 350 mL capacity electrochemical cell, with the immersed cathode and anode made of the same material (AA2007 aluminium alloy or zinc or iron). The addition of SZ zeolite was 20 g/L, without changing the initial pH of the solution and without adding electrolyte, with an electrode distance of 3 cm and a mixing speed of 100 rpm. The current density varied in the range of i = 0.003–0.018 A/m2, and the contact time was 10–30 min. The experiments were planned according to the Taguchi orthogonal array L9 design. Nine experiments were conducted to test the influence of different SZ zeolite particle sizes Z (<90 μm, 90–160 μm or 160–600 μm), current density i (0.003 A/cm2, 0.009 A/cm2 or 0.018 A/cm2), electrode material M (Fe, Al or Zn), and contact time t (10, 20 or 30 min). Thus, each factor had three levels—represented by L1, L2, and L3, as shown in Table 1.

Table 1.
Overview of the conducted ECZ experiments planned according to Taguchi L9 (34) orthogonal array.
After each ECZ experiment, a sedimentation test was performed according to Kynch’s sedimentation theory and the physicochemical indicators of the wastewater were determined (pH, temperature, turbidity, COD).
In addition, both electrodes were ultrasonically cleaned in deionized water for 10 min after each experiment, dried in a dryer, and then weighed on an analytical balance to determine the change in mass of the electrodes during the ECZ experiment.
Analysis of electrode surface with an optical microscope: each electrode surface was examined after the ECZ experiment with an optical microscope MXFMS-BD, Ningbo Sunny Instruments Co. equipped with a Canon EOS 1300D digital camera, at a magnification of 100×, illuminated with light through the objective lens (bright field microscopy).
Characterization of the zeolite and electrogenerated sludge: The mineral composition of parent zeolite and electrogenerated sludge coupled with zeolite of different particle sizes was determined by using a powder X-ray diffractometer (PXRD)—model Empyrean. Malvern Panalytical B.V., Netherlands. The X-ray source used was a tube with a Cu anode and the generator was set at the 45 kV and 40 mA. The detector used was a PIXcel3D detector with Medipix3. The diffraction patterns were collected using a gonio scan with a step size of 0.013° and a scan angle (°2Theta) from 2 to 80°. The collected patterns were corrected for systematic errors (external Si standard). Qualitative interpretation of XRD patterns was performed in comparison to standard patterns from the database PDF2 (ICDD, PDF2 Released 2020).
The morphology and elemental analysis of the parent zeolite and the electrogenerated sludge coupled with zeolite of different particle sizes were characterized using a scanning electron microscope (SEM) with energy dispersive analysis (EDS), type JEOL JSM -7610FPlus, and a Schottky field emission scanning electron microscope equipped with the Ultim Max 65 EDS detector from Oxford Instruments. The EDS spectra were analysed using Oxford Instruments Aztec v.5.1. software. For SEM/EDS analysis, the samples were prepared by grinding them in a grinding bowl and then glued to a brass stub with carbon paste. Due to this preparation method, the particle size does not provide any additional information about the samples studied.
3. Results and Discussion
3.1. Analysis of the Physicochemical Parameters of the ECZ Process
The initial compost leachate solution is characterized by a low initial pH value (pH = 4.03), high electrical conductivity (3.54 mS/cm), high turbidity (397 NTU), and high value of the total solids (10.33 g/L), indicating the presence of salts, anions, and cations, as well as general contamination of the sample with suspended, dissolved, and settling matter. A significantly high value of COD (10,427.6 mg O2/L) confirms the high organic loading of initial compost leachate. The results for each ECZ experiment performed in terms of pH, temperature, COD, and turbidity are summarized in Table 2.
Table 2.
Results of physicochemical parameters obtained for each ECZ process.
3.1.1. pH Change
As expected, the initial pH of the solution (pH = 4.03) increased during the ECZ process up to a pH range of 4.63–8.56, depending on the experimental conditions, and is related to the water hydrolysis reaction, the formation of hydrogen gas and hydroxide ions [36,37,38,39], but also to the electrode type, the experimental duration, current density, and the properties of the initial compost leachate. When the influence of SZ zeolite particle size is analysed, it is evident that the higher pH increase is obtained with the smallest zeolite particle size (<90 µm). Regardless of the other process conditions, the overall highest pH increase was obtained in the C3 experiment (pH = 8.56), at the highest current density of 0.018 A/cm2, the zinc electrode, and at a contact time of 30 min. According to Safwat (2020), a higher increase in pH for a Zn electrode is usually associated with a higher dissociation level of water molecules into OH− and H2 [46]. However, in this experiment, the initial composition of the compost leachate has a significant effect on the increase in pH. Namely, the pH increase of the solution during ECZ usually reaches a higher pH value (at least 8) [36,37,38,39]. A lower increase in pH observed in this study can be related to the complex composition of the initial compost leachate solution, which acts as a buffer. This assumption was further confirmed by the addition of sodium hydroxide to the initial compost leachate solution.
3.1.2. Temperature Change
An increase in temperature is observed in all experiments (from the initial Tin = 22.8 °C to the final value in the range of 24.2–35.7 °C), which is in accordance with references [36,37,38,39]. Taking into account the impact of SZ zeolite particle size, it is evident that the temperature increase is higher for smaller zeolite particles (<90 µm), leading to an increase in the temperature of the solution of up to 35.7 °C in experiment C3, which is the highest final temperature reached. In addition to the zeolite size, the current density has the highest impact on the electrolyte temperature, so that the highest temperature increase in already mentioned experiment C3 was obtained with the highest current density of 0.018 A/cm2, and the smallest zeolite particles used, and overlaps with the highest increase in pH.
3.1.3. COD Decrease
Looking at the COD removal efficiency, we find that it is relatively low, which is due to the very high organic load of the wastewater. Nevertheless, the highest COD removal efficiency of 35.11% was obtained in the C9 experiment, which was performed with the largest zeolite particles and the shortest time. Although this value was obtained for the highest value of current density with the Al electrode, comparison of the COD removal with smaller particles shows that the current density (example experiment C6) and electrode material (example experiment C2) are less influential factors than particle size. Nevertheless, the results suggest that there is a complex mechanism associated with the COD removal efficiency that should be further investigated. According to Tegladza et al. (2021) [24], at low current density, metal dissolution mainly occurs, while at high current density, metal dissolution processes compete with the anodic oxygen evolution reaction and thus may influence COD decrease.
Regarding the final COD values determined in this study, additional treatment should be performed to comply with Croatian regulation for discharge of treated wastewater into the sewage system [47]. Obviously, the initial compost leachate has a very complex composition, it is loaded with a large amount of organic matter, which was not significantly removed in the one-step process of hybrid ECZ. Thus, further solutions can be found in two-step or multistep processes, or in the application of another pretreatment step, such as advanced oxidation processes.
3.1.4. Turbidity Decrease
The turbidity decrease in results ranged from 79.47%–94.58%. The highest turbidity decrease was obtained in experiment C2, and the lowest in experiment C3. For the largest zeolite particle size (160–600 μm), the turbidity decrease varies only slightly with electrode material, current density, and contact time. For smaller SZ particle sizes, the variations are more visible and depend on the experimental conditions. Except for the experiments with the highest particle size, the percentage of turbidity decrease was also very high (over 90%) for all experiments with Al electrodes.
3.1.5. Settling Test
The results of the settling test (not given here) indicated poor sedimentation characteristics of the suspension after the application of ECZ. The reason for this was probably the complex composition of the original compost leachate solution and its very high organic load, which could not be efficiently processed in a single-stage ECZ. According to Smoczyńskia et al. (2017), insufficient electrocoagulant dosages can lead to the formation of residues of noncoagulated pollutants and residues of “unused” stable micelles or their destabilization products with very poor settling properties [48]. Even though the addition of zeolite had a positive effect on the settling properties of compost leachate with an organic load [36], this effect was not observed in this study when treating compost leachate with a high organic load. Thus, additional filtration will be necessary in the final application, since very poor separation of the formed precipitate from the solution was achieved.
3.1.6. Electrode Consumption
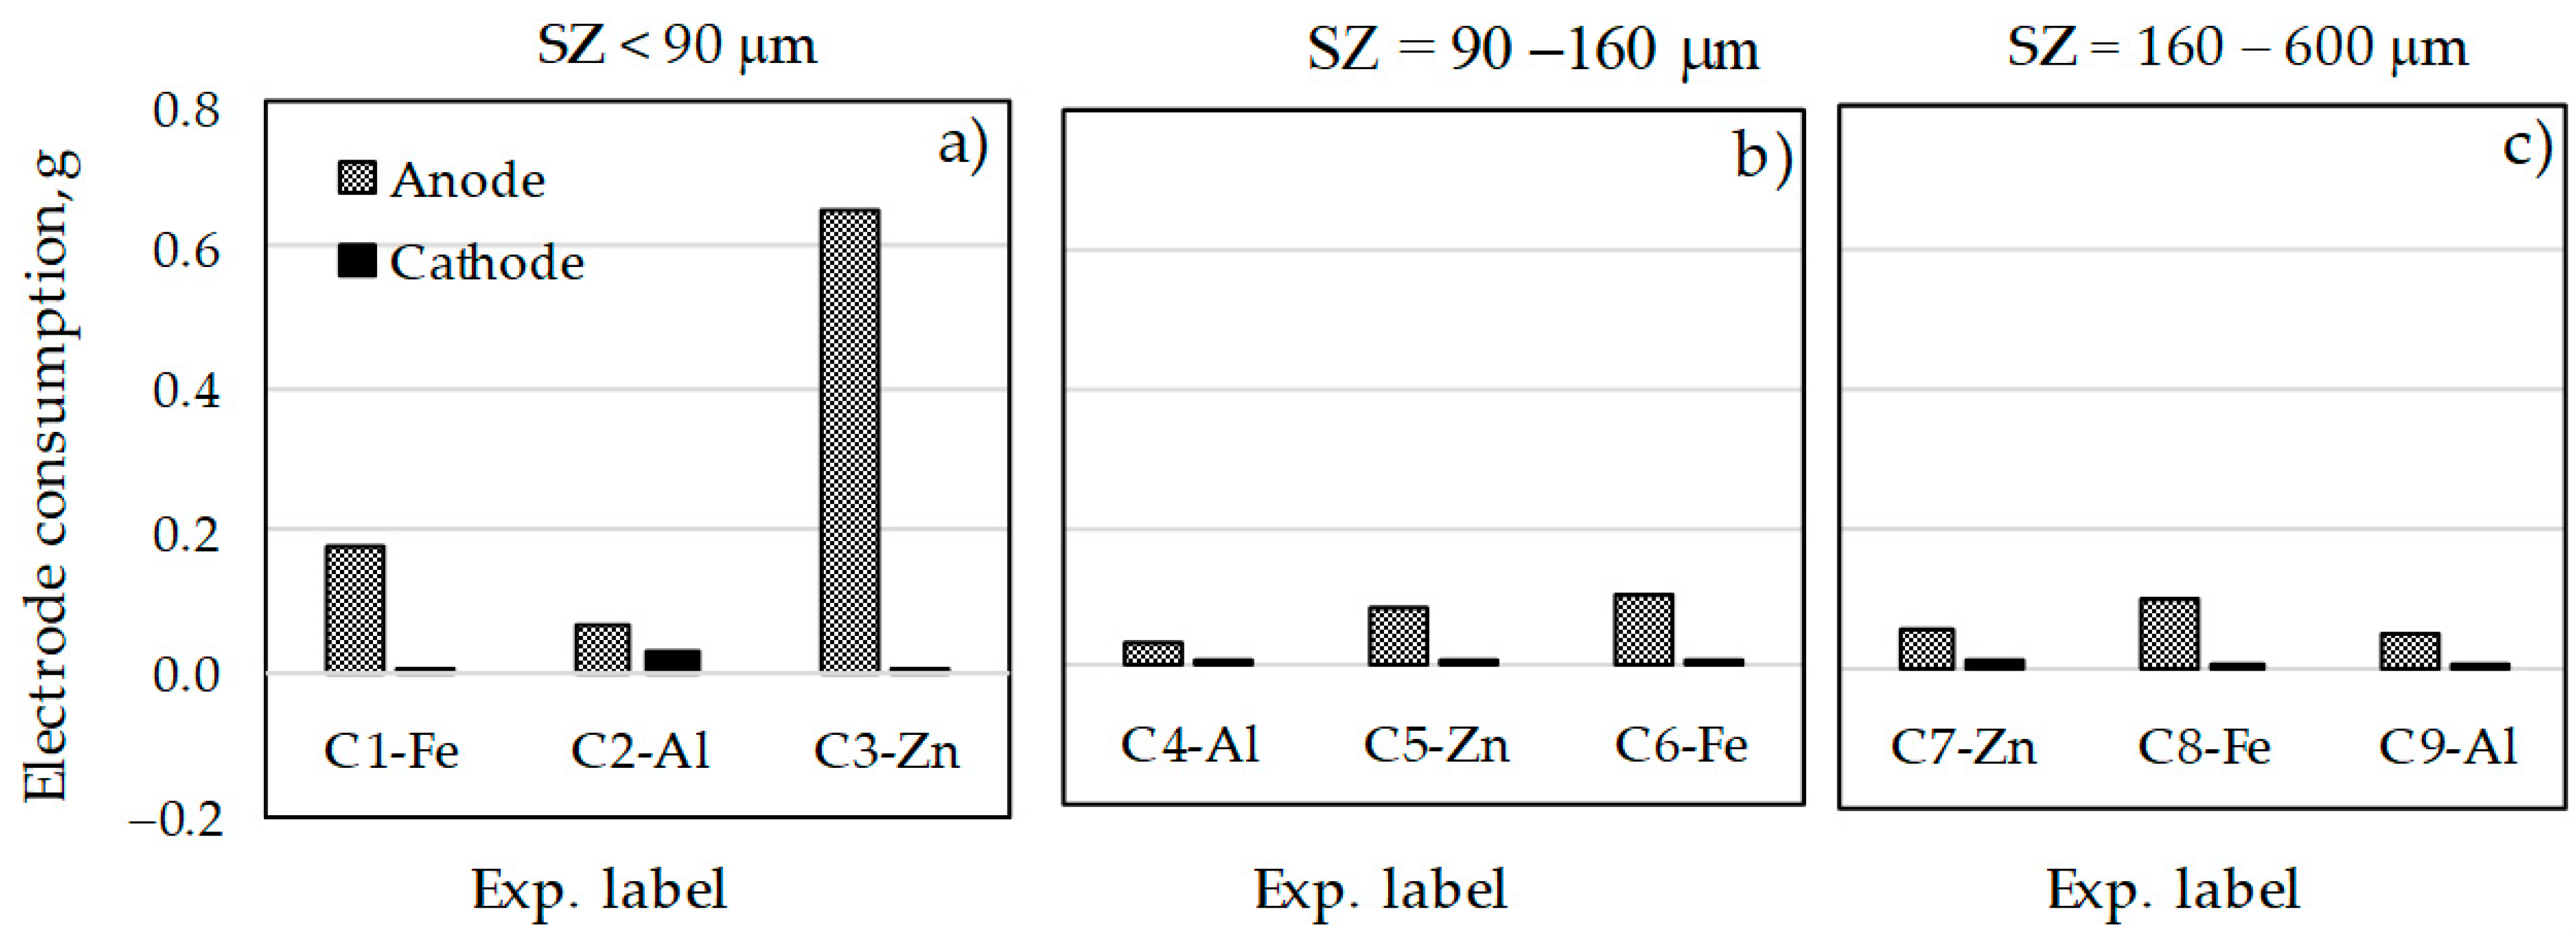
Electrode consumptions during the ECZ experiments are compared in Figure 1. In addition to the expected decrease in the mass of sacrificial anodes, there is also a decrease in the mass of all cathodes. According to the literature [49], the decrease in cathode mass is mainly due to the attack of OH− ions produced during the hydrogen evolution reaction. However, the loss of cathode mass could also be due to the addition of zeolite and its abrasive effect [38,39].
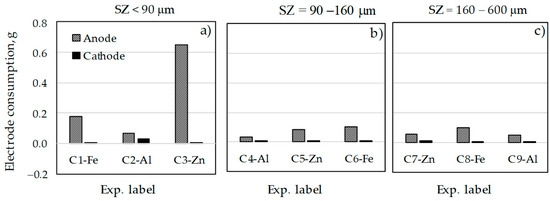
Figure 1.
Electrode consumption during ECZ experiments with different SZ particle sizes: (a) <90 μm; (b) 90−160 μm; (c) 160−600 μm.
Considering the influence of SZ particle size, it can be seen that higher electrode consumptions were obtained in the experiments with smaller zeolite particle size (experiments C1, C2, and C3), with electrode consumption clearly dominating in the C3 experiment in amount of 0.6481 g, at condition of Zn electrode, highest current density of 0.018 A/cm2, and longest contact time of 30 min). At medium (SZ = 90–160 µm) and largest zeolite particle size (SZ = 160–600 µm), the highest electrode reductions were obtained with the Fe electrodes (at C6 and C8 experiments electrode consumptions equal to 0.1085 and 0.1002 g, respectively).
Compared to previous studies performed on compost leachate with medium organic loading [42,49], the changes in cathode mass for the Fe and Zn electrodes were different and varied between loss and gain, depending on the experimental conditions. In this study, only cathode mass loss was observed for all materials under all experimental conditions.
3.1.7. Stability of ECZ Experiments
Pourbaix diagrams (potential-pH diagrams) can provide information about the stability and corrosion of a particular metal as a function of pH and potential. However, they have limited explanatory power because they represent the thermodynamic considerations of pure metals immersed in pure water at 25 °C, without considering the presence of various ions that play an important role in corrosion processes [50,51].
According to the Pourbaix diagrams, aluminium shows passive behaviour in the pH range from about 4 to 8.5. However, this range can vary with temperature, the specific form of the film present, and in the presence of substances that can form soluble complexes or insoluble salts with aluminium. Beyond these limits, aluminium corrodes in aqueous solutions in the form of Al3+ ions or in the form of because its oxides are soluble in many acids and bases, reflecting the amphoteric properties of aluminium oxide. The electrodes were made from the alloy AA 2007 (which belongs to the Al–Cu alloy series), which is known to have lower corrosion resistance compared to Al and other Al alloys, due to the presence of Cu-rich precipitates [51,52,53,54]. In this context, the main anodic reaction will be:
If the anodic potential is sufficiently high, an oxygen evolution reaction can also occur (Equation (2)):
Like aluminium, Zn dissolves as a Zn2+ ion in the pH range from pH = 0 to pH ≈ 8.5 according to the reaction (3) [55,56]:
From pH ≈ 8.5 to pH ≈ 12 Zn is covered with the passive oxide film ZnO. In strongly alkaline solutions (above pH = 12), Zn corrodes and dissolves in the form of . Formed Zn2+ ions react with the OH− ions in the solution to form Zn(OH)2 [56,57].
Anodic reaction for the iron in solution with pH < 4 can be described with the reactions (4) and (5):
For the solutions with 4 < pH < 7, iron will be dissolved into Fe2+ and Fe3+ ions, with instant hydrolysis and the formation of hydroxides according to the reactions (6) and (7) [58,59]:
Fe(III) hydroxide begins to precipitate floc with yellowish colour, together with precipitation of Fe(II) hydroxide with formation of a dark green floc.
Electrically generated metal ions form the corresponding hydroxides together with other monomeric, polymeric, and hydroxo complexes, which further destabilize the contaminants in the solution and allow their agglomeration and further separation from the solution by settling or flotation [60,61].
The formed hydroxocomplexes can contribute to the build-up of the electrode surface layers, which can lead to fouling and passivation [60]. The zeolite particles present in the solution impinge on the surface of the electrodes by mixing, thus cleaning the aforementioned surface layers, reducing these phenomena and contributing to the uniform dissolution of the anode.
3.2. Microscopic Electrode Surface Analysis
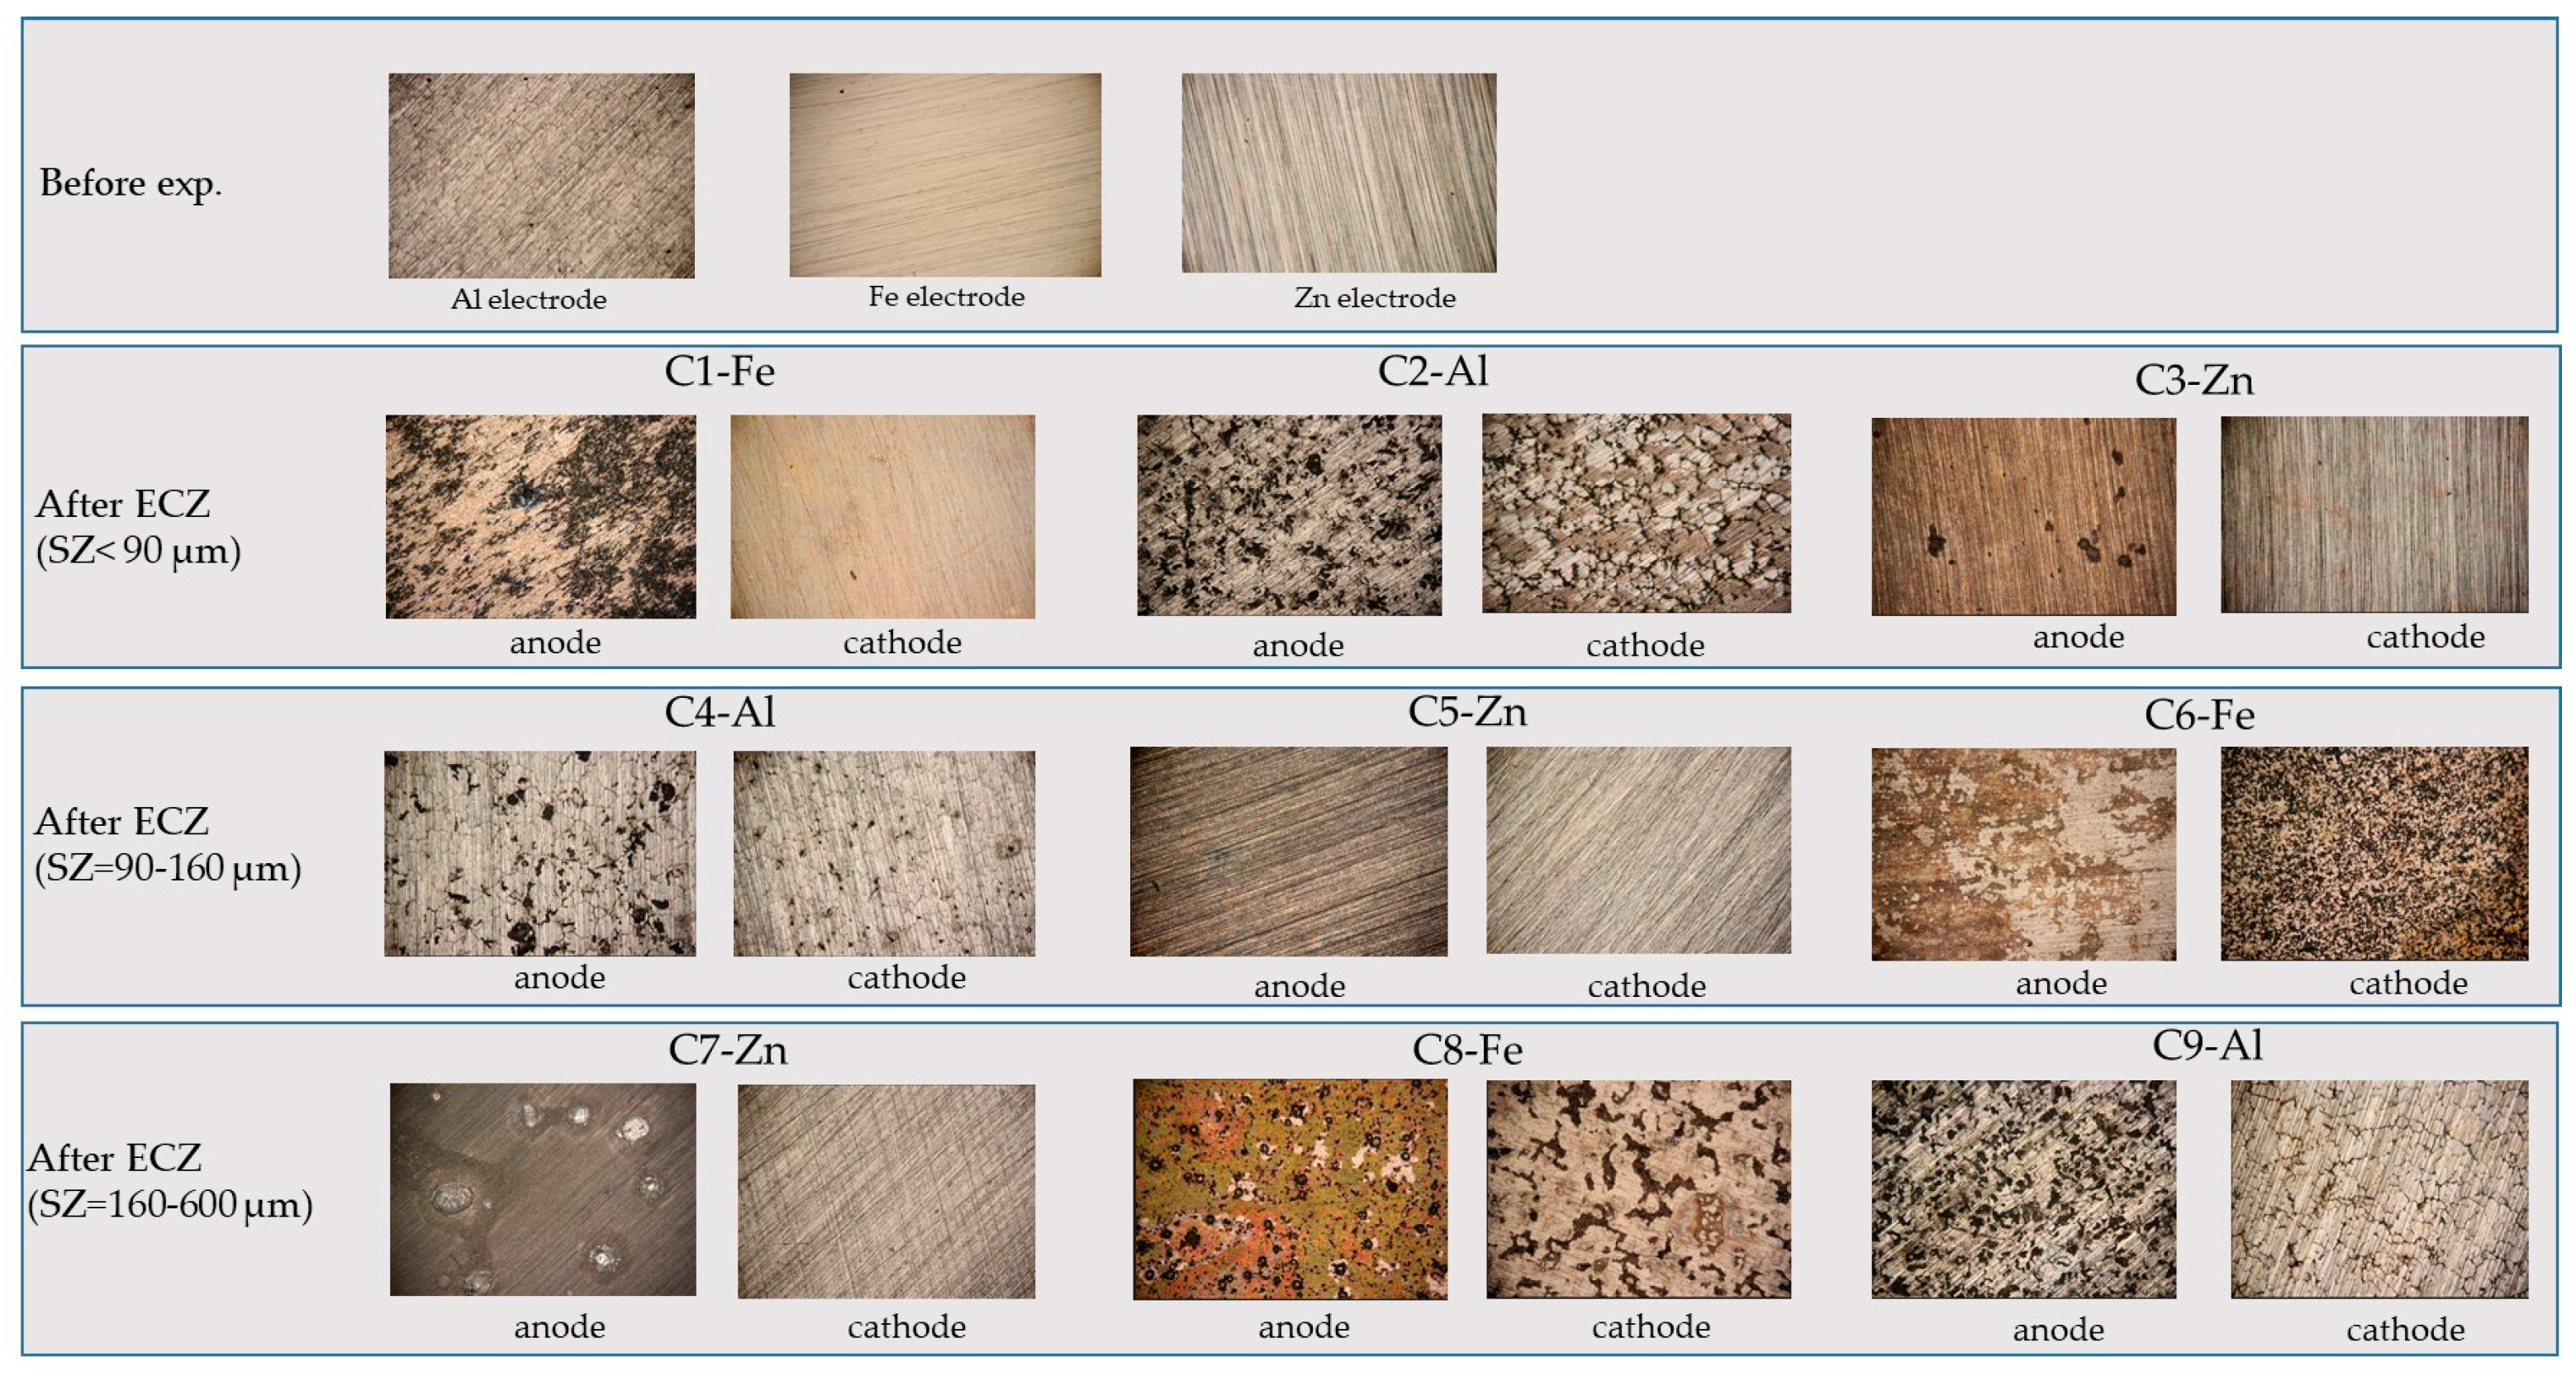
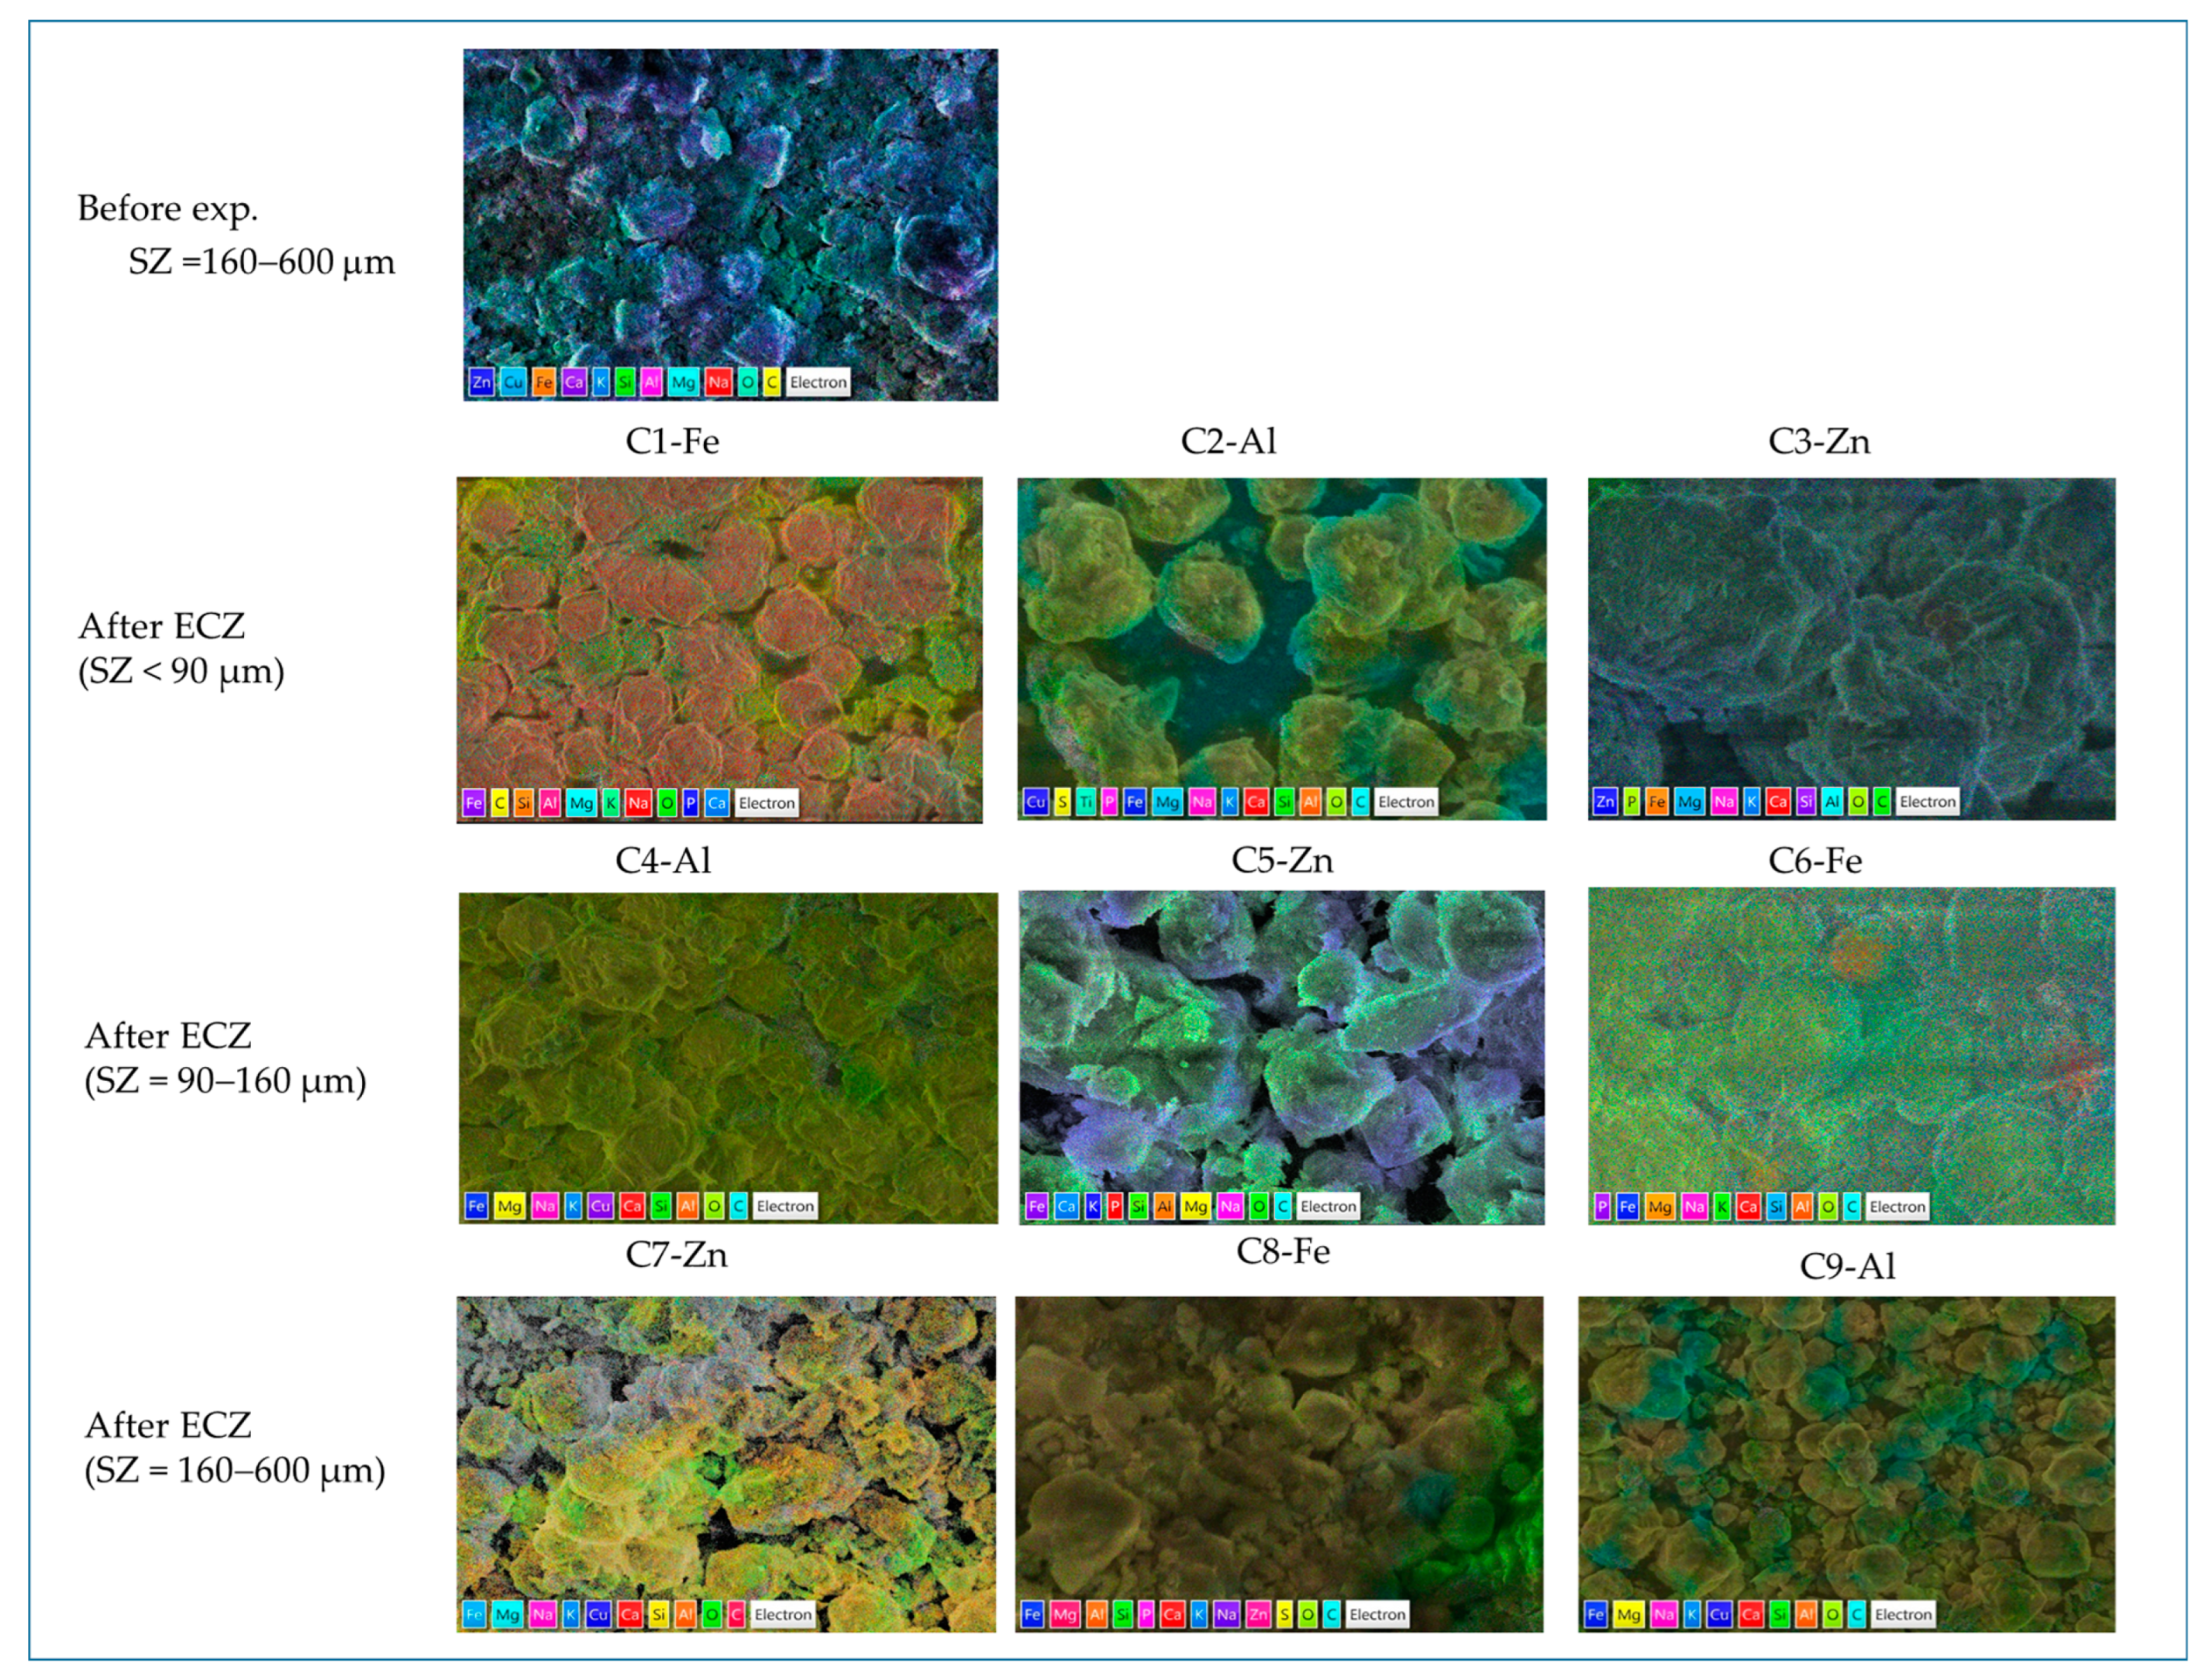
Figure 2 shows the surface of the electrodes before and after the ECZ experiments performed under different experimental conditions (labelled as C1–C9), which were examined with an optical microscope with 100× magnification.

Figure 2.
Microscopic electrodes surface analysis before and after the ECZ experiments performed under different experimental conditions (labelled as C1–C9). Note: with 100× magnification.
Before the ECZ process, the surfaces of all electrodes were relatively smooth, with flat lines that were the result of mechanical preparation of the surface using wet sanding with P800 grit sandpaper. After the ECZ process, both the anodes and cathodes of all the materials studied changed significantly as a result of the anodic and cathodic reactions that developed on their surfaces.
For the Al electrodes, the most severe damage is observed in experiment C9, which was performed with the highest corrosion current and the shortest time in the presence of the zeolite with the largest particle size, followed by experiment C2 (moderate current density, experimental duration of 20 min, and the smallest zeolite particles). The least surface damage was observed in experiment C4 with the lowest corrosion current density and the longest experiment duration with the medium zeolite particle size.
On the other hand, the most severe damage to the Zn anode was observed in experiment C3 (highest current density, longest experimental duration, and smallest zeolite particle size) and in experiment C7 (lowest current density, moderate experimental duration, and largest zeolite particle size), while the least damage occurred in experiment C5 (moderate current density, shortest experimental duration, and moderate zeolite particle size). On the Zn anode surfaces in experiments C3 and C7, the pitting damage is clearly visible in contrast to experiment C5, while no pitting damage was observed during optical examination of the surface.
Regarding surface damage of the Fe electrodes, the most severe damage was observed on the Fe anode in experiment C8, where the entire surface was covered with a layer of corrosion products and black holes were observed, probably as a result of pitting. The Fe anodes in experiments C1 (lowest current density, experiment duration, and smallest zeolite particle size) and C6 (highest current density, average experiment duration, and average zeolite particle size) have visible corrosion products on their surface (which cannot be removed with ultrasonic cleaning in deionized water using the ECZ method), but without black holes on the surface. On the other hand, most changes in the cathode’s surface were observed in the C6 experiment, followed by C8 (average current density, highest experimental duration, and largest zeolite particle size), while the cathode surface remained minimally damaged in the C1 experiment.
In general, the largest SZ zeolite particle size of 160–600 µm causes greater damage to the electrode surface, although the greatest mass loss occurs with the smallest particles. An exception to this is experiment C3. In this experiment, the smallest zeolite particles are responsible for the highest anode mass loss, and at the same time, the most severe anode damage was observed, indicating that electrode type, current density, and contact time have a significant effect on the electrode surface.
3.3. Zeolite and Electro-Generated Sludge Analysis
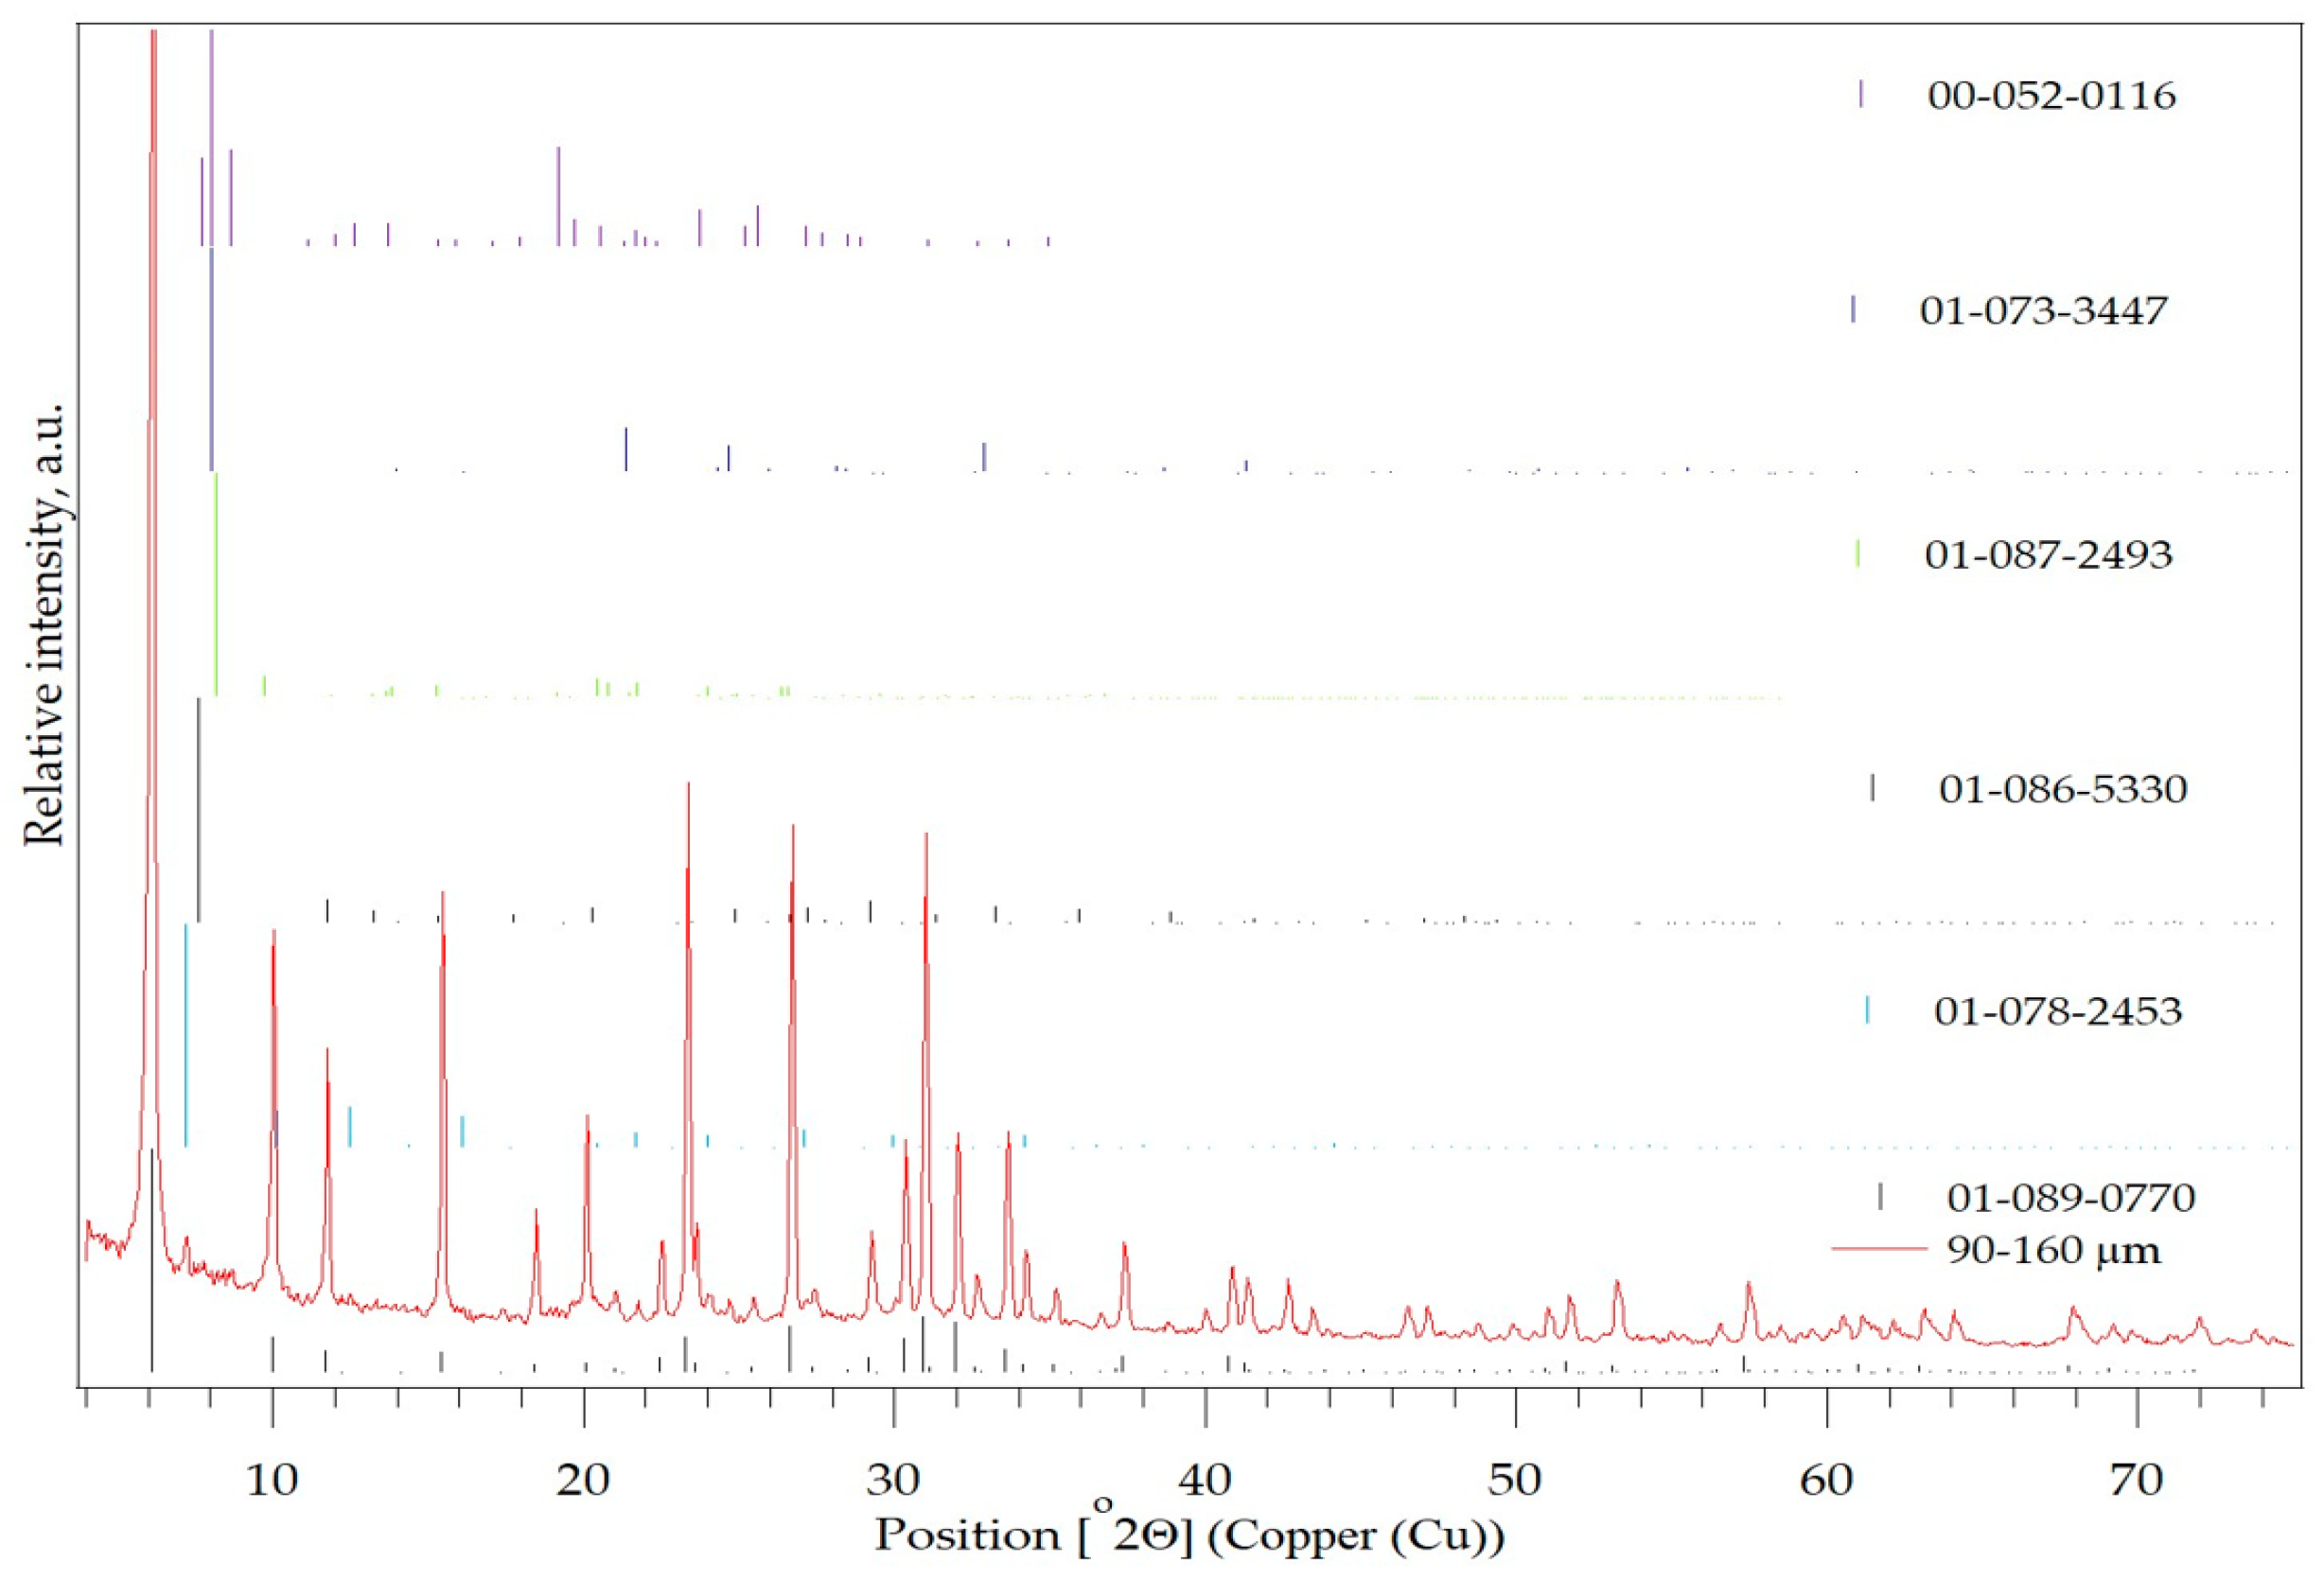
The diffraction pattern of the parent SZ zeolite with a particle size of 90–160 µm is shown in Figure 3 and Table 3. The most dominant structurally ordered phase belongs to the compound sodium potassium aluminium silicate hydrate, which belongs to the FAU-Faujasite family according to the zeolite classification.
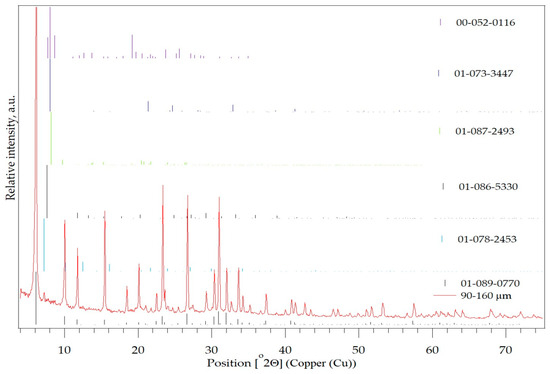
Figure 3.
PXRD pattern of the SZ zeolite with the particle size of 90–160 µm.
Table 3.
Identified the structural ordered phase which are present in the SZ zeolite with a particle size of 90–160 µm.
Analysis of the diffraction pattern also indicates other mineral types of zeolites that are present in smaller quantities, namely zeolite-LTL (potassium silicon aluminium oxide), LTA, IFR(ITQ-4), ZZ1 and SFF(SSZ-44).
The faujasite type zeolites all have the same framework structure and they crystallize with cubic symmetry. The structure of the faujasite is microporous, characterized by channels and cavities accessible even to pollutants with a significant molecular size, such as toluene, cyclohexane etc.
Figure 4 shows the simulated 3D structure of faujasite (FAU) prepared using the Mercury and the structure CIF file AMSD 0000128. The FAU framework is built on the basis of fused double six rings called hexagonal prisms and sodalite cages also called β-cages [62]. FAU crystalize in the space group Fd3m with the parameter of unite cell a = b = c = 25.104 Å and α = β = γ = 90°. The general composition of the faujasite is (Na2,Ca, Mg)29[Al58Si134O384]240H2O [63].
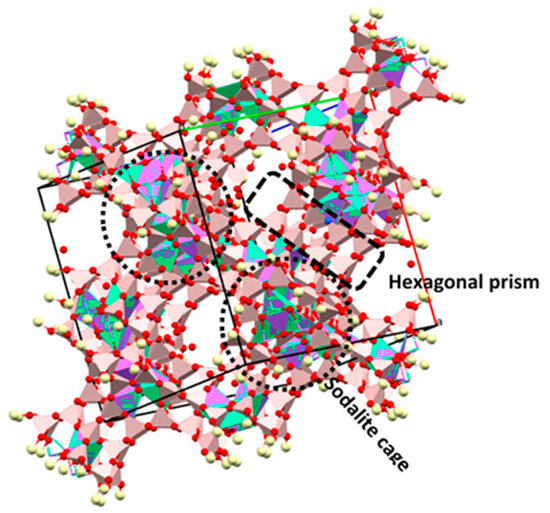
Figure 4.
Structure of the Na-Faujasite (CIF file amcsd 0000128).
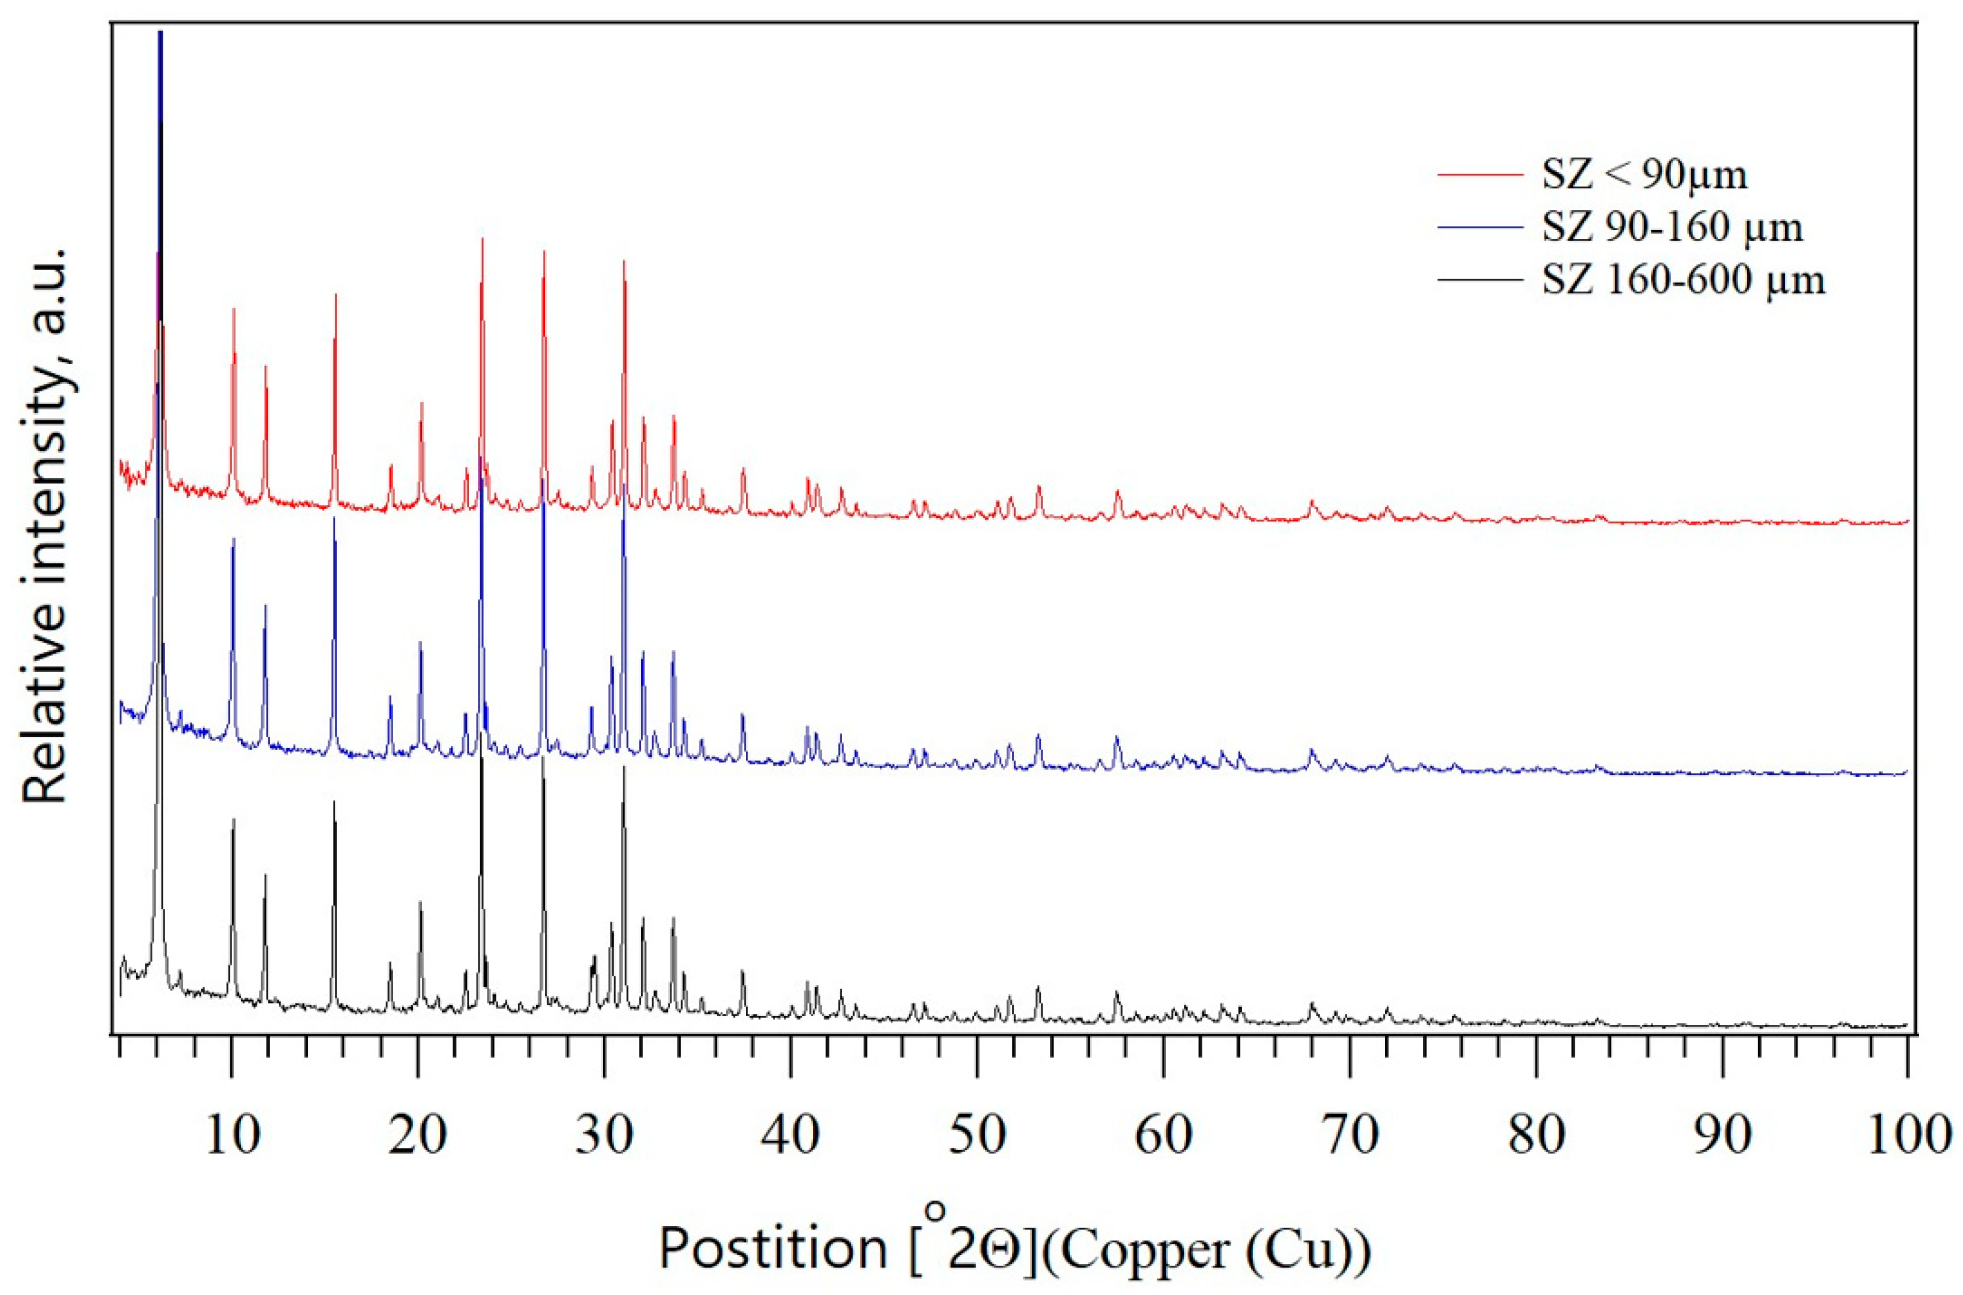
Figure 5 shows the PXRD patterns of the different zeolite fractions. From the comparison of the PXRD patterns of the different zeolite fractions, it is evident that the mineralogical composition is the same for all three granulations.
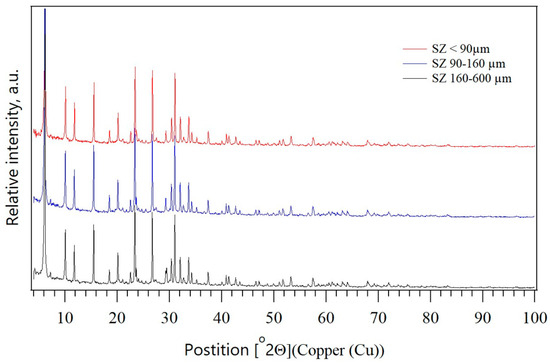
Figure 5.
PXRD patterns of the SZ zeolite of three particle sizes: <90 µm, 90–160 µm, and 160–600 µm.
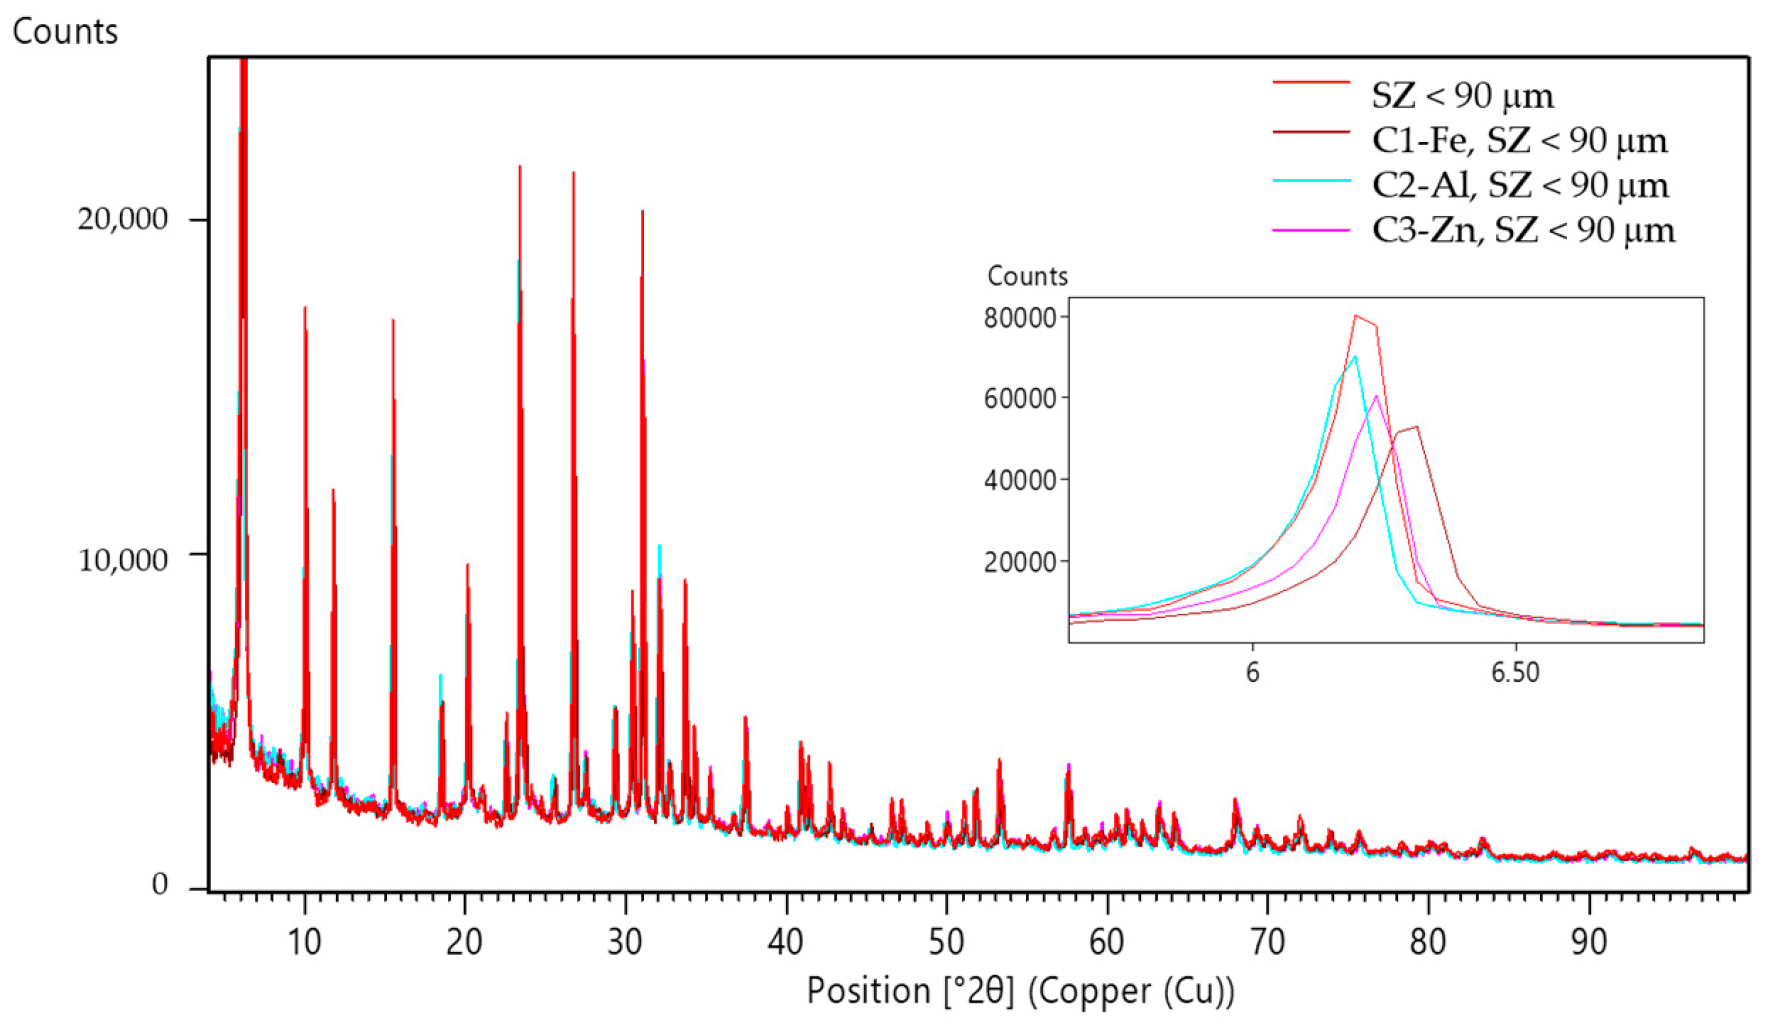
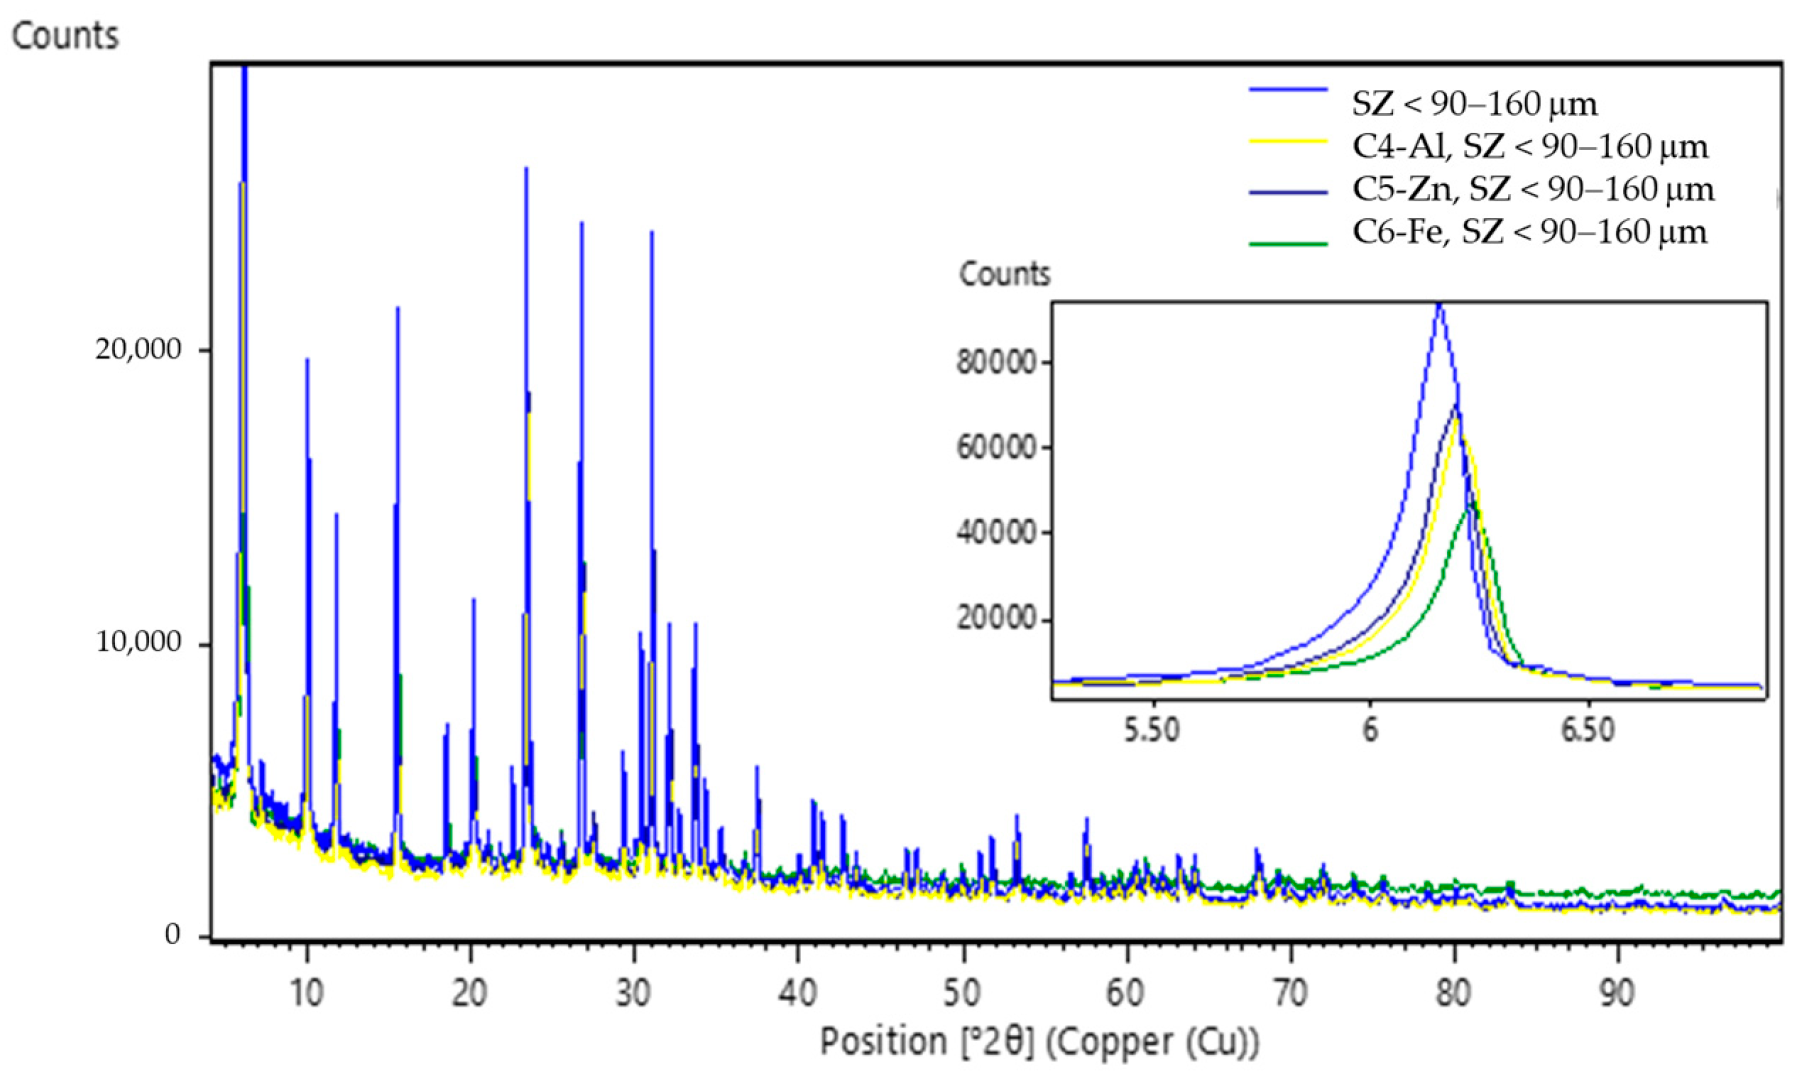
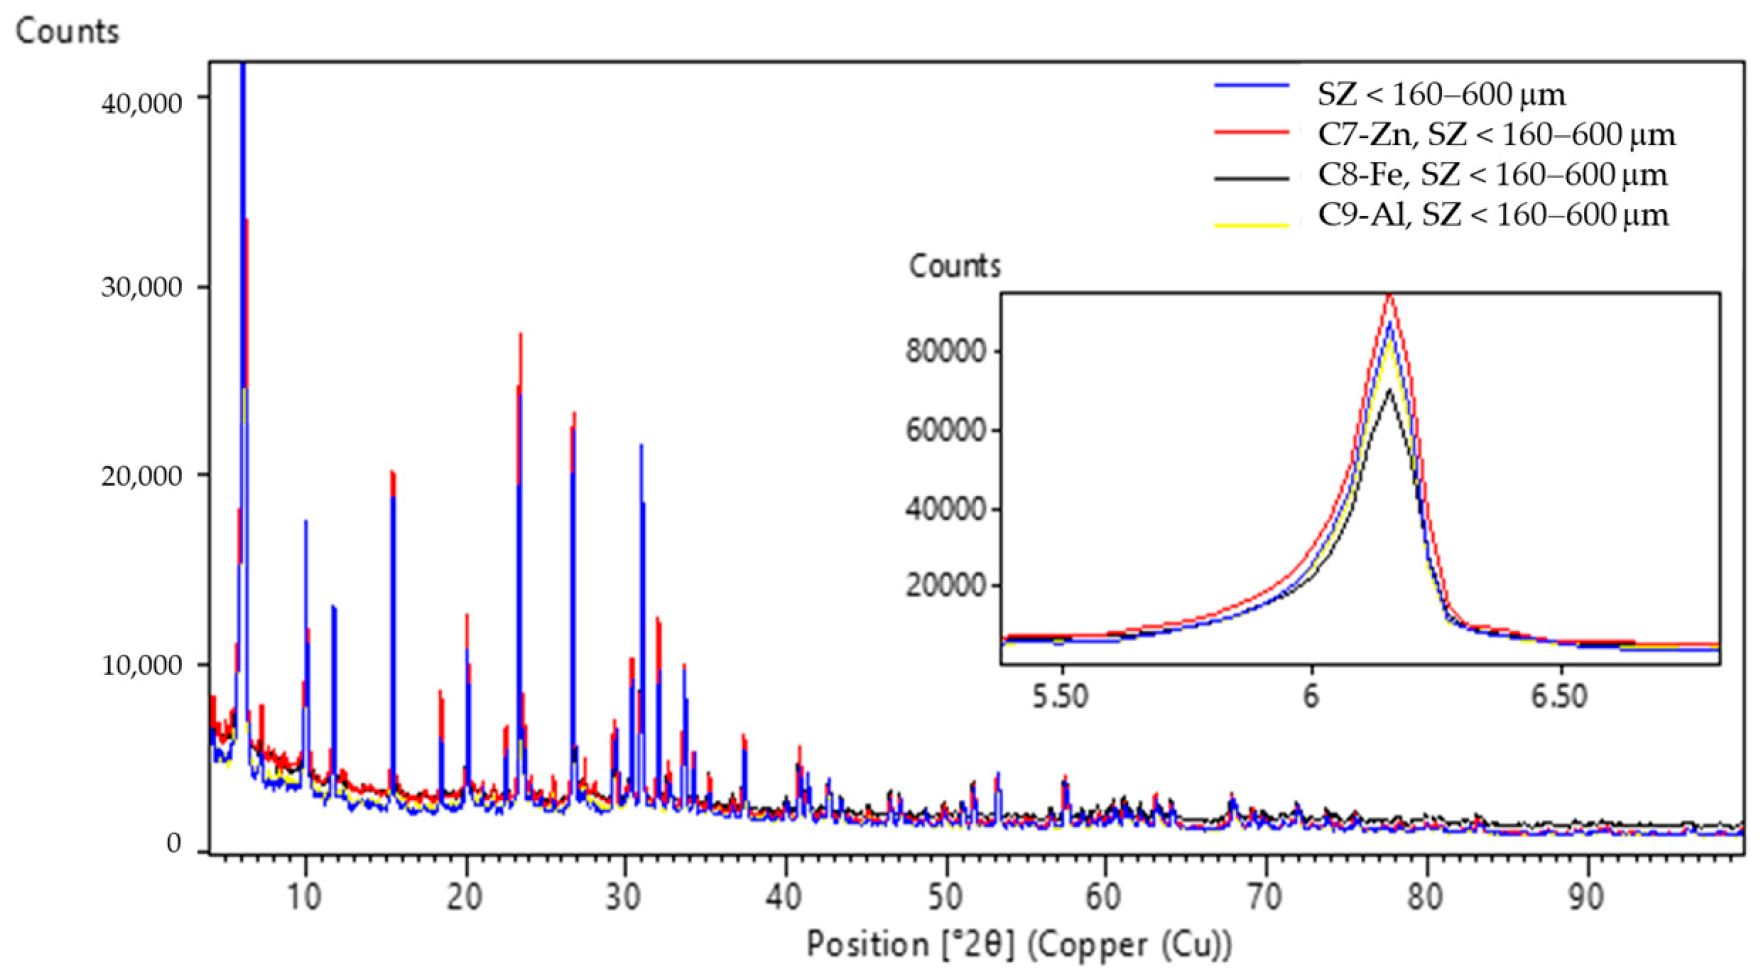
In this study, the analysis of the sludge electrolytically generated during the ECZ experiment and coupled with zeolite of different particle sizes was performed using PXRD and SEM/EDS. The diffraction patterns of mixtures of the electrogenerated sludge and zeolite (three different particle sizes SZ < 90 μm, 90–160 μm, and 160–600 μm) compared to the untreated zeolites are shown in Figure 6, Figure 7 and Figure 8.
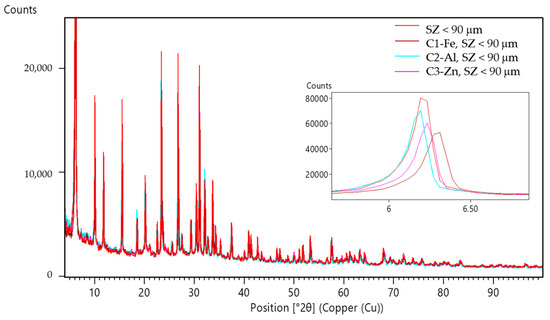
Figure 6.
Comparison of PXRD patterns of the zeolites SZ (<90 µm) before and after ECZ process marked as sludge (C1–C3).
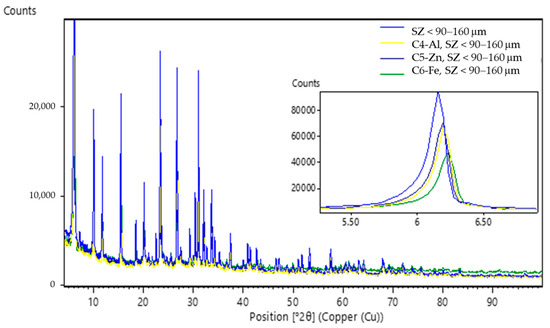
Figure 7.
PXRD patterns of the zeolites SZ (90–160 µm) before and after ECZ process marked as sludge (C3–C6).
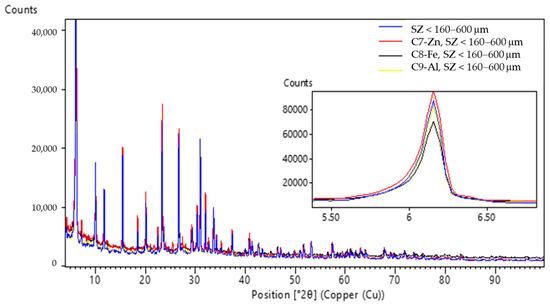
Figure 8.
PXRD patterns of the zeolites SZ (160–600 µm) before and after ECZ process marked as sludge (C7–C9).
The PXRD patterns (Figure 6) of the SZ zeolite specimens where particle size was <90 µm in experiments C1 (ECZ-Fe), C2 (ECZ-Al), and C3 (ECZ-Zn) after the ECZ process compared to the untreated SZ zeolite show that interplanar spacing between (111) planes (d111) decreases from 14.35 Å (SZ < 90 µm) to values of 14.07, 14.34, and 14.20 Å, respectively. In the PXRD patterns (Figure 7) for the specimens C4 (ECZ-Al), C5 (ECZ-Zn), and C6 (ECZ-Fe), where the particle size of the zeolite was 90–160 µm, interplanar spacing between the same plane d111 decreases from 14.35 Å (SZ 90–160 µm) to values of 14.24, 14.29, and 14.19 Å, respectively. However, the PXRD patterns (Figure 8) of specimens C7 (ECZ-Zn), C8 (ECZ-Fe), and C9 (ECZ-Al), where particle size of the zeolite was in the range of 160–600 µm, do not show a change in interplanar distances d111, suggesting that in the stabile structure of SZ the particle size was in the range of 160–600 µm. According to Castaldi et al. (2008), structural changes of zeolite samples may occur due to different interactions between the zeolite framework and ions in solutions that change the interplanar spacing [64].
In order to obtain a better insight into the elemental composition, Figure 9 and Table 4 compare the SEM/EDS mapping with the elemental distribution and map sum spectrum of untreated SZ zeolite and electrogenerated sludge mixed with zeolite after ECZ experiments.
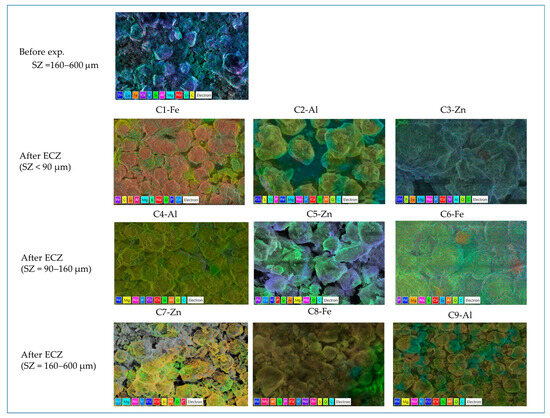
Figure 9.
The SEM/EDS mapping with the elemental distribution of untreated SZ zeolite and electrogenerated sludge mixed with zeolite after ECZ experiments.
Table 4.
SEM/EDS map sum spectrum of the untreated SZ zeolite and the electrogenerated sludge mixed with zeolite after ECZ experiments.
The results show that the elemental distribution and map sum spectrum of electrogenerated sludge mixed with zeolite after ECZ treatment differ slightly in elemental composition. Oxygen (O), silicon (Si), and aluminium (Al) are the dominant elements. The elemental distribution of carbon (C) is also significant but cannot be considered due to the overlap with the carbon pasta used in the SEM /EDS analysis. Other elements present in lower amounts are magnesium (Mg), iron (Fe), sodium (Na), potassium (K), calcium (Ca), and phosphorus (P). However, some elements such as titanium (Ti), sulphur (S), copper (Cu), zinc (Zn), chloride (Cl), manganese (Mn), and nitrogen (N) are present only in certain samples, which depends on the experimental conditions of each ECZ process. In comparison with elemental distribution and the map sum spectrum of electrogenerated sludge obtained in our previous study [37] with Al electrode but without zeolite addition performed, it is evident that sludge contains mainly oxygen (O) and aluminium (Al). In the experiment with the Fe and Zn electrodes, the main elements are iron and oxygen, and zinc and oxygen, respectively. In this study, the amount of zeolite significantly dominates in the total amount of sludge after the ECZ process, indicating that oxygen, silicon, and aluminium are mainly from the zeolite used.
3.4. Taguchi Optimization
The influence of the selected controllable parameters on chemical oxygen demand (COD) and turbidity decrease was investigated. These controllable parameters were zeolite SZ particle size (Z), current density (i), electrode materials (M), and contact time (t). As already stated, each parameter employed had three testing levels (L1, L2, and L3), as shown in Table 1. In this study, the larger-the-better quality characteristic Equation (8) was used:
where, S/N represents the signal-to-noise ratio, subscript LB represents larger-the-better, n is the number of repetitions under the same experimental conditions, and y is an experimental value [37,39].
The average S/NLB ratio of each controllable factor at level “i” was calculated and results are given in Table 5.
Table 5.
Taguchi design of experiments L9.
Statistical analysis employing the sum of squares (SS), mean square (MF), percentage of contribution (pC), and range was performed in order to evaluate the significance of all parameters employed. The formula for the calculation methodology is available elsewhere [40].
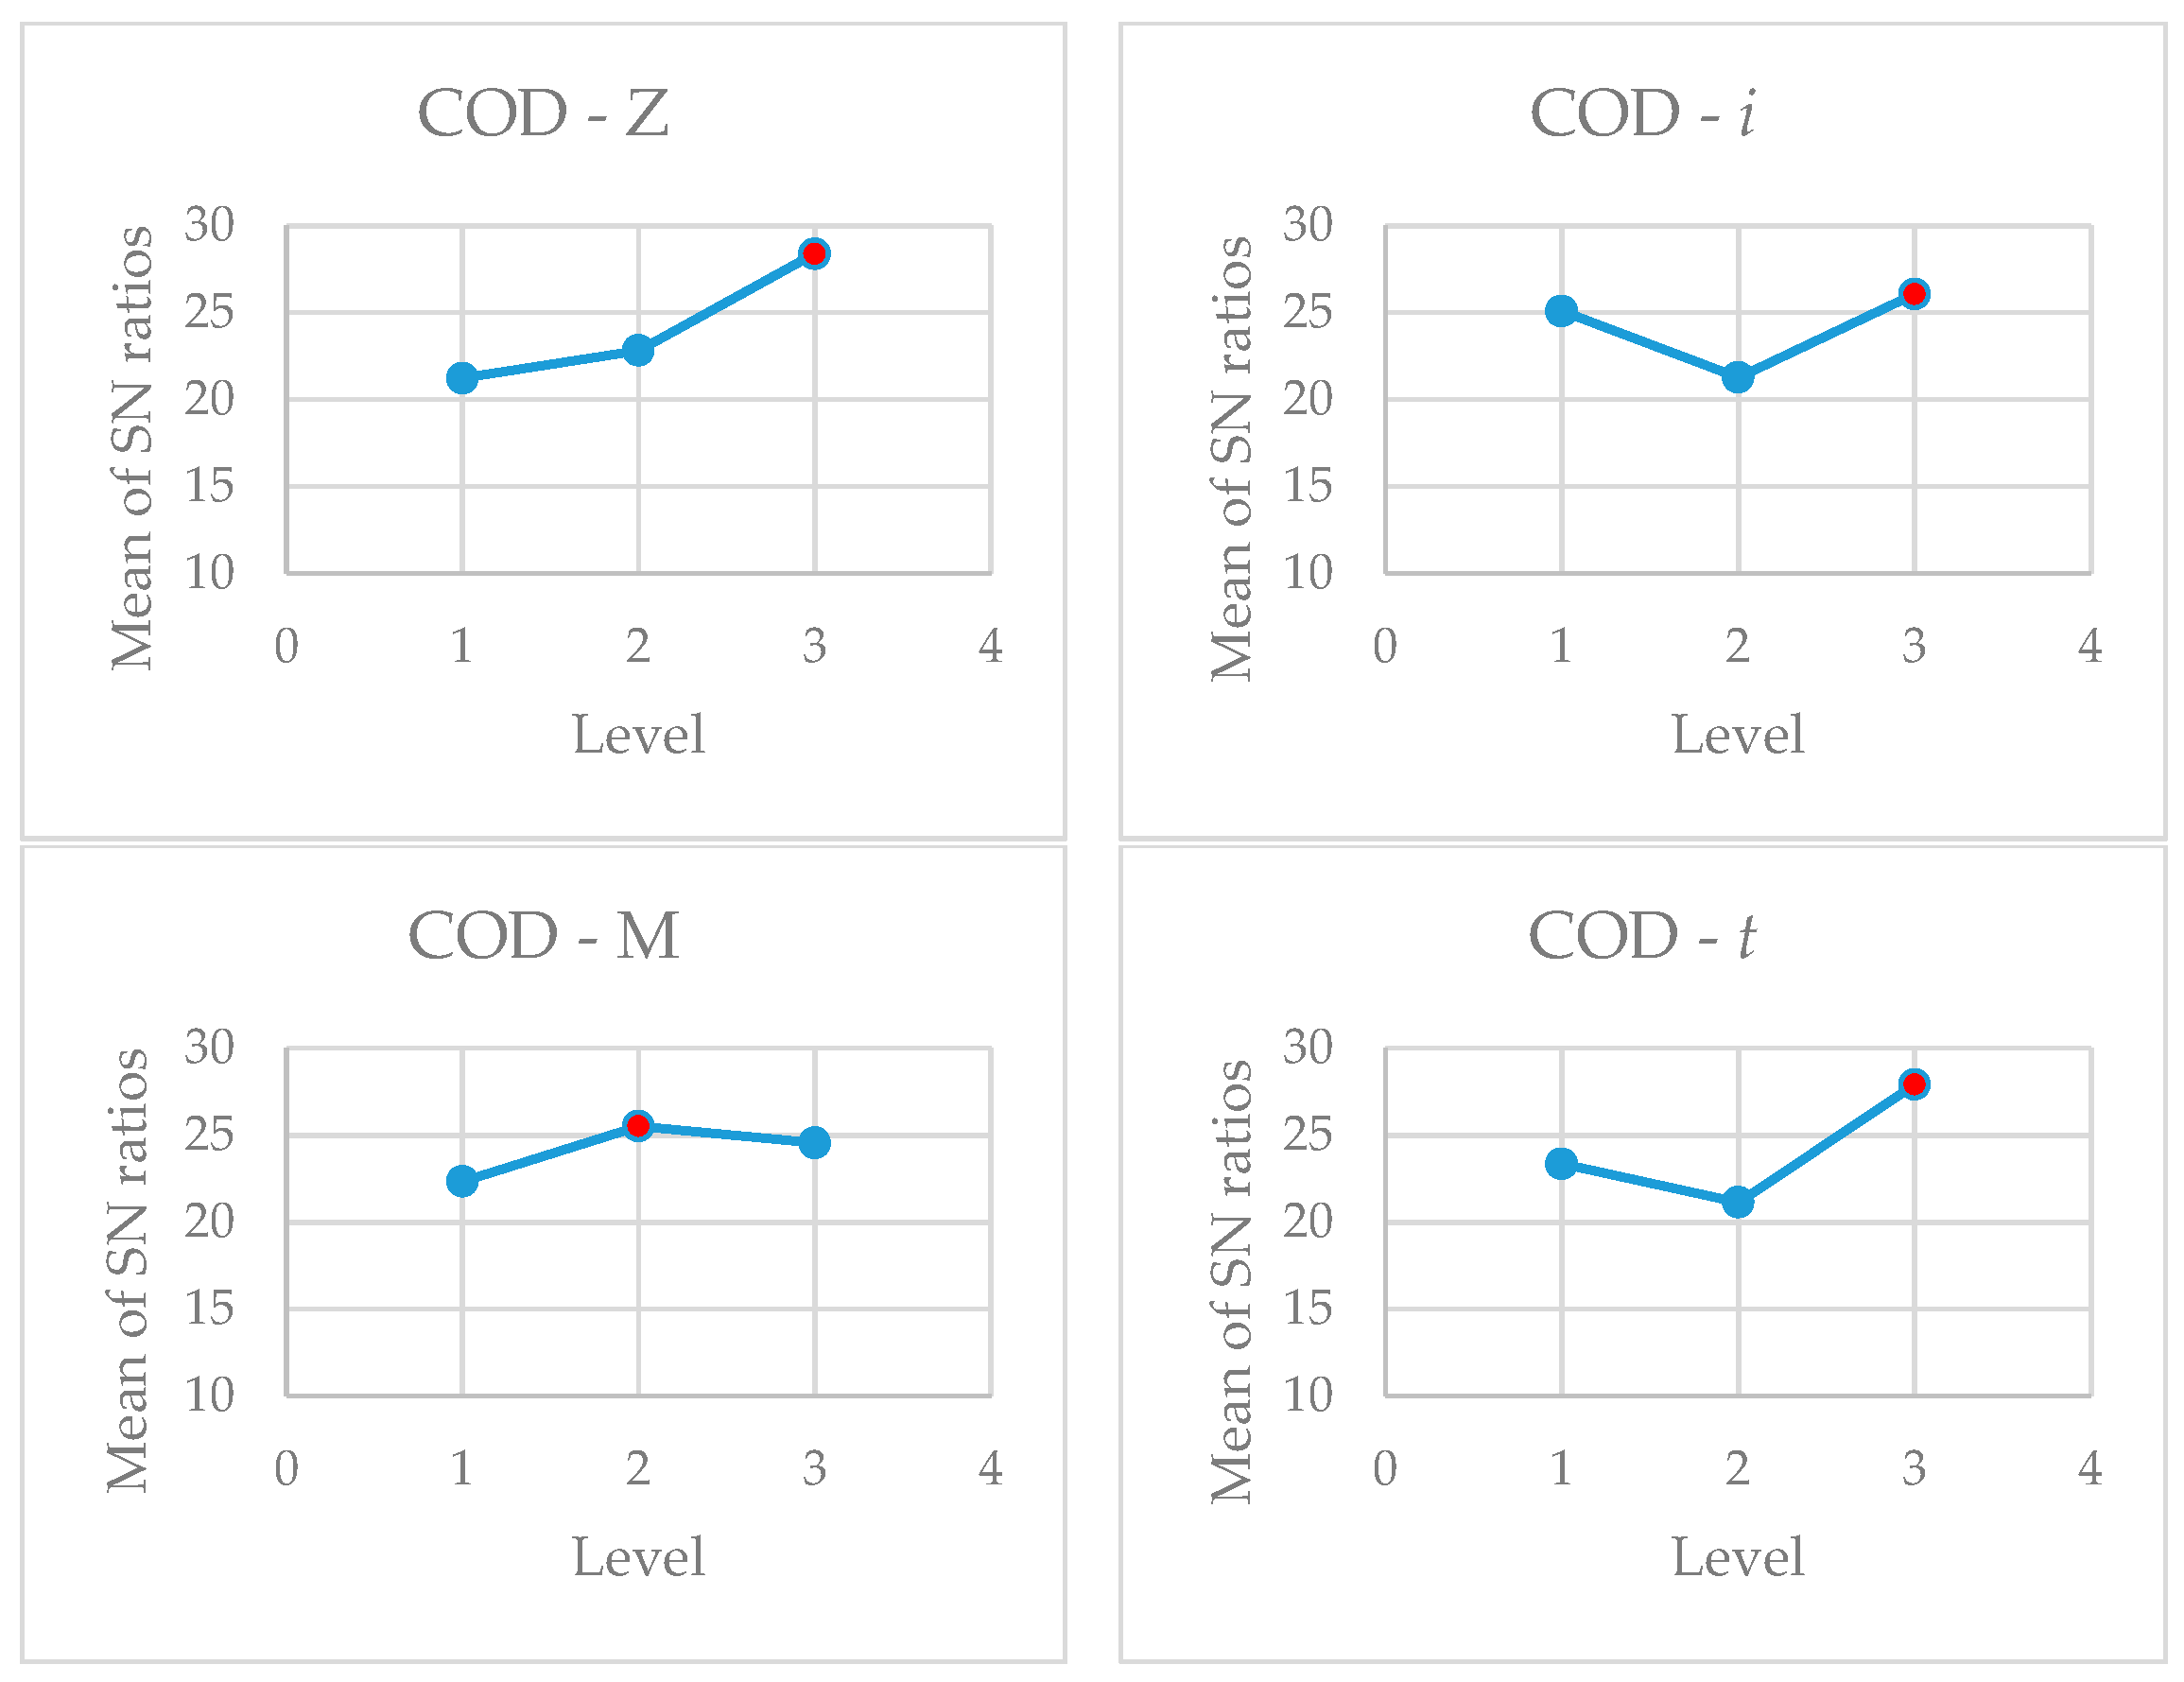
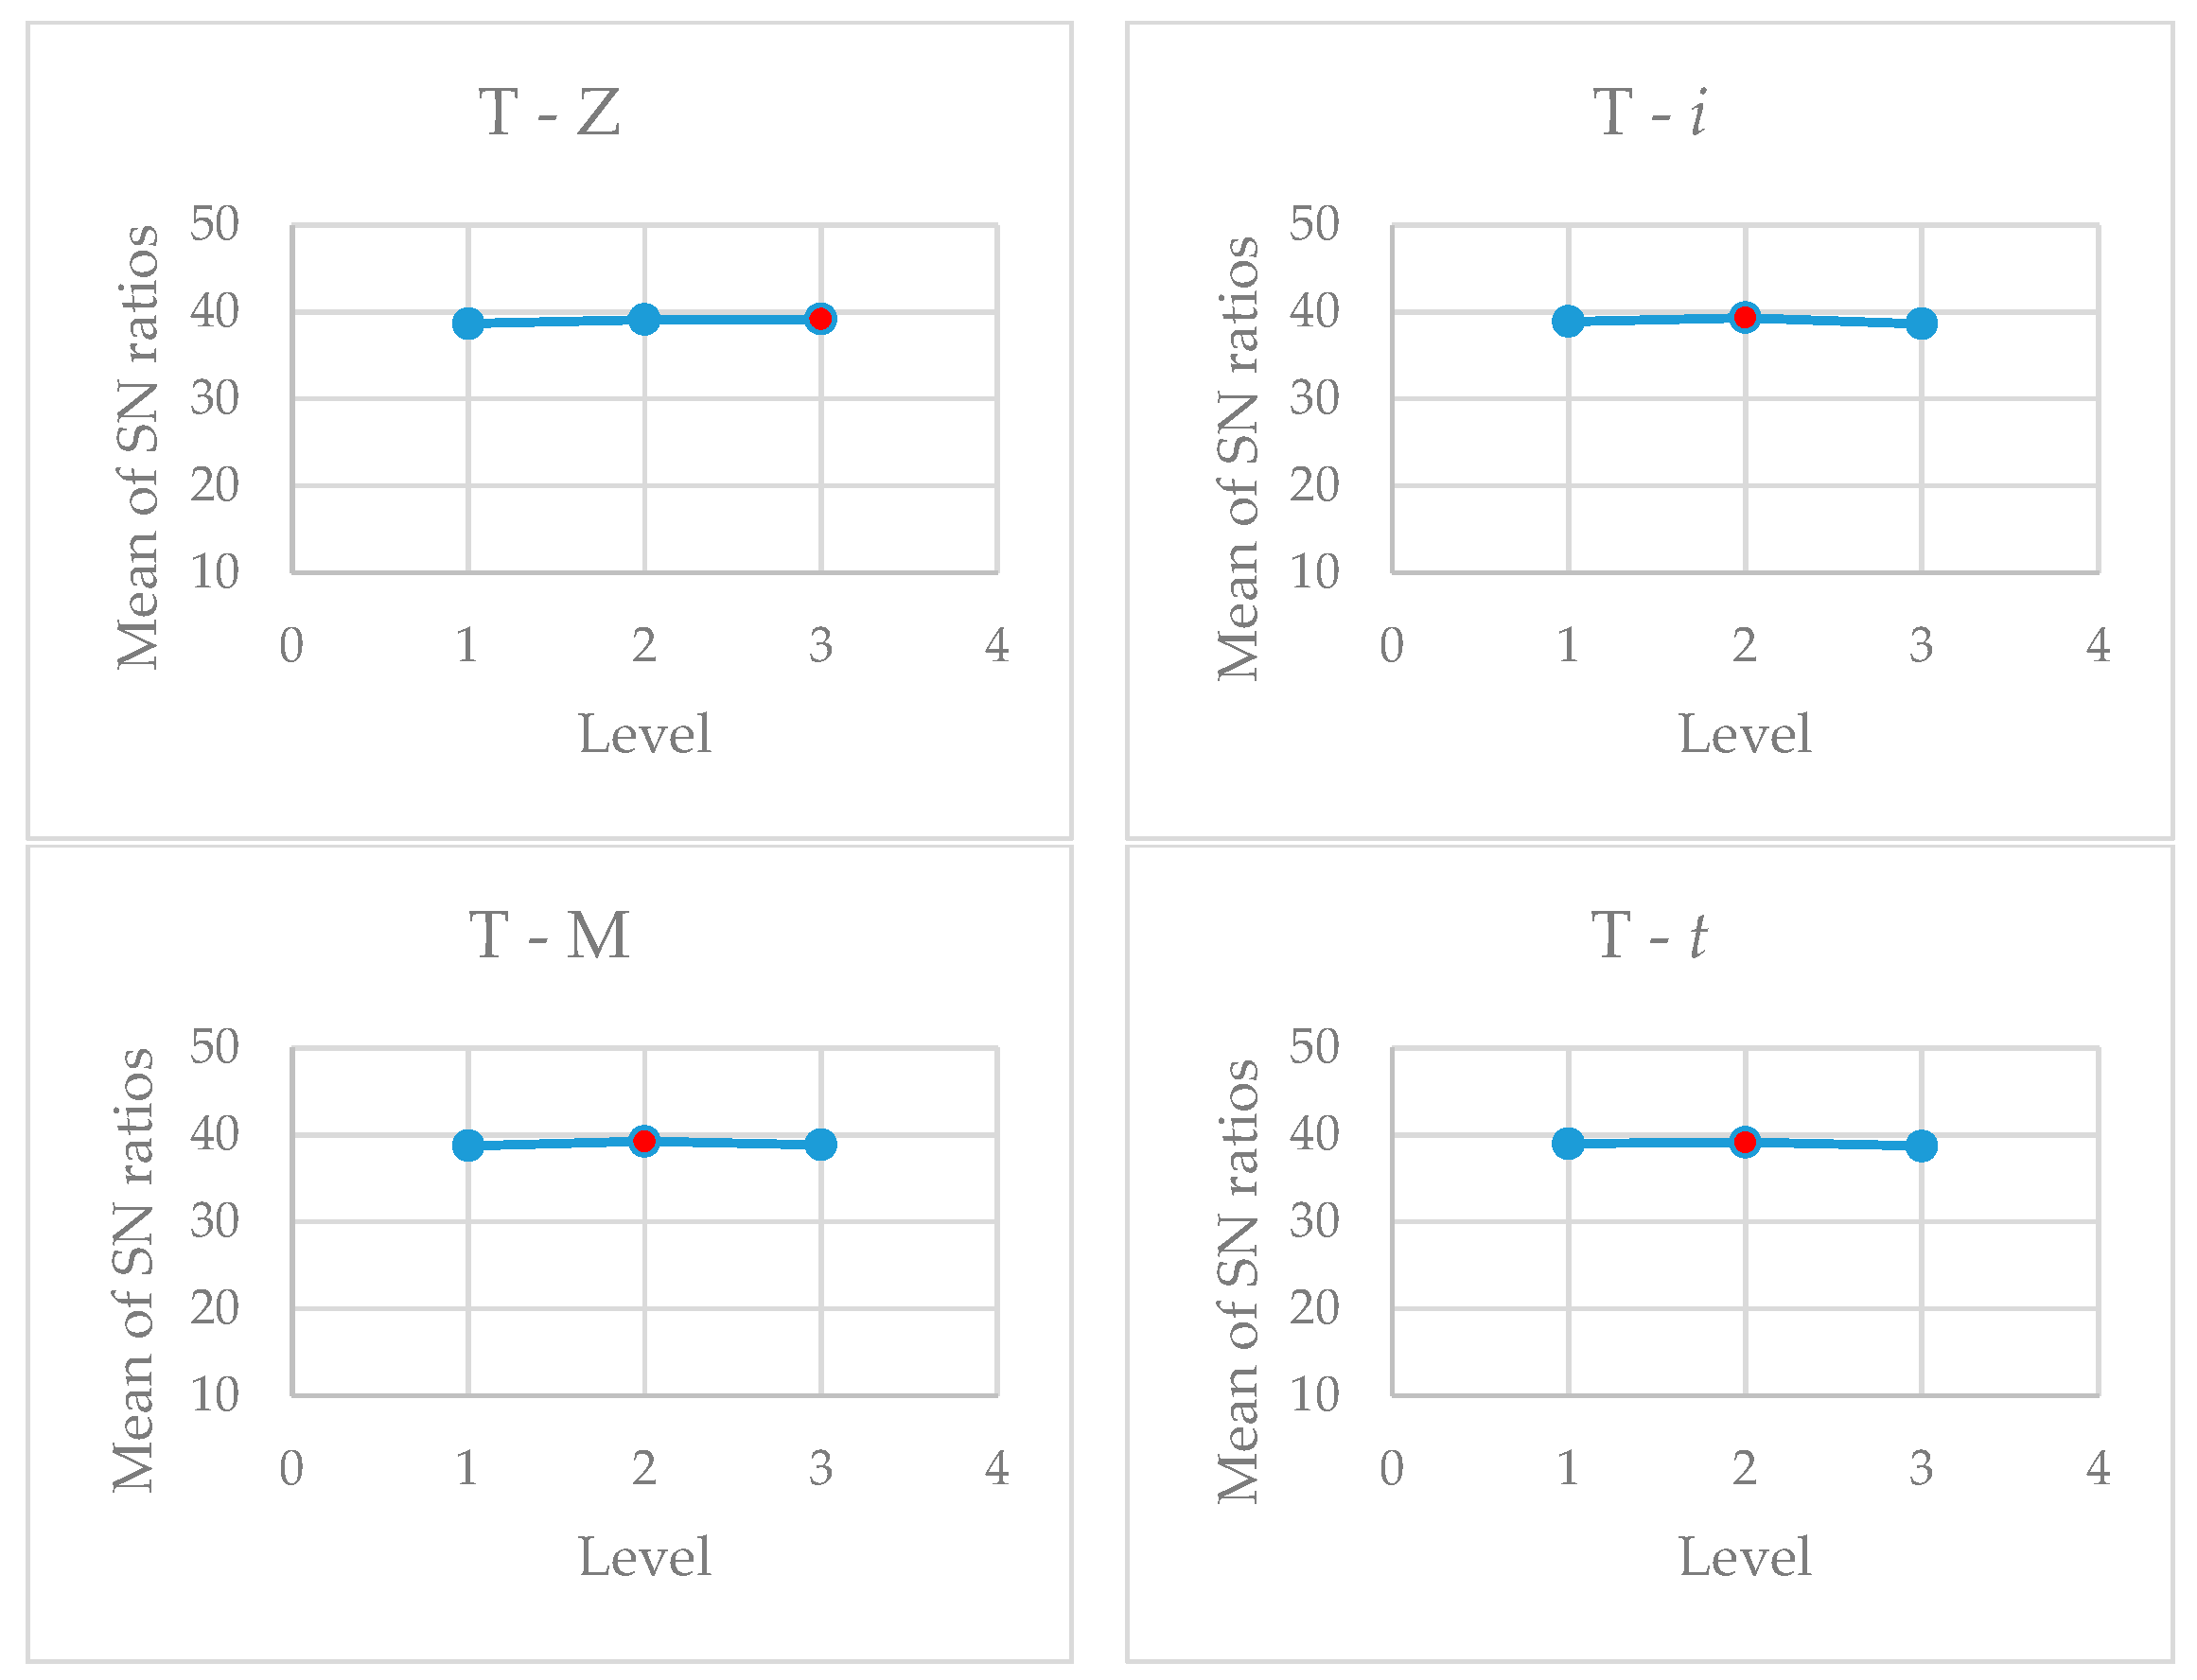
Analysis of the data shows, as can be seen in Figure 10, that for the following values: Z3, i3, M2; and t3, i.e., the largest zeolite SZ particles used, the highest current density used, Al electrodes, and after 30 min the highest COD decrease should be achieved. The highest turbidity removal should be achieved at the following values: Z3, i2, M2; and t2, i.e., the largest zeolite SZ particles used, the medium current density used, Al electrodes, and after 20 min. The analysis of the optimal values for both results shows the following: the highest COD and turbidity decrease is achieved with a zeolite particle size of 160–600 µm and with Al electrodes. In addition to analysing the optimal level of the factors, their effect on the mean values and SN ratios was also investigated. As can be seen from Table 6 and Table 7, the effects of the studied parameters on COD and the reduction in turbidity are completely opposite. The results show that in the optimization of two responses, the final selection of the optimal parameters cannot be based only on the Taguchi results. Regarding current density and contact time, some other factors, such as energy and electrode costs, must be considered before a final decision is made.
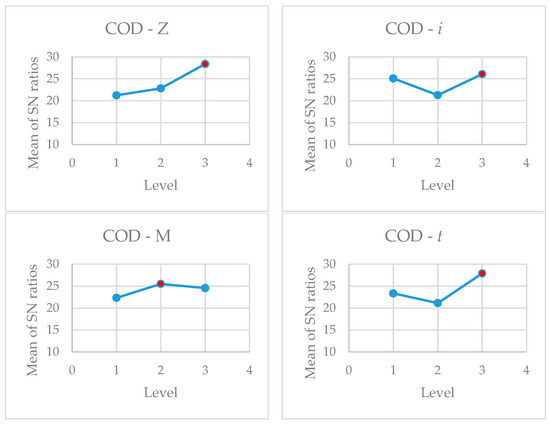
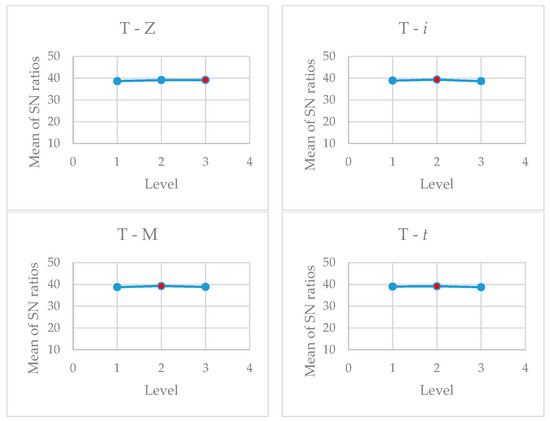
Figure 10.
Main effect plot for S/N ratios (red dot—optimal level).
Table 6.
Effect of controllable factors on means.
Table 7.
Effect of controllable factors on S/N ratio.
3.5. Energy and Electrode Consumption during ECZ Process
The electrode cost was calculated using Faraday’s law and mass loss measurements before and after the ECZ experiments, while the energy cost was calculated using only Faraday’s law [39]. The results are compared in Table 8.
Table 8.
Comparison of electrode and energy consumption.
Applied voltages ranged from 3.08–17.00 V, while applied currents ranged from 0.045–0.970 A. The highest energy cost was obtained in experiment C3 with the Zn electrode (1313.657 kW/m3), while the lowest was obtained in C1 with the Fe electrode (3.960 kW/m3), indicating a very high oscillation depending on the experimental conditions. Considering the influence of the zeolite particle size, a tendency towards lower power costs can be observed for the largest zeolite particle size.
The electrode costs calculated from the electrode mass consumption mostly exceeded the theoretical values calculated using Faraday’s law, which is known as “superfaradiac efficiency” [65]. These are the result of two effects: dissolution of the cathode, which occurs during EC, and electrochemical oxidation and reduction of water, which can change the solution pH in vicinity of the anode and cathode, thus contributing to their dissolution. However, these differences are less pronounced at the largest zeolite particle size. As electrode distance and mixing speed were constant in all experiments, this suggests that even the largest zeolite particle size causes greater surface damage, which has a positive effect on lower electrode consumption and contributes to higher COD and turbidity decrease (see Table 2).
However, the final values of electrode and power costs will depend on the market price. These fluctuations are even more pronounced today, as we face extremely increasing costs of electrical energy and market prices of metals. Thus, a possible solution to reduce the electricity cost during the ECZ process should consider the application of renewable energy sources, while decreasing metal electrode costs can be compensated using waste material as electrodes for ECZ.
In the context of limiting environmental standards, it is necessary to determine the residual amount of metal in the final solution, especially if the effluents are discharged into the natural receiving water without additional treatment, as they may have a negative impact on living organisms. The management of the electrosludge generated during the ECZ process can still be a problem as it can contain organic matter, metals, and nonmetallic compounds. A solution needs to be found on how to convert the EC sludge into a valuable resource to achieve sustainability. Furthermore, spent zeolite can be regenerated and reused in a later cycle, ensuring its recyclability.
4. Conclusions
Electrocoagulation coupled with zeolite (ECZ) is used to treat compost leachate with a very high organic load and to investigate the influence of SZ zeolite particle size on the efficiency of the ECZ process. The results show that with the largest zeolite particle size of 160–600 µm generally obtains a lower increase in pH and temperature and a higher COD and turbidity decrease. However, the electrode type, current density, and contact time also have a significant effect on the measured parameters, but their changes are less pronounced with the largest zeolite particle size. Consumption of anode and cathode electrodes is observed in all experiments. Higher electrode consumption in amount of 0.6481 g was obtained in experiments with the smallest zeolite particle size of <90 μm and with the Zn electrode, while with medium (SZ = 90–160 µm) and large zeolite particle size (SZ = 160–600 µm), the highest electrodes consumptions were obtained with the Fe electrode (in range 0.1002–0.1085 g). Microscopic images of the electrode surface before and after the ECZ process generally show more damage on the electrode surface with the largest zeolite particle size of 160–600 µm, but the influence of electrode type, current density, and contact time cannot be neglected. The diffraction pattern of the SZ zeolite used shows the most dominant structurally ordered phase of the sodium potassium aluminium silicate hydrate and belongs to the FAU-Faujasite family. The diffraction patterns of electrogenerated sludge mixed with zeolite show only small changes in interplanar spacing at low and medium particle size, while this effect was not observed at higher zeolite particle size. SEM/EDS analysis of electrogenerated sludge mixed with zeolite after ECZ treatment differ slightly in elemental composition, but oxygen, silicon, and aluminium are dominant elements. Taguchi L9 orthogonal array was applied to analyse the effects of synthetic SZ zeolite particle size, electrode materials, current density, and contact time on COD and turbidity decrease. The highest COD and turbidity decrease is achieved with the largest zeolite particle size of 160–600 µm, and with Al electrodes. For current density and contact time, the obtained results differ, and for the final decision, the energy and electrode costs should be considered before making a final selection. The energy costs estimated by Faraday’s law ranged from 3.960 kW/m3 to 1313.657 kW/m3, but in general, the lower energy costs and the smaller difference between the electrode costs calculated from the electrode mass consumption and the theoretical values calculated by Faraday’s law were obtained for the experiments with the largest zeolite particle size of 160–600 µm.
Although electrocoagulation with zeolite (ECZ) was efficiently used to treat compost leachate with a very high organic load, the final COD values are significantly higher than the Croatian regulations for the discharge of treated wastewater into the sewer system. This means that for the treatment of compost leachate with very high organic load additional processes, such as two-stage or multistage ECZ processes, the application of another pretreatment stage such as advanced oxidation processes must be considered.
Author Contributions
L.V. and N.V.M.: formal analysis, conceptualisation, methodology, validation, writing-original draft, supervision, writing, review and editing. S.S.: conceptualisation, writing-original draft, methodology; modelling, supervision, writing, review and editing. D.J. and A.Č.: formal analysis, investigation, writing-original draft, writing, review and editing. K.M.: formal analysis, investigation. All authors have read and agreed to the published version of the manuscript.
Funding
The results in this paper are funded by institution funds of the Faculty of Chemical Technology University of Split, Croatia.
Data Availability Statement
The dataset analysed in the current study are available from the corresponding author.
Acknowledgments
We would like to acknowledge to the “Functional integration of the University of Split, PMF-ST, PF-ST and KTF-ST through the development of scientific research infrastructure in the building of three faculties” (KK.01.1.1.02.0018), a project co-financed by the Croatian Government and the European Union through the European Regional Development Fund—the Competitiveness and Cohesion Operational Programme.
Conflicts of Interest
The authors declare that they have no competing interest.
References
- Król, M. Natural vs. Synthetic Zeolites. Crystals 2020, 10, 622. [Google Scholar] [CrossRef]
- Hardi, G.W.; Maras, M.A.J.; Riva, Y.R.; Rahman, S.F. A Review of Natural Zeolites and Their Applications: Environmental and Industrial Perspectives. Int. J. Appl. Eng. Res. 2020, 15, 730–734. Available online: https://www.ripublication.com/ijaer20/ijaerv15n7_16.pdf (accessed on 15 July 2023).
- Velarde, L.; Nabavi, M.S.; Escalera, E.; Antti, M.-L.; Akhtar, F. Adsorption of heavy metals on natural zeolites: A review. Chemosphere 2023, 328, 138508. [Google Scholar] [CrossRef] [PubMed]
- Kuldeyev, E.; Seitzhanova, M.; Tanirbergenova, S.; Tazhu, K.; Doszhanov, E.; Mansurov, Z.; Azat, S.; Nurlybaev, R.; Berndtsson, R. Modifying Natural Zeolites to Improve Heavy Metal Adsorption. Water 2023, 15, 2215. [Google Scholar] [CrossRef]
- Yuna, Z. Review of the Natural, Modified, and Synthetic Zeolites for Heavy Metals Removal from Wastewater. Environ. Eng. Sci. 2016, 33, 443–454. [Google Scholar] [CrossRef]
- Guida, S.; Potter, C.; Jefferson, B.; Soares, A. Preparation and evaluation of zeolites for ammonium removal from municipal wastewater through ion exchange process. Sci. Rep. 2020, 10, 12426. [Google Scholar] [CrossRef]
- Jiménez-Reyes, M.; Almazán-Sánchez, P.T.; Solache-Ríos, M. Radioactive waste treatments by using zeolites. A short review. J. Environ. Radioact. 2021, 233, 106610. [Google Scholar] [CrossRef]
- Derbe, T.; Temesgen, S.; Bitew, M. A Short Review on Synthesis, Characterization, and Applications of Zeolites. Adv. Mater. Sci. Eng. 2021, 2021, 6637898. [Google Scholar] [CrossRef]
- Łach, M.; Grela, A.; Pławecka, K.; Guigou, M.D.; Mikuła, J.; Komar, N.; Bajda, T.; Korniejenko, K. Surface Modification of Synthetic Zeolites with Ca and HDTMA Compounds with Determination of Their Phytoavailability and Comparison of CEC and AEC Parameters. Materials 2022, 15, 4083. [Google Scholar] [CrossRef]
- Valdés, H.; Riquelme, A.L.; Solar, V.A.; Azzolina-Jury, F.; Thibault-Starzyk, F. Removal of chlorinated volatile organic compounds onto natural and Cu-modified zeolite: The role of chemical surface characteristics in the adsorption mechanism. Sep. Purif. Technol. 2021, 258, 118080. [Google Scholar] [CrossRef]
- Pavlinović, A.; Novaković, M.; Nuić, I. Removal of carbendazim from aqueous solutions by adsorption on different types of zeolite. ST Open 2021, 2, e2021.1906.14. [Google Scholar] [CrossRef]
- Ugrina, M.; Vukojević Medvidović, N.; Daković, A. Characterization and environmental application of iron modified zeolite from the Zlatokop deposit. Desalin. Water Treat. 2015, 53, 3557–3569. [Google Scholar] [CrossRef]
- de Magalhães, L.F.; da Silva, G.R.; Peres, A.E.C. Zeolite Application in Wastewater Treatment. Adsorpt. Sci. Technol. 2022, 2022, 4544104. [Google Scholar] [CrossRef]
- Castro, C.J.; Shyu, H.Y.; Xaba, L.; Bair, R.; Yeh, D.H. Performance and onsite regeneration of natural zeolite for ammonium removal in a field-scale non-sewered sanitation system. Sci. Total Environ. 2021, 776, 145938. [Google Scholar] [CrossRef] [PubMed]
- Vukojević Medvidović, N.; Svilović, S. Cyclic zinc capture and zeolite regeneration using a column method, mass transfer analysis of multi regenerated bed. J. Environ. Health Sci. Eng. 2023. [Google Scholar] [CrossRef]
- Vukojević Medvidović, N.; Perić, J.; Trgo, M. Column performance in lead removal from aqueous solutions by fixed bed of natural zeolite–clinoptilolite. Sep. Purif. Technol. 2006, 49, 237–244. [Google Scholar] [CrossRef]
- Margeta, K.; Farkaš, A. Introductory Chapter: Zeolites—From Discovery to New Applications on the Global Market. In Zeolites—New Challenges; Margeta, K., Farkaš, A., Eds.; IntechOpen: London, UK, 2020. [Google Scholar] [CrossRef]
- Khaleque, A.; Alam, M.M.; Hoque, M.; Mondal, S.; Haider, J.B.; Xu, B.; Johir, M.A.H.; Karmakar, A.K.; Zhou, J.L.; Ahmed, M.B.; et al. Zeolite synthesis from low-cost materials and environmental applications: A review. Environ. Adv. 2020, 2, 100019. [Google Scholar] [CrossRef]
- Salahudeen, N.A. Review on Zeolite: Application, Synthesis and Effect of Synthesis Parameters on Product Properties. Chem. Afr. 2022, 5, 1889–1906. [Google Scholar] [CrossRef]
- Saravanan, A.; Senthil Kumar, P.; Jeevanantham, S.; Karishma, S.; Tajsabreen, B.; Yaashikaa, P.R.; Reshma, B. Effective water/wastewater treatment methodologies for toxic pollutants removal: Processes and applications towards sustainable development. Chemosphere 2021, 280, 130595. [Google Scholar] [CrossRef]
- Mohammad, A.W.; Ang, W.L. (Eds.) Integrated and Hybrid Process Technology for Water and Wastewater Treatment, 1st ed.; Elsevir: Amsterdam, The Netherland, 2021; Available online: https://books.google.hr/books?id=ViMZEAAAQBAJ&pg=PR3&hl=hr&source=gbs_selected_pages&cad=2#v=onepage&q&f=false (accessed on 7 July 2023).
- Das, P.P.; Sharma, M.; Purkait, M.K. Recent progress on electrocoagulation process for wastewater treatment: A review. Sep. Purif. Technol. 2022, 292, 121058. [Google Scholar] [CrossRef]
- Tawalbeh, M.; Al-Shannag, M.; Al-Anber, Z.; Bani-Melheme, K. Combined electrocoagulation processes as a novel approach for enhanced pollutants removal: A state-of-the-art review. Sci. Total Environ. 2020, 744, 140806. [Google Scholar] [CrossRef]
- Tegladza, I.D.; Xu, Q.; Xu, K.; Lv, G.; Lu, J. Electrocoagulation processes: A general review about role of electro-generated floc in pollutant removal. Process Saf. Environ. Prot. 2021, 146, 169–189. [Google Scholar] [CrossRef]
- Moussa, D.T.; El-Naas, M.H.; Nasser, M.; Al-Marri, M.J. A comprehensive review of electrocoagulation for water treatment: Potentials and challenges. J. Environ. Manag. 2017, 186, 24–41. [Google Scholar] [CrossRef]
- Bharath, M.; Krishna, B.M.; Kumar, B.M. A review of electrocoagulation process for wastewater treatment. Int. J. Chem. Tech. Res. 2018, 11, 289–302. Available online: https://sphinxsai.com/2018/ch_vol11_no3/3/(289-302)V11N03CT.pdf (accessed on 5 June 2023).
- Tahreen, A.; Jami, M.S.; Ali, F. Role of electrocoagulation in wastewater treatment: A developmental review. J. Water Process Eng. 2020, 37, 101440. [Google Scholar] [CrossRef]
- Mousazadeh, M.; Niaragh, E.K.; Usman, M.; Khan, S.U.; Sandoval, M.A.; Al-Qodah, Z.; Khalid, Z.B.; Gilhotra, V.; Emamjomeh, M.M. A critical review of state-of-the-art electrocoagulation technique applied to COD-rich industrial wastewaters. Environ. Sci. Pollut. Res. 2021, 28, 43143–43172. [Google Scholar] [CrossRef]
- Simonič, M.; Čurlin, M.; Fras Zemljič, L. Analysis of electrocoagulation process efficiency of compost leachate with the first order kinetic model. Holist. Approach Environ. 2020, 10, 35–40. Available online: https://hrcak.srce.hr/file/346950 (accessed on 7 July 2023). [CrossRef]
- Hamid, M.A.A.; Aziz, H.A.; Yusoff, M.S.; Abdul Rezan, S. Clinoptilolite augmented electrocoagulation process for the reduction of high-strength ammonia and color from stabilized landfill leachate. Water Environ. Res. 2020, 93, 596–607. [Google Scholar] [CrossRef]
- Hamid, M.A.A.; Aziz, H.A.; Yusoff, M.S.; Abdul Rezan, S. Optimization and analysis of zeolite augmented electrocoagulation process in the reduction of high-strength ammonia in saline landfill leachate. Water 2020, 12, 247. [Google Scholar] [CrossRef]
- Hamid, M.A.A.; Aziz, H.A.; Yusoff, M.S.; Rezan, S.A.A. Continuous clinoptilolite augmented SBR-electrocoagulation process to remove concentrated ammonia and colour in landfill leachate. Environ. Technol. Innov. 2021, 23, 101575. [Google Scholar] [CrossRef]
- Sutanto; Rohadi, N. Effect of Addition of Zeolite and Sodium Chloride on Changes in Bacterial Content and Turbidity in Industrial Wastewater Treatment into Drinking Water using Electrocoagulation Process. In Proceedings of the 8th Annual Southeast Asian International Seminar (ASAIS 2019), Jakarta, Indonesia, 7–8 November 2019; pp. 67–73. [Google Scholar] [CrossRef]
- Alenezi, A.K.; Hasan, H.A.; Hashim, K.S.; Amoako-Attah, J.; Gkantou, M.; Muradov, M.; Kot, P.; Abdulhadi, B. Zeolite-assisted electrocoagulation for remediation of phosphate from calcium-phosphate solution. IOP Conf. Ser. Mater. Sci. Eng. 2020, 888, 012031. [Google Scholar] [CrossRef]
- Zolfaghari, M.; Magdouli, S.; Tanabene, R.; Komtchou, S.P.; Martial, R.; Saffar, T. Pragmatic strategy for the removal of ammonia from gold mine effluents using a combination of electro-coagulation and zeolite cation exchange processes: A staged approach. J. Water Process Eng. 2020, 37, 101512. [Google Scholar] [CrossRef]
- Vrsalović, L.; Vukojević Medvidović, N.; Svilović, S.; Pavlinović, A. Taguchi method in the optimization of municipal wastewater treatment by electrocoagulation integrated with zeolite. Energy Rep. 2023, 9, 59–76. [Google Scholar] [CrossRef]
- Svilović, S.; Vukojević Medvidović, N.; Vrsalović, L.; Kulić, A. Combining natural zeolite and electrocoagulation with different electrode materials—Electrode surface analysis and Taguchi optimization. Appl. Surf. Sci. Adv. 2022, 12, 100330. [Google Scholar] [CrossRef]
- Vukojević Medvidović, N.; Vrsalović, L.; Ugrina, T.; Jukić, I. Electrocoagulation augmented with natural zeolite—The new hybrid process for treatment of leachate from composting of biowaste. In Proccedings of the 19th International Foundrymen conference: Humans—Valuable Resource for Foundry Industry Development, Split, Croatia, 16–18 June 2021; Dolić, N., Zovko Brodarac, Z., Brajčinović, S., Eds.; University of Zagreb, Faculty of Metallurgy: Zagreb, Croatia, 2021; pp. 489–498. Available online: https://ifc.simet.hr/?page_id=2518 (accessed on 11 July 2023).
- Vukojević Medvidović, N.; Vrsalović, L.; Svilović, S.; Bobanović, A. Electrocoagulation vs. Integrate Electrocoagulation-Natural Zeolite for Treatment of Biowaste Compost Leachate—Whether the Optimum Is Truly Optimal. Minerals 2022, 12, 442. [Google Scholar] [CrossRef]
- Svilović, S.; Mužek, M.N.; Vučenović, P.; Nuić, I. Taguchi design of optimum process parameters for sorption of copper ions using different sorbents. Water Sci. Technol. 2019, 80, 98–108. [Google Scholar] [CrossRef]
- Svilović, S.; Rušić, D.; Stipišić, R.; Kuzmanić, N. Process optimization for copper sorption onto synthetic zeolite NaX. Bulg. Chem. Commun. 2020, 52, 189–196. [Google Scholar] [CrossRef]
- Vukojević Medvidović, N.; Vrsalović, L.; Svilović, S.; Bilušić, A.; Jozić, D. Electrocoagulation treatment of compost leachate using aluminium alloy, carbon steel and zinc anode. Appl. Surf. Sci. Adv. 2023, 15, 100404. [Google Scholar] [CrossRef]
- Apaydina, Ö.; Ozkan, E. Landfill leachate treatment with electrocoagulation: Optimization by using Taguchi method. Desalin. Water Treat. 2020, 173, 65–76. [Google Scholar] [CrossRef]
- Deghles, A.; Kurt, U. Treatment of raw tannery wastewater by electrocoagulation technique: Optimization of effective parameters using Taguchi method. Desalin. Water Treat. 2016, 57, 14798–14809. [Google Scholar] [CrossRef]
- Eaton, A.D.; Clesceri, L.S.; Rice, E.W.; Greenberg, A.E.; Franson, M.A.H. (Eds.) Standard Methods for the Examination of Water and Wastewater, 21st ed.; American Public Health Association (APHA): Washington, DC, USA; American Water Works Association (AWWA): Washington, DC, USA; Water Environment Federation (WEF): Washington, DC, USA, 2005. [Google Scholar]
- Safwat, S.M. Treatment of real printing wastewater using electrocoagulation process with titanium and zinc electrodes. J. Water Process Eng. 2020, 34, 101137. [Google Scholar] [CrossRef]
- Croatian Regulation on Emission Limits Values in Wastewater, NN 26/2020. (In Croatian). Available online: https://narodne-novine.nn.hr/clanci/sluzbeni/2020_03_26_622.html (accessed on 11 July 2023).
- Smoczyńskia, L.; Kalinowskia, S.; Ratnaweerab, H.; Kosobuckaa, M.; Trifescua, M.; Pieczulis-Smoczyńska, K. Electrocoagulation of municipal wastewater—A pilot-scale test. Desalin. Water Treat. 2017, 72, 162–168. [Google Scholar] [CrossRef]
- Vrsalović, L.; Vukojević Medvidović, N.; Svilović, S.; Šarić, J. Application of Different Metals as Electrode Material in Compost Leachate Treament. Kem. Ind. 2023, 72, 297–304. [Google Scholar] [CrossRef]
- Davis, J.R. Corrosion Understanding the Basic; ASM International: Materials Park, OH, USA, 2000. [Google Scholar]
- Vargel, C.; Jacques, M.; Schmidt, M.P. Corrosion of Aluminium; Elsevier: Amsterdam, The Netherlands, 2004. [Google Scholar]
- Tao, J. Surface Composition and Corrosion Behavior of an Al-Cu Alloy. Ph.D. Thesis, Université Pierre et Marie Curie—Paris VI, Paris, France, 2016. [Google Scholar]
- Chen, G.S.; Gao, M.; Wei, R.P. Microconstituent-induced pitting corrosion in aluminum alloy 2024-T3. Corrosion 1996, 52, 8–15. [Google Scholar] [CrossRef]
- Boag, A.; Taylor, R.J.; Muster, T.H.; Goodman, N.; McCulloch, D.; Ryan, C.; Rout, B.; Jamieson, D.; Hughes, A.E. Stable pit formation on AA2024-T3 in a NaCl environment. Corros. Sci. 2010, 52, 90–103. [Google Scholar] [CrossRef]
- Bewerskog, B.; Puigdomenech, I. Revised Pourbaix diagram for zinc at 25–300 °C. Corros. Sci. 1997, 39, 107–114. [Google Scholar] [CrossRef]
- Fajardo, A.S.; Rodrigues, R.F.; Martins, R.C.; Castro, L.M.; Quinta-Ferreira, R.M. Phenolic wastewater treatment by electrocoagulation process using Zn anode. Chem. Eng. J. 2015, 275, 331–341. [Google Scholar] [CrossRef]
- Krezel, A.; Maret, W. The biological inorganic chemistry of zinc ions. Arch. Biochem. Biophys. 2016, 611, 3–19. [Google Scholar] [CrossRef]
- Parga, J.R.; González, G.; Moreno, H.; Valenzuela, J.L. Thermodynamic studies of the strontium adsorption on iron species generated by electrocoagulation. Desalin. Water Treat. 2012, 37, 244–252. [Google Scholar] [CrossRef]
- Moreno, H.A.; Cocke, D.L.; Gomez, J.A.G.; Morkovsky, P.; Parga, J.R.; Peterson, E.; Garcia, C. Electrochemistry behind electrocoagulation using iron electrodes. ECS Trans. 2007, 6, 1–15. [Google Scholar] [CrossRef]
- Ingelson, M.; Yasri, N.; Roberts, E.P.L. Electrode passivation, faradaic efficiency, and performance enhancement strategies in electrocoagulation—A review. Water Res. 2020, 180, 116433. [Google Scholar] [CrossRef]
- Rakhmania; Kamyab, H.; Yuzir, M.A.; Abdullah, N.; Quan, L.M.; Riyadi, F.A.; Marzouki, R. Recent Applications of the Electrocoagulation Process on Agro-Based Industrial Wastewater: A Review. Sustainability 2022, 14, 1985. [Google Scholar] [CrossRef]
- Ammouli, T.; Paillaud, J.-L.; Nouali, H.; Stephan, R.; Hanf, M.-C.; Sonnet, P.; Deroche, I. Insights into Water Adsorption in Potassium-Exchanged X-type Faujasite Zeolite: Molecular Simulation and Experiment. J. Phy. Chem. C 2021, 125, 19405–19416. [Google Scholar] [CrossRef]
- Rouquerol, J.; Llewellyn, P.; Sing, K. 12-Adsorption by Clays, Pillared Clays, Zeolites and Aluminophosphates. In Adsorption by Powders and Porous Solids: Principles, Methodology and Applications, 2nd ed.; Rouquerol, F., Rouquerol, J., Sing, K.S.W., Llewellyn, P., Maurin, G., Eds.; Academic Press: Cambridge, MA, USA, 2014; pp. 467–527. [Google Scholar] [CrossRef]
- Castaldi, P.; Santona, L.; Enzo, S.; Melis, P. Sorption processes and XRD analysis of a natural zeolite exchanged with Pb2+, Cd2+ and Zn2+ cations. J. Hazard. Mater. 2008, 156, 428–434. [Google Scholar] [CrossRef] [PubMed]
- Barrera-Díaz, C.E.; Balderas-Hernández, P.; Bilyeu, B. Electrocoagulation: Fundamentals and Prospectives. In Electrochemical Water and Wastewater Treatment; Martínez-Huitle, C.A., Rodrigo, M.A., Scialdone, O., Eds.; Elsevier Inc.: Oxford, UK, 2018; pp. 61–76. [Google Scholar] [CrossRef]

Disclaimer/Publisher’s Note: The statements, opinions and data contained in all publications are solely those of the individual author(s) and contributor(s) and not of MDPI and/or the editor(s). MDPI and/or the editor(s) disclaim responsibility for any injury to people or property resulting from any ideas, methods, instructions or products referred to in the content. |
© 2023 by the authors. Licensee MDPI, Basel, Switzerland. This article is an open access article distributed under the terms and conditions of the Creative Commons Attribution (CC BY) license (https://creativecommons.org/licenses/by/4.0/).