1. Introduction
Mineral resources constitute a pivotal component of a nation’s economic development. The continual integration of modern scientific theories and technological innovations within the domain of earth science has propelled substantial advancements in the theory, methodology, and technology employed for metallogenic prediction and mineral resource assessment [
1,
2]. Metallogenic prediction necessitates comprehensive analysis and evaluation due to the heterogeneous, intricate, and ambiguous nature of information influencing mineralization [
3,
4,
5]. As such, mineral resource prediction presents a challenging and high-priority issue in earth science. The intricate evaluation and prediction process cannot be effectively simulated using a singular factor. Thus, the development of a comprehensive evaluation and prediction model becomes imperative.
Given that ore-forming fault structures regulate the formation of metal deposits, fault structure prediction stands as an exclusive technique for uncovering mineral resources. Empirical evidence substantiates the utility of structural fractal dimension analysis as an effective method for prospecting prediction. The fractal theory facilitates a meticulous portrayal of complex structures, offering quantitative insights into elusive regularities [
6,
7]. This method not only enables quantitative analysis of structural fractal attributes and structural ore-controling characteristics, along with Fry analysis but also suggests potential prospects for prospecting prediction [
8,
9,
10,
11]. The formation of faults and deposits is attributed to intricate nonlinear dynamic processes, characterized as extreme geological events. The fractal theory facilitates an objective and quantitative depiction of these extreme geological phenomena [
12,
13].
The ongoing evolution and widespread adoption of information technology and big data technology have significantly enhanced the efficiency of prospecting prediction [
14,
15,
16]. The application of machine learning technology for extracting prospecting information and delineating prospecting areas represents a pioneering domain in digital geological science. Various technical methods, such as drilling, geophysical exploration, geochemical exploration, and remote sensing, yield abundant geological data, serving as pivotal support for the application of machine learning and deep learning algorithms [
17,
18]. Artificial intelligence technology has found extensive use in quantitatively predicting mineral resources, encompassing neural networks [
19], support vector machines [
20,
21,
22], random forests [
22,
23,
24,
25,
26,
27], extreme learning machines [
28,
29], AHP [
30,
31], and more. Notably, deep learning and convolutional neural networks (CNN) have been widely employed in mineral prediction and classification.
The Qixia area in Shandong, China, boasts favorable metallogenic geological conditions and abundant gold deposits. Nonetheless, due to the complexity and diversity of the metallogenic process, coupled with incomplete and uncertain prospecting information, traditional prospecting methods struggle to effectively unveil metallogenic regularities and discern potential metallogenic prospects. Addressing this issue, this paper integrates neural networks with fractal theory to comprehensively analyze and assess metallogenic factors in Qixia, Jiaodong. This study delineates metallogenic prospects based on multifaceted evaluations.
2. Geological Setting
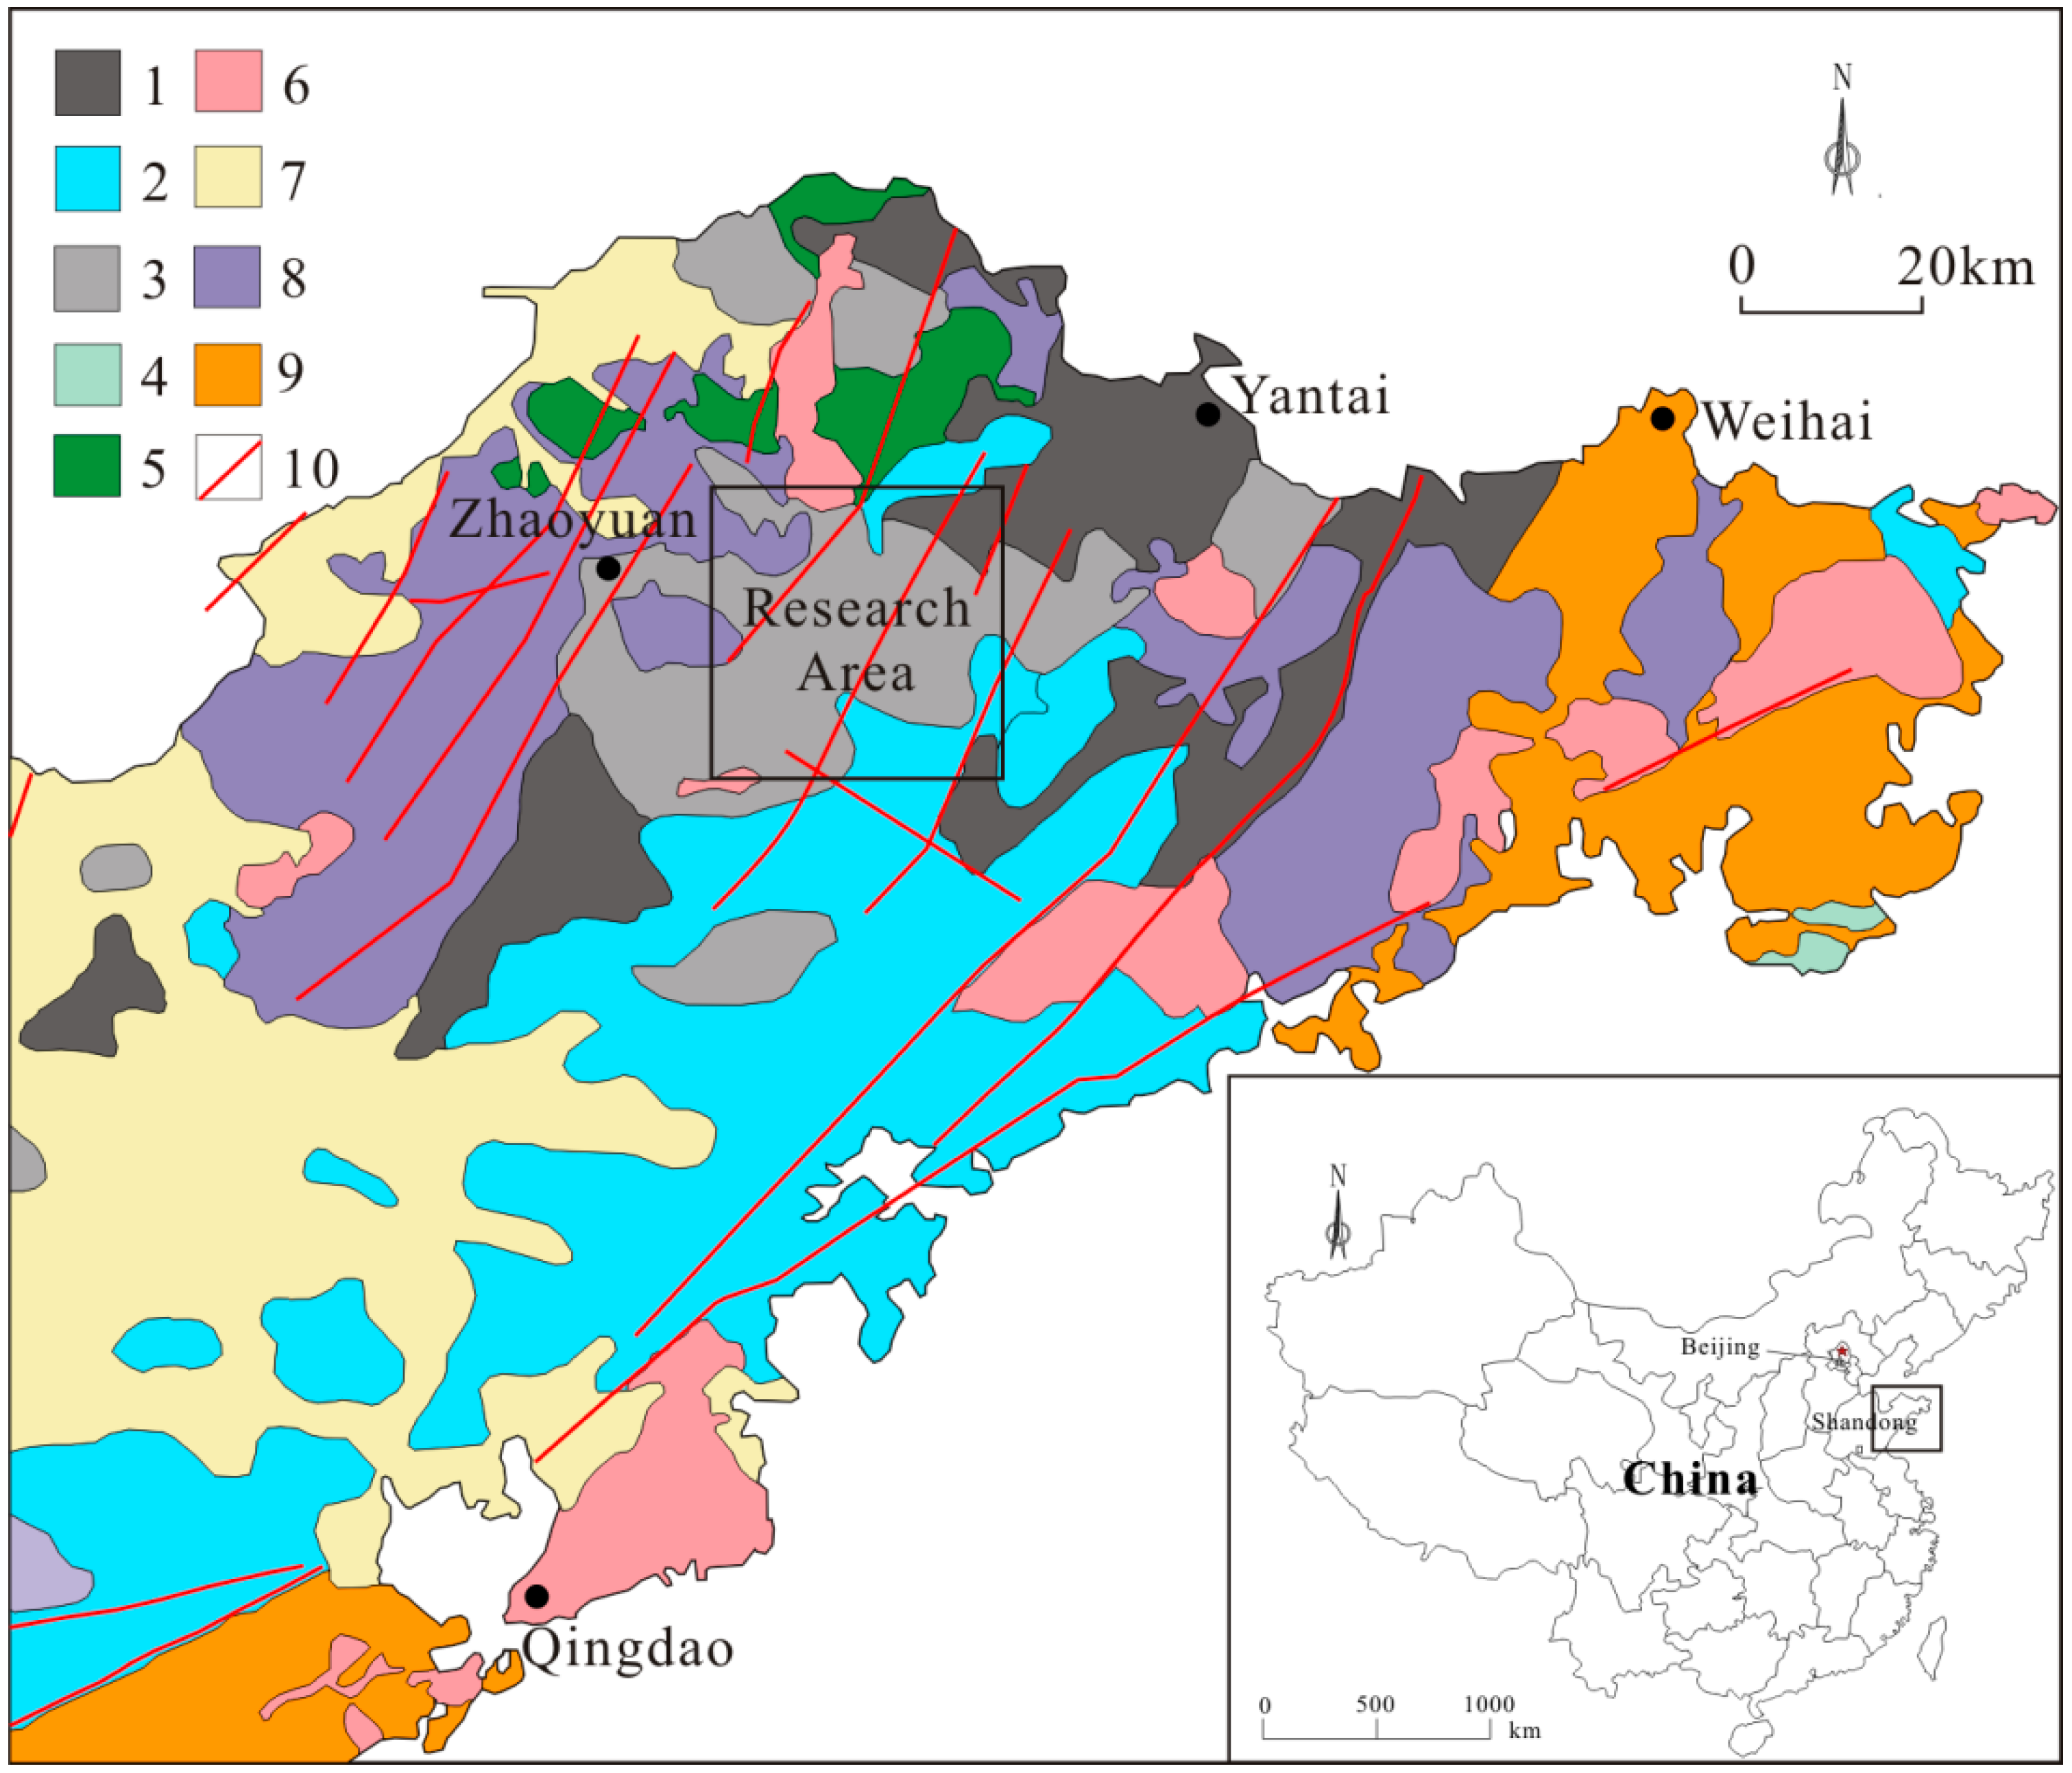
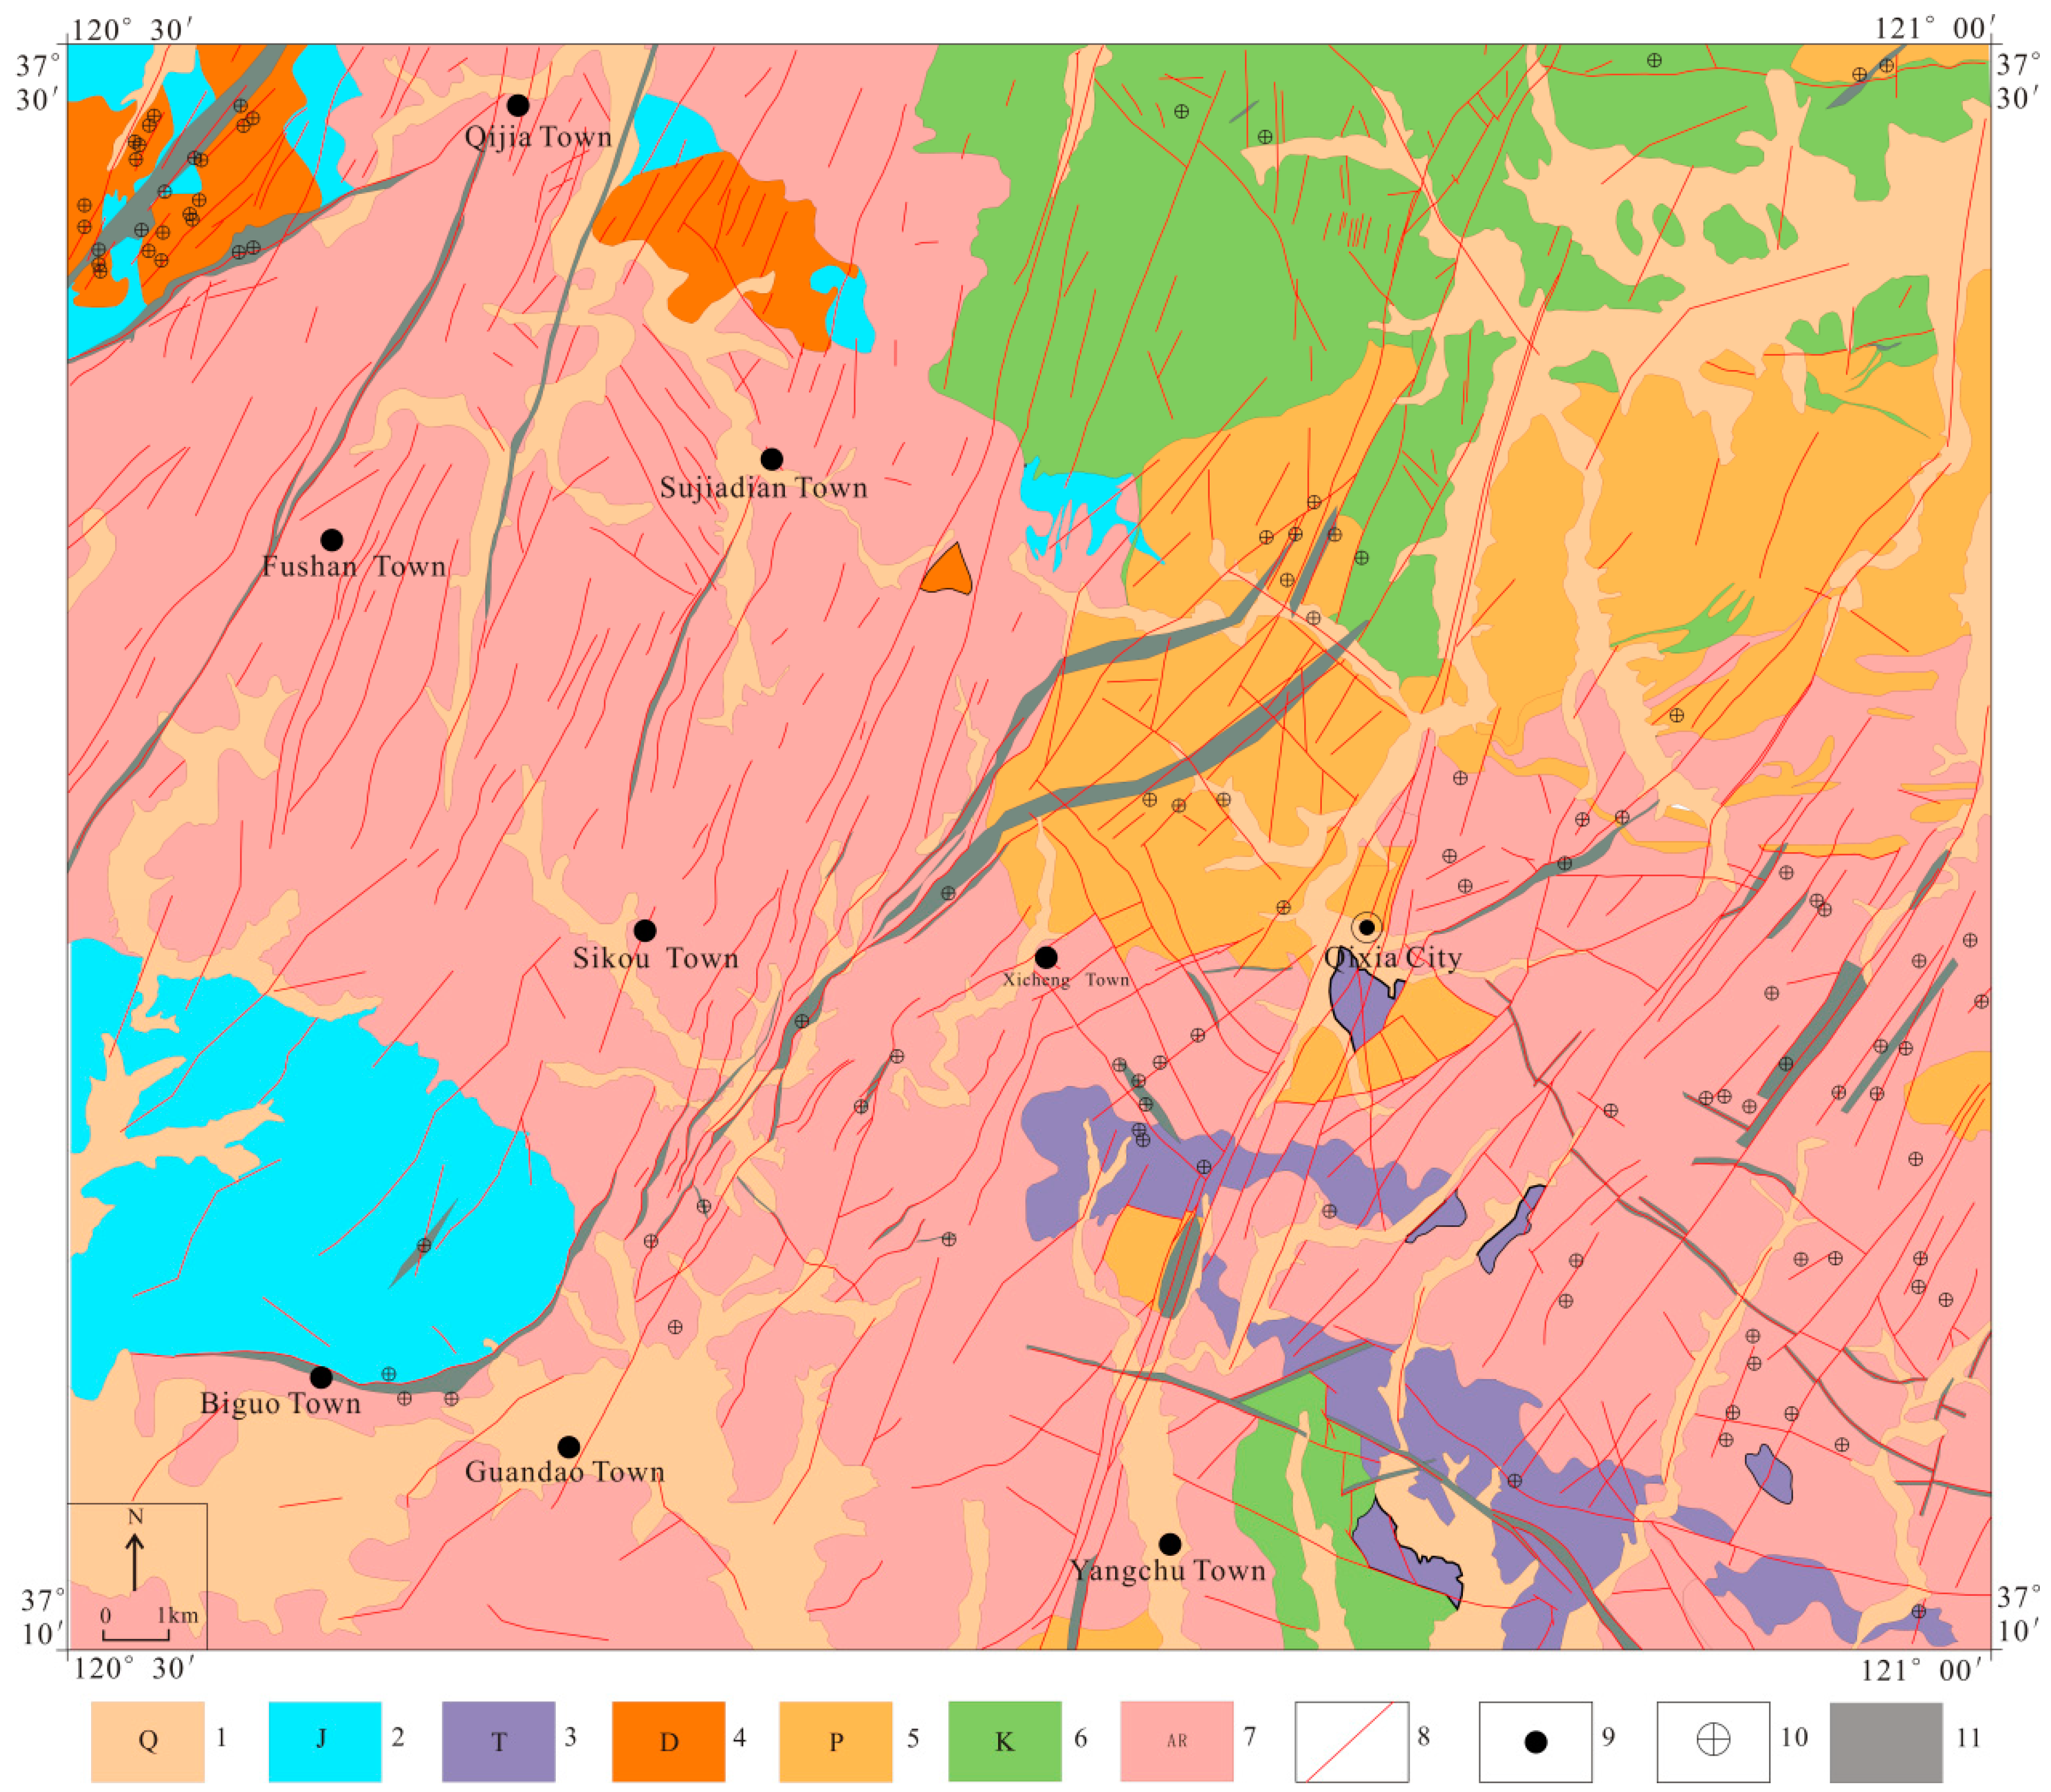
The Jiaodong Peninsula, situated on the eastern margin of the North China Craton, has the largest proven gold reserves and the highest abundance of extra-large gold deposits in China. The ore-concentrated area is bordered by the Tanlu fault to the west and the Qingdao-Rongcheng fault to the east. It primarily encompasses three NE metallogenic belts, namely the Zhaoyuan-Yexian metallogenic belt, the Penglai-Qixia metallogenic belt, and the Muping-Rushan metallogenic belt, arranged from west to east. The main metallogenic period falls within 110 and 130 Ma, with the Jiaodong type gold deposit being an exclusive Mesozoic gold deposit globally, found within the metamorphic basement of the early Precambrian.
Qixia is positioned in the northern part of the Jiaodong Peninsula, located between the Zhaoyuan-Pingdu fault and the Muping-Jimo fault. It lies adjacent to world-class super-large gold deposits such as Linglong, Jiaojia, Xincheng, and Sanshandao. The exposed strata in this region are predominantly composed of Precambrian metamorphic rocks and Mesozoic granitoid intrusive rocks. Magmatic rocks encompass Mesozoic gabbro, granitoid, and Cretaceous volcanic rocks, along with a limited quantity of Cenozoic basalt (
Figure 1). The Jiaodong Group, Jingshan Group, and Mesozoic granitoid act as the primary host rocks for gold deposits. The Qixia area exhibits well-developed fault structures, with the NE strike fault being the most pronounced group, followed by the near EW-NE strike fault. This area is characterized by a high density of NE faults, serving as the primary ore-controling structures for gold deposits. EW-trending faults often display discontinuity, scattering across the surface. Initial evidence suggests a robust correlation between the genesis of nonferrous metal deposits and early Cretaceous magmatic activity. In recent years, through the division and analysis of metallogenic series, multiple gold and nonferrous metal deposits have been identified and confirmed in the Qixia area (
Figure 2).
The primary geological types of gold deposits in the study area can be categorized into altered rock type and quartz-vein type. Altered rock-type gold deposits refer to occurrences within altered rocks dominated by pyrite sericite and pyrite-sericitized granitic cataclastic rocks. These are chiefly controlled by high-level gently dipping fault zones, mainly compressive or compressional, and often associated with main faults. Quartz-vein-type gold deposits pertain to ore-forming modes primarily involving filling. Quartz vein is commonly controlled by secondary faults in the footwall of the main fault, characterized by mineralization types mainly involving silicification and pyritization. These are largely governed by low-grade steep dip fault zones, mainly tensional or tensional, frequently manifesting in small-scale secondary structures associated with or derived from the main fault. These two gold deposit types are closely linked to fault structures, which serve as conduits for ore-forming fluids and the sites of ore bodies.
Geochemical data from the study area were collected using a scale of 1:200,000, with river sediments as the sampling medium. Each sample underwent analysis for 10 elements, including Au, Ag, Cu, Zn, Mo, W, Hg, As, Sb, and Bi. For detailed chemical analysis methods, readers are referred to Zhang et al. (2021) [
32]. A descriptive statistical analysis was performed on these 10 geochemical elements, and the fundamental statistical characteristics resulting from the analysis are presented in
Table 1. Notably, As, Sb, and Au contents in the region were 7.72 times, 7.02 times, and 5.34 times the national average, respectively. Furthermore, the high coefficient of variation in Au, As, and Sb also underscores their substantial enrichment capability, signifying significant prospecting potential in this region.
3. Methodology
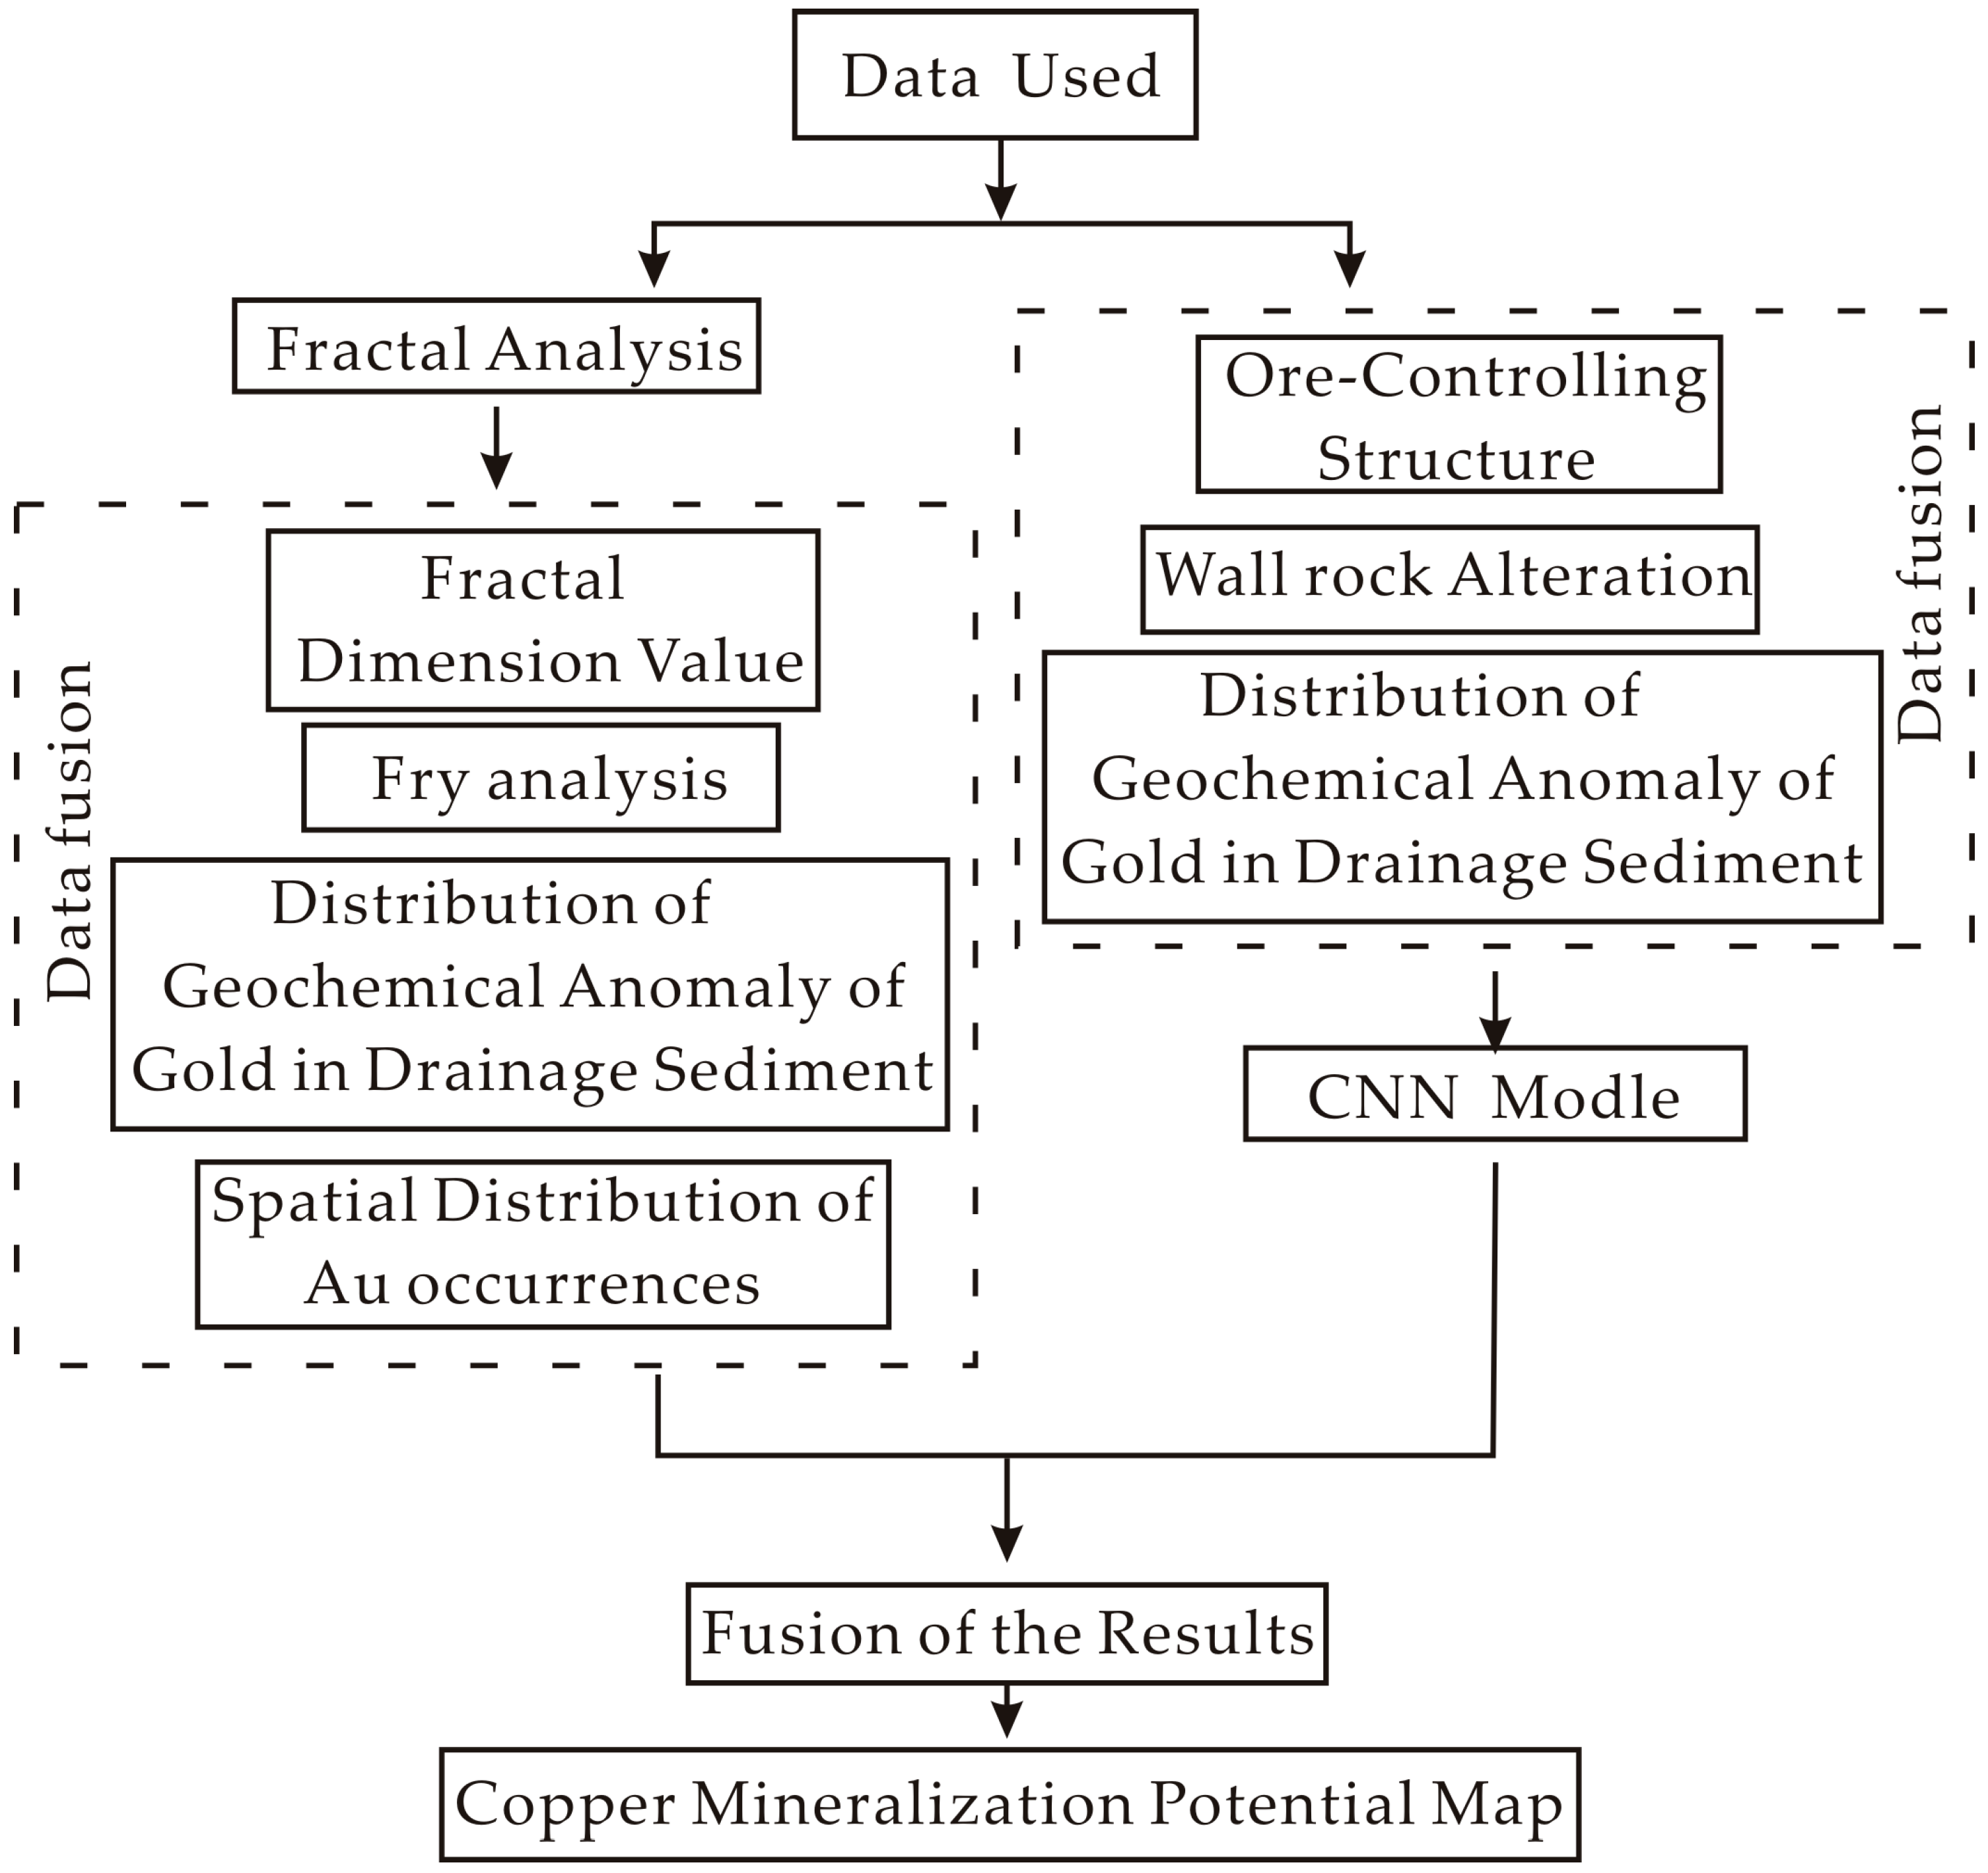
Figure 3 illustrates the flowchart of the methods utilized in this study. Through fractal analysis of faults in the study area, the fractal dimension of faults is determined. Subsequently, the forecast prospect map of gold deposits in the study area is generated by combining Fry analysis with geochemical anomalies of gold in river sediments. The Ore-controling, wall rock alteration, and Distribution of Geochemical Anomaly of Gold in Drainage Sediment collectively generate the information layer. The CNN model is then employed to generate the prospect map of gold deposits in the study area, and the prediction accuracy of the CNN model is validated through integration with known gold deposits. These two methods provide mutual verification, culminating in the creation of a gold deposit prediction prospect map for the study area.
3.1. Fractal Analysis
The fault system exhibits a complex spatial distribution. Traditional structural studies often rely on qualitative descriptions, lacking quantitative tools to analyze the spatial characteristics of faults. This limitation arises from the fact that the spatial distribution of fault structures can be represented as a series of irregular linear or planar aggregates [
34]. However, various studies have demonstrated that fault geometric shape and spatial distribution exhibit pronounced fractal structural characteristics. Fractal parameters can quantitatively depict the complexity of fault systems [
35,
36,
37,
38].
Presently, several methods exist for calculating the fractal dimensions of linear structures, such as the broken line method, box dimension method, circle covering method, and multifractal moment method. The fractal dimension value (D) serves not only as a comprehensive index reflecting the complexity and density of fault structures but also as a quantitative measure for identifying and extracting geochemical element anomalies and enrichment patterns. Furthermore, it aids in quantitative analysis of metallogenic regularities and metallogenic prediction. The correlation coefficient of D (R2) indicates the self-similarity exhibited by the fractal dimensions of regional linear structures. By utilizing fractal dimension values, i.e., Dij (i = 1, 2, 3, ……, 12; j = 1, 2, 3, ……, 9) and their central coordinates along with geological background analysis, the metallogenic prediction target area can be delineated.
3.2. Fry Analysis
Originally developed for analyzing rock strain [
9], Fry analysis has gradually been applied to mineral distribution analysis [
7], studies of distribution patterns of mineral deposits, and prospecting predictions [
39,
40,
41,
42], yielding promising outcomes. A Fry analysis of known ore occurrences can evaluate the distribution patterns of known ore deposits (points) and identify the potential locations of unknown ore deposits (points). Wang (2015) employed spatial point pattern analysis, fractal analysis, and Fry analysis to analyze the spatial relationship between known deposits (points) and the factors influencing the occurrence of ores [
42]. Although Fry analysis can analyze the distribution patterns of mineral deposits in this area based on the known mineral deposits, it cannot be applied alone and is often used in combination with the fractal theory. In essence, this approach assumes that mineral deposits (points) are “homogeneous” or stem from the same source.
Faults exhibit pronounced development in the northeastern portion of Jiaodong, significantly influencing ore deposition. In this study, the nonlinear characteristics of fault structure distribution in the northeastern part of Jiaodong were quantitatively examined via fractal analysis. The spatial relationship between fault structure distribution and gold mineralization was assessed. Additionally, fracture fractal analysis was employed to evaluate pre-mineralization in the study area.
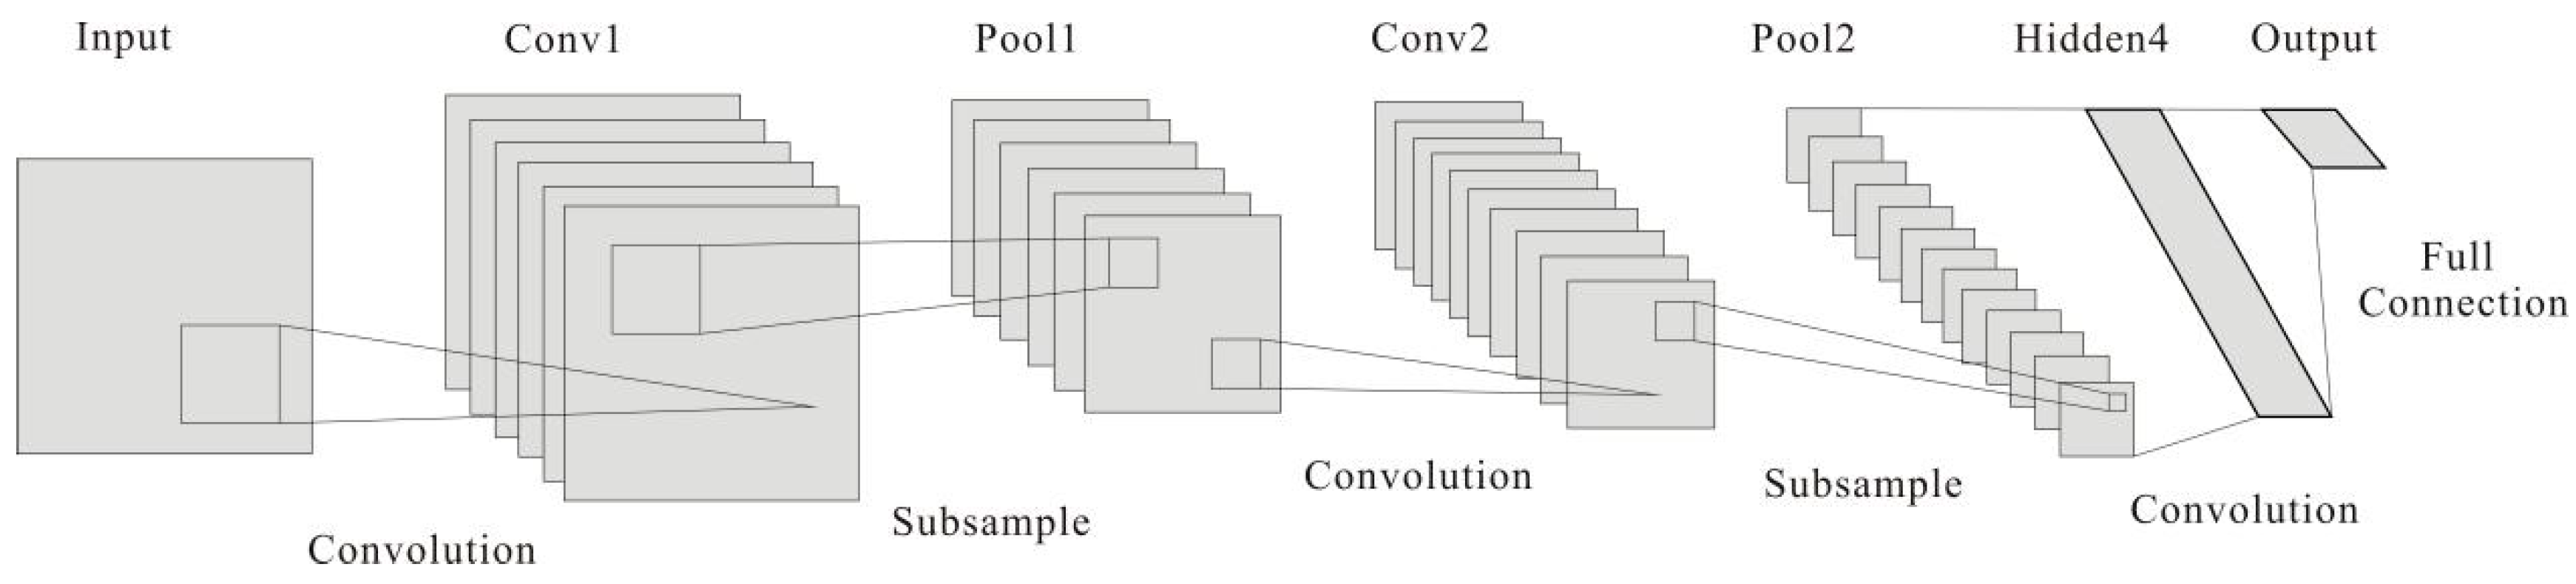
3.3. CNN Prospecting Prediction Model
CNN, inspired by biological systems, is a feed-forward neural network [
43]. It consists primarily of one or more convolution layers, pooling layers, and full connection layers (
Figure 4).
The convolution layer is the most pivotal element of the entire network model, comprising multiple feature surfaces. It plays a crucial role in extracting original features from input layer data.
Pooling layer: Extracted image features from the convolution layer can be judiciously chosen to generate a new image containing information from selected features. This pooling process further reduces nodes in the final full connection layer, subsequently decreasing parameters within the neural network.
Fully connected layer: After a sequence of convolution and pooling layers in CNN, one or more full connection layers are linked. The fully connected layer integrates local information, enabling category differentiation from the convolution or pooling layer.
The output value of the last layer of the fully connected layer, SoftMax, is transferred to the output layer for classification using SoftMax logic regression. The SoftMax layer produces the probability distribution of input information across designated categories as output.
4. Fractal Characteristics of Fault Structures
4.1. Method for Calculating Fractal Dimension Values
Within this investigation, the foundation map chosen was the one illustrating the distribution of fault structures and gold deposits (designated as points) within the Qixia area (as depicted in
Figure 5). The collection of fractal research data was predicated on the regional geological and mineral maps of Zhaogezhuang, Zangjiazhuang, Biguo, and Qixia at a scale of 1:50,000, along with the 1:200,000 sediment accomplishment map of the Jiaodong River system in Shandong Province. The study area is situated between 120°30′–121°00′ E and 37°10′–37°30′ N, encompassing an approximate area of 1690 km
2.
Utilizing the box dimension methodology, the interpreted fault structure map was partitioned into square grids, each characterized by a side length of L = 7.5 km. Subsequently, an analysis of D and R
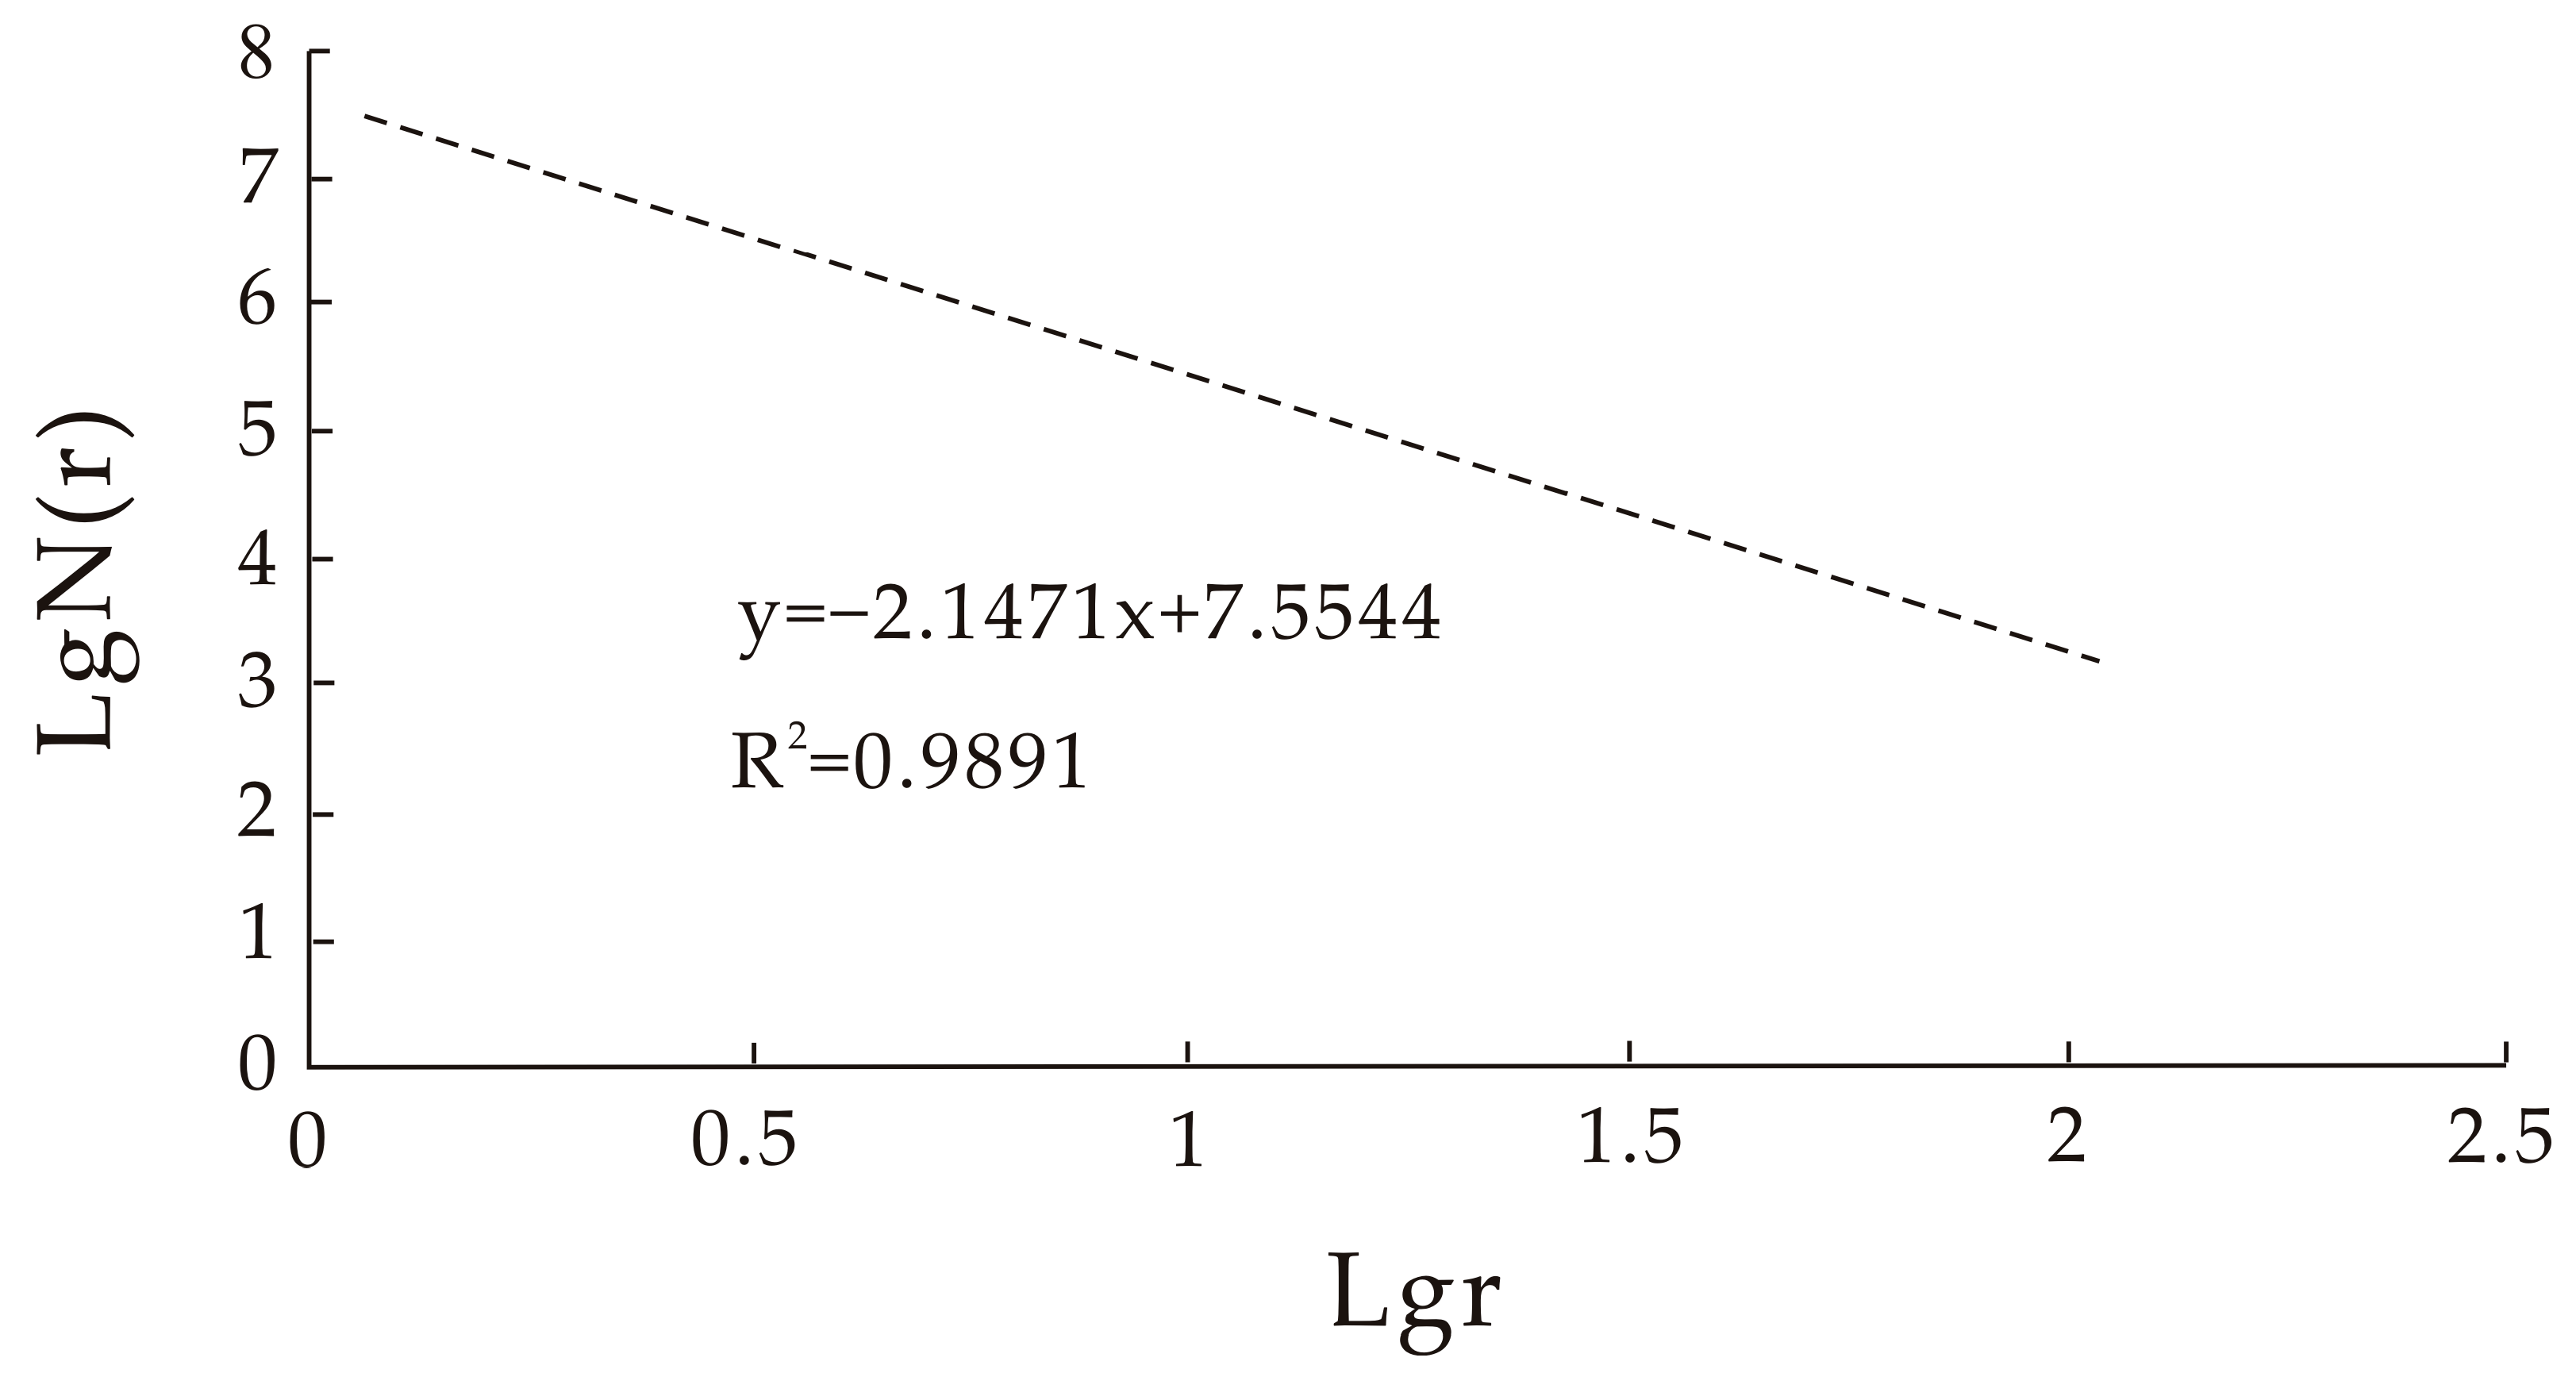
2 was undertaken regarding the fault structure at varying lengths of the square grids, specifically r = L, L/2, L/4, L/8, and L/16. The logarithmic scatter plot denoting “lgr vs. lgN(r)” was formulated employing the Gaussian coordinate system within Excel (where N(r) signifies the count of squares corresponding to fault construction). Furthermore, the numerical analysis regression equation facilitated the establishment of a linear relationship between lgr and lgN(r). Consequently, the logarithmic scatter plot of lgr vs. lgN(r) was attained (as expressed in Formula (1)). By drawing upon the dimensional values of each block (J = 1, 2, 3…12) and the central coordinates of said blocks, the generation of fractal contours was facilitated through the utilization of Surfer 12 software.
D: Fault fractal dimension value; N(r): Grid number; r: Grid side length.
Thus, the fractal analysis conducted on the fault structure in the Qixia area, Shandong Province, yielded values of R
2 = 0.9891 and D = 2.1471 (as shown in
Figure 6). The determined range for D was observed to be between 1.3297 and 1.9231, with the R
2 for each block surpassing 0.98. This observation underscores the presence of commendable self-similarity within the fault structures within the study area, reinforcing the potential utility of fractal dimension as a quantitative metric for the investigation of spatial scale and intricacy related to fault structures.
The calculated D of the NE, NW, and EW fault structures in the study area were 1.7231, 1.4984, and 1.0921, respectively, with R
2 > 0.98 for all cases (as detailed in
Table 2). This underscores that the NE, NW, and EW fault structures also manifest sound fractal self-similarity. Among these three fault types, the NE fault structure emerges as possessing the highest fractal dimension, emerging as the principal fault structure within the northern Jiaodong area. The NW-trending fault structure, closely mirroring the complexity of the NE-trending fault structure, stands out as a substantial metallogenic structure. Comparative analysis between the computed D value of the study area and those of other regions revealed that the D value of the study area exceeds that of the entire Shandong fault structure (1:200,000) (D = 1.45), a consequence of the pronounced development of secondary faults within the Penglai-Qixia fault zone.
A comparison of the study area’s D with that of other areas signifies that the study area’s D surpasses the entirety of the Shandong fault structure (1:200,000) (D = 1.45), reflecting the proliferation of secondary faults within the Penglai-Qixia fault zone.
Within this study, the range of D spans from 1.3297 to 1.9231, with an average of 1.7613 within each block (r = 7.5 km). A preliminary categorization of the study area can be conducted as follows: (1) a complex tectonic area with D ≥ 1.7500; (2) a middle tectonic area with 1.7500 > D ≥ 1.5000; and (3) a constructively simple region with 1.5000 > D > 1.3000.
4.2. Distribution Characteristics of the Gold Deposits
In the context of the metallogenic system, fault structures assume pivotal roles by facilitating pathways for ore-forming hydrothermal solutions’ migration and providing the necessary space for ore body formation [
44]. The fractal dimension of faults is intimately associated with the complexity of fault structures. Greater fractal dimensions signify heightened spatial fault distribution complexity, more prominent major fault branching, and escalated fault development within the region. This state enhances the facilitation of ore-forming hydrothermal solution migration, the concentration of ore-forming elements, and the eventual formation of ore deposits. Fault structures characterized by elevated fractal dimensions hold significant importance in the mineralization process [
45].
Mineral concentrations are primarily prominent in the northwestern and southeastern corners of the study area. Evidently from
Figure 7, some gold deposits are situated outside the structurally complex region. This observation underscores that higher D values do not unequivocally denote higher mineralization probabilities. The relationship between D of the fault structure and the metallogenic connection is not linearly straightforward.
The quantitative assessment of D pertaining to fault structures is instrumental in gauging metallogenic probability up to a critical threshold value [
8]. Lower D values of fault structures correspond to limited deformation and permeability of faults, isolated fault occurrences, and inadequate fracture connectivity, factors that inhibit the formation of hydrothermal minerals. Upon D reaching the critical threshold value, enhanced fault deformation and permeability emerge, resulting in improved fault connectivity, localized accumulation of hydrothermal solutions conducive to ore formation, and a heightened likelihood of mineralization. As D tends toward the critical threshold value, fault deformation, and permeability become optimally conducive to the generation of a deposit, or even a substantial deposit, through the accumulation of ore-forming hydrothermal solutions. D surpassing the critical threshold value prompts continued escalation of fault deformation and permeability, increasingly improved fault connectivity, and a greater intricacy of fault structure, leading to the homogenization of said structure. During this phase, ore-forming hydrothermal solutions tend not to converge locally but instead exhibit uniform dispersion, an environment unsuitable for hydrothermal deposit formation [
46].
4.3. Factor Analysis
This study involved the statistical computation of the fractal dimension of fault structures within the study area, accompanied by the determination of their dominant orientations. The obtained D values stood at 2.1471 for the study area as a whole, 1.7231 for NE-trending structures, 1.4948 for NW-trending structures, and 1.0921 for EW-trending structures. Of these, the NE and NW-oriented fault structures displayed heightened complexity and made the most substantial contributions to mineralization within the study area. Notably, the NW-oriented fault structures alone are insufficient to fulfill the conditions conducive to metallogenesis. Consequently, the combination of NE and/or EW fault structures with other directions, one or two in total, becomes essential to fulfill requisite metallogenic conditions. Integration of mineral data in the study area with fault structure data (
Table 3) elucidated that ore body occurrences are strictly regulated by the NS and NE ore-hosting faults. Moreover, the fault structures responsible for ore body formation within the mining area are a composite of NS or (and) NE faults in conjunction with NW and (or) EW faults. The analysis of fractal dimensions of fault structures and their interplay with ore bodies points towards the significant role played by the combination of NE, NW, and EW fault structures in the context of mineralization. As such, the focus of metallogenic prognosis should center upon the combination of these aforementioned fault orientations. The fractal dimension map of fault structures, along with the distribution map of gold deposits within the study area, establishes that gold deposits are primarily concentrated within zones featuring D > 1.500.
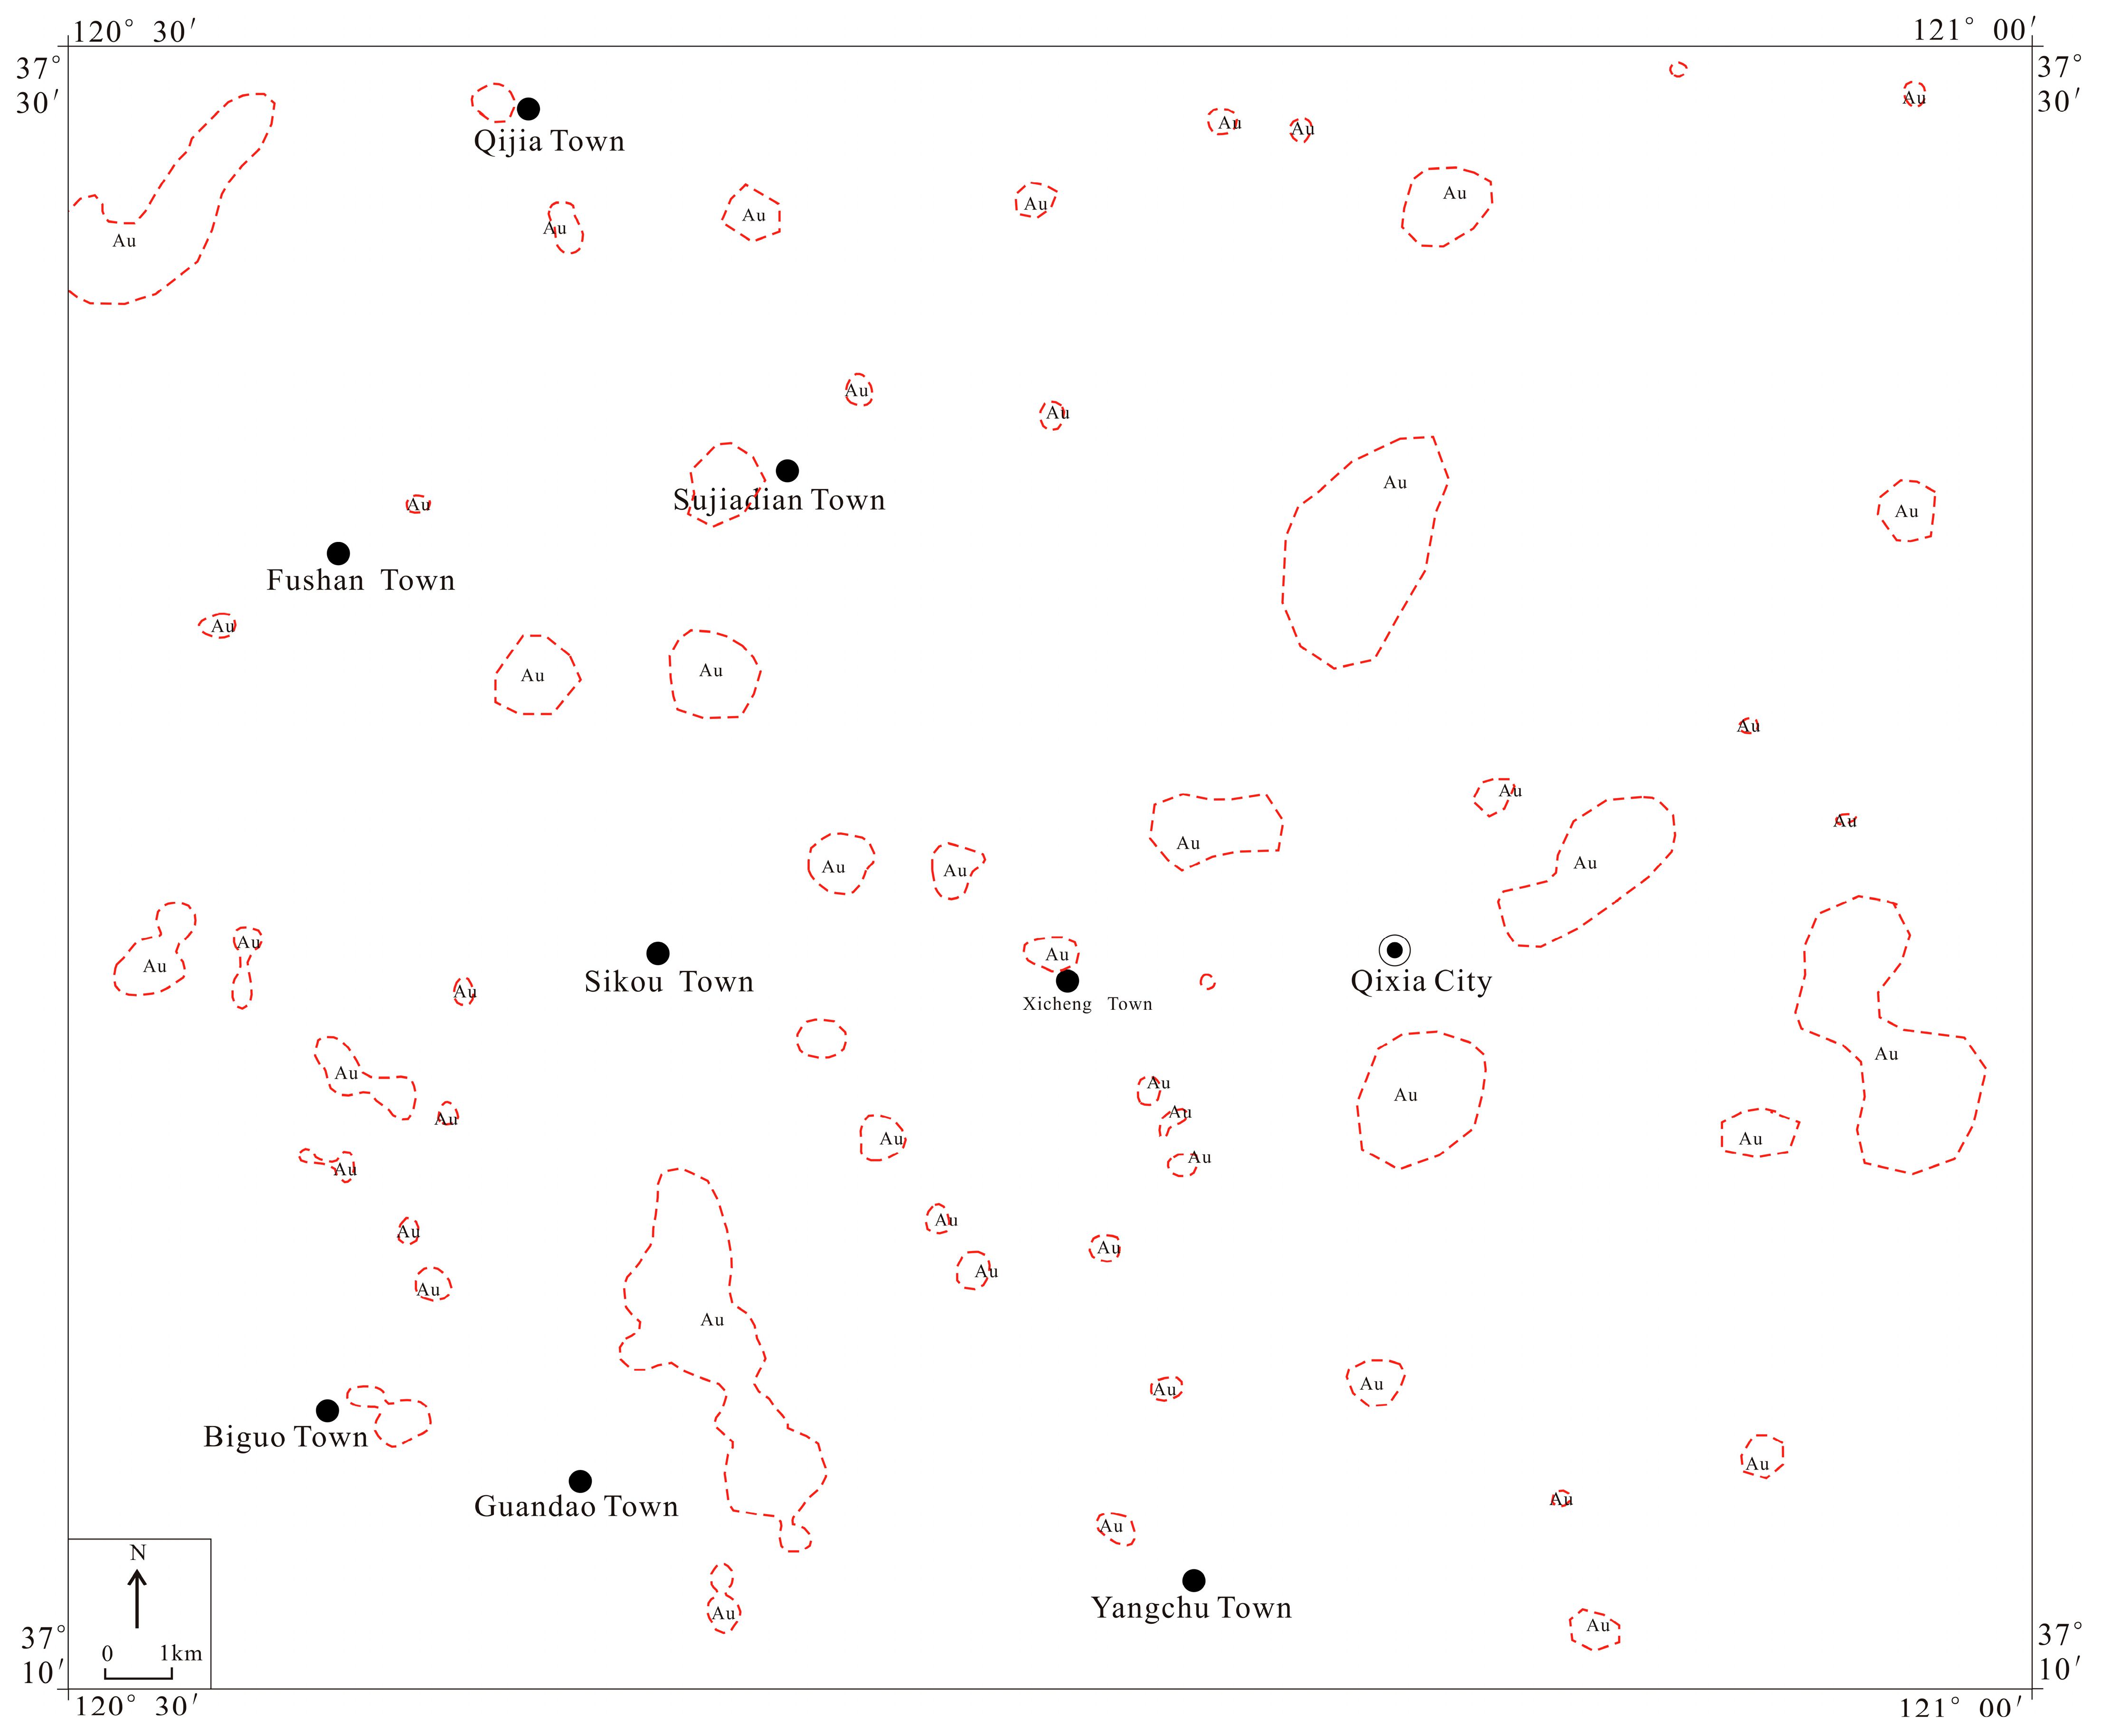
Distribution of geochemical anomaly of gold within drainage sediment: The overlay of mineral distribution and mineralization anomaly curve (
Figure 5) revealed a pronounced alignment, primarily extending in the southwest-northeast direction in the southwest region and the northwest-southeast direction in the central and northern sectors of the study area. Furthermore, most minerals find their location within mineralization anomaly zones. Accordingly, the focal point of metallogenic prediction should concentrate on the anomalous mineralization zones.
Analysis of mineral deposit (point) spatial distribution trend: Analysis of the spatial distribution trend of known gold deposits (points) within the area was performed utilizing the Fry analysis method, followed by the construction of a rose diagram using the generated Fry points to visually illustrate the distribution trend of these deposits. Consequently, Fry analysis highlighted 100 known gold deposits (points) within the area, resulting in the generation of 9900 Fry points via a process involving the distribution of 100 points (as depicted in
Figure 8a). With consideration for 100 gold deposits (points) and 9900 Fry points as original data, rose diagrams highlighting distribution trends on both local and global scales were formulated (
Figure 8b,c), with the former diagram providing insights into ore-controling structures at a local scale.
Based on the aforementioned findings, combined with the regional geological background and regional structural characteristics, it is evident that: (1) At a local scale, the distribution trend of known gold deposits (points) in the area exhibits a strong spatial correlation with the NE-trending, NW-trending, and EW-trending faults. This indicates that the spatial distribution of gold deposits (points) may be primarily controlled by these faults at the ore field scale, and the NE-trending faults may exert the strongest influence over gold deposits (points). The overall pattern of fault structures in the study area is dominated by the NE-trending and NW-trending faults, while NNE-trending and EW-trending faults intertwine with each other. Among them, two groups of structural fractures, i.e., NE-trending and NW-trending faults, are the dominant rock-controling and ore-guiding structures, exhibiting characteristics of large-scale and multi-stage evolution [
47]. This is further confirmed by the results obtained from this spatial analysis. (2) At the global scale, the known gold deposits (points) in the area show a strong spatial correlation with the NE-trending faults. This indicates that the spatial distribution of gold deposits (points) may be primarily influenced by the NW-trending regional faults in the metallogenic belt or at the regional scale. Based on the regional structural characteristics, it was observed that four tectonic movements with strong mineralization occurred in the study area since the Mesozoic. Moreover, the formation of gold deposits (points) or mineralization points was reported along the NW-trending fault zone [
48,
49,
50,
51], which can also be confirmed by the results based on this spatial analysis.
5. Convolutional Neural Network (CNN) Model
By studying and analyzing the geological characteristics and ore-controling factors of typical deposits in the study area, the following ore-controling factors for geological prospecting information in the study area were identified:
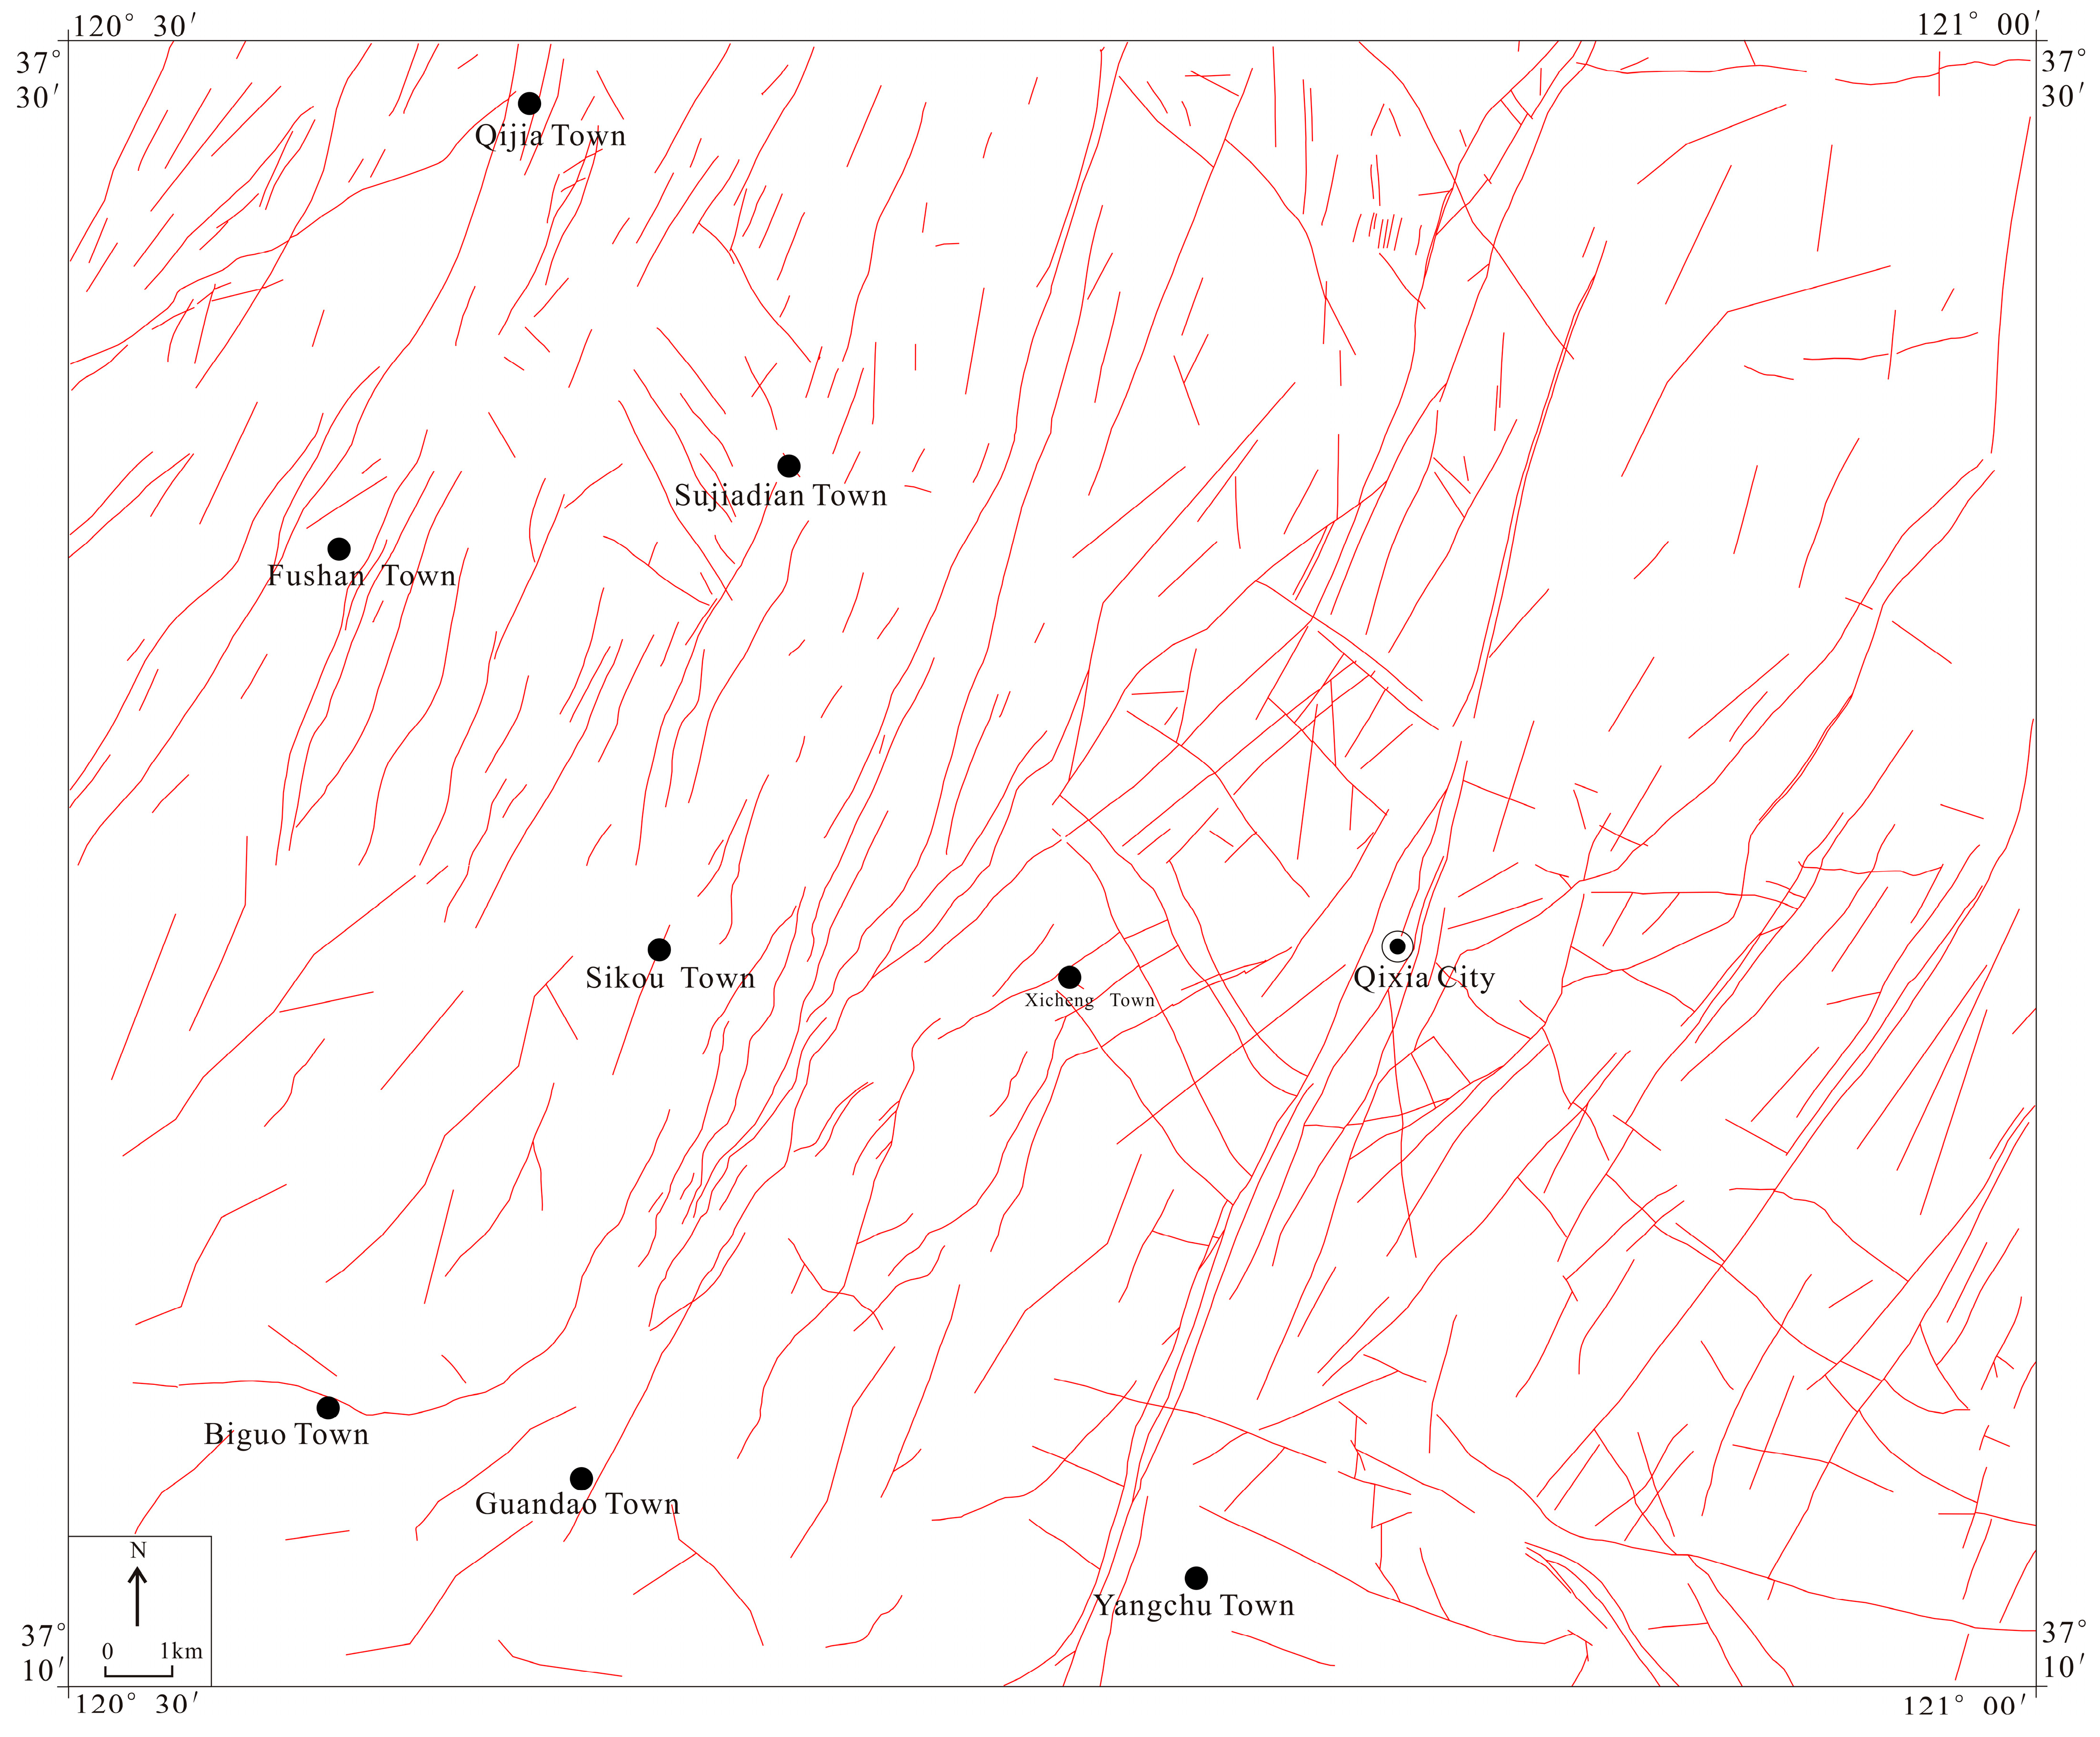
Ore-controling structure: The primary ore-controling structure is the NE-trending fault structure, followed by NW and EW fault structures. It is evident that the structure in the study area is ore-controlled, with the faults in the area playing the role of ore-guiding channels during the process of ore liquid migration. This is confirmed by the spatial distribution characteristics of ore deposits, major faults, and secondary faults in the area (
Figure 9).
Wall rock alteration: Silicification is closely associated with the formation of gold deposits. A silicified quartzite has formed from silica present in the hydrothermal solution under external action, and its metasomatism with plagioclase or potash feldspar has resulted in the development of residual body characteristics. Sericitization and pyritization are the most closely associated alteration characteristics with mineralization, and pyrite sericitization is the predominant wall rock alteration identified in the gold deposits in northwest Jiaodong. Carbonization results from the hydrothermal alteration of rocks accompanied by chloritization, which plays a crucial role in the fractured alteration zone (
Figure 10).
Distribution of geochemical anomalies of gold in drainage sediment: The anomaly curve of ore-forming elements reveals that the anomalous area contains almost all the discovered gold deposits in the study area (
Figure 11). This indicates that the application of combined anomalies of ore-forming elements is an effective approach to delineating the extent of mineralization in the study area.
In summary, this study established a dataset of predicted regional gold mineral resources with geochemical data as the core and structural control as the constraint. This includes information on 10 geochemical elements, ore-forming element Au, structural distance, and wall rock alteration (
Table 4). This provides valuable data support for the application of CNN in regional gold ore prediction.
The CNN model employed in this study includes two convolution layers, two pooling layers, and one connection layer. The convolution kernel size of each convolution layer is 3 × 3, with a moving step size of 1. The convolution kernel size of each pooling layer is 2 × 2, with a moving step of 2. Average pooling is used as the pooling method. During training, the ReLU activation function is used, and the initial learning rate is set to 0.002. The learning attenuation is 0.1, and the maximum number of iterations is 100, with 16 iterations per epoch. The model is implemented in the Python 3.8 framework.
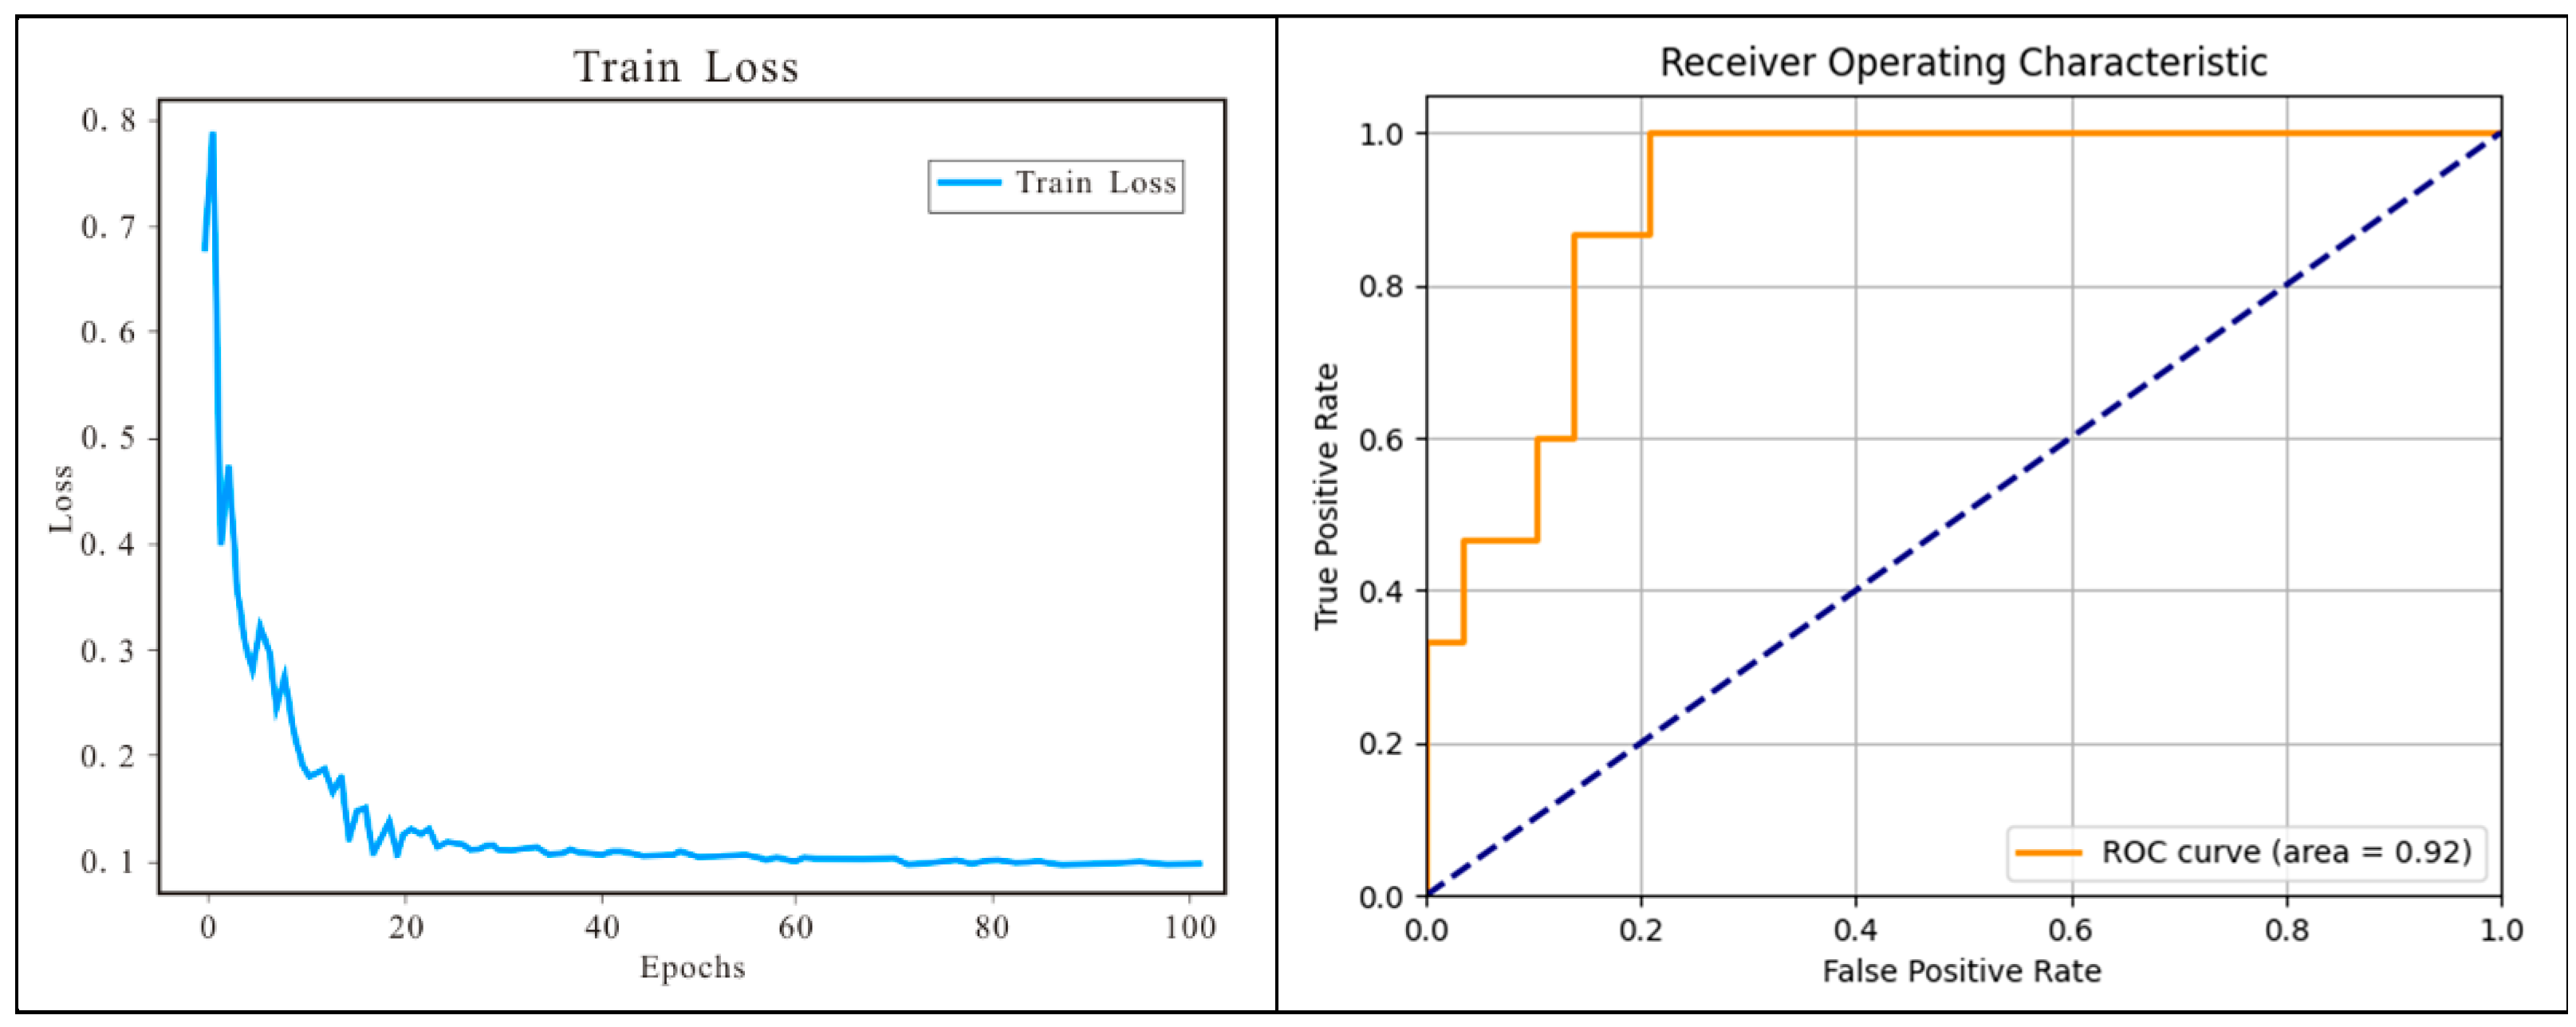
The model is trained with 70% normal data, and the test dataset consists of the remaining 30% normal samples and all abnormal samples. The loss function constructed is depicted in
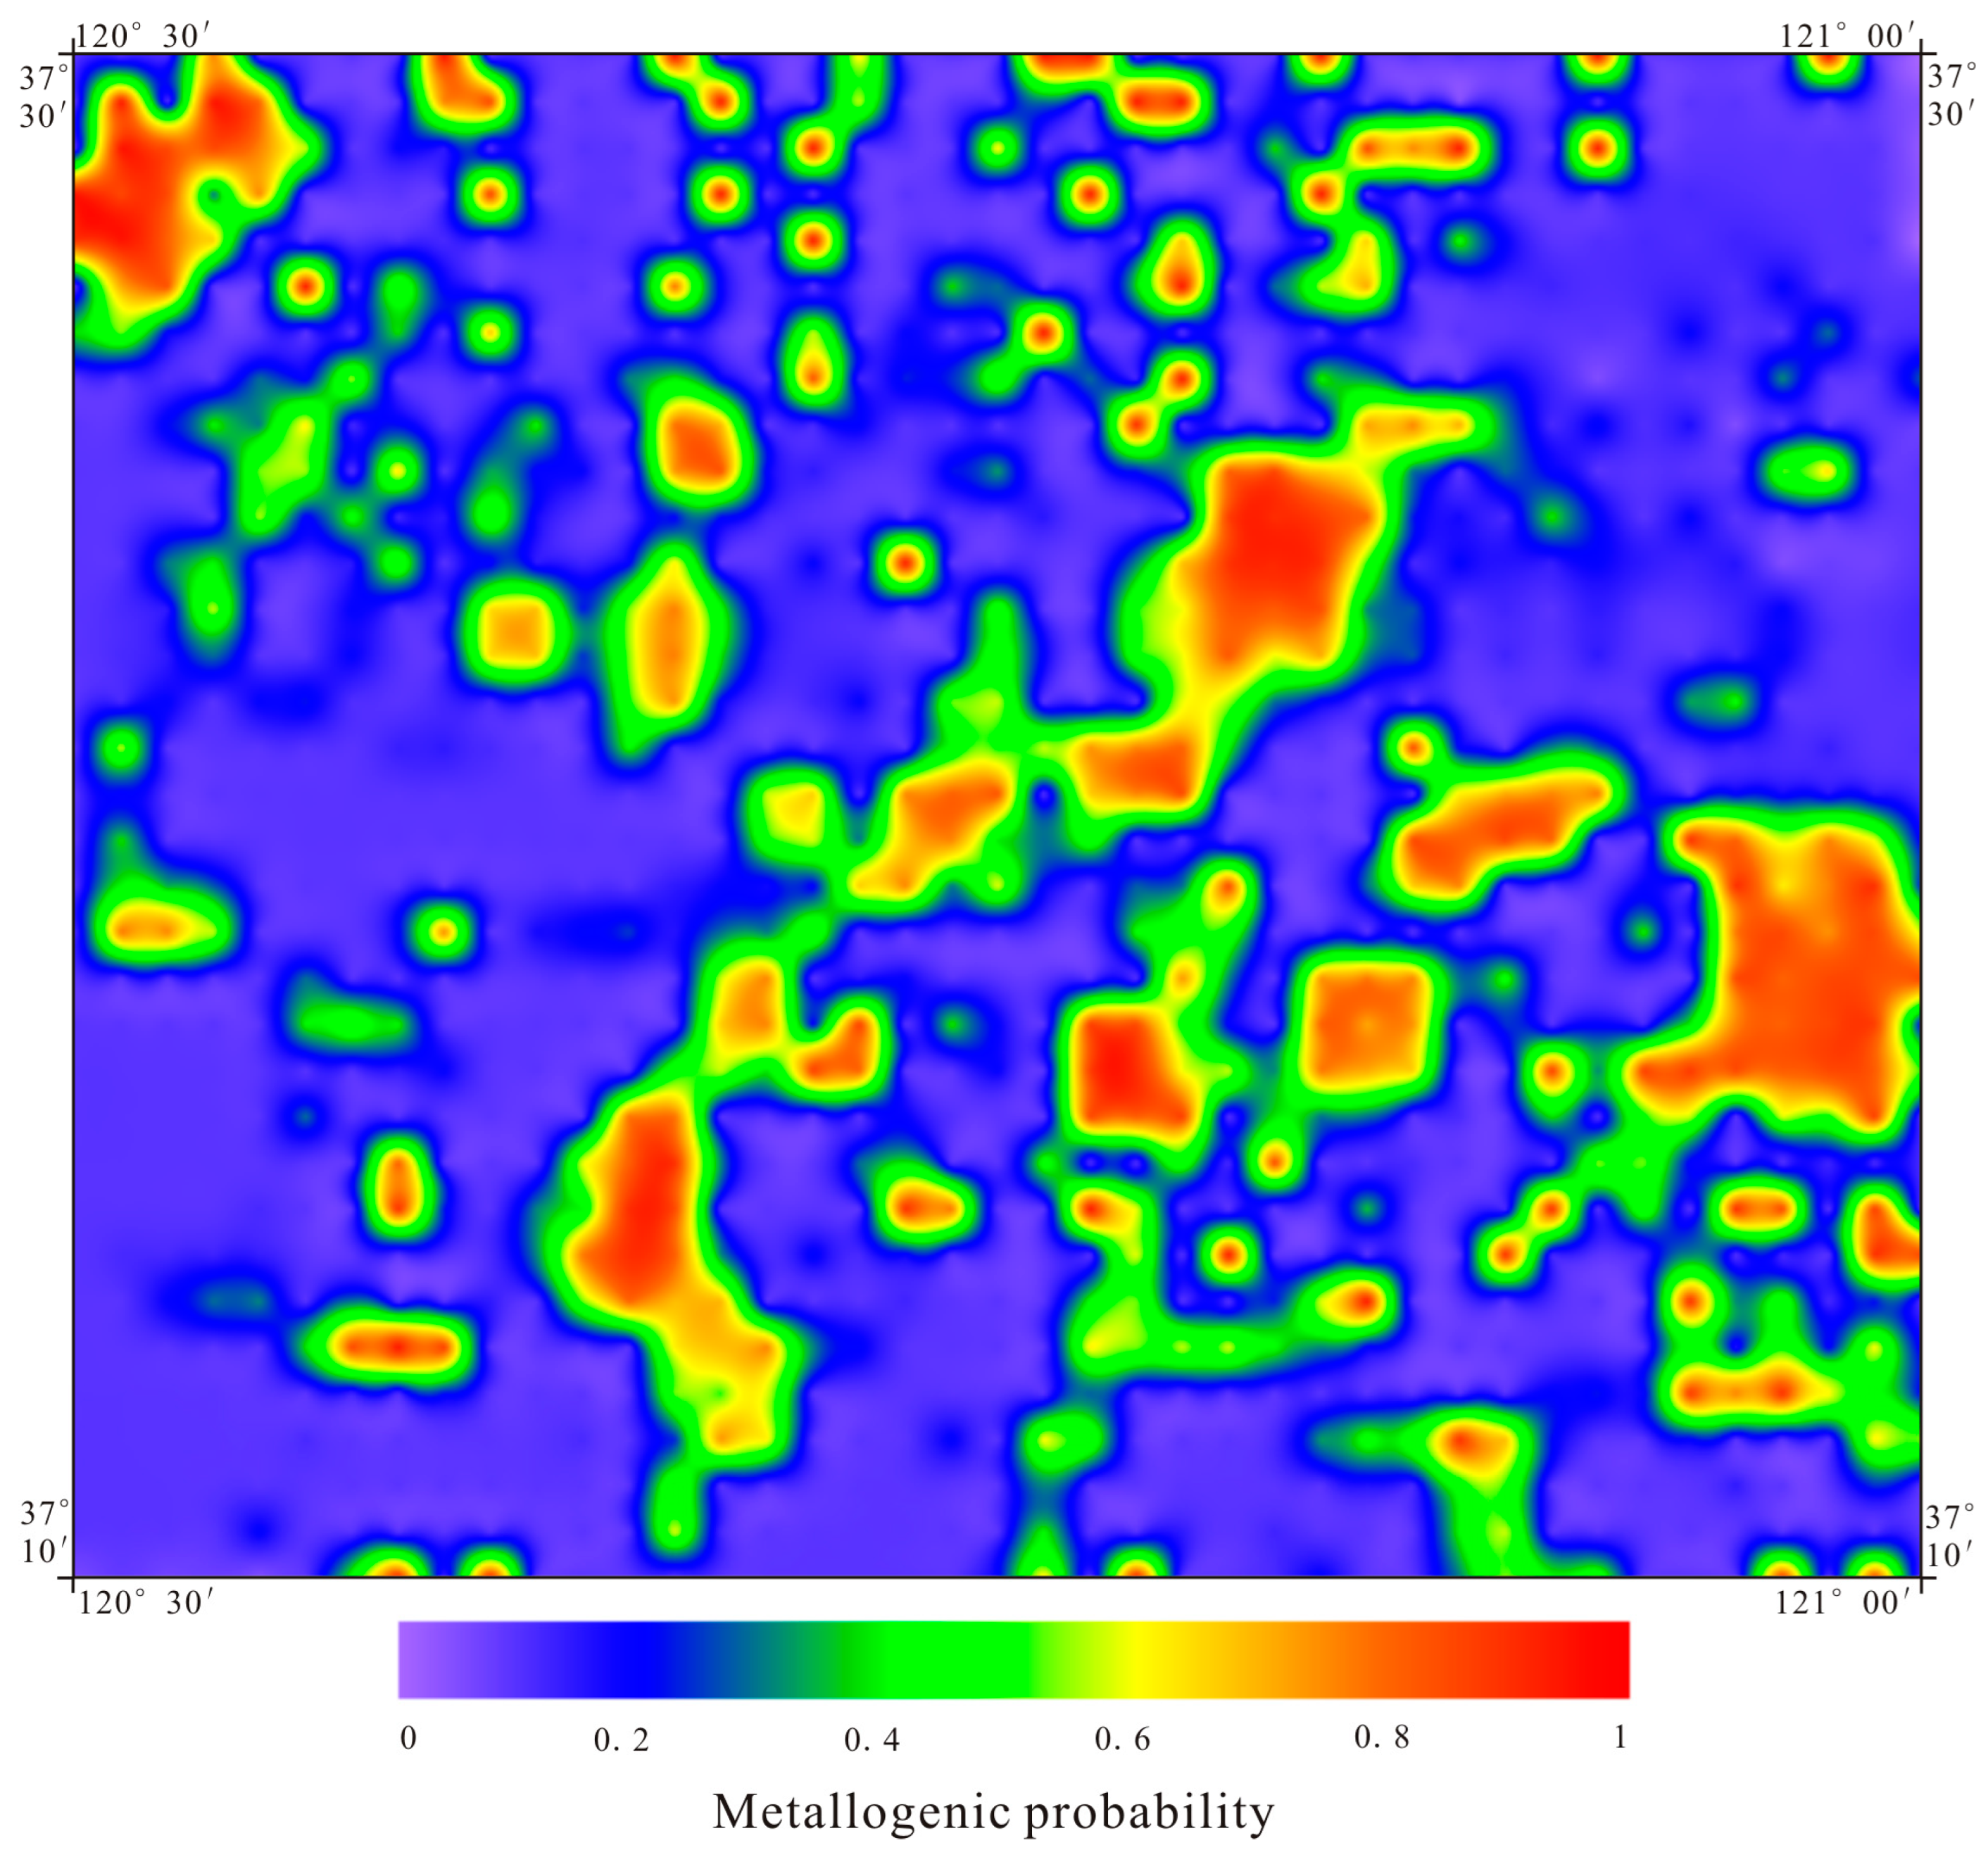
Figure 12. At a Mean Squared Error (MSE) of 0.01, the model is relatively convergent. However, MSE exhibits significant variations. The prediction results indicate that the prediction accuracy reaches 92%, the recall value is 90%, and the AUC value is 92%. This reveals that the quantitative prediction of mineral resources based on CNN has high accuracy and reliability. The model’s prediction score is interpolated by the Inverse Distance Weight (IDW) in ArcGIS 10.2 software, and the segmentation value for setting the color scale is determined using the cumulative frequency method. Finally, a mineral prediction distribution map is generated (
Figure 13).
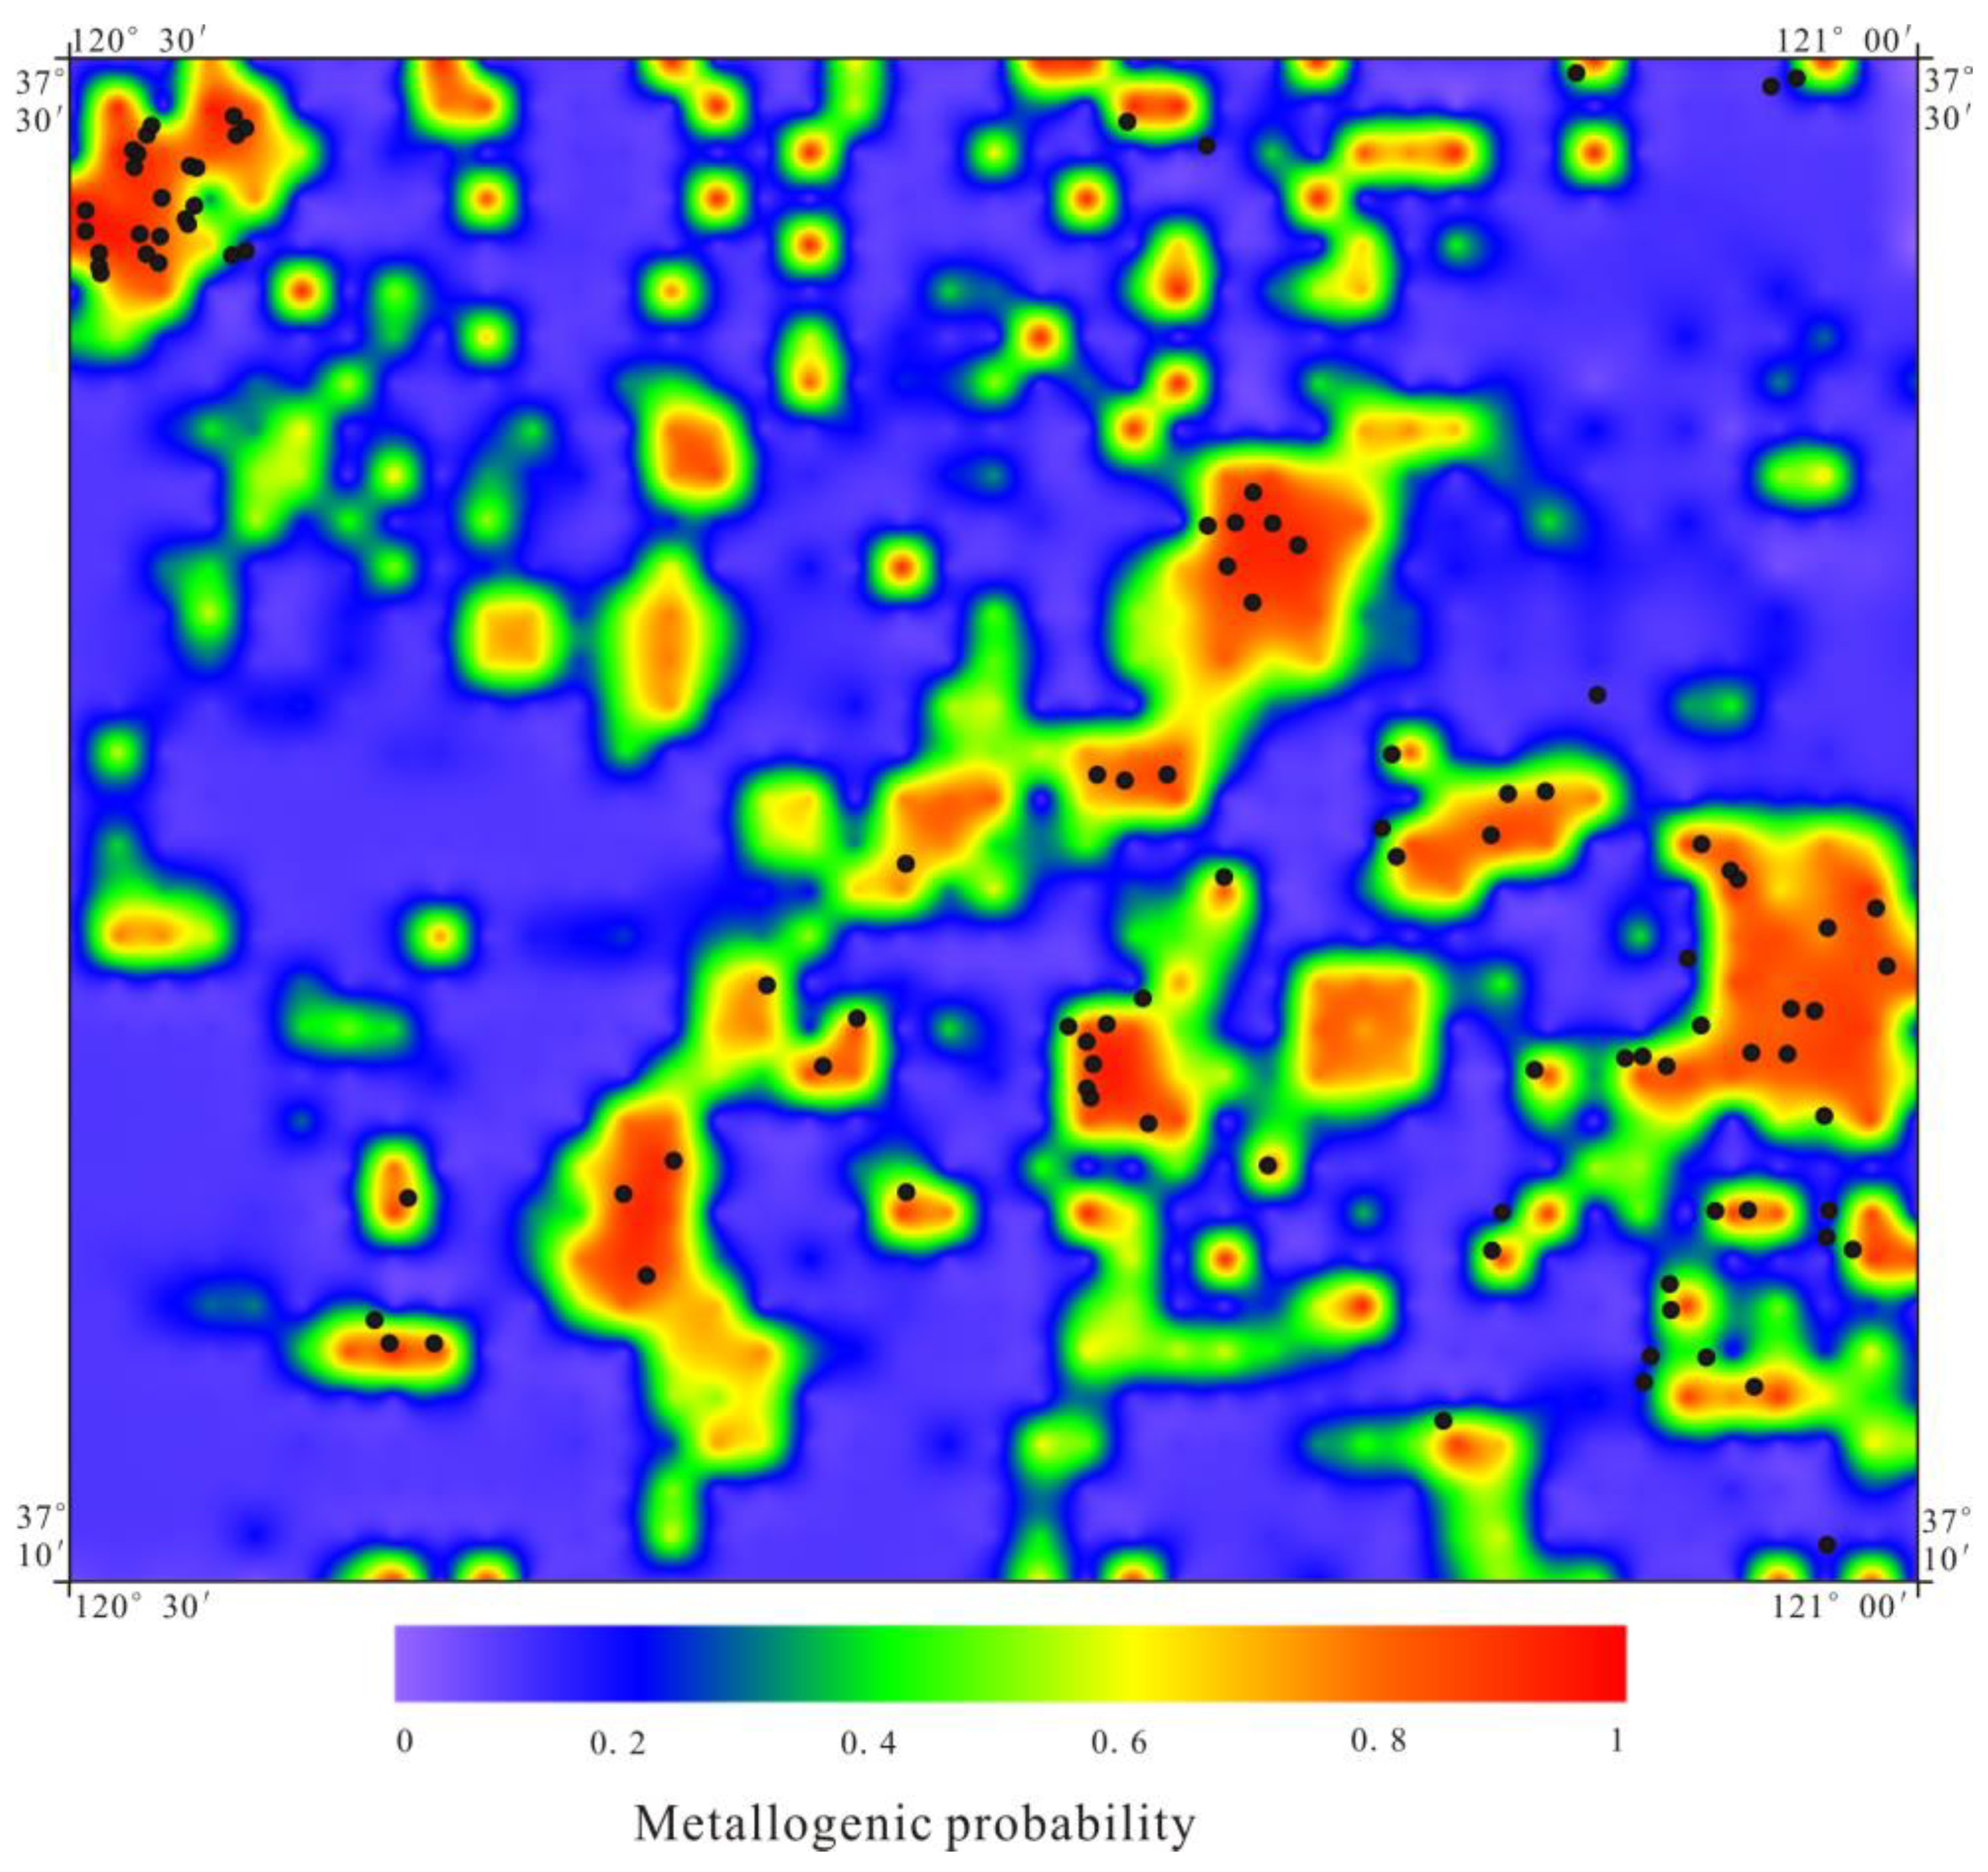
6. Result
6.1. Forecast Results
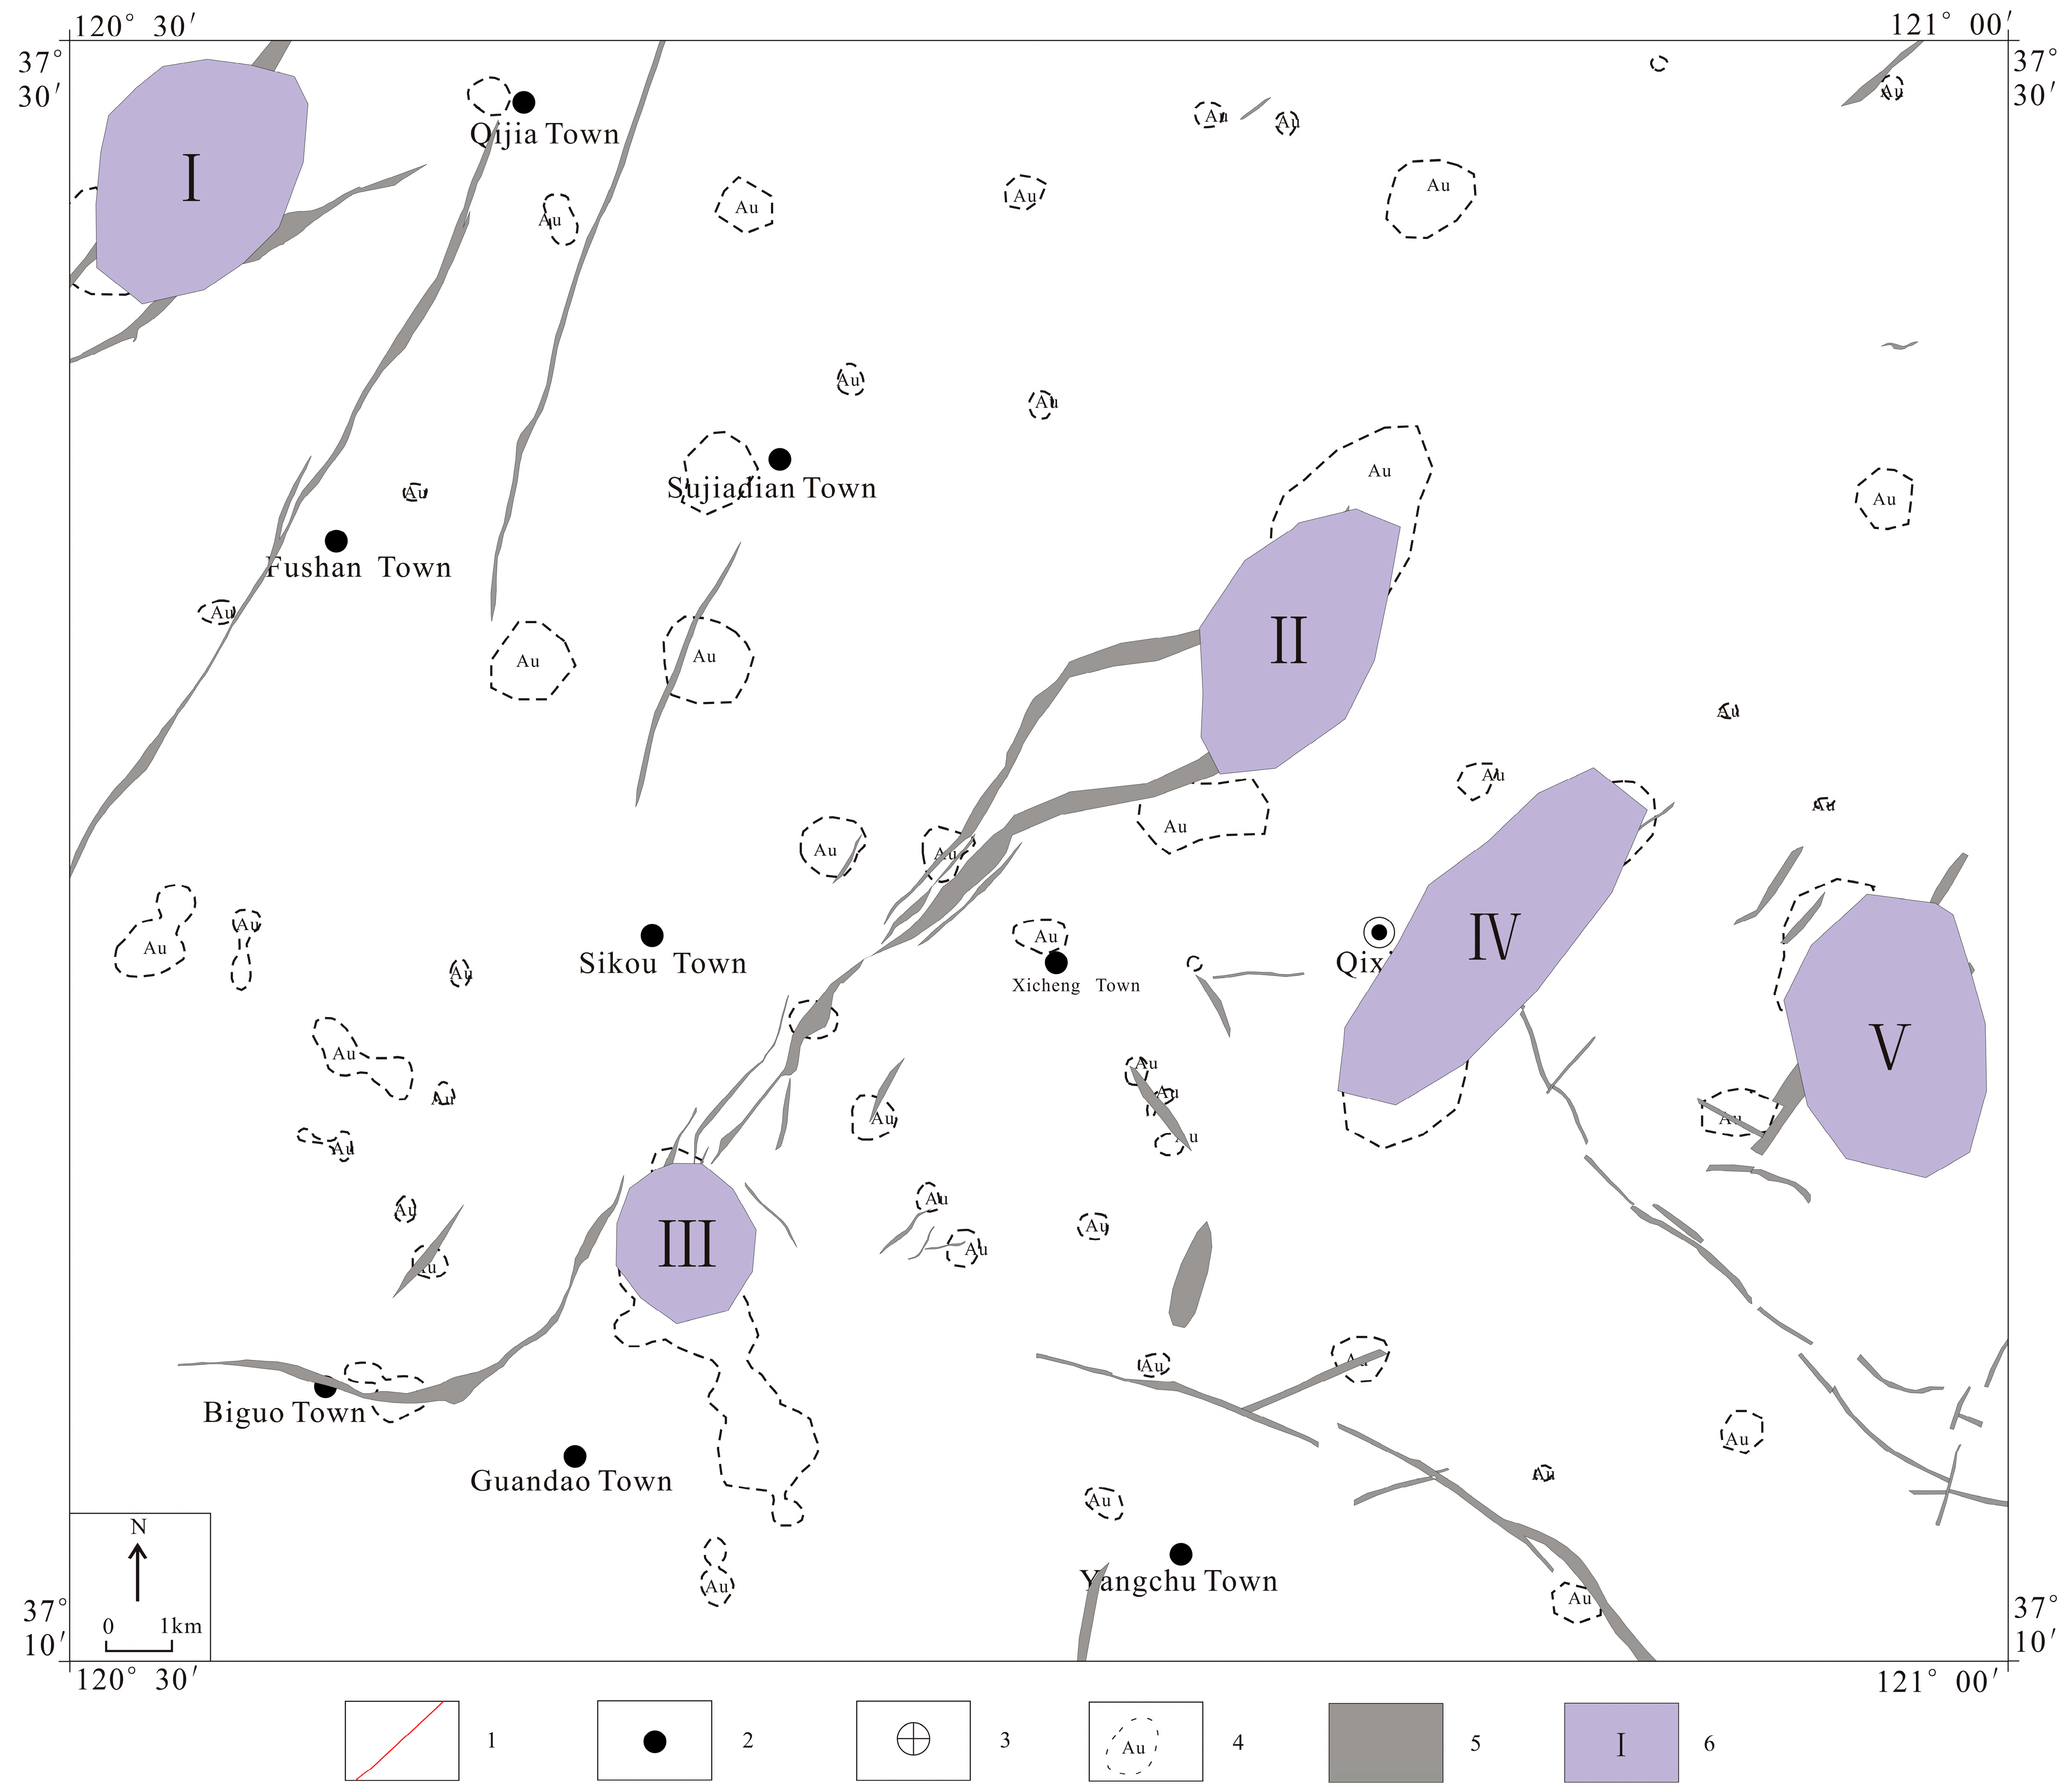
By calculating the fractal dimension of the fault structure, analyzing the distribution of fault complexity, examining mineral distribution, the distribution of geochemical anomalies of gold in drainage sediment, the relationship between the occurrence of ore bodies and fault structure, as well as by Fry analysis to analyze the distribution patterns of major minerals, the following five metallogenic prediction targets were delineated (
Figure 14).
I: The prospect zone of metallogenic prognosis is located about 5 km west of Qixia Town and is characterized by a NE-trending fault. Au mineralization anomalies are identified in the zone, and the target region is adjacent to globally renowned super-large gold deposits such as Linglong, Jiaojia, Xincheng, and Sanshandao, with D = 1.6600 to 1.9000.
II: The prospect zone of metallogenic prognosis is situated about 4 km northwest of Qixia City and is characterized by the NW-trending fault staggered by the NE-trending fault. The zone also exhibits Au mineralization anomalies, with D = 1.6000 to 1.8500.
III: The prospect zone of metallogenic prognosis is situated about 3 km south of Sikou town, with a NE-trending fault structure. The zone is also characterized by the Au mineralization anomalies, with D = 1.7200 to 1.8300.
IV: The prospect zone of metallogenic prognosis is situated about 0.5 km northeast of Qixia city, and characterized by the NW-trending fault staggered by the NE-trending fault. The zone also exhibits Au mineralization anomalies, with D = 1.6800 to 1.8600.
V: The prospect zone of metallogenic prognosis is situated approximately 8 km east of Qixia city, with a NE-trending fault structure. The zone is also characterized by the Au mineralization anomalies, with D = 1.7100 to 1.8500.
6.2. CNN Prediction Results
By combining the spatial distribution relationship between known deposits (points) and the results of metallogenic prognosis in the study area, five metallogenic prospect zones were delineated, which are explained below in combination with the geological and metallogenic laws:
I: The prospect zone is situated in the northwest corner of the study area, where several known ore occurrences are present. The prediction results of CNN indicated the distribution of abnormal shapes around faults and alteration zones, making it a significant prospect area for further exploration.
II: The prospect zone is situated in the middle of the study area. The prospect zone has a large region of high anomaly values for the Au element, and the anomaly is distributed in a belt along the NW-trending secondary fault. The Luofushan gold deposit serves as a typical example of a known deposit within the prospect zone, and there is further prospecting potential around this known deposit.
III: The prospect zone is situated in the northeast of the study area. The abnormal combination of ore-forming elements, the distribution of faults, and CAE prediction results together reveal a promising prospecting potential in the southeast direction of the known ore occurrence.
IV: The prospect zone is situated between II and III, where faults intersect with rock mass, and the abnormal combination of ore-forming elements is controlled by the distribution of faults and rock mass. The CAE prediction results were found to be abnormal with high values, indicating a promising prospecting potential.
V: The prospect zone is situated in the southwest corner of the study area, characterized by favorable rock bodies for mineralization, distribution of fault structures, and enriched combinations of ore-forming elements. The prediction results of CNN also revealed high ore-forming potential in this zone. Therefore, this zone can be considered a favorable prospect area for future exploration.
Using the convolutional neural network to form a gold mineralization potential map, gold occurrence points were plotted on the final map. In this way, the validation of the final map was examined. As a result, all points were located in high-potential areas, demonstrating the high reliability of this map (
Figure 15).
7. Conclusions
In this study, a quantitative prediction model of regional geology and geochemistry was established by constructing prospecting prediction factors. The quantitative prediction of mineral resources in the Qixia area of Shandong Province was performed using fractal theory analysis and CNN in deep learning.
The prediction results obtained by combining fractal analysis and CNN were highly consistent. The prospective areas introduced in the final integrated map can be targeted for Au exploration on a larger scale. Moreover, the results of this study will reduce the financial and time costs of future exploratory studies. To increase the accuracy of reconnaissance studies, it is suggested to increase the density of geochemical sampling, geological, and geophysical surveys in the high-potential areas.
Author Contributions
Conceptualization, S.F. and M.Q.; methodology, S.F.; software, Z.L.; validation, X.Y., T.L. and L.Z.; formal analysis, T.L.; investigation, S.F.; resources, L.S.; data curation, L.Z.; writing—original draft preparation, S.F.; writing—review and editing, M.Q.; visualization, L.S.; supervision, L.S.; project administration, L.S.; funding acquisition, L.S. All authors have read and agreed to the published version of the manuscript.
Funding
This study was financially supported by the Natural Science Foundation of Shandong Province, China (ZR2020KE023).
Data Availability Statement
Geochemical stream sediments and Geophysical Data are available on request from the China Geological Survey. (
https://www.cgs.gov.cn/ (accessed on 13 February 2023)).
Conflicts of Interest
We declare that we do not have any commercial or associative interest that represents a conflict of interest in connection with the work submitted.
References
- Qi, G.; Meng, G.X.; Yan, J.Y.; Tang, H.J.; Xue, R.H. Three-Dimensional Geological—Geophysical Modeling and Prospecting Indications of the Ashele Ore Concentration Area in Xinjiang Based on Irregular Sections. Minerals 2023, 13, 984. [Google Scholar] [CrossRef]
- Xi, Y.Z.; Li, Y.B.; Liu, J.J.; Wu, S.; Lu, N.; Liao, G.X.; Wang, Q.L. Application of Analytic Hierarchy Process in Mineral Prospecting Prediction Based on an Integrated Geology-Aerogeophysics-Geochemistry Model. Minerals 2023, 13, 978. [Google Scholar] [CrossRef]
- Ding, J.H.; Zhang, Y.; Ma, Y.B.; Wang, Y.; Zhang, J.B.; Zhang, T.T. Metallogenic characteristics and resource potential of antimony in China. J. Geochem. Explor. 2021, 230, 106834. [Google Scholar] [CrossRef]
- Fan, M.J.; Xiao, K.Y.; Li, S.; Xu, Y. Metallogenic prediction based on geological-model driven and data-driven multisource information fusion: A case study of gold deposits in Xiong’ershan area, Henan Province, China. Ore Geol. Rev. 2023, 156, 105390. [Google Scholar] [CrossRef]
- Hou, J.G.; Cui, B.; Li, G.J.; Hu, W.W.; Qin, Z.G. Material, energy and spatial fields for metallogenic prediction: Theory and practice an example: Limu Sn polymetallic crisis mines. Min. Sci. Technol. China 2021, 21, 107–116. [Google Scholar]
- Biswas, U.; Mukhopadhyay, M.; Mandal, N. Fractal analysis of anisotropic shear-fracture roughness from rocks and analogue laboratory models: A new approach for heterogeneous-slip characterization. Int. J. Rock Mech. Min. Sci. 2023, 169, 105432. [Google Scholar] [CrossRef]
- Shirazi, A.; Hezarkhani, A.; Beiranvand, P.A.A. Fusion of Lineament Factor (LF) Map Analysis and Multifractal Technique for Massive Sulfide Copper Exploration: The Sahlabad Area, East Iran. Minerals 2022, 12, 549. [Google Scholar] [CrossRef]
- Austin, J.R.; Blenkinsop, T.G. Local to regional scale structural controls on mineralization and the importance of a major lineament in the eastern Mount Isa Inlier. Australia: Review and analysis with autocorrelation and weights of evidence. Ore Geol. Rev. 2009, 35, 298–316. [Google Scholar] [CrossRef]
- Carranza, E.J.M. Controls on mineral deposit occurrence inferred from analysis of their spatial pattern and spatial association with geological. Ore Geol. Rev. 2009, 35, 383–400. [Google Scholar] [CrossRef]
- Fry, N. Random point distributions and strain measurement in rocks. Tectonophysics 1979, 60, 89–105. [Google Scholar] [CrossRef]
- Cheng, Q.M. Mapping singularities with stream sediment geochemical data for prediction of undiscovered mineral deposits in Gejiu, Yunnan Province, China. Ore Geol. Rev. 2007, 32, 314–324. [Google Scholar] [CrossRef]
- Peng, D.Q.; Li, J.; Chen, Y.H.; Jiang, W.G. A fractal dimension study on geological fracture system based on remote sensing data: A case study of Dexing Jiangxi. J. Nat. Disasters 2008, 17, 119–123. [Google Scholar]
- Zuo, R.G. Identifying geochemical anomalies associated with Cu and Pb–Zn skarn mineralization using principal component analysis and spectrum-area fractal modeling in the Gangdese Belt, Tibet (China). J. Geochem. Explor. 2011, 111, 13–22. [Google Scholar] [CrossRef]
- Barnett, C.T.; Williams, P.M.A. Radical Approach to Exploration: Let the Data Speak for Themselves. SEG Discov. 2012, 92, 1–17. [Google Scholar]
- Chen, G.X.; Huang, N.; Wu, G.P.; Luo, L.; Wang, D.T.; Cheng, Q.M. Mineral prospectivity mapping based on wavelet neural network and Monte Carlo simulations in the Nanling W-Sn metallogenic province. Ore Geol. Rev. 2022, 143, 104765. [Google Scholar] [CrossRef]
- Zuo, R. Geodata science-based mineral prospectivity mapping: A review. Nat. Resour. Res. 2020, 29, 3415–3424. [Google Scholar] [CrossRef]
- Maepa, F.; Smith, R.S.; Tessema, A. Support vector machine and artificial neural network modelling of orogenic gold prospectivity mapping in the Swayze greenstone belt, Ontario, Canada. Ore Geol. Rev. 2021, 130, 103968. [Google Scholar] [CrossRef]
- Sadeghi, B.; Khalajmasoumi, M.; Afzal, P.; Moarefvand, P.; Yasrebi, A.B.; Wetherelt, A.; Foster, P.; Ziazarifi, A. Using ETM+ and ASTER sensors to identify iron occurrences in the Esfordi 1:100,000 mapping sheet of Central Iran. J. Afr. Earth Sci. 2013, 85, 103–114. [Google Scholar] [CrossRef]
- Li, Y.S.; Peng, C.; Ran, X.J.; Xue, L.F.; Chai, S.L. Soil geochemical prospecting prediction method based on deep convolutional neural networks-Taking Daqiao Gold Deposit in Gansu Province, China as an example. China Geol. 2022, 5, 71–83. [Google Scholar]
- Shabankareh, M.; Hezarkhani, A. Application of support vector m achines for copper potential mapping in Kerman region, Iran. J. Afr. Earth Sci. 2017, 128, 116–126. [Google Scholar] [CrossRef]
- Zuo, R.G.; Carranza, E.J.M. Support vector machine: A tool for mapping mineral prospectivity. Comput. Geosci. 2011, 37, 1967–1975. [Google Scholar] [CrossRef]
- Rodgiguez, G.; Sanchez, C.; Chica, O.M.; Chica, R.M. Machine learning predictive models for mineral prospectivity: An evaluation of neural networks random forest regression trees and supportvector machines. Ore Geol. Rev. 2015, 71, 804–818. [Google Scholar]
- Carranza, E.J.M.; Laborte, A.G. Random forest predictive modeling of mineral prospectivity with small number of prospects and data with missing values in Abra (Philippines). Comput. Geosci. 2015, 74, 60–70. [Google Scholar] [CrossRef]
- Gao, Y.; Zhang, Z.J.; Xiong, Y.H.; Zuo, R.G. Mapping mineral prospectivity for Cu polymetallic mineralization in southwest Fujian Province China. Ore Geol. Rev. 2016, 75, 16–28. [Google Scholar] [CrossRef]
- Li, T.F.; Xia, Q.L.; Zhao, M.Y.; Gui, Z.; Leng, S. Prospectivity mapping for tungsten polymetallic mineral resources Nanling Metallogenic Belt South China: Use of Random Forest Algorithm from a Perspective of Data Imbalance. Nat. Resour. Res. 2019, 29, 203–227. [Google Scholar] [CrossRef]
- Rodriguer-galiano, V.F.; Chica, O.M.; Chica, R.M. Predictive modelling of gold potential with the integration of multisource information based on random forest: A case study on the Rodalquilar area, Southern Spain. Int. J. Geogr. Inf. Sci. 2014, 28, 1336–1354. [Google Scholar] [CrossRef]
- Zhang, S.; Xiao, K.Y.; Carranza, E.J.M.; Yang, F. Maximum entropy and random forest modeling of mineral potential: Analysis of gold prospectivity in the Hezuo—Meiwu district west Qinling Orogen, China. Nat. Resour. Res. 2019, 28, 645–664. [Google Scholar] [CrossRef]
- Liu, Y.; Zhou, K.F.; Zhang, N.N.; Wang, J.L. Maximum entropy modeling for orogenic gold prospectivity mapping in the Tangbale-Hatu belt, western Junggar China. Ore Geol. Rev. 2018, 100, 133–147. [Google Scholar] [CrossRef]
- Chen, Y.L.; Wu, W. Mapping mineral prospectivity using an extreme learning machine regression. Ore Geol. Rev. 2017, 80, 200–213. [Google Scholar] [CrossRef]
- Shabani, A.; Ziaii, M.; Monfared, M.S.; Shirazy, A.; Shirazi, A. Multi-Dimensional Data Fusion for Mineral Prospectivity Mapping (MPM) Using Fuzzy-AHP Decision-Making Method, Kodegan-Basiran Region, East Iran. Minerals 2022, 12, 1629. [Google Scholar] [CrossRef]
- Shirazi, A.; Hezarkhani, A.; Pour, A.B.; Shirazi, A.; Hashim, M. Neuro–Fuzzy–AHP (NFAHP) Technique for Copper Exploration Using Advanced Spaceborne Thermal Emission and Reflection Radiometer (ASTER) and Geological Datasets in the Sahlabad Mining Area, East Iran. Minerals 2022, 14, 5562. [Google Scholar] [CrossRef]
- Zhang, S.; Carranza, E.J.M.; Xiao, K.Y.; Wei, H.T.; Yang, F. Mineral prospectivity mapping based on isolation forest and random forest: Implication for the existence of spatial signature of mineralization in Outliers. Nat. Resour. Res. 2021, 31, 1981–1999. [Google Scholar] [CrossRef]
- Xie, X.J.; Ren, T.X.; Sun, H.Z. Geochemical Atlas of China; Geological Publishing House: Beijing, China, 2012; 135p. [Google Scholar]
- Cheng, Y.S. Fractal characteristics of fractures in Jiuwandashan area and their geological significance. Geol. China 2010, 27, 127–133. [Google Scholar]
- Ayunova, O.D.; Kalush, Y.A.; Loginov, V.M. Relationship of the seismic activity of the Tuvinian and adjacent Mongolian areas with the fractal dimensionality of a fault system. Russ. Geol. Geophys. 2007, 48, 593–597. [Google Scholar] [CrossRef]
- Ford, A.; Blenkinsop, T.G. Evaluating geological complexity and complexity gradients as controls on copper mineralisation, Mt. Isa Inlier. Aust. J. Earth Sci. 2008, 55, 13–23. [Google Scholar] [CrossRef]
- Kruhl, J.H. Fractal-geometry techniques in the quantification of complex rock structures: A special view on scaling regimes, inhomogeneity and anisotropy. J. Struct. Geol. 2013, 46, 2–21. [Google Scholar] [CrossRef]
- Mandelbrot, B.B. Multifractal measures, especially for the geophysicist. Pure Appl. Geophys. 1989, 131, 5–42. [Google Scholar] [CrossRef]
- Haddad-Martim, P.M.; Carranza, E.J.M.; de Souza Filho, C.R. The fractal nature of structural controls on ore formation: The case of the iron oxide copper-gold deposits in the Carajas mineral province, Brazilian Amazon. Econ. Geol. 2018, 113, 1499–1524. [Google Scholar] [CrossRef]
- Li, T.; Xia, Q.; Chang, L.; Chang, L.H.; Wang, X.Q.; Liu, Z.Z.; Wang, S.J. Deposit density of tungsten polymetallic deposits in the eastern Nanling metallogenic belt, China. Ore Geol. Rev. 2018, 94, 73–92. [Google Scholar] [CrossRef]
- Parsa, M.; Maghsoudi, A.; Yousefi, M. Spatial analyses of exploration evidence data to model skarn-type copper prospectivity in the Varzaghan district, NW Iran. Ore Geol. Rev. 2018, 92, 97–112. [Google Scholar] [CrossRef]
- Wang, Z.; Zuo, R.; Zhang, Z. Spatial analysis of Fe deposits in Fujian Province, China: Implications for mineral exploration. J. Earth Sci. 2015, 26, 813–820. [Google Scholar] [CrossRef]
- Terziyan, V.; Malyk, D.; Golovianko, M.; Branytskyi, V. Hyper-flexible Convolutional Neural Networks based on Generalized Lehmer and Power Means. Neural Netw. 2022, 155, 177–203. [Google Scholar] [CrossRef]
- Mahyar, Y.R.; Jon, M.A. Hronsky Translation of the function of hydrothermal mineralization-related focused fluid flux into a mappable exploration criterion for mineral exploration targeting. Appl. Geochem. 2023, 149, 105561. [Google Scholar]
- Li, F.; Liu, G.S.; Zhou, Q.W.; Zhao, G.B. Application of fractal theory in the study of the relationship between fracture and mineral. J. Hefei Univ. Technol. 2016, 39, 701–706. [Google Scholar]
- Sun, T.; Liao, Z.Z.; Wu, K.X.; Chen, L.K.; Liu, W.M.; Yi, C.Y. Fractal distribution characteristics and geological significances of fracture structure in Southern Jiangxi. J. Jiangxi Univ. Sci. Technol. 2017, 38, 48–54. [Google Scholar]
- Song, M.C.; Yi, P.H.; Xu, J.X.; Cui, S.X.; Shen, K.; Yuan, W.H.; Wang, H.J. A step metallogenetic model for gold deposits in the northwestern Shandong Peninsula, China. Sci. China Earth Sci. 2012, 55, 940–948. [Google Scholar] [CrossRef]
- Fan, H.R.; Hu, F.F.; Yang, J.H.; Shen, K.; Zhai, M.G. Fuid evolution and large-scale gold metallogeny during Mesozoic tectonic transition in the eastern Shandong province. Acta Petrol. Sin. 2005, 21, 1317–1328. [Google Scholar]
- Hou, M.L.; Jiang, Y.H.; Jiang, S.Y.; Ling, H.F.; Zhao, K.D. Contrasting origins of late Mesozoic adakitic granitoids from the northwestern Jiaodong Peninsula, east China: Implications for crustal thickening to delamination. Geol. Mag. 2007, 144, 619–631. [Google Scholar] [CrossRef]
- Li, Y.F.; Li, H.K.; Chen, G.D.; Geng, K.; Cao, L.L.; Liang, T.T. On the Compression-extensional Tectonic Environment and Gold Mineralization in the Jiaodong Area, Shandong Province. Geotecton. Metallog. 2019, 46, 1117–1132. [Google Scholar]
- Mao, J.W. Mantle fluids involved in metallogenesis of Jiaodong (East Shandong) gold district:evidence of C, O and H isotopes. Miner. Depos. 2002, 21, 121–128. [Google Scholar]
Figure 1.
Regional geological map of the Jiaodong Peninsula, Shandong Province. 1. Neoarchean rock group; 2. Cretaceous sedimentary rocks and volcanic rocks; 3. Paleoproterozoic rock group; 4. Late Triassic adamellite; 5. Early Cretaceous guojialing granodiorite; 6. Early Cretaceous pegmatite and adamellite; 7. Quaternary; 8. Late Jurassic Linglong adamellite; 9. Sulu ultrahigh-pressure metamorphic rock series; 10. Fault.
Figure 2.
Regional geological map of the research area. 1. The quaternary system; 2. Jurassic rock mass; 3. Triassic rock mass; 4. Devonian rock mass; 5. Permian rock mass; 6. Cretaceous rock mass; 7. Archean rock mass; 8. Fault; 9. City; 10. Gold deposit; 11. Alteration zone.
Figure 2.
Regional geological map of the research area. 1. The quaternary system; 2. Jurassic rock mass; 3. Triassic rock mass; 4. Devonian rock mass; 5. Permian rock mass; 6. Cretaceous rock mass; 7. Archean rock mass; 8. Fault; 9. City; 10. Gold deposit; 11. Alteration zone.
Figure 3.
Flowchart of the methodology used in the present study.
Figure 3.
Flowchart of the methodology used in the present study.
Figure 4.
The complete structure of CNN.
Figure 4.
The complete structure of CNN.
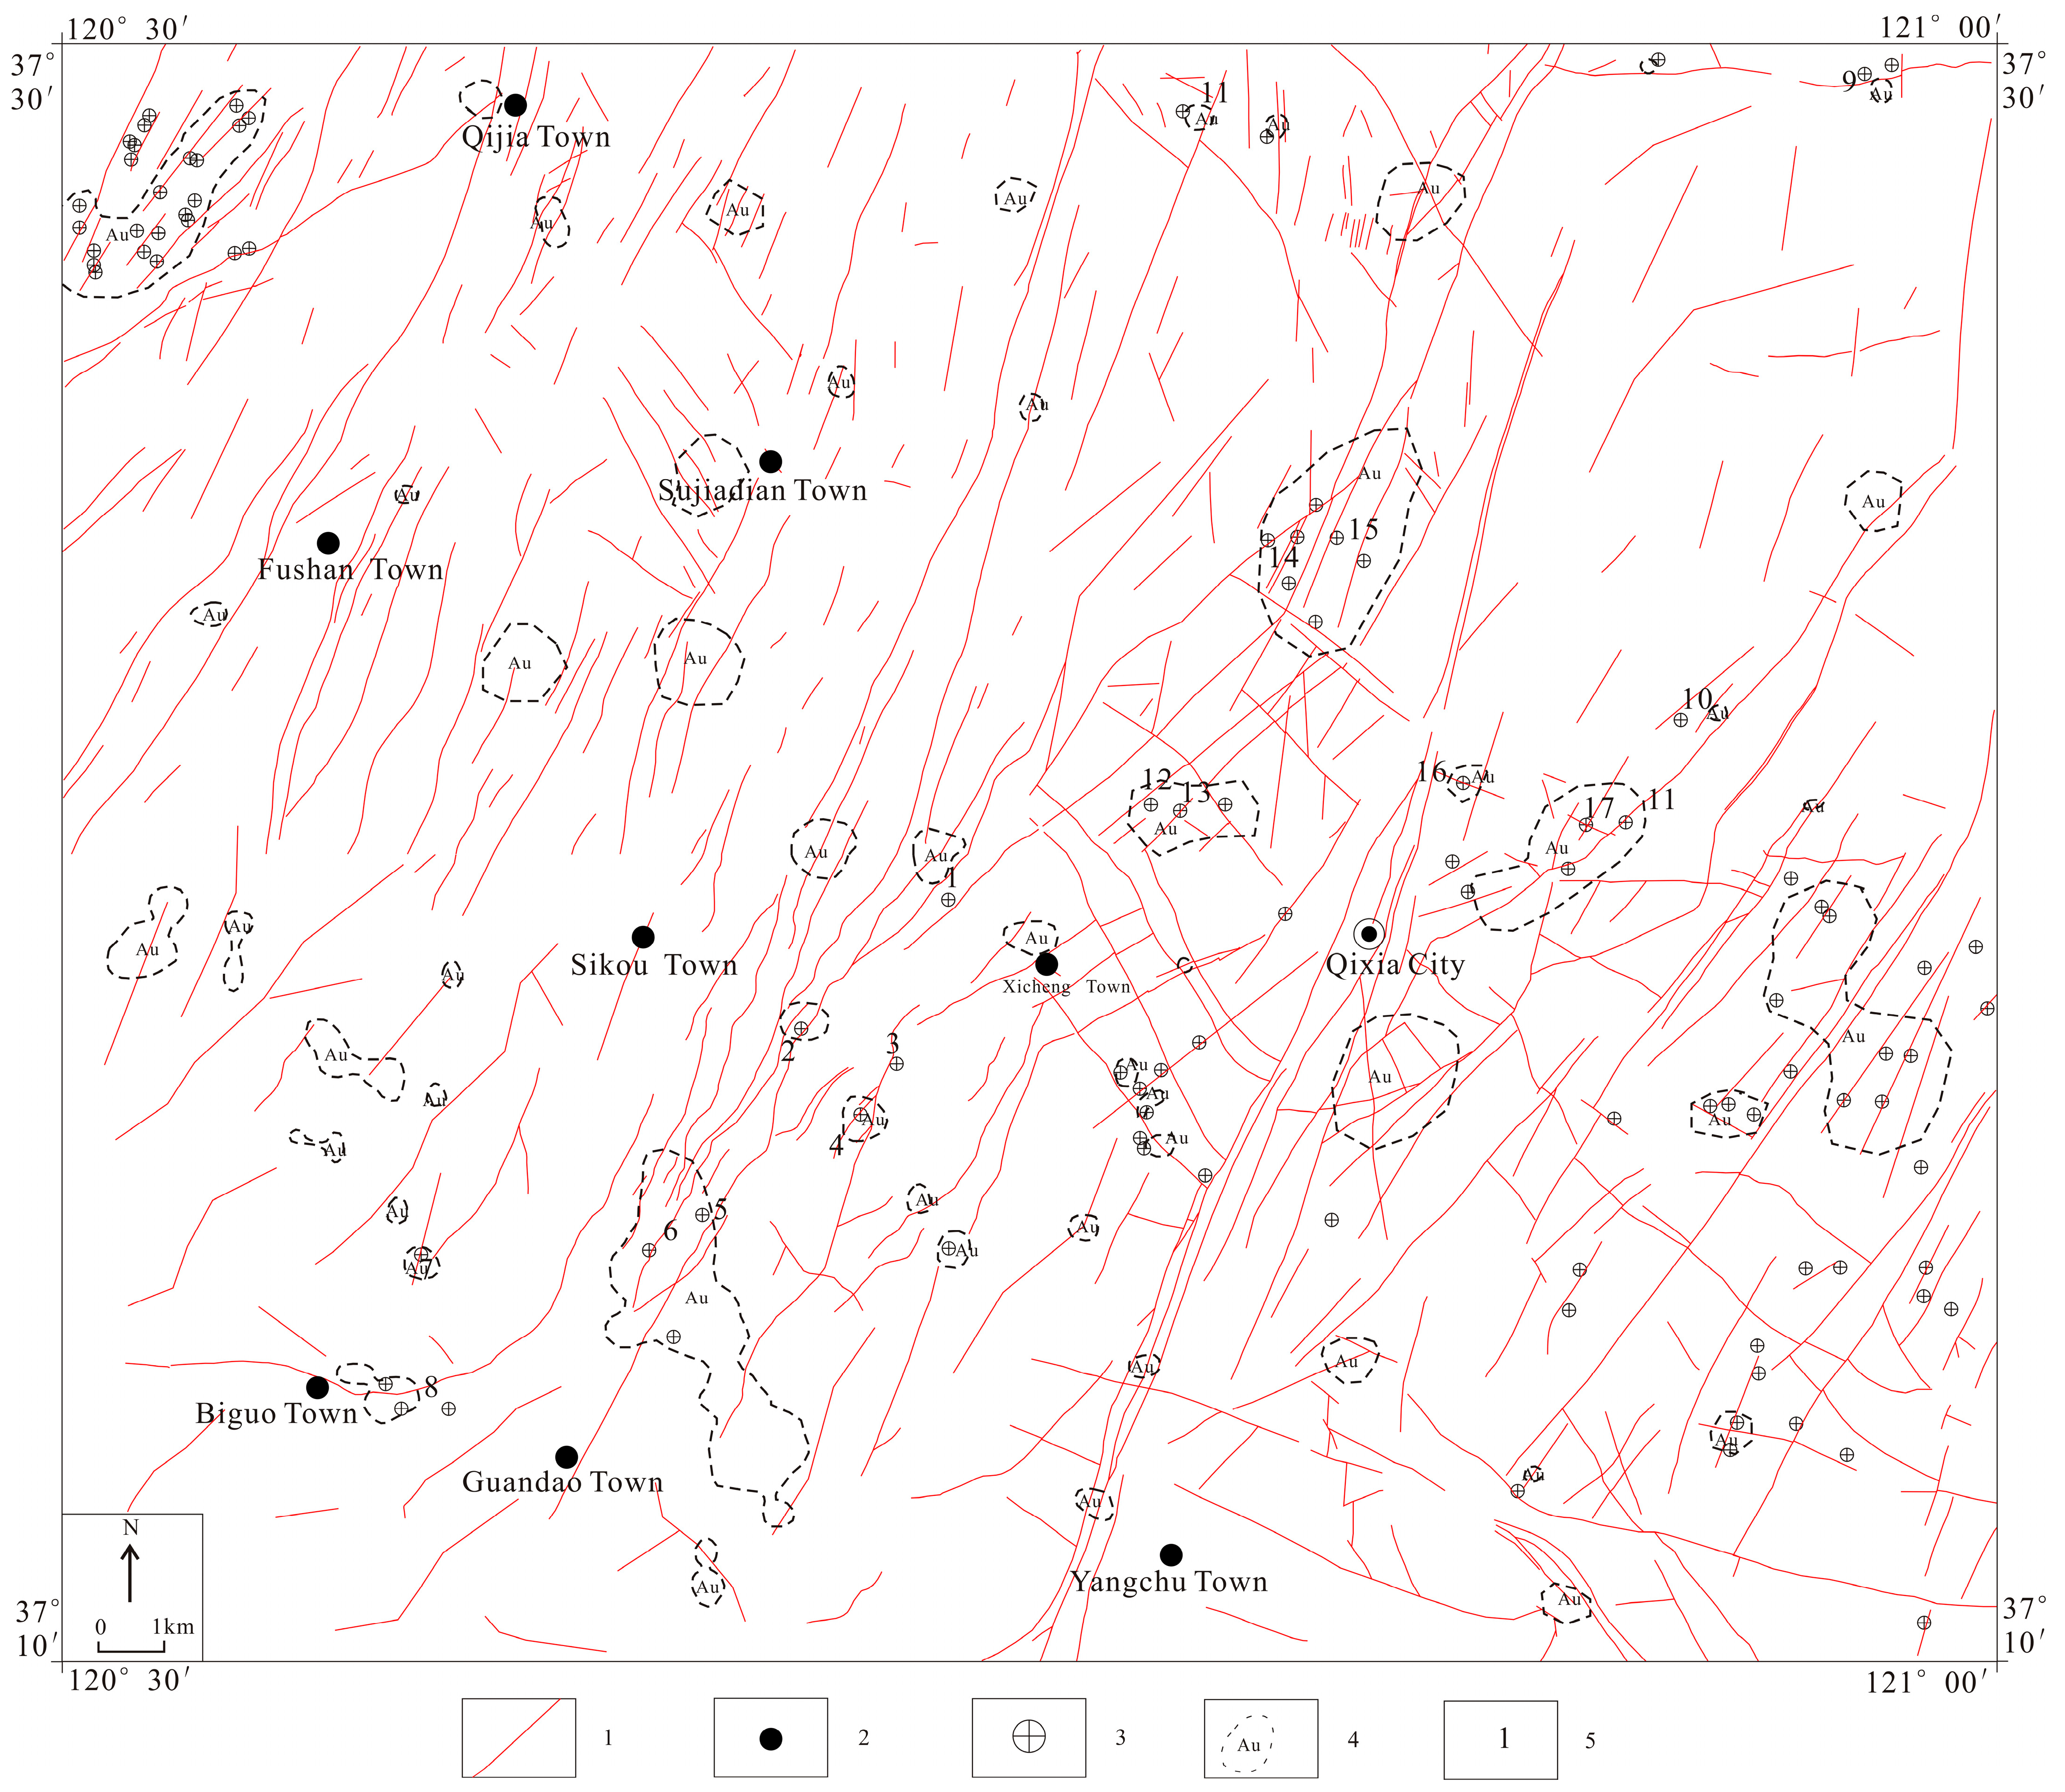
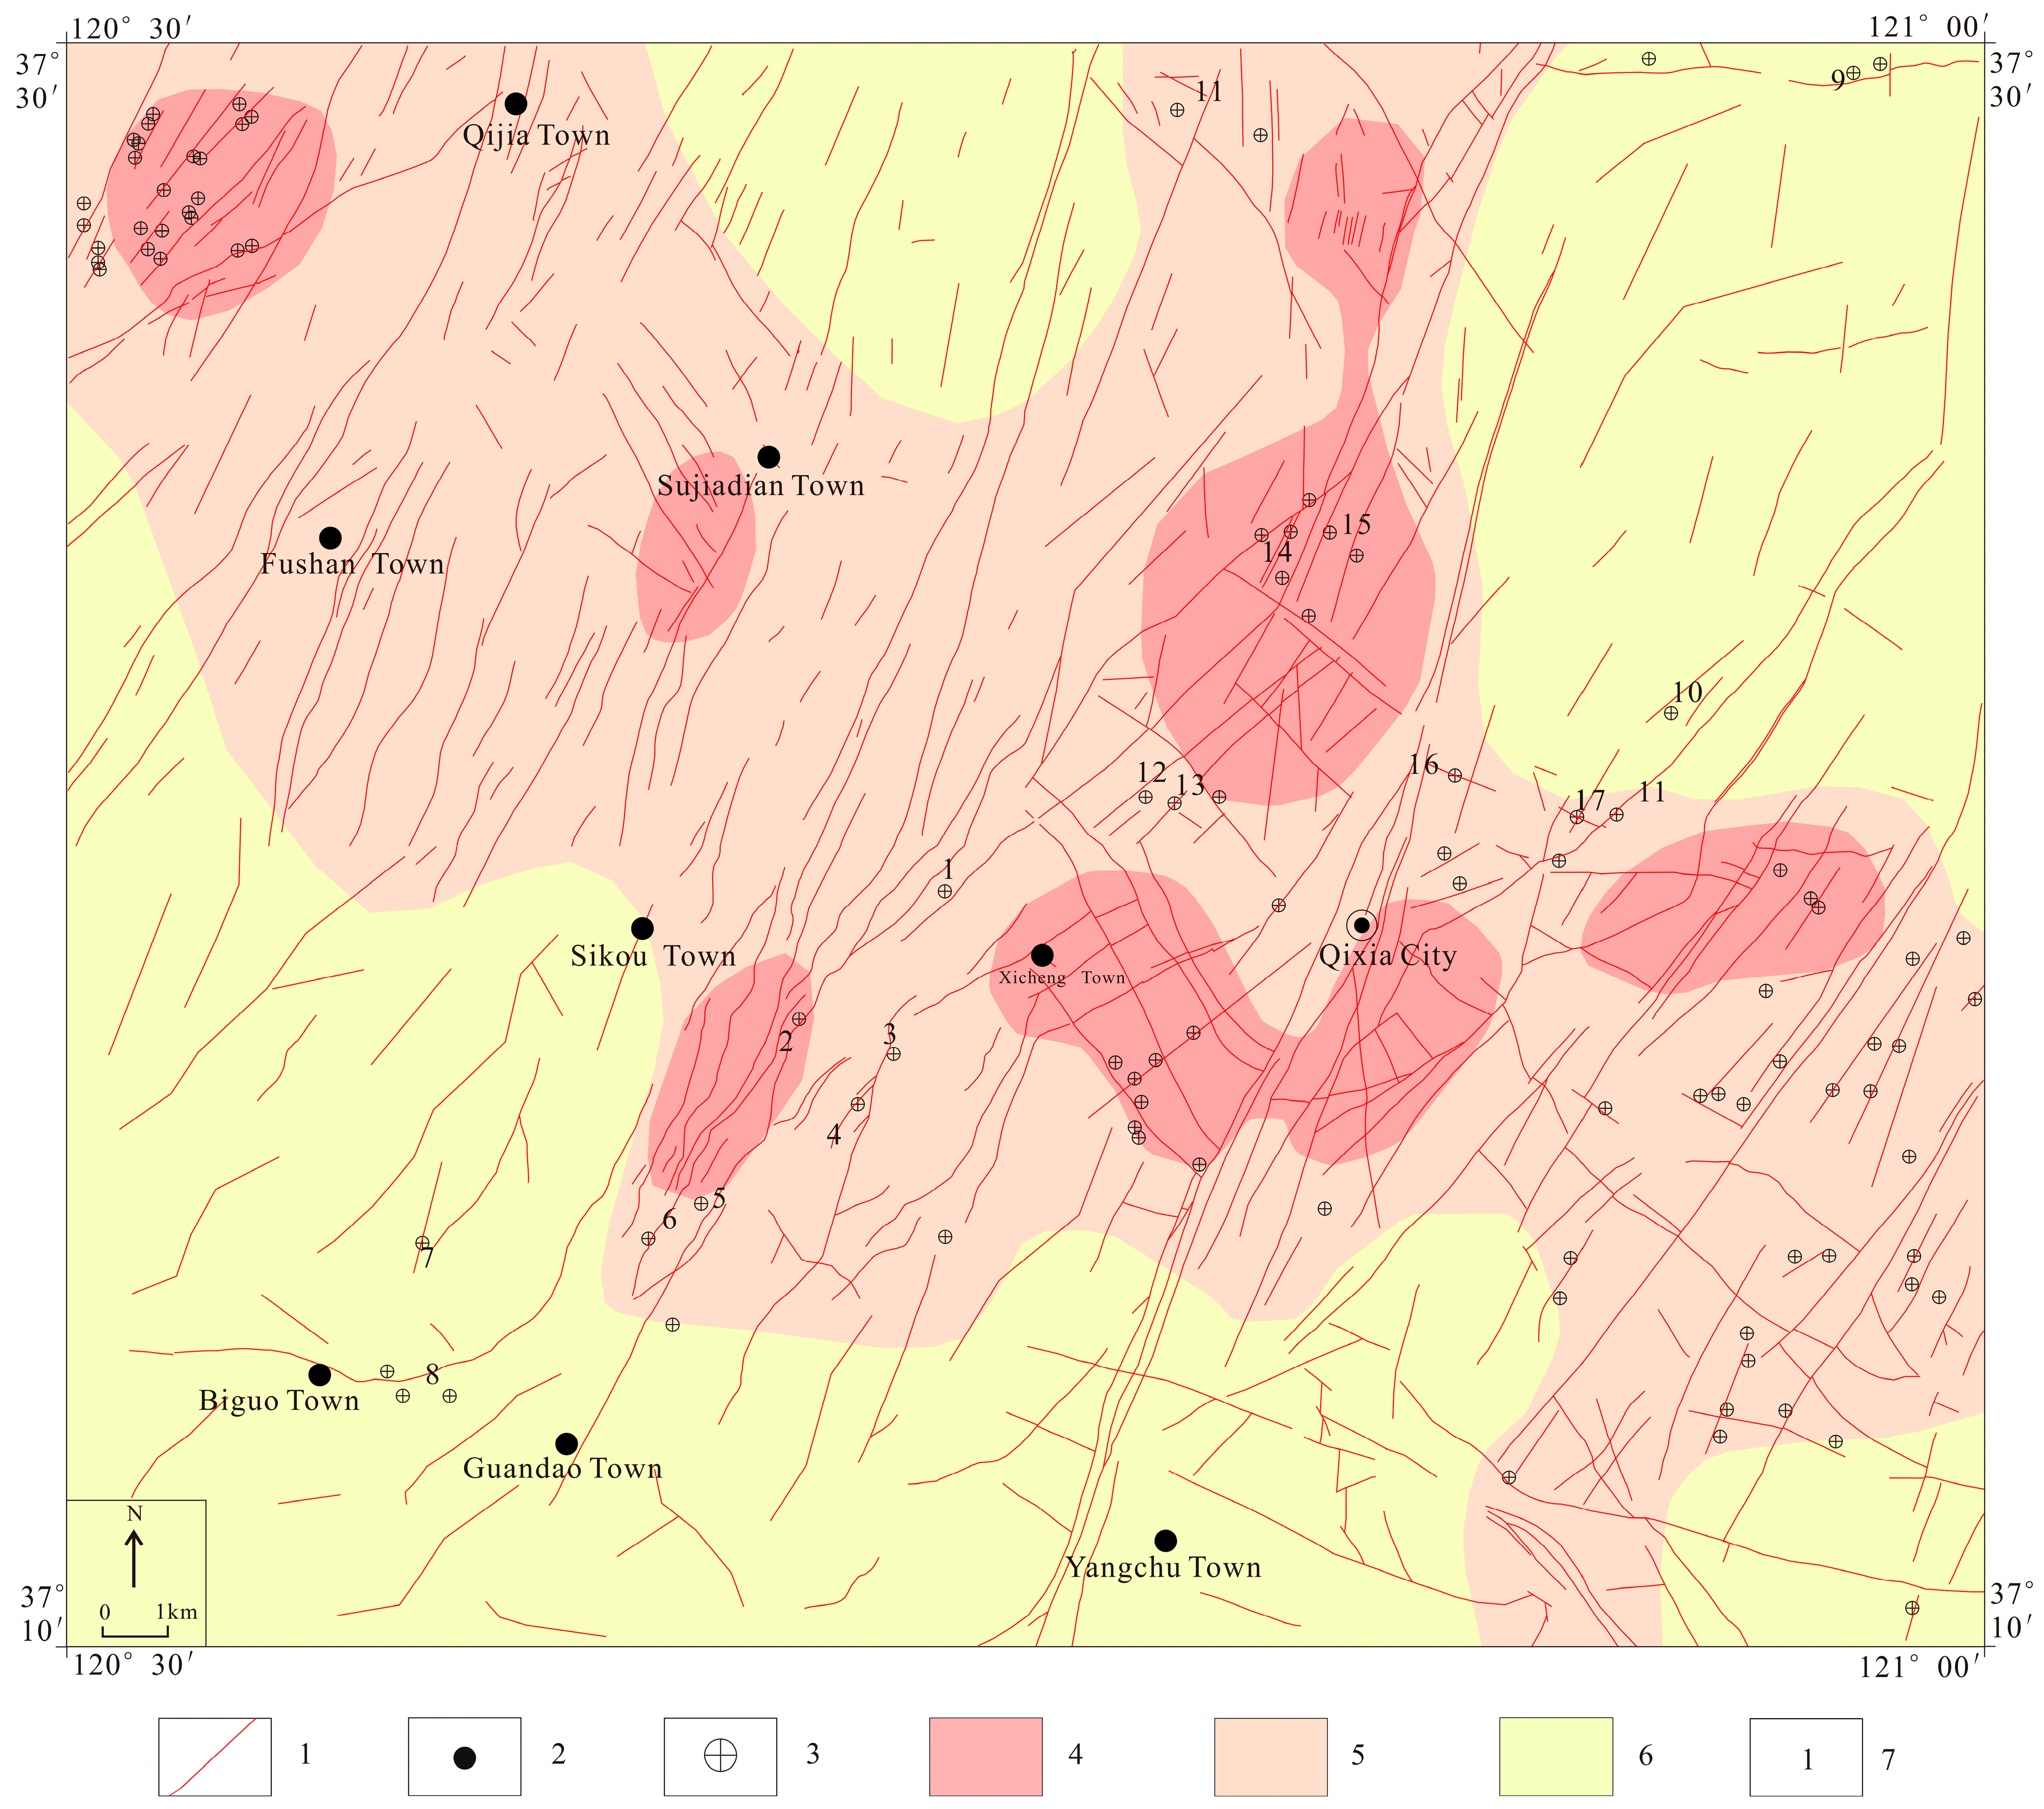
Figure 5.
Tectonic mineral map of the Qixia area. 1. Fault, 2. City, 3. Gold deposit, 4. Abnormal area of gold mineralization, 5. Fault number.
Figure 5.
Tectonic mineral map of the Qixia area. 1. Fault, 2. City, 3. Gold deposit, 4. Abnormal area of gold mineralization, 5. Fault number.
Figure 6.
Fractal-dimensional scatter plot highlighting the fault structure in the Qixia area.
Figure 6.
Fractal-dimensional scatter plot highlighting the fault structure in the Qixia area.
Figure 7.
Fractal contour and mineral distribution map of the research area. 1. Fault; 2. City; 3. Gold deposit; 4. Tectonic complex area; 5. Tectonic medium area; 6. Tectonic simple area, 7. Fault number.
Figure 7.
Fractal contour and mineral distribution map of the research area. 1. Fault; 2. City; 3. Gold deposit; 4. Tectonic complex area; 5. Tectonic medium area; 6. Tectonic simple area, 7. Fault number.
Figure 8.
Fry analysis of gold deposits in the study area: (a) Fry dot diagram; (b) Dominant orientation of local-scale deposit distribution; (c) Dominant orientation of global scale deposit distribution.
Figure 8.
Fry analysis of gold deposits in the study area: (a) Fry dot diagram; (b) Dominant orientation of local-scale deposit distribution; (c) Dominant orientation of global scale deposit distribution.
Figure 9.
Ore-controling factor (Fault).
Figure 9.
Ore-controling factor (Fault).
Figure 10.
Ore-controling factor (Alteration zone).
Figure 10.
Ore-controling factor (Alteration zone).
Figure 11.
Ore-controling factor (Geochemical anomaly curve).
Figure 11.
Ore-controling factor (Geochemical anomaly curve).
Figure 12.
Losses at each iteration and ROC curve of the model.
Figure 12.
Losses at each iteration and ROC curve of the model.
Figure 13.
Prediction prospect diagram of the CNN model.
Figure 13.
Prediction prospect diagram of the CNN model.
Figure 14.
Predicted ore-forming target areas in Qixia, Shandong. 1. Fault; 2. City; 3. Gold deposit; 4. Abnormal area of gold mineralization; 5. Alteration zone; 6. Predicted target area.
Figure 14.
Predicted ore-forming target areas in Qixia, Shandong. 1. Fault; 2. City; 3. Gold deposit; 4. Abnormal area of gold mineralization; 5. Alteration zone; 6. Predicted target area.
Figure 15.
Gold deposit verification map.
Figure 15.
Gold deposit verification map.
Table 1.
Geochemical characteristics of the research area.
Table 1.
Geochemical characteristics of the research area.
| Element | Min. | Max. | Median | Avg. | Standard Deviation | Variable Coefficient | Average of China [33] |
|---|
| Au | 0.19 | 1241 | 1.05 | 10.41 | 47.57 | 4.57 | 1.96 |
| Ag | 6 | 4000 | 33 | 116.59 | 270.62 | 2.32 | 0.08 |
| Cu | 0.01 | 1500 | 6.6 | 50.62 | 75.45 | 1.49 | 23.6 |
| Zn | 4.2 | 600 | 34 | 78.09 | 64.08 | 0.82 | 72 |
| Mo | 0.2 | 28.1 | 0.6 | 0.64 | 0.79 | 1.24 | 1.08 |
| W | 0.3 | 35.8 | 0.91 | 3.04 | 2.29 | 0.75 | 2.51 |
| Hg | 0.41 | 156.1 | 8.1 | 2.32 | 5.78 | 2.49 | 52 |
| As | 0.01 | 11,159 | 2.8 | 101.14 | 430.18 | 4.25 | 13.1 |
| Sb | 0.01 | 158.2 | 0.32 | 9.13 | 12.73 | 1.39 | 1.3 |
| Bi | 0.02 | 32.79 | 0.14 | 0.72 | 1.01 | 1.4 | 0.47 |
Table 2.
Fractal dimension value D and correlation coefficient R2 of fault structures in all directions of the study area.
Table 2.
Fractal dimension value D and correlation coefficient R2 of fault structures in all directions of the study area.
| | Title | Fractal Dimension Value D | Correlation Coefficient R2 |
|---|
| 1 | Global linear structure | 2.1471 | 0.9891 |
| 2 | NE-trending | 1.7231 | 0.9849 |
| 3 | NW-trending | 1.4948 | 0.9825 |
| 4 | EW-trending | 1.0921 | 0.9976 |
Table 3.
Fault strike associated with major gold deposits in the study area.
Table 3.
Fault strike associated with major gold deposits in the study area.
| Number | Mineral Deposit Name | Main Ore-Bearing Structural Strike |
|---|
| 1 | Wushan Gold Mine, Qixia City, Shandong Province | NE-trending |
| 2 | Taiqian Gold Mine, Qixia City, Shandong Province | NE-trending |
| 3 | Chugezhuang Gold Deposit, Qixia City, Shandong Province | NE-trending |
| 4 | Sansujie Gold Deposit, Qixia City, Shandong Province | NE-trending |
| 5 | Yang Jialing Gold Deposit, Qixia City, Shandong Province | NE-trending |
| 6 | Sun DongGold Deposit, Qixia City, Shandong Province | NE-trending |
| 7 | Li Jiagou Gold Deposit, Qixia City, Shandong Province | NE-trending |
| 8 | Da Zhai Gold Deposit, Qixia City, Shandong Province | EW-trending |
| 9 | Xi Lin Gold Deposit, Qixia City, Shandong Province | EW-trending |
| 10 | Ma Zhangjia Gold Deposit, Qixia City, Shandong Province | NE-trending |
| 11 | Wang Gezhuang Gold Deposit, Qixia City, Shandong Province | NE-trending |
| 12 | Yin Jia Gold Deposit, Qixia City, Shandong Province | NE-trending |
| 13 | Ai Shantang Gold Deposit, Qixia City, Shandong Province | NE-trending |
| 14 | Xia Aikou Gold Deposit, Qixia City, Shandong Province | NE-trending |
| 15 | Ge Jiagou Gold Deposit, Qixia City, Shandong Province | NE-trending |
| 16 | Zhang Jiagou Gold Deposit, Qixia City, Shandong Province | NW-trending |
| 17 | Zhou Jia Gold Deposit, Qixia City, Shandong Province | NW-trending |
Table 4.
Dataset of predicted gold deposits.
Table 4.
Dataset of predicted gold deposits.
| Metallogenic Factors | Predictive Index | Characteristic Variable |
|---|
| Tectonic conditions | Ore-controling structure | Direction |
| Distance |
| Geochemical anomaly area | Au anomaly area | Gold mineralization anomaly |
| Ten geochemical elements | Au, Ag, Cu, Zn, Mo, W, Hg, As, Sb, Bi |
| Wall rock alteration | Mineralization characteristics | Silicification, sericitization, pyritization, and carbonation |
| Disclaimer/Publisher’s Note: The statements, opinions and data contained in all publications are solely those of the individual author(s) and contributor(s) and not of MDPI and/or the editor(s). MDPI and/or the editor(s) disclaim responsibility for any injury to people or property resulting from any ideas, methods, instructions or products referred to in the content. |
© 2023 by the authors. Licensee MDPI, Basel, Switzerland. This article is an open access article distributed under the terms and conditions of the Creative Commons Attribution (CC BY) license (https://creativecommons.org/licenses/by/4.0/).


