Abstract
The MSL Curiosity rover investigated dark, Mn-P-enriched nodules in shallow lacustrine/fluvial sediments at the Groken site in Glen Torridon, Gale Crater, Mars. Applying all relevant information from the rover, the nodules are interpreted as pseudomorphs after original crystals of vivianite, (Fe2+,Mn2+)3(PO4)2·8H2O, that cemented the sediment soon after deposition. The nodules appear to have flat faces and linear boundaries and stand above the surrounding siltstone. ChemCam LIBS (laser-induced breakdown spectrometry) shows that the nodules have MnO abundances approximately twenty times those of the surrounding siltstone matrix, contain little CaO, and have SiO2 and Al2O3 abundances similar to those of the siltstone. A deconvolution of APXS analyses of nodule-bearing targets, interpreted here as representing the nodules’ non-silicate components, shows high concentrations of MnO, P2O5, and FeO and a molar ratio P/Mn = 2. Visible to near-infrared reflectance of the nodules (by ChemCam passive and Mastcam multispectral) is dark and relatively flat, consistent with a mixture of host siltstone, hematite, and a dark spectrally bland material (like pyrolusite, MnO2). A drill sample at the site is shown to contain minimal nodule material, implying that analyses by the CheMin and SAM instruments do not constrain the nodules’ mineralogy or composition. The fact that the nodules contain P and Mn in a small molar integer ratio, P/Mn = 2, suggests that the nodules contained a stoichiometric Mn-phosphate mineral, in which Fe did (i.e., could) not substitute for Mn. The most likely such minerals are laueite and strunzite, Mn2+Fe3+2(PO4)2(OH)2·8H2O and –6H2O, respectively, which occur on Earth as alteration products of other Mn-bearing phosphates including vivianite. Vivianite is a common primary and diagenetic precipitate from low-oxygen, P-enriched waters. Calculated phase equilibria show Mn-bearing vivianite could be replaced by laueite or strunzite and then by hematite plus pyrolusite as the system became more oxidizing and acidic. These data suggest that the nodules originated as vivianite, forming as euhedral crystals in the sediment, enclosing sediment grains as they grew. After formation, the nodules were oxidized—first to laueite/strunzite yielding the diagnostic P/Mn ratio, and then to hematite plus an undefined Mn oxy-hydroxide (like pyrolusite). The limited occurrence of these Mn-Fe-P nodules, both in space and time (i.e., stratigraphic position), suggests a local control on their origin. By terrestrial analogies, it is possible that the nodules precipitated near a spring or seep of Mn-rich water, generated during alteration of olivine in the underlying sediments.
1. Introduction
The Curiosity rover of the Mars Science Laboratory Mission has been exploring the sediments in Gale Crater (Mars) since 6 August 2012, now approaching 4000 sols (martian days) of exploration. MSL’s major goals have been to determine if habitable conditions ever existed on Mars, and to investigate the major environmental transition from clay-rich to sulfate-rich rocks part-way up the central mound in Gale Crater, Mt. Sharp [1]. Among Curiosity’s many findings [2,3], it documented a thick sequence of lake deposits, from fluvial and deltaic through benthic and back to shallow near-surface muds (some with desiccation cracks) and fluvial deposits, e.g., [4,5,6,7]. These lake and river sediments were affected by a wide range of diagenetic processes yielding concretions, fracture fills, and cements consisting of Ca-sulfate-, iron oxide-, and manganese-rich materials [8,9,10,11,12,13,14,15,16,17,18,19,20,21,22]. Diagenetic enrichments in phosphorus and manganese are scattered and occur together in some features, but Curiosity has also discovered high concentrations of the two elements separately. These observations imply that phosphorus and manganese were mobile (at least to some extent) in the Gale Crater lake and sediments [23,24,25,26,27,28,29]. Geochemical processes involving phosphorus are of great interest for habitability because phosphorus is essential to many biomolecules in terran life. Likewise, processes involving manganese are of interest due to its frequent association with biological activity in terrestrial settings, e.g., [30,31].
Here, we describe in detail one of the phosphorus-bearing diagenetic features—dark angular nodules rich in phosphorus, manganese, and iron. These nodules were found only in a single small area in Gale Crater, in the Glen Torridon region (Figure 1A,B), which is a local swale on the slopes of Mt. Sharp [32]. Curiosity entered Glen Torridon, formerly called the “phyllosilicate trough,” from the north on sol 2304 (28 January 2019) after leaving the Vera Rubin ridge [33]. Glen Torridon was of particular interest because it showed the strongest orbital signatures of clay minerals, which require water to form and thus could reasonably be tied to habitability. Curiosity departed Glen Torridon on sol 3051 (5 March 2021) and entered the clay–sulfate transition region on its traverse up Mt. Sharp.
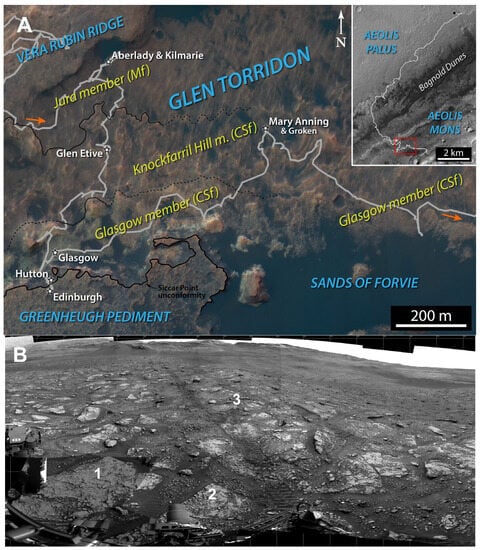
Figure 1.
Setting for the Groken site and nodules. (A) Location and geologic map of the Glen Torridon area. Inset upper right shows Curiosity’s path since landing; arrows show direction of travel. After [34]. (B) Regional view, looking south across the Groken area, taken just prior to drilling. Numbered sites are: 1. Mozie_Law outcrop slab, which includes Groken; 2. Falkirk_Wheel outcrop slab; 3. Le_Ceasnachadh, float rock. Note rover wheel tracks on either side of number ‘3’. NavCam image N_L000_2829_ILT082CYL_S_2176_UNCORM1.
Rocks exposed in Glen Torridon are assigned to the Mt. Sharp Group of lacustrine-related sediments, which include fine sandstones and mudstones of basaltic provenance (Figure 2). They are estimated to have been deposited approximately 3.7 billion years ago [4]. Three units of the group are exposed in Glen Torridon; in stratigraphic and time sequence they are the Jura member, the Knockfarrill Hill member, and the Glasgow member (Figure 2). The Jura member is the uppermost unit of the Murray formation, which consists dominantly of mudstones and fine sandstones deposited in a low-energy environment. The transition from Jura to Knockfarrill Hill is interpreted as a change to a nearer-shoreline fluvial-influenced environment [7,34]. The Knockfarrill Hill and Glasgow members are assigned to the Carolyn Shoemaker formation, which includes fluvial deposits and lake-margin sediments [32,35]. The Groken nodules occur in finely laminated and cross-bedded sandstone near the middle of the Knockfarrill Hill member (Figure 2). The overlying unit, the Glasgow member, consists principally of finely laminated mudstones, heavily overprinted by diagenetic nodules and veins. Diagenetic minerals and textures are common in the rocks of Glen Torridon [8,34], and their formation environments can be rationalized in a model of a filling lake where its waters percolated into the sediments and interacted with upwelling groundwaters [36].
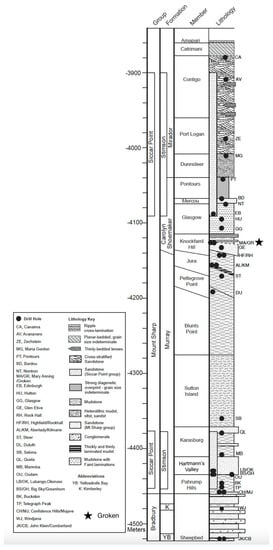
Figure 2.
Stratigraphic column for Gale Crater sediments, showing nomenclature (names of groups, formations, and members), rock types, sampling locations (filled circles), and location of the Groken and Mary_Anning locations. Updated, after [32].
The Groken site, in the middle of the Knockfarrill Hill member (Figure 2), features the Mn-Fe-P nodules that are the focus of our work here; for convenience, these Mn-Fe-P materials will be called the Groken nodules. The Curiosity rover approached the Groken site, on the Mozie_Law slab (Figure 1, Table 1), on sol 2829 of the Mission (19 August 2020). Curiosity stayed at Mozie_Law, moving only slightly to accommodate different drill locations, for 93 sols. The rover left Mozie_Law on its traverse toward Mt. Sharp on sol 2923 (19 October 2020). For a detailed chronology, see the Supplementary Materials.

Table 1.
Selected names used here.
Table 1.
Selected names used here.
| Designation | Name | Description | Figure |
|---|---|---|---|
| Formation | Carolyn Shoemaker | Sandstones and mudstones transitional from lacustrine to fluvial systems | Figure 1A and Figure 2 |
| Member | Knockfarrill Hill | In Carolyn Shoemaker formation, dominated by finely laminated and cross-bedded sandstones | Figure 1B and Figure 2 |
| Outcrop | Falkirk_Wheel | Bedrock slab in Knockfarrill Hill member, east of Mozie_Law. | |
| Site | Wart | Nodule-rich layer on Falkirk_Wheel. | |
| Outcrop | Le_Ceasnachadh | Float rock, with dark nodular surface. | |
| Outcrop | Mozie_Law | Bedrock slab in Knockfarrill Hill member. | Figure 1B and Figure 3A |
| Site | Mary_Anning | Drill location on Mozie_Law; sample analyzed by CheMin & SAM | Figure 2 and Figure 3A |
| Site | Mary_Anning2 | Drill location on Mozie_Law; sample analyzed by SAM | |
| Site | Mary_Anning3 | Drill location on Mozie_Law; sample analyzed by CheMin & SAM | Figure 2 and Figure 3A |
| Site | Groken | Drill location on Mozie_Law targeted to collect dark nodule material; sample analyzed by CheMin & SAM | Figure 2 and Figure 3 |
| Site | Trow | MAHLI/APXS targets on Mozie_Law near Ayton, imaged at 5 cm standoff with dust cover closed | Figure 3B |
| Site | Ayton | Three APXS targets on Mozie_Law near Groken, analyzed to deconvolve the composition of dark nodules | Figure 3B |
| Site | Ballalan | Site near Mary_Anning3 on Mozie_Law, MALHI image showing scattered small nodules | Figure 3E |

Figure 3.
Local sites on Mozie_Law. G: Groken; T: Ayton and Trow; B: Balallan; f: distinctive float rock, for orientation. (A) Mozie_Law slab, post-drill. South to lower left; slab is ~1 m across. Sub-frame of MAHLI selfie, NASA image PIA24173. (B) Groken drill site, pre-drill, image rotated 90° counterclockwise from frame A. MAHLI 2906MH000424003483C00. Denoted sub-areas 5A and 5B in Figure 5. (C) Groken after drilling. Note break in rock and exposed edge (arrow, see Figure 5C). Note wind-blown debris up and right (south) from drill hole. MAHLI 2920MH0004340011003512C00. (D) Isolated nodule-rich layer at Wart. Subframe from MAHLI 2870MH0001900011003436C00. (E) Small nodules widely spaced on laminae at Balallan. Arrows point to some nodules. Subframe from MAHLI 2870MH0001970011003432C00. (F) Float rock Le_Ceasnachadh near Mozie_Law (Figure 1B). Top surface with abundant dark nodules, similar to those on Mozie_Law. Rock is ~20 cm wide. Contrast-enhanced subframe from 2824ML0147800120208647E01_DRCX.

2. Data and Methods
Unlike prior work on the Mn-Fe-P nodules, we have used relevant data from all of the science instruments on the Curiosity rover and the rover’s drill system. Because these instruments and their data have been described elsewhere, we provide detailed information only on new or unfamiliar capabilities and refer the reader to the primary publications.
2.1. Imaging
The Curiosity rover carries many cameras, several of which have been useful for understanding and interpreting the dark nodules at Groken.
2.1.1. Mastcam
Mastcam, or MCAM, is a pair of cameras on Curiosity’s remote sensing mast (RSM), designed for monocular and stereo imaging of the mid- and far-field [37,38]. The Mastcam cameras each have a filter wheel, so they can acquire visual color images, and images in 12 narrow spectral bands. The multispectral image capability is described below. Mastcam images and reduced data are available in the NASA Planetary Data System (PDS) Analyst’s Notebook (https://an.rsl.wustl.edu/msl/mslbrowser/an3.aspx, accessed on 7 July 2023).
2.1.2. MAHLI
MAHLI is a focusable color imager on Curiosity’s arm, capable of close-up images of rock surfaces. Under ideal circumstances, MAHLI images can have spatial resolutions down to ~14 µm per pixel [39]. MAHLI commonly takes through-focus series of images and merges them on-board the rover to return images effectively of long focal length. When not in use, MAHLI’s optics are protected by a transparent cover, which has become partially covered with dust (as has all exposed Curiosity hardware). The MAHLI images figured here are all from moderate standoff (i.e., 25 cm) with the cover open. In the Groken area, winds were strong and rapidly moved sand and dust at the surface (see Drill below), and the MAHLI team permitted closeup images (e.g., 5 cm standoff) only with the cover closed. Those images, as shown in Figure 8 in [40], are not used here.
2.1.3. NCAM
Curiosity’s Navigation Camera, or NCAM, is a pair of cameras mounted on Curiosity’s RSM, in parallel with Mastcam [38]. Here, a NCAM panorama shows the ‘regional’ setting for the Groken nodules and their host bedrock slab.
2.1.4. Digital Outcrop Modelling
To characterize the 3-dimensional shape and fine-scale spatial distribution of the dark angular nodules of the Groken site, a micro–Digital Outcrop Model (DOM) was computed. This scaled 3D representation was obtained through Structure-from-Motion photogrammetry [19] using ten MAHLI images taken on Sols 2857 and 2870. The DOM covers a surface of approximately 10 × 14 cm, with a spatial resolution of ~0.5 mm.
2.2. Elemental Chemistry
2.2.1. APXS
The APXS instrument is an X-ray fluorescence spectrometer, located on the end of Curiosity’s arm. The APXS is similar in operation to those on the MER rovers [41,42,43] and can analyze for the major rock-forming elements (Na through Fe), and some trace elements of higher atomic numbers. O’Connell-Cooper, et al. [44] describe its operation and some results for the Glen Torridon region. APXS provides bulk chemical analyses from its field of view, which is nominally a ~2 cm diameter circle on a rock or soil surface. APXS data are available in the PDS (https://an.rsl.wustl.edu/msl/mslbrowser/an3.aspx, accessed 7 July 2023).
Many diagenetic features in Glen Torridon (and elsewhere in Gale Crater) are smaller than 2 cm in extent, so the APXS team developed a procedure to calculate elemental compositions of such smaller features [43]. APXS acquires adjacent or overlapping analyses (i.e., a raster) where the analyzed surfaces include different proportions of the target feature, but the target material and adjacent material are otherwise identical. The proportions of target features in each analysis area are determined from MAHLI images, and the raster analyses are then deconvolved to yield estimates of the compositions of the target features and their host material [43,45].
2.2.2. ChemCam—LIBS
The ChemCam instrument suite on Curiosity’s RSM includes a laser-induced breakdown spectrometer or LIBS [46,47]. LIBS obtains chemical compositions of small volumes of the target material by using intense laser light to vaporize the volume and recording optical emission spectra (ultraviolet through infrared) from the resulting plasma. In a typical operation, an observation point is hit by 30 laser shots. Photoemissions from the last 25 shots are summed to give the rock chemical analysis. The first five shots typically have photoemissions distinct from the latter ones and are interpreted to represent dust or coatings on the rock surface. The LIBS laser shots sputter a small pit into the target, typically 0.3–0.5 mm in diameter, and as deep as ~0.5 mm [48].
ChemCam LIBS can provide quantitative abundances of elements that are easily ionized by the laser, including most of the rock-forming elements [49,50]. Of particular importance is the recently developed quantification of Mn [51]. ChemCam LIBS analyses in oxide format are available in the PDS (https://pds-geosciences.wustl.edu/msl/msl-m-chemcam-libs-4_5-rdr-v1/mslccm_1xxx/data/moc/, accessed 7 July 2023). ChemCam LIBS can also detect other elements at varying levels of sensitivity, including P, S, and H. Quantifications for these elements are challenging and are continuously being improved; the assessment of these elements in particular target classes is conducted with different approaches, see [52,53,54] and references therein.
2.3. Reflectance Spectra
2.3.1. ChemCam Passive
The optical spectrometer used for ChemCam LIBS analyses can also be used in passive mode (no laser shots) to obtain relative reflectance spectra in the wavelength range 400–840 nm [55]. This range is primarily sensitive to iron-related absorptions in oxides, oxyhydroxides, and ferric sulfates, including the edge of the ferric-ferrous charge-transfer absorption [56]. Few Mn-bearing minerals have distinctive spectra in this wavelength range [57,58]. ChemCam passive spectra have high wavelength resolution and small target areas, and so are complementary to Mastcam multispectral observations, which cover wavelengths farther into the infrared, but with lower spectral resolutions.
2.3.2. Mastcam Multispectral
The two Mastcam cameras, described above, include filter wheels which allow a scene to be imaged in twelve different wavelength bands from 440 through 1035 nm [37,38]. After calibration, pixel values from these images can be combined to yield twelve-band reflectance spectra of individual regions of interest or pixels [59,60]. Many iron-bearing oxides and silicates have absorptions in this range, but few Mn-bearing minerals do [57,58]. These multispectral observations are complicated by the fact that the cameras have different focal lengths and thus different fields of view and pixel sizes. The Mastcam right-eye camera (M100, 100 mm focal length) has a field of view approximately one-third that of the Mastcam left-eye camera (M34, 34 mm focal length). Thus, spectra of the smallest resolvable features can only be obtained in the M100 filter bands, with narrowband filters centered at 447, 527, 805, 908, 937, and 1013 nm and wider Bayer filters with band centers 480, 544, and 638 nm [38].
2.4. CheMin
The CheMin instrument is an X-ray diffractometer, housed inside the body of the Curiosity rover. CheMin generates a collimated beam of CoKα X-rays, which is transmitted through a cell that contains powdered rock (or regolith), delivered by the drill assembly [36,61,62]. Diffracted and fluoresced X-rays are detected by a charge-coupled device (CCD) imager, with data collection and readout timed so that very few CCD pixels receive more than one X-ray in a collection. Each such data collection yields a raw frame, a two-dimensional image of X-ray hits with the X-ray energy for each hit.
Groups of raw frames are co-added on the rover to produce minor frames, which are all downlinked to Earth. Raw frames can be downlinked by explicit commands. Data returned for each frame (raw or minor) includes an image of diffracted X-ray hits (i.e., at the energy of CoKα X-rays) and a histogram (summed over the image) of the counts of fluoresced (i.e., non-diffracted) X-rays sorted by their energies. On Earth, minor frames are co-added to yield a major frame—the typical final CheMin data product for a rock or soil sample. CheMin can detect crystalline minerals if present at more than approximately 1% of the sample mass.
The energy histogram of fluoresced X-rays is an unfamiliar CheMin data product, comparable in concept to APXS products. The CheMin XRF is minimally sensitive to X-rays with energies lower than that of Ca (i.e., S, P, Si, Al, Mg, and Na) and has a much lower energy resolution and signal/noise ratio than APXS. CheMin XRF data have not been calibrated but can provide qualitative or semi-quantitative data on the most abundant elements with higher X-ray energies. As with the CheMin diffraction data, fluorescence histograms from all minor frames are typically co-added to produce a major frame histogram. CheMin data are available in the ODR repository (https://odr.io/chemin) and the NASA PDS (https://an.rsl.wustl.edu/msl/mslbrowser/an3.aspx, both accessed 7 July 2023).
The Groken drill sample was acquired on mission sol 2910, and delivered to CheMin on sol 2912. The sample was analyzed in CheMin over four nights (sols 2912, 2914, 2922, and 2930), yielding a total of 60 minor frames of analyses (30 h of analysis). Refined cell parameters for plagioclase, c and the angle γ [63], were used to adjust the sample cell to detector distance calibration by −122 µm. CCD temperatures during data collection were near −50 °C. On the first three nights, the Groken sample vibrated in the normal intensity and pattern. On the fourth night, a gentler vibration was applied by activating the vibration piezos on the adjacent cell pair (rather than on the cell pair that contained the Groken sample). Here, we do not use that last night of data.
2.5. SAM
Curiosity’s Sample Analysis for Mars (SAM) instrument is a multimodal system for the analysis of gases [64]. It includes a tunable laser spectrometer (TLS) that determines optical absorption constants and gas mass spectrometers. The latter includes a heater to release gas from solid samples, reagents for derivatization experiments, and gas chromatography columns [65,66].
2.6. Drill
Rock samples are acquired for CheMin and SAM analyses by Curiosity’s drill and delivery mechanism, the SA-SPaH [62,67]. Among the engineering parameters returned by the drill mechanism is the drill progress rate. The drill procedures were revised after the failure of a drill actuator on sol 1536 [68], long before Groken was drilled. The Curiosity engineering team recovered Curiosity’s ability to drill through a revised drill procedure—Feed Extended Drill/Feed Extended Sample Transfer—or FED/FEST [3]. With FED/FEST, delivered drilled samples come only from the small mass (~13 portions) that remain in the stem when drilling stops. This mass is dominated by the final material that was drilled, i.e., from the lowest few mm of the drill hole [3].
2.7. Mineral Stabilities
Equilibrium mineral stabilities were calculated and graphed using Geochemists’ Workbench© set of software tools [69] (GWB), and verified in some cases by manual calculations on spreadsheets. Graphs here are from the programs Act2 and Phase2. Act2 calculates stability diagrams, which show the most supersaturated solid (i.e., greatest saturation index) or dominant aqueous ion which includes the target species for a given bulk elemental composition over a given range of pH and oxidation states. Phase2 calculates the equilibrium mineral assemblage for a given bulk elemental composition at the given pH and oxidation state.
The thermochemical database of [70] was used for equilibrium calculations. That database is consistent with the recent work Mn-phosphates [71] and, for the most part, is consistent with the earlier compilation of [72] and yields results similar to those in other recent works [45,73]. Where thermochemical data for a phosphate mineral were not available, they were estimated using the ThermAp method [74,75], which has been shown to yield adequately accurate values for many Mn-bearing minerals [71]. Because we estimated phases other than apatites, we used the estimation parameters from [71]. Please refer to the Supplementary Materials for specific thermochemical data and calculation methods applied here.
Table 2 lists all the crystalline phases for which our thermochemical database gives solubility products. Several of these phases were not included in modeling because their solubility products imply far greater stability ranges than are known in comparable environments on Earth. For example, some compounds are predicted to be stable under Earth-surface conditions but are not known as minerals, e.g., Mn2+HPO4 and Mn2+3(PO4)2. Others are predicted to be stable under a wide range of chemical conditions, like reddingite [Mn2+3(PO4)2·3H2O] and vivianite-Mn [Mn2+3(PO4)2·8H2O] but are actually uncommon or rare in nature. A few others are not expected in low-temperature aqueous conditions (e.g., hausmannite, Mn2+Mn3+2O4, and jacobsite, Mn2+Fe3+2O4). The calculated solubility products for laueite and strunzite are essentially identical (they differ only in degree of hydration, Table 2).
Table 2.
Solid phases encountered in geochemical modelling.
3. Results
Here, we establish the geology of the nodule occurrence, at and near the Groken site, and current compositions and mineralogies of the Groken nodules and their host rocks. The geologic relations of the nodules come from visual imaging by Mastcam, MAHLI, and ChemCam RMI. Chemical and mineralogical data come from APXS, ChemCam LIBS, CheMin, and relative reflectance spectra from ChemCam and Mastcam. We separate the chemical/mineralogical inferences into those related to rock surfaces and drilled materials. Analyses related to rock surfaces can be correlated with objects or locations on images, giving them geologic context in the finely laminated Mary Anning rock. Drilled samples are fine-grained mixtures of materials in the rock beneath the drill epicenter. After the drill anomaly of sol 1536, the drill material delivered to SAM and CheMin is not representative of the entire drilled core, but only of the final rock that was drilled, i.e., the bottom few millimeters of the hole [3].
3.1. Local Geology
The regional geology of the Groken site was described in the Introduction (Section 1). Groken is on a bedrock slab named Mozie_Law, in the middle of the Knockfarrill Hill member of the Carolyn Shoemaker formation (Figure 2). The Mozie_Law slab is typical of bedrock outcrops in the area, Figure 1B and Figure 3A—with a relatively flat top surface at a small angle to the rock’s bedding/layering and surrounded by sand-filled lanes with patches and rows of well-sorted pebbles [76]. The Mozie_Law slab is approximately 1 m across (Figure 3A) and its surface exposes thinly laminated sandstone, with layers on the order of millimeters thick (Figure 3B–E and Figure 4). Low-angle cross-bedding is visible at a few spots (Figure 4); elsewhere, cross-bedding is subtle if present.
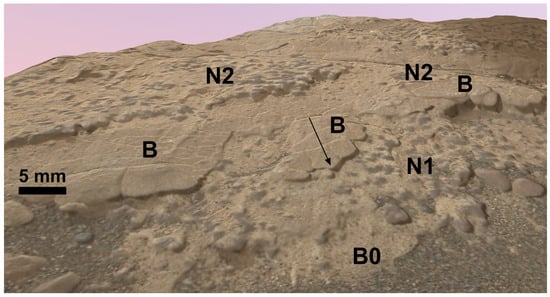
Figure 4.
Oblique view of the Groken site photogrammetric micro-Digital Outcrop Model, looking south, rendered using MAHLI images. Nodule-bearing layers, N1 and N2 following [40], are ~2 mm thick. Between them is a nodule-free, barren layer, B, which is 0.7 mm thick. Most of the exposed layer B is interpreted as its top surface—cross-sections are shadowed, as at the arrow. Sand in foreground surrounds Mozie_Law slab. For an interactive rendering, see https://skfb.ly/oFMtU (accessed 7 July 2023).
The Groken drill site is at the southernmost edge of the Mozie_Law slab, where the stratigraphically highest layers of the slab are exposed (Figure 3A). Layers rich in dark nodules are interspersed with those containing few or no nodules, Figure 3B [8,40]. During drilling at Groken, the Mozie_Law slab broke along some of the layers (Figure 3C). The dark nodules are generally compact with straight edges and distinct angular corners, Figure 3D and Figure 4. As exposed on the weathered rock surfaces, the nodules average approximately 0.3 mm long and 0.2 mm wide; the longest imaged is ~0.5 mm long. Most of the nodules are distinctly separate, with light-toned host rock visible between them; however, many of the nodules impinge on others (Figure 3, Figure 4 and Figure 5). In their layers, the nodules appear to be randomly distributed and oriented (Figure 3, Figure 4 and Figure 5).
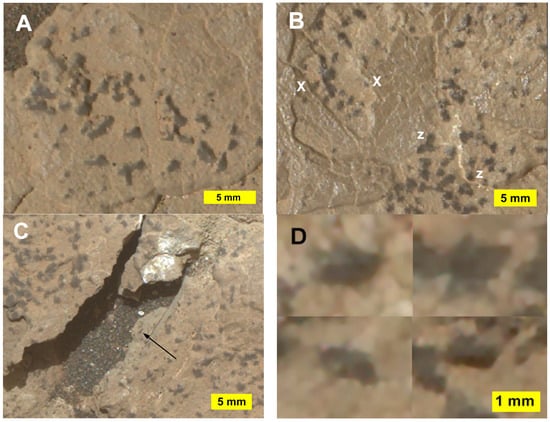
Figure 5.
Details of Groken nodule textures, showing nodules’ straight boundaries and sharp corners. Sub-frames from Figure 3B, enlarged with the “Detail Preservation 2.0” filter in Photoshop©. (A) Nodules’ straight boundaries and sharp corners. Subframe from Figure 3B. (B) Relationships between nodules and sediment laminae. Small nodules (x) are overlain by laminae, without disrupting or distorting them. Larger nodules (z) extend through laminae without disrupting or distorting them. Subframe from Figure 2B. (C) Broken rock edge, arrow, near drill hole (upper right). Nodules on broken surfaces are dark, implying that the dark color is not a surface effect. Subframe from Figure 3C. (D) Extreme close-ups of selected individual nodules from Figure 3B, enlarged with the “Detail Preservation 2.0” filter in Photoshop© (version 24.5.0). Nodules were chosen to emphasize their angular outlines and consistent minimum inter-edge angle of ~55°.
The dark nodules are only abundant at the southernmost corner of Mozie_Law, i.e., at the highest stratigraphic level exposed (Figure 3A and Figure 4). However, similar-appearing dark nodules are concentrated in a few layers present elsewhere nearby (Figure 3D) and on the nearby loose rock Le_Ceasnachadh (Figure 3F). A few images of Mozie_Law show scattered small dark spots (Figure 3E); these could be the same type of nodules as in the Groken area, but we lack high-resolution images or chemical data on them. Although diagenetic features of many types are common in Glen Torridon and in the Knockfarrill Hill unit, dark nodules like those at Groken have not been reported anywhere else [8,34].
In the absence of high-resolution oblique images, relationships between the nodules and the sedimentary layers are difficult to discern. However, it appears that layers are nowhere deflected or disturbed by the nodules (Figure 4). The layers themselves average 1.4 mm thick around Groken, from ~0.7 mm to ~2 mm. In the available images, there is no indication that the nodules disturb or deflect layer boundaries either below or above. If the nodules had deflected layers, one might expect to see contrasts in color or weathering around nodules, following the slight differences in color and strength of the laminae. No such features have been found. Rather, small nodules are covered by overlying laminae without deflection (‘x’ in Figure 5B), and larger nodules extend through overlying laminae without deflecting or disturbing them (‘z’ in Figure 5B).
3.2. Rock Surface
Anticipating the results here, chemical analyses of nodules on their rock surfaces are consistent with them being pseudomorphs—a mixture of substances that have replaced an earlier Mn-Fe phosphate phase. APXS analyses show that Groken nodules are rich in Mn, P, and Fe and contain minimal Si and Al. LIBS observations show that the nodules enriched in Mn, P, and Fe contain little Ca but contain significant Si and Al. The consequences of these differences are discussed below in Discussion and Implications (Section 4 and Section 5).
3.2.1. APXS
APXS chemical analyses were taken on several rock surfaces on the Mozie_Law slab, on surfaces both raw and brushed of dust by the DRT (dust removal tool) Table 3 [26]. The chemical composition of the Groken nodules was derived from the quantitative comparison of APXS analyses of adjacent areas (Ayton 1, 2, and 3) that contained varying proportions of nodules, i.e., a raster deconvolution [43]. The results of that raster deconvolution [40] are given in Table 3.
Table 3.
APXS chemical composition of selected Mozie_Law samples.
The composition calculated from the Ayton raster deconvolution is rich in Mn, Fe, and P and contains no Si. This result, at its most conservative interpretation, is a pointer to what is compositionally unique to the nodules compared to the substrate. The absence of SiO2 would suggest that the deconvolution removed all contributions from the silica-rich matrix material and the surrounding siltstone, or that the nodules contain no matrix material (i.e., grains of silt). Abundances of Na, Mg, and Al in the deconvolved composition are suggested to be an artifact of APXS analyses of layered targets (e.g., a thin dust layer over rock), and not intrinsic to the bulk nodules [40,45]. The molar proportions of Ca and S in the nodules are within the uncertainty of each other, suggesting that the nodules contain a stoichiometric CaSO4 mineral, like anhydrite or gypsum. CaSO4 phases are abundant across Gale crater in veins and as likely cements in the sediments [8,29,77,78]. Table 3 also includes a column of the nodules’ composition without CaSO4 [40] to help understand the substances in the rest of the nodules. After the removal of the CaSO4 component and ignoring the Na and Al, the deconvolved composition is seen to consist primarily of Mg, Fe, Mn, and P (inferred to as oxides) and possibly other components like carbonate that are undetectable by APXS.
The Ayton deconvolved composition of the host rock (Table 3) is very similar to the analyzed compositions of rock and drilled materials in the Groken area. The largest differences between the deconvolved host composition and the direct analyses of it are in SO3 and CaO, which imply more CaSO4 in the inferred nodule composition than permitted by LIBS analyses.
A crucial feature of the dark nodules’ composition is that they contain P and Mn in a molar ratio of nearly exactly two (Table 3). Figure 6A shows the abundances of P2O5 and MnO of all APXS analyses of Knockfarrill Hill rocks. Most of these analyses have P2O5 and MnO near 0.8 and 0.2% wt., respectively, which we take as the background for Knockfarrill Hill rocks. Several samples on Mozie_Law and a few other sites have higher abundances of Mn and P, consistent with the addition of a substance with molar P/Mn = 2 (Figure 6A). The inferred nodule composition from the Ayton raster falls slightly higher than this ratio, ~2.2, but within 1σ uncertainty of molar P/Mn = 2 (Table 3, Figure 6B). Ayton raster points 1 and 2 have P/Mn very close to 2.0, as do other APXS rock analyses including Jones_Marsh and Maple_Spring. The possible identities and origins of this substance are discussed below.
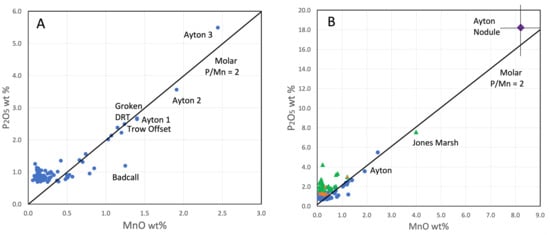
Figure 6.
Phosphorus and manganese oxide abundances, APXS analyses. (A) Samples from Knockfarrill Hill member. Ayton 1, 2, and 3 were used to deconvolve the nodule composition, in Table 2. The Badcall sample is enriched in Mn but not P, showing that the Knockfarrill Hill member experienced multiple styles of chemical alteration [8]. (B) Samples from the whole Murray Fm, and the deconvolved composition of the Ayton nodules [8,40]; blue = Knockfarrill Hill; green = Vera Rubin Ridge; orange = other Glen Torridon. The Jones_Marsh sample, a nodular surface, is richer in Mn and P than the Ayton samples and has molar P/Mn = 2. Uncertainty bars on the Ayton nodule deconvolution are 1σ.
Jones_Marsh and Maple_Spring are APXS targets near and on Vera Rubin Ridge, the plateau just north of the Glen Torridon trough (Figure 1). Both analyses are of dark nodules on rock surfaces, and both are significantly enriched in P and Mn with molar P/Mn = 2 within uncertainties [26,33]. Unlike the Groken nodules, those at Jones_Marsh and Maple_Spring were circular or elliptical blobs or mergers of such blobs, and not the sharply angular nodules seen at Groken (Figure 5). For both targets, the APXS analysis area included nodules and host rock, so their nodules are likely richer in Mn and P than in the published analyses.
Another crucial aspect of the analyses is that the calculated composition of the host rock among the dark nodules is like those of other Knockfarrill Hill rocks, especially those on Mozie_Law, in Table 3. Mozie_Law rocks are somewhat variable in composition, consistent with variations in abundances of a CaSO4 component, perhaps an Fe-oxide component, and other minerals and amorphous material [36]. The calculated composition of the rock among the nodules in the Ayton raster in Table 3 is in family with other Knockfarrill Hill rocks and notable in its low abundances of P2O5 and MnO. This observationwill find use later in interpreting the origins of the nodules.
3.2.2. LIBS
ChemCam LIBS chemical analyses are of mm-sized spots on rock targets, and so are complementary to APXS analyses of broad areas. Table 4 gives a set of characteristic LIBS analyses, from the Groken_ccam2 raster, which is in the Ayton APXS raster area (see Figure S7). A first-order observation is that the abundances of P and Mn in LIBS analyses are not coupled tightly (Table 4, Figure 7). Although abundances of P have not been quantified, Table 4 shows that analyses with detectable P have MnO from 0.8 to 4.5% wt, while several observations with ~1.5% wt MnO do not show detectable P. So, at the scale of LIBS analysis, P and Mn are not tightly coupled, i.e., they likely do not reside in the same phase. Another important LIBS result is that the Groken nodules contain more hydrogen than their host rock and that H abundances in the nodules are broadly correlated with those of Mn and P (Figure 7).
Table 4.
Selected LIBS chemical analyses, Ayton site, Groken_ccam2 raster.
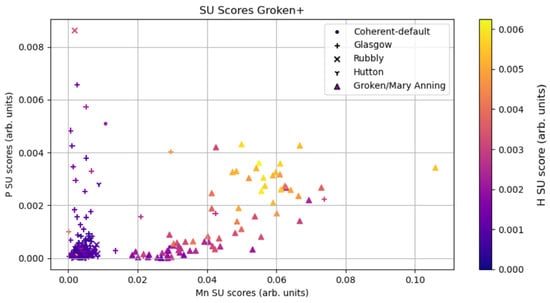
Figure 7.
Relative abundances of P, Mn, and H in Glen Torridon targets, from LIBS spectral unmixing (SU) score calculations [79,80]. SU scores are unquantified but are in proper relative order of elemental abundance. Scores for P and Mn on graph axes, score for H in symbol color. Targets on Glasgow, rubbly material, and Hutton have low Mn and H scores and variable P scores. All targets on Mozie_Law (Groken/Mary Anning) have higher Mn scores and H scores that increase with those of P and Mn.
The analyses of Table 4, as with all LIBS analyses, typically represent the summations of results of the last 25 of 30 laser shots in a single location. Data from the first few laser shots are not included, being inferred to represent dust or coatings on the rock surface. Quantified results from the last 25 shots on a target can be used to assess the target’s homogeneity with depth. Figure 8A,B show profiles of MnO and SiO2 abundances in LIBS observation points in the area of the Ayton APXS raster. No LIBS target (Table 4) or laser shot analysis (Figure 8A,B) contains so much MnO and so little SiO2 as the “pure nodule” from the APXS raster deconvolution (Table 3). The nodules contain much less Ca than the surrounding matrix (Figure 8C), suggesting that they contain little Ca sulfate, which is not obviously consistent with the APXS results (Table 3). The nodules also contain nearly twice as much MgO as their surrounding matrix (Figure 8D), which is also not observed in the APXS results.
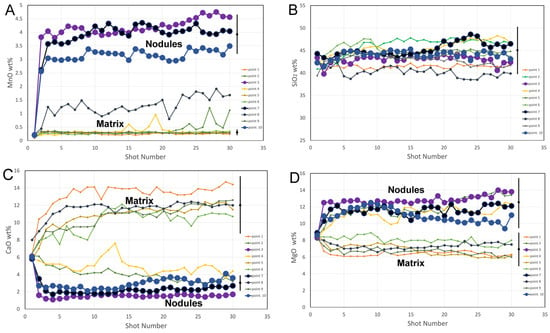
Figure 8.
ChemCam LIBS depth profile analyses of Groken nodules and surrounding materials on the Ayton_APXS_ccam raster scan (sol 2872). Target points are near the APXS Ayton raster used to deconvolve the nodule composition (Table 3). Shot number refers to the sequential number of laser pulses at a given point, which is an unquantified proxy for depth into the target. Three of the targets (3, 7, 10; darker colors, larger symbols) are on dark nodules (as shown in ChemCam RMI images); they show significant enrichments in MnO and also detections of P. Black bars show representative RMSEP uncertainties, including precision and accuracy relative to external standards. See Figure S5 for other depth profiles. (A) MnO abundances on LIBS depth profiles. The other targets do not show MnO enrichments. (B) SiO2 abundances. Within uncertainties, all shots have identical, non-zero abundances of SiO2. (C) CaO abundances. Nodule targets have far less CaO (possibly in CaSO4) than targets in the matrix. (D) MgO abundances. Nodule targets have nearly twice as much MgO as targets in the matrix.
ChemCam LIBS analyses of the nodules and their host material allow us to distinguish many of their constituent chemical components, following [34]. At least six can be discerned. First, the LIBS analyses are consistent with the presence of a substance rich in MnO and poor in SiO2, as in Figure 9A. Two trends are apparent in that figure, one of increasing MnO with decreasing SiO2, and another of consistently low MnO (~0.3% wt) with decreasing SiO2. The first trend is consistent with a Mn-rich silica-absent phase and extrapolates to ~20% MnO at zero SiO2. This extrapolated MnO abundance is twice that of the APXS deconvolved nodule composition (Table 3), but similar to the MnO abundance in the APXS deconvolved composition without CaSO4 (Table 3). A similar extrapolation for FeO implies that the MnO-rich, SiO2-absent component contains approximately 34% FeO, approximately three times the deconvolved nodule composition (Figure 8C), and twice that of the CaSO4-free inferred composition.
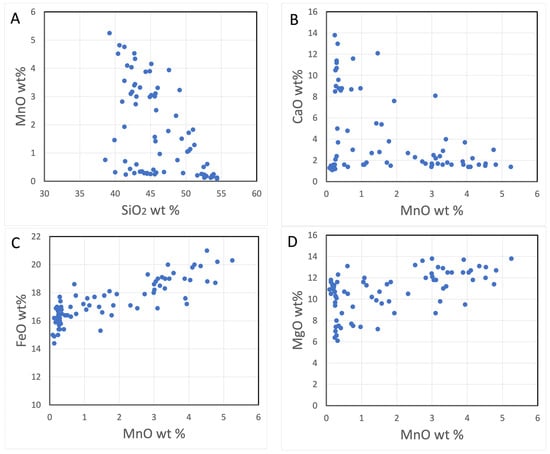
Figure 9.
ChemCam LIBS oxide abundances for spot analyses in the Groken area (see also Figure S6). (A) MnO-SiO2. Note two trends: from Si-rich Mn-poor to Si-poor Mn-rich (toward the APXS nodule composition) and to Si-poor Mn-poor (toward the Ca sulfate component). (B) CaO-MnO. The Mn-rich component contains minimal Ca, and vice versa (see Figure 3C). (C) FeO-MnO. All analyzed materials contain significant FeO, including the Mn-rich component Fe (i.e., the APXS nodule composition). (D) MgO-MnO. MgO abundance varies but the high MnO component is enriched in MgO (see Table 3, Figure 8D).
The trend of points in Figure 9A of constant low MnO with decreasing SiO2 is consistent with varying proportions of calcium sulfates in the targets, see Figure 9B and [71]. The Mn-rich and Ca-sulfate components are independent, as shown in Figure 9B—all but a few points there are either Mn-rich and Ca-poor or Mn-poor and Ca-rich. The silica-rich components are described by [34]. Their Figure 4 and Figure S6a show Mg-rich K-poor coherent bedrock in the Jura and Knockfarrill Hill members and K-rich Mg-poor rubbly bedrock. In the observation points of Table 4, iron and magnesium abundances are high; the Mn-rich component has more FeO and MgO than the remaining material, including the components rich in SiO2 and Ca-sulfate (Figure 9C,D). Another component appears to be rich in FeO and MgO, distributed pervasively across all analyses. This component is particularly apparent in the points rich in the Ca-sulfate component because crystalline Ca sulfates can contain little FeO or MgO (compare Figure 9C,D). The high abundances of FeO and MgO across all observations (e.g., high and low MnO) suggest that this component is present in all the Knockfarrill Hill observations included here. A final component is marked by Na2O abundances, that are essentially constant across all LIBS targets (see Figure S7b). As with the FeO-MgO component, this suggests a pervasive addition of Na to otherwise Na-poor materials. The Na-bearing component could be NaCl, considering the Cl detected in APXS analyses, as LIBS is not sensitive to Cl. Finally, there are P-detectable and P-undetectable materials (Table 4), but we lack a LIBS quantitation for P to assign them to the other components or define separate components.
3.2.3. Reflectance
The Groken nodules were characterized by their dark tone in visible-wavelength images. Visible to near-infrared spectra, as an extension of this visual detection, could provide crucial constraints on their mineralogy.
Mastcam multispectral data on nodules and host rock from near the Groken drill site and from the Le_Ceasnachadh rock nearby (Figure 1B and Figure 3F) are shown in Figure 10A, along with a few reference spectra of minerals [81]. The Groken and Le_Ceasnachadh rocks have essentially identical reflectance spectra, and the Groken drill cuttings are similar and somewhat brighter than the surrounding solid rock, consistent with their smaller grain size (Figure 10A). The nodules from Groken and Le_Ceasnachadh also have nearly identical spectra, which have the same shape as the host rock, but with lower reflectances at long wavelengths. The shapes of these spectra are most consistent with that of the reference fine-grained hematite (Figure 10A) and are clearly distinct from those of coarse-grained hematite and the Mn minerals.
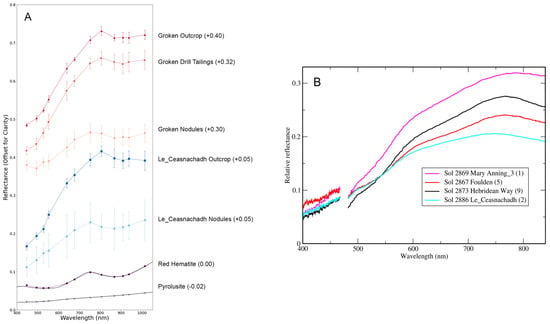
Figure 10.
Reflectance spectra of Groken nodules and similar material (A) MCAM reflectance spectra for Groken and Le_Ceasnachadh rock, drill cuttings, and nodules, with reference lab spectra [81] convolved to MCAM spectral bands. Spectra are offset for clarity by values indicated in the legend). Locations of MCAM spectra are in the Supplementary Materials (Figures S1 and S2). (B) ChemCam passive relative reflectance spectra (smoothed with 51-channel median filter) of individual raster locations for targets of interest (gap between detector region extends from 469–477 nm). Pronounced peaks in relative reflectance near 765 nm for the Foulden and Hebridean_Way targets are consistent with ferric-bearing materials. The weaker peak near 785 nm in Mary_Anning3 is consistent with less crystalline and/or finer-grained ferric materials. The flatter spectrum of Le_Ceasnachadh exhibits weak peak near 745 nm, consistent with it containing relatively less ferric-bearing material.
No ChemCam passive spectra were acquired of nodules on Mozie_Law, but spectra were acquired of dark nodules on a nearby float rock, Le_Ceasnachadh (Figure 3F), for which we lack LIBS or APXS elemental compositions. Le_Ceasnachadh appears similar to other rocks in the Mozie_Law area, so its dark nodules might be the same material as the Groken nodules. Passive ChemCam spectra of Le_Ceasnachadh, as in Figure 10B, show a distinctly lower overall reflectance than the Mozie_Law host rock (e.g., Mary_Anning3) and are distinct from other types of dark nodules (e.g., Hebridean_Way), which are interpreted as rich in hematite. Compared to them, the Le_Ceasnachadh nodules have lower near-infrared reflectances, a flatter curve in the near-infrared, and a slightly flatter slope in visible wavelengths (Figure 10B). The Le_Ceasnachadh passive spectrum is consistent with several minerals containing ferric iron, notably fine-grained hematite (2-3 µm), FeO(OH) minerals (goethite, lepidocrocite), akageneite (β-FeO(Cl,OH)), and nontronite clay [60]. The ChemCam passive spectrum is not obviously consistent with magnetite or maghemite [60], nor with pure Mn-oxy-hydroxide minerals [57,82]. However, it could be consistent (at least in pattern if not in absolute reflectance) with a mixture of fine-grained hematite and a dark, spectrally bland material like the Mn-oxide mineral pyrolusite [57,81,83].
3.3. Drilled Sample—Minimal Nodule Material
Evidence presented above shows that the Groken drill sample, the material delivered to the CheMin and SAM instruments, contained minimal dark nodule material. Because delivered drill material now comes from centimeters beneath the rock surface [3], there was no a priori guarantee that the drill sample would contain dark nodules. The MSL science team chose to take that gamble and normally would have learned of its success by APXS analyses of the sample dump pile—material cleared from the drill stem after delivery to CheMin and SAM. Unfortunately, winds blew the dump pile away before the APXS analyses were taken, so we lack that crucial data. Here, we show that the gamble was not successful and that the Groken drilled sample and cuttings show no evidence of minerals, compositions, or structures different from those of the nodule-free Mary_Anning and Mary_Anning3 drill samples or rock adjacent to the Groken drill hole.
3.3.1. CheMin X-ray Diffraction
CheMin XRD patterns provide identifications and abundances (within limits) of crystalline phases and general constraints on the amorphous material in drill samples. On the Mozie_Law rock slab, CheMin analyzed drilled samples from the Groken, Mary_Anning, and Mary_Anning3 drill sites (Figure 11A). Crystalline minerals detected in these samples are the same as have been found throughout the Murray group: plagioclase and alkali feldspars, pyroxenes, smectite clay(s), anhydrite [CaSO4], and bassanite [CaSO4·½H2O]. The Glen Torridon samples typically also include small proportions of quartz, apatite, Fe-bearing carbonate, hematite, and magnetite [17,36,84]. These samples also contain significant proportions of amorphous material [36,85], which are apparent as the hump in the XRD backgrounds from ~15–35° 2θ [17], as in Figure 11A. The Groken drill sample contains the major minerals above, but no detectable magnetite, hematite, or apatite. It does contain detectable quartz, a Fe-bearing carbonate mineral (siderite or ankerite or both), and a mineral with astrong diffraction at 11.15° 2θ, or 9.22 Å (Figure 11A). It had been suggested that this last diffraction came from a Mn-rich phosphate mineral [86], but it is now interpreted as representing a mixed talc-serpentine phyllosilicate [21,36,71]. The Groken XRD pattern shows no indication of any Mn- or P-bearing crystalline phases, which suggested that the nodules’ Mn and P were in the amorphous component.
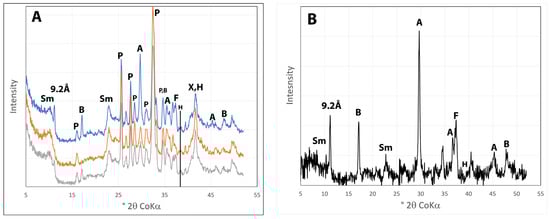
Figure 11.
CheMin X-ray diffraction. (A) Patterns for Groken (blue), Mary_Anning3 (brown), and Mary_Anning (gray), offset vertically for clarity. Diffraction peaks are from: Sm, smectite; 9.2 Å, talc-serpentine interlayer [36]; P: plagioclase; B: bassanite; A: anhydrite; H: hematite (strongest diffractions noted with line); X: pyroxenes; F: Fe-bearing carbonate (siderite and/or ankerite). Groken contains no detectable hematite. (B) Difference pattern, Groken minus Mary_Anning, scaled to eliminate peaks from plagioclase. All remaining peaks can be ascribed to Ca sulfates, pyroxenes, Fe-bearing carbonate, and the 9.22 Å phase. The background beneath the peaks is flat, implying that the composition and abundances of amorphous materials in Groken and Mary_Anning are essentially identical.
To test for the presence of Mn and P in the amorphous component of Groken, we compare the Groken and Mary_Anning patterns. Figure 11B shows the difference (subtraction) between those diffraction patterns, scaled to remove diffraction peaks from plagioclase. The peaks remaining in the difference XRD pattern can be ascribed to the 9.22 Å phase, bassanite, smectite, anhydrite, and pyroxenes (Figure 11B). As before, none of the remaining peaks can be ascribed to a phosphate mineral (recognizing that CheMin XRD cannot detect minerals with abundances below ~1% mass of the total).
Of equal importance is that the difference XRD pattern shows minimal variation in the background level between 15 and 45° 2θ, the location of the ‘amorphous hump. This implies that the amorphous materials in Groken and Mary_Anning have similar XRD behaviors and have abundances comparable to those of plagioclase. The XRD ‘hump’ of amorphous silicates (see Figure 11A) is at lower 2θ values than those of amorphous phosphates [87,88] and see Figure S8. If the amorphous material in Groken were rich in phosphate, the difference pattern should show a ‘swayback’ with negative values near ~26° 2θ (amorphous silicate) and positive values centered on ~38° 2θ (amorphous phosphate). The difference XRD pattern (Figure 11B), shows no obvious swayback or other variation; its simplest interpretation is that the amorphous material in Groken is essentially identical in composition and abundance to that in Mary_Anning. Thus, CheMin XRD data do not support the hypothesis that Groken’s amorphous material contains abundant P and Mn.
3.3.2. CheMin X-ray Fluorescence
The abundance of nodule material in the CheMin sample can be constrained by comparing APXS analyses of cuttings and surfaces with CheMin XRF data on the delivered material. As described above, CheMin collects XRF along with the XRD data; CheMin XRF spectra have much lower energy resolution than APXS spectra and have not been calibrated. Here, we use them semi-quantitatively to show that the Groken sample analyzed in CheMin contained minimal Mn-rich nodule material.
Figure 12A shows the CheMin XRF spectra for Groken, Mary_Anning, and Mary_Anning3, which all have peaks at energies corresponding to Kα radiations from Fe, Ti, and Ca. The MnKα X-ray energy is on the low-energy shoulder of the FeKα peak and only appears as a distinct peak in the Groken spectrum (Figure 12A). Unlike APXS spectra, XRF spectra from CheMin are not calibrated; there is no baseline for the counts at an element’s Kα energy in the absence of that element, and no function to convert X-ray counts to elemental abundance. However, because the calibration function should be approximately linear in this limited range of compositions, we can use CheMin XRF data for the Mary_Annings to test whether the Groken sample delivered to CheMin was enriched in Mn relative to the surrounding nodule-free rock.
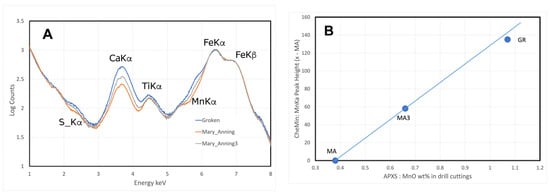
Figure 12.
CheMin X-ray Fluorescence. (A) XRF spectra for the three Mozie_Law drill samples, all for 45 h and direct vibration conditions. Note that the peak heights for FeKα are essentially identical and that the spectra show different heights for Mn, Ti, Ca, and S Kα peaks. (B) Comparing APXS and CheMin XRF for the drill samples. The ordinate is difference in counts for CheMin MnKα peak (part A) between each sample and Mary_Anning (MA), i.e., the difference value for Mary_Anning is zero. Blue line extends from MA through Mary_Anning3 (MA3) and beyond, showing anticipated linear correlation of CheMin and APXS abundances of Mn. The Groken (GR) sample falls close to that line, implying that the GR material delivered to CheMin had MnO comparable to that of the APXS analysis of the drill cuttings, which have similar MnO abundances of rock surfaced near Groken (Table 2).
For this test of whether the Groken drill sample contained a significant proportion of Mn-rich nodules, we compare its MnKα X-ray counts from CheMin with the APXS analysis of the Groken drill cuttings. Because we lack a ‘zero calibration’ for CheMin MnKα, we look at the difference in its counts between the Mary_Anning sample and the others (i.e., the difference value for Mary_Anning itself is zero). Data for this test are in Figure 12B, which graphs the difference in CheMin XRF counts at the MnKα peak energy against quantified MnO abundances (from APXS) of the drill cuttings for each sample. In Figure 12B, data for Mary_Anning and Mary_Anning3 define a linear relation between these quantities. Data for the Groken sample fall close to that linear relation, implying that the MnO abundance in the drill cuttings (by APXS) is a fair representation of the MnO abundance in the CheMin drill sample.
It is clear from Figure 12B that the Groken sample in CheMin was not greatly enriched in Mn, and hence contained little or no nodule material. Uncertainties here are difficult to quantify. If we take the Mary_Anning value for MnO as nodule-free rock, and the APXS deconvolution result for the MnO abundance in the nodules (Table 3), then the Groken CheMin sample contains ~4.5% wt. of sulfate-free nodule material. If we take instead the Mary_Anning3 value for MnO as nodule-free, then the Groken CheMin sample contains only ~2.5% weight of sulfate-free nodule material. And, if we take APXS analyses of rock surfaces in the Groken area (Table 3) as nodule-free, then the Groken CheMin sample is also nodule-free.
3.3.3. SAM
Results from SAM could indicate the presence of Mn-phosphate, oxidized Mn (e.g., Mn4+), or other substances in the nodules, commonly at proportions below what CheMin can detect. Most Mn-phosphate minerals from sedimentary and diagenetic settings contain waters of hydration; and their dehydrations would presumably be detectable by SAM, but there is nearly no reference data for the hydrate minerals of Table 2. Differential thermal analysis (DTA) of vivianite [Fe2+3(PO4)2·8H2O] shows a first thermal dehydration below 250 °C [89]. Thermogravimetry of the related minerals metavivianite [Fe2+Fe3+2(PO4)2(OH)2·6H2O, the ferrous equivalent of strunzite] and correianevesite [Fe2+Mn2+2(PO4)2·3H2O,] indicate dehydration below 200 °C and around 500 °C respectively [90,91]. Given these temperatures, it seems entirely reasonable strunzite itself (Table 2) or the more-hydrated laueite (Table 2) would dehydrate at temperatures reachable by SAM, and give H2O releases different from those of other hydrous phases in Glen Torridon samples. SAM analyses of the Groken, Mary_Anning, and Mary_Anning2 samples are detailed in [65,66], and we excerpt their results.
The thermal release patterns for H2O in the Groken and Mary_Anning samples above ~250 °C are very similar; see Figures 4 and 5 of [65]. These releases are interpreted as dehydration(s) of smectite clays. The Groken sample shows a slight additional release between 600 and 750 °C, which is attributed to the talc-serpentine interlayered phase [36,66]. Below ~250 °C, the Groken sample has a significant H2O release centered at ~150 °C, which is consistent with thermal decomposition of bassanite [65], a mineral which is fairly abundant in Groken (Figure 11A). There is no indication of the H2O release of any other phase, including phosphates, in the Groken sample.
For most other evolved gases, the Groken and Mary_Anning samples are effectively identical [65], including SO2, CO2, and CO. The CO2 and CO releases from Groken are essentially identical to those of Mary_Anning, but at about half the abundance, suggesting that Groken had less organic matter than Mary_Anning [66]. The Groken and Mary_Anning samples show undetectable O2 releases, which had been taken to imply that the Groken nodules minerals do not contain Mn3+ or Mn4+ (e.g., as in pyrolusite or todorokite). The HCl release from Mary_Anning samples is distinct from that of Groken. The Mary_Anning samples have a strong release starting at ~300 °C, peaking at ~500 °C, and tailing slowly down at higher temperatures; this release is assigned to trace chlorides reacting with hydrous phases in the sample. On the other hand, the Groken sample shows no sign of the ~500 °C release but has much smaller HCl releases centered at ~150 and 775 °C. The former release could result from the H2O from dehydration of bassanite reacting with chloride in the sample, the latter could be from the melting or decomposition of NaCl in the presence of H2O [65]. In any case, these SAM gas releases provide no evidence for the presence of Mn-P nodule material in the drill sample.
3.3.4. Reflectance Spectra
As shown in Figure 10A, the Groken drill cuttings have greater relative reflectance than, but identical shape to, the rock surface adjacent to the drill hole. The greater reflectance is expected because of the fine grain size of the cuttings. If the cuttings contained a significant proportion of dark nodule material, they should have lower reflectance than the rock without nodules. As before, these data do not show that the cuttings contained no nodule material, only that the proportion of nodule was too small to affect the cuttings’ VNIR reflectance.
3.3.5. Drill Engineering Data
Curiosity collects engineering data during drilling, including the progress of penetration as a function of time. Drill progress depends on the strength (i.e., scratch hardness and fracture toughness) of the target, but also another parameter unrelated to rock properties (e.g., pressure on the bit, percussion level, and side load on drill stem). With caution, then, drill progress can be used as a rough, qualitative indication of rock strength and the absence of other issues. For the Groken target, one might expect the dark nodules to be stronger than their host, given their resistance to aeolian abrasion; if the drill penetrated nodule material, one might then see a decrease in penetration rate. However, we cannot know if the nodules’ resistance to aeolian abrasion translates to increased strength detectable during drilling.
To assess drill data in terms of the presence of nodules, Figure 13 shows drill penetration depth versus time for Groken compared to the Mary_Anning and Mary_Anning3 drill holes. All drill holes show similar progress rates for the first 25 to 32 mm (rotary drilling only), consistent with penetrating rock of similar strengths. The small variations in penetration rates are similar for all drills and there is no indication that the Groken drill hole traversed material stronger than anything in the Mary_Anning holes. Recognizing the many factors that can affect drill progress, the most definitive conclusion possible is that drill data provide no evidence that the Groken hole penetrated nodule material.
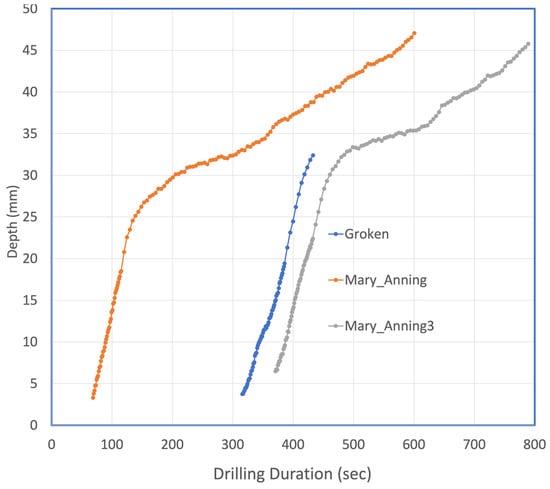
Figure 13.
Penetration depth versus time for the drill holes on the Mozie_Law bedrock slab. Time starts at beginning ‘Start Hole’ activity; data is shown only from beginning of ‘Drilling’ activity. All drill holes progressed at approximately the same rate and with same degree of variability for their first 25 to 30 mm, whether the target rock had nodules (Groken) or not (Mary_Anning and Mary_Anning3). The Groken drill hole was completed with only rotary drilling; i.e., no percussion. The Groken target broke at ~20 mm penetration (compare Figure 2B,C). Both Mary_Anning drill holes required percussion, which is seen as their quicker penetration rates below 25–30 mm depths.
3.3.6. Nodule Material in the Groken Drill Sample?
To summarize this section, there is no evidence that the Groken drill sample contained any nodule material. CheMin and SAM analyses, which are of the drill material, show no evidence of detectable Mn above that of the local non-nodular rock, no amorphous material different from the local rock, and no volatile releases beyond those seen in the local rock and expected from the 9.22 Å phyllosilicate. We lack APXS analyses of the Groken drill sample, but the drill cuttings around the drill hole are not distinct from the surrounding non-nodular rock. One cannot say that the drill sample contained absolutely no nodule material, only that nodule material was not detectable with any of the instruments on Curiosity.
3.4. Summary: What Are the Nodules Now?
Consideration of all relevant rover data provide a significant, albeit incomplete, characterization of the Groken nodules.
3.4.1. Geology
The Groken nodules commonly appear angular and elongate, with sharp corners, up to millimeters in length, and dark toned (Figure 3, Figure 4 and Figure 5). They are present only in some mm-thick sediment layers in the Groken area (Figure 3, Figure 4 and Figure 5) and not observed anywhere else (so far) in Gale Crater. The nodules protrude from the surrounding surfaces, indicating that they are relatively resistant to aeolian abrasion. The abundance of dark nodules varies layer by layer (Figure 4 and Figure 5), covering from a maximum of ~12% of a layer [40] to being completely absent. In layers where present, the nodules appear to be randomly distributed and show no preferred orientations (Figure 4 and Figure 5). Some nodules extend through sedimentary layers and do not appear to distort or disturb the layers near those penetrations (Figure 5).
3.4.2. Drill Sample—Minimal Nodule Material
As described above, there is no evidence that the Groken drill hole encountered dark nodule material, or that the rock powder sample delivered to CheMin and SAM contained detectable nodule material. Unfortunately, this means that we lack CheMin’s X-ray diffraction constraints on the minerals and amorphous material in the nodules, SAM’s constraints on mineral devolatilization, SAM’s constraints on organic compounds, and SAM’s determination of element isotope ratios.
3.4.3. Mineralogy
With available data, the mineralogy of the nodules can be constrained directly only by reflectance spectra and chemistry. Visible to near-infrared reflectance spectra from Mastcam and ChemCam-passive are consistent with the presence of hematite and/or host rock plus a dark, spectrally neutral substance. The latter must lack absorption features between 400 and 1010 nm wavelengths, such as seen in a Mn-oxide mineral like pyrolusite, MnO2, (e.g., Figure 9A). LIBS data show that the nodules contain Mn and P in separate substances (Table 4). The APXS deconvolved composition of the nodules (Table 3) suggests that the nodules include a Ca-sulfate mineral, probably anhydrite. These data imply that the nodules now are multiphase mixtures; combining this inference with the angular compact shapes of the nodules suggests that they could be pseudomorphic replacements of some precursor mineral.
3.4.4. Chemical Composition
The chemical composition of the Groken nodules has been problematic because of apparent inconsistencies between APXS and ChemCam LIBS analyses (Table 3 and Table 4). For the Groken nodules, the analyses can be reconciled by accepting the LIBS results as qualitative and semi-quantitative constraints on the nodules’ bulk composition and accepting the APXS raster deconvolution as a quantitative composition of the non-silicate portion of the nodules.
The apparent inconsistencies between APXS and LIBS analyses of the nodules involve nearly all element abundances. The APXS deconvolution of the nodule composition shows zero SiO2, ~8% MnO, ~12% FeO, ~7% MgO, and ~20% CaO (Table 3). The direct LIBS analyses of nodules, in contrast, give ~45% SiO2, ~4.5% MnO, ~20% FeO, ~12% MgO, and ~2% CaO (Table 4; Figure 8, Figure 9, Figures S3 and S4). The abundances of Na2O, MgO, and Al2O3 in the deconvolved analysis have been ascribed to surface dust and not inherent to the nodules [40]; the same elements in the LIBS analyses are similar in all nodule targets, very little with depth (Figure S5), and thus are not ascribed to surface dust.
These discrepancies between APXS and LIBS compositions could reflect the difference between the analytical volumes probed by the methods. APXS analyses give the compositions of broad, thin volumes: ~20 mm diameter and less than approximately 0.1 mm deep [45]. LIBS analyses are of targets typically 0.1–0.3 mm in diameter and extend to depths of ~0.5 mm [48]. Given these analytical volumes, the APXS deconvolution and LIBS analyses could be reconciled if the rinds of the nodules were of the APXS deconvolution composition (Ca sulfate plus Mn-Fe-P material, no SiO2), while the nodule interiors consisted of sedimentary detritus (source of Si) cemented by material of the APXS deconvolution composition. Such Mn-Fe-rich rinds should be detectable in the first few shots of LIBS analyses but are not apparent in the depth profiles (Figure 8).
On the other hand, the deconvolution of the Ayton raster analyses involves several assumptions, although there is no reason to doubt the quality of its individual analyses. For example, the APXS deconvolution result would be close to that of the LIBS analyses if the proportion of nodules in each Ayton raster analysis were approximately twice what was measured (S. VanBommel, pers. comm.). Such a misestimation, however unlikely, could have several causes; the proportions of visible nodules were underestimated; the Ayton scan areas, as in Figure 9 of [40], were not located correctly; and/or the rock matrix contains small nodules that were not resolved in MALHI images (see Figure 3E) and so not counted as nodules. Of these options, the last seems most likely.
For the purposes here, it seems reasonable to accept LIBS analyses of the Groken nodules (Table 4, Figure 8) as representing their bulk composition(s) for elements that can currently be quantified (e.g., not P, H, Cl, etc.). The high and relatively constant Si and Al abundances in all nodule depth profiles (Figure 8B and Figure S5) convince us that Si and Al are essential constituents of the Groken nodules. The APXS Ayton deconvolution composition would then represent the non-silicate-aluminate portion of the nodules: Mn- and P-bearing materials, Ca sulfate, and possibly other Fe- and Mg-bearing phases. Inferring that the nodules’ bulk compositions contain abundant Si and Al (i.e., the LIBS analyses) implies that the nodules post-date deposition of the silicate sediment in Groken. In other words, the Groken nodules can be interpreted as cement, filling interstices among sediment particles. Similarly, the high abundance of CaSO4 in the matrix among the nodules and the low abundance of Ca in the nodules suggests that the CaSO4 is also a cement, which was deposited among the silt grain after the Mn-Fe-P nodules were deposited.
4. Discussion: What Were the Nodules Originally?
Having described the Groken nodules as well as possible with available data and inferred that they are not now as they once were (i.e., they are pseudomorphs), it is important to constrain what the nodules might have been and how they might have formed. Here, we enter the realm of informed speculation and attempt to develop self-consistent stories for the nodules’ geology and history based on the facts above, theoretical constraints, and analogies from comparable occurrences on Earth. Our plan is to identify a possible precursor mineral for the Groken nodules, suggest what its precursor might have been based on Earth analogs, suggest what the sources of phosphorus and manganese might have been, and finally suggest original geological settings for nodule formation.
4.1. Precursor Mineral: Molar P/Mn = 2
The strongest constraint on the identity of the mineral precursor to the Groken nodules is their deconvolved APXS composition, which has high concentrations of P, Mn, Fe, and Mg and molar P/Mn = 2 (Table 3, Figure 6). The Na, Al, and Mg in the deconvolved composition have been assigned to dust [40], and the Ca and S are assigned to anhydrite and/or bassanite. Because the P/Mn ratio is a small integer, we infer that the precursor material was crystalline, i.e., a mineral with that ratio dictated by its crystal structure.
Because the stoichiometric ratio is P/Mn and not P/(Mn+Fe), Fe in the nodule precursor must have been unable to substitute for Mn2+. Divalent manganese, Mn2+, can substitute extensively for ferrous iron (Fe2+) in vivianite [91] and in many other minerals [92,93,94,95]. Complete separation of Mn from Fe is most plausible if the iron had been oxidized, Fe3+, as in the minerals of Table 5. Fairfieldite does not contain ferric iron, yet the same constraint holds because its Mn2+ can be replaced by Fe2+ as a messelite component, Ca2Fe2+(PO4)2·2H2O [96]. Some mineral compositions in the jahnsite-whiteite group have P/Mn = 2 [86], but the jahnsite-whiteite structure supports so many elemental substitutions that it would be coincidental for a natural mineral of that group to have P/Mn = 2. This rejection of jahnsite as a possible Groken mineral is consistent with, and independent of, the thermochemical analysis of [71].
Table 5.
Possible Groken minerals with molar P/Mn = 2 1.
Because the stoichiometric ratio is P/Mn, and not P/(Mn+Mg), Mg in the nodule precursor must have been unable or unavailable to substitute for Mn in the phosphate. Mn and Mg could be separated by valence at high oxidation states, for example, Mn4+ versus Mg2+, but no known minerals contain Mn4+ and have P/Mn = 2. The Mn2+ ion is larger than Mg2+ [97], which strongly restricts its capacity for substitution in phyllosilicates like clays [98]. Thus, we suggest that Mg in the nodules had been sequestered into phyllosilicates [36] and so was unavailable to substitute into the Mn-bearing phosphate.
4.1.1. Laueite/Strunzite
Among the possible Groken precursor minerals of Table 5, we focus on laueite and strunzite because they are found on Earth in sedimentary diagenetic environments. Laueite and strunzite were first described from altered pegmatite (silicic igneous) material [99,100], and are “… common late-stage hydrothermal mineral[s] in oxidized triphylite-bearing complex granite pegmatites” [96]. Laueite and strunzite also occur, though uncommonly to rarely, in other environments (Table 5). Their most common non-pegmatite occurrences are as alteration products of manganoan vivianite, (Fe2+,Mn2+)3(PO4)2·8H2O, in lake and ocean sediments [72,101,102]. The polymorphs of laueite (Table 5) are rare and reported (nearly without exception) as hydrothermal alteration minerals in granitic pegmatites and aplites [103]. The other minerals in Table 5 are rare and found even more rarely outside of hydrothermally altered zones of pegmatites. Calcium-bearing Mn-P minerals are apparently excluded from both the find of equimolar CaO and SO3 in the nodule composition (Table 3) and the LIBS observation that high-Mn points have low CaO abundances (Figure 8A,C and Figure 9B).
However, the composition of the Groken nodules (by APXS deconvolution or LIBS extrapolation) does not have the Fe/Mn ratio expected of laueite or strunzite. Both minerals have molar Fe/Mn = 2, but the APXS deconvolved and extrapolated LIBS compositions have Fe/Mn of 1.6 and ~1.0, respectively (Table 3, Figure 9). No known minerals correspond to these proportions of P, Mn, and Fe, and we are loathe to propose a new mineral on such limited data. Instead, we infer that Fe has been mobile (based on extensive evidence cited above) and thus that Fe could have been removed during alteration from a precursor P-Mn-Fe mineral.
4.1.2. Aqueous Solution Model
Continuing with the inference that the Groken nodules were, or included, laueite and/or strunzite, we explore their stability in aqueous solutions, such as might have been present when the nodules formed or were altered. All Geochemist’s Workbench models were run for 25 °C, 1 bar total pressure, and a water activity of unity, i.e., relatively dilute solutions. We assume that chemical equilibria were reached in all cases, although redox reactions (like Fe3+ + e− ⇔ Fe2+) are commonly hindered or slow. Following common practice, stability relations were explored as functions of solution oxidation potential (fugacity of O2 gas, ƒO2) and pH (similar to Pourbaix diagrams) for a range of activities or concentrations of Mn, Fe, and P. Here, we consider aqueous solutions only with these elements, unlike the models of [26] and [40] which start with a water composition adapted from those in terrestrial basaltic aquifers. We also differ from the work of [73] in not considering transport (fluid flow) or dissolution/precipitation rates.
Graphs of Fe-Mn-PO4-H2O mineral stabilities, as functions of ƒO2 and pH, are given in Figure 14 and Figure S9 for a few combinations of the activities and abundances of the elements. Figure S9 shows composite stability diagrams (calculated with GWB’s Act2 program), which show the most thermodynamically stable solids and predominant aqueous species for activities of given components (e.g., Fe2+) and those swapped into the calculation (e.g., Fe3+) in response to changing pH or oxygen fugacity. Figure 14 shows mineral assemblage diagrams (calculated with GWB’s Phase2 program), which show all thermodynamically stable solid phases predicted to be present for a given initial bulk solution composition, pH, and oxygen fugacity. Figure 14A and Figure S9A have nearly identical starting activities and compositions and illustrate the differences between the approaches. In the calculations of Figure S9, Mn oxide phases are not considered; they are included in the calculations of Figure 14 and appear for the most part as accompaniments to hematite.
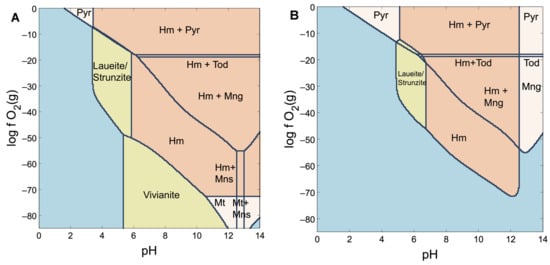
Figure 14.
Mineral assemblage diagrams, relevant to stability of laueite/strunzite and other minerals in aqueous solutions with Fe, Mn, and PO4, calculated with the GWB Phase2 program. Diagrams for 25 °C, 1 bar pressure, and dilute solutions. Olive color—phosphate solids; pink—fields with hematite; Blue—solution only (see Figure S9). Abbreviations: Hm, hematite; Pyr, pyrolusite; Tod, todorokite; Mng, manganite; Mt, magnetite; Mns, manganosite. (A) Solid assemblage diagram for log initial molarities of P, −2.8; Mn, −3; Fe, −6. Small field of ‘laueite/strunzite + hematite’ not labeled. Compare to Figure S9A. At lower abundances of P (same Fe and Mn), laueite/strunzite are not stable. (B) Solid assemblage diagram, log initial molarities of P, −2.4; Mn, −4; Fe, −9. Small fields not labelled: laueite/strunzite + pryolusite; laueite/strunzite + todorokite; laueite/strunzite + manganite. Compare to Figure S9B.
In Figure 14, laueite and strunzite are calculated to be stable only at moderate-to-high oxidation states and neutral to moderately acidic pH. The figures show relations at P concentrations or species activities just above the appearance of laueite or strunzite; at lower concentrations or activities, neither laueite nor strunzite are stable. In all cases, laueite and strunzite are not predicted for pH > 7 nor at pH < 2. Likewise, laueite/strunzite are not predicted for log(ƒO2) values below ~−50 nor above ~−5; this corresponds to a range where iron is ferric (Fe3+) and some Mn is manganous (Mn2+).
The presence of an iron-bearing carbonate mineral in the Groken drill sample [36] further restricts possible chemical conditions, if the Fe-carbonate were coeval with and in equilibrium with the laueite or strunzite and/or their alteration products.
If the Fe-carbonate was siderite, FeCO3, the assemblage’s equilibrium would be restricted to conditions of high CO2 fugacity, low oxidation state, and low acidity, as exemplified by the reactions:
FeCO3 + H+ + ½ O2 + e− ⇔ FeO(OH) + CO2 and
2 FeCO3 + ½ O2 ⇔ Fe2O3 + 2 CO2.
In general, siderite stability requires pH values greater than ~5 and oxygen gas fugacities below ~10−50, see Figure 14 and Figure S9 [104,105,106]. The stability field of laueite and strunzite would intersect minimally, if at all, with that of siderite (Figure 14 and Figure S9), which would suggest that siderite would not be present in the nodules, would be relict, or would have post-dated formation of the laueite/strunzite.
The Mary_Anning and Mary_Anning3 drill samples contain siderite and hematite in quantities detectable by CheMin [36], suggesting that their chemical conditions might be described by the latter equilibrium. It is possible that early siderite in these rocks was partially oxidized to hematite after deposition, and even under present-day exposure to Mars’ atmosphere. However, the Groken drill sample contains Fe-bearing carbonate but no detectable hematite, suggesting slightly more reduced conditions.
If the Fe-bearing carbonate was ankerite, CaFe(CO3)2, somewhat higher oxidation states would be possible, but cannot be quantified because the GWB thermochemical database does not include ankerite. It still is not obvious how much of the iron mineralogy of the Groken drill sample is also present in the nodules.
The diagrams of Figure 14 must be taken only as guides and not as quantitative representations of mineral stabilities. The thermochemical parameters for laueite and strunzite are estimated (see Supplementary Materials), and this estimation method yielded unreasonable stability fields for other minerals (reddingite, rockbridgeite, and vivianite-Mn). The thermochemical database does not include a few possible minerals (e.g., ludlamite). Also, calculations for the figures do not include possible solid solutions, especially that of Mn in vivianite. Natural vivianites commonly contain significant Mn, so the stability fields of natural vivianites are likely larger than in the figures. Recognizing these shortcomings, we press onward.
4.2. Precursor to Laueite And/Or Strunzite?
The minerals laueite and strunzite are consistent with chemical constraints on the nodules’ composition and can be stable under credible and achievable chemical conditions (Figure 14 and Figure S9). But those minerals, uncommon as they are on Earth, are rarely if ever interpreted as primary—their settings and parageneses almost always suggest that they formed during the alteration of a precursor Mn-bearing phosphate mineral. In granitic igneous systems, laueite and strunzite are “ … common late-stage hydrothermal mineral(s) in oxidized triphylite-bearing complex granite pegmatites” [96]. In lacustrine and littoral environments on Earth, like those inferred for the Murray formation in Gale crater, laueite, and strunzite have been reported as alteration products of manganoan vivianite and ludlamite, (Fe,Mn,Mg)3(PO4)2·8H2O, and (Fe,Mn,Mg)3(PO4)2·4H2O, respectively [72,101,102,107]; vivianite is far more common than ludlamite. On Earth, vivianite and ludlamite in lacustrine environments are typically interpreted as primary precipitates in the sediments [101,107,108,109,110,111] and more rarely directly from lake water [112]. This lacustrine vivianite is commonly manganoan [72,101,102,109].
By analogy with these terrestrial occurrences, we speculate that the angular Fe-Mn-P nodules in the Gale crater were originally crystals of manganoan vivianite. The outlines of the Groken nodules, as in Figure 5D, are consistent with those of vivianite single crystals, oriented perpendicular to their (010) faces, and showing the angle between their (001) and (100) faces [113,114,115], see Figure S10.
4.3. Conditions for Vivianite Crystallization
Accepting the speculation that the Groken nodules were originally manganoan vivianite, several questions remain. What were the sources of the manganese and phosphorus? Could carbonaceous matter be involved (as commonly is on Earth)? And, why are the nodules so localized, both in space (only Groken) and time (i.e., by sedimentary laminae, Figure 3, Figure 4 and Figure 5)?
4.3.1. Elemental Mobility and Sources
There is extensive evidence for element mobility in rocks of the Glen Torridon area, notably of iron, manganese, and phosphorus [8,16,26,34,36,116,117]. This evidence includes (among others) diagenetic nodules of several sorts, replacement features obscuring sedimentary laminations, fillings of fractures and cracks, and cement. The sediment pile in Gale Crater, the Murray formation underlying the Knockfarrill Hill member, provides a ready source for these elements. Almost all the sediments in Gale Crater are basaltic in composition, altered to varying degrees. Like their martian basalt precursors, they are relatively rich in iron, manganese, and phosphorus compared to terrestrial basalts [118], and so can source these elements to mobile aqueous fluids. Iron is especially mobile across the Murray formation, as documented across the Knockfarrill Hill member [8,34] and the nearby Vera Rubin Ridge [18,19]. Manganese has been redistributed across the Murray formation, broadly removed from the bulk rock, and concentrated in veinlets and nodules [28,83,117]. There is evidence for coupled mobility of phosphorus and manganese, beyond the Groken nodules, in a few rock targets in the Mt. Sharp group; the two strongest examples are the Jones_Marsh nodules or veinlet on Vera Rubin Ridge (sol 1727; P2O5 = 7.6 wt%; MnO = 4.0 wt%, Figure 6B) and the Maple_Spring nodule in the Sutton Island member (sol 1679; P2O5 = 3.0 wt%; MnO = 1.2 wt%), see [33,43]. Phosphorus mobility that was decoupled from manganese is also apparent in P-rich, Mn-depleted, and fracture-associated haloes in the Stimson formation [24], in the vein-hosting wallrock of the Garden City vein complex of the Pahrump Hills member (Kern Peak; sol 948; P2O5 = 2.7 wt%; MnO = 0.2 wt%) and in several P-rich dark-toned veins and nodules [25,119]. Elsewhere on Mars, phosphorus appears to have been significantly mobile in the Wishstone-class rocks of Gusev Crater [120]. The source of the aqueous phosphate could be the dissolution of igneous apatite [121] or basaltic glass in the sediments.
Diagenesis, and hence elemental mobility, in Glen Torridon appears in a variety of textural patterns [8]. In many areas, diagenetic concretions and nodules are pervasive in rocks, e.g., [35,122]. This pattern suggests that the diagenetic fluids suffused through the sediments, penetrating among the sediment grains. Other diagenetic features include Mn-rich veins or crack-fills like the Stephen target, and nodules rich in Mn and P like the targets Jones_Marsh and Maple_Spring [26,83], suggesting that the flow of those fluids was focused. Such focused flows of fluids could appear at the sediment surface as a spring with associated deposits [123,124,125,126], enriched in this case in Mn and P.
4.3.2. Carbonaceous Matter?
On Earth, vivianite formation is commonly localized around carbonaceous material, and around phosphatic matter like bones, shells, and teeth. Quoting [127]:
“Direct association of vivianite crystal aggregates with organic remains appears to be a common feature, although it is not ubiquitous. Ref. [128] detected spherical vivianite nodules in a bog lake (Lake Ursee, Germany) and some of these nodules were grown on the remains of leaves and fibers. Ref. [129] found vivianite associated with decaying roots, or alone inside root channels in a soft bog of the Belgian Campine. Ref. [130] reported vivianite encrusting fragments of decayed wood and fossil bone in swamp, lake, and surface deposits of the Auckland area (New Zealand), and recently, [131] demonstrated that vivianite crystal aggregates grow on and within decaying rice roots in a paddy field soil, Japan. Also, ref. [132] reported that vivianite frequently replaces leaves and fecal pellets in lacustrine clayey diatomite deposits in Thessaly, Central Greece. Moreover, vivianite has been identified in teeth and bones of dead bodies buried in waterlogged conditions, in close proximity to a source of Fe, see [133].”
Other reports of vivianite associated with biogenic matter include [102,107,134,135].
Despite the common association of vivianite with biogenic matter on Earth, it is not required for vivianite formation [127], and the Groken and Mary_Anning drill samples do not contain abundant organics [66]. One could hypothesize that the Groken nodules were induced by scraps of organic material that were either not sampled in drilling or were consumed during nodule formation. If so, that organic matter could have been biogenic, or possibly fragments of infallen carbonaceous chondrite meteorites. However, there is no evidence to support either notion, and it seems reasonable that the formation of the Groken Fe-Mn-phosphate did not involve organic or biogenic materials.
4.3.3. Vivianite as a Cement
The chemical composition of the Groken nodules, as shown by direct LIBS analyses (and APXS deconvolution), is essentially that of the host siltstone, plus Mn-Fe phosphate and minus CaSO4 (Table 3 and Table 4; Figure 7, Figure 8 and Figure 9). We interpret the LIBS composition to mean that the nodules consist of siltstone plus Fe-Mn-P minerals and infer that the latter is a cement-filling void space among the silt grains—i.e., in a poikilotopic texture. On Earth, gypsum (CaSO4·2H2O) and barite (BaSO4) commonly form such clast-filled “sand crystals” [136,137]. On Earth, diagenetic vivianite forms most commonly as concretions or replacements and is known rarely to form space-filling or poikilotopic grains [107,138,139,140]. Thus, our inference of poikilotopic vivianite cement is plausible.
4.3.4. Localization
The final question is why the Mn-Fe-P nodules are so localized, having been found only at one location and there only in a few sedimentary laminae. Why only here at Groken, and nowhere else in Glen Torridon? And, elsewhere, why only at Jones_Marsh and Maple_Spring on Vera Rubin ridge? These questions cannot be answered with certainty, and perhaps could not even if Curiosity could return to the Knockfarfill Hill for extensive Earth-style field study. Yet, the available data allow us to reject some hypotheses, and terrestrial analogs suggest some possible reasons for the limited distribution of Groken-style nodules.
The Mn-Fe-P nodules cannot be related to the widely-distributed pervasive diagenetic processes that affected Glen Torridon rocks [8,34]. Those processes are marked mostly by enrichments in Ca-sulfates and/or iron oxides (nodules or cement), rarely by manganese, and never by phosphorus (as noted so far). On Earth, enrichments in Mn and P are commonly related to redox boundaries, or other water–chemistry boundaries, above and in sediments, e.g., [110,141,142,143], such as have been inferred for the Gale Crater lake [36,144]. However, one would expect deposits from such a boundary to be widespread, either at the sediment–water interface or pervasively in the sediments.
The restricted distribution of the Groken nodules suggests a localized source of elements or chemical conditions (e.g., pH or redox) that allowed the deposition of the nodules’ precursors. One could imagine a local-focused source of Mn (and/or P) in the vicinity and time of deposition of Mozie_Law sediments, perhaps a spring or seep of alkaline, reduced groundwater. Mixing of that groundwater with ambient lake water, more acidic and oxidized, could have induced precipitation of Mn-bearing minerals like vivianite. The presence or absence of nodule precursors in adjacent sediment laminae could reflect variations in deposition rate, water flow direction, or even catalytic particles (like organic matter).
5. Implications: Speculative History
For the Groken nodules, the Curiosity rover was unable to collect sufficient data to allow a complete, well-justified history of their origin and development. Unfortunately, the Groken drill sample contained minimal to no nodule material; a full study of the dark nodules would have required more time than was available and additional analytical instruments. Even so, the data in hand and terrestrial analogs allow a speculative self-consistent story.
At the time the Mozie_Law (Knockfarrill Hill) sediments were deposited (Figure 2), Mn and P were locally enriched in the water of the shallow Gale crater lake or its near-surface sediments, perhaps from a spring or seep of alkaline, reduced groundwater. These conditions allowed Mn-rich vivianite to crystallize in the freshly deposited sediments, filling pore spaces among the sediment grains. Cross-bedding and layer terminations in the sediments (Figure 4) suggest that some sediment layers containing these Mn-rich vivianite crystals were eroded, implying that the vivianite crystals were deposited before the sediment was fully lithified. The remaining Mn-rich vivianite crystals were buried as sedimentation continued. Thereafter, the sediments were cemented by calcium sulfate, as shown by the abundance of CaSO4 outside the nodules and its paucity in them (Table 4, Figure 8C). At some later time, the crystals were altered to laueite and/or strunzite (and probably Mg-rich phyllosilicates), producing the nodules’ distinctive P/Mn abundance ratio. The cause(s) and process(es) of this alteration are not known, nor whether they were related to other diagenetic processes and products in the Glen Torridon rocks. Later still, the nodules were oxidized and partially dehydrated to produce their current mineralogy as revealed by reflectance spectra: hematite and a dark substance, possibly pyrolusite. The current mineralogic host of the nodules’ phosphorus is not known; it could be amorphous material, or could possibly be strengite or phosphosiderite, Fe3+(PO4)·2H2O [145].
Although the Groken Mn-Fe-P nodules are unique (so far) in Gale Crater, and thus of relatively local significance, they provide insights and support for broader-scale models of the Gale Crater lake and its evolution [36,144]. In particular, the nodules’ evidence of the availability of phosphorus and manganese in the lake’s waters could be important for astrobiology—phosphorus being an essential constituent of many biomolecules and manganese being a common redox energy source for biological metabolism.
Supplementary Materials
The following supporting information can be downloaded at: https://www.mdpi.com/article/10.3390/min13091122/s1, 1. Text File: a. Chronology of events at and near Mozie_Law; b. Documentation of Mastcam multispectral observations; c. Additional LIBS data; d. X-ray diffraction data on amorphous phosphate material; e. Description of thermochemical data and calculations f. Morphology of vivianite crystals, compared to those of the Groken nodules. 2. ThermoddemV1.10_Groken_june2023.tdat file for Geochemist’s Workbench (GWB). 3. Spreadsheet [GrokenSupp3ThermoCalcData.xlsx] documenting calculations to estimate DGf and Ksp for Mn-Fe-P phases.
Author Contributions
Conceptualization, A.H.T. and N.L.L.; Methodology, all authors; Investigation, all authors; Resources, all authors; Data Curation, all authors; Writing—Original Draft Preparation, A.H.T.; Writing—Review and Editing, A.H.T.; Visualization, G.C.; Supervision, T.B.; Project Administration, A.V.; Funding Acquisition, A.V. All authors have read and agreed to the published version of the manuscript.
Funding
Funding for this work came from NASA’s Mars Exploration Program through the Mars Science Laboratory project, via their respective instrument PIs and the MSL Participating Scientist Program.
Data Availability Statement
All data reported here are available through the NASA Planetary Data System (PDS). ChemCam relative reflectance spectra can be found here: https://pds-geosciences.wustl.edu/msl/urn-nasa-pds-msl_chemcam_psv_calibrated/. CheMin data are also available at https://odr.io/chemin (all accessed 7 July 2023).
Acknowledgments
The authors acknowledge the support they received, and have received, from NASA’s Mars Exploration Program through the Mars Science Laboratory project, and their respective instrument PIs and the MSL participating scientist program (J.R. Johnson, 80NSSC22K0779). Part of this research was carried out at the Jet Propulsion Laboratory, California Institute of Technology, under a contract with the National Aeronautics and Space Administration (NASA). Treiman is grateful for contract support through the CheMin instrument. The Lunar and Planetary Institute (LPI) is operated by Universities Space Research Association (USRA) under a cooperative agreement with the Science Mission Directorate of NASA. We are grateful for corrections and comments from two anonymous reviewers. LPI Contribution No. 3000.
Conflicts of Interest
The authors declare no conflict of interest.
References
- Grotzinger, J.P.; Crisp, J.; Vasavada, A.R.; Anderson, R.C.; Baker, C.J.; Barry, R.; Blake, D.F.; Conrad, P.; Edgett, K.S.; Ferdowski, B. Mars Science Laboratory mission and science investigation. Space Sci. Rev. 2012, 170, 5–56. [Google Scholar]
- Grotzinger, J.P.; Crisp, J.A.; Vasavada, A.R. Curiosity’s mission of exploration at Gale Crater, Mars. Elements 2015, 11, 19–26. [Google Scholar]
- Vasavada, A.R. Mission overview and scientific contributions from the Mars Science Laboratory Curiosity rover after eight years of surface operations. Space Sci. Rev. 2022, 218, 14. [Google Scholar]
- Grotzinger, J.P.; Sumner, D.; Kah, L.; Stack, K.; Gupta, S.; Edgar, L.; Rubin, D.; Lewis, K.; Schieber, J.; Mangold, N. A habitable fluvio-lacustrine environment at Yellowknife Bay, Gale Crater, Mars. Science 2014, 343, 1242777. [Google Scholar]
- Grotzinger, J.P.; Gupta, S.; Malin, M.C.; Rubin, A.E.; Schieber, J.; Siebach, K.; Sumner, D.Y.; Stack, K.M.; Vasavada, A.R.; Arvidson, R.; et al. Deposition, exhumation, and paleoclimate of an ancient lake deposit, Gale Crater, Mars. Science 2015, 350, acc7575. [Google Scholar] [CrossRef]
- Stein, N.; Grotzinger, J.; Schieber, J.; Mangold, N.; Hallet, B.; Newsom, H.; Stack, K.; Berger, J.; Thompson, L.; Siebach, K. Desiccation cracks provide evidence of lake drying on Mars, Sutton Island member, Murray formation, Gale Crater. Geology 2018, 46, 515–518. [Google Scholar]
- Caravaca, G.; Mangold, N.; Dehouck, E.; Schieber, J.; Zaugg, L.; Bryk, A.B.; Fedo, C.M.; Le Mouélic, S.; Le Deit, L.; Banham, S.G. From lake to river: Documenting an environmental transition across the Jura/Knockfarril Hill members boundary in the Glen Torridon region of Gale Crater (Mars). J. Geophys. Res. Planets 2022, 127, e2021JE007093. [Google Scholar]
- Gasda, P.J.; Comellas, J.; Essunfeld, A.; Das, D.; Bryk, A.B.; Dehouck, E.; Schwenzer, S.P.; Crossey, L.; Herkenhoff, K.; Johnson, J. Overview of the morphology and chemistry of diagenetic features in the clay-rich Glen Torridon unit of Gale Crater, Mars. J. Geophys. Res. Planets 2022, 127, e2021JE007097. [Google Scholar]
- Edgar, L.; Rubin, D.; Schieber, J.; Gupta, S.; Williams, R.; Stack, K.; Rice, M.; Grotzinger, J.; Lewis, K.; Malin, M. Reconstructing ancient fluvial environments at the Balmville and Dingo Gap outcrops, Gale crater, Mars; American Geophysical Union: Washington, DC, USA, 2014; p. P42C-05. [Google Scholar]
- Nachon, M.; Clegg, S.; Mangold, N.; Schröder, S.; Kah, L.; Dromart, G.; Ollila, A.; Johnson, J.; Oehler, D.; Bridges, J. Calcium sulfate veins characterized by ChemCam/Curiosity at Gale crater, Mars. J. Geophys. Res. Planets 2014, 119, 1991–2016. [Google Scholar]
- Stack, K.; Grotzinger, J.; Kah, L.; Schmidt, M.; Mangold, N.; Edgett, K.; Sumner, D.; Siebach, K.; Nachon, M.; Lee, R. Diagenetic origin of nodules in the Sheepbed member, Yellowknife Bay formation, Gale crater, Mars. J. Geophys. Res. Planets 2014, 119, 1637–1664. [Google Scholar]
- Blaney, D.; Wiens, R.; Maurice, S.; Clegg, S.; Anderson, R.; Kah, L.; Le Mouelic, S.; Ollila, A.; Bridges, N.; Tokar, R. Chemistry and texture of the rocks at Rocknest, Gale Crater: Evidence for sedimentary origin and diagenetic alteration. J. Geophys. Res. Planets 2014, 119, 2109–2131. [Google Scholar]
- Siebach, K.; Grotzinger, J.; McLennan, S.; Hurowitz, J.; Ming, D.; Vaniman, D.; Rampe, E.; Blaney, D.; Kah, L. Constraining the texture and composition of pore-filling cements at Gale crater, Mars. In Proceedings of the Lunar and Planetary Science Conference 46th, The Woodlands, TX, USA, 16–20 March 2015; p. 2234. [Google Scholar]
- Schwenzer, S.P.; Bridges, J.C.; Wiens, R.C.; Conrad, P.G.; Kelley, S.; Leveille, R.; Mangold, N.; Martín-Torres, J.; McAdam, A.; Newsom, H. Fluids during diagenesis and sulfate vein formation in sediments at Gale crater, Mars. Meteorit. Planet. Sci. 2016, 51, 2175–2202. [Google Scholar]
- Le Deit, L.; Mangold, N.; Forni, O.; Cousin, A.; Lasue, J.; Schröder, S.; Weins, R.C.; Sumner, D.; Fabre, C.; Stack, K.M.; et al. The potassic sedimentary rocks in Gale crater, Mars as seen by ChemCam onboard Curiosity. J. Geophys. Res. 2016, 121, 784–804. [Google Scholar] [CrossRef]
- Sun, V.Z.; Stack, K.M.; Kah, L.C.; Thompson, L.; Fischer, W.; Williams, A.J.; Johnson, S.S.; Wiens, R.C.; Kronyak, R.E.; Nachon, M. Late-stage diagenetic concretions in the Murray formation, Gale crater, Mars. Icarus 2019, 321, 866–890. [Google Scholar]
- Rampe, E.B.; Blake, D.F.; Bristow, T.; Ming, D.W.; Vaniman, D.; Morris, R.; Achilles, C.; Chipera, S.; Morrison, S.; Tu, V. Mineralogy and geochemistry of sedimentary rocks and eolian sediments in Gale crater, Mars: A review after six Earth years of exploration with Curiosity. Geochemistry 2020, 80, 125605. [Google Scholar]
- Fraeman, A.A.; Edgar, L.A.; Rampe, E.B.; Thompson, L.M.; Frydenvang, J.; Fedo, C.M.; Catalano, J.G.; Dietrich, W.E.; Gabriel, T.S.; Vasavada, A. Evidence for a diagenetic origin of Vera Rubin ridge, Gale crater, Mars: Summary and synthesis of Curiosity’s exploration campaign. J. Geophys. Res. Planets 2020, 125, e2020JE006527. [Google Scholar]
- Caravaca, G.; Le Mouélic, S.; Mangold, N.; L’Haridon, J.; Le Deit, L.; Massé, M. 3D digital outcrop model reconstruction of the Kimberley outcrop (Gale Crater, Mars) and its integration into virtual reality for simulated geological analysis. Planet. Space Sci. 2020, 182, 104808. [Google Scholar]
- David, G.; Cousin, A.; Forni, O.; Meslin, P.Y.; Dehouck, E.; Mangold, N.; L’Haridon, J.; Rapin, W.; Gasnault, O.; Johnson, J. Analyses of high-iron sedimentary bedrock and diagenetic features observed with ChemCam at Vera Rubin ridge, Gale crater, Mars: Calibration and characterization. J. Geophys. Res. Planets 2020, 125, e2019JE006314. [Google Scholar]
- Bristow, T.; Grotzinger, J.P.; Rampe, E.; Cuadros, J.; Chipera, S.; Downs, G.; Fedo, C.M.; Frydenvang, J.; McAdam, A.; Morris, R. Brine-driven destruction of clay minerals in Gale crater, Mars. Science 2021, 373, 198–204. [Google Scholar]
- Sutter, B.; McAdam, A.; Wong, G.; Clark, J.; Archer, P.; Franz, H.; Gasda, P.; Ming, D.; Yen, A.; Lewis, J. Constraining alteration processes along the Siccar Point Group unconformity, Gale Crater, Mars: Results from the Sample Analysis at Mars instrument. J. Geophys. Res. Planets 2022, 127, e2022JE007387. [Google Scholar]
- Rampe, E.; Ming, D.; Morris, R.; Blake, D.; Bristow, T.; SJ, C.; Vaniman, D.; Yen, A.; Grotzinger, J.; Downs, R. Diagenesis in the Murray formation, Gale Crater, mM. Lunar Planet. Sci. Conf. 2016, 47, 2543. [Google Scholar]
- Yen, A.S.; Ming, D.W.; Vaniman, D.T.; Gellert, R.; Blake, D.F.; Morris, R.V.; Morrison, S.M.; Bristow, T.F.; Chipera, S.J.; Edgett, K.S. Multiple stages of aqueous alteration along fractures in mudstone and sandstone strata in Gale Crater, Mars. Earth Planet. Sci. Lett. 2017, 471, 186–198. [Google Scholar]
- Meslin, P.-Y.; Gasda, P.; L’Haridon, J.; Forni, O.; Lanza, N.; Lamm, S.; Johnson, J.; Wiens, R.; Thompson, L.; Rapin, W. Detection of hydrous manganese and iron oxides with variable phosphorus and magnesium contents in the lacustrine sediments of the Murray Formation, Gale, Mars. Lunar Planet. Sci. Conf. 2018, 49, 1447. [Google Scholar]
- Berger, J.A.; King, P.L.; Gellert, R.; Clark, B.C.; Flood, V.A.; McCraig, M.A.; Ming, D.W.; O’Connell-Cooper, C.D.; Schmidt, M.E.; Thompson, L.M.; et al. Manganese mobility in Gale Crater, Mars: Leached bdrock and localized enrichments. J. Geophys. Res. Planets 2022, 127, e2021JE00717. [Google Scholar] [CrossRef]
- Meslin, P.-Y.; Forni, O.; Loche, M.; Fabre, S.; Lanza, N.; Gasda, P.; Treiman, A.; Berger, J.; Cousin, A.; Gasnault, O. Overview of secondary phosphate facies observed by Chemcam in Gale Crater, Mars. EGU Gen. Assem. Conf. 2022, 2022, EGU22-6613. [Google Scholar]
- Berger, J.A.; Gellert, R.; Boyd, N.I.; King, P.L.; McCraig, M.A.; O’Connell-Cooper, C.D.; Schmidt, M.E.; Spray, J.G.; Thompson, L.M.; VanBommel, S.J. Elemental composition and chemical evolution of geologic materials in Gale Crater, Mars: APXS results from Bradbury landing to the Vera Rubin ridge. J. Geophys. Res. Planets 2020, 125, e2020JE006536. [Google Scholar]
- L’Haridon, J.; Mangold, N.; Meslin, P.-Y.; Johnson, J.; Rapin, W.; Forni, O.; Cousin, A.; Payré, V.; Dehouck, E.; Nachon, M. Chemical variability in mineralized veins observed by ChemCam on the lower slopes of Mount Sharp in Gale crater, Mars. Icarus 2018, 311, 69–86. [Google Scholar]
- Johnson, J.E.; Webb, S.M.; Thomas, K.; Ono, S.; Kirschvink, J.L.; Fischer, W.W. Manganese-oxidizing photosynthesis before the rise of cyanobacteria. Proc. Natl. Acad. Sci. USA 2013, 110, 11238–11243. [Google Scholar]
- Lingappa, U.F.; Yeager, C.M.; Sharma, A.; Lanza, N.L.; Morales, D.P.; Xie, G.; Atencio, A.D.; Chadwick, G.L.; Monteverde, D.R.; Magyar, J.S. An ecophysiological explanation for manganese enrichment in rock varnish. Proc. Natl. Acad. Sci. USA 2021, 118, e2025188118. [Google Scholar]
- Bennett, K.A.; Fox, V.K.; Bryk, A.; Dietrich, W.; Fedo, C.; Edgar, L.; Thorpe, M.T.; Williams, A.J.; Wong, G.M.; Dehouck, E. The Curiosity Rover’s exploration of Glen Torridon, Gale crater, Mars: An overview of the campaign and scientific results. J. Geophys. Res. Planets 2023, 128, e2022JE007185. [Google Scholar] [PubMed]
- Thompson, L.M.; Berger, J.A.; Spray, J.G.; Fraeman, A.A.; McCraig, M.A.; O’Connell-Cooper, C.; Schmidt, M.E.; VanBommel, S.J.; Gellert, R.; Yen, A.; et al. APXS-derived compositional characteristics of the Vera Rubin Ridge, Gale crater, Mars: Geochemical implications for the origin of the ridge. J. Geophys. Res. Planets 2020, 125, e2019JE006319. [Google Scholar]
- Dehouck, E.; Cousin, A.; Mangold, N.; Frydenvang, J.; Gasnault, O.; Forni, O.; Rapin, W.; Gasda, P.J.; Caravaca, G.; David, G. Bedrock geochemistry and alteration history of the clay-bearing Glen Torridon region of Gale crater, Mars. J. Geophys. Res. Planets 2022, 127, e2021JE007103. [Google Scholar]
- Cardenas, B.T.; Grotzinger, J.P.; Lamb, M.P.; Lewis, K.W.; Fedo, C.M.; Bryk, A.B.; Dietrich, W.E.; Stein, N.; Turner, M.; Caravaca, G. Barform deposits of the Carolyn Shoemaker formation, Gale crater, Mars. J. Sediment. Res. 2022, 92, 1071–1092. [Google Scholar]
- Thorpe, M.T.; Bristow, T.F.; Rampe, E.B.; Tosca, N.J.; Grotzinger, J.P.; Bennett, K.; Achilles, C.N.; Blake, D.F.; Chipera, S.; Downs, G.; et al. Mars Science Laboratory CheMin data from the Glen Torridon region and the significance of lake-groundwater interactions in interpreting mineralogy and sedimentary history. J. Geophys. Res. Planets 2022, 127, e2021JE007099. [Google Scholar]
- Malin, M.C.; Ravine, M.A.; Caplinger, M.A.; Tony Ghaemi, F.; Schaffner, J.A.; Maki, J.N.; Bell III, J.F.; Cameron, J.F.; Dietrich, W.E.; Edgett, K.S. The Mars Science Laboratory (MSL) mast cameras and descent imager: Investigation and instrument descriptions. Earth Space Sci. 2017, 4, 506–539. [Google Scholar]
- Bell III, J.F.; Godber, A.; McNair, S.; Caplinger, M.; Maki, J.; Lemmon, M.; Van Beek, J.; Malin, M.; Wellington, D.; Kinch, K. The Mars Science Laboratory Curiosity rover Mastcam instruments: Preflight and in-flight calibration, validation, and data archiving. Earth Space Sci. 2017, 4, 396–452. [Google Scholar] [CrossRef]
- Edgett, K.S.; Yingst, R.A.; Ravine, M.A.; Caplinger, M.A.; Maki, J.N.; Ghaemi, F.T.; Schaffner, J.A.; Bell, J.F.; Edwards, L.J.; Herkenhoff, K.E. Curiosity’s Mars hand lens imager (MAHLI) investigation. Space Sci. Rev. 2012, 170, 259–317. [Google Scholar]
- VanBommel, S.J.; Berger, J.A.; Gellert, R.; O’Connell-Cooper, C.D.; McCraig, M.A.; Thompson, L.M.; Fedo, C.M.; Des Marais, D.J.; Fey, D.M.; Yen, A.S.; et al. Elemental composition of manganese- and phosphorus-rich nodules in the Knockfarril Hill member, Gale Crater, Mars. Icarus 2023, 392, 115372. [Google Scholar]
- Gellert, R.; Clark, B.C. In-situ compositional measurements of rocks and soils with the Alpha Particle X-ray Spectrometer on NASA’s Mars rovers. Elements 2015, 11, 39–44. [Google Scholar] [CrossRef]
- Campbell, J.L.; Perrett, G.M.; Gellert, R.; Andrushenko, S.M.; Boyd, N.I.; Maxwell, J.A.; King, P.L.; Schofield, C.D. Calibration of the Mars Science Laboratory Alpha Particle X-ray Spectrometer. Space Sci. Rev. 2012, 170, 319–340. [Google Scholar] [CrossRef]
- VanBommel, S.J.; Gellert, R.; Berger, J.A.; Campbell, J.L.; Thompson, L.M.; Edgett, K.S.; McBride, M.J.; Minitti, M.E.; Pradler, I.; Boyd, N.I. Deconvolution of distinct lithology chemistry through oversampling with the Mars Science Laboratory Alpha Particle X-ray Spectrometer. X-ray Spectrom. 2016, 45, 155–161. [Google Scholar] [CrossRef]
- O’Connell-Cooper, C.D.; Thompson, L.M.; Spray, J.G.; Berger, J.A.; Gellert, R.; McCraig, M.; VanBommel, S.J.; Yen, A. Statistical analysis of APXS-derived chemistry of the clay-bearing Glen Torridon region and Mount Sharp group, Gale crater, Mars. J. Geophys. Res. Planets 2022, 127, e2021JE007177. [Google Scholar] [CrossRef]
- VanBommel, S.J.; Gellert, R.; Berger, J.; McCraig, M.; O’Connell-Cooper, C.; Thompson, L.; Yen, A.; Boyd, N.; Lanza, N.; Ollila, A. Constraining the chemical depth profile of a manganese-rich surface layer in Gale crater, Mars. Spectrochim. Acta Part B At. Spectrosc. 2022, 191, 106410. [Google Scholar] [CrossRef]
- Maurice, S.; Wiens, R.; Saccoccio, M.; Barraclough, B.; Gasnault, O.; Forni, O.; Mangold, N.; Baratoux, D.; Bender, S.; Berger, G.; et al. The ChemCam instrument suite on the Mars Science Laboratory (MSL) rover: Science objectives and mast unit description. Space Sci. Rev. 2012, 170, 95–166. [Google Scholar] [CrossRef]
- Wiens, R.C.; Maurice, S.; Barraclough, B.; Saccoccio, M.; Barkley, W.C.; Bell III, J.F.; Bender, S.; Bernardin, J.; Blaney, D.; Blank, J.; et al. The ChemCam instrument suite on the Mars Science Laboratory (MSL) rover: Body unit and combined system tests. Space Sci. Rev. 2012, 170, 167–227. [Google Scholar] [CrossRef]
- Chide, B.; Maurice, S.; Murdoch, N.; Lasue, J.; Bousquet, B.; Jacob, X.; Cousin, A.; Forni, O.; Gasnault, O.; Meslin, P.-Y. Listening to laser sparks: A link between Laser-Induced Breakdown Spectroscopy, acoustic measurements and crater morphology. Spectrochim. Acta Part B At. Spectrosc. 2019, 153, 50–60. [Google Scholar] [CrossRef]
- Wiens, R.C.; Maurice, S.; Lasue, J.; Forni, O.; Anderson, R.; Clegg, S.; Bender, S.; Blaney, D.; Barraclough, B.; Cousin, A. Pre-flight calibration and initial data processing for the ChemCam laser-induced breakdown spectroscopy instrument on the Mars Science Laboratory rover. Spectrochim. Acta Part B At. Spectrosc. 2013, 82, 1–27. [Google Scholar] [CrossRef]
- Clegg, S.M.; Wiens, R.C.; Anderson, R.; Forni, O.; Frydenvang, J.; Lasue, J.; Cousin, A.; Payré, V.; Boucher, T.; Dyar, M.D. Recalibration of the Mars Science Laboratory ChemCam instrument with an expanded geochemical database. Spectrochim. Acta Part B At. Spectrosc. 2017, 129, 64–85. [Google Scholar] [CrossRef]
- Gasda, P.J.; Anderson, R.B.; Cousin, A.; Forni, O.; Clegg, S.M.; Ollila, A.; Lanza, N.; Frydenvang, J.; Lamm, S.; Wiens, R.C. Quantification of manganese for ChemCam Mars and laboratory spectra using a multivariate model. Spectrochim. Acta Part B At. Spectrosc. 2021, 181, 106223. [Google Scholar] [CrossRef]
- Payré, V.; Cousin, A.; Anderson, D.E.; Thomas, N.H.; Rapin, W.; Beck, P.; Fabre, C.; Gasda, P.J.; Lasue, J.; Ollila, A.M.; et al. Review of trace and minor elements analyzed by ChemCam: Detection and quantification using laser induced breakdown spectroscopy. Lunar Planet. Sci. Conf. 2017, 48, 1963. [Google Scholar]
- Maurice, S.; Clegg, S.M.; Wiens, R.C.; Gasnault, O.; Rapin, W.; Forni, O.; Cousin, A.; Sautter, V.; Mangold, N.; Le Deit, L. ChemCam activities and discoveries during the nominal mission of the Mars Science Laboratory in Gale crater, Mars. J. Anal. At. Spectrom. 2016, 31, 863–889. [Google Scholar] [CrossRef]
- Payré, V.; Fabre, C.; Cousin, A.; Sautter, V.; Wiens, R.C.; Forni, O.; Gasnault, O.; Mangold, N.; Meslin, P.Y.; Lasue, J. Alkali trace elements in Gale crater, Mars, with ChemCam: Calibration update and geological implications. J. Geophys. Res. Planets 2017, 122, 650–679. [Google Scholar] [CrossRef]
- Johnson, J.R.; Bell III, J.; Bender, S.; Blaney, D.; Cloutis, E.; DeFlores, L.; Ehlmann, B.; Gasnault, O.; Gondet, B.; Kinch, K. ChemCam passive reflectance spectroscopy of surface materials at the Curiosity landing site, Mars. Icarus 2015, 249, 74–92. [Google Scholar] [CrossRef]
- Johnson, J.R.; Bell III, J.F.; Bender, S.; Blaney, D.; Cloutis, E.; Ehlmann, B.; Fraeman, A.; Gasnault, O.; Kinch, K.; Le Mouélic, S. Constraints on iron sulfate and iron oxide mineralogy from ChemCam visible/near-infrared reflectance spectroscopy of Mt. Sharp basal units, Gale Crater, Mars. Am. Mineral. 2016, 101, 1501–1514. [Google Scholar] [CrossRef]
- Fox, V.; Arvidson, R.; Jolliff, B.; Carpenter, P.; Catalano, J.; Hinkle, M.; Morris, R. Characterization of synthetic and natural manganese oxides as martian analogues. Lunar Planet. Sci. Conf. 2015, 46, 2132. [Google Scholar]
- Xin, Y.; Cao, H.; Liu, C.; Chen, J.; Liu, P.; Lu, Y.; Ling, Z. A systematic spectroscopic study of laboratory synthesized manganese oxides relevant to Mars. J. Raman Spectrosc. 2021, 53, 340–355. [Google Scholar] [CrossRef]
- Haber, J.T.; Horgan, B.; Fraeman, A.A.; Johnson, J.R.; Bell III, J.F.; Rice, M.S.; Seeger, C.; Mangold, N.; Thompson, L.; Wellington, D. Mineralogy of a possible ancient lakeshore in the Sutton Island member of Mt. Sharp, Gale crater, Mars, from Mastcam multispectral images. J. Geophys. Res. Planets 2022, 127, e2022JE007357. [Google Scholar] [CrossRef]
- Rice, M.S.; Seeger, C.; Bell, J.; Calef, F.; St. Clair, M.; Eng, A.; Fraeman, A.A.; Hughes, C.; Horgan, B.; Jacob, S. Spectral diversity of rocks and soils in Mastcam observations along the Curiosity rover’s traverse in Gale Crater, Mars. J. Geophys. Res. Planets 2022, 127, e2021JE007134. [Google Scholar] [CrossRef]
- Blake, D.F.; Vaniman, D.T.; Achilles, C.N.; Anderson, R.; Bish, D.L.; Bristow, T.F.; Chen, C.; Chipera, S.J.; Crisp, J.A.; Des Marais, D.; et al. Characterization and calibration of the CheMin mineralogical instrument on Mars Science Laboratory. Space Sci. Rev. 2012, 170, 341–399. [Google Scholar] [CrossRef]
- Anderson, R.C.; Jandura, L.; Okon, A.B.; Sunshine, D.; Roumeliotis, C.; Beegle, L.W.; Hurowitz, J.A.; Kennedy, B.; Limonadi, D.; McCloskey, S.; et al. Collecting samples in Gale Crater, Mars; An overview of the Mars Science Laboratory Sample Acquisition, Sample Processing and Handling System. Space Sci. Rev. 2012, 170, 57–75. [Google Scholar] [CrossRef]
- Morrison, S.M.; Downs, R.T.; Blake, D.F.; Prabhu, A.; Eleish, A.; Vaniman, D.T.; Ming, D.W.; Rampe, E.B.; Hazen, R.M.; Achilles, C.N. Relationships between unit-cell parameters and composition for rock-forming minerals on Earth, Mars, and other extraterrestrial bodies. Am. Mineral. 2018, 103, 848–856. [Google Scholar] [CrossRef]
- Mahaffy, P.R.; Webster, C.R.; Cabane, M.; Conrad, P.G.; Coll, P.; Atreya, S.K.; Arvey, R.; Barciniak, M.; Benna, M.; Bleacher, L. The Sample Analysis at Mars investigation and instrument suite. Space Sci. Rev. 2012, 170, 401–478. [Google Scholar] [CrossRef]
- McAdam, A.; Sutter, B.; Archer, P.; Franz, H.; Wong, G.; Lewis, J.; Clark, J.; Millan, M.; Williams, A.; Eigenbrode, J. Evolved gas analyses of sedimentary rocks from the Glen Torridon Clay-Bearing Unit, Gale crater, Mars: Results from the Mars Science Laboratory Sample Analysis at Mars Instrument Suite. J. Geophys. Res. Planets 2022, 127, e2022JE007179. [Google Scholar] [CrossRef]
- Millan, M.; Williams, A.J.; Mcadam, A.C.; Eigenbrode, J.L.; Steele, A.; Freissinet, C.; Glavin, D.P.; Szopa, C.; Buch, A.; Summons, R.E. Sedimentary organics in Glen Torridon, Gale Crater, Mars: Results from the SAM instrument suite and supporting laboratory analyses. J. Geophys. Res. Planets 2022, 127, e2021JE007107. [Google Scholar] [CrossRef]
- Verma, V.; Carsten, J.; Kuhn, S. The evolution of the Curiosity rover sampling chain. J. Field Robot. 2020, 37, 729–753. [Google Scholar] [CrossRef]
- Kinnett, R.; Green, T.; Klein, D.; Lin, M.R. Remote diagnosis and operational response to an in-flight failure of the drill feed mechanism onboard the Mars Science Laboratory Rover. In Proceedings of the 46th Aerospace Mechanisms Symposium, NASA Johnson Space Center, Houston, TX, USA, 13 May 2022; pp. 309–322. [Google Scholar]
- Bethke, C.M. Geochemical and Biogeochemical Reaction Modeling; Cambridge University Press: Cambridge, UK, 2022; p. 543. [Google Scholar]
- Vieillard, P.; Tardy, Y. Thermochemical properties of phosphates. In Phosphate Minerals; Springer: Berlin/Heidelberg, Germany, 1984; pp. 171–198. [Google Scholar]
- Drouet, C.; Loche, M.; Fabre, S.; Meslin, P.-Y. On the occurrence of jahnsite/whiteite phases on Mars: A thermodynamic study. Am. Mineral. 2022, 107, 1807–1817. [Google Scholar] [CrossRef]
- Nriagu, J.O.; Dell, C. Diagenetic formation of iron phosphates in recent lake sediments. Am. Mineral. 1974, 59, 934–946. [Google Scholar]
- Loche, M.; Fabre, S.; Meslin, P.-Y.; Cousin, A.; Lanza, N.; Kah, L.; Gasnault, O.; Maurice, S.; Wiens, R. Exploring the formation of the Mn-P-Fe-Mg enrichment of the Groken nodules in Gale Crater with source-to-sink geochemical modeling. Lunar Planet. Sci. Conf. 2022, 53, 1274. [Google Scholar]
- Drouet, C. A comprehensive guide to experimental and predicted thermodynamic properties of phosphate apatite minerals in view of applicative purposes. J. Chem. Thermodyn. 2015, 81, 143–159. [Google Scholar] [CrossRef]
- Drouet, C. Applied predictive thermodynamics (ThermAP). Part 2. Apatites containing Ni2+, Co2+, Mn2+, or Fe2+ ions. J. Chem. Thermodyn. 2019, 136, 182–189. [Google Scholar] [CrossRef]
- Hallet, B.; Sletten, R.S.; Malin, M.; Mangold, N.; Sullivan, R.J.; Fairén, A.G.; Martínez, G.; Baker, M.; Schieber, J.; Martin-Torres, J. Active ground patterns near Mars’ equator in the Glen Torridon region of Gale Crater. J. Geophys. Res. Planets 2022, 127, e2021JE007126. [Google Scholar] [CrossRef]
- Kah, L.C.; Stack, K.M.; Eigenbrode, J.L.; Yingst, R.A.; Edgett, K.E. Syndepositional precipitation of calcium sulfate in Gale Crater, Mars. Terra Nova 2018, 30, 431–439. [Google Scholar] [CrossRef]
- Kronyak, R.E.; Kah, L.; Edgett, K.; VanBommel, S.; Thompson, L.; Wiens, R.; Sun, V.; Nachon, M. Mineral-filled fractures as indicators of multigenerational fluid flow in the Pahrump Hills member of the Murray formation, Gale crater, Mars. Earth Space Sci. 2019, 6, 238–265. [Google Scholar] [CrossRef]
- Hansen, P.B. Modeling of LIBS Spectra Obtained in Martian Atmospheric Conditions; Humboldt University of Berlin: Berlin, Germany, 2022. [Google Scholar]
- Schröder, S.; Rammelkamp, K.; Hansen, P.B.; Seel, F.; Cousin, A.; Forni, O.; Gasnault, O.; Meslin, P.-Y.; Pilleri, P.; Rapin, W.; et al. Semiquantitative analysis of ChemCam and SuperCam LIBS data with spectral unmixing. Lunar Planet. Sci. Conf. 2023, 54, 2014. [Google Scholar]
- Kokaly, R.F.; Clark, R.N.; Swayze, G.A.; Livo, K.E.; Hoefen, T.M.; Pearson, N.C.; Wise, R.A.; Benzel, W.M.; Lowers, H.A.; Driscoll, R.L.; et al. USGS Spectral Library Version 7; U.S. Geological Survey Data Series; U.S. Geological Survey: Reston, VA, USA, 2017; Volume 1035.
- Farrand, W.H.; Johnson, J.R.; Rice, M.S.; Wang, A.; Bell III, J.F. VNIR multispectral observations of aqueous alteration materials by the Pancams on the Spirit and Opportunity Mars Exploration Rovers. Am. Mineral. 2016, 101, 2005–2019. [Google Scholar] [CrossRef]
- Lanza, N.L.; Wiens, R.C.; Arvidson, R.E.; Clark, B.C.; Fischer, W.W.; Gellert, R.; Grotzinger, J.P.; Hurowitz, J.A.; McLennan, S.M.; Morris, R.V. Oxidation of manganese in an ancient aquifer, Kimberley formation, Gale crater, Mars. Geophys. Res. Lett. 2016, 43, 7398–7407. [Google Scholar] [CrossRef]
- Tu, V.M.; Rampe, E.B.; Bristow, T.F.; Thorpe, M.T.; Clark, J.V.; Castle, N.; Fraeman, A.A.; Edgar, L.A.; McAdam, A.; Bedford, C. A review of the phyllosilicates in Gale Crater as detected by the CheMin instrument on the Mars Science Laboratory, Curiosity rover. Minerals 2021, 11, 847. [Google Scholar] [CrossRef]
- Smith, R.; McLennan, S.; Achilles, C.; Dehouck, E.; Horgan, B.; Mangold, N.; Rampe, E.; Salvatore, M.; Siebach, K.; Sun, V. X-Ray amorphous components in sedimentary rocks of Gale Crater, Mars: Evidence for ancient formation and long-lived aqueous activity. J. Geophys. Res. Planets 2021, 126, e2020JE006782. [Google Scholar] [CrossRef]
- Treiman, A.; Downs, R.; Ming, D.; Morris, R.; Thorpe, M.; Hazen, R.; Downs, G.; Rampe, E.; CheMin Team, T. Possible detection of a jahnsite-whiteite group phosphate mineral by MSL CheMin in Glen Torridon, Gale Crater, Mars. Lunar Planet. Sci. Conf. 2021, 52, 1200. [Google Scholar]
- Brangule, A.; Gross, K.; Komarovska, L.; Vīksna, A. Exploring zinc apatites through different synthesis routes. Key Eng. Mater. 2014, 587, 171–176. [Google Scholar] [CrossRef]
- Vecbiskena, L.; Gross, K.A.; Riekstina, U.; Yang, T.C.-K. Crystallized nano-sized alpha-tricalcium phosphate from amorphous calcium phosphate: Microstructure, cementation and cell response. Biomed. Mater. 2015, 10, 025009. [Google Scholar] [CrossRef] [PubMed]
- Rodgers, K.; Henderson, G. The thermochemistry of some iron phosphate minerals: Vivianite, metavivianite, baraćite, ludlamite and vivianite/metavivianite admixtures. Thermochim. Acta 1986, 104, 1–12. [Google Scholar] [CrossRef]
- Chukanov, N.V.; Scholz, R.; Zubkova, N.V.; Pekov, I.V.; Belakovskiy, D.I.; Van, K.V.; Lagoeiro, L.; Graça, L.M.; Krambrock, K.; de Oliveira, L.C. Correianevesite, Fe2+Mn22+(PO4)2·3H2O, a new reddingite-group mineral from the Cigana mine, Conselheiro Pena, Minas Gerais, Brazil. Am. Mineral. 2014, 99, 811–816. [Google Scholar] [CrossRef]
- Kubeneck, L.J.; Thomas-Arrigo, L.K.; Rothwell, K.A.; Kaegi, R.; Kretzschmar, R. Competitive incorporation of Mn and Mg in vivianite at varying salinity and effects on crystal structure and morphology. Geochim. Cosmochim. Acta 2023, 346, 231–244. [Google Scholar] [CrossRef]
- Kulik, D.A.; Kersten, M.; Heiser, U.; Neumann, T. Application of Gibbs energy minimization to model early-diagenetic solid-solution aqueous-solution equilibria involving authigenic rhodochrosites in Anoxic Baltic Sea sediments. Aquat. Geochem. 2000, 6, 147–199. [Google Scholar] [CrossRef]
- Glynn, P. Solid-solution solubilities and thermodynamics: Sulfates, carbonates and halides. Rev. Mineral. Geochem. 2000, 40, 481–511. [Google Scholar] [CrossRef]
- Vinograd, V.L.; Winkler, B.; Putnis, A.; Gale, J.D.; Sluiter, M.H. Static lattice energy calculations of mixing and ordering enthalpy in binary carbonate solid solutions. Chem. Geol. 2006, 225, 304–313. [Google Scholar] [CrossRef]
- Redfern, S.A.; Knight, K.; Henderson, C.; Wood, B. Fe-Mn cation ordering in fayalite–tephroite (FexMn1−x)2SiO4 olivines: A neutron diffraction study. Mineral. Mag. 1998, 62, 607–615. [Google Scholar] [CrossRef]
- Anthony, J.W.; Bideaux, R.A.; Bladh, K.W.; Nichols, M.C. Handbook of Mineralogy; Mineralogical Society of America: Chantilly, VA, USA, 2023; Available online: http://www.handbookofmineralogy.org/ (accessed on 7 July 2023).
- Whittaker, E.; Muntus, R. Ionic radii for use in geochemistry. Geochim. Et Cosmochim. Acta 1970, 34, 945–956. [Google Scholar] [CrossRef]
- Güven, N. Smectites. In Hydrous Phyllosilicates (Exclusive of Micas); Reviews in Mineralogy; Bailey, S.W., Ribbe, P.H., Eds.; Mineralogical Society of America: Washington, DC, USA, 1988; pp. 497–559. [Google Scholar]
- Strunz, H. Laueit, MnFe23+[OH/PO4]2·8H2O, ein neues Mineral. Naturwissenschaften 1954, 41, 256. [Google Scholar] [CrossRef]
- Frondel, C. Strunzite, a new mineral. Naturwissenschaften 1958, 45, 37–38. [Google Scholar] [CrossRef]
- Azam, H.M.; Alam, S.T.; Hasan, M.; Yameogo, D.D.S.; Kannan, A.D.; Rahman, A.; Kwon, M.J. Phosphorous in the environment: Characteristics with distribution and effects, removal mechanisms, treatment technologies, and factors affecting recovery as minerals in natural and engineered systems. Environ. Sci. Pollut. Res. Int. 2019, 26, 20183–20207. [Google Scholar] [CrossRef] [PubMed]
- Matsubara, S. Vivianite nodules and secondary phosphates in Pliocene-Pleistocene clay deposits from Hime-Shima, Oita Prefecture and Kobe, Hyogo Prefecture, western Japan. Mem Natl. Sci Mus Tokyo 2000, 33, 15–27. [Google Scholar]
- Dill, H.G.; Weber, B.; Kaufhold, S. The origin of siderite-goethite-phosphate mineralization in the karst-related faultbound iron ore deposit Auerbach, Germany, a clue to the timing of hypogene and supergene Fe-Al phosphates in NE Bavaria. Neues Jahrb. Für Mineral.-Abh. 2009, 186, 283–307. [Google Scholar]
- Fernández-Remolar, D.; Sánchez-Román, M.; Hill, A.C.; Gómez-Ortíz, D.; Ballesteros, O.P.; Romanek, C.S.; Amils, R. The environment of early Mars and the missing carbonates. Meteorit. Planet. Sci. 2011, 46, 1447–1469. [Google Scholar] [CrossRef]
- Bridges, J.C.; Hicks, L.J.; Treiman, A.H. Carbonates on Mars. In Volatiles in the Martian Crust; Filiberto, J., Schwenzer, S.P., Eds.; Elsevier: Amsterdam, The Netherlands, 2019; pp. 89–118. [Google Scholar]
- Cullen, M.; Phillips-Lander, C.; Madden, A.E.; Madden, M.E. Siderite dissolution in Mars-analog Brines: Kinetics and reaction products. Planet. Sci. J. 2021, 2, 169. [Google Scholar] [CrossRef]
- Nakano, S. Manganoan vivianite in the bottom sediments of Lake Biwa, Japan. Mineral. J. 1992, 16, 96–107. [Google Scholar] [CrossRef]
- Friedl, G.; Wehrli, B.; Manceau, A. Solid phases in the cycling of manganese in eutrophic lakes: New insights from EXAFS spectroscopy. Geochim. Cosmochim. Acta 1997, 61, 275–290. [Google Scholar] [CrossRef]
- Egger, M.; Jilbert, T.; Behrends, T.; Rivard, C.; Slomp, C.P. Vivianite is a major sink for phosphorus in methanogenic coastal surface sediments. Geochim. Cosmochim. Acta 2015, 169, 217–235. [Google Scholar] [CrossRef]
- Makri, S.; Wienhues, G.; Bigalke, M.; Gilli, A.; Rey, F.; Tinner, W.; Vogel, H.; Grosjean, M. Variations of sedimentary Fe and Mn fractions under changing lake mixing regimes, oxygenation and land surface processes during Late-glacial and Holocene times. Sci. Total Environ. 2021, 755, 143418. [Google Scholar] [CrossRef]
- Vuillemin, A.; Friese, A.; Wirth, R.; Schuessler, J.A.; Schleicher, A.M.; Kemnitz, H.; Lücke, A.; Bauer, K.W.; Nomosatryo, S.; Von Blanckenburg, F. Vivianite formation in ferruginous sediments from Lake Towuti, Indonesia. Biogeosciences 2020, 17, 1955–1973. [Google Scholar] [CrossRef]
- Cosmidis, J.; Benzerara, K.; Morin, G.; Busigny, V.; Lebeau, O.; Jézéquel, D.; Noël, V.; Dublet, G.; Othmane, G. Biomineralization of iron-phosphates in the water column of Lake Pavin (Massif Central, France). Geochim. Cosmochim. Acta 2014, 126, 78–96. [Google Scholar] [CrossRef]
- Barth, T.F. Crystallographic studies in the vivianite group. Am. Mineral. 1937, 22, 325–341. [Google Scholar]
- Rečnik, A. Minerals of the Mercury Ore Deposit Idria; Springer: Berlin/Heidelberg, Germany, 2013; p. 110. [Google Scholar]
- Madsen, H.E.L. Morphology and optical properties of precipitated vivianite, Fe3(PO4)2·8H2O. Cryst. Res. Technol. 2020, 55, 1900226. [Google Scholar] [CrossRef]
- Rudolph, A.; Horgan, B.; Johnson, J.; Bennett, K.; Haber, J.; Bell III, J.; Fox, V.; Jacob, S.; Maurice, S.; Rampe, E. The distribution of clay minerals and their impact on diagenesis in Glen Torridon, Gale crater, Mars. J. Geophys. Res. Planets 2022, 127, e2021JE007098. [Google Scholar] [CrossRef]
- Lanza, N.; Gasda, P.; Swanner, E.; Fischer, W.; Treiman, A.; Essunfeld, A.; Comellas, J.; Williams, A.; Rampe, E.; Meslin, P.-Y. Precipitation of Mn-bearing nodules in a shallow shoreline environment in Gale Crater, Mars. Lunar Planet. Sci. Conf. 2022, 53, 2689. [Google Scholar]
- Ruzicka, A.; Snyder, G.A.; Taylor, L.A. Comparative geochemistry of basalts from the Moon, Earth, HED asteroid, and Mars: Implications for the origin of the Moon. Geochim. Cosmochim. Acta 2001, 65, 979–997. [Google Scholar] [CrossRef]
- Berger, J.A.; Schmidt, M.E.; Gellert, R.; Boyd, N.I.; Desouza, E.D.; Flemming, R.L.; Izawa, M.R.; Ming, D.W.; Perrett, G.M.; Rampe, E.B. Zinc and germanium in the sedimentary rocks of Gale Crater on Mars indicate hydrothermal enrichment followed by diagenetic fractionation. J. Geophys. Res. Planets 2017, 122, 1747–1772. [Google Scholar] [CrossRef]
- Adcock, C.T.; Hausrath, E.M. Weathering profiles in phosphorus-rich rocks at Gusev Crater, Mars, suggest dissolution of phosphate minerals into potentially habitable near-neutral waters. Astrobiology 2015, 15, 1060–1075. [Google Scholar] [CrossRef] [PubMed]
- Adcock, C.T.; Hausrath, E.M.; Forster, P. Readily available phosphate from minerals in early aqueous environments on Mars. Nat. Geosci. 2013, 6, 824–827. [Google Scholar] [CrossRef]
- Seeger, C.; Grotzinger, J.P.; Thompson, L.M.; Kah, L.C. Unpacking diagenetic overprints associated with the clay-sulfate transition in Gale crater, Mars. Geol. Soc. Am. Abstr. Programs 2021, 53, 2021AM–370244. [Google Scholar] [CrossRef]
- Tanaka, A.; Seyama, H.; Soma, M. Iron and manganese-rich sediments as an indicator of hot spring activities at the bottom of Lake Mashu, Japan. Geochem. J. 1994, 28, 289–306. [Google Scholar] [CrossRef]
- Khan, M.A.; Kakar, M.I.; Ulrich, T.; Ali, L.; Kerr, A.C.; Mahmood, K.; Siddiqui, R.H. Genesis of manganese deposits in the Ali Khanzai block of the Zhob ophiolite, Pakistan: Inferences from geochemistry and mineralogy. J. Earth Sci. 2020, 31, 884–895. [Google Scholar] [CrossRef]
- Tumiati, S.; Martin, S.; Godard, G. Hydrothermal origin of manganese in the high-pressure ophiolite metasediments of Praborna ore deposit (Aosta Valley, Western Alps). Eur. J. Mineral. 2010, 22, 577–594. [Google Scholar] [CrossRef]
- Pinto-Auso, M.; Harper, G.D. Sedimentation, metallogenesis, and tectonic origin of the basal Galice Formation overlying the Josephine ophiolite, northwestern California. J. Geol. 1985, 93, 713–725. [Google Scholar] [CrossRef]
- Rothe, M.; Kleeberg, A.; Hupfer, M. The occurrence, identification and environmental relevance of vivianite in waterlogged soils and aquatic sediments. Earth-Sci. Rev. 2016, 158, 51–64. [Google Scholar] [CrossRef]
- Tessenow, U. Solution, diffusion and sorption in the upper layer of lake sediments. IV. Reaction mechanisms and equilibria in the system iron-manganese-phosphate with regard to the accumulation of vivianite in Lake Ursee. Arch. Hydrobiol. Suppl. 1974, 47, 1–79. [Google Scholar]
- Stoops, G. SEM and light microscopic observations of minerals in bog-ores of the Belgian Campine. In Developments in Soil Science; Elsevier: Amsterdam, The Netherlands, 1983; Volume 12, pp. 179–186. [Google Scholar]
- Henderson, G.; Black, P.; Rodgers, K.; Rankin, P. New data on New Zealand vivianite and metavivianite. N. Z. J. Geol. Geophys. 1984, 27, 367–378. [Google Scholar]
- Nanzyo, M.; Onodera, H.; Hasegawa, E.; Ito, K.; Kanno, H. Formation and dissolution of vivianite in paddy field soil. Soil Sci. Soc. Am. J. 2013, 77, 1452–1459. [Google Scholar] [CrossRef]
- Stamatakis, M.; Koukouzas, N. The occurrence of phosphate minerals in lacustrine clayey diatomite deposits, Thessaly, Central Greece. Sediment. Geol. 2001, 139, 33–47. [Google Scholar] [CrossRef]
- McGowan, G.; Prangnell, J. The significance of vivianite in archaeological settings. Geoarchaeology 2006, 21, 93–111. [Google Scholar] [CrossRef]
- Shannon, E.V. Description of vivianite encrusting a fossil tusk from gold placers of Clearwater County, Idaho. Proc. U. S. Natl. Mus. 1921, 59, 415–417. [Google Scholar] [CrossRef]
- Thali, M.J.; Lux, B.; Lösch, S.; Rösing, F.W.; Hürlimann, J.; Feer, P.; Dirnhofer, R.; Königsdorfer, U.; Zollinger, U. “Brienzi”–The blue vivianite man of Switzerland: Time since death estimation of an adipocere body. Forensic Sci. Int. 2011, 211, 34–40. [Google Scholar] [CrossRef] [PubMed]
- Jafarzadeh, A.; Burnham, C. Gypsum crystals in soils. J. Soil Sci. 1992, 43, 409–420. [Google Scholar] [CrossRef]
- London, D. The barite roses of Oklahoma. Mineral. Rec. 2008, 39, 277–292. [Google Scholar]
- Rodgers, K. Some occurrences of vivianite in the Auckland area. N. Z. J. Geol. Geophys. 1977, 20, 363–367. [Google Scholar] [CrossRef]
- Noboru, H.; Shugo, O.; Satoshi, N. Interstitial vivianite and siderite-rhodochrosite in sandy nodules on a submerged terrace in Lake Biwa, Shiga Prefecture, Japan. Earth Sci. (Chikyu Kagaku) 2018, 72, 213–218. [Google Scholar]
- Ixer, R.A.; Tindle, A.G. An unusual magnesium-bearing vivianite within a sandstone hone from Canterbury, Kent. J. Russell Soc. 2020, 2020, 97. [Google Scholar]
- Dellwig, O.; Leipe, T.; März, C.; Glockzin, M.; Pollehne, F.; Schnetger, B.; Yakushev, E.V.; Böttcher, M.E.; Brumsack, H.-J. A new particulate Mn–Fe–P-shuttle at the redoxcline of anoxic basins. Geochim. Cosmochim. Acta 2010, 74, 7100–7115. [Google Scholar] [CrossRef]
- Jilbert, T.; Slomp, C.P. Iron and manganese shuttles control the formation of authigenic phosphorus minerals in the euxinic basins of the Baltic Sea. Geochim. Cosmochim. Acta 2013, 107, 155–169. [Google Scholar] [CrossRef]
- Dijkstra, N.; Hagens, M.; Egger, M.; Slomp, C.P. Post-depositional formation of vivianite-type minerals alters sediment phosphorus records. Biogeosciences 2018, 15, 861–883. [Google Scholar] [CrossRef]
- Hurowitz, J.A.; Grotzinger, J.P.; Fischer, W.W.; McLennan, S.M.; Milliken, R.E.; Stein, N.; Vasavada, A.R.; Blake, D.F.; Dehouck, E.; Eigenbrode, J.L. Redox stratification of an ancient lake in Gale crater, Mars. Science 2017, 356, eaah6849. [Google Scholar] [CrossRef] [PubMed]
- Schwid, M.F.; Xiao, S.; Hiatt, E.E.; Fang, Y.; Nolan, M.R. Iron phosphate in the Ediacaran Doushantuo Formation of South China: A previously undocumented marine phosphate sink. Palaeogeogr. Palaeoclimatol. Palaeoecol. 2020, 560, 109993. [Google Scholar] [CrossRef]


Disclaimer/Publisher’s Note: The statements, opinions and data contained in all publications are solely those of the individual author(s) and contributor(s) and not of MDPI and/or the editor(s). MDPI and/or the editor(s) disclaim responsibility for any injury to people or property resulting from any ideas, methods, instructions or products referred to in the content. |
© 2023 by the authors. Licensee MDPI, Basel, Switzerland. This article is an open access article distributed under the terms and conditions of the Creative Commons Attribution (CC BY) license (https://creativecommons.org/licenses/by/4.0/).