
Relationship between Rock Porosity and Infrared Cooling Rate in Non-Standard Specimens of Tuffs Used in the Hungarian Cultural Heritage


Abstract
:1. Introduction
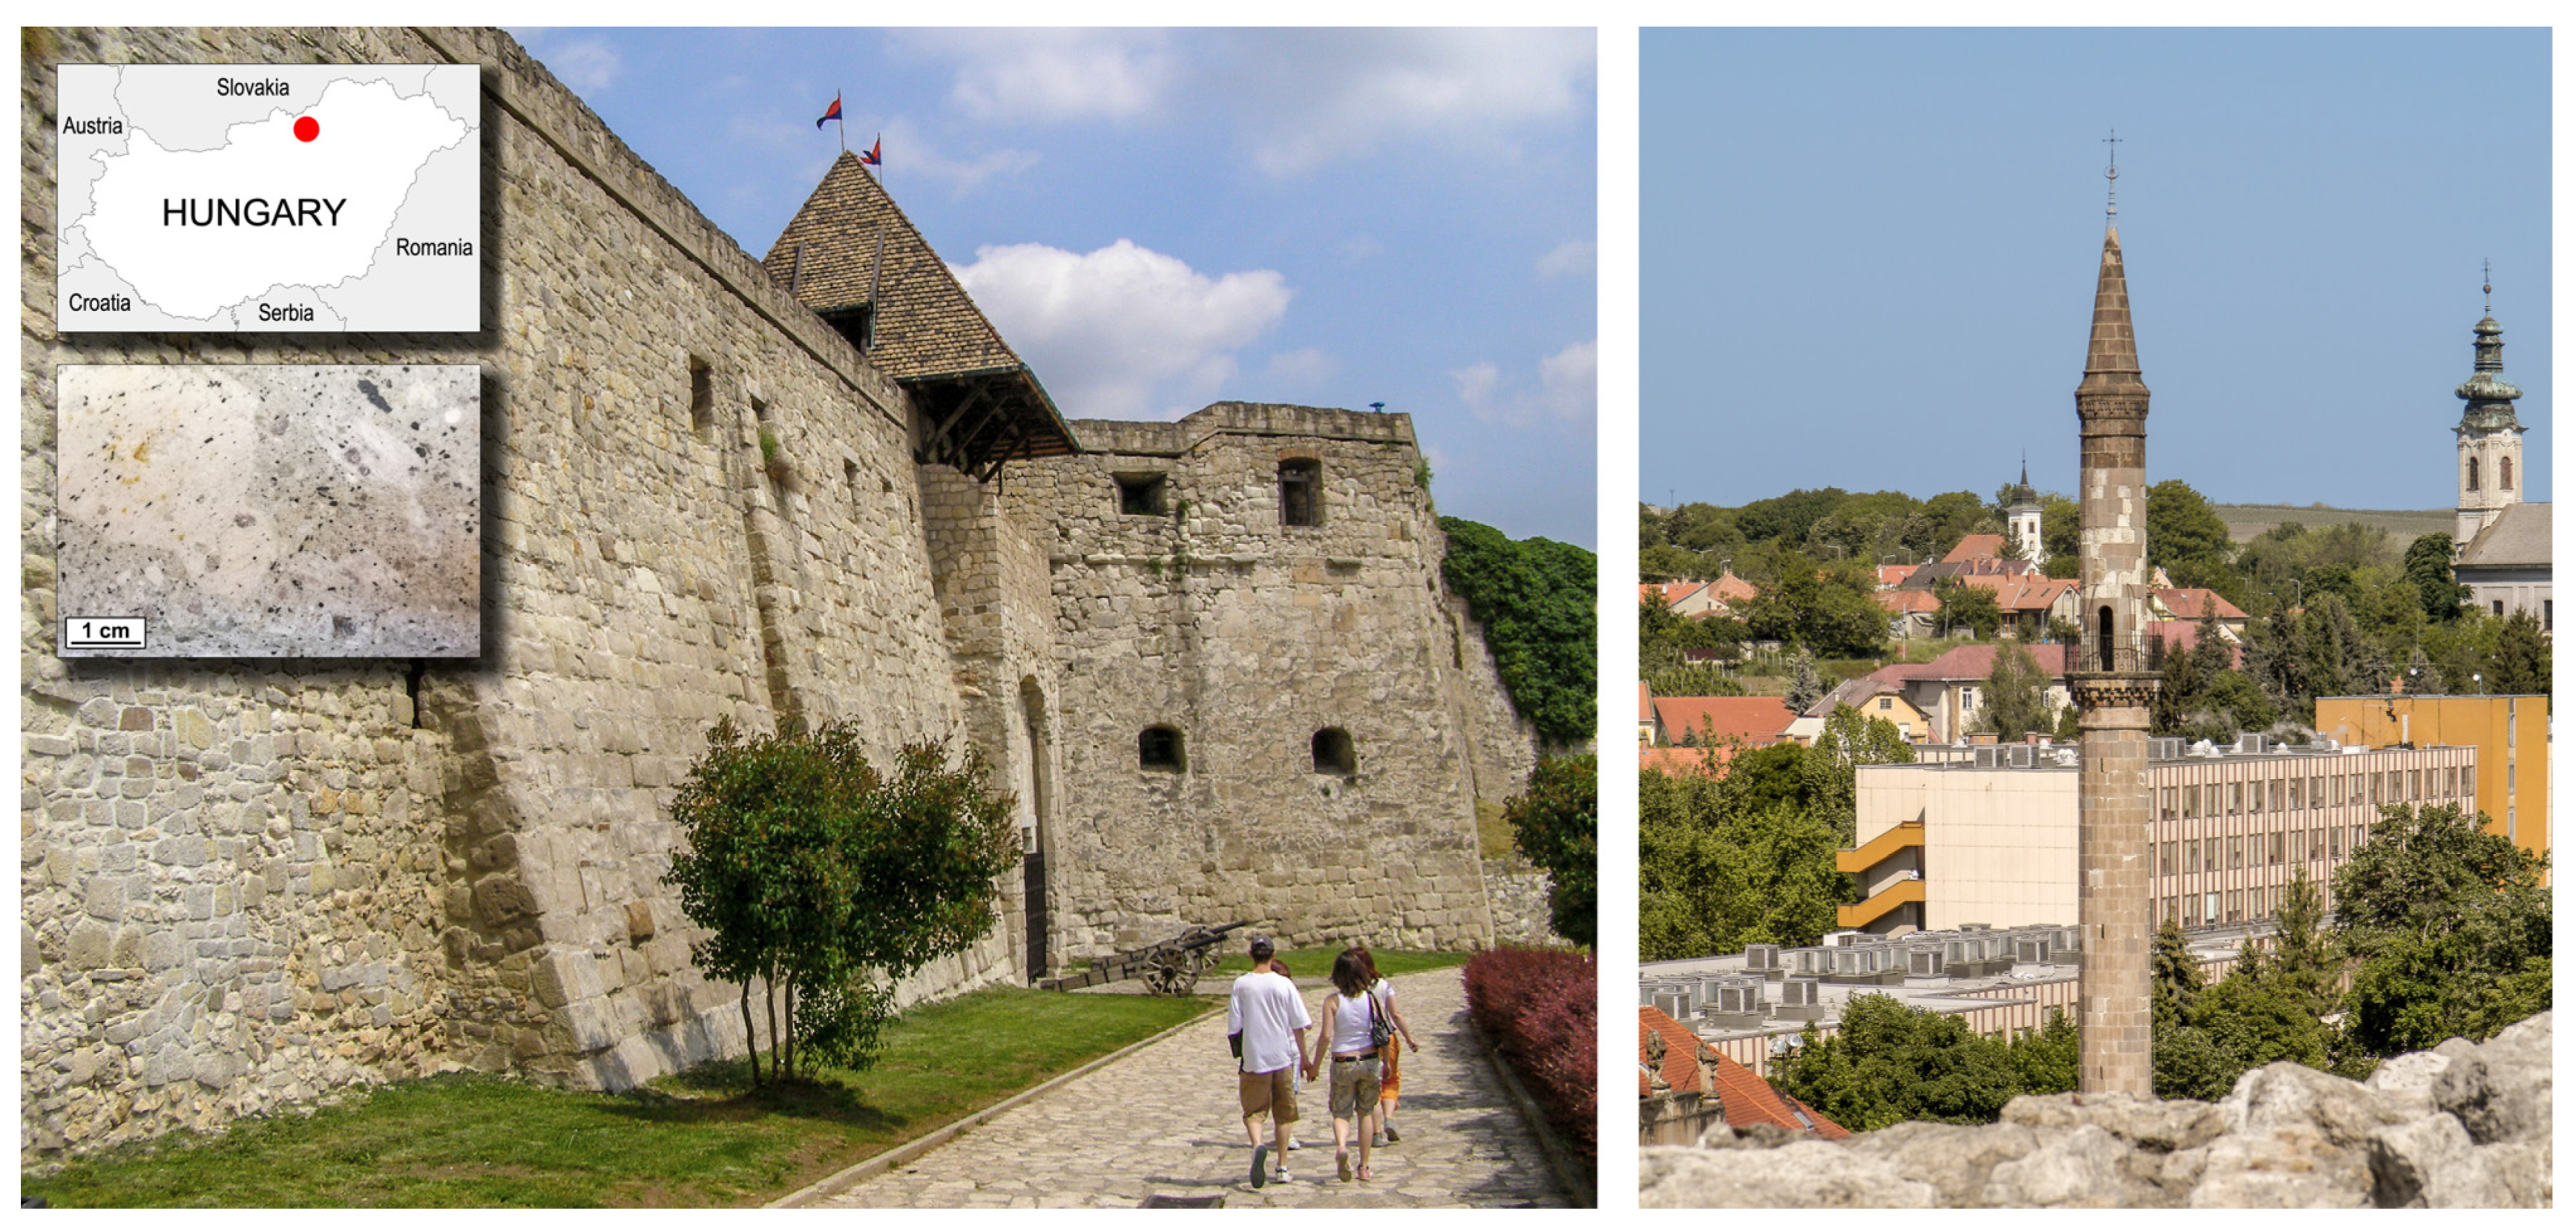
2. Materials
3. Methods
3.1. Salt Crystallization Tests
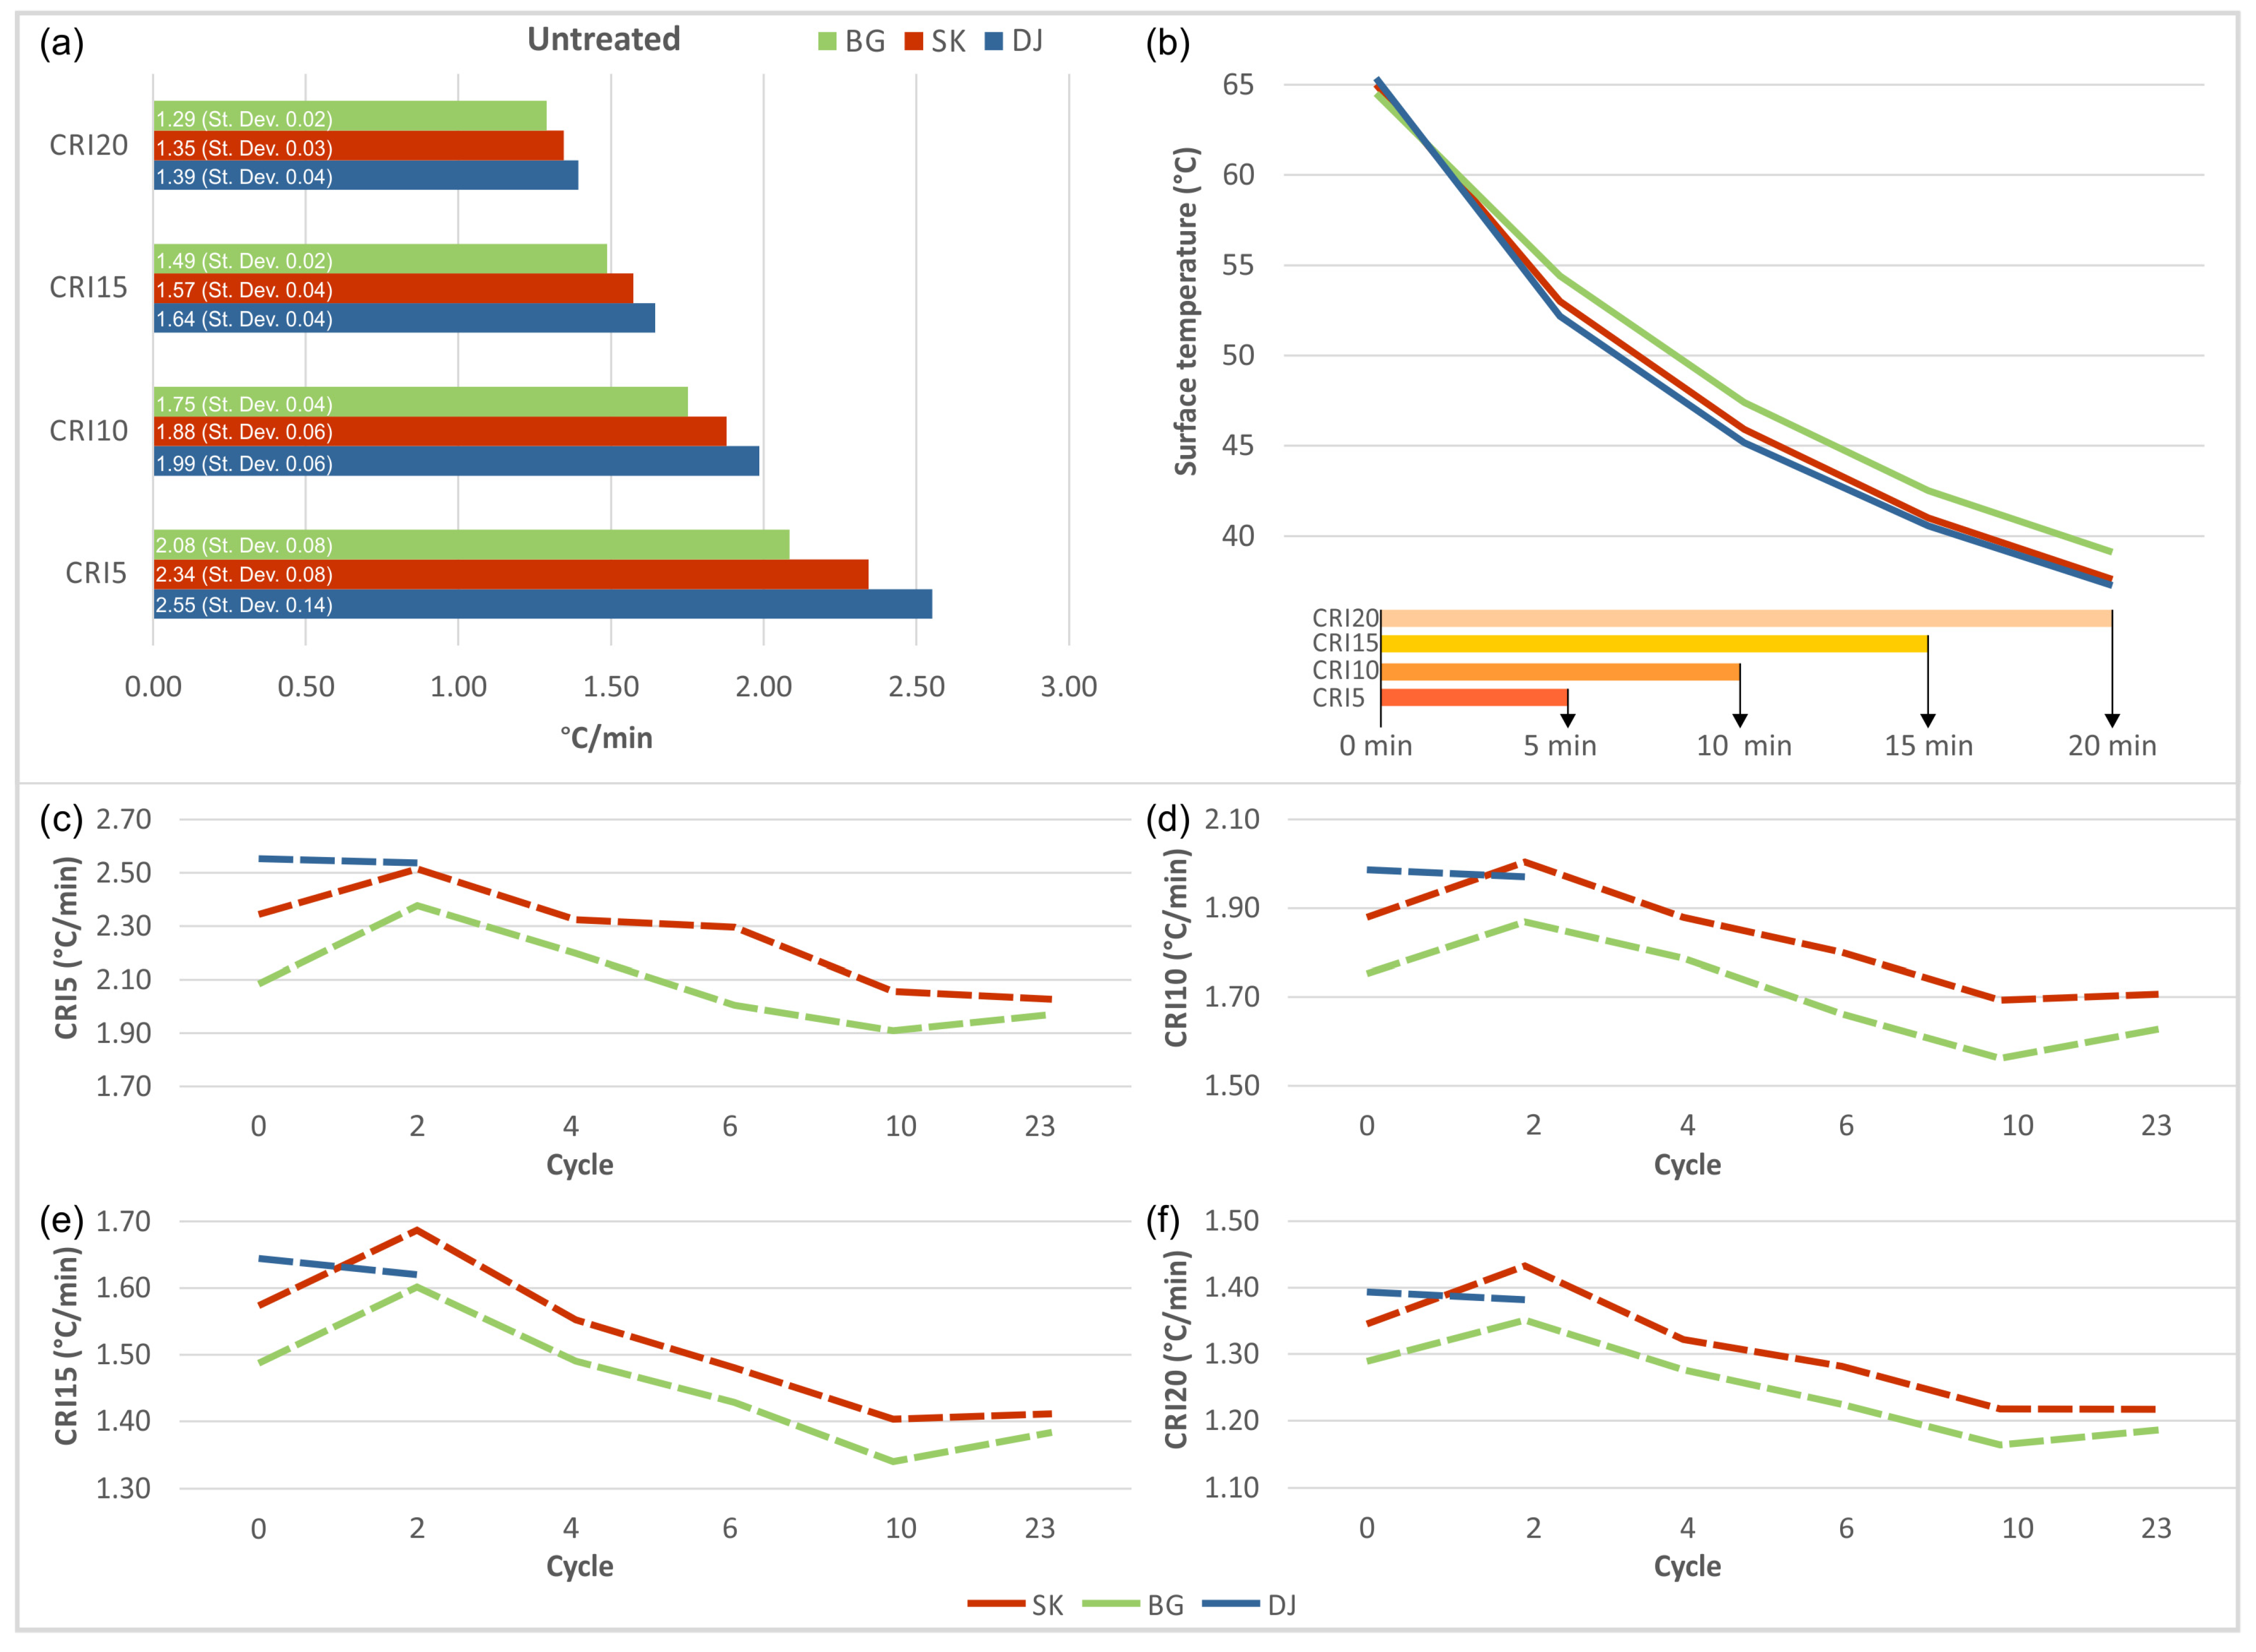
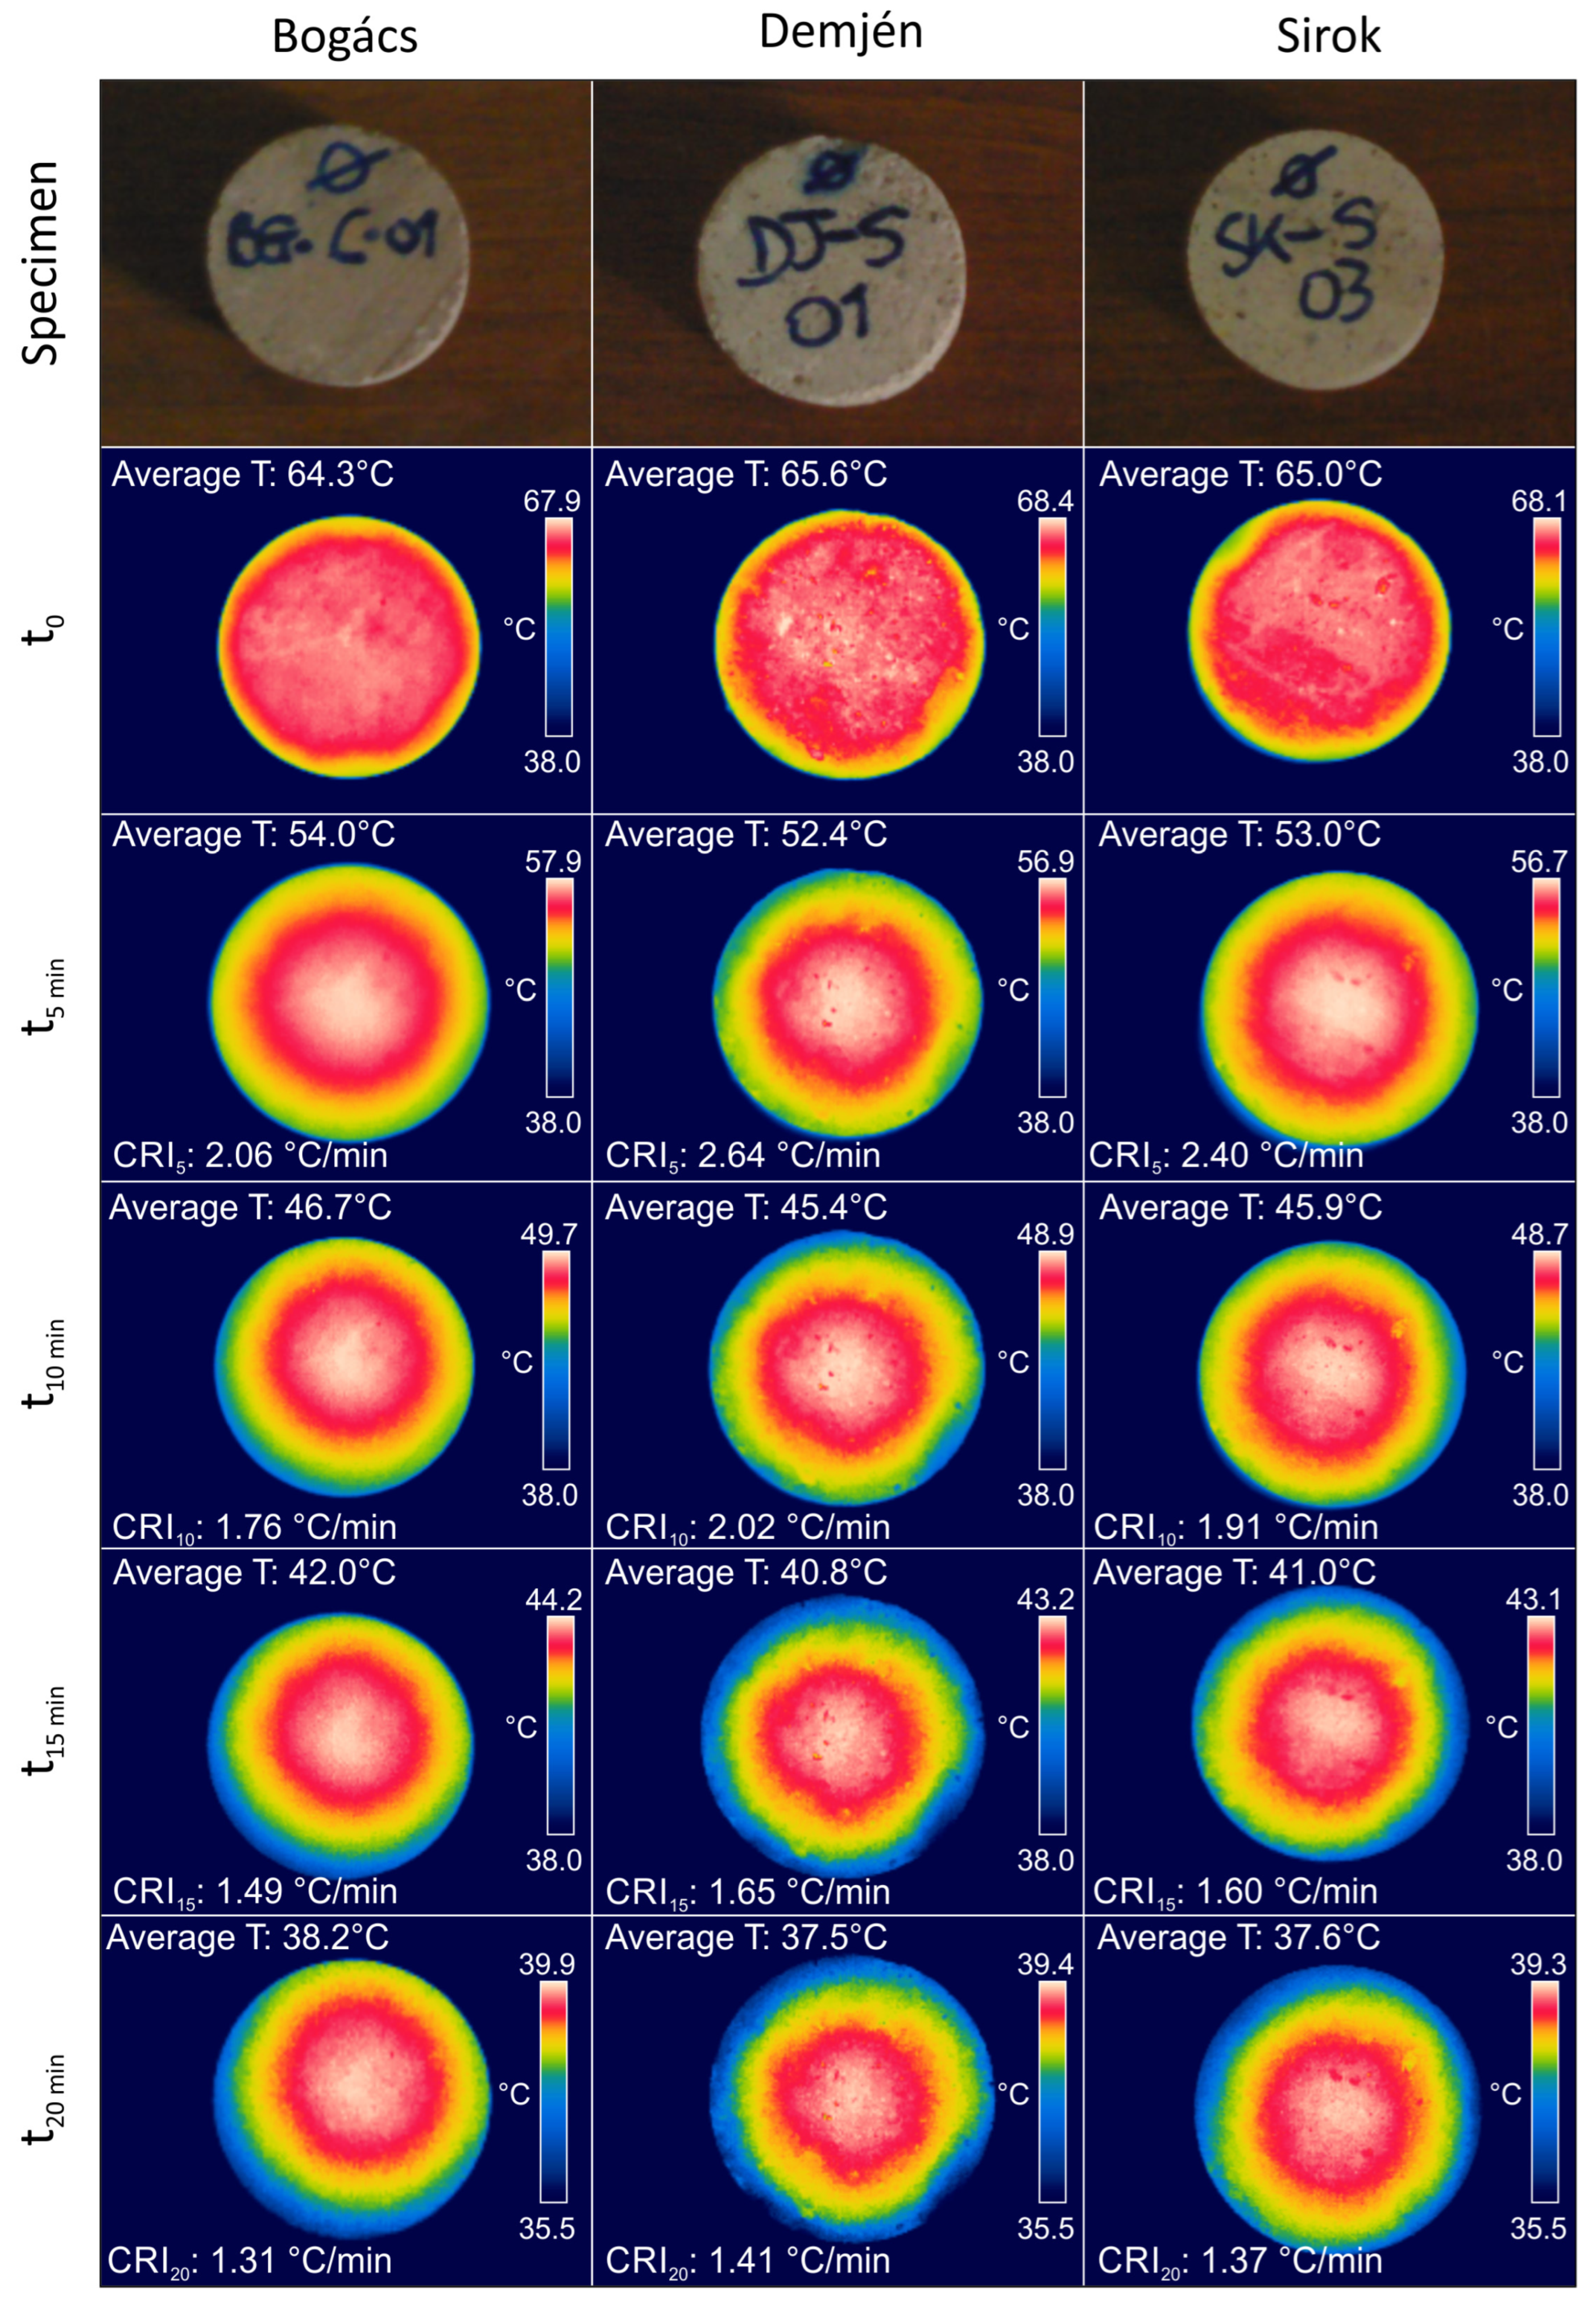
3.2. Infrared Cooling Monitoring and CRI Calculation
3.3. Rock Porosity Estimation
3.4. Statistical Data Processing
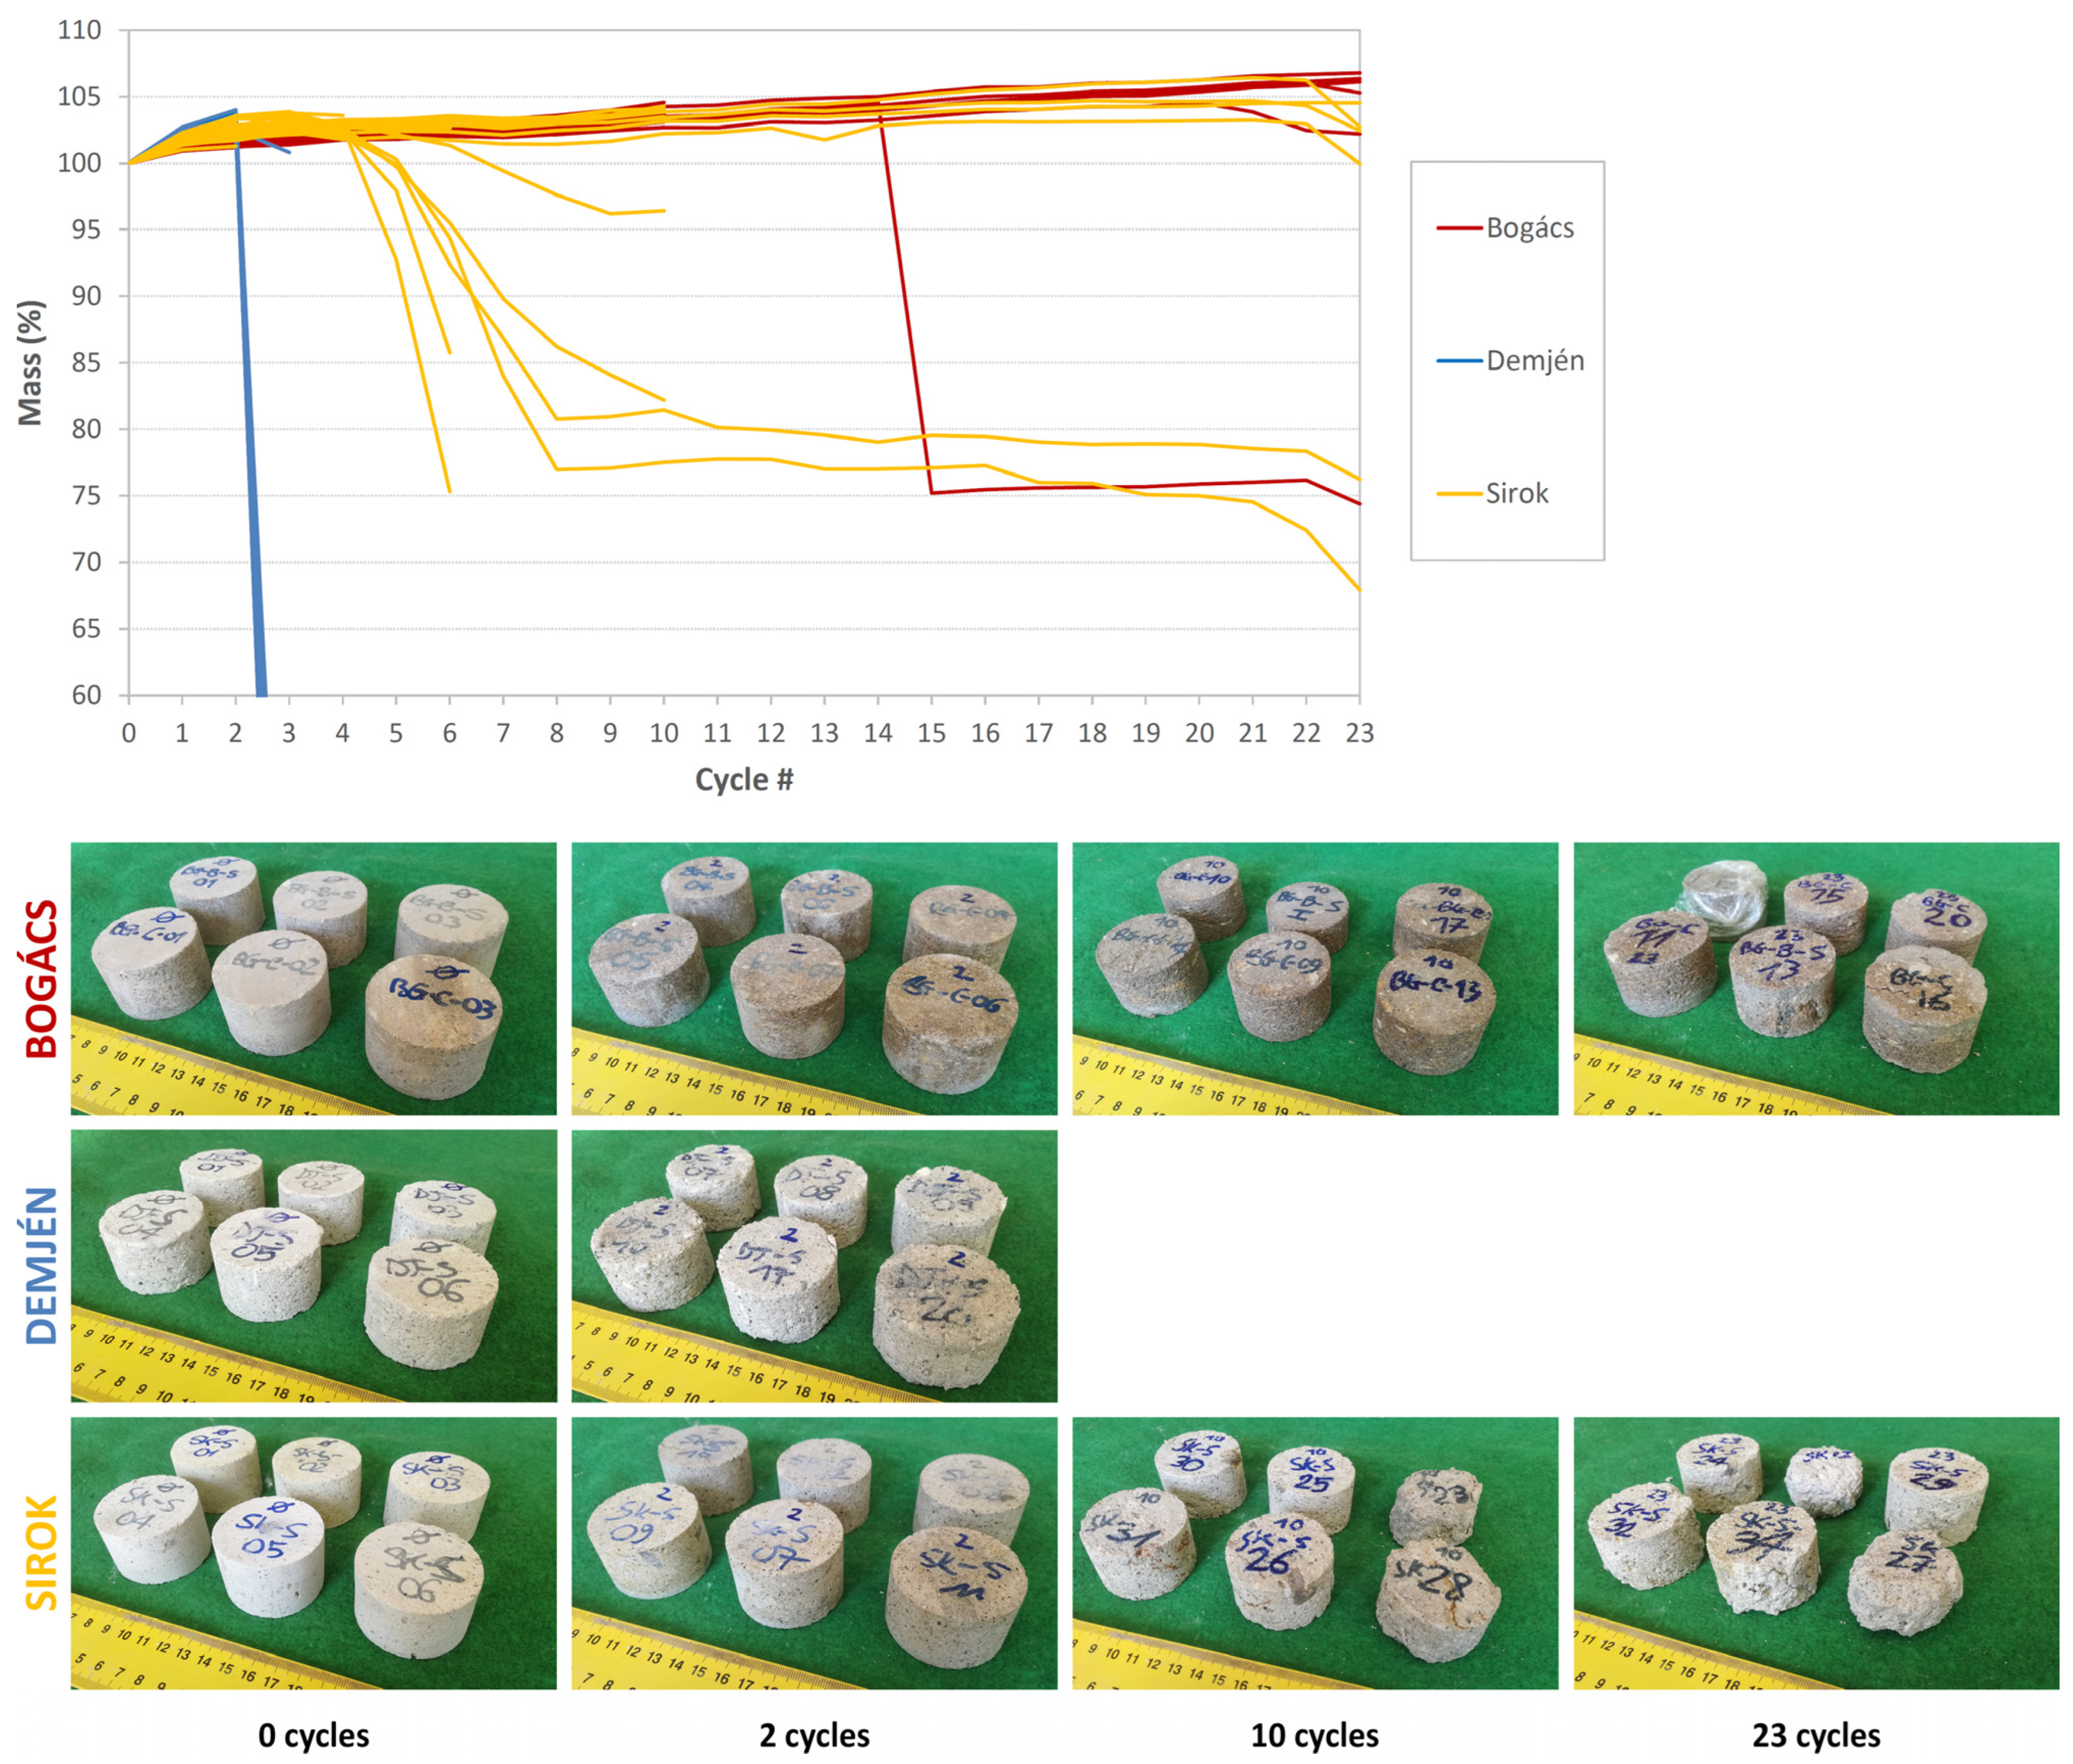
4. Results of Salt Crystallization Tests
5. Results of Porosity Estimation
6. Results of IR Cooling Monitoring
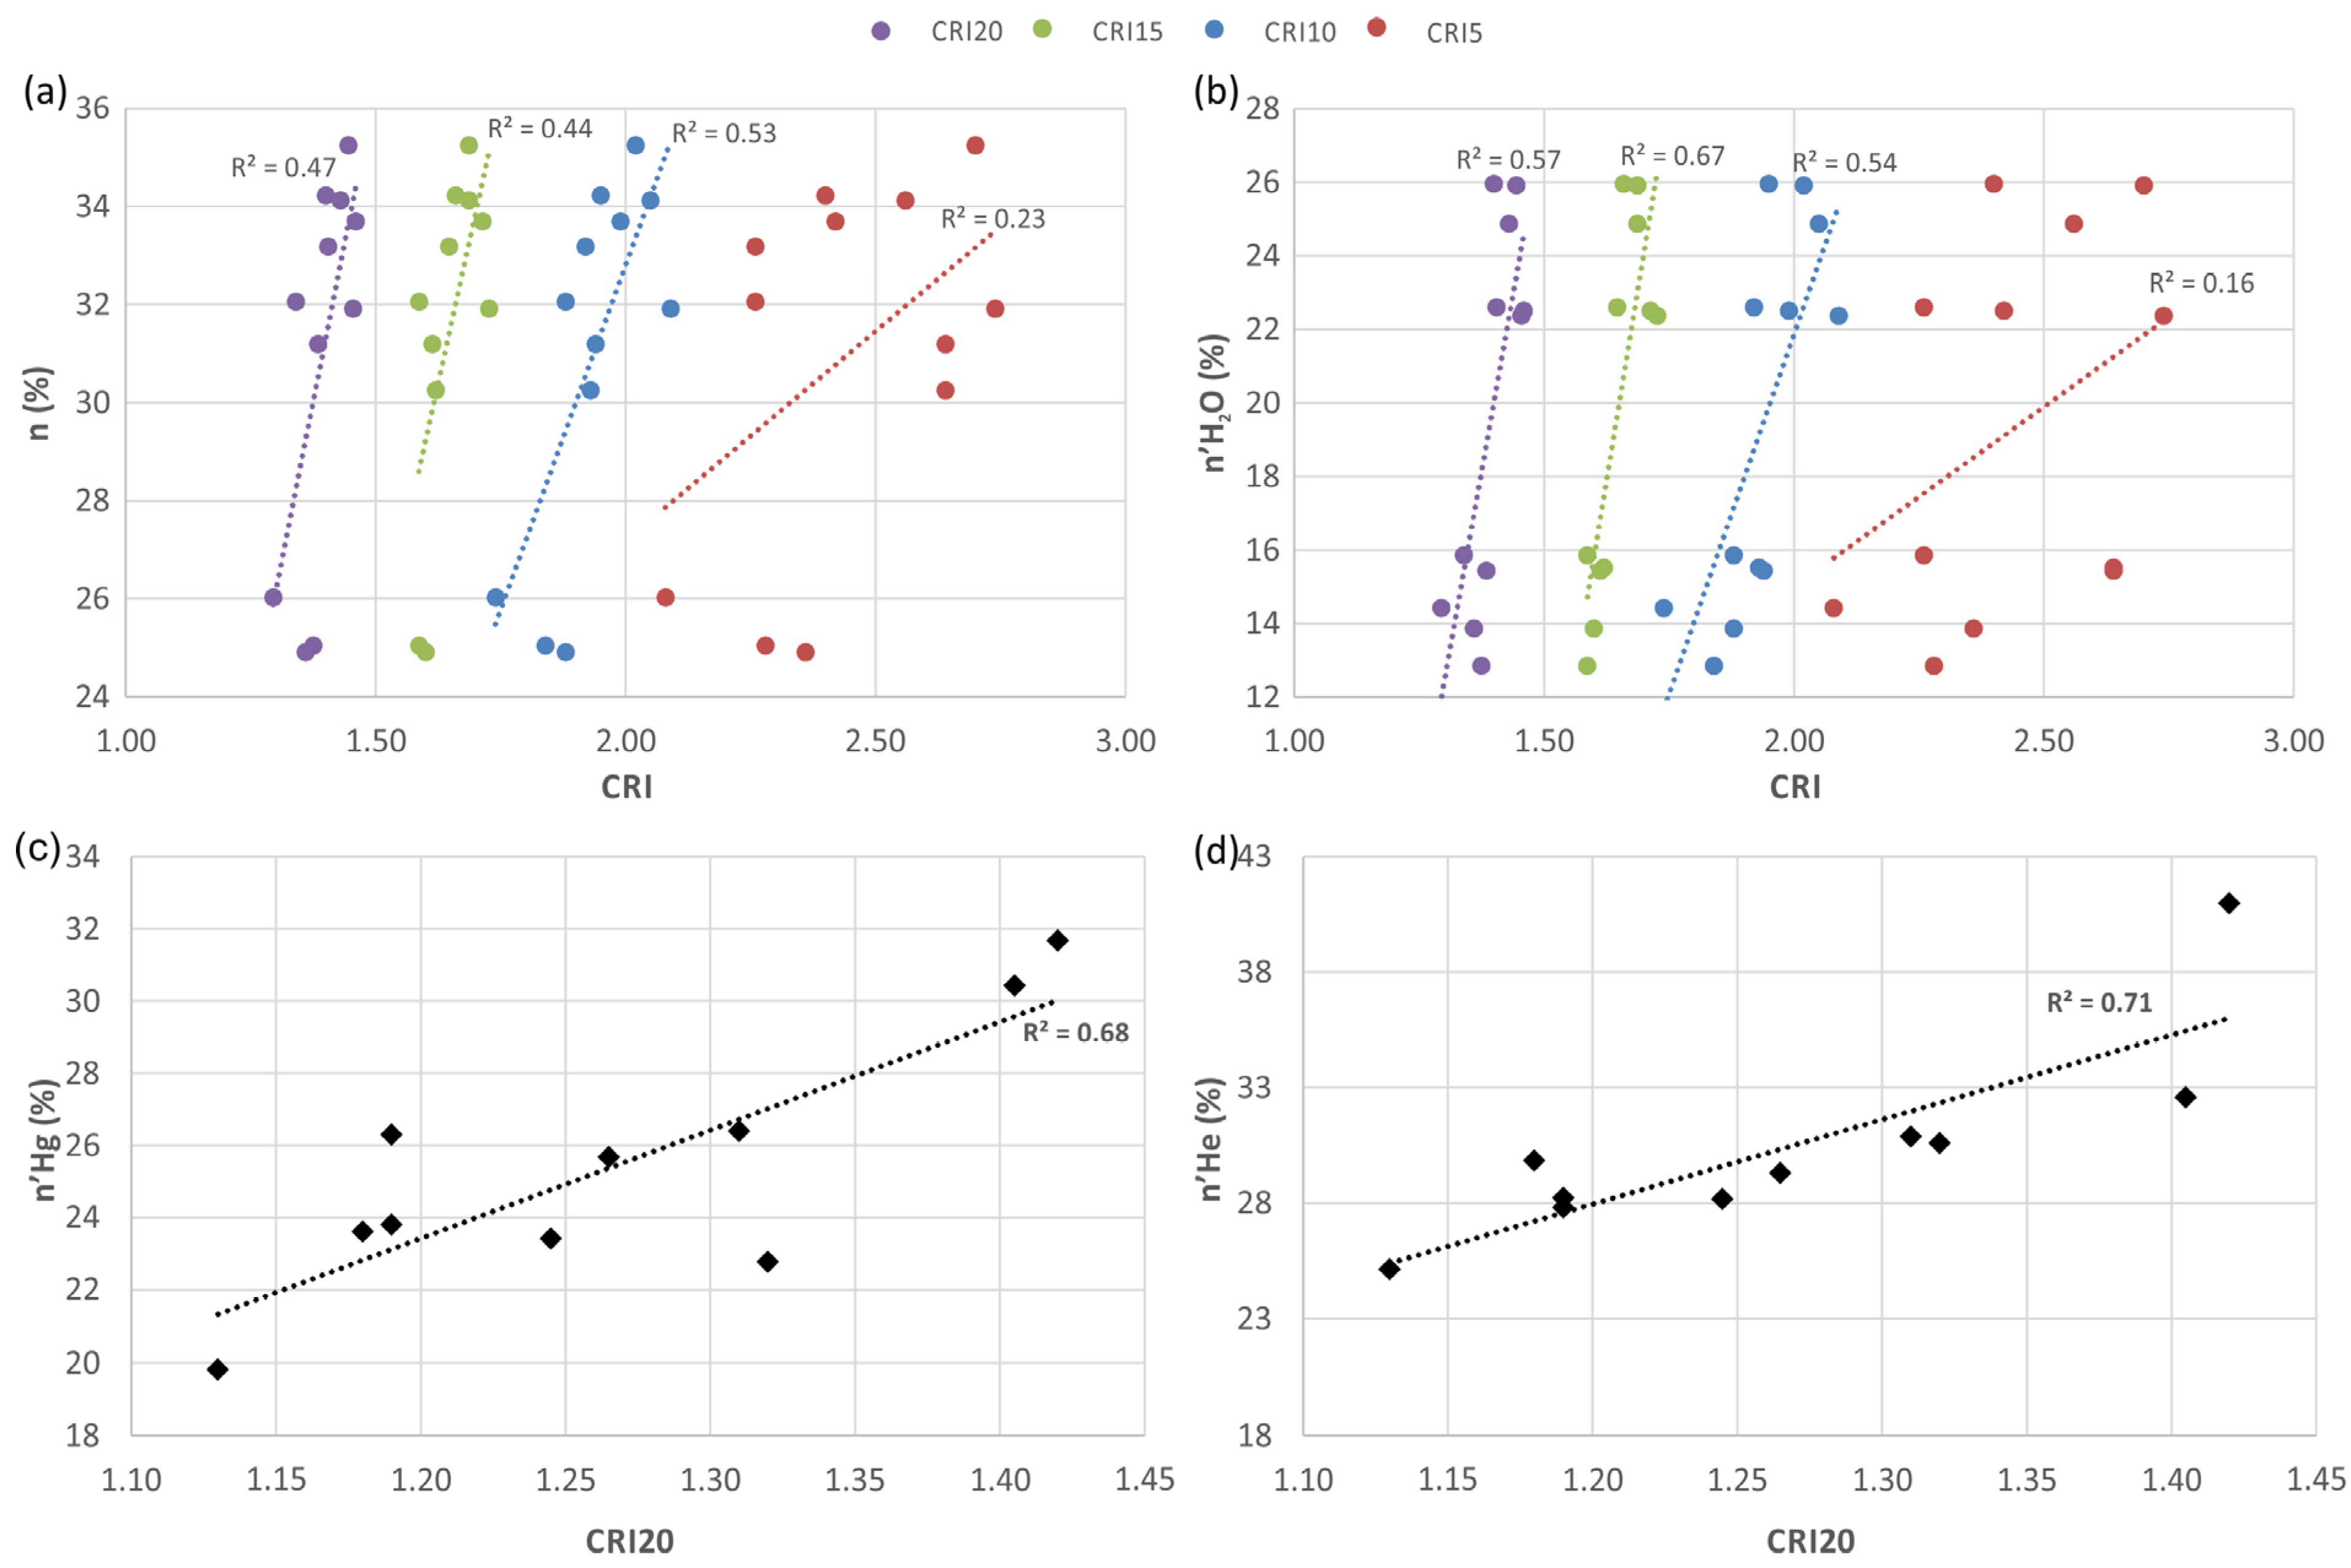
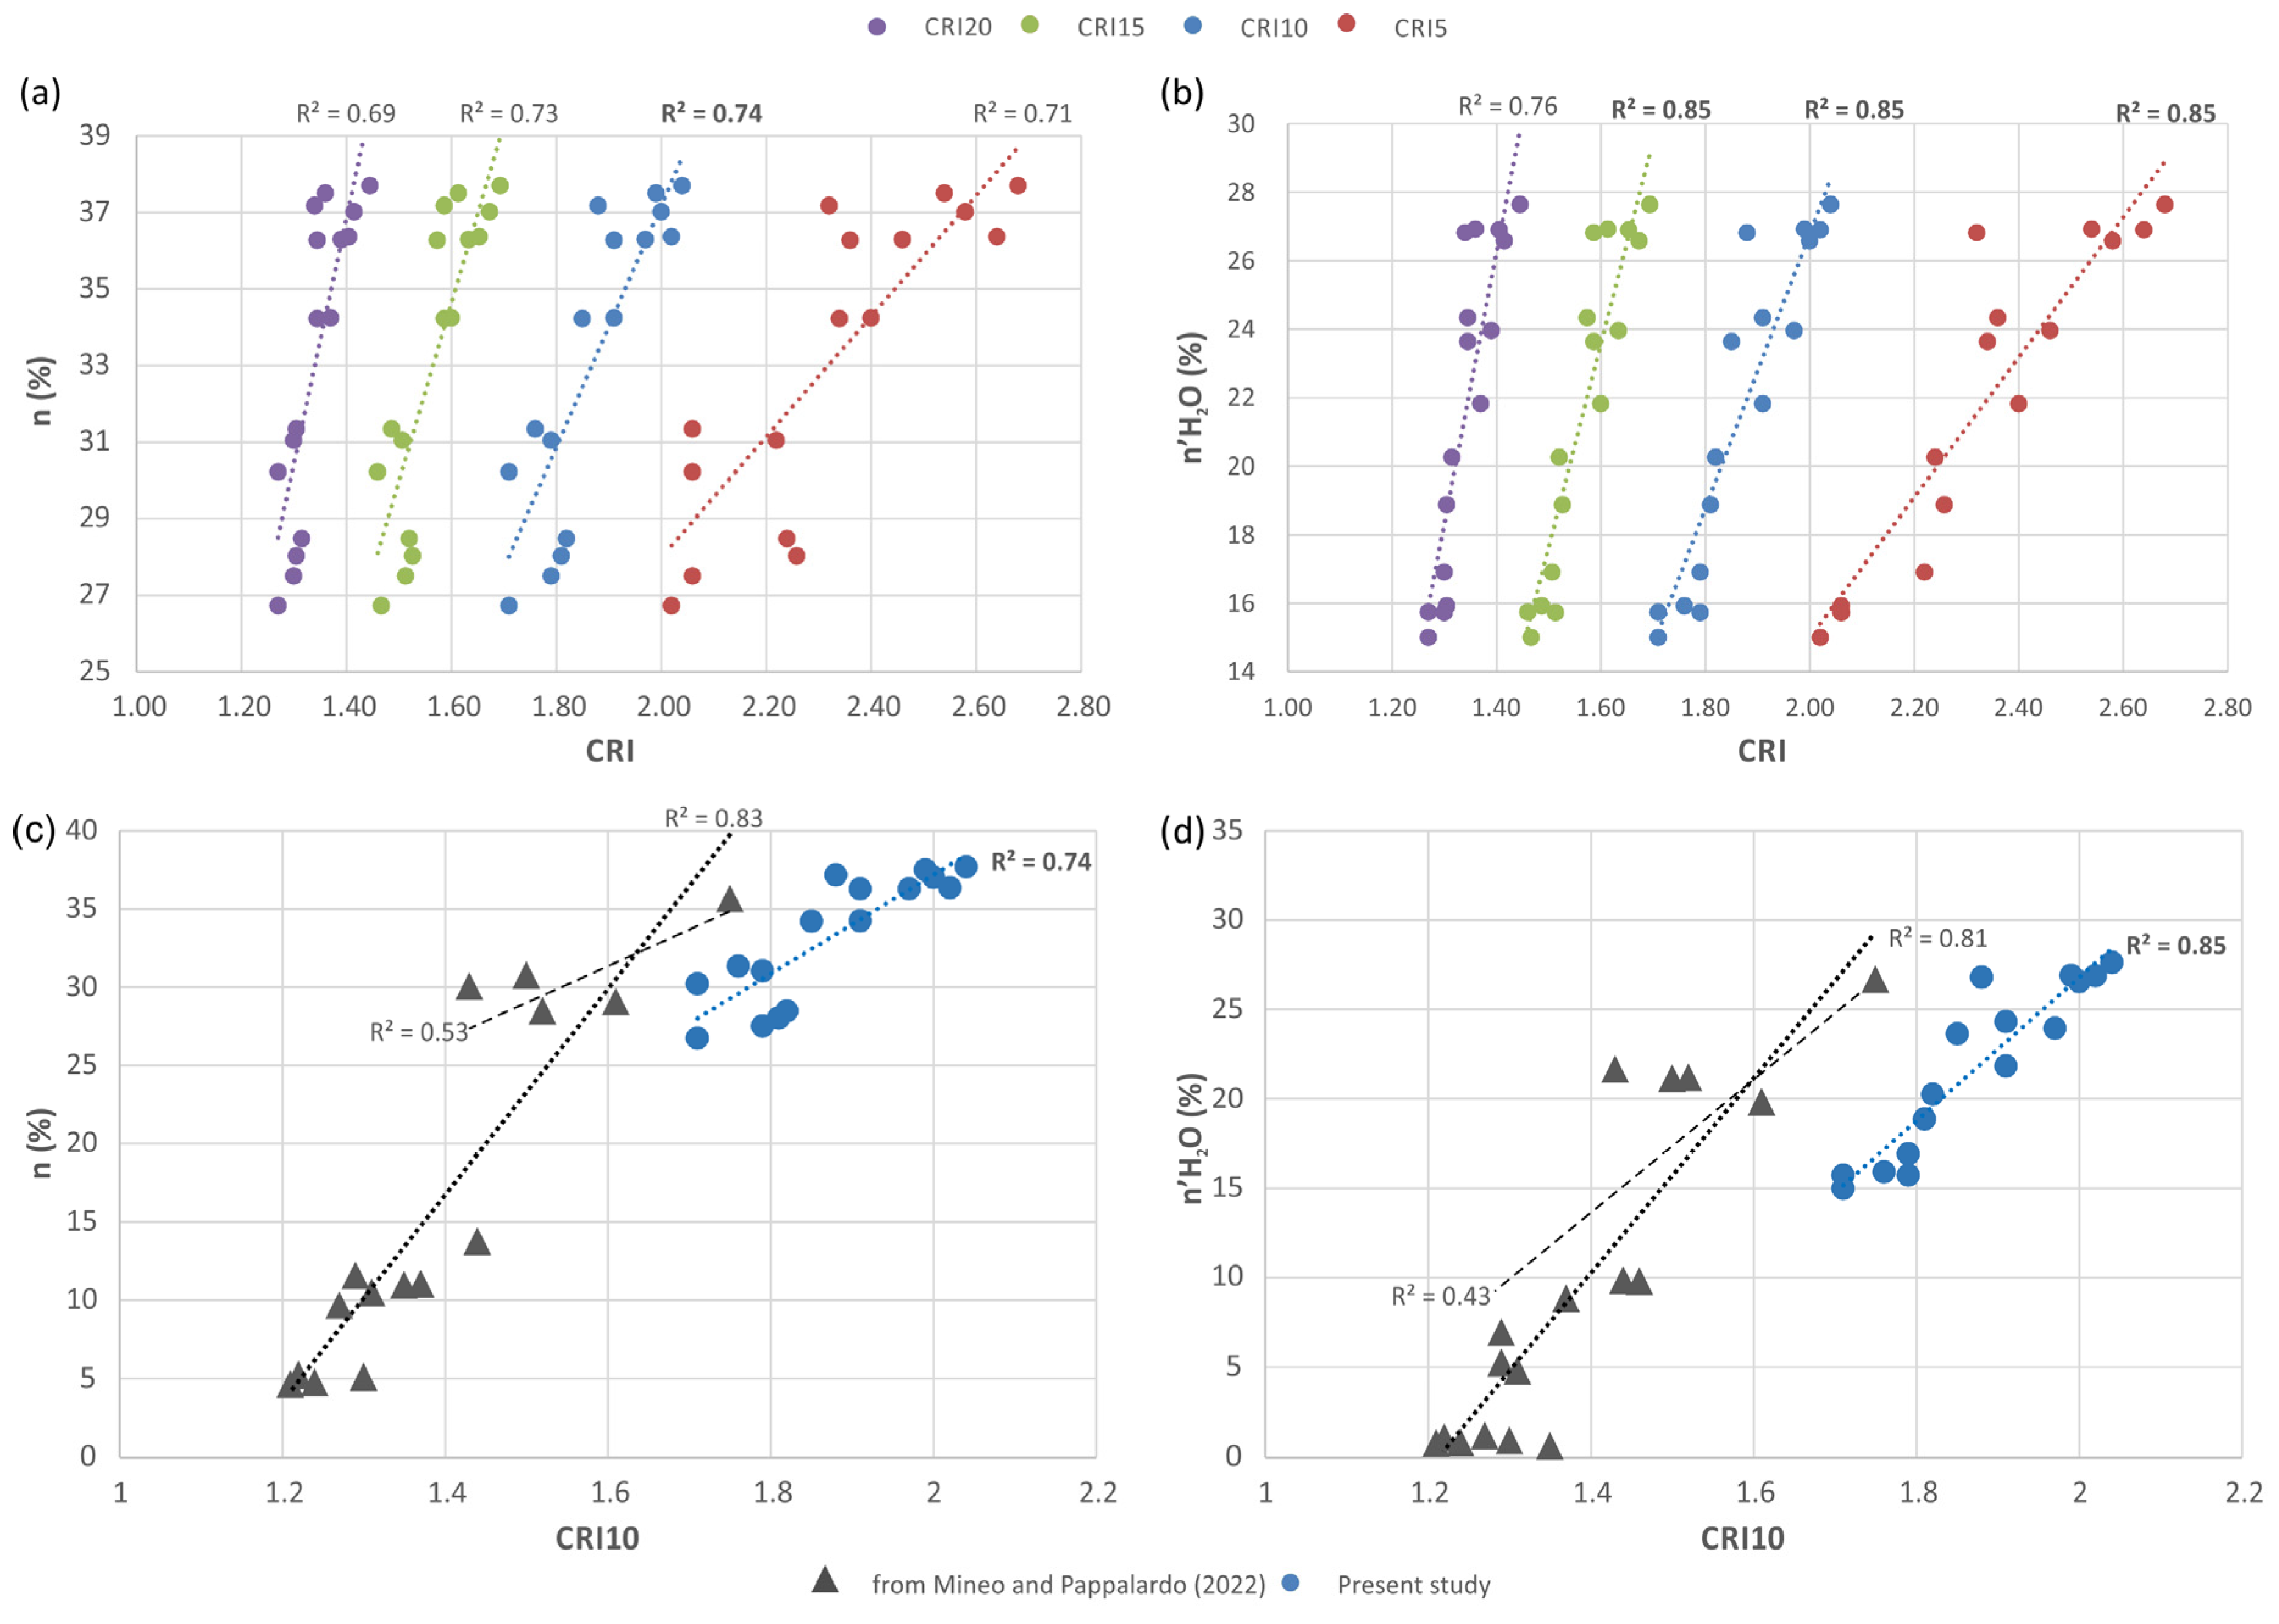
7. Statistical Correlations
7.1. CRI and Rock Porosity on Untreated (Cycle 0) Specimens
7.2. CRI and Rock Porosity after Salt Crystallization Cycles
8. Discussion and Conclusions
Supplementary Materials
Author Contributions
Funding
Acknowledgments
Conflicts of Interest
References
- Hatzor, Y.H.; Palchik, V. A Microstructure-Based Failure Criterion for Aminadav Dolomites. Int. J. Rock Mech. Min. Sci. 1998, 35, 797–805. [Google Scholar] [CrossRef]
- Vernik, L.; Bruno, M.; Bovberg, C. Empirical Relations between Compressive Strength and Porosity of Siliciclastic Rocks. Int. J. Rock Mech. Min. Sci. Geomech. Abstr. 1993, 30, 677–680. [Google Scholar] [CrossRef]
- Al-Harthi, A.A.; Al-Amri, R.M.; Shehata, W.M. The Porosity and Engineering Properties of Vesicular Basalt in Saudi Arabia. Eng. Geol. 1999, 54, 313–320. [Google Scholar] [CrossRef]
- Chang, C.; Zoback, M.D.; Khaksar, A. Empirical Relations between Rock Strength and Physical Properties in Sedimentary Rocks. J. Pet. Sci. Eng. 2006, 51, 223–237. [Google Scholar] [CrossRef]
- Basu, A.; Celestino, T.B.; Bortolucci, A.A. Evaluation of Rock Mechanical Behaviors under Uniaxial Compression with Reference to Assessed Weathering Grades. Rock Mech Rock Eng 2009, 42, 73–93. [Google Scholar] [CrossRef]
- Palchik, V. Influence of Porosity and Elastic Modulus on Uniaxial Compressive Strength in Soft Brittle Porous Sandstones. Rock Mech. Rock Eng. 1999, 32, 303–309. [Google Scholar] [CrossRef]
- Pappalardo, G.; Mineo, S. Static Elastic Modulus of Rocks Predicted through Regression Models and Artificial Neural Network. Eng. Geol. 2022, 308, 106829. [Google Scholar] [CrossRef]
- Sousa, L.M.O.; Suárez Del Río, L.M.; Calleja, L.; Ruiz De Argandoña, V.G.; Rey, A.R. Influence of Microfractures and Porosity on the Physico-Mechanical Properties and Weathering of Ornamental Granites. Eng. Geol. 2005, 77, 153–168. [Google Scholar] [CrossRef]
- Thaulow, N.; Sahu, S. Mechanism of Concrete Deterioration Due to Salt Crystallization. Mater. Charact. 2004, 53, 123–127. [Google Scholar] [CrossRef]
- Benavente, D.; Sanchez-Moral, S.; Fernandez-Cortes, A.; Cañaveras, J.C.; Elez, J.; Saiz-Jimenez, C. Salt Damage and Microclimate in the Postumius Tomb, Roman Necropolis of Carmona, Spain. Environ. Earth Sci. 2011, 63, 1529–1543. [Google Scholar] [CrossRef]
- Pappalardo, G.; Mineo, S.; Caliò, D.; Bognandi, A. Evaluation of Natural Stone Weathering in Heritage Building by Infrared Thermography. Heritage 2022, 5, 2594–2614. [Google Scholar] [CrossRef]
- Keppert, M. Damage of Porous Stones by Salt Crystallization; Čáchová, M., Fořt, J., Koňáková, D., Pavlík, Z., Černý, R., Eds.; WIT Transactions on Modelling and Simulation; WIT Press: Opatija, Croatia, 2015; pp. 333–341. [Google Scholar] [CrossRef]
- Germinario, L.; Oguchi, C.T. Underground Salt Weathering of Heritage Stone: Lithological and Environmental Constraints on the Formation of Sulfate Efflorescences and Crusts. J. Cult. Herit. 2021, 49, 85–93. [Google Scholar] [CrossRef]
- Germinario, L.; Andriani, G.F.; Laviano, R. Decay of Calcareous Building Stone under the Combined Action of Thermoclastism and Cryoclastism: A Laboratory Simulation. Constr. Build. Mater. 2015, 75, 385–394. [Google Scholar] [CrossRef]
- Germinario, L.; Oguchi, C.T. Gypsum, Mirabilite, and Thenardite Efflorescences of Tuff Stone in the Underground Environment. Environ. Earth Sci. 2022, 81, 242. [Google Scholar] [CrossRef]
- Ulusay, R. (Ed.) The Complete ISRM Suggested Methods for Rock Characterization, Testing and Monitoring: 1974–2006; Commission on Testing Methods; International Society for Rock Mechanics: Ankara, Turkey, 2007. [Google Scholar]
- EN1936:2006; European Standard 1936: 2006 Natural Stone Test Methods—Determination of Real Density and Apparent Density, and of Total and Open Porosity. European Union: Maastricht, The Netherlands, 2006.
- Siegesmund, S.; Durrast, H. Physical and Mechanical Properties of Rocks. In Stone in Architecture. Properties, Durability, 5th ed.; Siegesmund, S., Snethlage, R., Eds.; Springer: Berlin, Germany, 2014; pp. 97–224. [Google Scholar]
- Mineo, S.; Pappalardo, G. The Use of Infrared Thermography for Porosity Assessment of Intact Rock. Rock Mech. Rock Eng. 2016, 49, 3027–3039. [Google Scholar] [CrossRef]
- Mineo, S.; Pappalardo, G. InfraRed Thermography Presented as an Innovative and Non-Destructive Solution to Quantify Rock Porosity in Laboratory. Int. J. Rock Mech. Min. Sci. 2019, 115, 99–110. [Google Scholar] [CrossRef]
- Mineo, S.; Pappalardo, G. Nondestructive Rock Porosity Estimation by InfraRed Thermography Applied to Natural Stones. Constr. Build. Mater. 2022, 342, 127950. [Google Scholar] [CrossRef]
- Mineo, S.; Pappalardo, G. Preliminary Results on the Estimation of Porosity in Intact Rock through InfraRed Thermography. ROL 2016, 41, 317–320. [Google Scholar] [CrossRef]
- Germinario, L.; Török, Á. Variability of Technical Properties and Durability in Volcanic Tuffs from the Same Quarry Region—Examples from Northern Hungary. Eng. Geol. 2019, 262, 105319. [Google Scholar] [CrossRef]
- Germinario, L.; Török, Á. Surface Weathering of Tuffs: Compositional and Microstructural Changes in the Building Stones of the Medieval Castles of Hungary. Minerals 2020, 10, 376. [Google Scholar] [CrossRef]
- Lukács, R.; Harangi, S.; Guillong, M.; Bachmann, O.; Fodor, L.; Buret, Y.; Dunkl, I.; Sliwinski, J.; Von Quadt, A.; Peytcheva, I.; et al. Early to Mid-Miocene Syn-Extensional Massive Silicic Volcanism in the Pannonian Basin (East-Central Europe): Eruption Chronology, Correlation Potential and Geodynamic Implications. Earth-Sci. Rev. 2018, 179, 1–19. [Google Scholar] [CrossRef]
- DeWitt, D.P.; Nutter, G.D. Theory and Practice of Radiation Thermometry; Wiley: New York, NY, USA, 1988. [Google Scholar]
- Thomachot-Schneider, C.; Gommeaux, M.; Lelarge, N.; Conreux, A.; Mouhoubi, K.; Bodnar, J.-L.; Vázquez, P. Relationship between Na2SO4 Concentration and Thermal Response of Reconstituted Stone in the Laboratory and on Site. Environ. Earth Sci. 2016, 75, 762. [Google Scholar] [CrossRef]
- Thomachot-Schneider, C.; Vázquez, P.; Gommeaux, M.; Lelarge, N.; Conreux, A.; Drothière, X.; Mouhoubi, K.; Bodnar, J.-L. Thermal Response of Building Stones Contaminated with Salts. Constr. Build. Mater. 2019, 226, 331–344. [Google Scholar] [CrossRef]
- Vazquez, P.; Thomachot-Schneider, C. Infrared Thermography as a Tool to Detect Increasing Cracking in Granitic Stones Exposed to High Temperatures. J. Cult. Herit. 2023, 59, 163–170. [Google Scholar] [CrossRef]
- Franzosi, F.; Casiraghi, S.; Colombo, R.; Crippa, C.; Agliardi, F. Quantitative Evaluation of the Fracturing State of Crystalline Rocks Using Infrared Thermography. Rock Mech. Rock Eng. 2023. [Google Scholar] [CrossRef]
- Caliò, D.; Mineo, S.; Pappalardo, G. Digital Rock Mass Analysis for the Evaluation of Rockfall Magnitude at Poorly Accessible Cliffs. Remote Sens. 2023, 15, 1515. [Google Scholar] [CrossRef]
- Mineo, S.; Caliò, D.; Pappalardo, G. UAV-Based Photogrammetry and Infrared Thermography Applied to Rock Mass Survey for Geomechanical Purposes. Remote Sens. 2022, 14, 473. [Google Scholar] [CrossRef]
- Frodella, W.; Elashvili, M.; Spizzichino, D.; Gigli, G.; Adikashvili, L.; Vacheishvili, N.; Kirkitadze, G.; Nadaraia, A.; Margottini, C.; Casagli, N. Combining InfraRed Thermography and UAV Digital Photogrammetry for the Protection and Conservation of Rupestrian Cultural Heritage Sites in Georgia: A Methodological Application. Remote Sens. 2020, 12, 892. [Google Scholar] [CrossRef]
- Pappalardo, G.; Mineo, S.; Carbone, S.; Monaco, C.; Catalano, D.; Signorello, G. Preliminary Recognition of Geohazards at the Natural Reserve “Lachea Islet and Cyclop Rocks” (Southern Italy). Sustainability 2021, 13, 1082. [Google Scholar] [CrossRef]
- Guerin, A.; Jaboyedoff, M.; Collins, B.D.; Derron, M.-H.; Stock, G.M.; Matasci, B.; Boesiger, M.; Lefeuvre, C.; Podladchikov, Y.Y. Detection of Rock Bridges by Infrared Thermal Imaging and Modeling. Sci. Rep. 2019, 9, 13138. [Google Scholar] [CrossRef]
- Grechi, G.; Fiorucci, M.; Marmoni, G.M.; Martino, S. 3D Thermal Monitoring of Jointed Rock Masses through Infrared Thermography and Photogrammetry. Remote Sens. 2021, 13, 957. [Google Scholar] [CrossRef]
- Mineo, S.; Pappalardo, G. Rock Emissivity Measurement for Infrared Thermography Engineering Geological Applications. Appl. Sci. 2021, 11, 3773. [Google Scholar] [CrossRef]
- Hall, C.; Hamilton, A. Porosities of Building Limestones: Using the Solid Density to Assess Data Quality. Mater. Struct. 2016, 49, 3969–3979. [Google Scholar] [CrossRef]


| Tuff Variety | Total Porosity (%) | Effective Porosity (%) | Bulk Density (g/cm3) |
|---|---|---|---|
| Bogács | 29.37 (±2.1) | 15.86 (±0.7) | 1.78 (±0.05) |
| Demjén | 37.15 (±0.5) | 26.97 (±0.4) | 1.51 (±0.01) |
| Sirok | 32.93 (±3.7) | 22.15 (±2.2) | 1.64 (±0.09) |
| Tuff Variety | Sample ID | Cycle Number | He Pycnometry | MIP | |||||
|---|---|---|---|---|---|---|---|---|---|
| Matrix Density | Bulk Density | Total Porosity | Specific Pore Volume | Main Peaks of Pore-Size Distribution Curves | Open Porosity | Specific Surface Area | |||
| (g/cm3) | (g/cm3) | (%) | (cm3/g) | (μm) | (%) | (m2/g) | |||
| Bogács | BG_C_8 | 4 | 2.5713 (±0.0003) | 1.818 (±0.001) | 29.29 (±0.05) | 0.161 (±3.5 × 10⁻⁴) | 4.99|2.88 | 25.67 | 10.54 |
| BG_C_S_19 | 6 | 2.5207 (±0.0004) | 1.809 (±0.001) | 28.22 (±0.02) | 0.156 (±1.6 × 10⁻⁴) | 4.73|3.11 | 23.80 | 11.15 | |
| BG_C_09 | 10 | 2.5414 (±0.0001) | 1.835 (±0.001) | 27.79 (±0.04) | 0.151 (±3.2 × 10⁻⁴) | 4.74|2.96|0.07 | 26.29 | 9.32 | |
| BG_C_11 | 23 | 2.5343 (±0.0003) | 1.897 (±0.001) | 25.13 (±0.04) | 0.132 (±2.9 × 10⁻⁴) | 5.53|4.99 | 19.81 | 9.42 | |
| Demjén | DJ_S_09 | 2 | 2.4977 (±0.0004) | 1.474 (±0.002) | 40.97 (±0.06) | 0.278 (±7.2 × 10⁻⁴) | 5.99 | 31.66 | 3.38 |
| Sirok | SK_S_07 | 2 | 2.4983 (±0.0010) | 1.685 (±0.002) | 32.57 (±0.10) | 0.193 (±8.5 × 10⁻⁴) | 12.2|0.10 | 30.42 | 13.50 |
| SK_35 | 4 | 2.4617 (±0.0004) | 1.709 (±0.002) | 30.58 (±0.10) | 0.179 (±8.2 × 10⁻⁴) | 1.04|0.08|0.02 | 22.76 | 15.20 | |
| SK_S_21 | 6 | 2.4788 (±0.0005) | 1.713 (±0.001) | 30.87 (±0.04) | 0.180 (±2.8 × 10⁻⁴) | 0.14 | 26.39 | 10.76 | |
| SK_S_31 | 10 | 2.4786 (±0.0009) | 1.739 (±0.001) | 29.83 (±0.04) | 0.172 (±2.5 × 10⁻⁴) | 1.04|0.02 | 23.60 | 15.82 | |
| SK_S_34 | 23 | 2.4546 (±0.0009) | 1.763 (±0.002) | 28.16 (±0.07) | 0.160 (±4.8 × 10⁻⁴) | 0.13 | 23.41 | 12.34 | |
Disclaimer/Publisher’s Note: The statements, opinions and data contained in all publications are solely those of the individual author(s) and contributor(s) and not of MDPI and/or the editor(s). MDPI and/or the editor(s) disclaim responsibility for any injury to people or property resulting from any ideas, methods, instructions or products referred to in the content. |
© 2023 by the authors. Licensee MDPI, Basel, Switzerland. This article is an open access article distributed under the terms and conditions of the Creative Commons Attribution (CC BY) license (https://creativecommons.org/licenses/by/4.0/).
Share and Cite
Mineo, S.; Germinario, L.; Török, Á.; Pappalardo, G. Relationship between Rock Porosity and Infrared Cooling Rate in Non-Standard Specimens of Tuffs Used in the Hungarian Cultural Heritage. Minerals 2023, 13, 1100. https://doi.org/10.3390/min13081100
Mineo S, Germinario L, Török Á, Pappalardo G. Relationship between Rock Porosity and Infrared Cooling Rate in Non-Standard Specimens of Tuffs Used in the Hungarian Cultural Heritage. Minerals. 2023; 13(8):1100. https://doi.org/10.3390/min13081100
Chicago/Turabian StyleMineo, Simone, Luigi Germinario, Ákos Török, and Giovanna Pappalardo. 2023. "Relationship between Rock Porosity and Infrared Cooling Rate in Non-Standard Specimens of Tuffs Used in the Hungarian Cultural Heritage" Minerals 13, no. 8: 1100. https://doi.org/10.3390/min13081100
APA StyleMineo, S., Germinario, L., Török, Á., & Pappalardo, G. (2023). Relationship between Rock Porosity and Infrared Cooling Rate in Non-Standard Specimens of Tuffs Used in the Hungarian Cultural Heritage. Minerals, 13(8), 1100. https://doi.org/10.3390/min13081100