Abstract
Thermal history modeling based on low-temperature thermochronological data is widely used in the study of geology. Despite its common applications, several problems remain easy to ignore yet should not be overlooked in the execution of such models. This paper describes four key problems of thermal history modeling, namely, (1) is the best-fit thermal history the best? (2) Is the date constraint box a suitable constraint? (3) Does the bimodal distribution of the apatite fission track confined track length absolutely correspond to the cooling reheating model? (4) Is the whole thermal history path credible? Counterexamples are then provided to stress the importance of accounting for these problems in the application of thermal history modeling. Acknowledging the uncertainty and considering the geological constraints are recommended to improve the accuracy of thermal history models. Moreover, thermal historical intervals with high credibility and strong constraint ability are recommended to interpret the selected geological phenomenon.
1. Introduction
Low-temperature thermochronology (e.g., apatite and zircon fission track (AFT and ZFT) and apatite and zircon (U–Th)/He (Ahe and ZHe)) records rock exhumation information within several kilometers of the shallow crust. It is widely used in the study of the uplift and exhumation of orogenic belts, topographic evolution, sedimentary basin evolution, fault activity, and deposit preservation [1,2]. As a principal method for the interpretation of low-temperature thermochronological data, thermal history modeling provides key information for the visualization and quantification of rock exhumation history. Therefore, the quality of thermal history modeling has a significant impact on the application of low-temperature thermochronology.
Although thermal history modeling is commonly employed among scholars, it is associated with several problems that users can easily fall into, potentially resulting in an incorrect interpretation of the geological phenomenon. Previous research has addressed this issue, making certain progress [3,4,5,6,7,8,9]. However, solving such problems proves to be a complicated task, considering the complexities of the relevant geological processes, the multiple solutions for low-temperature thermochronological data, and the limitations of mathematical algorithms. Thus, achieving a comprehensive understanding of the bottlenecks associated with thermal history modeling will aid in avoiding them, allowing us to explain geological phenomena more accurately.
Therefore, this paper presents several problems of thermal history modeling using synthetic and real examples and explains why they occur. We aim to improve the awareness of uncertainty in thermal history modeling, particularly for beginner users. The used software and model parameters are introduced in Appendix A.
2. Problems Associated with Thermal History Modeling
2.1. Problem 1: Is the Best-Fit Thermal History the Best?
The best-fit thermal history is typically obtained by users via modeling software (e.g., HeFTy [10]). The best-fit thermal history is the output thermal history with the highest goodness-of-fit (GOF). However, this fitted thermal history is often not the best fit for the real thermal history. For example, in Figure 1a, we input thermal history as the target for the thermal history inversion, and Figure 1b presents the AFT date and the distribution of the confined fission track. After 10,000 thermal histories being randomly searched, the best-fit thermal history is compared with the mean history of all acceptable histories. The comparison is performed four times based on the thermal history inversions (Figure 1c–j). The best-fit history is not as stable as the mean thermal history, although the former fits the input history very well at times. Therefore, the mean thermal history is recommended for data interpretations.
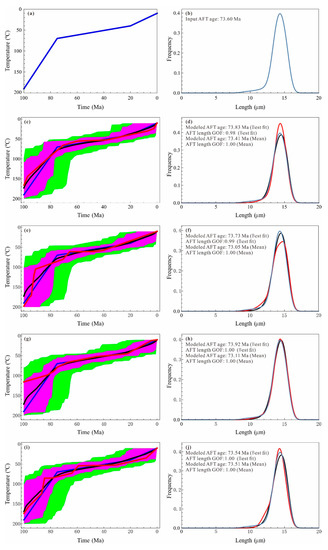
Figure 1.
Thermal history models of synthetic sample A1. A total of 10,000 t-T paths were randomly generated using the Monte Carlo method. The blue, red, and black solid lines indicate the input thermal history, best-fit thermal history, and mean thermal history in (a,c,e,g,i) and their corresponding distributions of the AFT confined track length in (b,d,f,h,j), respectively. The mean of all good t-T paths (i.e., GOF ≥ 0.5) was used as the mean thermal history of the sample. Magenta and green areas define the good fit (GOF ≥ 0.5) and acceptable fit (GOF ≥ 0.05) regions, respectively.
We repeated the thermal history modeling 100 times. A total of 10,000 t-T paths were randomly generated using the Monte Carlo method each time. We compared the input thermal history, best-fit thermal histories, and mean thermal histories. The result shows that the mean thermal histories are more stable than the best-fit thermal histories (Figure 2).
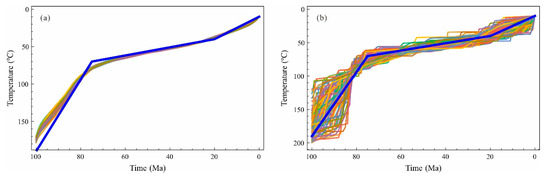
Figure 2.
Comparison of stability for the mean thermal histories and best-fit thermal histories. The thermal history modeling was repeated 100 times, and 10,000 t-T paths were randomly generated using the Monte Carlo method each time. The line blue indicates the input thermal history. (a) The 100 colored lines represent the mean thermal histories of all good t-T paths (i.e., GOF ≥ 0.5) at each modeling repetition; (b) the 100 colored lines represent the best-fit thermal history at each modeling repetition.
2.2. Problem 2: Is the Date Constraint Box a Suitable Constraint?
Low-temperature thermal history modeling is generally achieved using AFT data, with the other dates (e.g., (U-Th)/He and ZFT) sometimes employed as a constraint box to force all t-T paths to pass through it. This is the case when users would like to manually set a date constraint based on its closure temperature. This method is relatively simple and easy to operate, yet the temperature coordinates corresponding to the (U-Th)/He and ZFT dates (i.e., the closure temperature) are obtained under the assumption that the thermal history is linear. Although this is used to model the ever-changing thermal history, it is contradictory and results in new subjective errors. We use sample DB43 from Tiantangzhai peak in Dabie Mountain, China [11,12] (see Appendix B) as an example to explain this problem.
Figure 3a,b depicts the thermal history obtained via the direct inversion of the AHe and AFT datasets, while Figure 3c,d presents the thermal history determined using the AHe data as the date constraint box to constrain the AFT inversion. Comparing the two results reveals a deviation of the t-T paths induced by the constraint box.
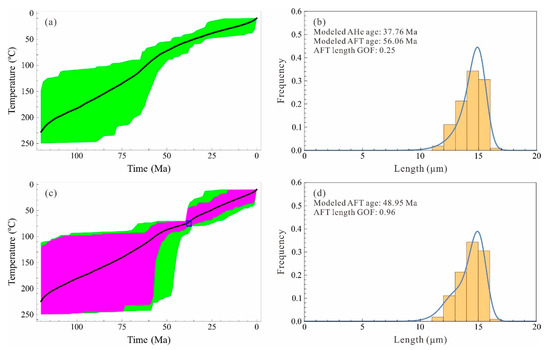
Figure 3.
Thermal history models of sample DB43. (a,b) AHe date and AFT are joined to invert the thermal history. (c,d) AHe date is used as the constrained box. Then, 10,000 t-T paths were randomly generated using the Monte Carlo method. Magenta and green areas define good fit (GOF ≥ 0.5) and acceptable fit (GOF ≥ 0.05) regions, respectively. The mean thermal history (black solid line) of all good t-T paths (GOF ≥ 0.5) is taken as the modeling output.
By comparing the t-T path and its corresponding date, we can reveal why it is not suitable to force the t-T path to pass the date constraint. We randomly generate 10 t-T paths and calculate their dates, including AHe, AFT, ZHe, and ZFT. We plot all their dates together with the closure temperature ranges and t-T paths (Figure 4). In Figure 4, we can see that the t-T paths do not always cross their date ranges. More specifically, there is no sufficient evidence to indicate that the t-T path must pass the date constraints, even if the date exhibits an error range.
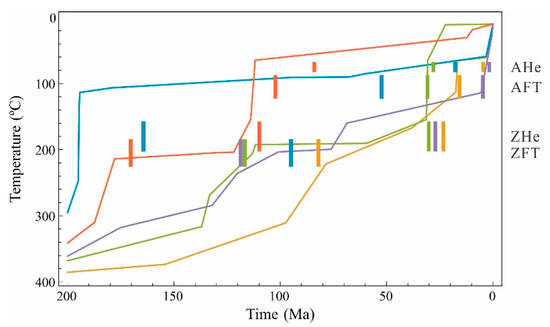
Figure 4.
Comparison of the t-T path and its corresponding dates. A total of 10 t-T paths are randomly generated. The closure temperatures of AHe, AFT, ZHe, and ZFT are assumed to be 75 ± 5 °C [13,14], 90–120 °C [15,16], 160–200 °C [17], and 205 ± 18 °C [18], respectively. The t-T paths are corresponding to the AHe, AFT, ZHe, and ZFT dates with the same color, respectively.
2.3. Problem 3: Does the Bimodal Distribution of Apatite Fission Track Confined Track Length Absolutely Correspond to the Cooling Reheating Model?
The bimodal distribution of the AFT confined fission track length is generally considered to correspond to the reheating processes [19]. However, at times, this is impractical as the long and slow cooling in the partial annealing zone produces a bimodal distribution.
The sample synthetic example A2 is employed to present this phenomenon (Figure 5). This example suggests that the long and slow cooling phase during the partial annealing zone accumulates a group of fission tracks with shorter lengths. The later rapid cooling phase outside of the partial annealing zone accumulates another fission track group with longer lengths. These two fission track groups form a bimodal distribution.
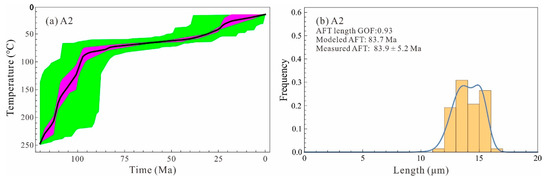
Figure 5.
(a) Thermal history models of the synthetic sample A2. A total of 10,000 t-T paths were randomly generated using the Monte Carlo method. Magenta and green areas define good fit (GOF ≥ 0.5) and acceptable fit (GOF ≥ 0.05) regions. The mean thermal history (black solid line) of all good t-T paths (GOF ≥ 0.5) is taken as the modeling output; (b) The comparison of input (histogram) and modeled (blue solid line) distributions of the AFT confined track length. The modeled distribution is corresponding to the mean thermal history.
We randomly generate 20 t-T paths with a cooling-only model and bimodal fission track length distribution (Figure 6). A long and slow cooling phase during the partial annealing zone is observed for all 20 t-T paths. This is attributed to the effects of both temperature and time on the fission track length distribution. The temperature has a more significant impact on the annealing of the fission track length than the time, according to the annealing equation (e.g., Ref. [16]), and the time decides the accumulation of the fission tracks. Therefore, for the reheating model, the short time reheating into the partial annealing zone can cause the older fission tracks to anneal significantly and form a bimodal fission track length distribution. For the cooling-only model, the relatively long time stay on the partial annealing zone also cause enough shortened fission tracks to accumulate to form a peak in the fission track length distribution, while the other peak is formed by the tracks without experiencing partial annealing.
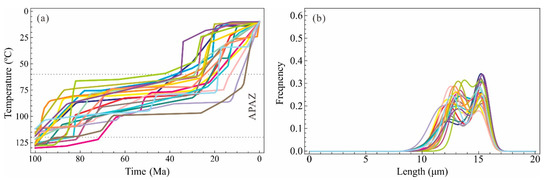
Figure 6.
Thermal history models with cooling-only model and bimodal fission track length distributions. (a) A total of 20 t-T paths were randomly generated using the Monte Carlo method; (b) Distributions of apatite fission track length calculated by the 20 t-T paths in (a). APAZ: AFT partial annealing zone.
2.4. Problem 4: Is the Whole Thermal History Path Credible?
When interpreting thermal history modeling results, some geologists often provide a detailed explanation of the entire thermal history temperature time period. However, the temperature range of a thermal history curve that can be constrained by the low-temperature thermochronological data is limited. More specifically, the temperature phase outside the closure temperature is not controlled.
Sample DB45 [11,12] from Dabie Mountain, China, is taken as an example to model the thermal history using AFT and AHe data, respectively (Figure 7) [20]. In order to clearly demonstrate the constraints of these three variables on the thermal history, the higher temperature component of the history beyond the partial annealing AFT zone is removed in Figure 7. This example reveals the following key observations:
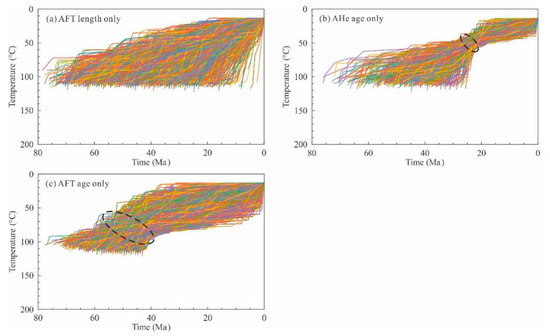
Figure 7.
Comparison of thermal history modeling results using the AFT length (a), AHe date (b) and AFT date (c) for DB45 (modified from [20]). A total of 10,000 thermal histories were randomly searched. All thermal histories with GOF ≥ 0.32 (i.e., errors within 1σ) are reserved.
- The closure temperature of each thermal history curve is distinct. For a rapid cooling thermal history curve, the complete annealing time is earlier, and the closure temperature is slightly higher. In contrast, for a slow cooling thermal history curve, the time for complete annealing is older, and the closure temperature is slightly lower. Moreover, the closure temperature of the AHe thermal history model using He diffusion kinetic models (radiation damage accumulation and annealing model, RDAAM [21]) is similar to that of AFT.
- The constraints of the AHe and AFT dates and AFT length on the thermal history are distinct. The constraint of the date on the thermal history curve is limited to the measured data and the partial annealing zone. The constraint time of the AFT track length on the thermal history is not only limited to the measured date but also has a larger span. However, although the constraint temperature range of the AFT track length is wide, the constraint time range is not centralized.
Therefore, it is important to clearly understand that the temperature range outside the closure temperature does not exert any constraints on the thermal history curve as 4He cannot be retained or the track is completely annealed.
3. Conclusions
We present and analyze four key problems that are frequently encountered in the thermal history modeling process. The results reveal that low-temperature thermochronological data have limited constraints on thermal history modeling and often require additional accurate geological knowledge obtained through other means to jointly constrain the model. The thermal history modeling algorithm itself must be understood by the user with respect to its suitability in describing actual geological conditions. This work helps geologists avoid the misinterpretation of current thermal history modeling methods and the corresponding results, despite their great progress in the field.
There is also a need to enhance the applicability of thermal history modeling. For example, more thermal history modeling methods corresponding to the different types of thermochronological data must be developed to expand the constrainable modeling interval. A method of incorporating more geological constraints may an issue to consider in the future.
Funding
This study was jointly supported by the National Natural Science Foundation of China (nos. 42072229; 41102131; 41972049; and 41972302), the Guangdong Natural Science Foundation (no. 2021A1515011658), and the Science and Technology Program of Guangzhou (no. 202002030184).
Data Availability Statement
Not Applicable.
Conflicts of Interest
The author declares no conflict of interest regarding the publication of this paper.
Appendix A
The Low-T Thermo computer code [20] was employed for thermal history modeling. The model parameters included the spherical diffusion equation [22], the Arrhenius equation [23], the (U-Th)/He date equation [13], the alpha particle stopping distance [24], and the He diffusion kinetic models for AHe (radiation damage accumulation and annealing model) [21], and for ZHe (zircon damage accumulation and annealing model) [25], the fanning curvilinear fit AFT annealing model for the C-axis projected track lengths [26], and the ZFT annealing model [25] with a ratio of spontaneous track length to induced track length in the standard set at 0.995. The minimum of the apatite fission track age, apatite fission track length, and zircon fission track age were employed for the overall GOF.
Appendix B
Dabie Mountain lies in eastern China and is interpreted as a Triassic suture zone between the North China block and the South China block [11,12]. In the early to middle Cretaceous, Dabie Mountain experienced a second major orogenic event that was dominantly extensional and accompanied by voluminous magmatism [11,12]. The Tiantangzhai peak is composed of early Cretaceous magmatic rock and has experienced continuous exhumation since the Cretaceous. The samples DB43 and DB45 were collected from the Tiantangzhai peak, and their AHe and AFT data are shown as follows:

Table A1.
Apatite (U-Th)/He data from Dabie Mountain [11,12].
Table A1.
Apatite (U-Th)/He data from Dabie Mountain [11,12].
| Sample | Longitude | Latitude | Lithology | Elevation (m) | U (ppm) | Th (ppm) | He (nmol/g) | Radius (μm) | FT | Age (Ma) | 1σ (Ma) |
|---|---|---|---|---|---|---|---|---|---|---|---|
| DB43 | 115.78873 | 31.09673 | Granite | 860 | 10.4 | 26.5 | 2.79 | 77 | 0.83 | 37.7 | 1.2 |
| DB45 | 115.82327 | 31.07343 | Migmatite | 340 | 8.52 | 2.2 | 0.949 | 60 | 0.77 | 25.3 | 1.0 |
Table A2.
Apatite fission track data from Dabie Mountain [11,12].
Table A2.
Apatite fission track data from Dabie Mountain [11,12].
| Sample | Grains | ρs (106 cm−2) | Ns | ρi (106 cm−2) | Ni | P (χ2) | ρd (106 cm−2) | Nd | Age (Ma) | 1σ (Ma) | Counted Track | Mean Track Length (μm) | 1σ (μm) |
|---|---|---|---|---|---|---|---|---|---|---|---|---|---|
| DB43 | 24 | 0.188 | 125 | 0.872 | 581 | 0.211 | 4.059 | 4117 | 49.5 | 5.1 | 108 | 13.04 | 1.59 |
| DB45 | 22 | 0.167 | 127 | 0.883 | 670 | 0.042 | 4.050 | 4117 | 43.5 | 4.4 | 100 | 13.58 | 1.68 |
Note: ρs and ρi represent sample spontaneous and induced track densities; Ns and Ni represent the numbers of spontaneous and induced tracks.
References
- Reiners, P.W. Past, Present, and Future of Thermochronology. Rev. Mineral. Geochem. 2005, 58, 1–18. [Google Scholar] [CrossRef]
- Zhou, Z. Low Temperature Thermochronology: Principles & Applications; Science Press: Beijing, China, 2014; pp. 1–230. [Google Scholar]
- Vermeesch, P.; Tian, Y. Thermal History Modelling: HeFTy vs. QTQt. Earth-Sci. Rev. 2014, 139, 279–290. [Google Scholar] [CrossRef]
- Gallagher, K.; Ketcham, R.A. Comment on “Thermal History Modelling: HeFTy vs. QTQt” by Vermeesch and Tian, Earth-Science Reviews (2014), 139, 279–290. Earth-Sci. Rev. 2018, 176, 387–394. [Google Scholar] [CrossRef]
- Vermeesch, P.; Tian, Y. Reply to Comment on “Thermal History Modelling: HeFTy vs. QTQt” by K. Gallagher and R.A. Ketcham. Earth-Sci. Rev. 2018, 176, 395–396. [Google Scholar] [CrossRef]
- Gallagher, K.; Ketcham, R.A. Comment on the Reply to the Comment on “Thermal History Modelling: HeFTy vs. QTQt” by Vermeesch and Tian, Earth-Science Reviews (2014), 139, 279–290. Earth-Sci. Rev. 2020, 203, 102878. [Google Scholar] [CrossRef]
- Green, P.; Duddy, I. Discussion: Extracting Thermal History from Low Temperature Thermochronology. A Comment on Recent Exchanges between Vermeesch and Tian and Gallagher and Ketcham. Earth-Sci. Rev. 2021, 216, 103197. [Google Scholar] [CrossRef]
- Gallagher, K. Comment on “Discussion: Extracting Thermal History from Low Temperature Thermochronology/A Comment on the Recent Exchanges between Vermeesch and Tian and Gallagher and Ketcham”, by Paul Green and Ian Duddy, Earth Science Reviews. https://doi.org/10.1016/j.Earscirev.2020.103197. Earth-Sci. Rev. 2021, 216, 103549. [Google Scholar] [CrossRef]
- Green, P.; Duddy, I. Reply to Comment on “Discussion: Extracting Thermal History from Low Temperature Thermochronology/A Comment on the Recent Exchanges between Vermeesch and Tian and Gallagher and Ketcham”, by Paul Green and Ian Duddy, Earth Science Reviews. https://doi.org/10.1016/j.Earscirev.2020.103197. Earth-Sci. Rev. 2021, 216, 103550. [Google Scholar] [CrossRef]
- Ketcham, R.A. Forward and Inverse Modeling of Low-Temperature Thermochronometry Data. Rev. Mineral. Geochem. 2005, 58, 275–314. [Google Scholar] [CrossRef]
- Reiners, P.W. Post-Orogenic Evolution of the Dabie Shan, Eastern China, from (U-Th)/He and Fission track Thermochronology. Am. J. Sci. 2003, 303, 489–518. [Google Scholar] [CrossRef]
- Zhou, Z.; Xu, C.; Reiners, P.W.; Yang, F.; Donelick, R.A. Late Cretaceous-Cenozoic Exhumation History of Tiantangzhai Region of Dabieshan Orogen: Constraints from (U-Th)/He and Fission Track Analysis. Chin. Sci. Bull. 2003, 48, 1151–1156. [Google Scholar] [CrossRef]
- Farley, K.A. (U-Th)/He Dating: Techniques, Calibrations, and Applications. Rev. Mineral. Geochem. 2002, 47, 819–844. [Google Scholar] [CrossRef]
- Wolf, R.A.; Farley, K.A.; Kass, D.M. Modeling of the Temperature Sensitivity of the Apatite (U–Th)/He Thermochronometer. Chem. Geol. 1998, 148, 105–114. [Google Scholar] [CrossRef]
- Laslett, G.M.; Green, P.F.; Duddy, I.R.; Gleadow, A.J.W. Thermal Annealing of Fission Tracks in Apatite 2. A Quantitative Analysis. Chem. Geol. Isot. Geosci. Sect. 1987, 65, 1–13. [Google Scholar] [CrossRef]
- Ketcham, R.A.; Donelick, R.A.; Carlson, W.D. Variability of Apatite Fission track Annealing Kinetics; III, Extrapolation to Geological Time Scales. Am. Mineral. 1999, 84, 1235–1255. [Google Scholar] [CrossRef]
- Reiners, P.W.; Spell, T.L.; Nicolescu, S.; Zanetti, K.A. Zircon (U-Th)/He Thermochronometry: He Diffusion and Comparisons with 40Ar/39Ar Dating. Geochim. Cosmochim. Acta 2004, 68, 1857–1887. [Google Scholar] [CrossRef]
- Bernet, M.A. Field-Based Estimate of the Zircon Fission track Closure Temperature. Chem. Geol. 2009, 259, 181–189. [Google Scholar] [CrossRef]
- Gleadow, A.J.W.; Duddy, I.R.; Green, P.F.; Lovering, J.F. Confined Fission Track Lengths in Apatite: A Diagnostic Tool for Thermal History Analysis. Contrib. Mineral. Petrol. 1986, 94, 405–415. [Google Scholar] [CrossRef]
- Ding, R. Low Temperature Thermal History Reconstruction Based on Apatite Fission track Length Distribution and Apatite U-Th/He Age Using Low-T Thermo. J. Earth Sci. 2023, 34, 717–725. [Google Scholar] [CrossRef]
- Flowers, R.M.; Ketcham, R.A.; Shuster, D.L.; Farley, K.A. Apatite (U–Th)/He Thermochronometry Using a Radiation Damage Accumulation and Annealing Model. Geochim. Cosmochim. Acta 2009, 73, 2347–2365. [Google Scholar] [CrossRef]
- Carslaw, H.S.; Jaeger, J.C. Conduction of Heat in Solids; Clarendon Press: Oxford, UK, 1959. [Google Scholar]
- Reiners, P.W.; Brandon, M.T. Using Thermochronology to Understand Orogenic Erosion. Annu. Rev. Earth Planet. Sci. 2006, 34, 419–466. [Google Scholar] [CrossRef]
- Ketcham, R.A.; Gautheron, C.; Tassan-Got, L. Accounting for Long Alpha-Particle Stopping Distances in (U–Th–Sm)/He Geochronology: Refinement of the Baseline Case. Geochim. Cosmochim. Acta 2011, 75, 7779–7791. [Google Scholar] [CrossRef]
- Guenthner, W.R.; Reiners, P.W.; Ketcham, R.A.; Nasdala, L.; Giester, G. Helium Diffusion in Natural Zircon: Radiation Damage, Anisotropy, and the Interpretation of Zircon (U-Th)/He Thermochronology. Am. J. Sci. 2013, 313, 145–198. [Google Scholar] [CrossRef]
- Ketcham, R.A.; Carter, A.; Donelick, R.A.; Barbarand, J.; Hurford, A.J. Improved Modeling of Fission track Annealing in Apatite. Am. Mineral. 2007, 92, 799–810. [Google Scholar] [CrossRef]


Disclaimer/Publisher’s Note: The statements, opinions and data contained in all publications are solely those of the individual author(s) and contributor(s) and not of MDPI and/or the editor(s). MDPI and/or the editor(s) disclaim responsibility for any injury to people or property resulting from any ideas, methods, instructions or products referred to in the content. |
© 2023 by the author. Licensee MDPI, Basel, Switzerland. This article is an open access article distributed under the terms and conditions of the Creative Commons Attribution (CC BY) license (https://creativecommons.org/licenses/by/4.0/).