3.2. Hydraulic Fracture Propagation in Sandstone
Hydraulic fracturing experiments were conducted on the four sandstone specimens at
of 22 MPa and
of 8 MPa. The horizontal fracture orientation was induced and controlled by the sample loading scheme; in all tests, the induced fracture was oriented in the
direction perpendicular to the
direction. Fluids such as non-Newtonian OilGel 40/40 (OG with a viscosity equal to 1220 cP at 100 rpm, which decreases to 310.81 cP at 300 rpm) and Newtonian viscous silicone oils (SOs with viscosities of 10,000 cP and 100,000 cP) were injected at a constant rate of 5 mL/min. The main experimental conditions are described in
Table 5.
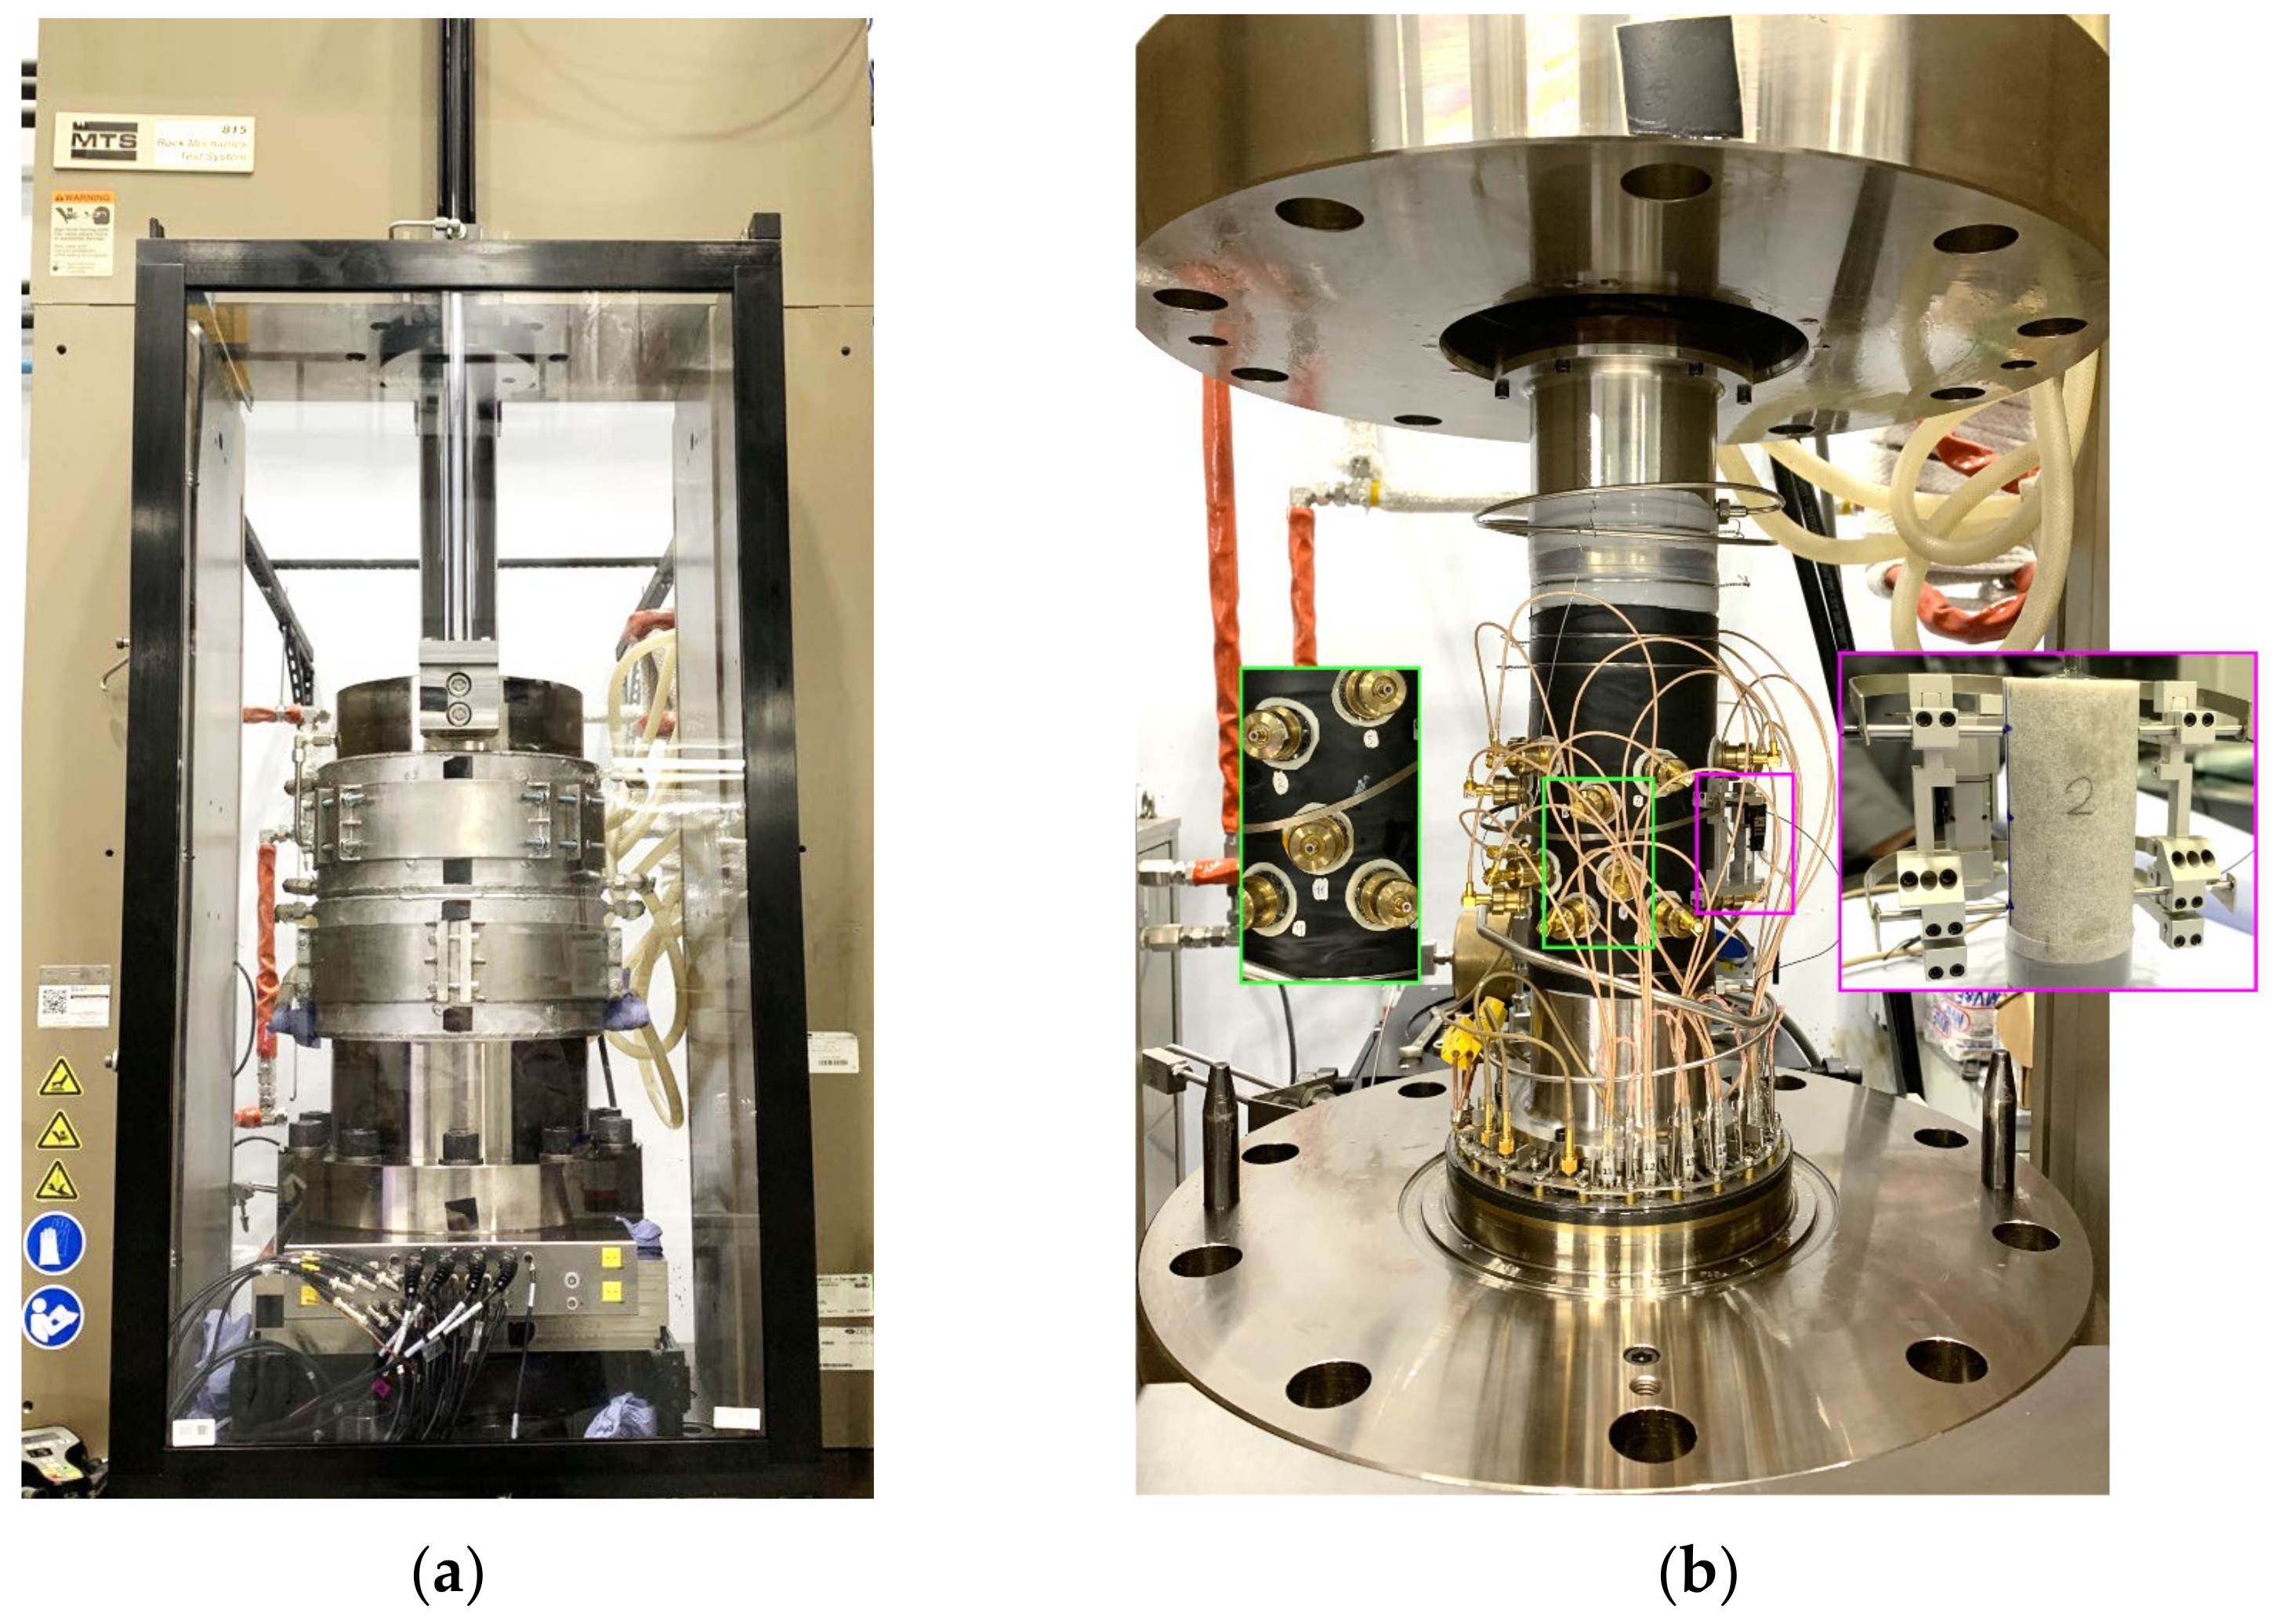
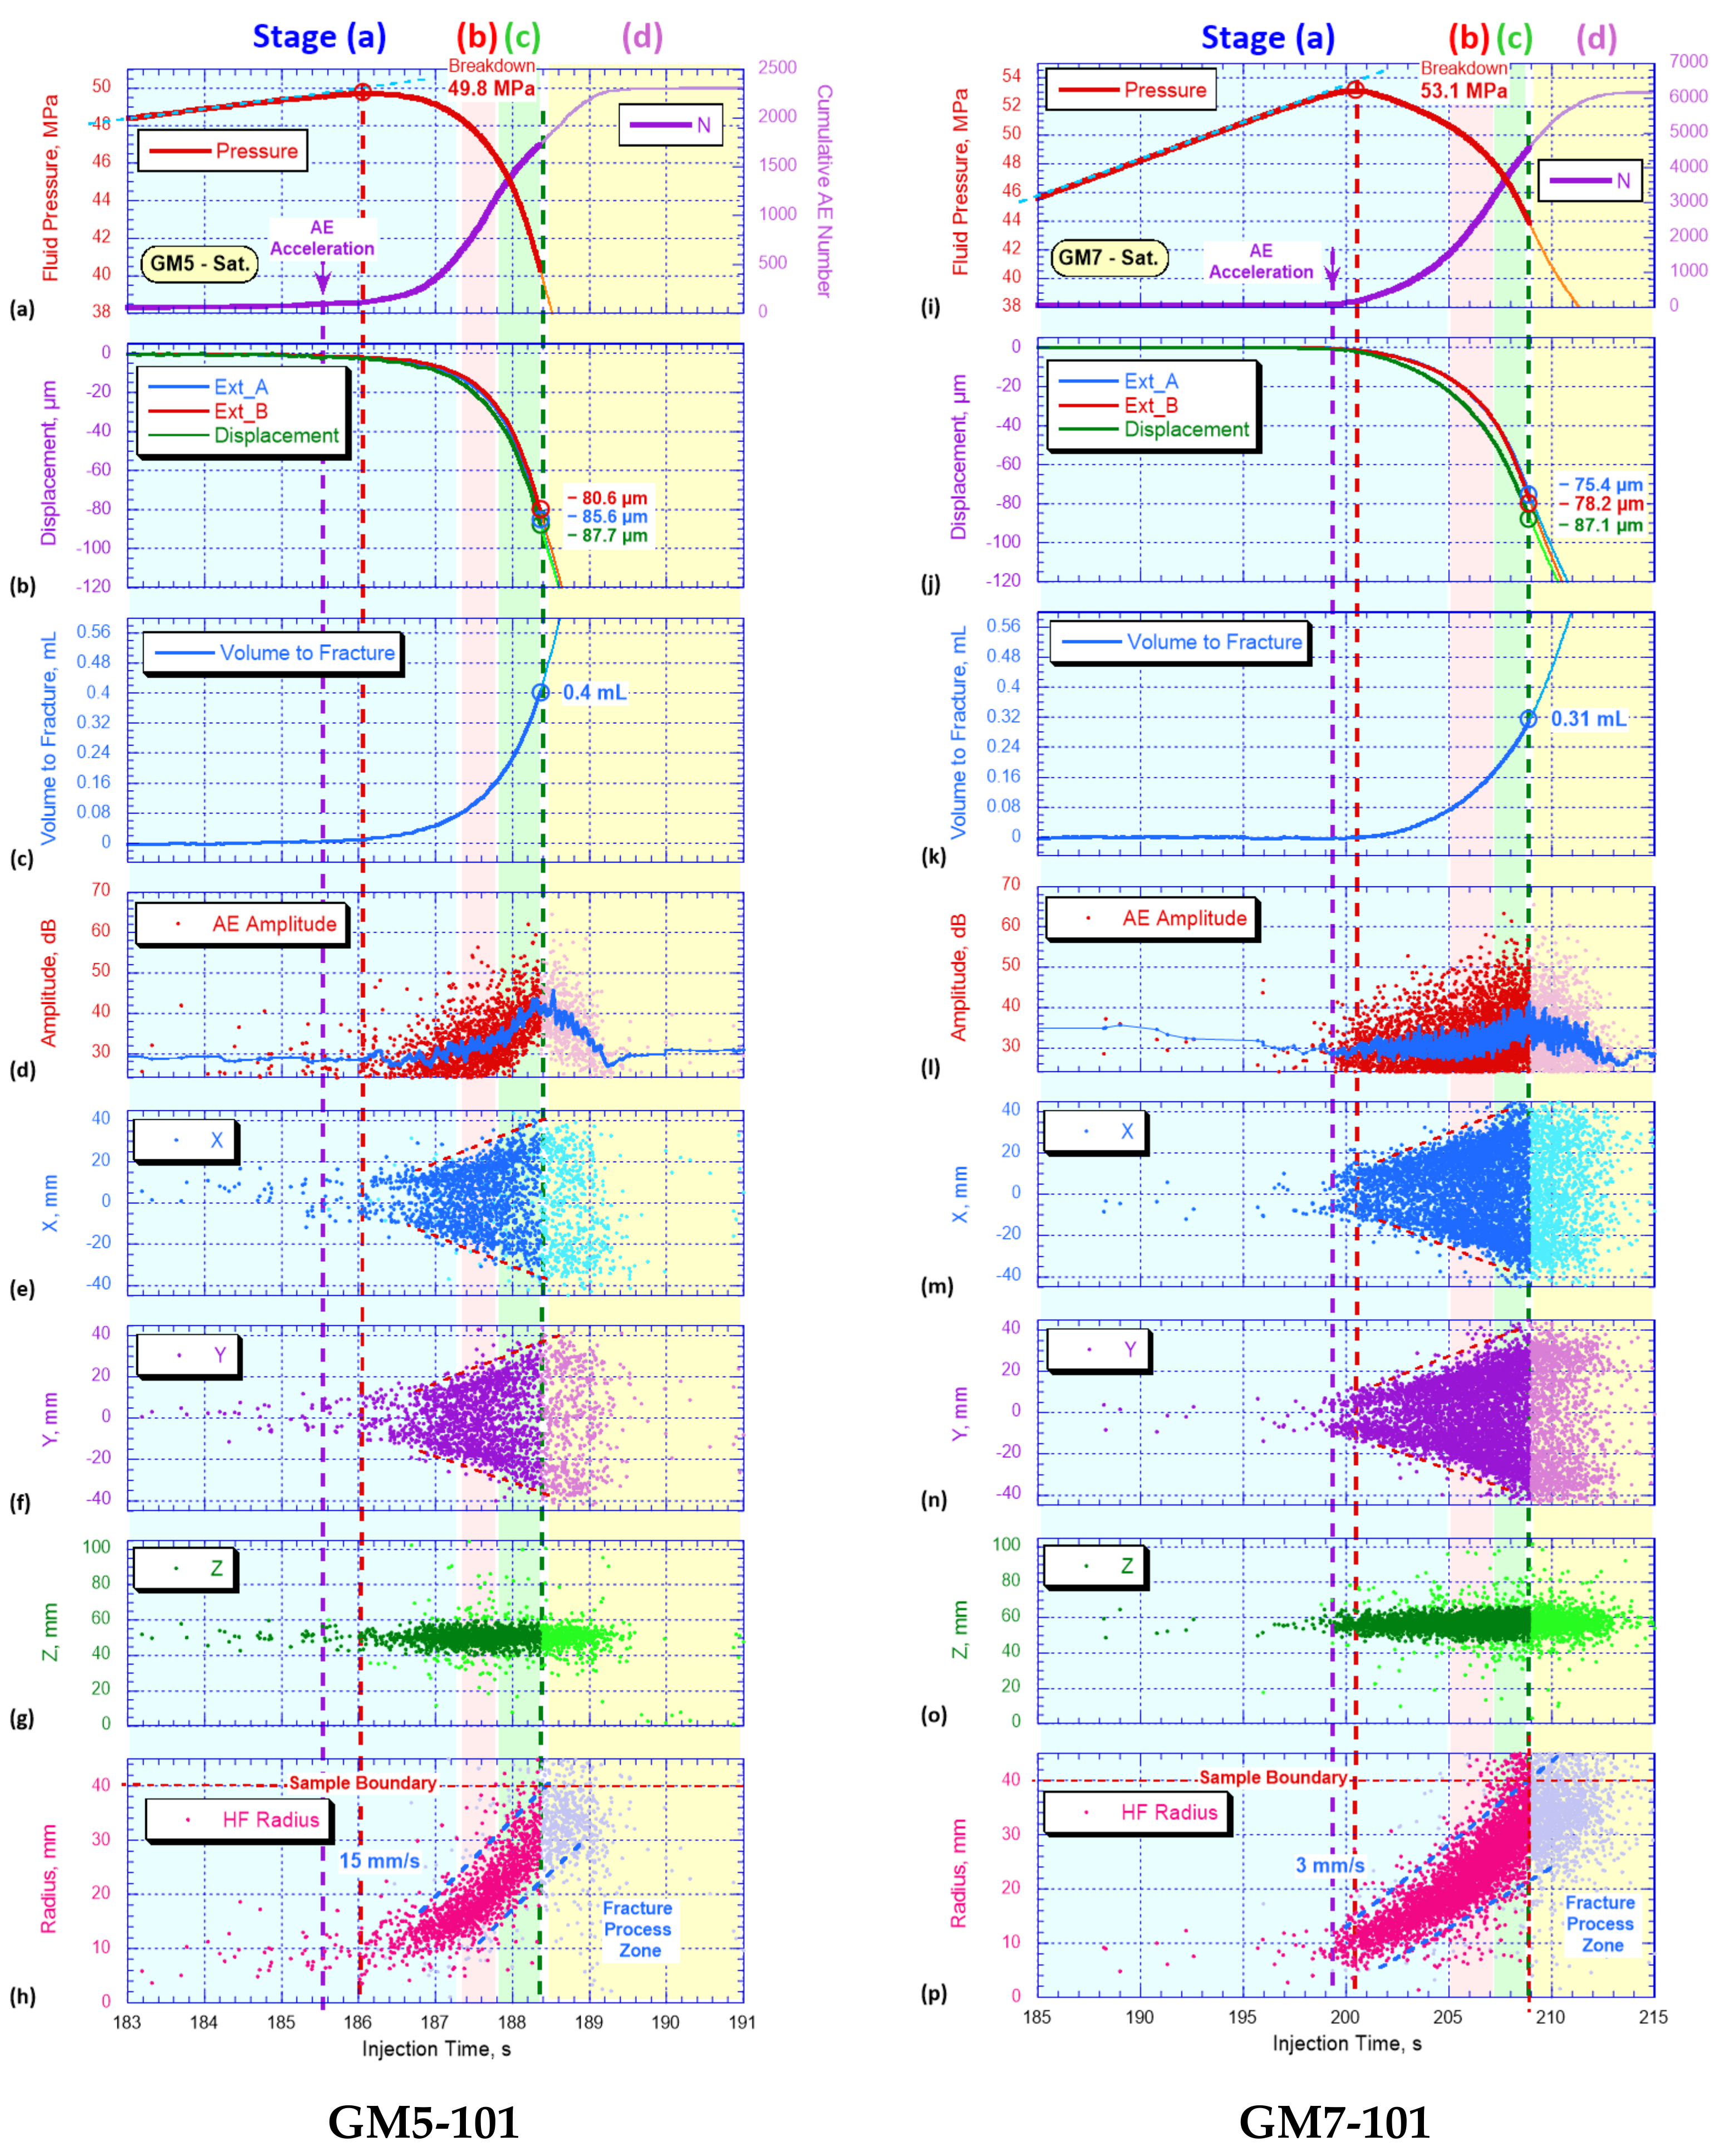
Figure 9 indicates a set of parameters recorded during the hydraulic fracturing of sandstone samples (GM5-101 and GM7-101) by a few independent observation systems.
Figure 9a shows the wellbore pressure (red) approaching a maximum value of 49.8 MPa at 186.0 s and the cumulative number of localized acoustic emission (AE) signals (purple) that demonstrated slight acceleration at 185.5 s, or about half a second before the wellbore pressure approached the maximum value (the breakdown moment) in the test GM5-101. In contrast to the test GM5-101, the injection of more viscous fracturing fluid caused a slightly higher maximum value of wellbore pressure (red) which was equal to 53.1 MPa, and the initiation of acoustic emission (AE) signals (purple) was approximately one second before the breakdown moment in the test GM7-101. Specimen deformation was measured by two extensometers, labeled Ext_A (
Figure 9b,j, blue) and Ext_B (
Figure 9b,j, red), mounted opposite each other on the cylindrical surface of each specimen. During hydraulic fracturing, all stresses applied to the specimens were kept constant, and the LVDT sensor measured the position of the piston, maintaining a constant stress
applied in the vertical direction (
Figure 9b,j, green). The deformations measured in the tests GM5-101 and GM7-101 (Ext_A, Ext_B and piston displacement,
Figure 9b,j) indicate the initiation of HF at approximately the same time as the increase in AE activity (
Figure 9a,i). Note that all three deformations were measured independently by three sensors, and their values coincide within 10% of the difference. Such close correspondence of the experimentally measured values allows us to conclude that, first of all, the deformation of the sample is directly related to the opening of the hydraulic fracture confirmed by the onset of AE. Secondly, the close coincidence of the deformations measured on the opposite sides of the specimens (Ext_A and Ext_B) may indicate the symmetrical opening of the created hydraulic fracture.
The entire volume of injected fluid can be divided into two components: a linearly increasing fluid volume, which is associated with the compressibility of the rock and fluid, the elastic expansion of the hydraulic injection system due to the pressure increase, and a non-linearly rising fluid volume associated with the cracks-and-pores-filling processes during the propagation of the hydraulic fracture [
27,
38].
Figure 9c,k shows the fluid volume having entered the fracture; this calculated parameter was obtained as a subtraction of the linearly rising component of the fluid volume from the total fluid volume injected into the wellbore. Note that the onset of fluid volume increase in
Figure 9c,k corresponds very closely to the independently measured onset of displacements in
Figure 9b,k and the cumulative AE number curve in
Figure 9a,i, purple.
The remaining four graphs (d–h and l-p) in
Figure 9 show the AE parameters recorded during the test. Each magenta dot in
Figure 9d,l shows the amplitude of the localized AE signal in dB scale, and the blue line in
Figure 9d,l shows the amplitudes smoothed in the sliding window of 25 signals. An increase in the AE signal amplitudes can be seen shortly after the initiation of the HF, which we associate with the enlargement of the microcracks. The plots in
Figure 9e–f,m–n show the positions of the XY coordinates of the localized AE events along the horizontal axis of the sample, and in
Figure 9g,o the vertical coordinate along the Z axis of the sample. One can see a very symmetrical propagation of the AE cloud along the horizontal X and Y coordinates (
Figure 9e–f,m–n), while, along the vertical Z direction, most of the AE events are localized within a zone of about 20 mm thickness (
Figure 9g,o). The distances between the wellbore (or the sample center) and each located AE event are presented in
Figure 9h,p, indicating an increase in the radius of the created hydraulic fracture.
It can be seen that the front of the HF propagates toward the sample boundary at a rate of approximately 3 mm/s and 15 mm/s in the tests GM5-101 (
Figure 9h, upper dashed blue line) and GM7-101 (
Figure 9p, upper dashed blue line), respectively. This considerable difference in fracture propagation rates was caused by the 10-fold difference in the viscosity values of injected SOs. Note the existence of the rear front of the propagating hydraulic fracture (
Figure 9h,p, lower dashed blue line), indicating the approximately 20-mm-wide radiation of induced AE events within the fracture process zone (FPZ). A detailed description of the AE localization technique is presented in [
27,
38]; the accuracy of the AE event localization in our study was about 5 mm. The position of the sample boundary is indicated by the horizontal red dashed line in
Figure 9h,p, and it can be seen that the fracture front reached the sample boundary at approximately 188.4 s and 209.0 s in the tests GM5-101 and GM7-101, respectively, which is indicated by the vertical dashed blue line in
Figure 9. Note that this moment corresponds to the maximal value of the AE amplitude (
Figure 9e,m). A similar correlation of the registration of the maximal value of the AE amplitudes with HF approaching the sample boundary was observed in [
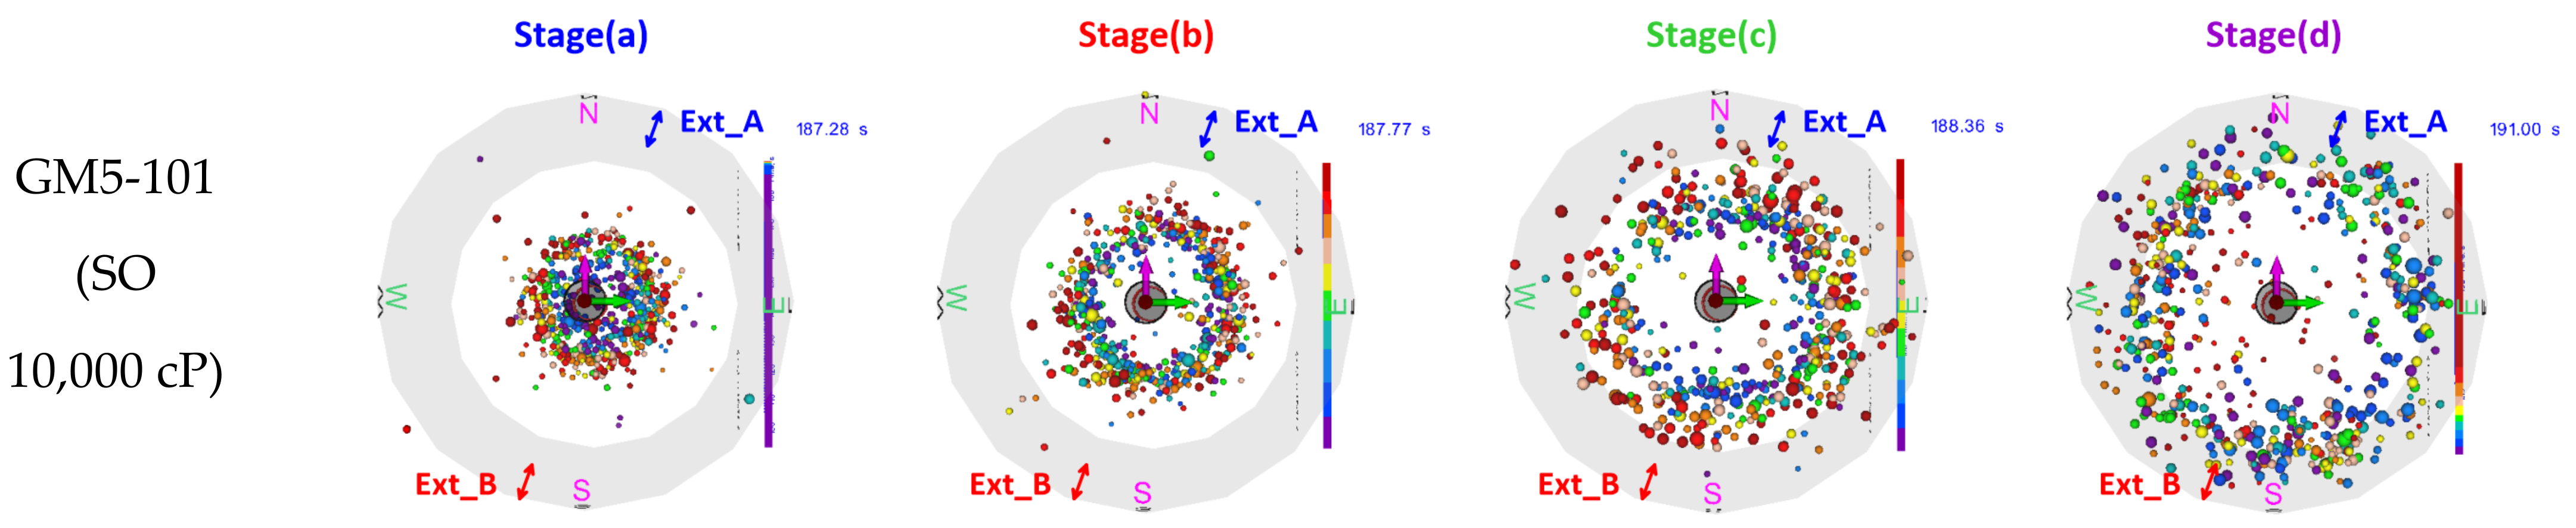
27]. The entire process of HF propagation up to the sample boundary was divided into three consecutive time intervals, providing an equal number of 576 AE signals for each stage, labeled stage (a), (b), and (c) in
Figure 9. The very last stage (d) in
Figure 9 (highlighted by the yellow rectangle) indicates 584 AE signals localized after the moment when the front of the FPZ approached the sample boundary. The analysis of the results presented in
Figure 9 shows that at the moment marked by the vertical dashed line, the displacements in the range of 80.6–87.7 µm and 75.4–87.1 µm were recorded in the tests GM5-101 (
Figure 9b) and GM7-101 (
Figure 9j), respectively. Additionally, 0.4 mL of 10,000 cP SO and 0.31 mL of 100,000 cP SO were injected into the fracture in the tests GM5-101 (
Figure 9c) and GM7-101 (
Figure 9k), respectively. These values, experimentally determined by a few independent sensors, can be used for verification of the radial hydraulic-fracture-propagation models.
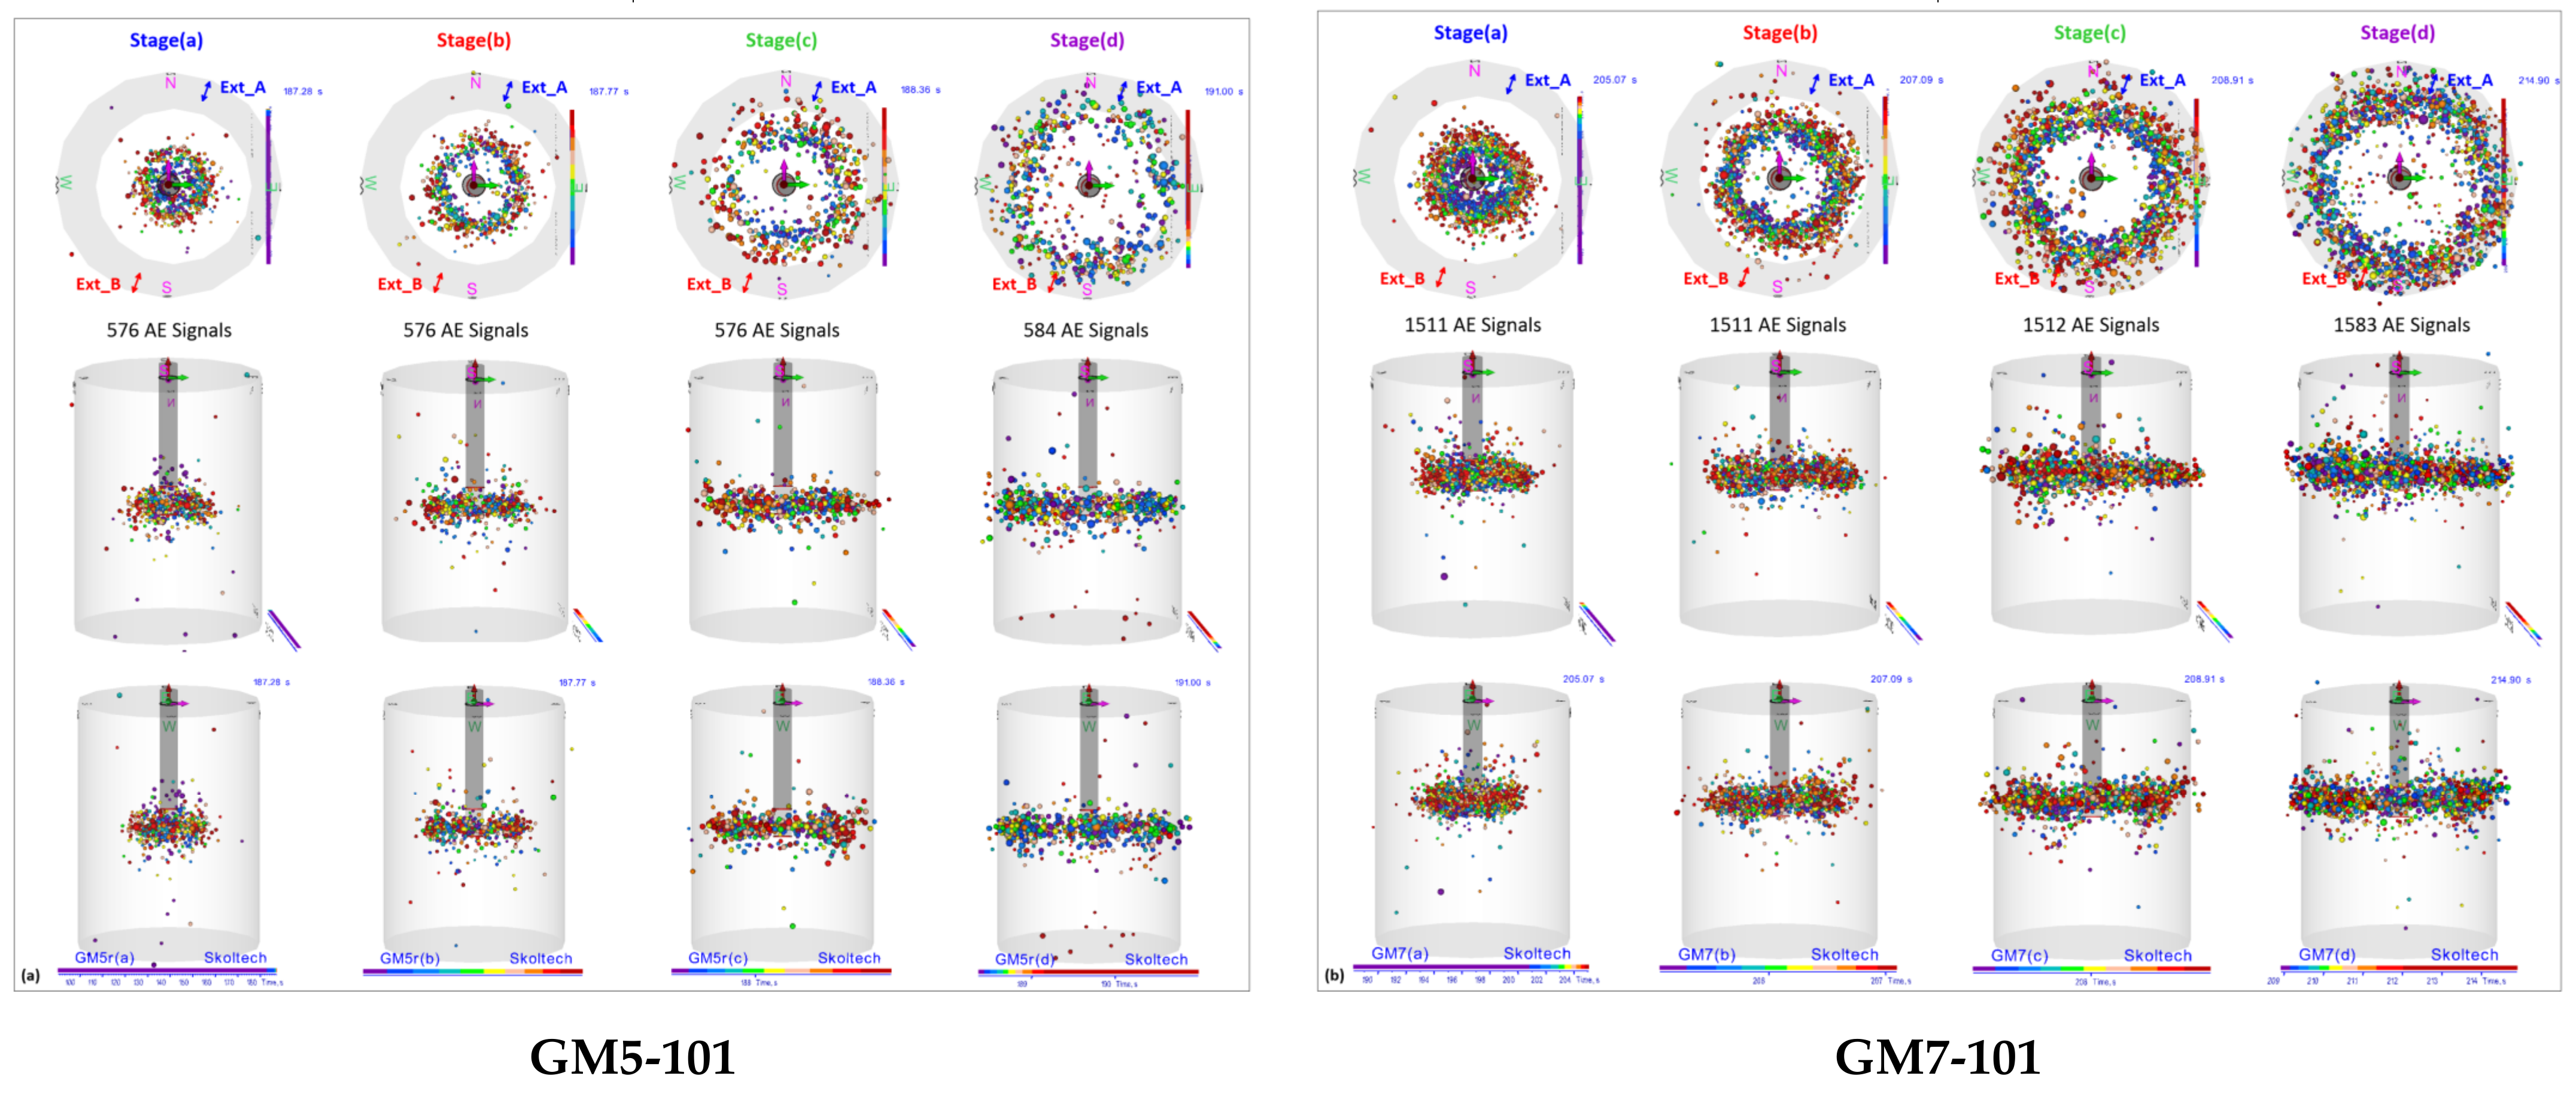
Three orthogonal projections of the coordinates of localized AE events are shown in three rows in
Figure 10, divided into four columns corresponding to the consecutive time intervals indicated in
Figure 9 as stages (a) through (d). The spheres depicted in
Figure 10 represent the positions of the AE signals in three-dimensional space; the color of the spheres corresponds to the time scale shown on the color bar placed at the bottom of the lower row of projections. The diameter of the spheres is proportional to the magnitude of the AE signals, calculated as a logarithm of the recorded AE amplitude. The top view of the orthogonal projections of the AE signal distributions demonstrates the radial shape of the FPZ propagation (
Figure 10, upper row). The locations of the AE events exactly replicate the shape of the fractures obtained in all the tests performed. Note that in case of high-viscosity fluid injection, the existence of a lag between the fracture process zone (FPZ) and the fluid front was experimentally confirmed [
39]; however, taking into account the symmetry of the deformation measured on the sample boundary, one can assume that the fluid front also propagates radially in the GM5-101 and GM7-101 tests.
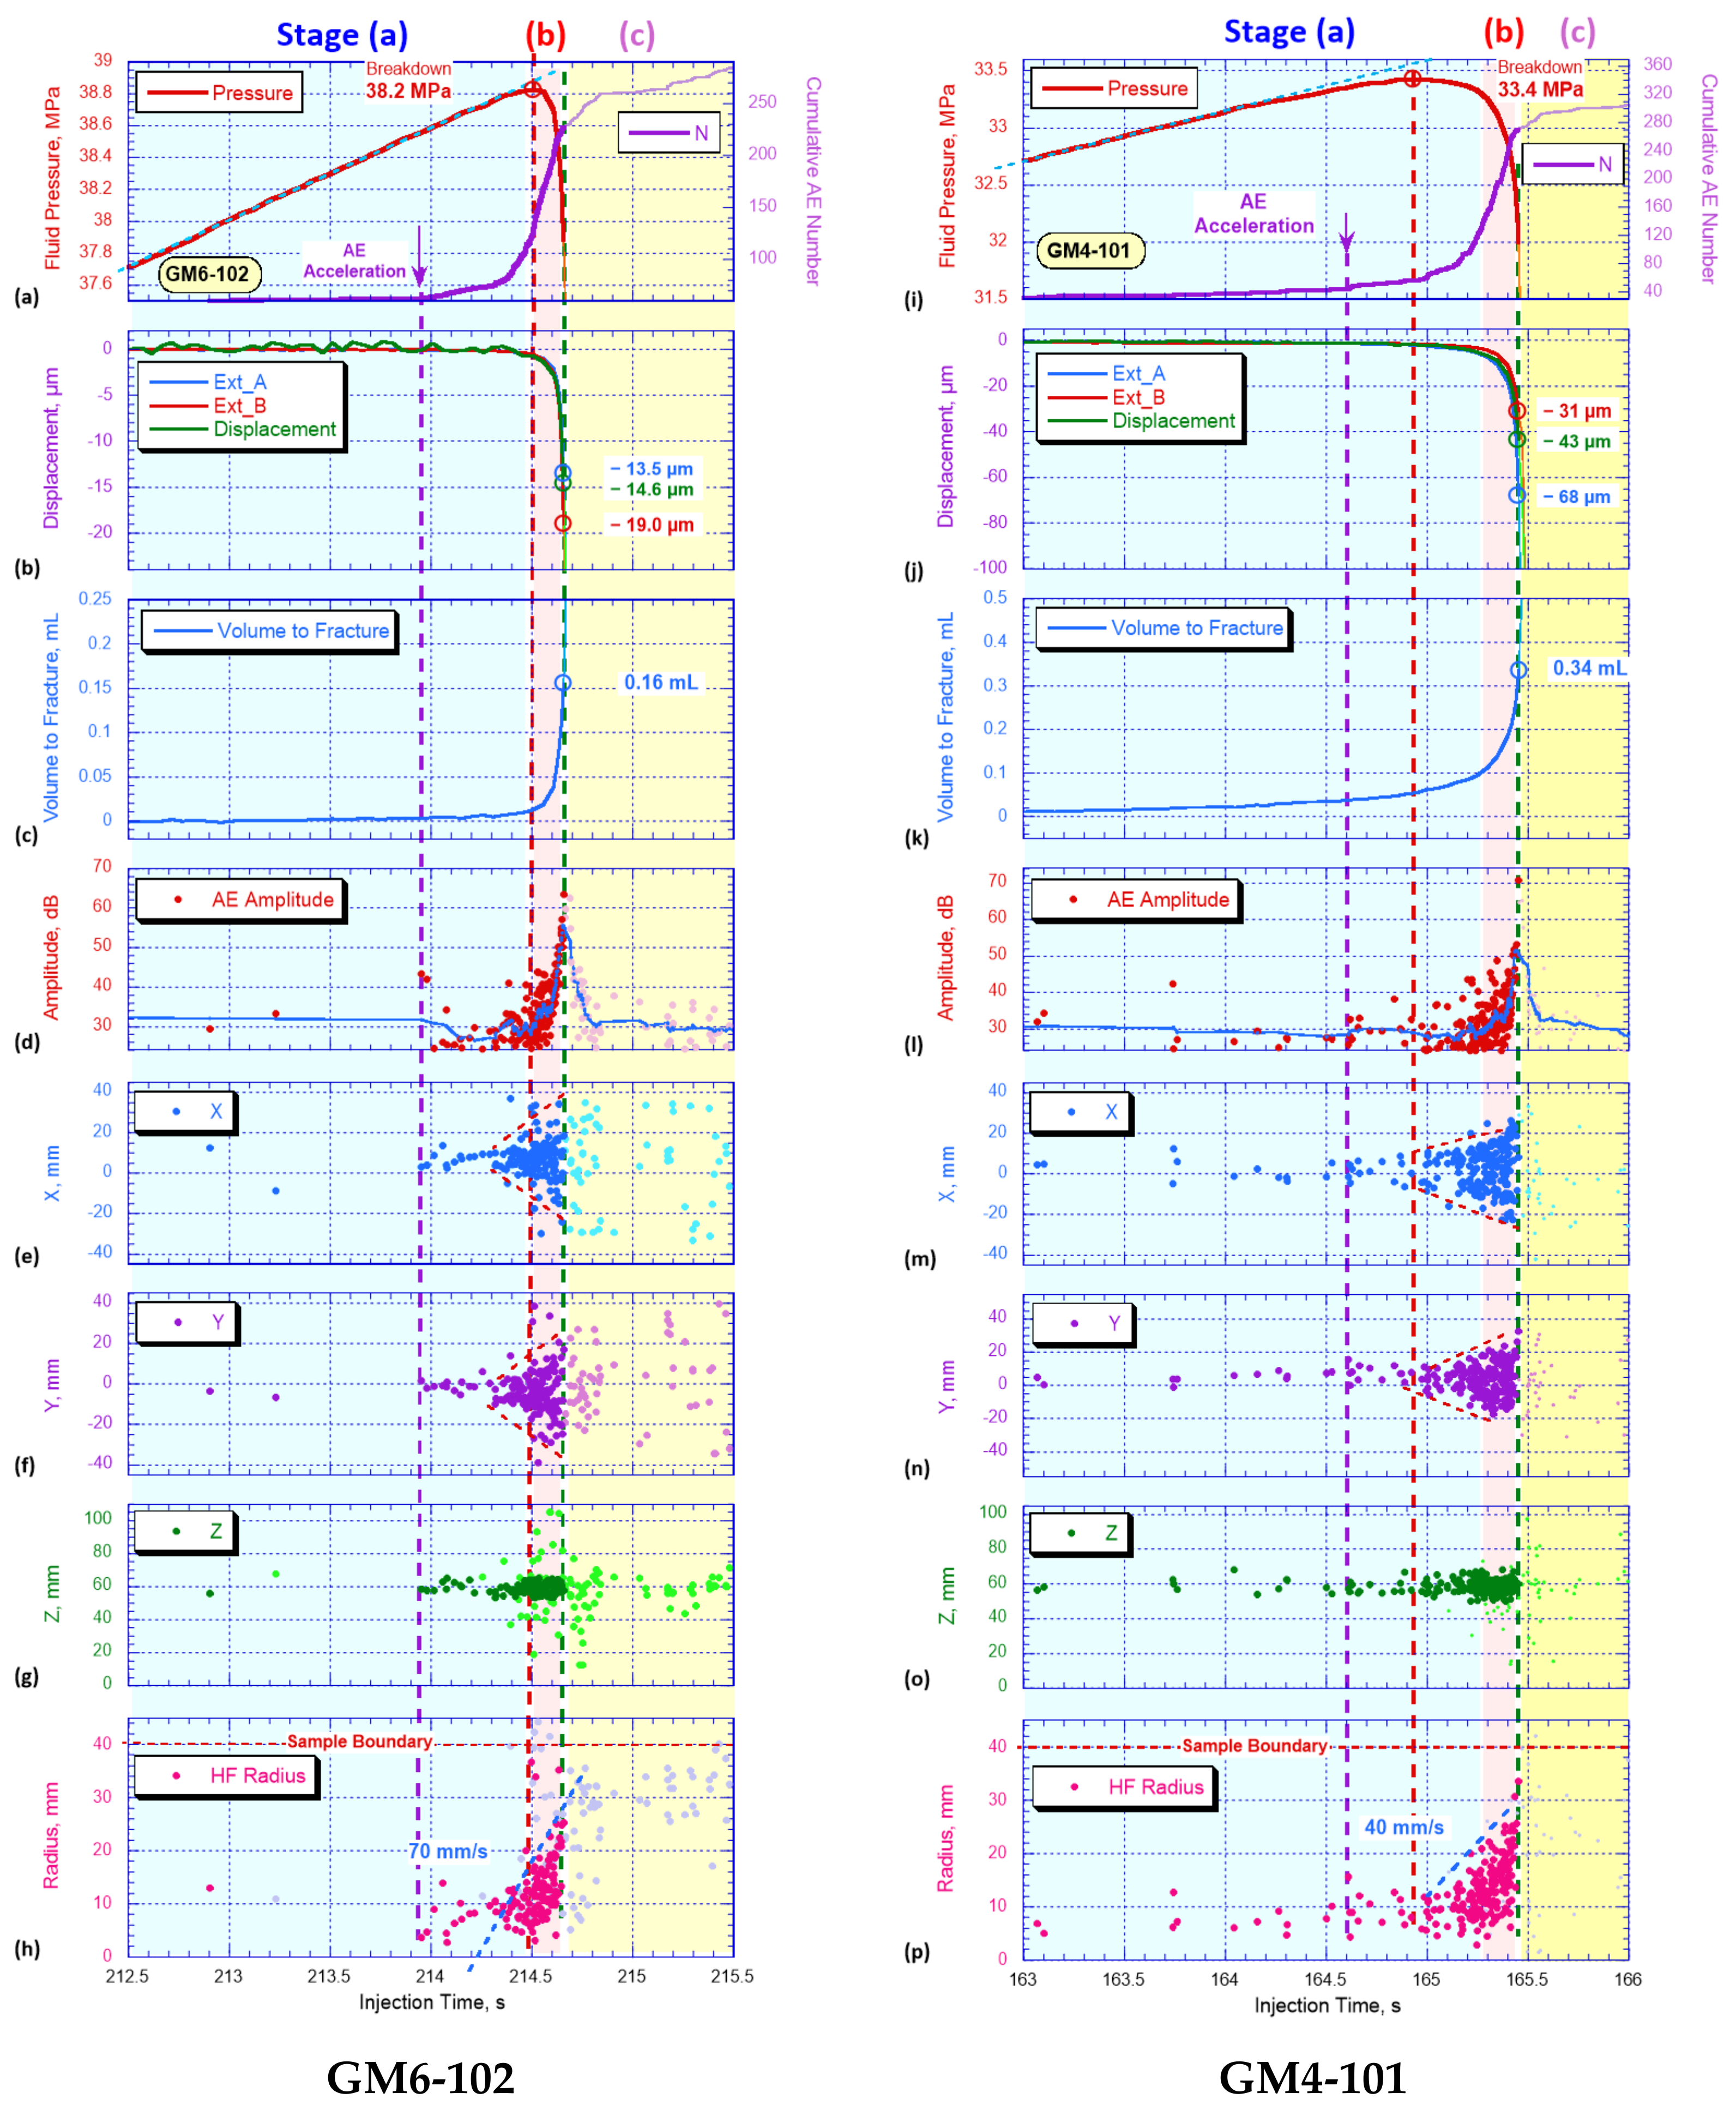
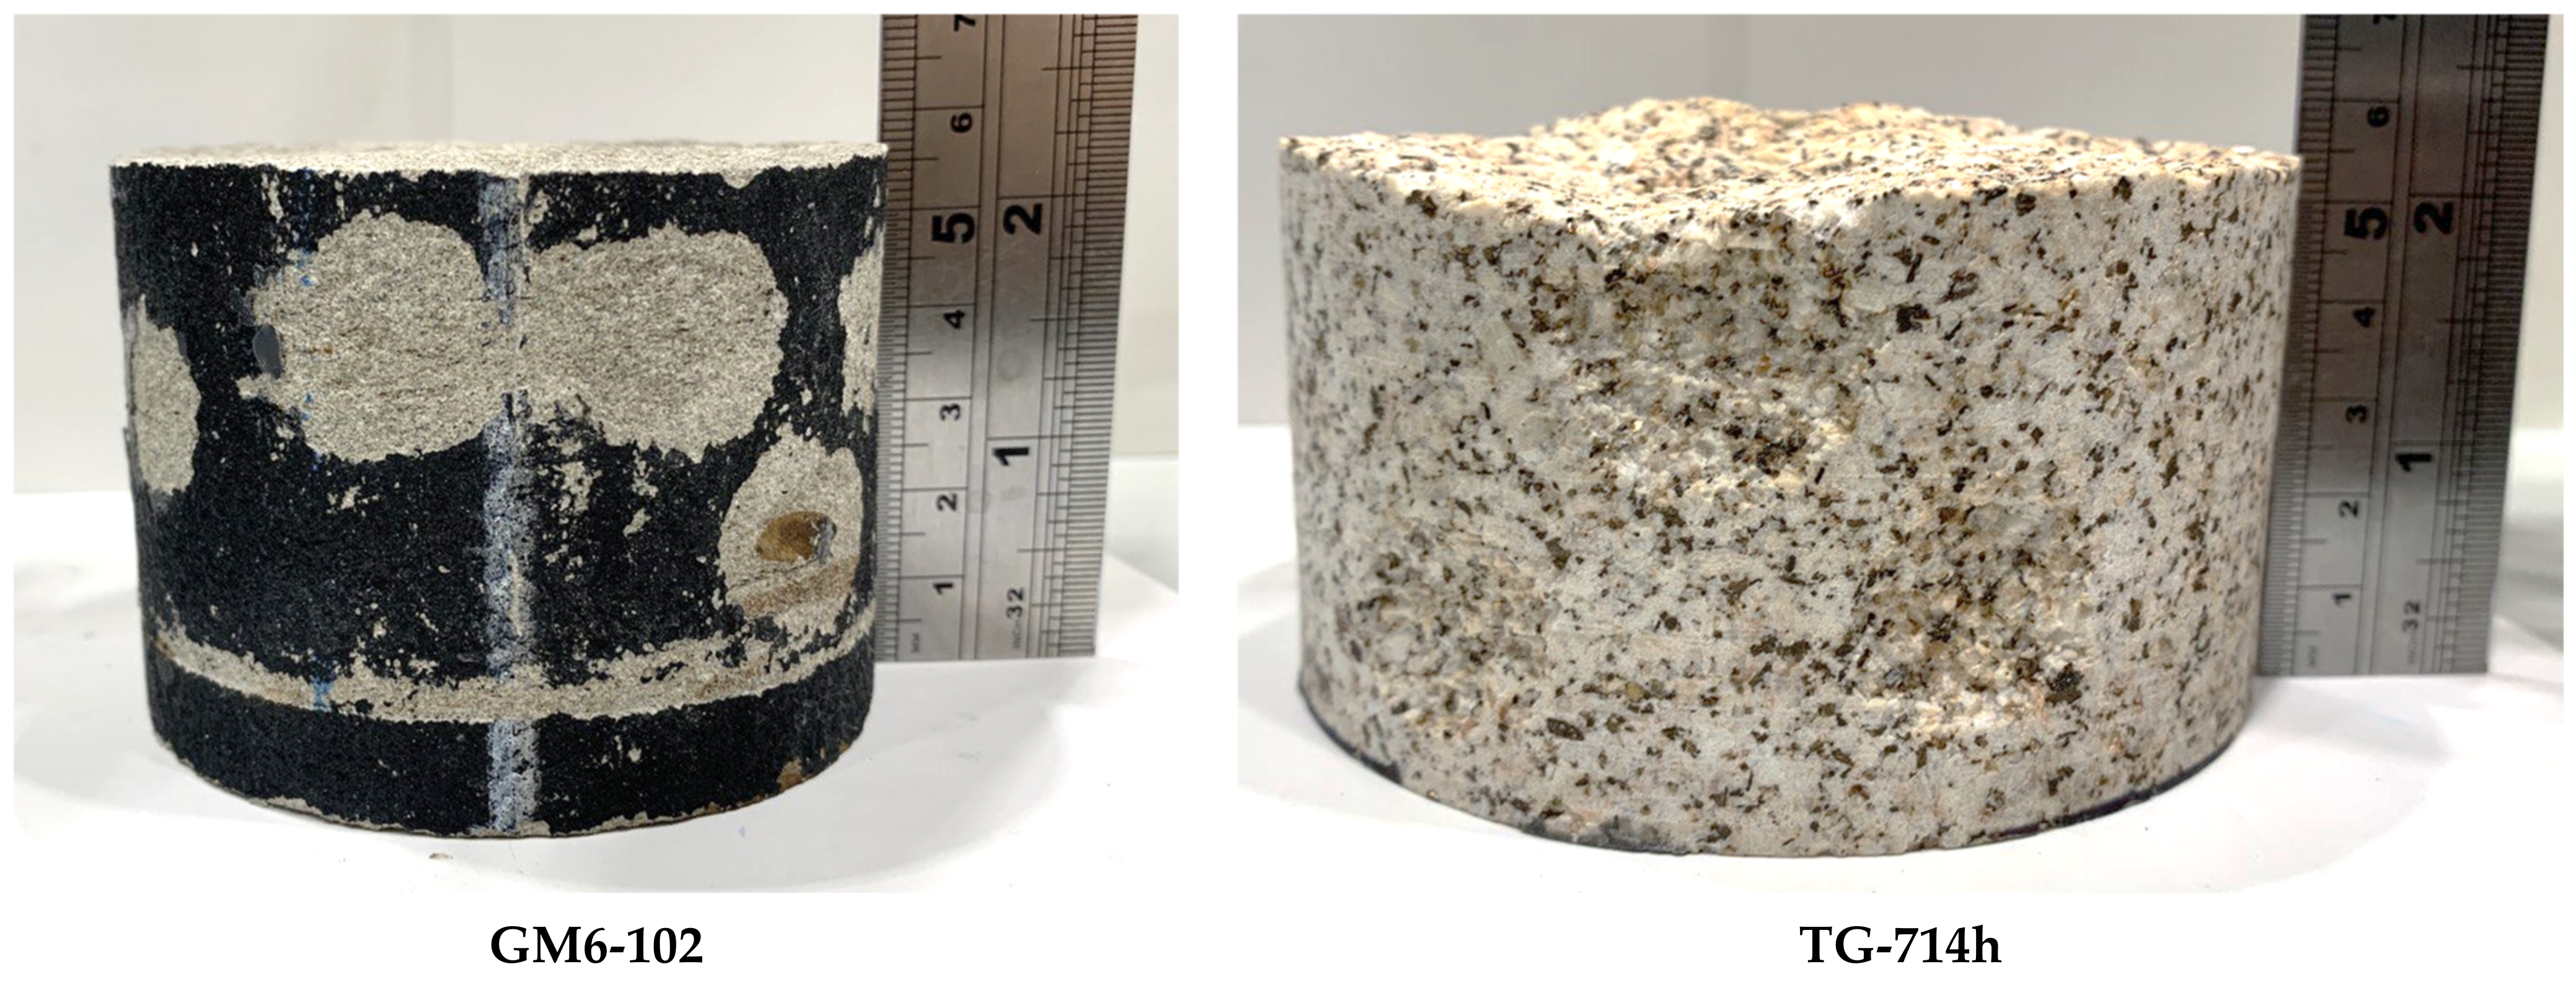
In the previous test, hydraulic fracturing was induced by the injection of high-viscosity silicone oil; however, in the field, fluids with significantly lower viscosities are usually used. Therefore, in the next two tests, we studied the fracturing of similar sandstone samples, but induced it by injecting diesel-based fluid OG 40/40, which is specially designed for hydraulic fracturing in the field. Sample GM6-102 was tested in dry conditions, and sample GM-4-101 was saturated with mineral oil before the fracturing. The test results are shown in
Figure 11. The reason for saturating the specimen is based on the fact that in nature, most of the rocks in a reservoir are saturated with a formation fluid. The fracture parameters were determined at the moment when the fracture approached the sample boundary, based on the analysis of the AE results. In order to determine this moment with the highest possible accuracy, combined criteria were applied, based on the analysis of spatial distributions of the AE signals (
Figure 11h,p) (indicating the appearance of the AE signals in the vicinity of the sample boundary), and AE amplitudes approaching the maximum values (
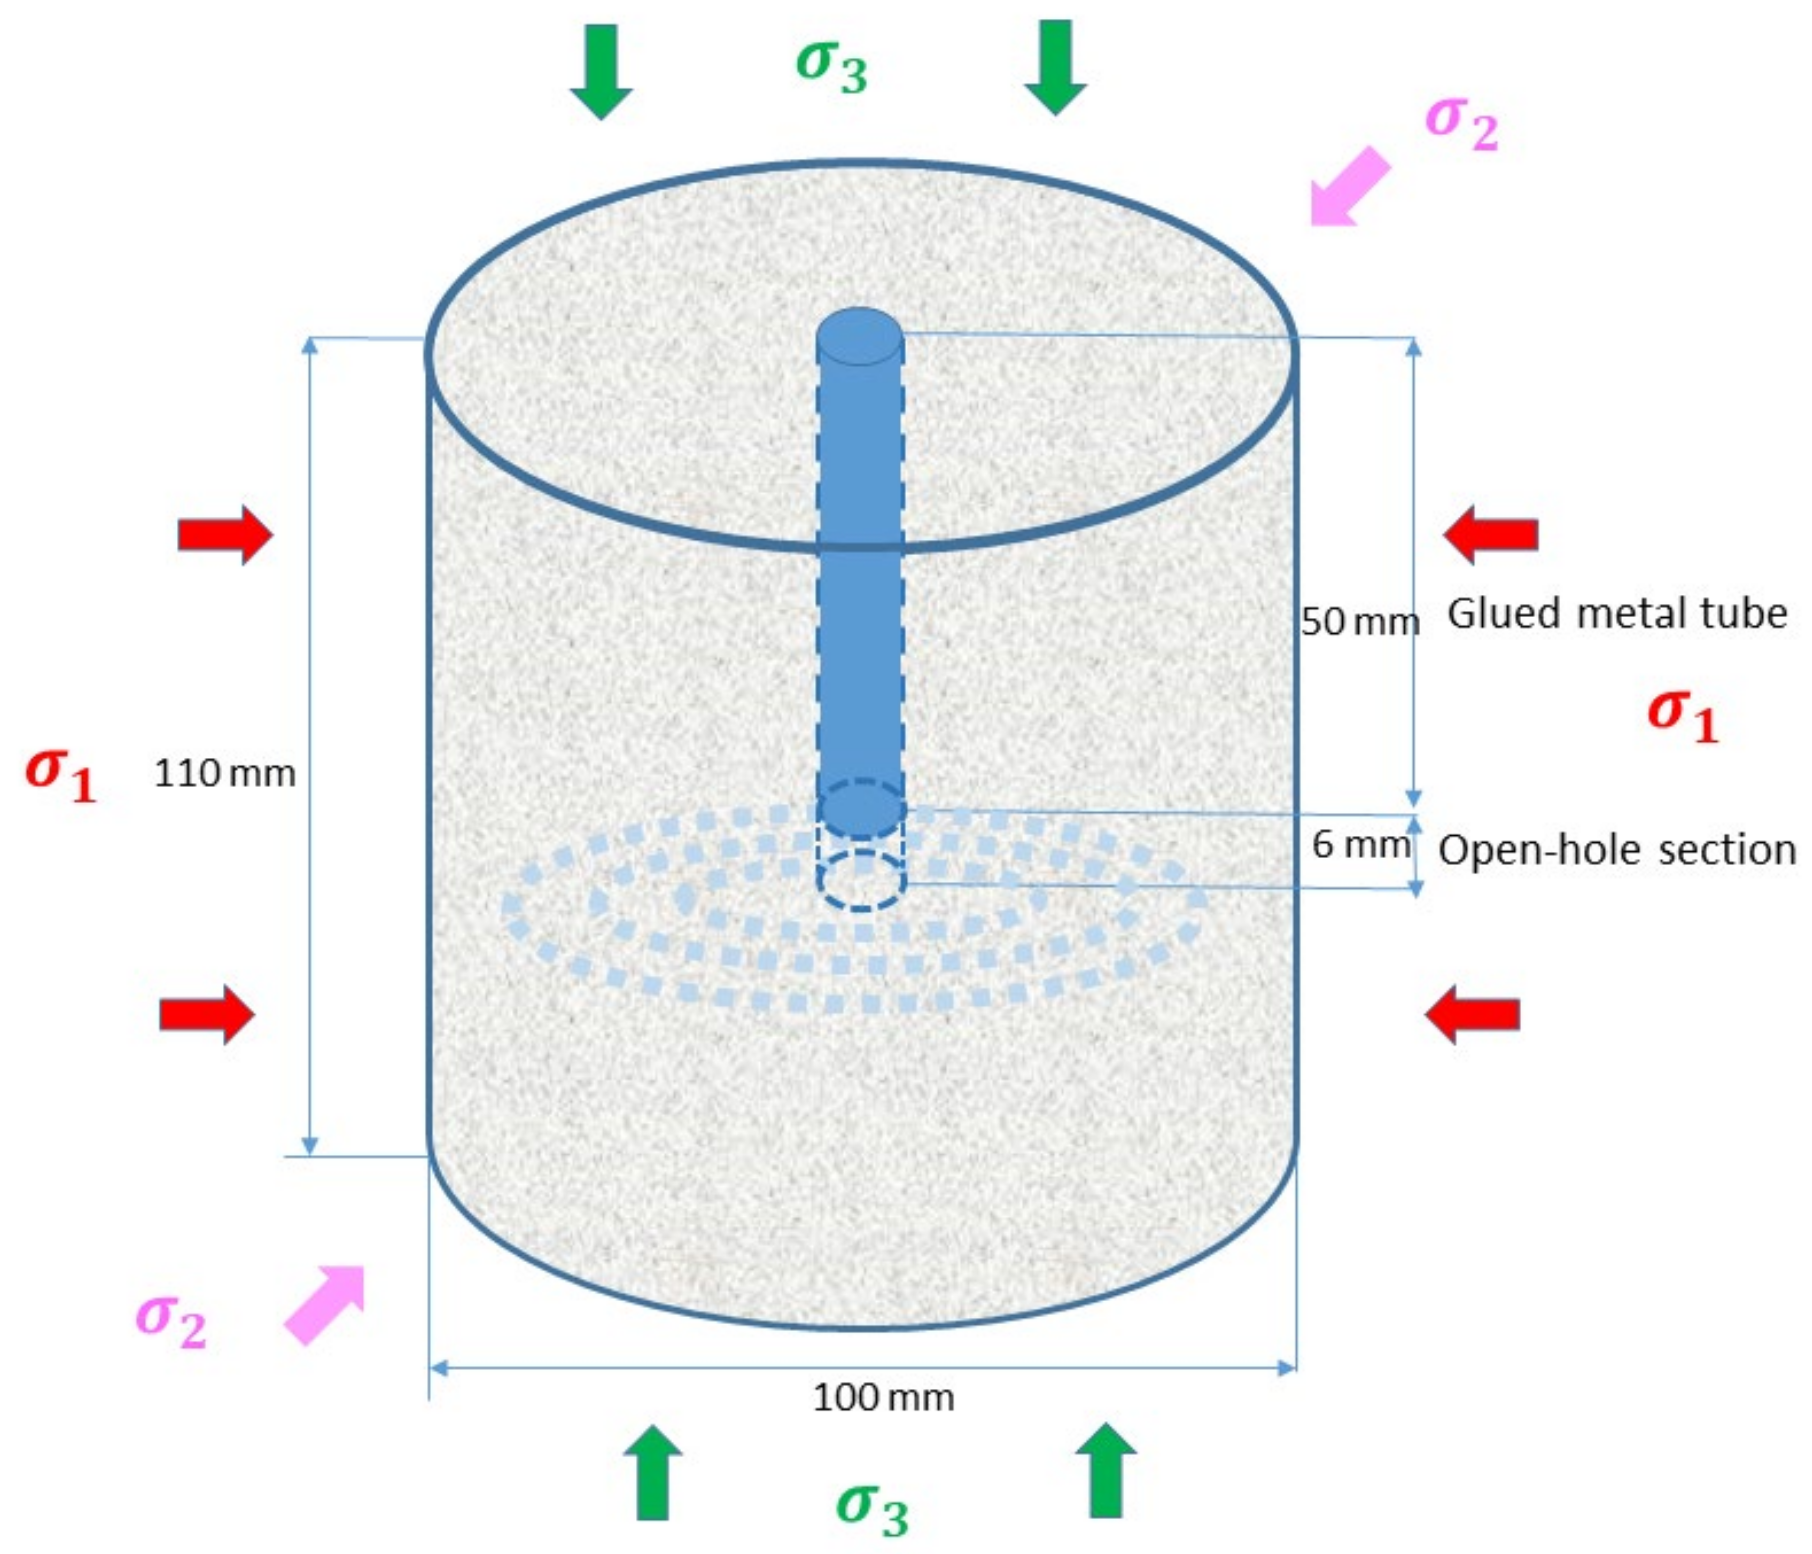
Figure 11d,l) (indicating the appearance of the largest microcracks) were used. It should be noted that, with the loading scheme used (
Figure 2), the minimum principal stress was applied in the vertical direction and was kept constant during the stages of fluid injection and propagation of hydraulic fracture. However, during the very fast HF propagation, the massive piston of the loading frame could not adjust its position in order to maintain constant
stress. As a result of piston inertia, some increase in the minimum principal stress was recorded, occurring mainly after the HF approached the specimen boundary. For all analyzed tests, it was specifically verified that, at the moment when HF approached the cylindrical surface of the rock, the minimum principal stress increased by less than 10%. According to the parameters shown in
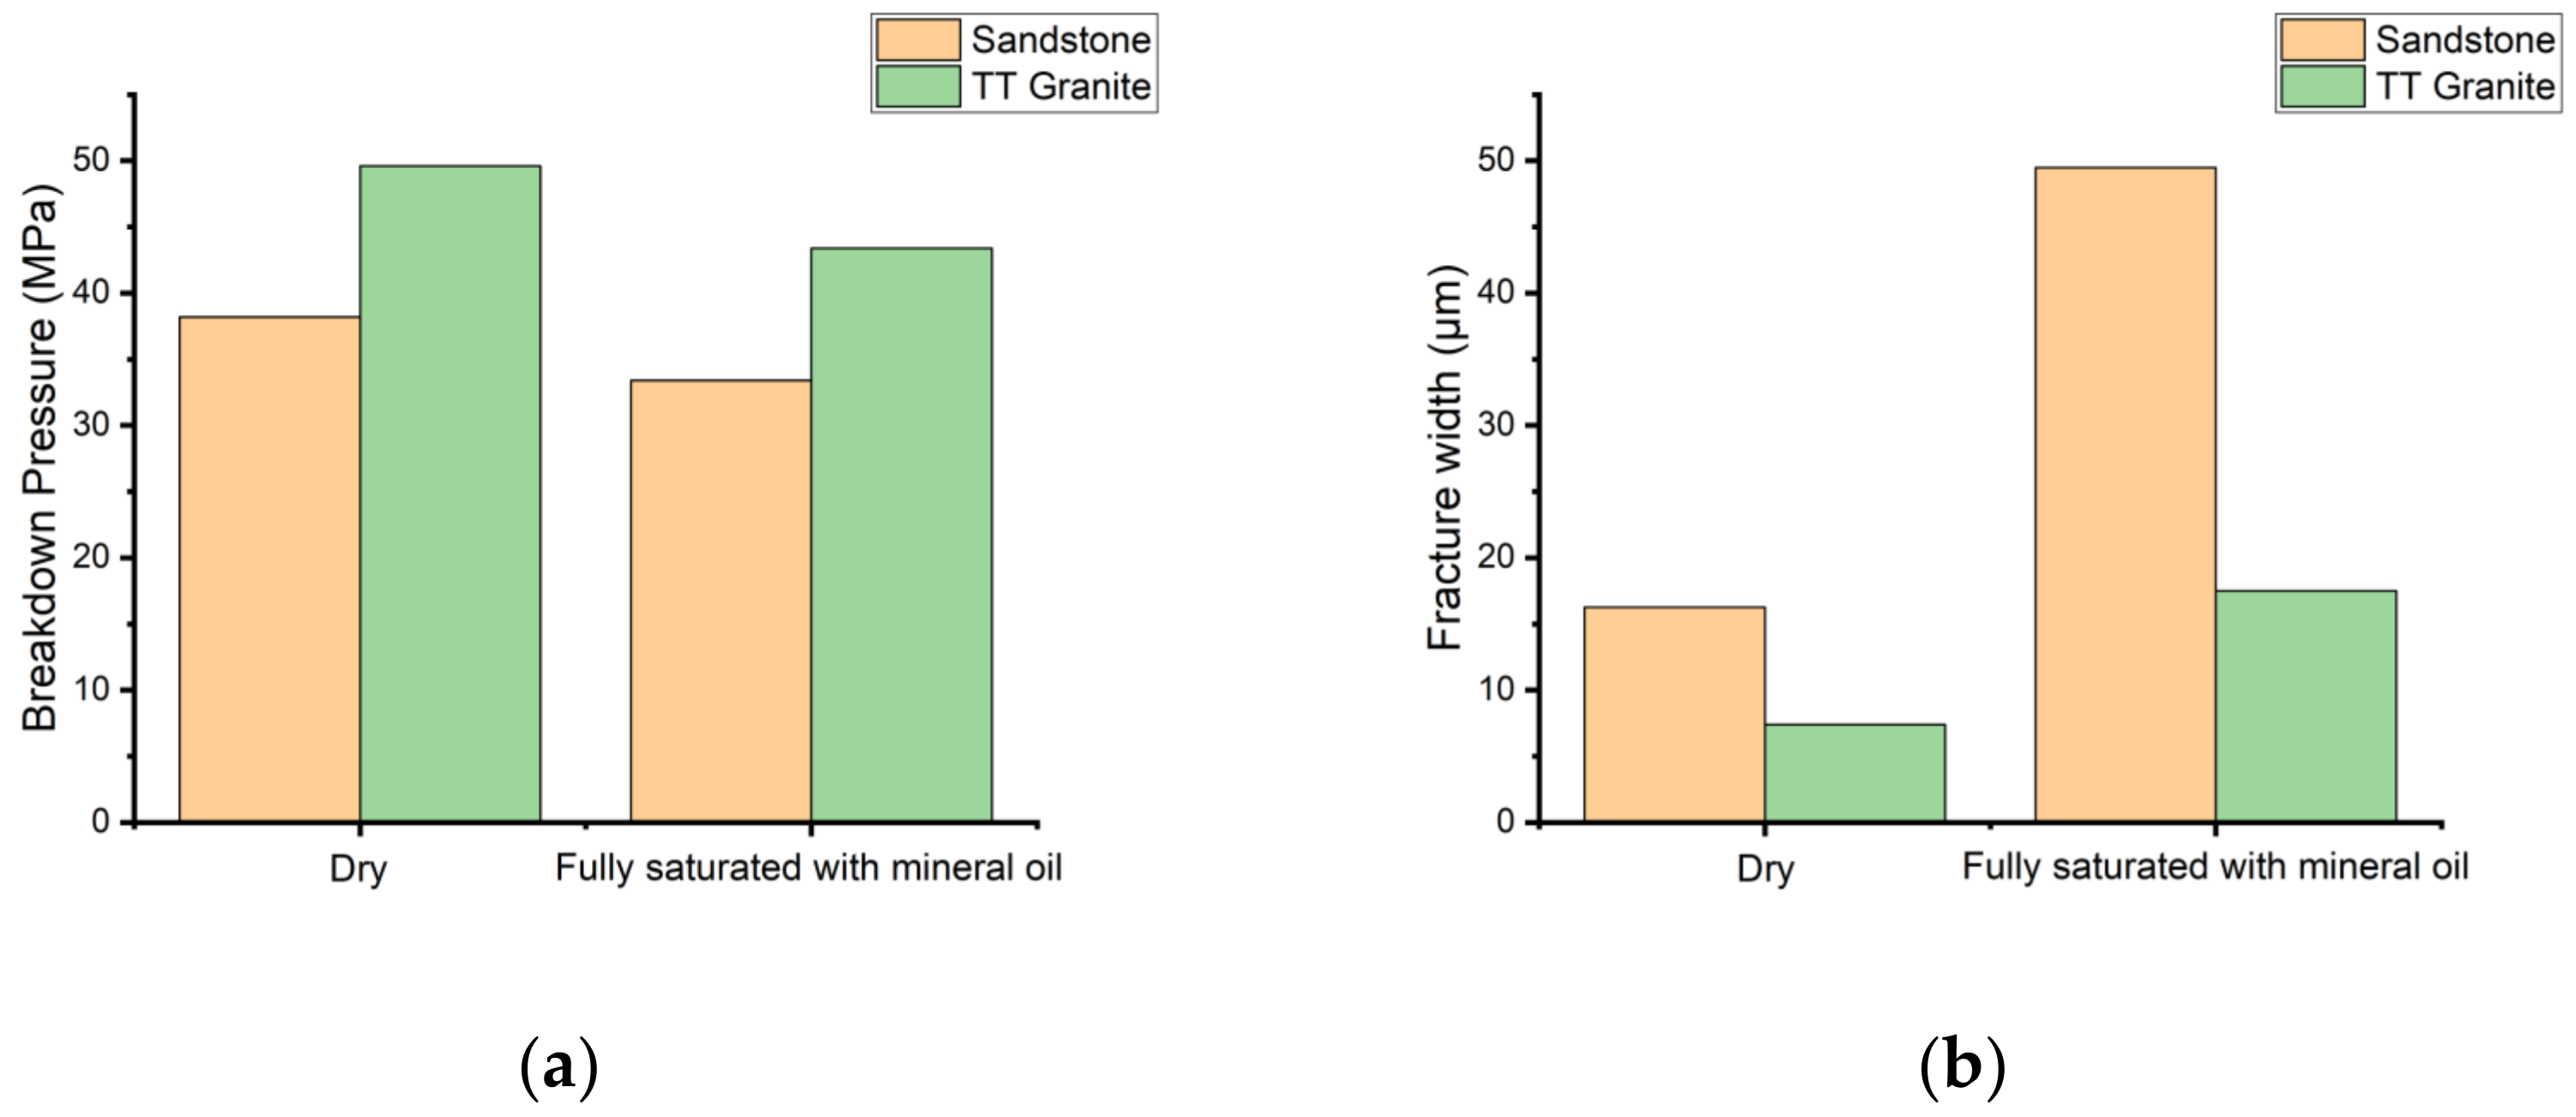
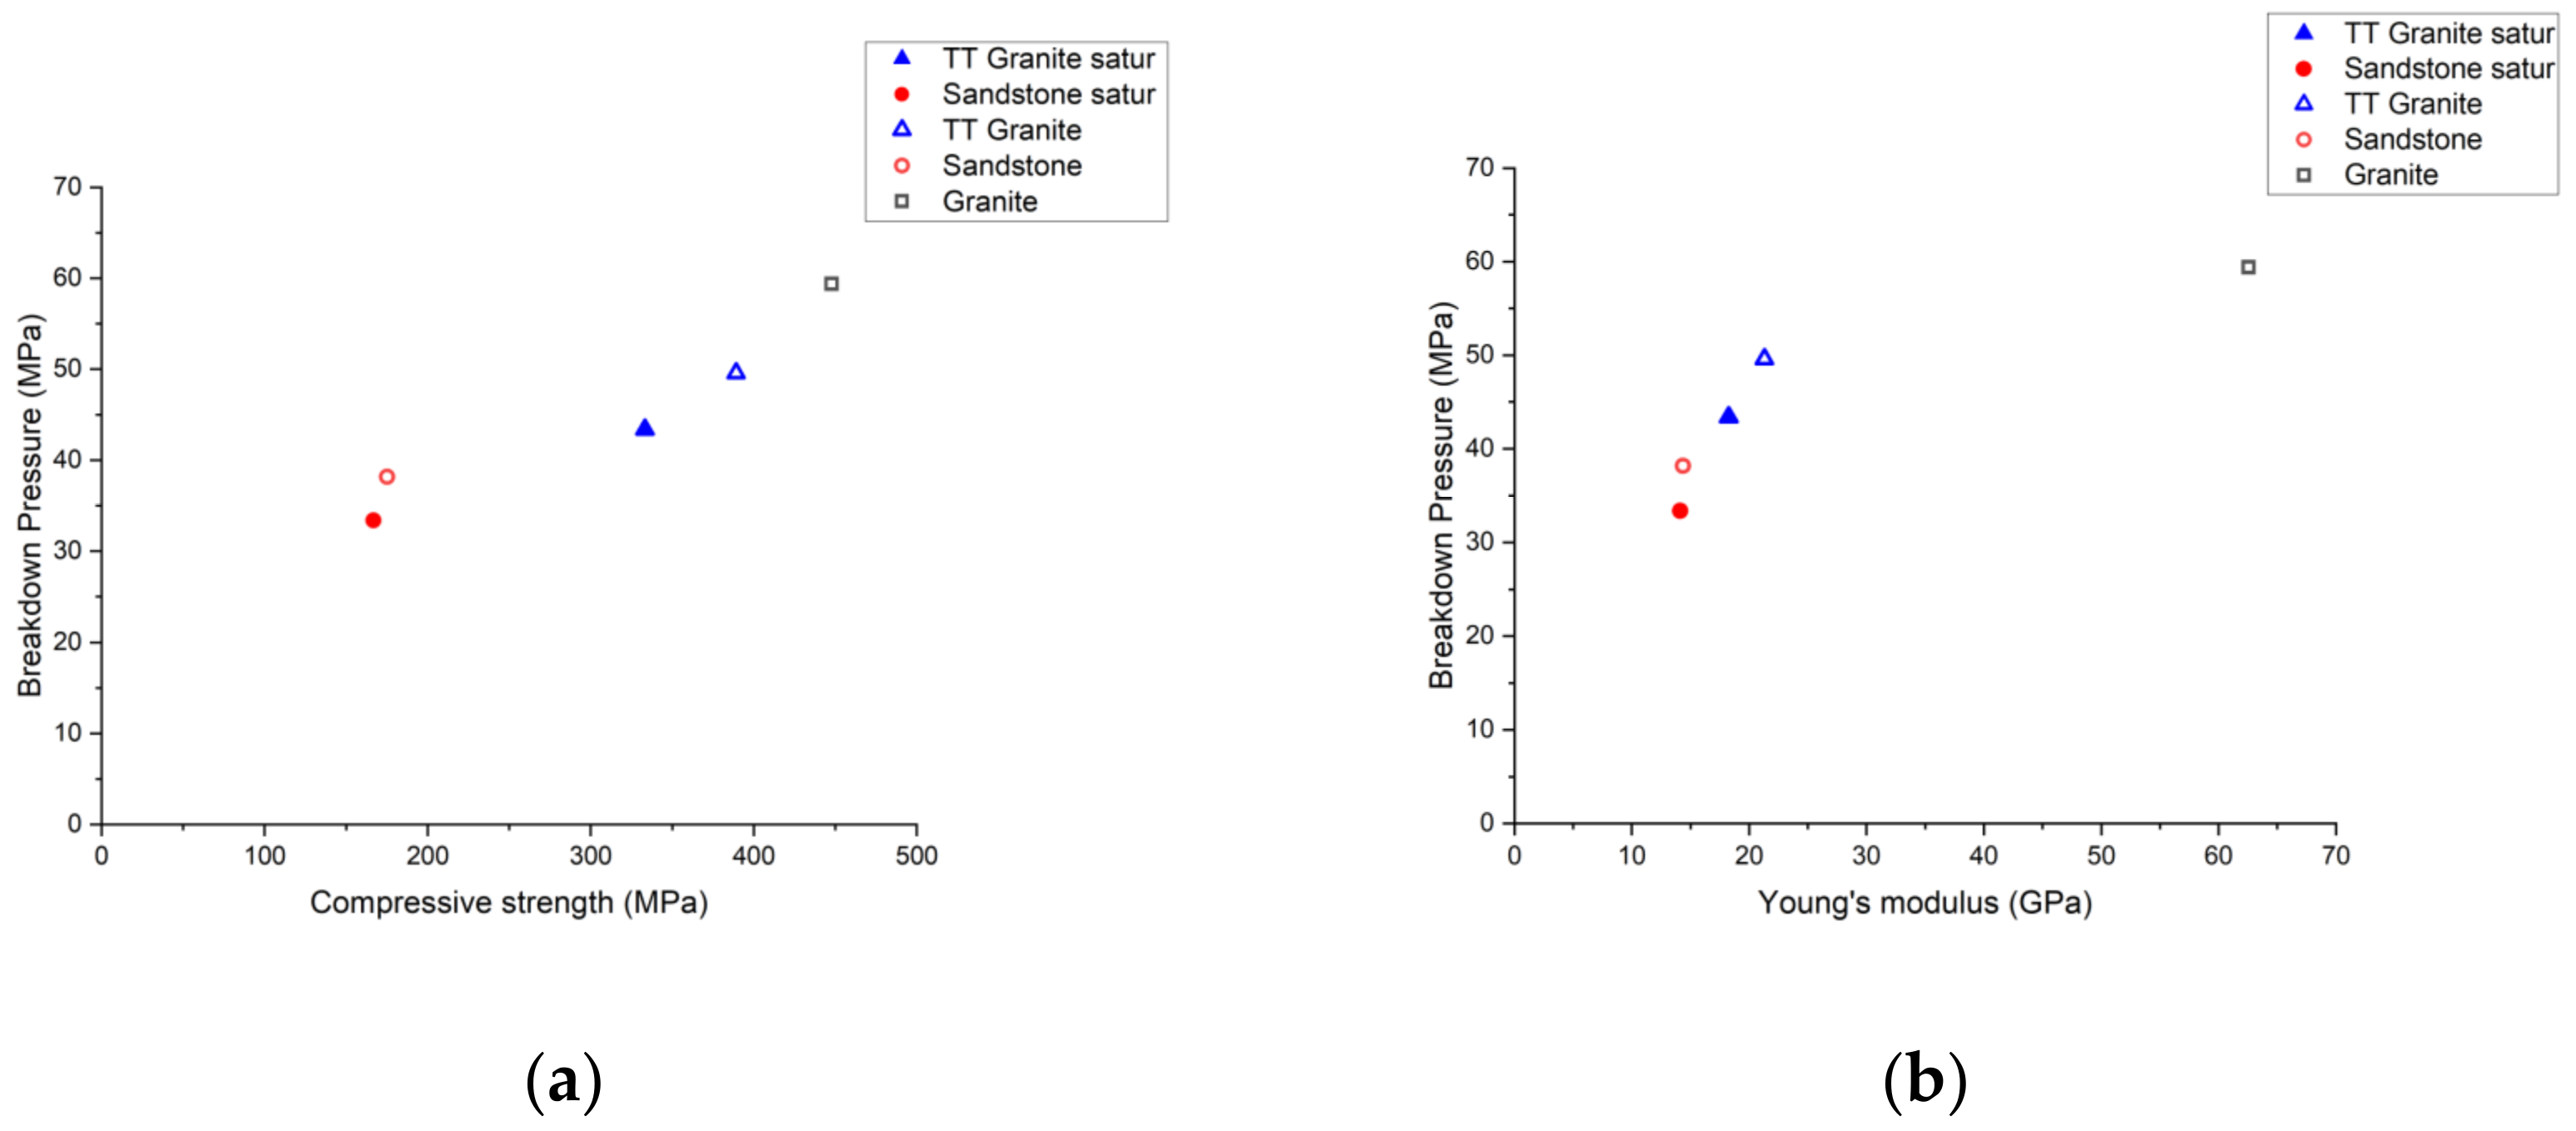
Figure 11, the saturated sample (GM4-101) is characterized by a 13% lower BP and a 70% larger sample deformation than the dry sample (GM6-102). The maximum value of the AE amplitudes is also slightly lower in the saturated sample. Although the same fluid was injected into the dry and saturated specimens, the saturated specimen (GM4-101) demonstrates a larger volume having entered the fracture (
Figure 11k), a larger axial deformation of the specimen caused by the fluid-driven HF opening (
Figure 11j), and a slower speed of HF propagation (
Figure 11p).
Moreover, the influence of the fluid viscosity on fracture parameters can be analyzed by comparing the experimental results recorded with the injection of OG (GM4-101) and viscous SO (GM5-101) demonstrated above. Pumping less viscous OG induces the fracture at a 33% lower BP and with an almost 40% smaller sample deformation, related to HF aperture. In addition, the fracture induced by injecting less viscous fluid propagates almost five times faster in dry sandstone, and almost three times faster in saturated sandstone than the fracture driven by injecting SO into the saturated sandstone specimen (
Figure 9p) shown above.
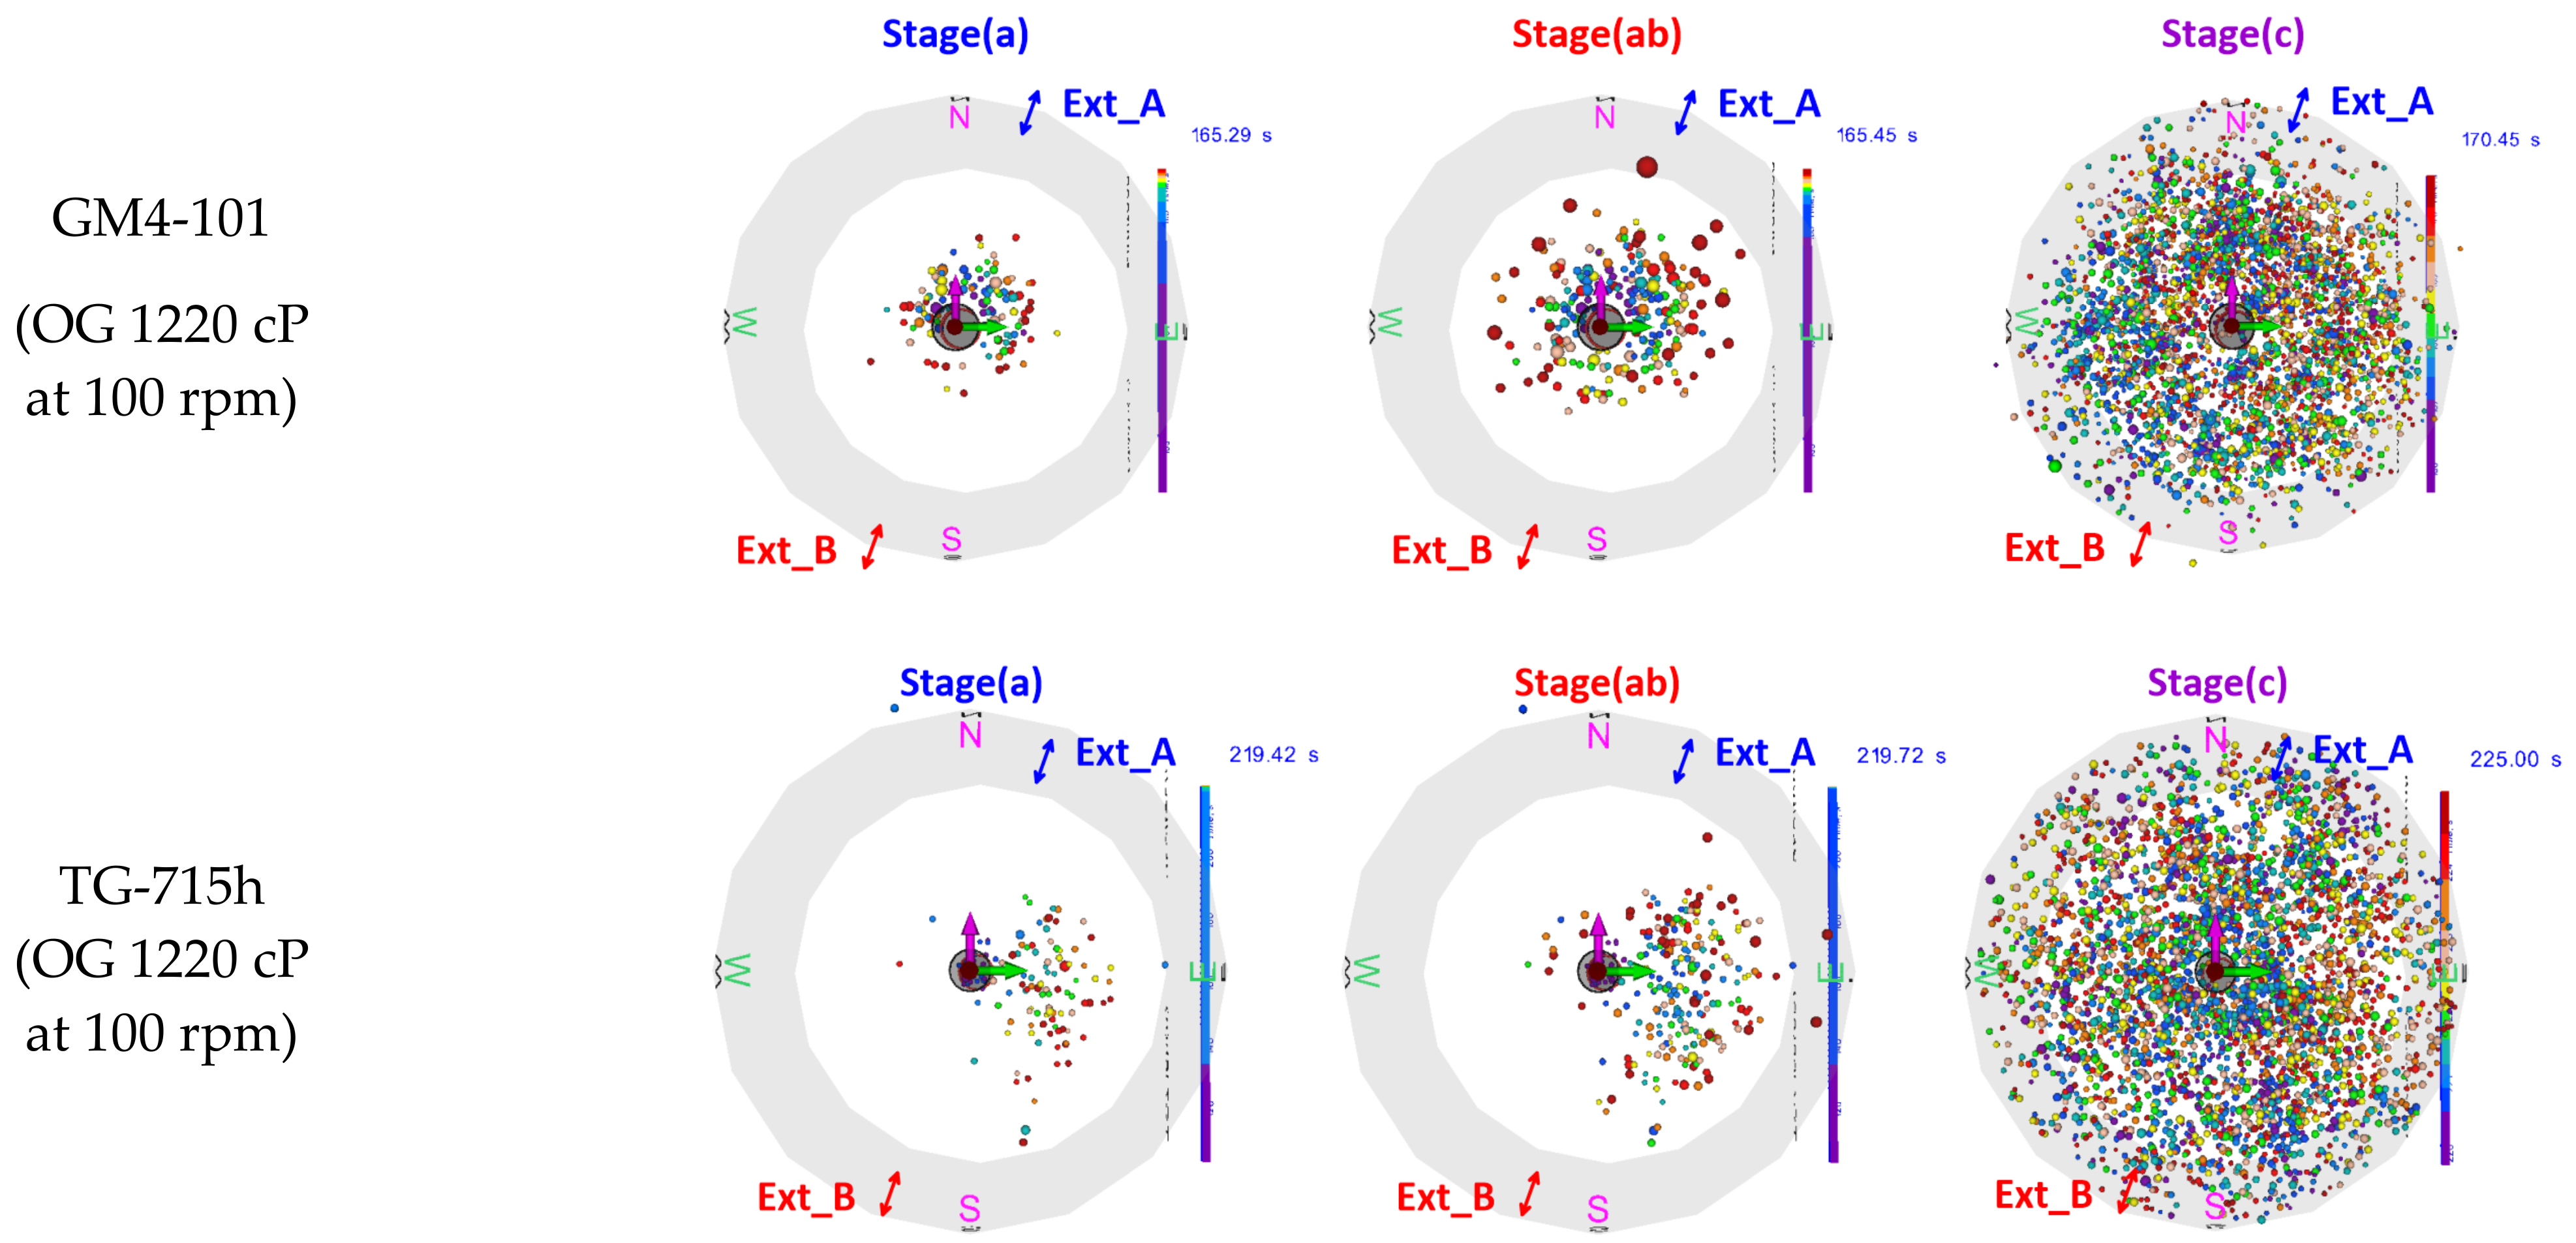
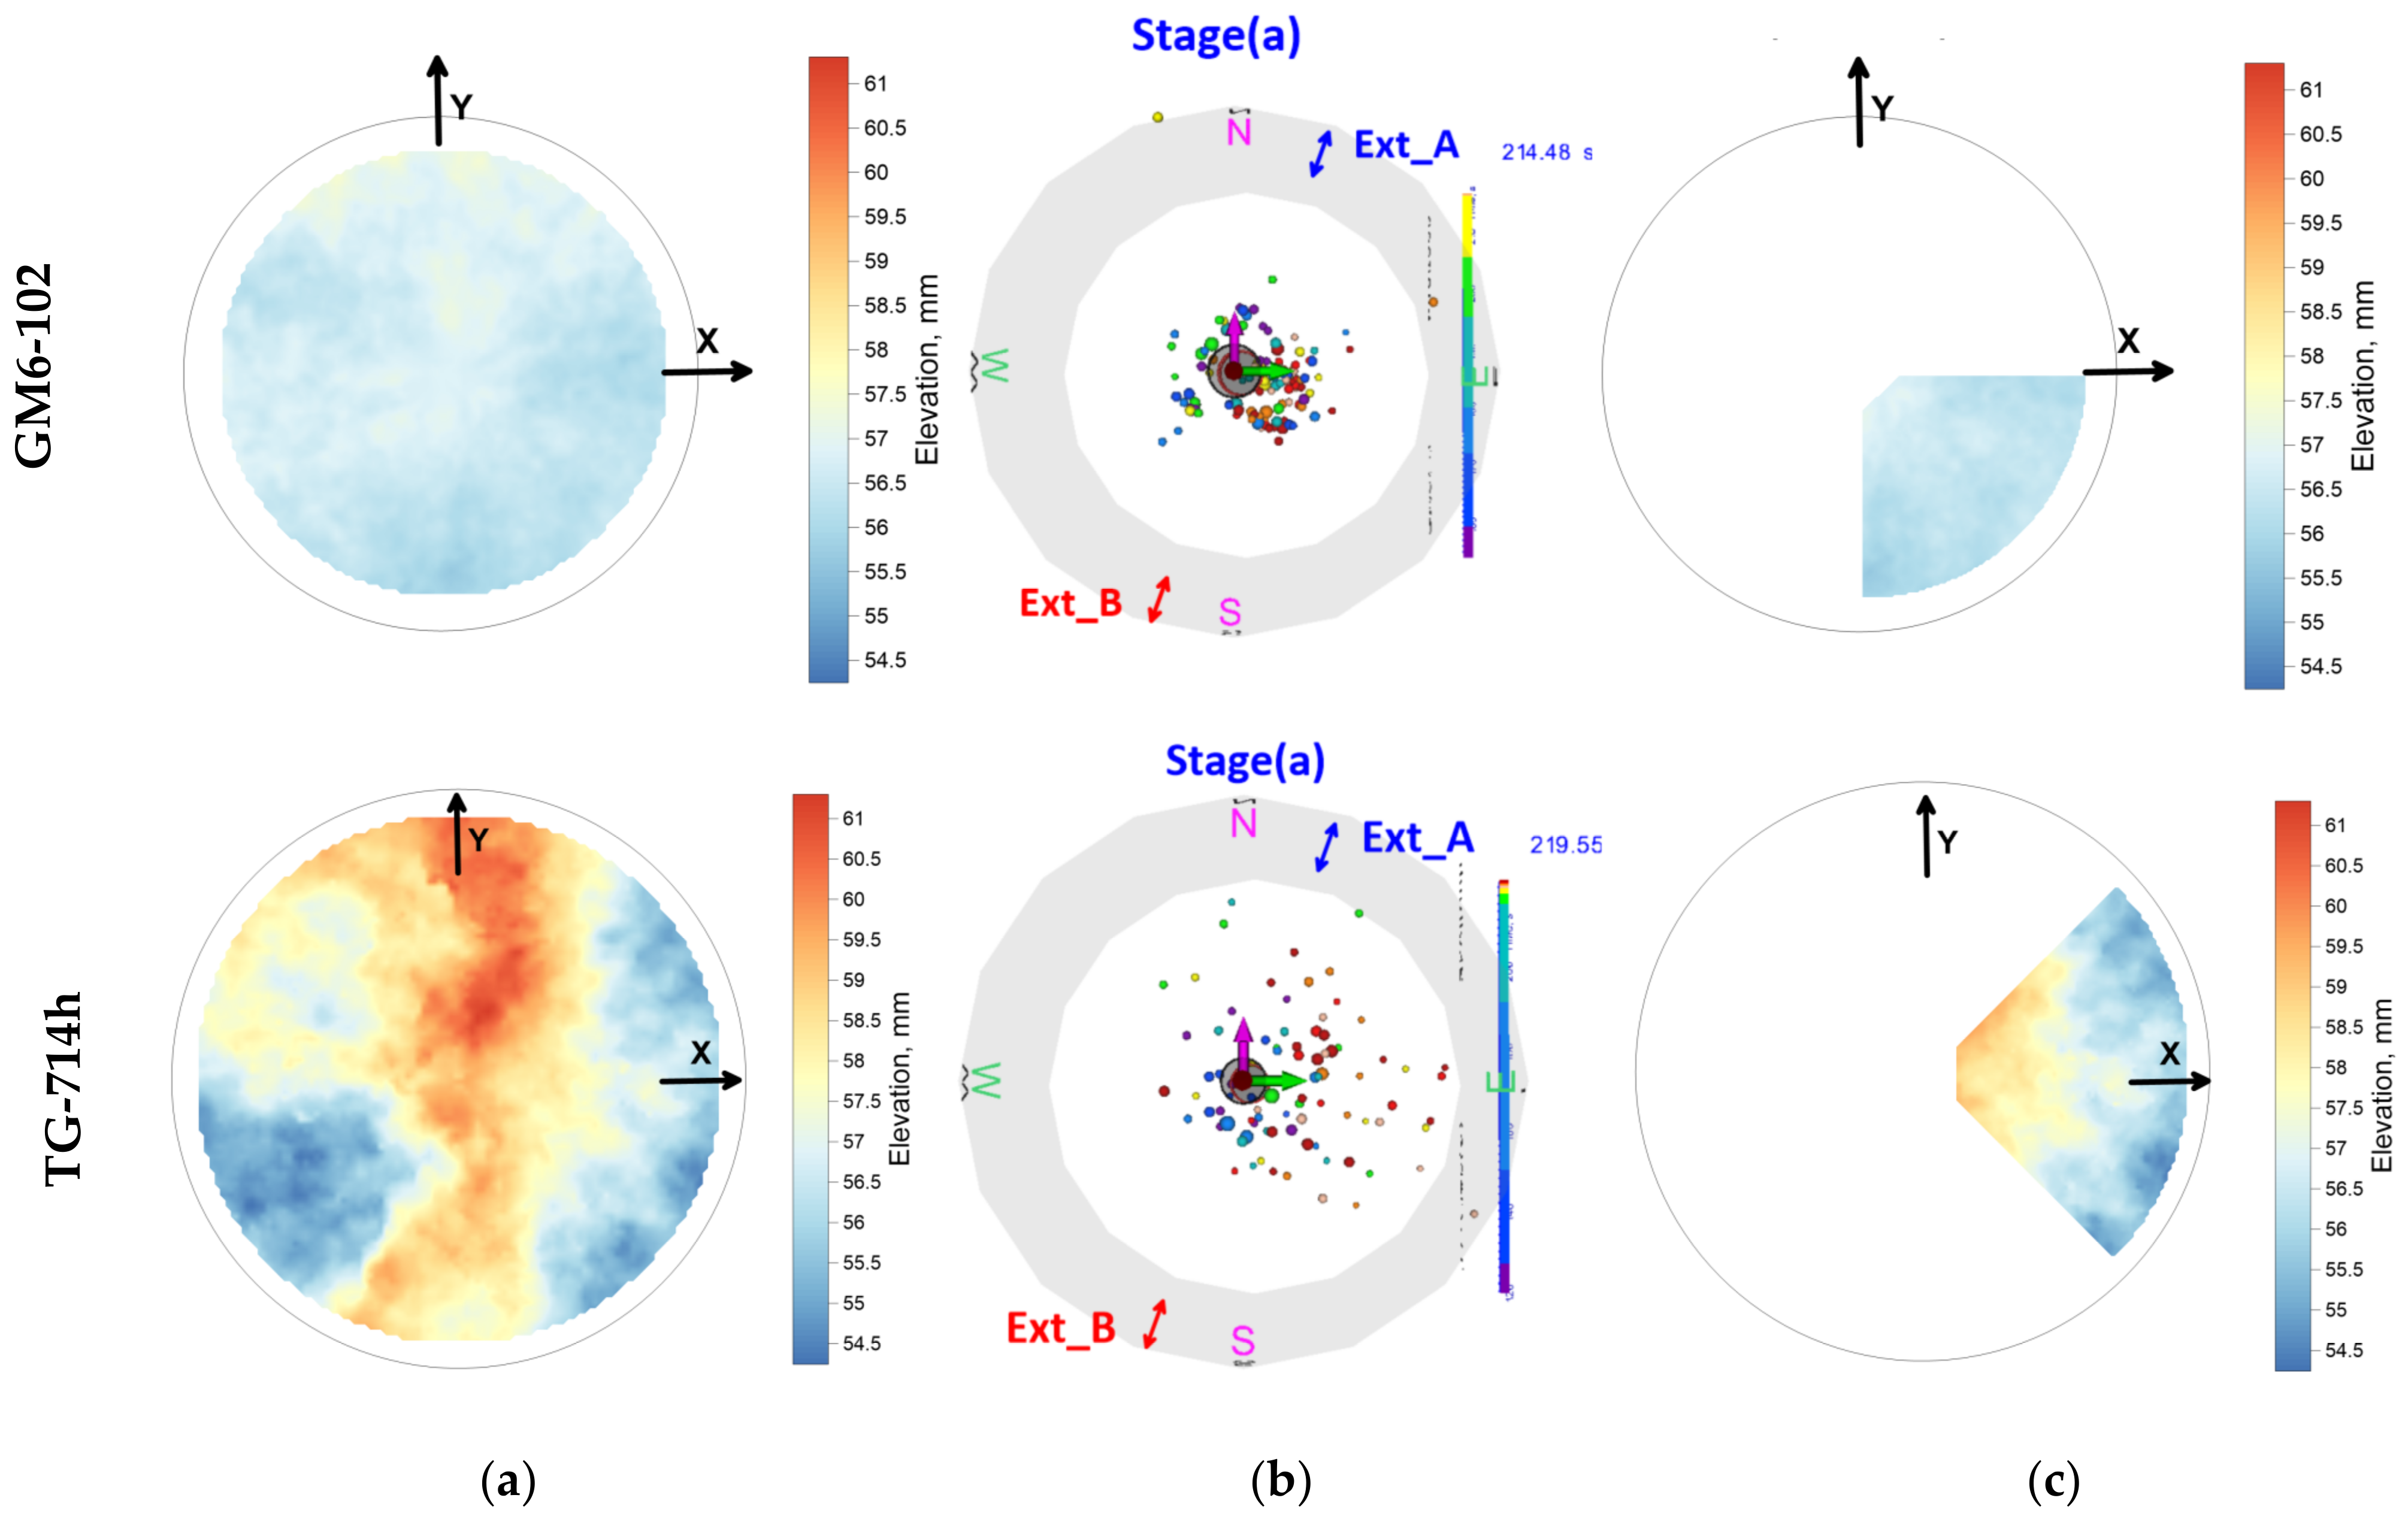
Figure 12 depicts the three-dimensional spatial distribution of the AE signals recorded during the three experimental stages for the dry sample (GM6-102) and the saturated sample (GM4-101). The middle column, labeled stage (ab), shows all AE events localized from the HF initiation to the moment when the HF approached the cylindrical surface of the rock. As it was shown above, this moment also coincides with the moment of maximal AE amplitude registration (
Figure 11d,l). The left column of plots, labeled stage (a), shows the initial part of the HF propagation up to the moment when half of the number of the AE signals localized before the HF approached the surface of the rock, was recorded. Most of the AE signals recorded during stage (a) were localized near the open-hole section, with small asymmetry indicating the preferred direction of the initial stage of the HF propagation. In contrast to the almost symmetrical fracture growth in the dry sample (GM6-102), the fracture development in the saturated sample (GM4-101) shows significant asymmetry based on the results of measurements recorded by two observation systems. According to the located AE events, the fracture growth significantly prevails in the north-east direction, or in the direction of the installation site of the axial extensometer, labeled Ext_A (
Figure 12b, upper row, blue). The results presented in
Figure 11j (GM4-101, right column of plots) show that the deformation measured by Extensometer A at the moment when the HF approached the surface of the sample, was equal to 68 μm, whereas at the same moment, Extensometer B recorded only 31 μm on the opposite side of the sample. Thus, both the AE and deformation measurements confirm asymmetry of HF propagation in the sample GM4-101.
The left column of the plots, labeled stage (c) (
Figure 12), shows the AE activity during the final stage of the test associated with HF expansion across the entire cross-section of the sample, followed by the closure of HF. The loading algorithm was designed in such a way that, after reaching a significant HF opening, the fluid was pumped out of the wellbore and the loading piston quickly returned the displacement to its initial position, corresponding to the value of an unbroken sample, ensuring closure of the HF. The AE signals recorded during stage (c) can be radiated by squeezing rough HF surfaces, which was directly confirmed by AE Moment Tensor Inversion [
27]. The observed difference in the number of AE events may be related to the difference in elastic wave attenuation in dry and saturated samples [
40]. Note that the injection of high-viscosity SO in the GM5-101 test resulted in a significantly higher number of AE events than the injection of lower viscosity OG in the GM6-102 and GM4-101 samples, as well as in a larger deformation of the sample and a larger volume injected into the HF (
Figure 9 and
Figure 11, pink curves). It can be explained by the creation of HF with a larger aperture during the injection of higher viscosity fluid, which is consistent with [
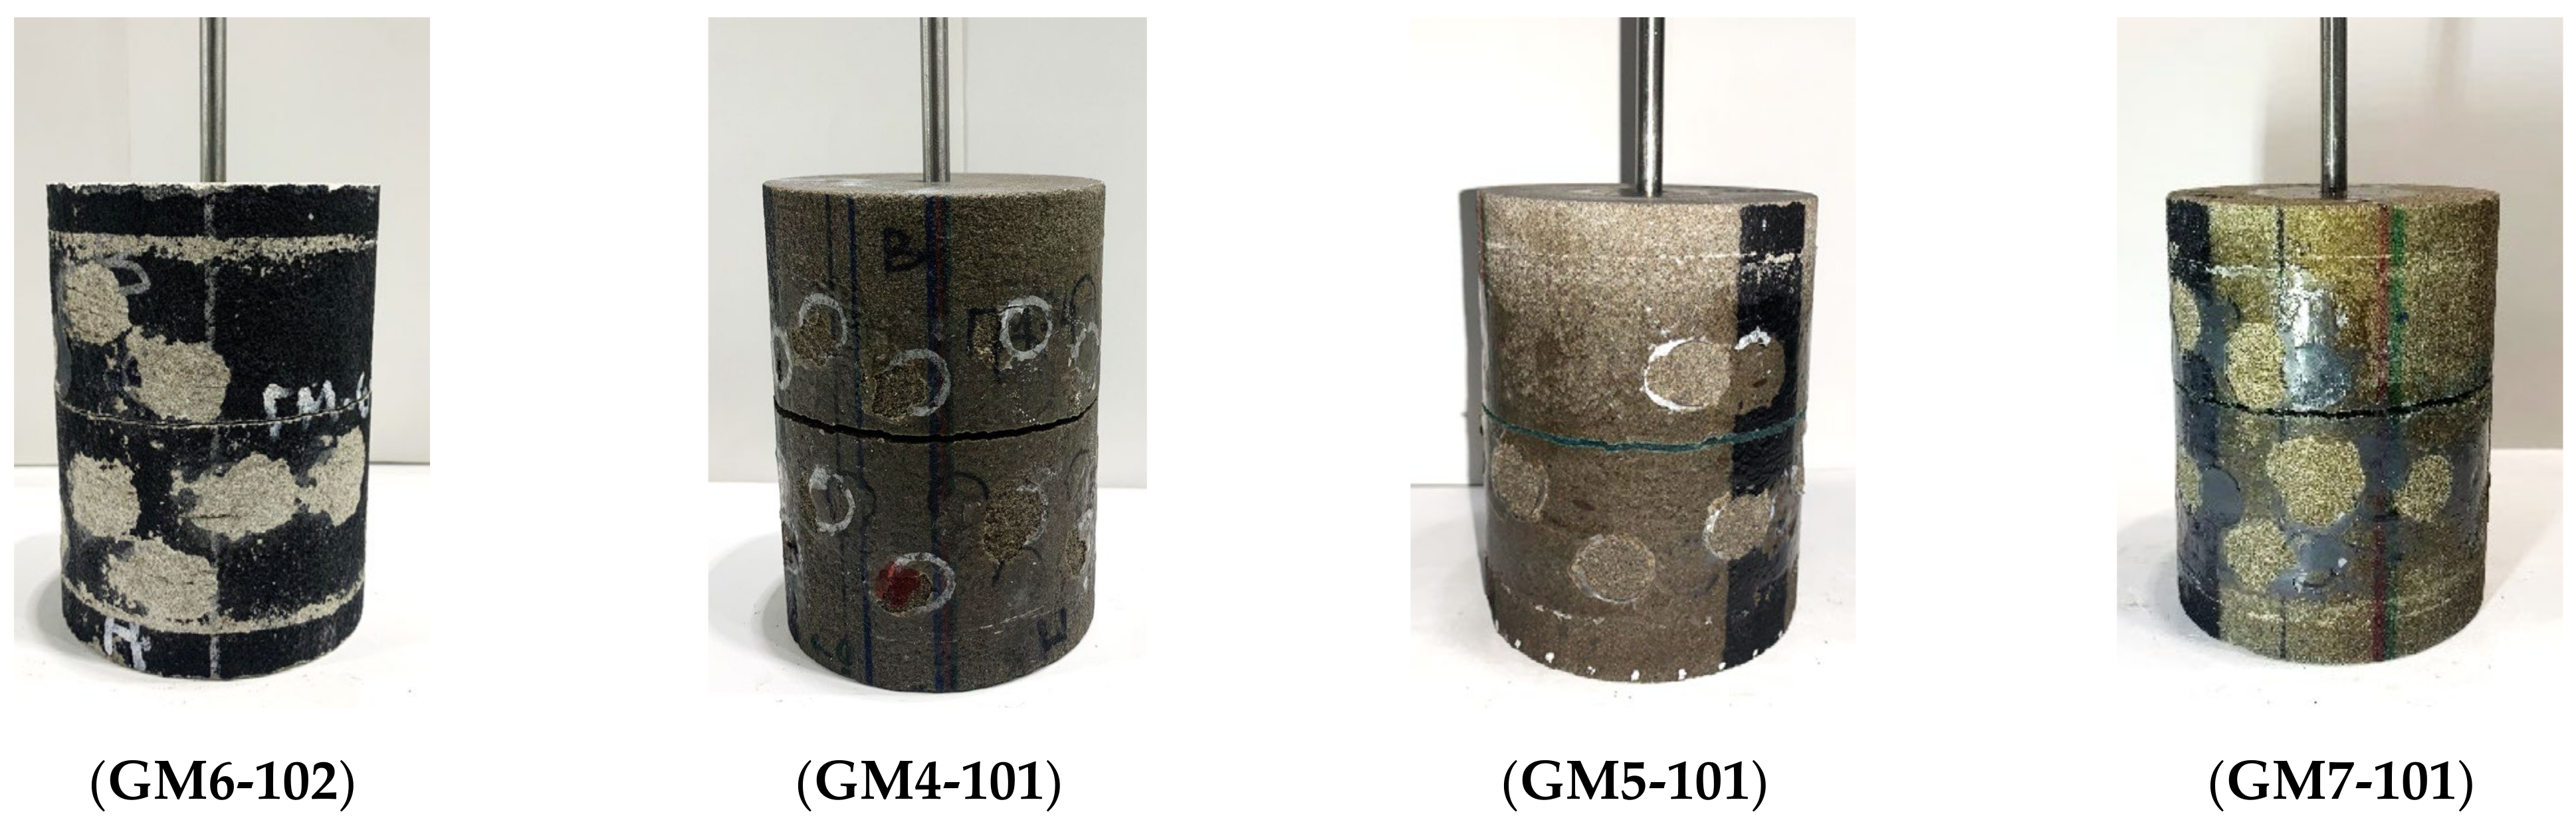
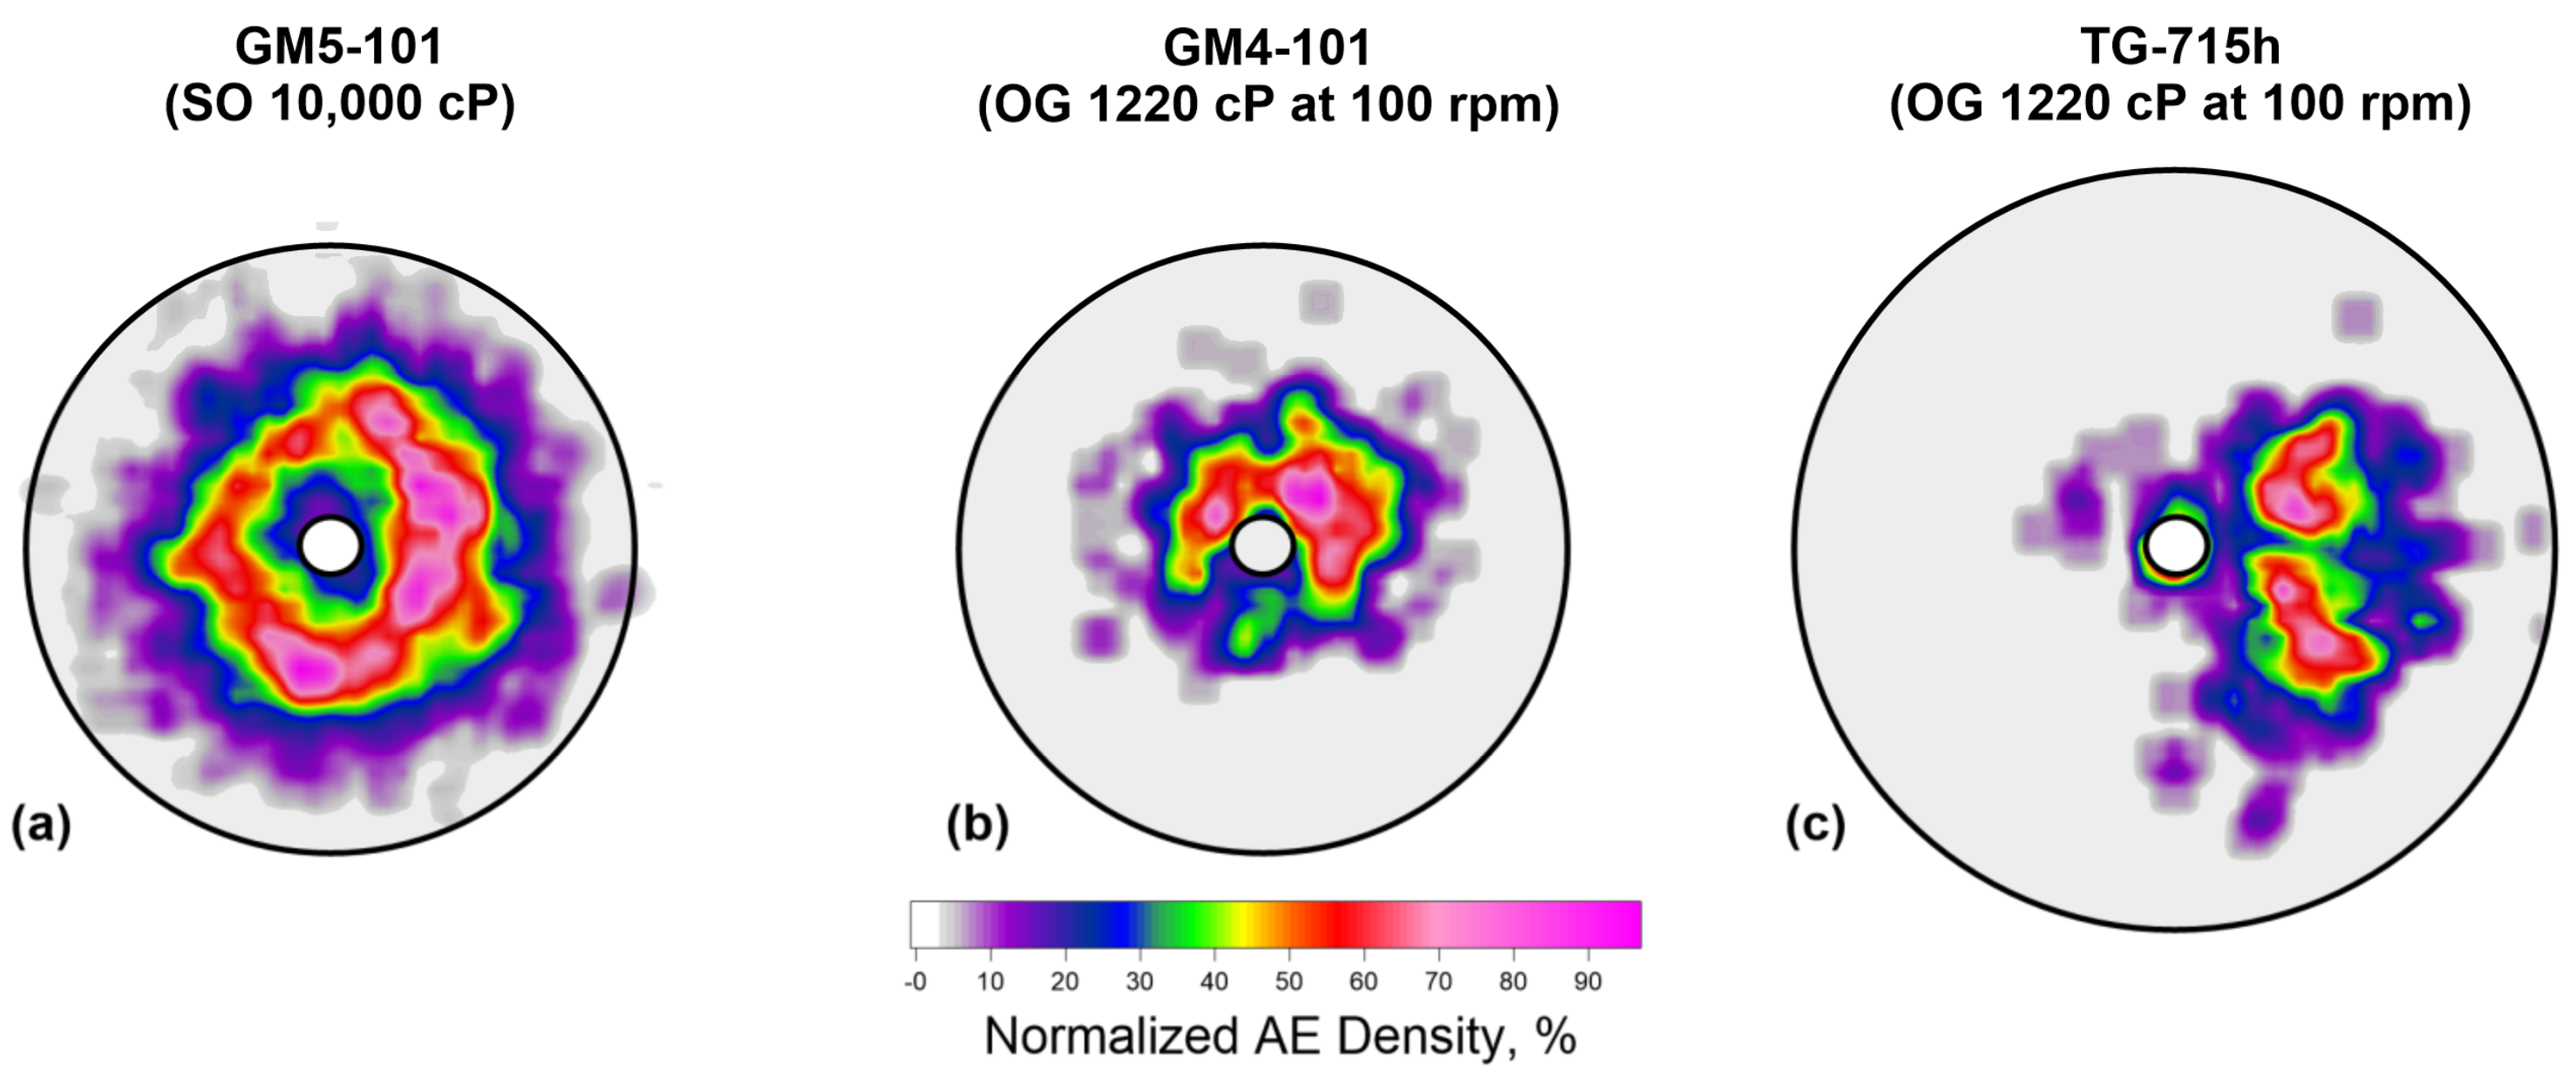
39]. In all performed tests, the positions of the located AE events exactly repeat the shape of the obtained fractures (
Figure 13).
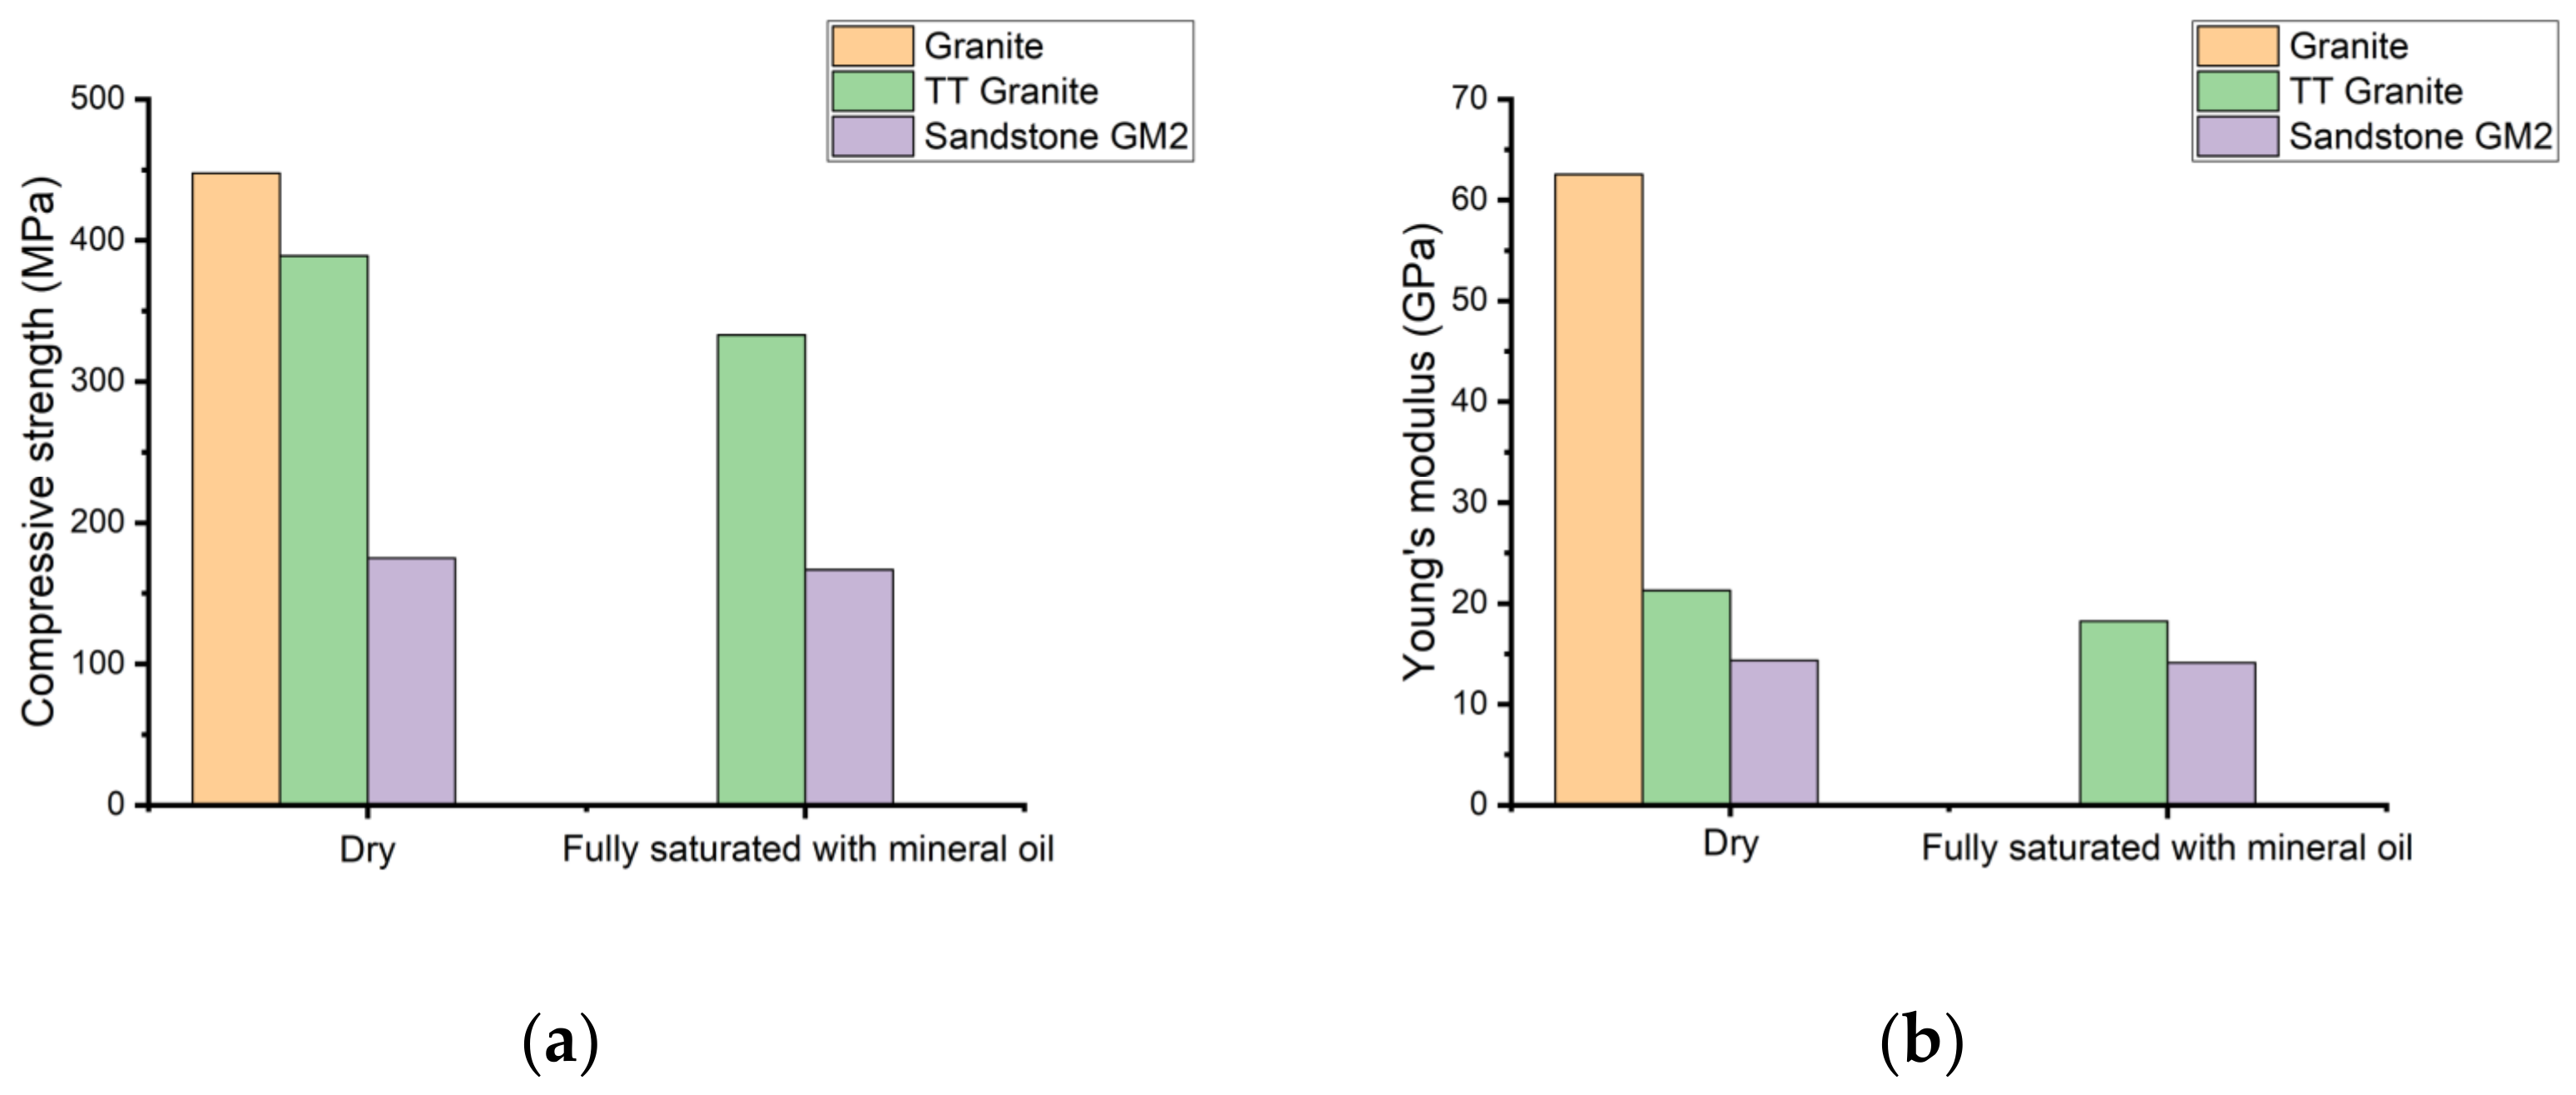
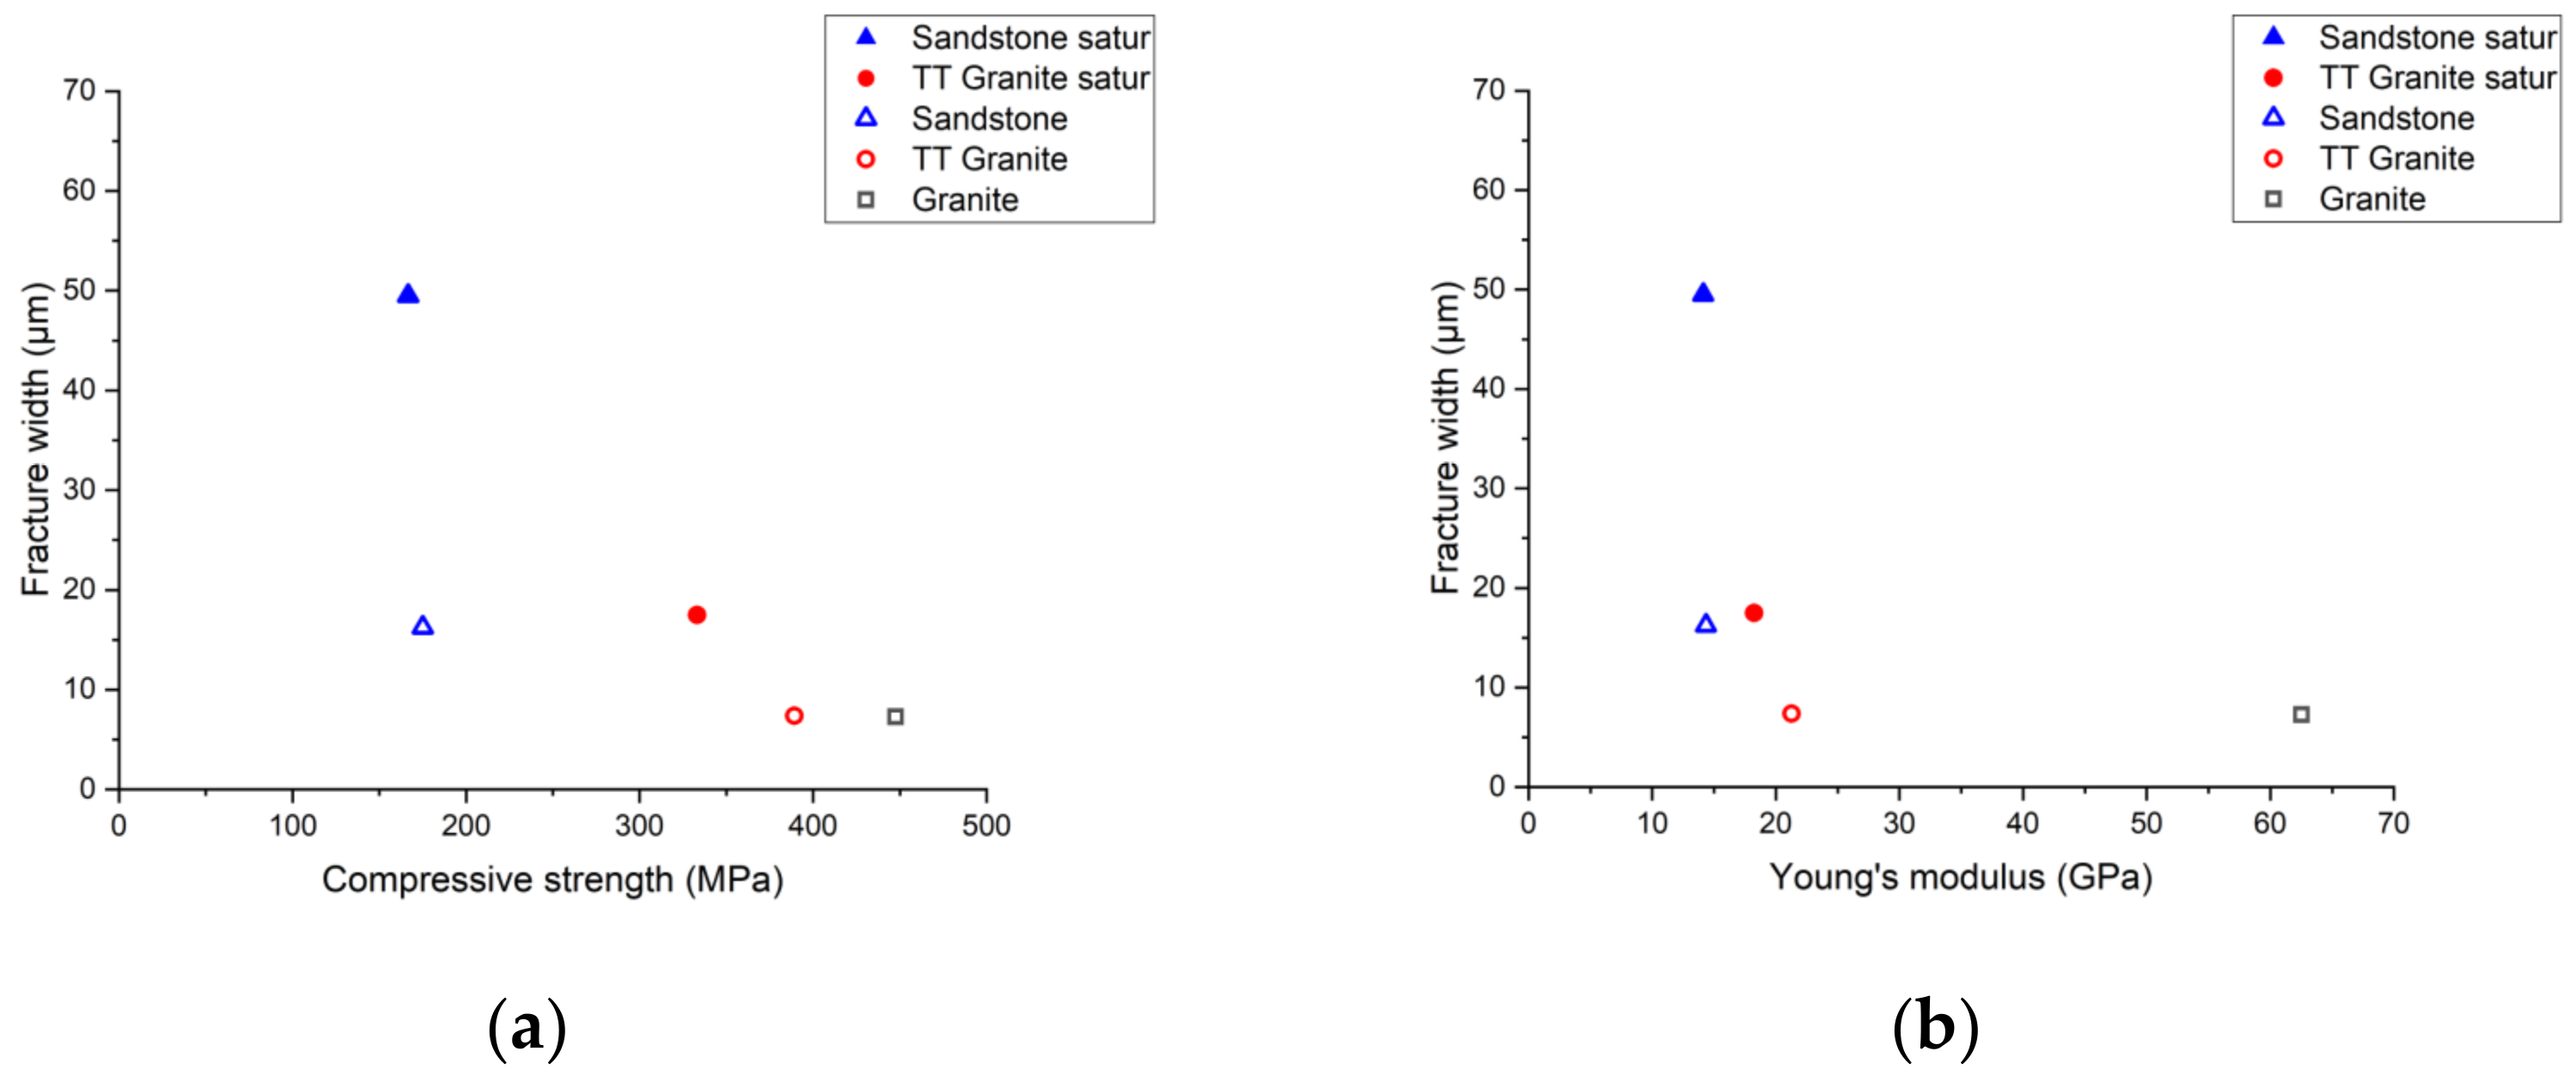
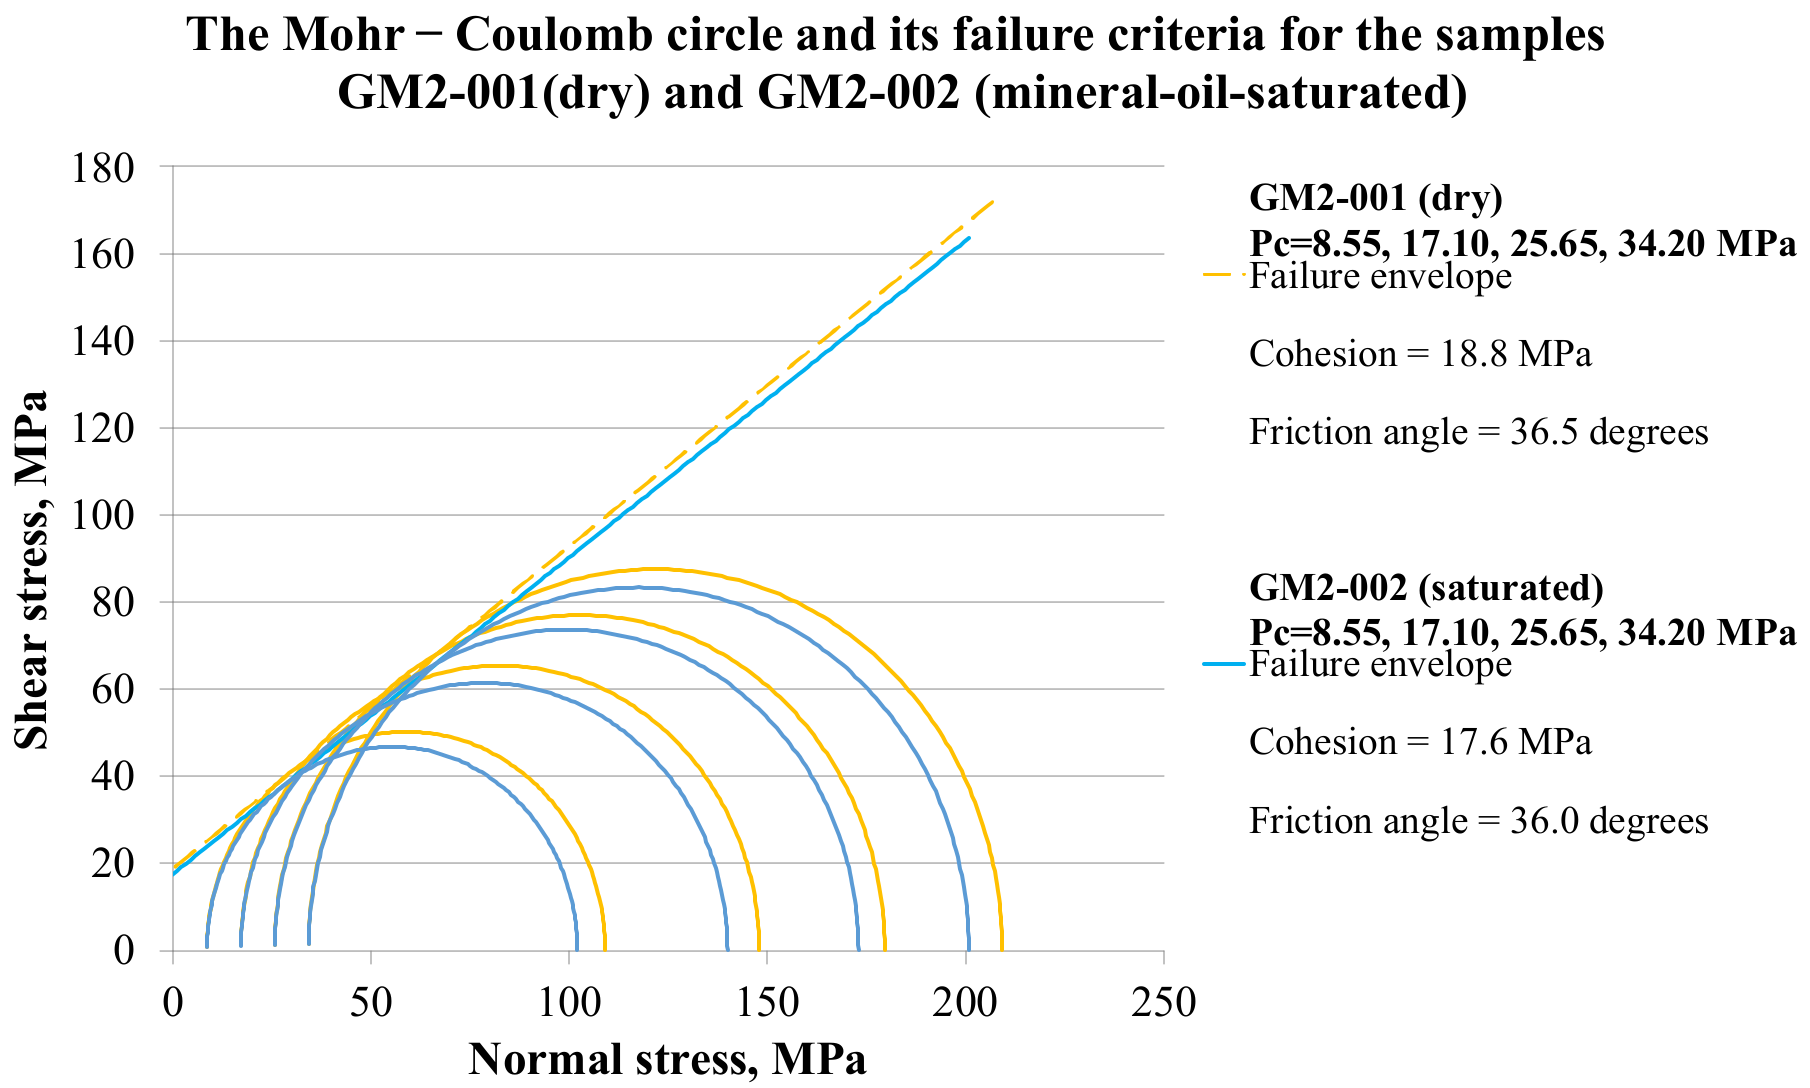
As shown earlier in
Section 3.1, the mineral-oil-saturated sandstone specimen was characterized by lower values of Young’s modulus, compressive strength, and cohesion compared to the dry sample of the same sandstone. In hydraulic fracturing experiments, we found that the saturated sample (GM4-101) had a lower BP value and a wider fracture opening compared to the corresponding parameters for the dry sample (GM6-102). However, the fracture propagation speed is higher in the dry sample (GM6-102).
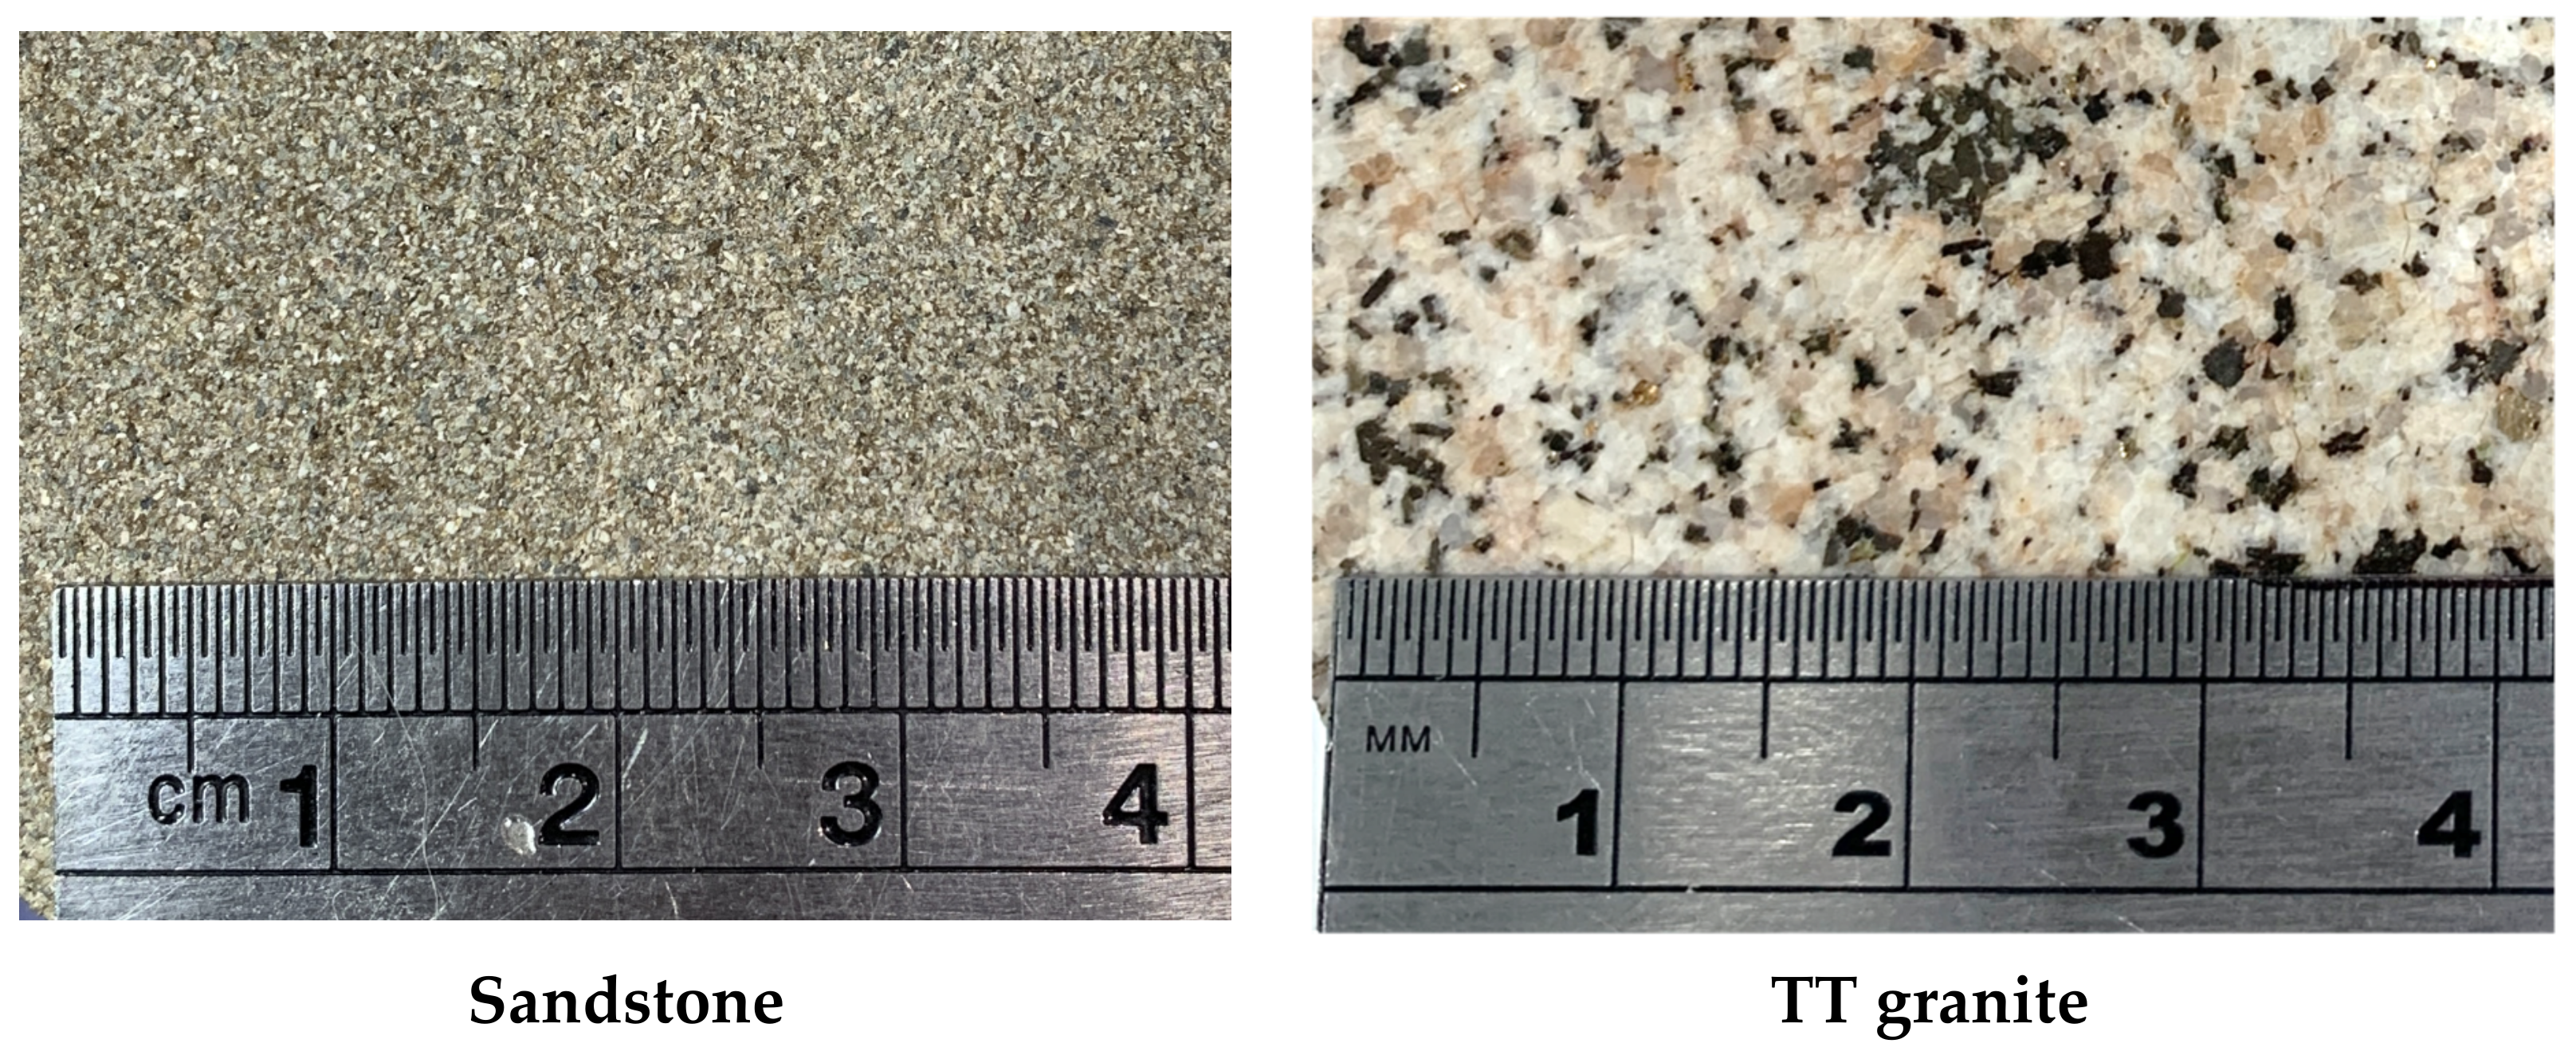
3.3. Hydraulic Fracture Propagation in Original (Unheated) and Thermally Treated (TT) Granite
To supplement the results obtained for the sandstone specimens, three granite samples were prepared and tested with the OG injection (one untreated and two thermally treated samples), and, in addition, one untreated granite sample was tested with the SO injection (with a viscosity of 1000 cP). In contrast to the Newtonian SO constant viscosity, the non-Newtonian OG viscosity significantly decreased from 1220 cP at 100 rpm to 310.81 cP at 300 rpm. Hydraulic fracturing experiments were conducted on the four granite specimens at
of 22 MPa and
of 8 MPa. The horizontal fracture orientation was induced and controlled by the sample loading scheme; the induced fracture was oriented in the
plane, perpendicular to the
plane, in all tests. Fracturing fluids were injected at a constant rate of 5 mL/min. The main experimental conditions are described in
Table 6.
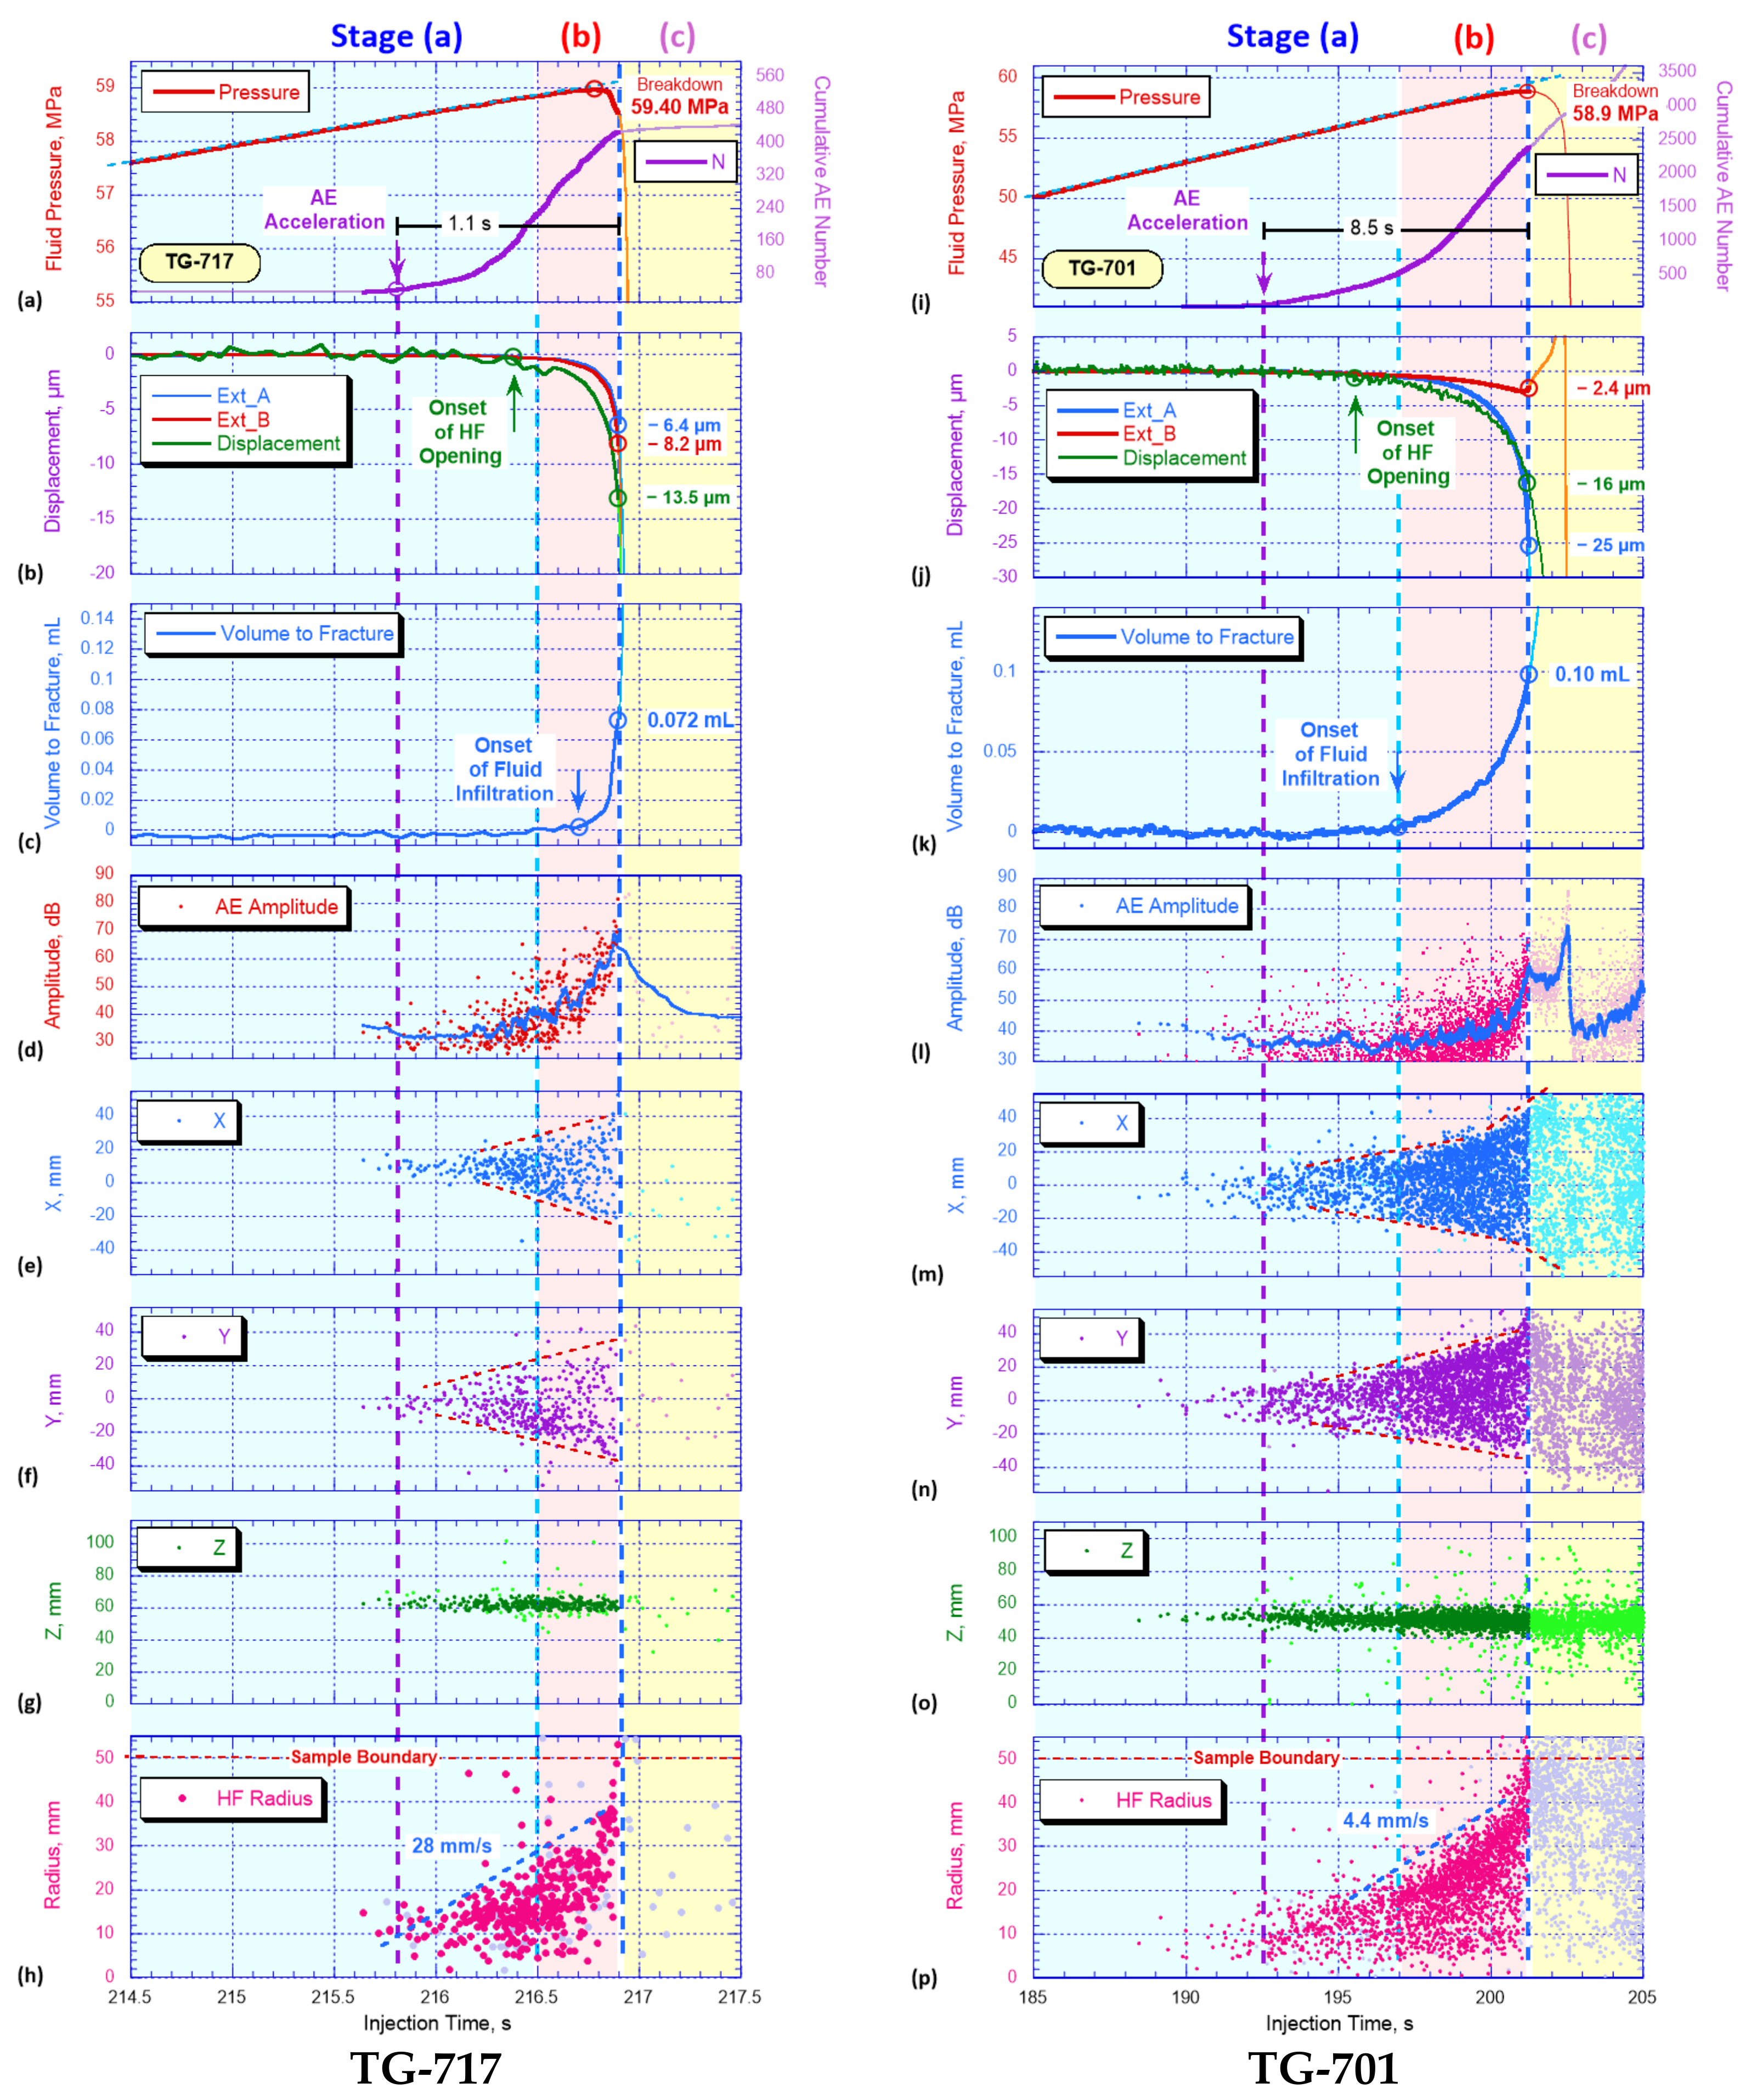
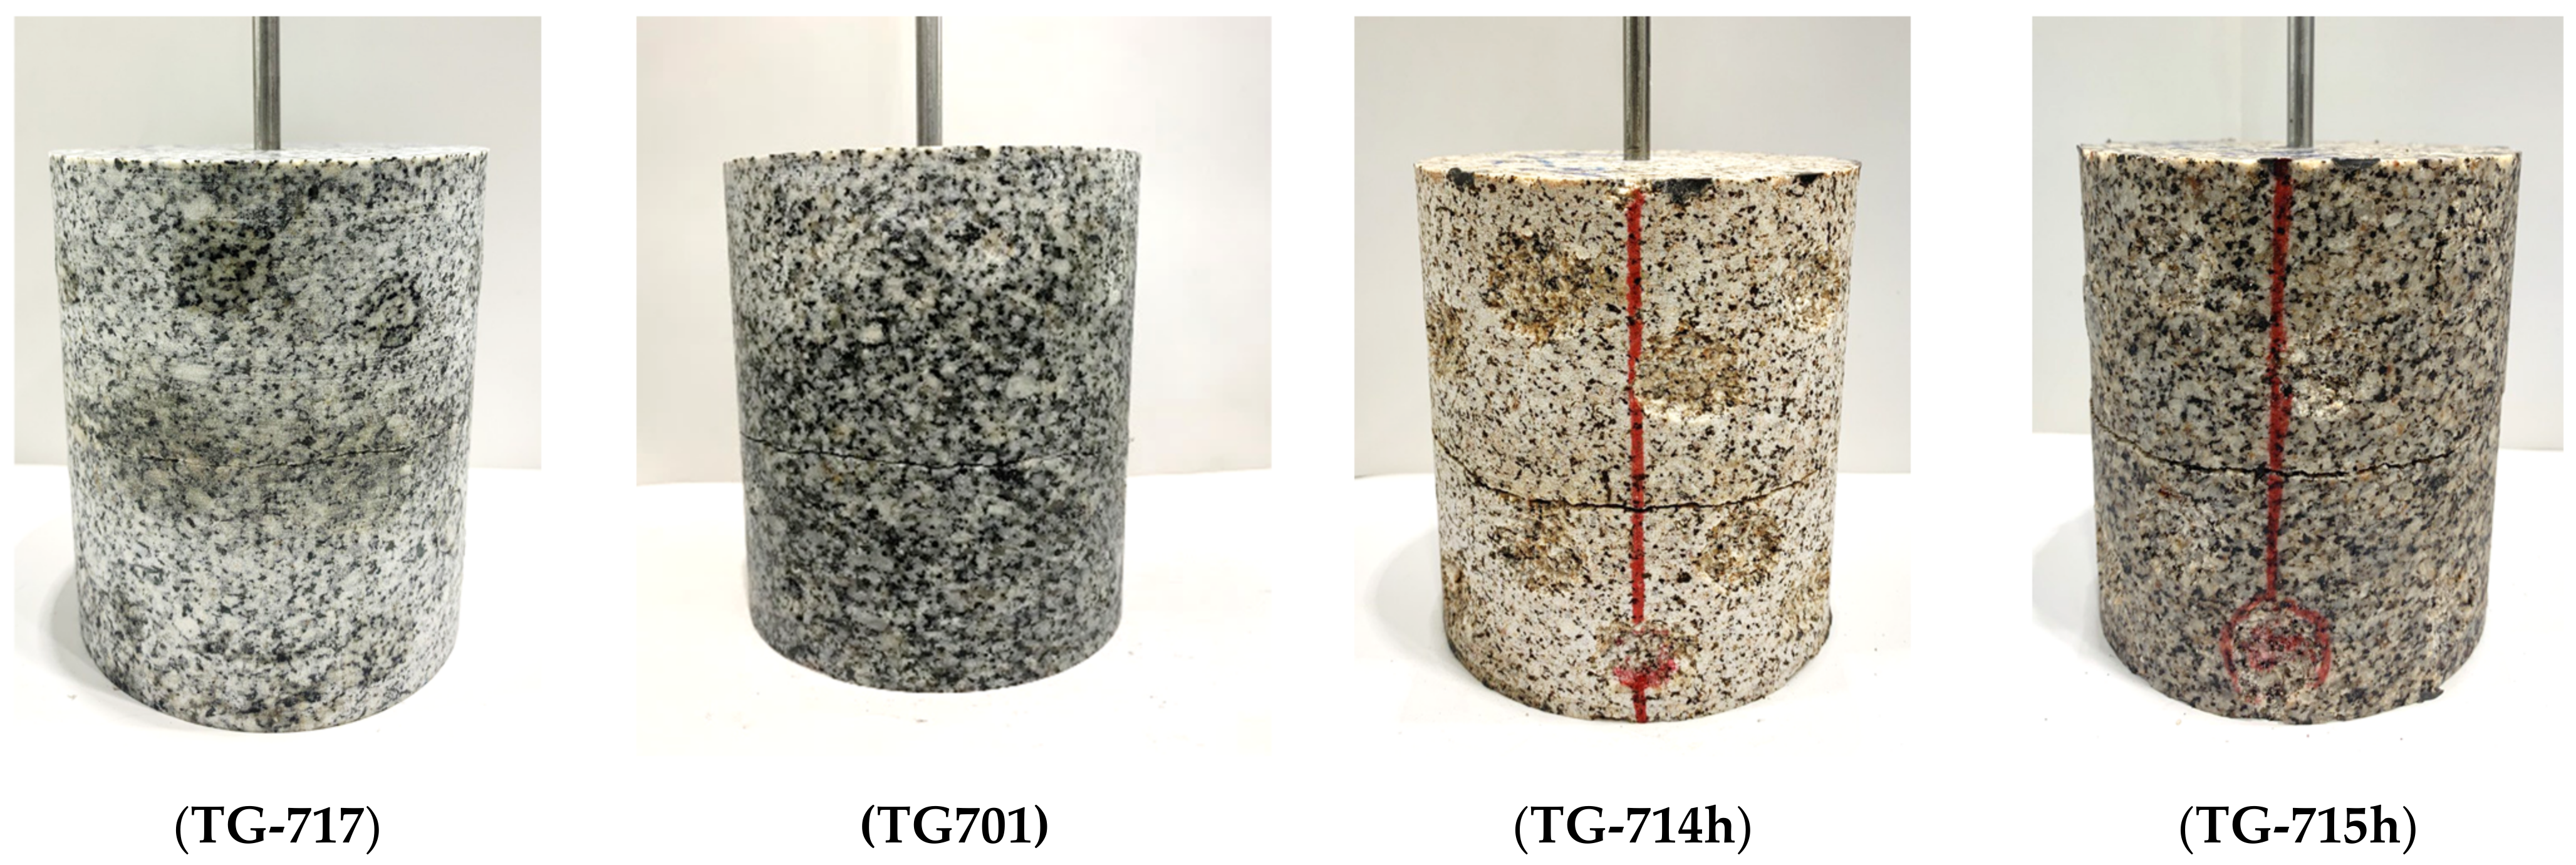
At first, let us look at the parameters of HF recorded in the original (untreated) granite samples fractured by the OG injection (TG-717,
Figure 14, left column) and by the SO injection (TG-701,
Figure 14, right column). Similarly to the sandstone tests presented above, the moment when the HF approached the sample surface was also registered very close to the moment when the highest AE amplitude was recorded (
Figure 14, vertical blue dash lines). In case of the OG injection (left column),
Figure 14a shows that about 1.1 s before this moment, marked by the vertical blue dashed line, an acceleration of AE activity was recorded (vertical violet dashed line) and about 0.6 s later, an onset of axial displacement was recorded (
Figure 14b, green arrow), indicating that the HF has begun to open. Note that the onset of fluid infiltration into the HF was observed about 0.3 s later than the onset of displacement, or just 0.2 s before the HF reached the cylindrical surface of the rock (
Figure 14c, light blue arrow). We interpret these experimental observations by assuming that propagation of the dry FPZ took place during this 0.3-s interval between the green and blue arrows. We assume that the OG could not instantly fill all the very thin microcracks, especially if not all of them were interconnected. It means that probably during the initial stage of the OG injection, there was a lag between the front of the FPZ and the fluid front, in correspondence with the results of studies [
39,
41] where the appearance of a delay during the injection of viscous fluid was directly confirmed by the results of ultrasonic transmission measurements.
A very similar combination of recorded parameters was observed in case of SO injection (with a viscosity of 1000 cP) into TG-701 granite; however, the absolute values of almost all the parameters were different, as the comparison of the left (fluid OG) and right (fluid SO) columns of
Figure 14 shows. The injection of the fluid into the TG-701 sample caused the onset of AE activity much earlier than the moment when the HF approached the rock surface, and upon approaching the surface it showed a significantly larger number of AE signals (
Figure 14i), a larger deformation of the sample (
Figure 14j), a larger volume of fluid injected into the fracture (
Figure 14k), and a significantly lower speed of the HF propagation (
Figure 14p). We attribute the difference in all parameters, observed by several independent recording systems, to the influence of the viscosity of the injected fluid, in accordance with the results of earlier studies [
25,
39,
41].
Similarly to the tests described above, the fracturing process of the TG-717 and TG-701 samples was also divided into three stages: stage (a) lasted until half of the number of AE signals localized before the HF approached the surface of the rock was recorded (
Figure 14, light blue rectangle). Stage (b) lasted until the HF approached the cylindrical surface of the rock (
Figure 14, rose rectangle), and stage (c) represents the HF closure stage (
Figure 14, yellow rectangle).
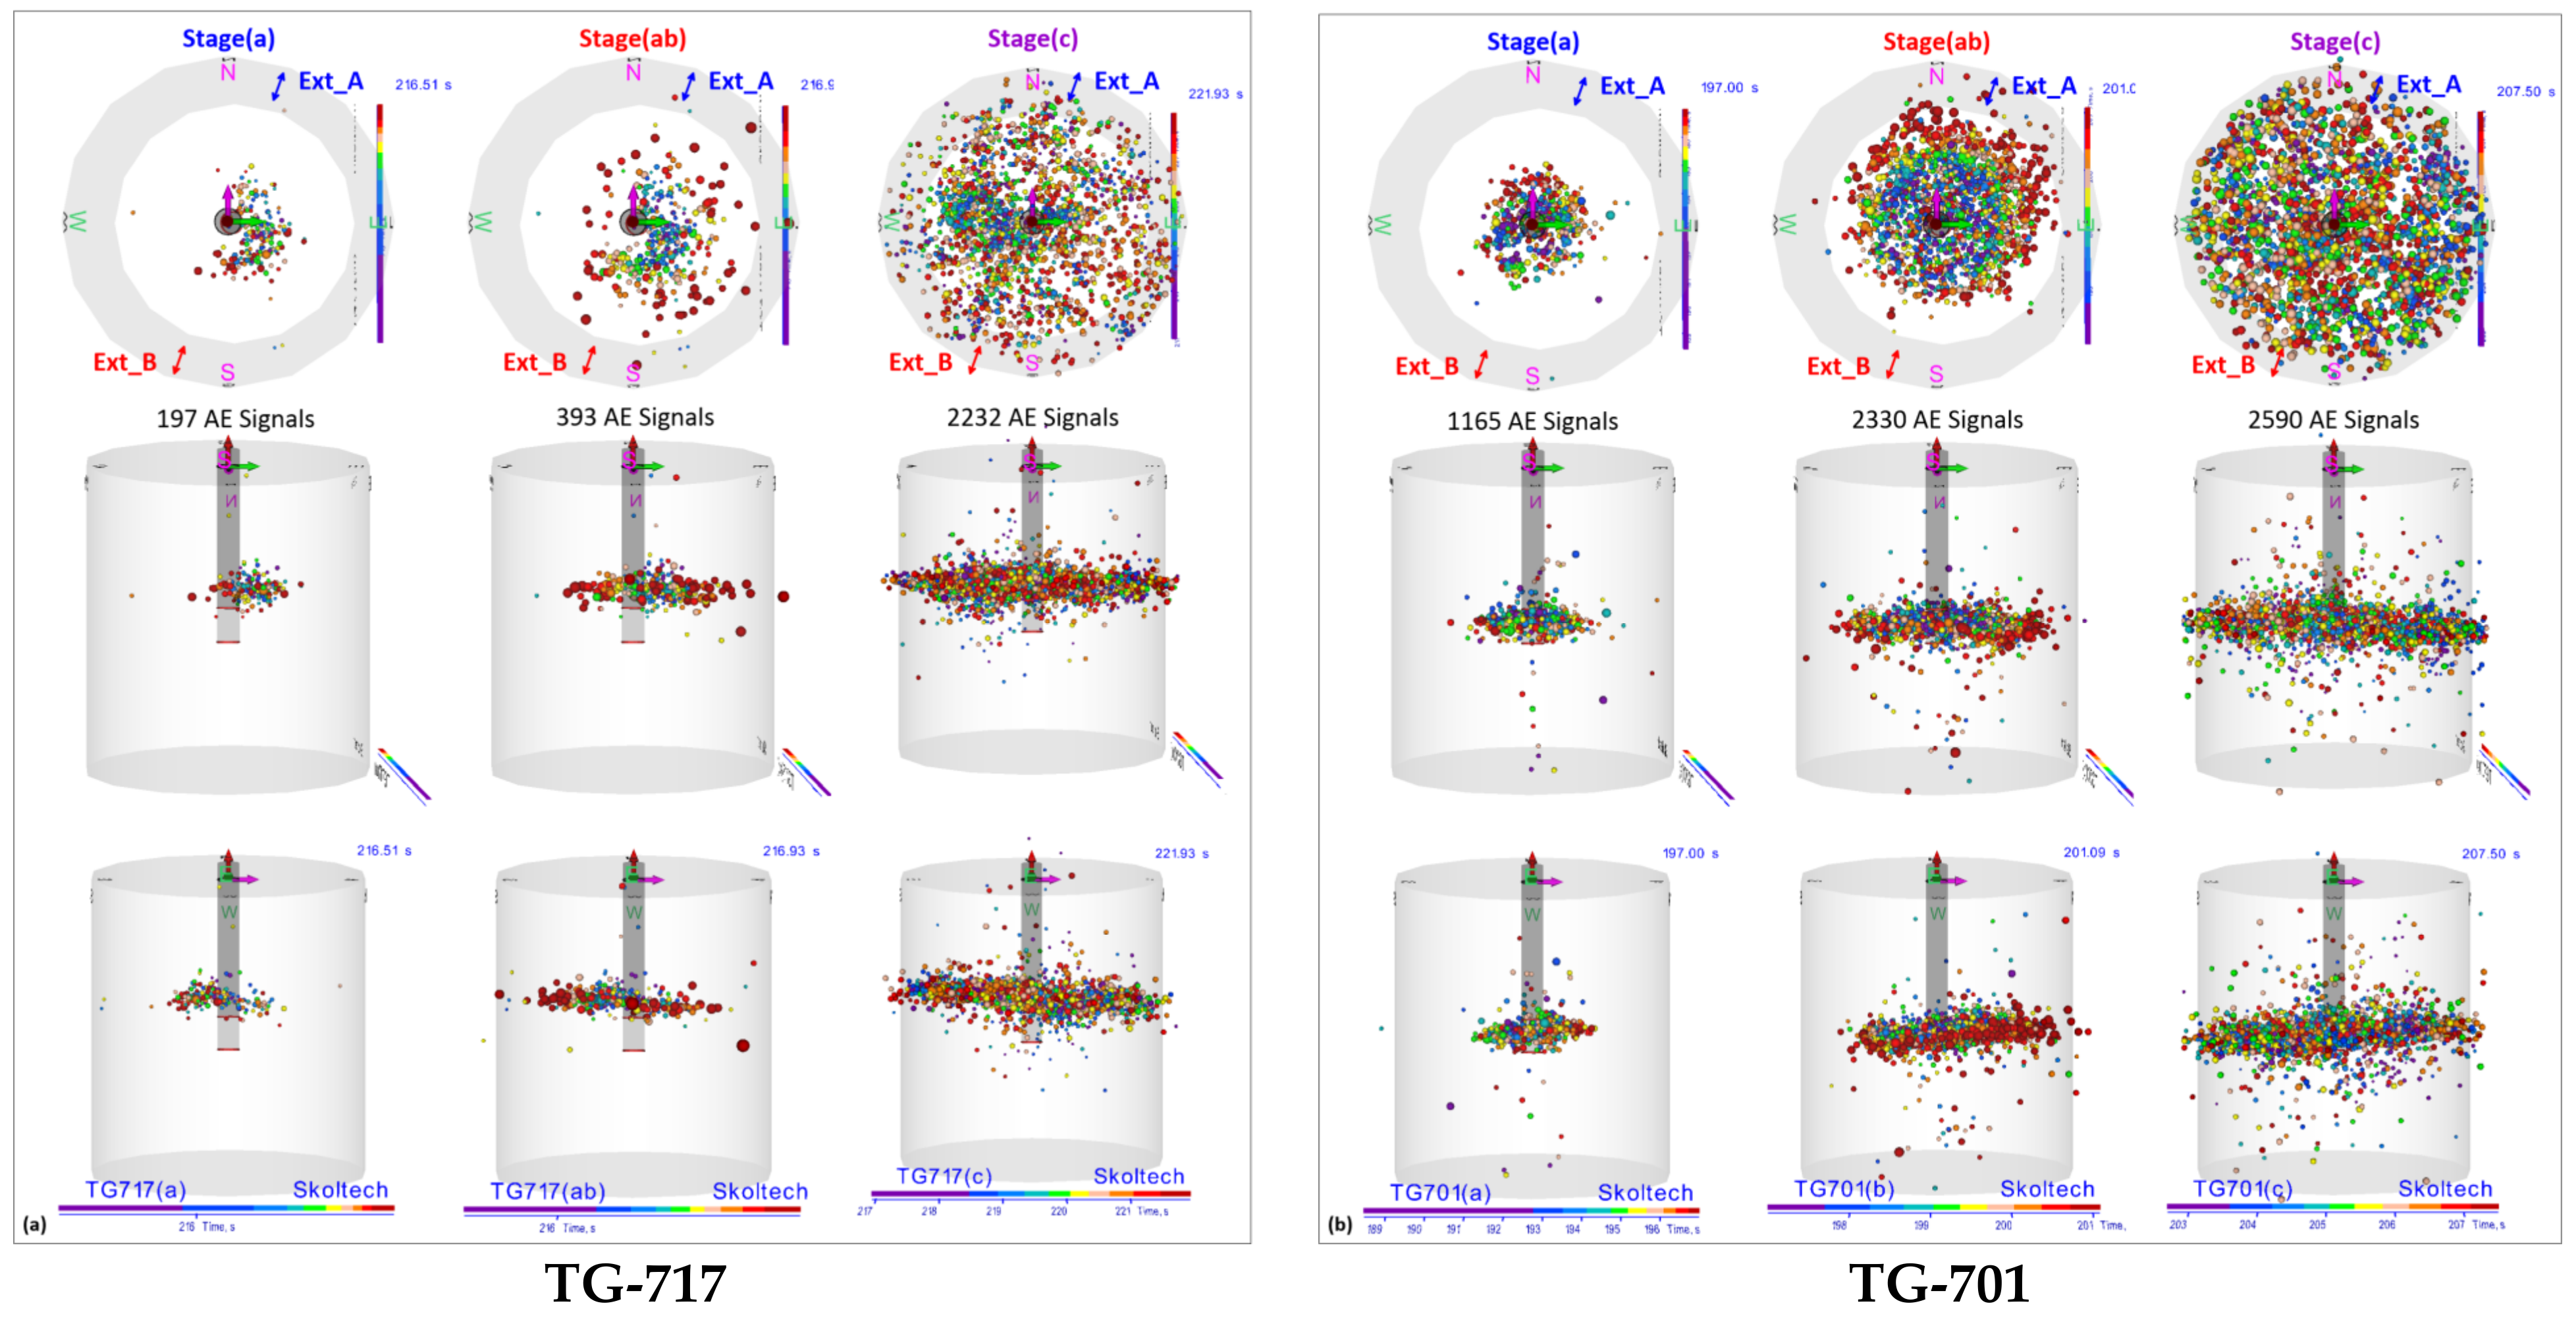
Figure 15 shows three orthogonal projections of the spatial distributions of localized AE signals corresponding to three stages of HF propagation. During the initial stage (a) (left column of plots), as well as during the HF propagation up to the sample boundary (stage (ab), middle column of plots), a predominant south-east direction of HF propagation can be observed in sample TG-717 (left) and north-east in TG-701 (right). In the case of the TG7-17 sample, this direction of HF propagation is almost symmetrical in relation to the installation places of extensometers Ext_A and Ext_B (
Figure 15a, upper row of plots), so the AE results correlate with insufficient difference in the recordings of two extensometers (
Figure 14b left, blue and red curves). In the case of the TG-701 sample, the initial propagation of the HF was directed toward the Ext_A extensometer location marked with a blue double-headed arrow, with limited propagation towards the Ext_B extensometer (
Figure 15b, upper row of plots), so there was a significant difference between the values recorded by both extensometers (
Figure 14j right, blue and red curves). Thus, for both tests, there was a close correspondence between the independent techniques (AE and deformation measurements). In the case of the TG-701 test, both methods indicated an asymmetry of the created HF.
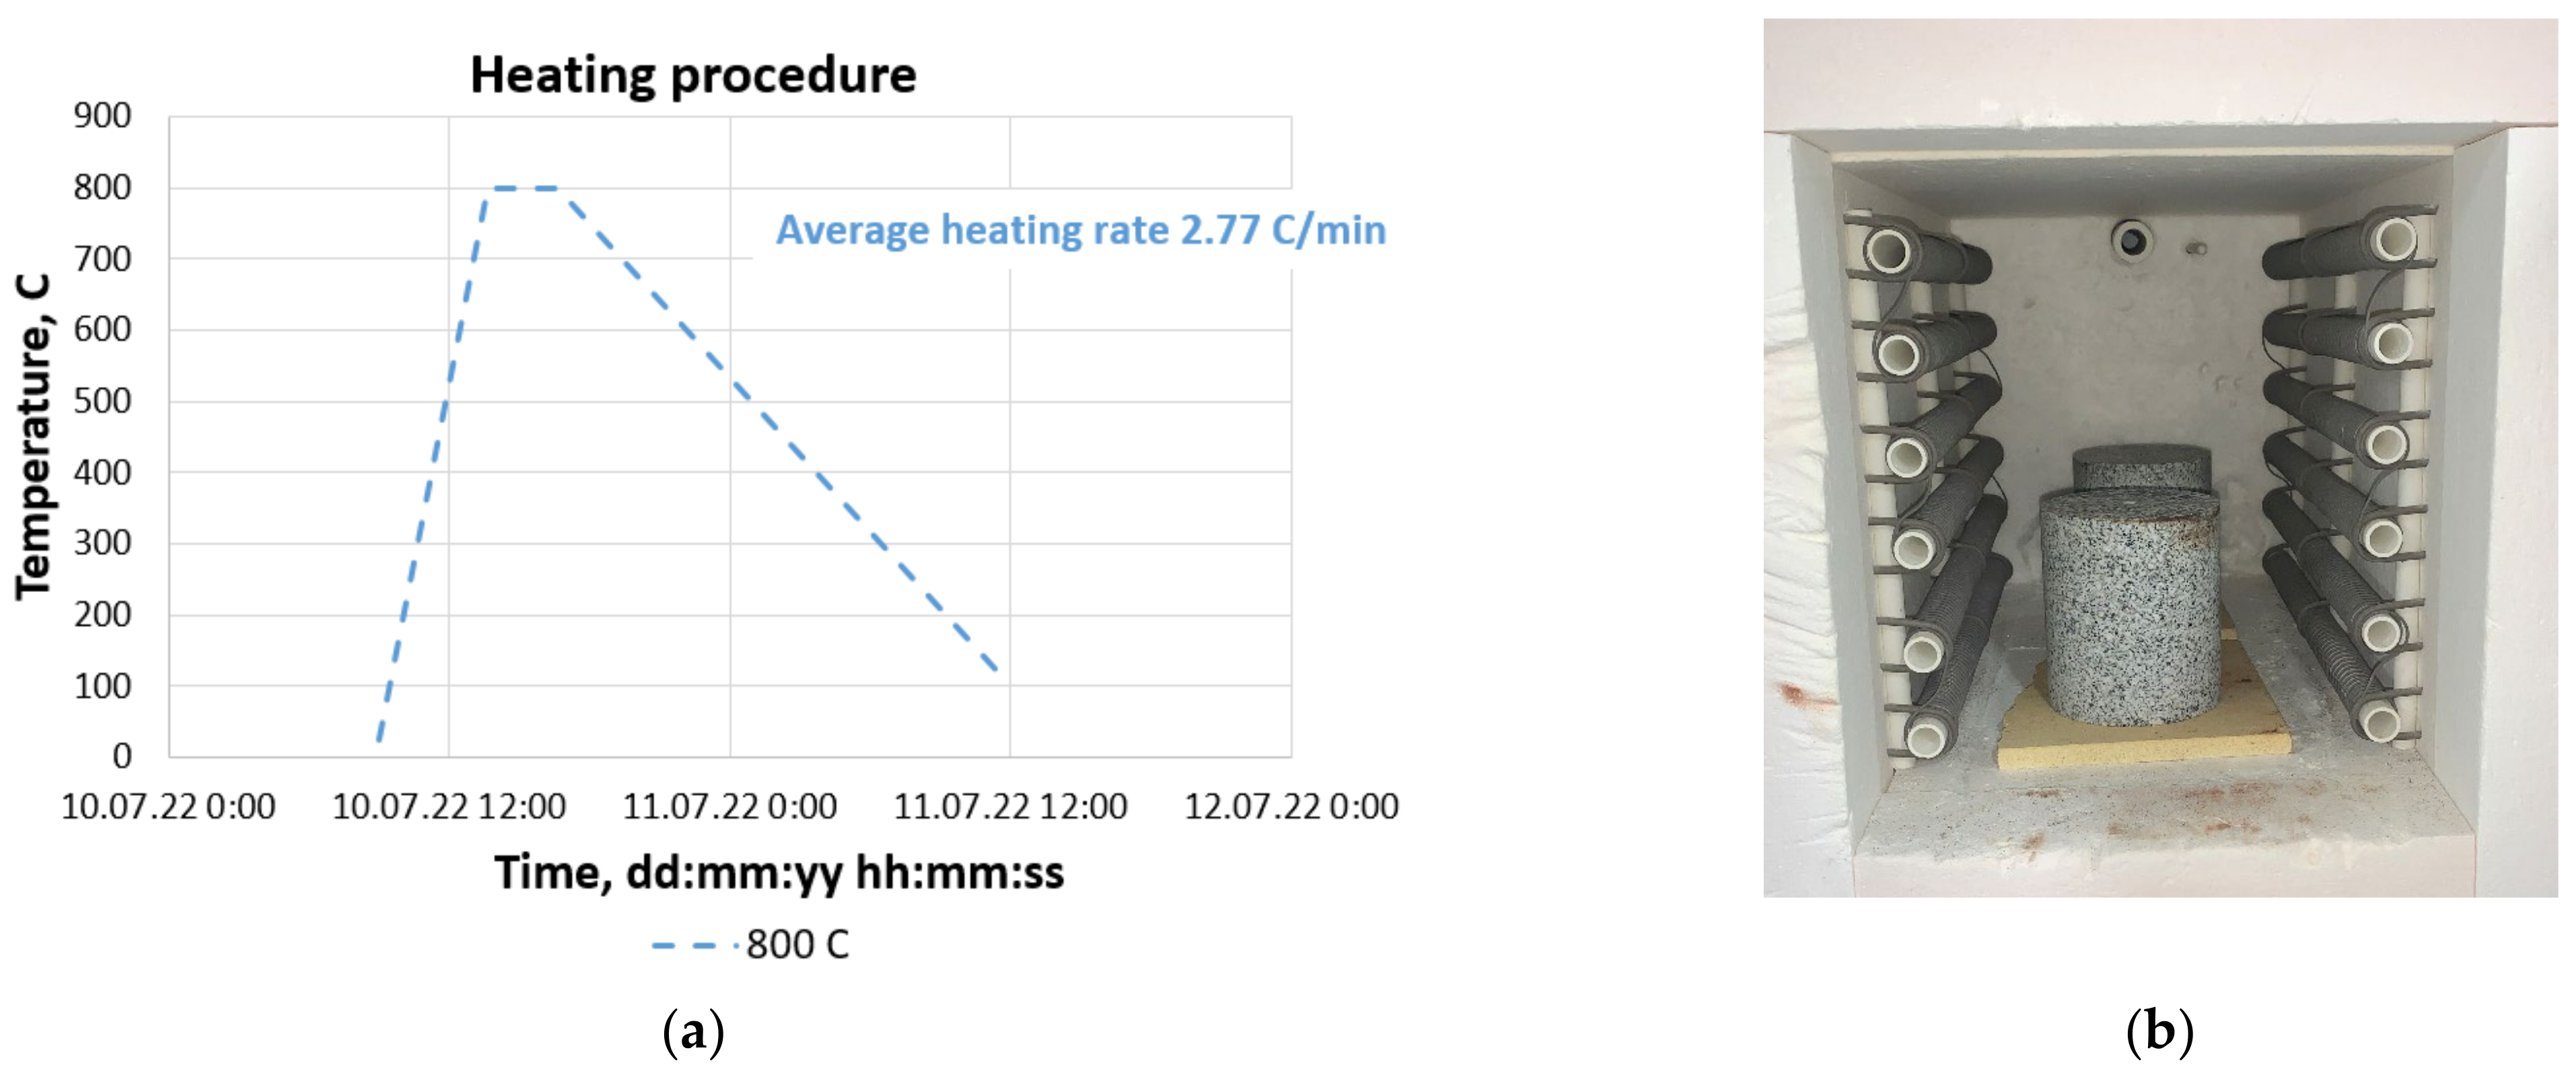
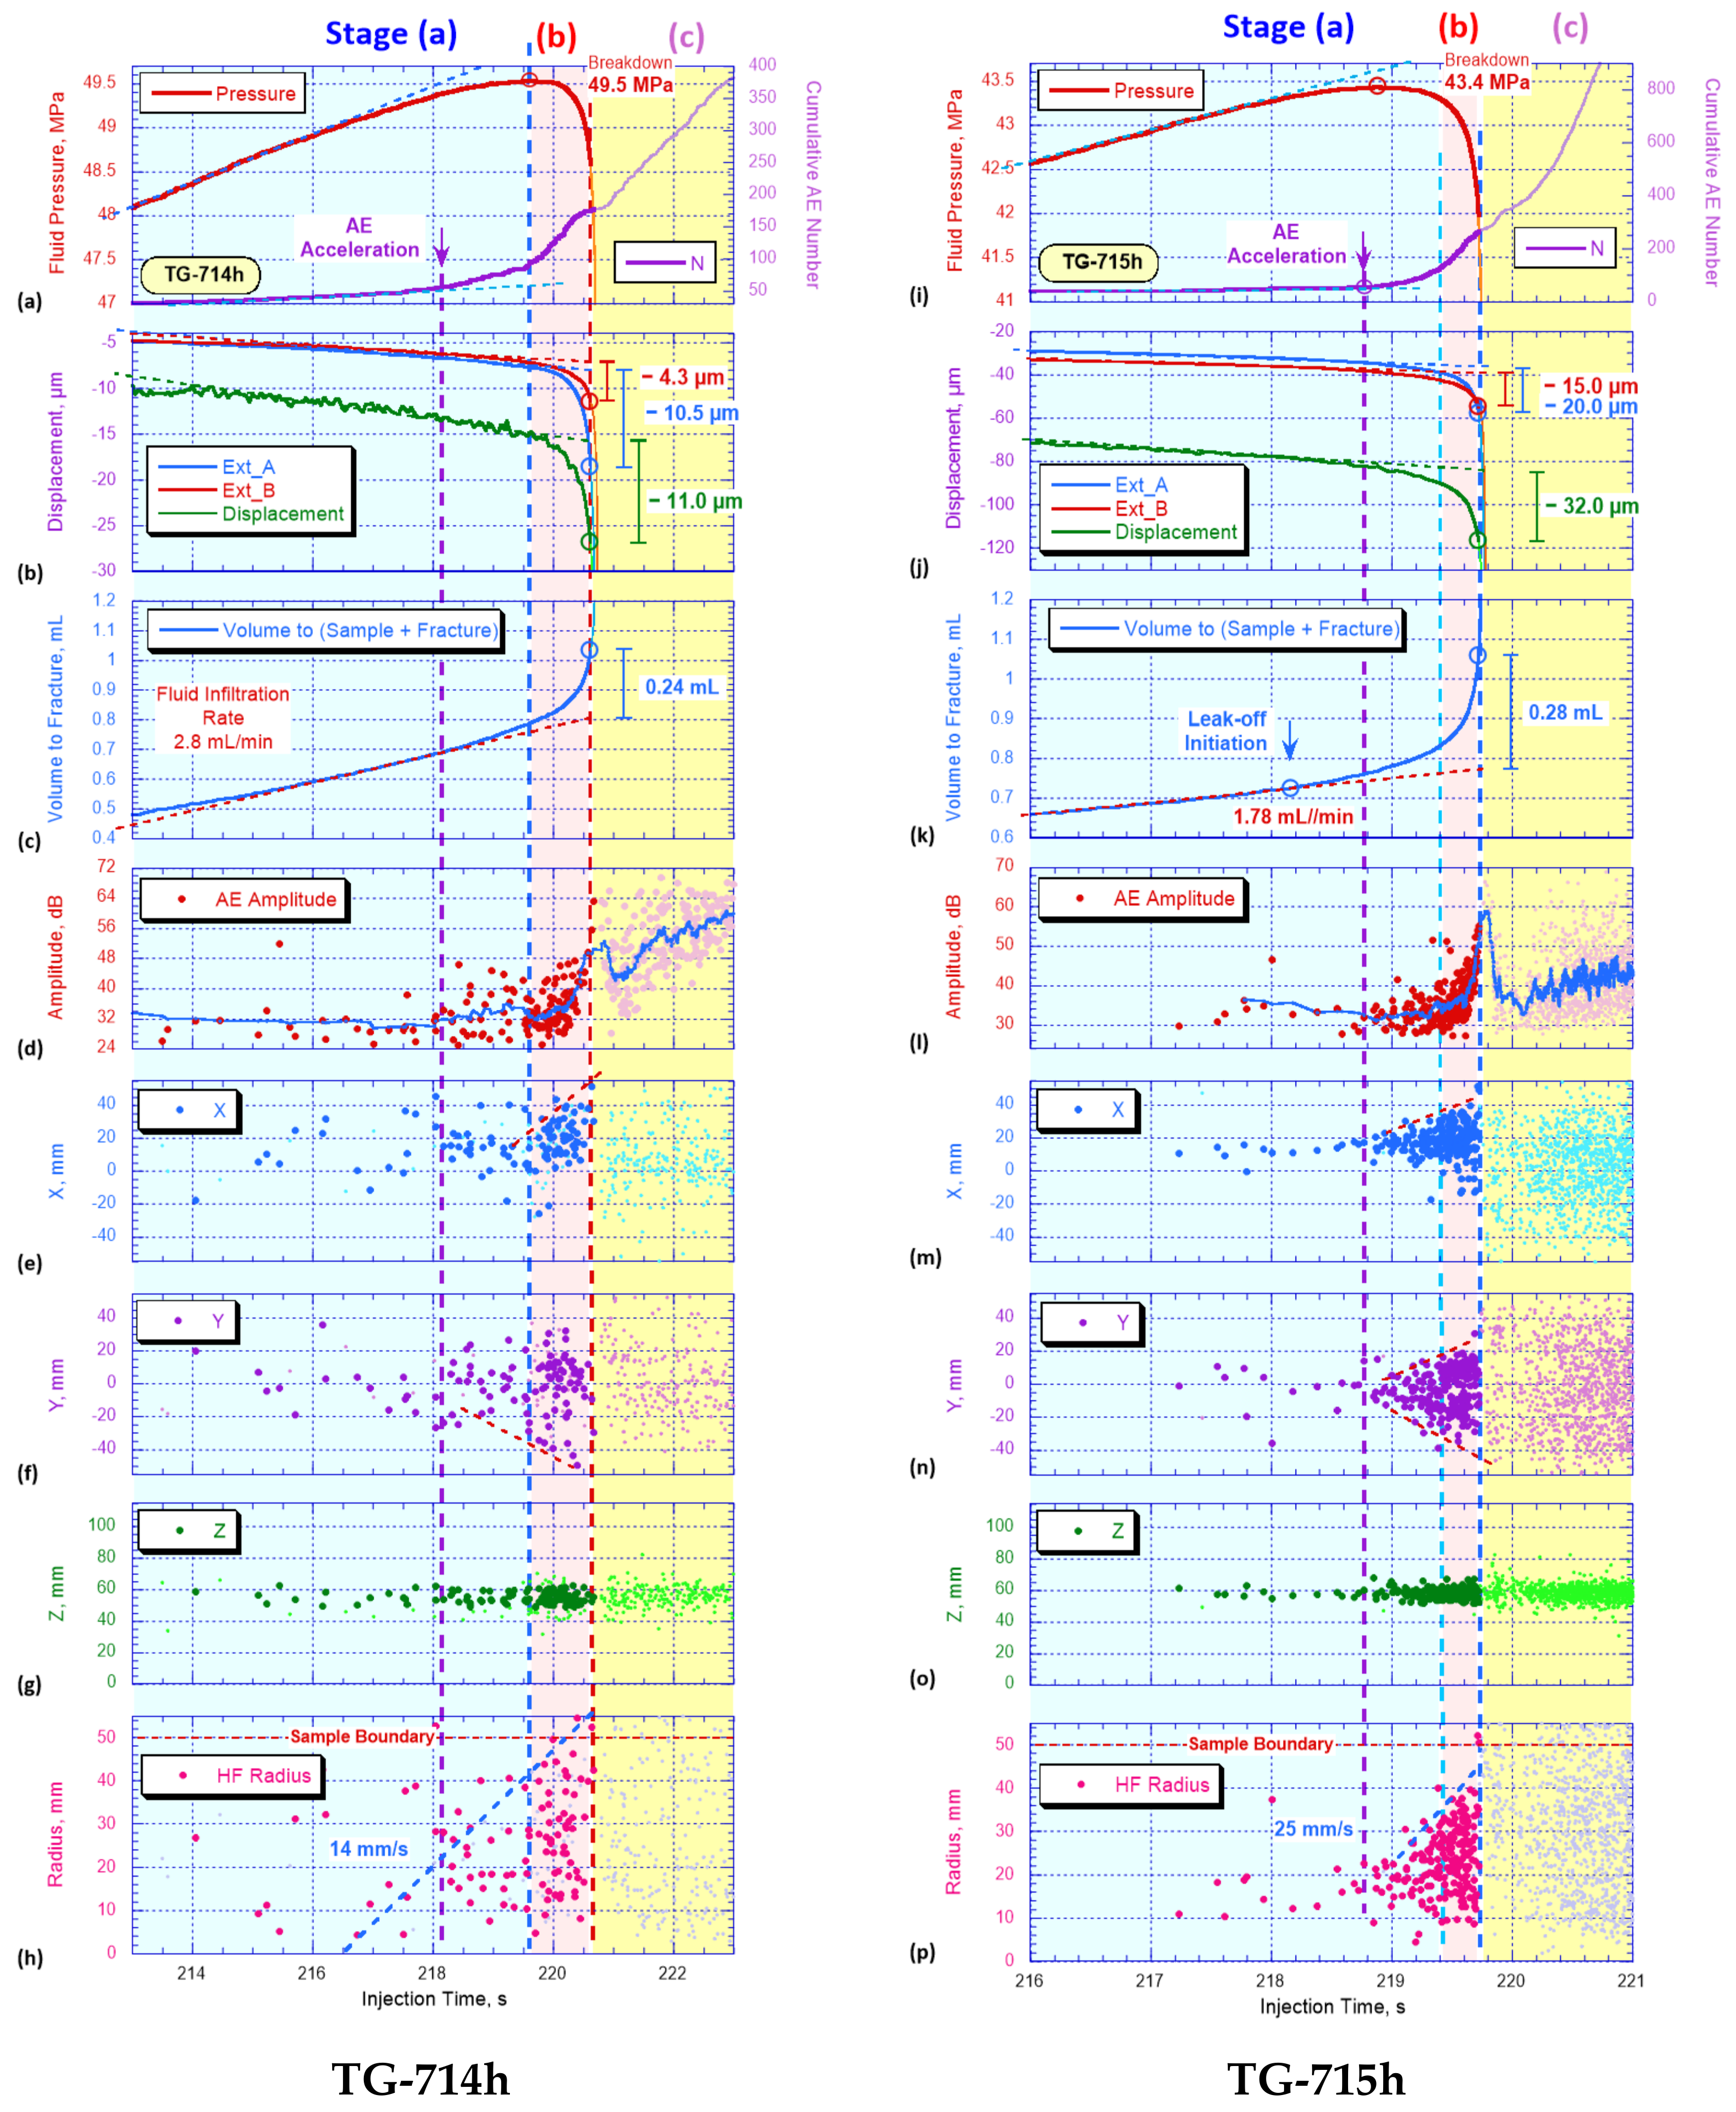
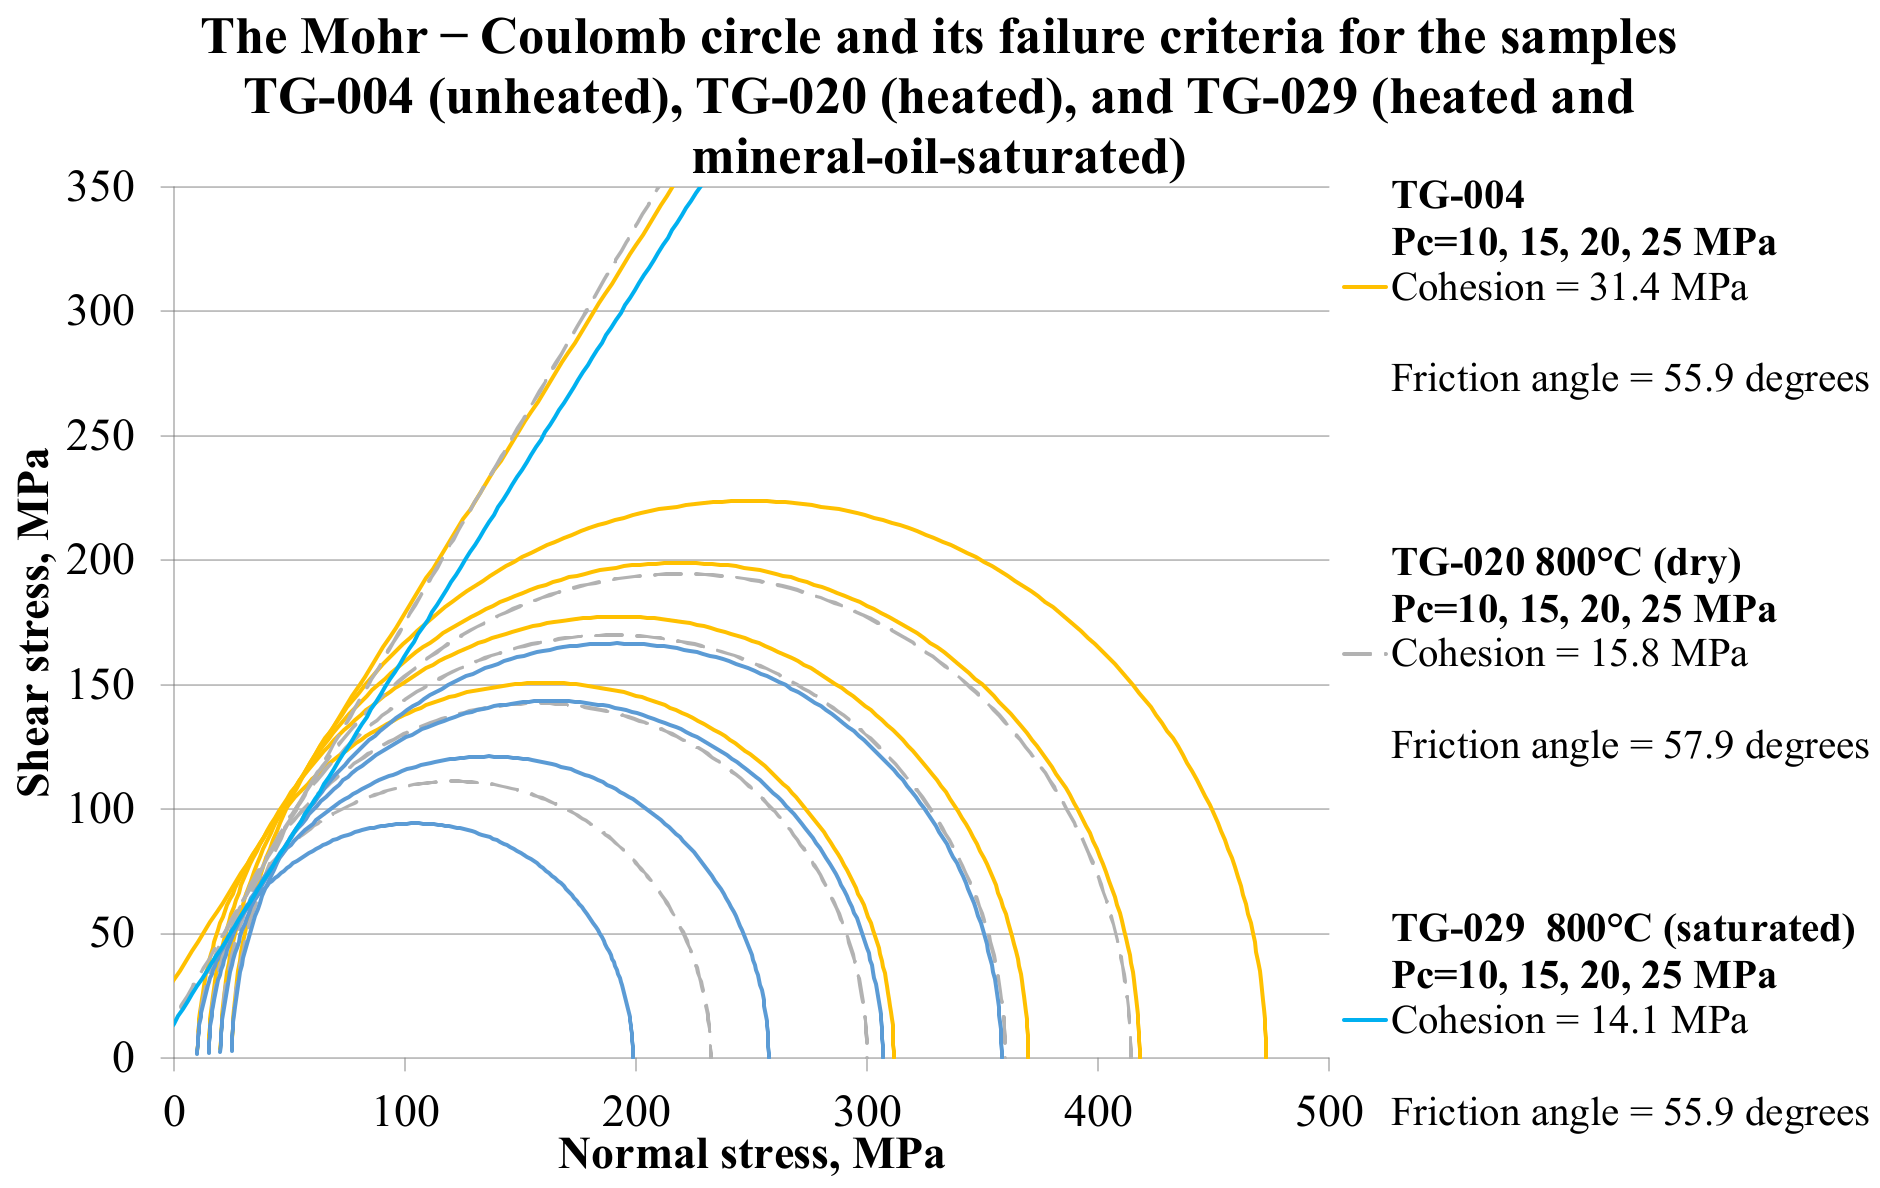
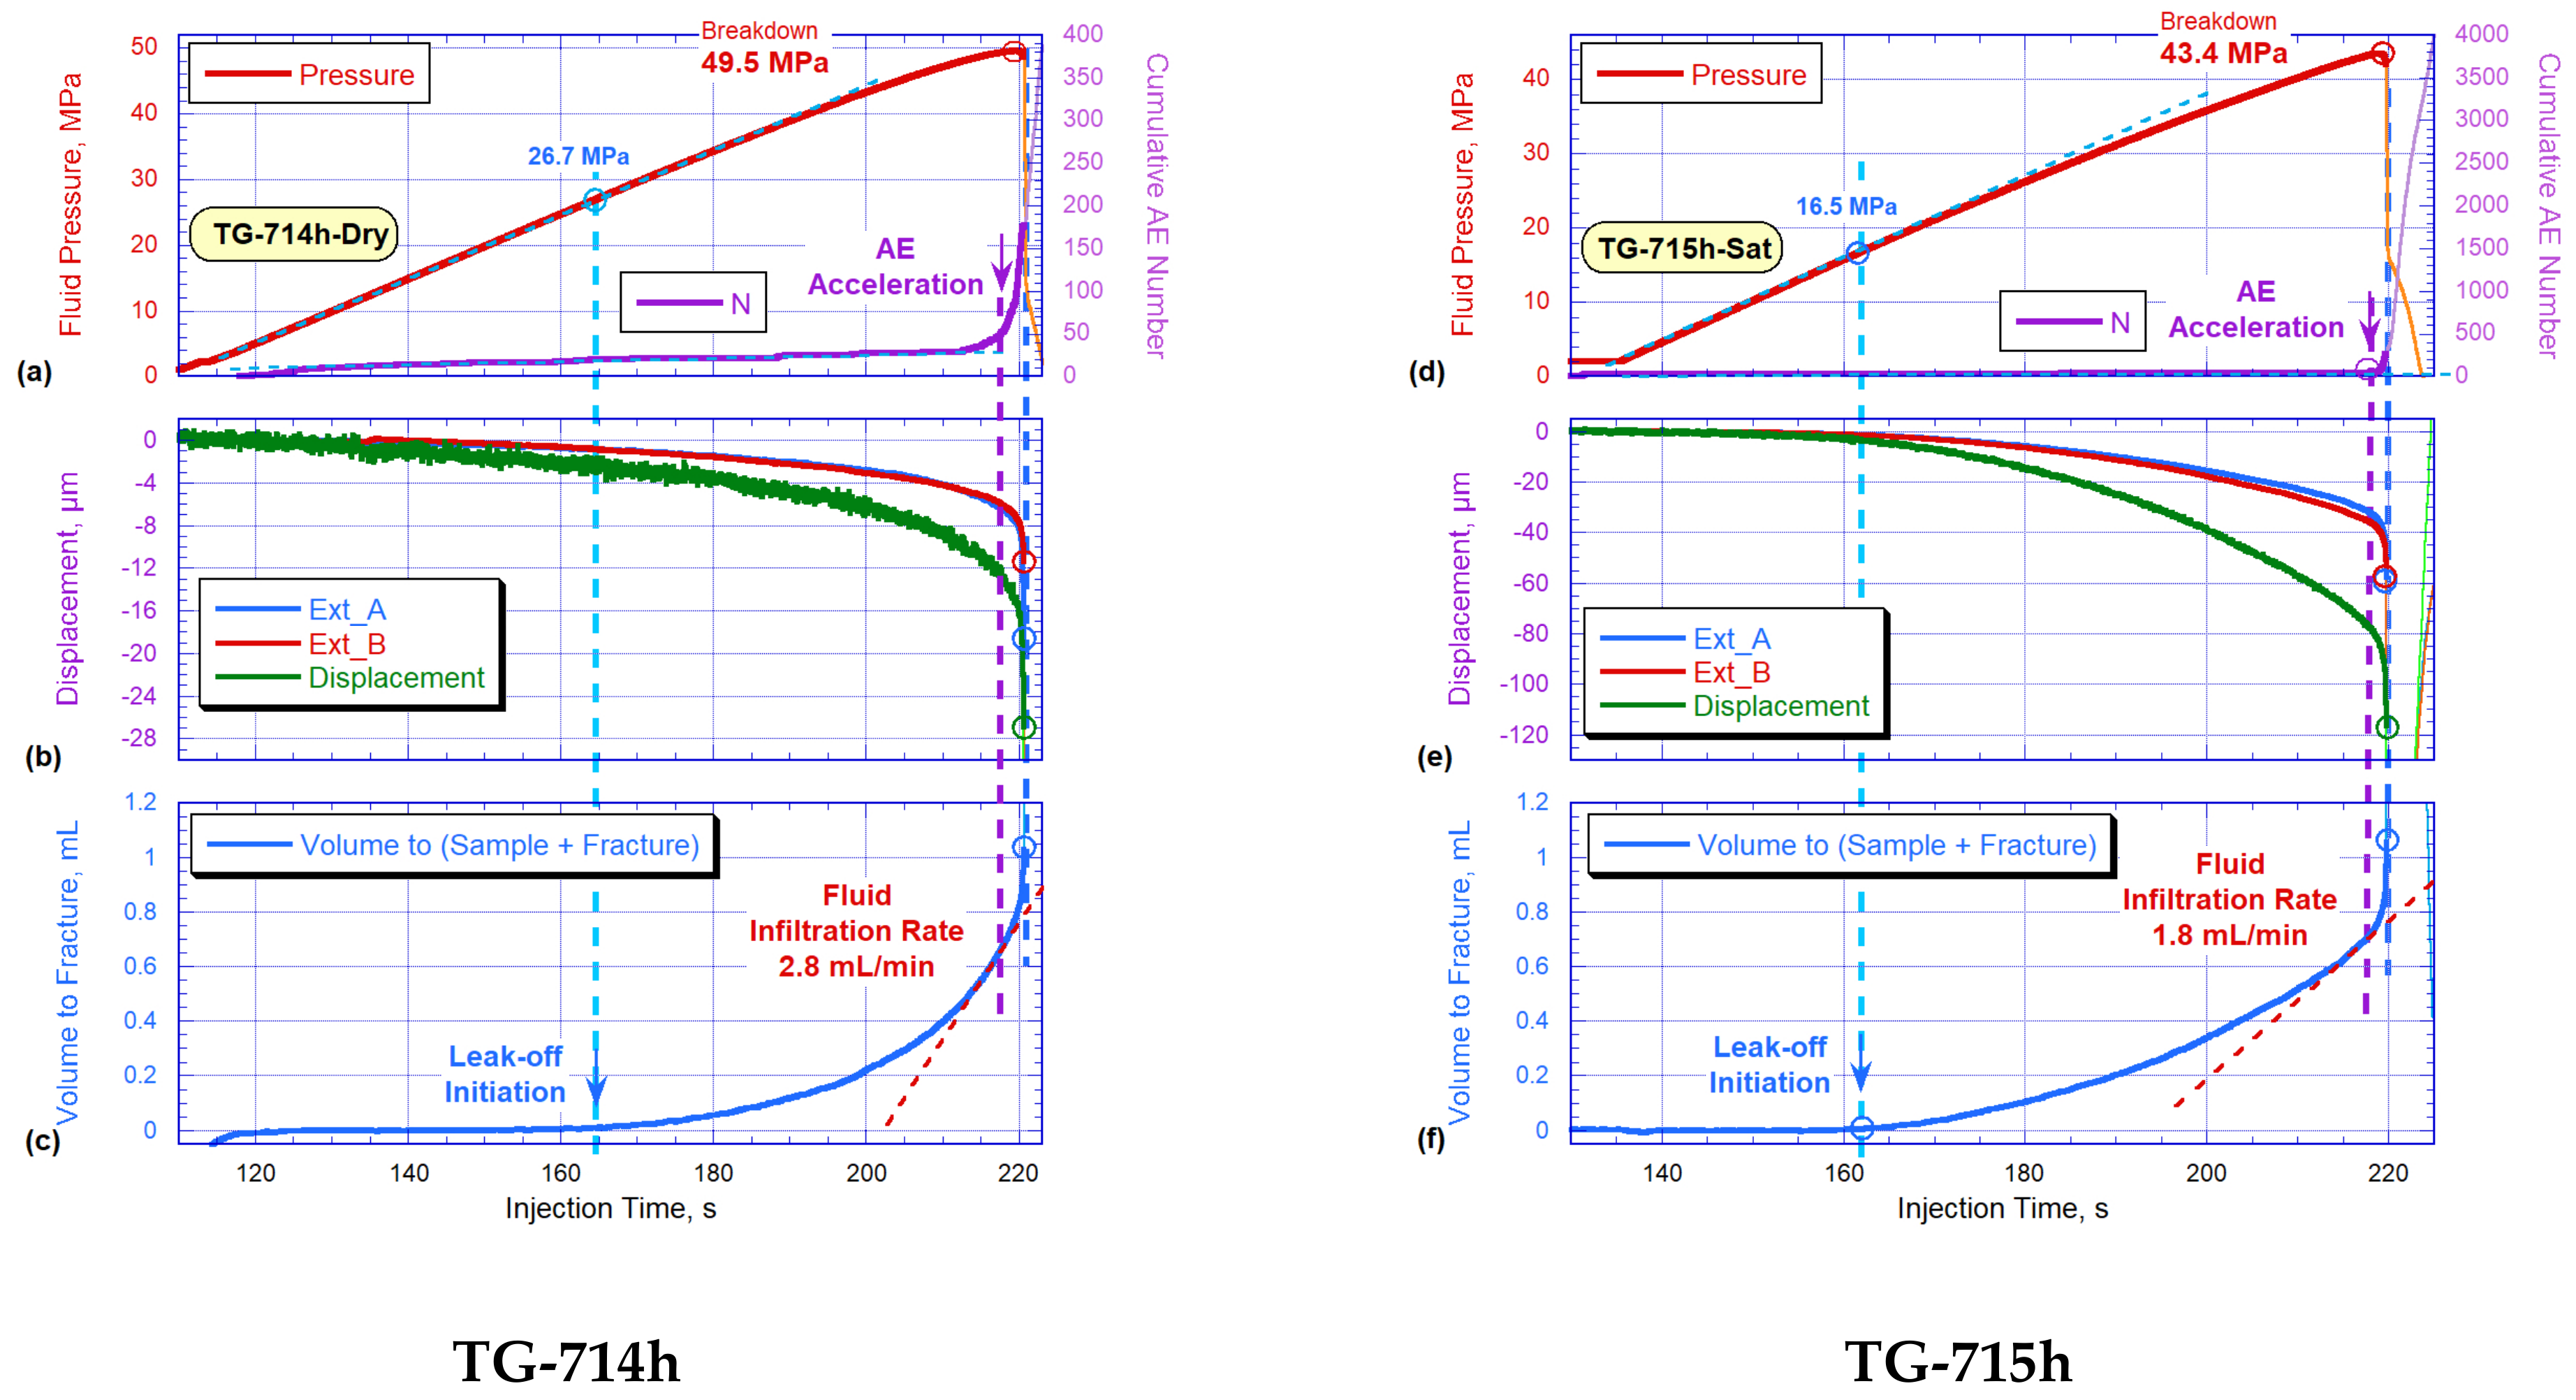
Let us turn to the study of the HF properties in thermally treated granites. Samples TG-714h and TG-715h were treated in the abovementioned heating procedure, up to 800 °C, in order to simulate highly fractured materials. The same viscous OG was injected in both tests, but sample TG-714h was tested dry and sample TG-715h was fully saturated with mineral oil prior to hydraulic fracturing. A comparison of the parameters recorded during hydraulic fracturing of dry TG-714h and saturated TG-715h samples is shown in
Figure 16. It was found that the saturated specimen, TG-715h, demonstrated a 13% lower BP (
Figure 16i, red curves) and an about 58% smaller HF aperture (
Figure 16j). These results correspond well to the results described above for the pair of dry and saturated sandstones.
It should be noted that a significant leak-off effect was detected during the OG injection into both thermally treated samples. The slopes of the red dashed lines in
Figure 16c,k indicate that the highest infiltration rate was about 2.8 mL/min for the dry sample TG-714h (
Figure 16c), and about 1.8 mL/min for the saturated sample TG-715h (
Figure 16k). Despite the significant leak-off rate difference, the volume of fluid injected into the fracture was almost the same: 0.24 mL (dry sample) and 0.28 mL (saturated sample). In addition, we found out that the fracture propagation rate in the dry sample (
Figure 16h) was almost two times slower than in the saturated sample (
Figure 16p). The obvious explanation is the influence of the fluid infiltration rate on the dynamics of hydraulic fracture propagation. The injection rate was equal to 5 mL/min in both samples. Taking into account that the fluid infiltration rates in the dry and saturated samples were 2.8 and 1.8 mL/min, respectively (
Figure 16c); it can be assumed that the fluid flows towards the tip of the hydraulic fracture in the dry and saturated samples were 2.2 and 3.2 mL/min, respectively. Most likely, this difference is the cause of the different registered rates of fracture propagation.
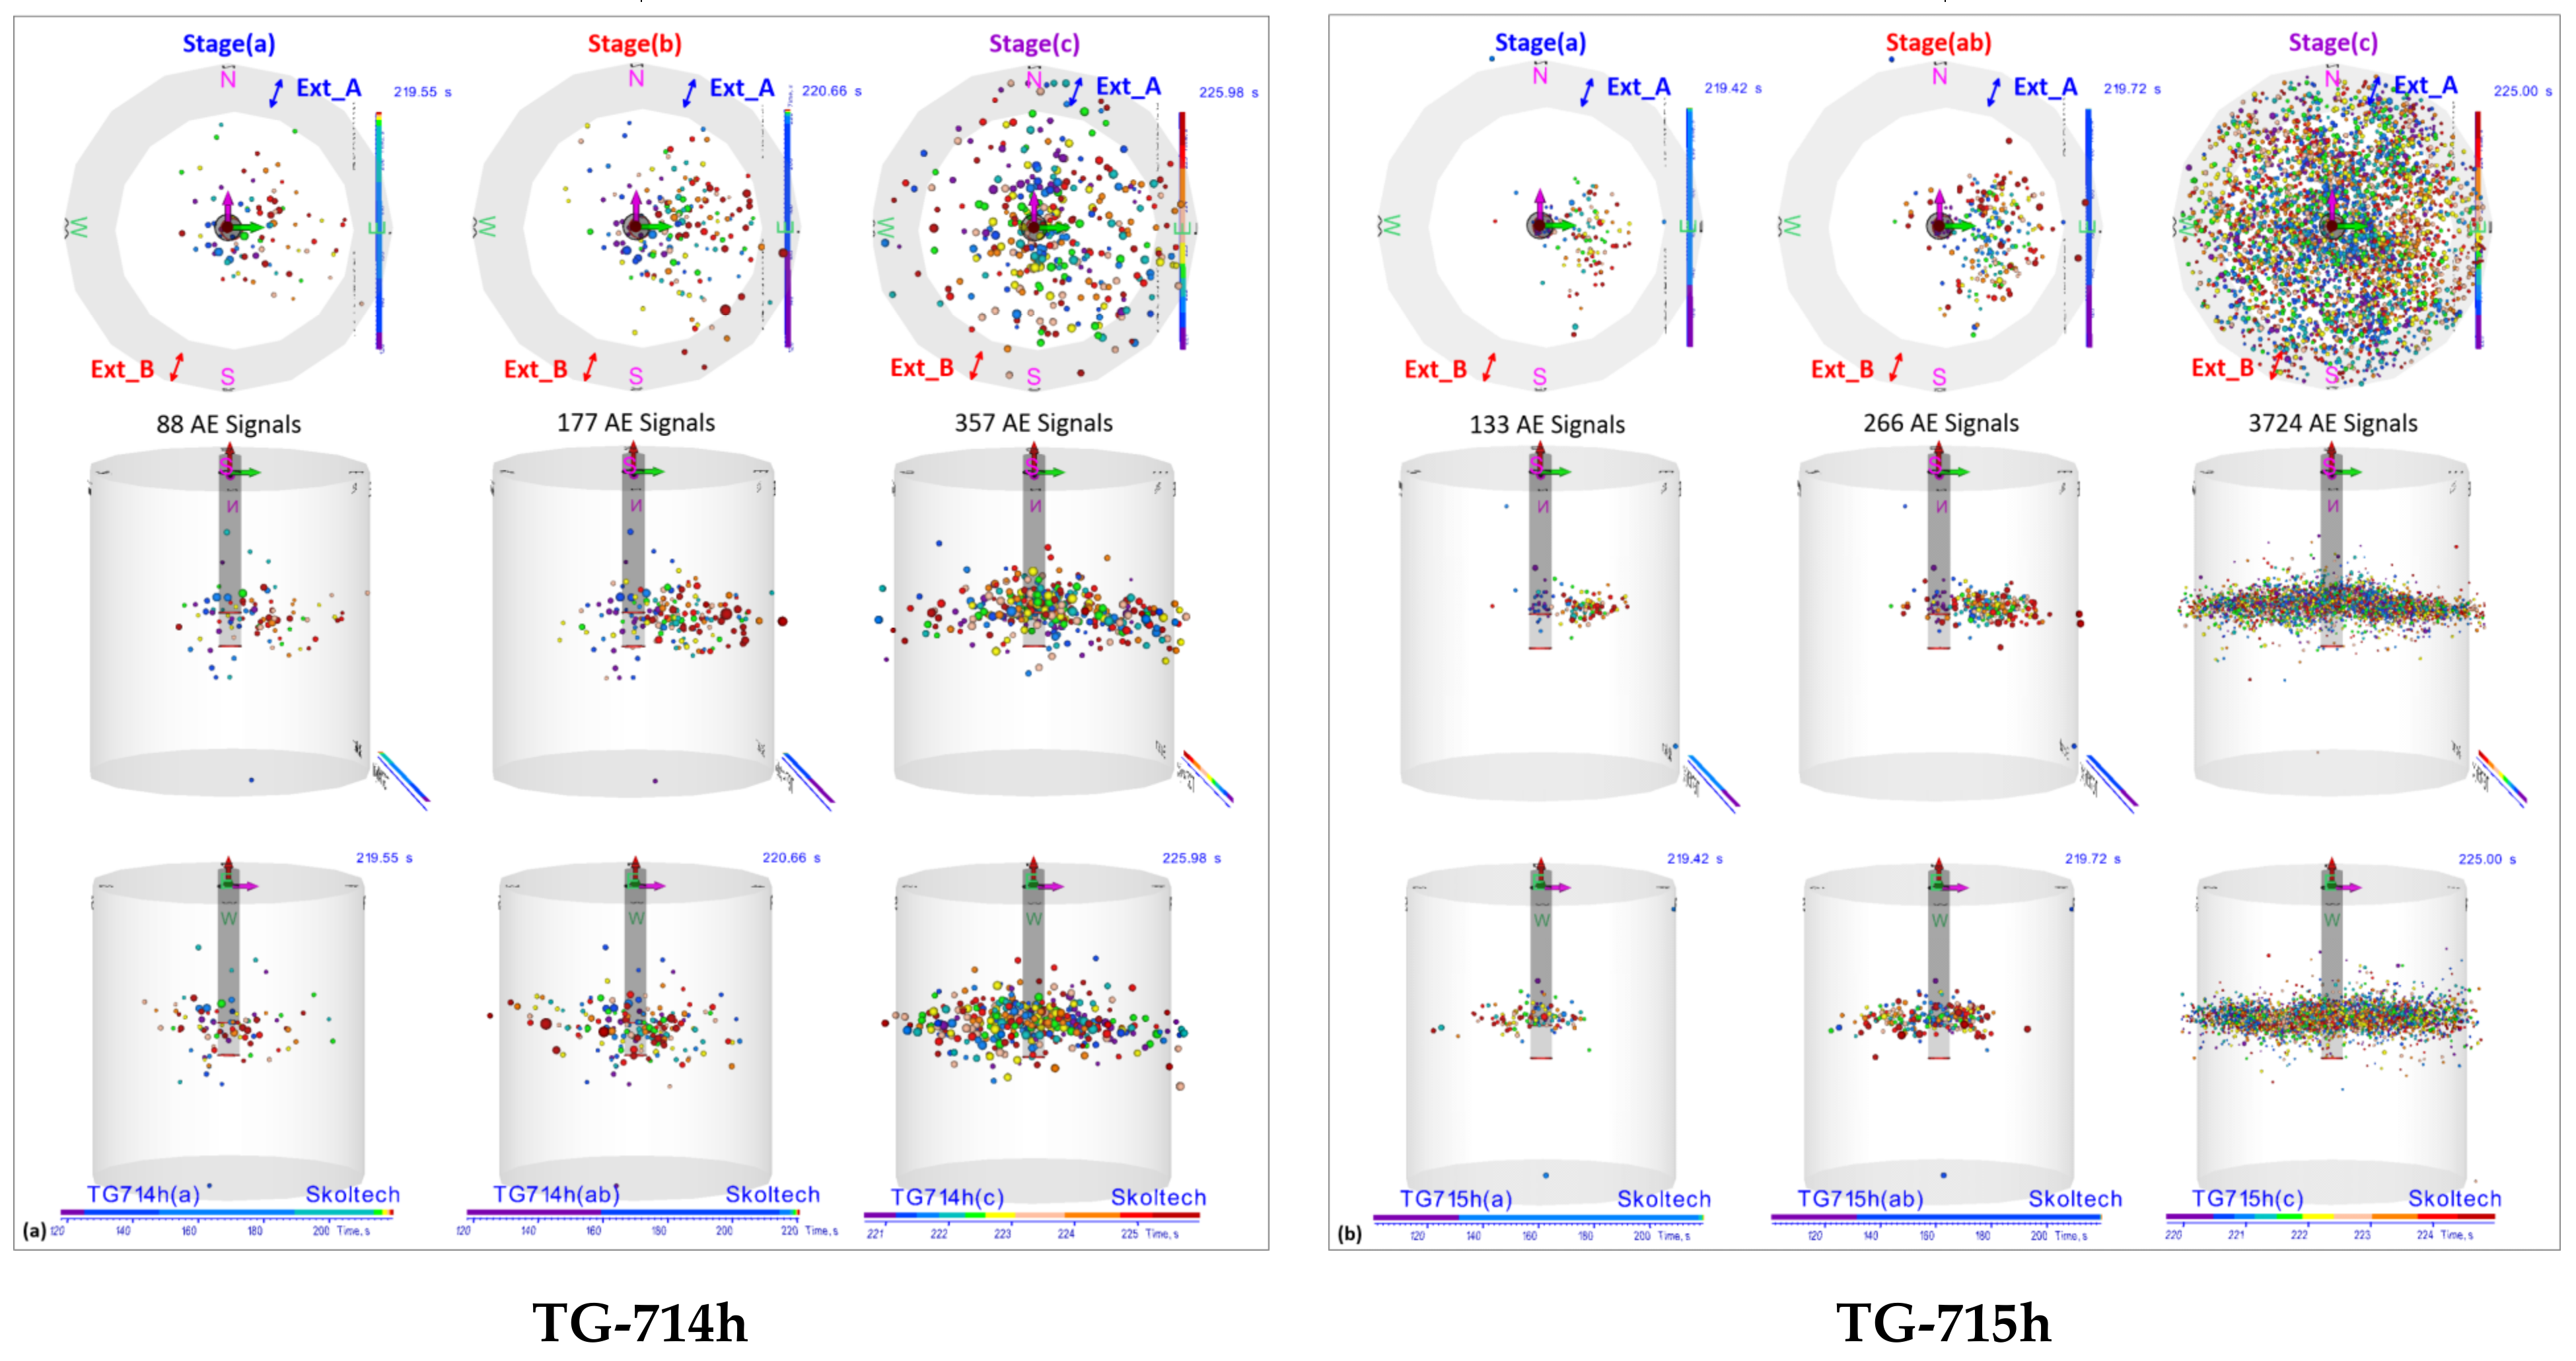
In addition, we found several differences in the spatial distribution of AE events in the dry and saturated samples, as shown in
Figure 17. In the saturated sample (TG-715h) the HF propagated within a small sector, mainly between the south-east and north-east directions (
Figure 17b). In the dry sample (
Figure 17a), AE events were distributed in a wider segment, mostly between the south-east and north directions. Furthermore, 3724 AE events were recorded in the saturated sample and only 357 signals were recorded in the dry sample, which corresponds to the number of AE events registered earlier in a pair of the dry and saturated sandstone specimens. For all studied granite samples, the AE event distributions coincide with the shapes of the observed fractures (
Figure 18).

 ,
, 


