Article

Study on the Quantitative Characterization and Heterogeneity of Pore Structure in Deep Ultra-High Pressure Tight Glutenite Reservoirs

1
University of Chinese Academy of Sciences, Beijing 100049, China
2
Institute of Porous Flow & Fluid Mechanics, Chinese Academy of Sciences, Langfang 065007, China
3
Research Institute of Petroleum Exploration & Development, PetroChina, Beijing 100083, China
4
State Key Laboratory of Enhanced Oil Recovery, Beijing 100083, China
5
Research Institute of CNOOC (China) Ltd., Shenzhen 518000, China
6
PetroChina Qinghai Oilfield Company, Dunhuang 817500, China
*
Authors to whom correspondence should be addressed.
Minerals 2023, 13(5), 601; https://doi.org/10.3390/min13050601
Submission received: 10 April 2023 / Revised: 24 April 2023 / Accepted: 25 April 2023 / Published: 26 April 2023
(This article belongs to the Section Mineral Exploration Methods and Applications)

Abstract

:
The precise characterization of a tight glutenite reservoir’s microscopic pore structure is essential for its efficient development. However, it is difficult to accurately evaluate using a single method, and its microscopic heterogeneity is not fully understood. In this study, a combination of X-ray diffraction, casting thin section observations, scanning electron microscopy, high-pressure mercury injection, constant-speed mercury injection, X-ray computed tomography, and the advanced mathematical algorithms in the AVIZO 8.0 visualization software was used to construct the three-dimensional digital core of a glutenite reservoir at the study site, and the parameters of the pore network model were extracted. The overall microscopic pore structure characteristics were quantitatively investigated from multiple scales. Based on this, the mineral quantitative evaluation system (QEMSCAN) examined the microscopic heterogeneity of the glutenite reservoir and its impact on seepage. The results show that the glutenite reservoir in the study block can be classified into three categories based on lithology and capillary pressure curve characteristics. The type I reservoir samples have large and wide pore throats, low threshold pressure, and high reservoir quality; type II reservoir samples are characterized by medium-sized pore throat, medium threshold pressure, and moderate reservoir quality; and the small and narrow pore throat, high threshold pressure, and poor reservoir quality are characteristics of type III reservoir samples. The various pore throat types and mineral distributions are due to the differences in dissolution, compaction, and cementation. The continuous sheet pores have good connectivity, which is related to the interconnection of primary intergranular pores and strip fractures, while the connectivity of isolated pores is significantly poor, which is related to the development of intragranular dissolved pores and intercrystalline pores. This suggests the deterioration of physical properties and pore throat connectivity, reduced average pore radius, and decreased pore sorting as decreasing permeability. The tight glutenite pores range in size from 5 nm to 80 μm and primarily feature Gaussian and bimodal distribution patterns, and submicron–micron pores contribute more to seepage. The effective pores were found to be attributed to the slowing effect of abnormally high pressure on the vertical stress, and the protective effect was positively correlated with the high-pressure strength. Notably, there is strong microscopic heterogeneity in the distribution of the reservoir matrix minerals and the pore throat size. As a result, the injected fluid easily flows along the preferential seepage channel with pore development and connectivity. This study provides new insights into the exploration and development of similar tight reservoirs.

Graphical Abstract

1. Introduction

The exploration and development of unconventional oil and gas are the keys to ensuring the security of China’s national energy strategy. Tight oil has attracted attention as an economic resource due to its significant reserve potential as a promising area in worldwide unconventional oil exploration and development. Currently, the production of tight oil in North America accounts for nearly 50%, reaching 4.67 × 10⁸ t [1,2,3]. The theoretically recoverable resources for China’s tight oil resources can reach (20–25) × 108 t. In China’s major oilfields, tight oil has emerged as a significant alternative resource for boosting reserves and production [4,5,6]. Glutenite reservoirs, a typical type of tight oil reservoir, have emerged as a significant new field in oil and gas exploration in recent years, and they are widely distributed in China’s Tarim Basin, Junggar Basin, and Bohai Bay Basin. The southern margin glutenite reservoir discovered under the guidance of the sag accumulation theory plays an important role [7,8]. Exploration and development of the tight oil in this reservoir are challenging due to the poor correlations between oil distribution, production, and complex reservoir pore structure. Understanding the pore structure of the glutenite is crucial for reservoir evaluation and successful exploration. However, due to the strong compaction and tectonic activity during a long geological history, the reservoirs in this area are characterized by a considerable number of nanoscale pores [6,9,10], an extremely wide pore size distribution [11], strong heterogeneity, and poor pore throat connectivity [12,13], all of which make it challenging to characterize the overall pore structure of these reservoirs [10,14]. Therefore, it is urgent to identify, classify, and characterize the pore structure parameters (geometric shape, size, distribution, and interconnection of pores and throats in rocks). This is extremely important for the analysis of reservoir capacity and seepage characteristics.
At present, the conventional methods for characterizing and analyzing the pore structure of tight reservoirs include high-pressure mercury injection (HPMI) [6,15,16,17], constant-speed mercury injection (CSMI), gas adsorption methods, casting thin sections (CTS), scanning electron microscopy (SEM) [18,19], and unconventional techniques such as X-ray computed tomography (X-CT), FIB electron microscopy, FE electron microscopy, and nuclear magnetic resonance (NMR) [20,21]. Each approach has its benefits and limitations. Due to the shielding effect and the potential for core fractures caused by high mercury injection pressure, HPMI may underestimate the size of big pores. The limitation of injection mercury pressure prevents CSMI from testing throats (<0.1 m), although it can discriminate pores and throats by detecting pressure changes [21,22,23]. The pore types and morphologies of cores can be directly observed with CTS and SEM, but fail to obtain quantitative pore data. CT and NMR are two typical nondestructive characterization techniques. CT can not only directly obtain 3D images, but also obtain quantitative pore throat structure parameters. The application of CT is limited by high expense and resolutions. NMR can be used to obtain the full-scale pore size distribution, but the conversion from time domain to size domain is dependent on the surface relaxation strength, which needs to be calculated by integrating the findings from HPMI and CSMI [24,25]. Therefore, some scholars have studied the pore structure of tight reservoirs based on various characterization methods. Wang et al. [26] demonstrated the feasibility of CT scanning technology in the digital characterization of glutenite by performing a visual quantitative characterization of coal pores and mineral content using micro-CT, NMR, and SEM. Li et al. [27] constructed a network topology model of fracture connection based on the topology method and characterized the core fracture network with micro-CT and HPMI. Bera and Golab [28,29] et al. used high-resolution CT and SEM to establish the 3D pore structure of coal rock and sandstone and analyzed the pore size distribution of the two types of cores with NMR. Lv et al. [30] used the mineral imaging method (QEMSCAN), SEM, and micro-CT to investigate the pore structure characteristics of sandstone and analyzed the pore pressure propagation mechanism. Overall, due to the complexity of pore-fracture distribution characteristics in tight glutenite reservoirs, the pore structure cannot be characterized by a single method mentioned above; only a combination of multiple methods can characterize the comprehensive pore structure of glutenite. Meanwhile, there is still a lack of a visual digital models that can accurately characterize the pore throat parameters of tight glutenite reservoirs. Moreover, porosity loss and model randomization will occur during threshold segmentation due to the influence of the CT scanning resolution and reconstruction approach, resulting in significant mistakes in the quantitative results of pore-fracture. Consequently, how to comprehensively characterize pores and throats of various scales to achieve full-scale characterization of pore size distribution needs to be solved urgently.
In addition, the heterogeneity of microscopic pore throats in glutenite reservoirs has a great influence on reservoir seepage. In other words, the study of microscopic heterogeneity is the key to analyzing the seepage characteristics of glutenite reservoir. In recent years, many scholars have studied the microscopic heterogeneity of glutenite reservoirs through geological models and laboratory experiments [31,32]. They believe that tight glutenite reservoirs have strong microscopic heterogeneity, which will affect oil seepage and production. Researchers have studied the microscopic heterogeneity of reservoirs using different experimental methods. It can be concluded that pore structure characteristics and diagenesis are important factors affecting reservoir heterogeneity. Different pore formation modes make the glutenite reservoir have diagenetic heterogeneity, and microfractures promote reservoir heterogeneity [28,30]. The diagenetic evolution process is controlled by the classification of glutenite and the composition of matrix minerals, which ultimately makes the microscopic pore throat, physical properties, and diagenesis of the reservoir significantly heterogeneous in its spatial distribution.
In this study, based on conventional characterization methods, a digital core pore-fracture network model of different types of tight glutenite reservoirs was established using high-resolution computed tomography (CT) and the AVIZO 8.0 visualization software. The pore and throat structure parameters at different scales were obtained, and the full-scale pore size distribution and the pore structure characteristics of the glutenite reservoir were investigated. The matrix mineral characteristics were calibrated via high-precision scanning electron microscopy, and QEMSCAN was further utilized to examine mineral distribution characteristics and microscopic heterogeneity. The novel aspect of this paper is that it characterizes the microscopic pore structure and the heterogeneity of deep ultra-high pressure glutenite reservoirs from different pore scales, which provides new insights and theoretical support for the exploration and development of tight oil.

2. Experimental Materials and Methods

2.1. Research Region Overview

The experimental cores were taken from the tight glutenite reservoirs of the Qingshuihe Formation in Sikeshu Sag, at the southern margin of the Junggar Basin. The Junggar Basin is a superimposed basin, and it was formed during the Late Carboniferous to Middle Permian in northwestern China. This basin covers an area of 13,533 km2. The Gaoquan area of Sikeshu Sag, located in the southern uplift zone of the Junggar Basin, is the main research target in this study [7,24]. The depth of the study area is close to 5900 m, the formation pressure is 133.17 MPa, the pressure coefficient is 2.2, and the daily crude oil production is 1223 m3, which means it is a typical deep ultra-high pressure tight reservoir. The data from oil and gas exploration and geological evolution show that the reservoir lithology in this area is mainly glutenite, and the conglomerate and glutenite of fluvial facies are widely distributed in the southern margin area. Among them, an industrial oil and gas flow with a daily output of thousands of cubic meters has been obtained in Well Gaotan 1, indicating that this area has great oil production potential. The reservoir is characterized by a high starting pressure gradient, poor physical properties, low particle sorting, locally developed microfractures, small pore throats, and poor pore throat connectivity. In the production and development of oil fields, there are three issues: rapid production decline, difficult energy supplement, and short stable production time. In general, the use of elastic energy development is not promising.

2.2. Rock Samples and Fluids

First, 46 tight glutenite samples from this area were selected to carry out porosity and permeability tests. The depths of the core samples were 5827–6013 m. The diameter of the samples was ~3.80 cm, the lengths were 4.0–5.0 cm, and they were collected parallel to each other in the longitudinal direction. The porosity was measured using a porosimeter (PORG-200), the permeability was measured using the helium method, and the reference standard was GB/T 29172-2012. Next, eight representative samples were selected to carry out X-ray CT (X-CT) nondestructive scanning experiments and X-ray diffraction (XRD) composition analysis experiments. Meanwhile, a comparative study of digital core visualization of pore throat connectivity was conducted by selecting a shale sample with similar porosity. The mineral components of the eight glutenite samples were mainly quartz, plagioclase, and K-Feldspar, and their clay mineral contents were 0.09%–1.71%. The mineral components of the shale samples were dominated by feldspar and quartz, which were 22.74% and 51.89%, respectively. The clay content was relatively high, and the proportion reached 7.72%. The glutenite samples were divided into three types according to their lithologies and grain size. Type I (C1, C2) was dominated by the gritstone, type II (X1, X2, X3, X4) was dominated by fine conglomerate, while type III (Z1, Z2) was dominated by medium conglomerate. The physical parameters and image of the core samples are presented in Table 1 and Figure 1.

2.3. Experimental Apparatus

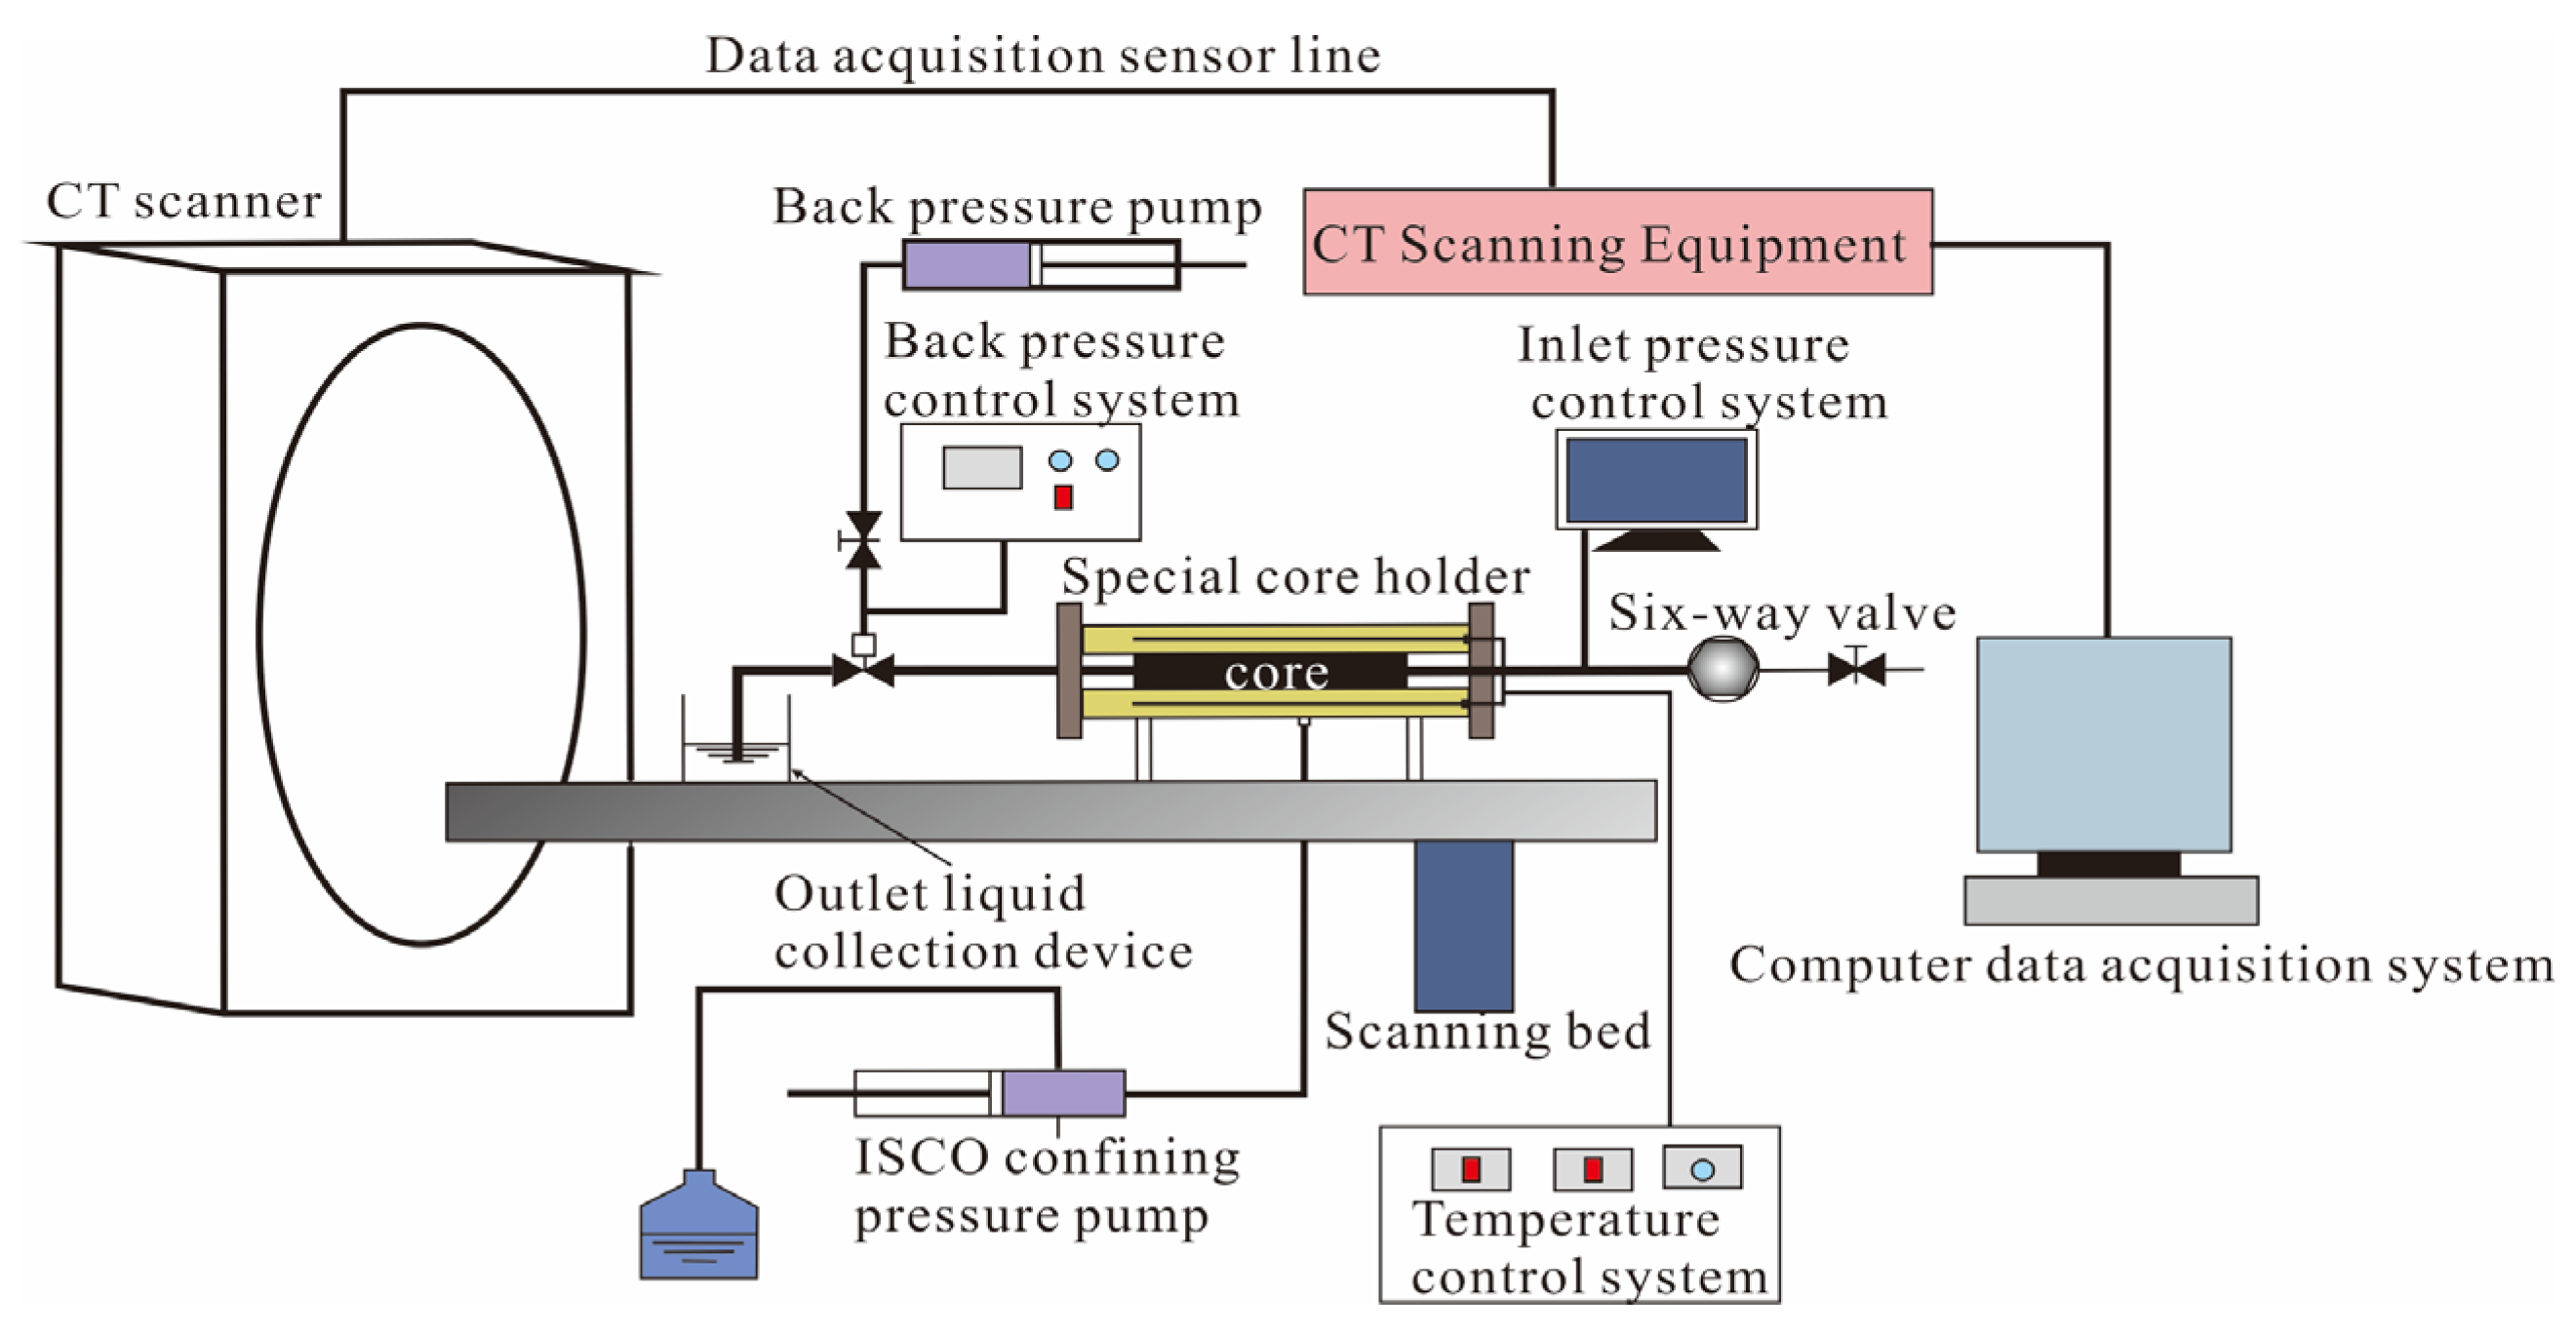
The X-CT scanning experiment was carried out using a self-developed core online CT scanning system (Figure 2). The X-CT device was the Xradia-200 Micro-CT at the Core Laboratories of the EOR (enhanced oil recovery) Department of the Institute of Petroleum Exploration and Development of China. The scanning voltage was 120 keV, the current was 130 μA, and the spatial resolution was 0.5–35 μm. The CT image analysis software (CCTAS 2.0) was used for the data processing. In addition, a special core holder with a shell made of polyether ether ketone (PEEK) material was used to hold the core in position, and the X-rays could penetrate the core and reduce the scanning error caused by the ray hardening effect. Additionally, the apparatus used for the QEMSCAN test was the QEMSCAN ® 650F.

2.4. Experimental Procedure

Each sample was cut into four parts with lengths of ~1.0, ~0.5 ~1.0, ~0.5, ~0.5, and ~1.0 cm, respectively. The first part (~1.0 cm long) was tested first using X-CT; then, the high-pressure mercury injection (HPMI) experiment was conducted. The second part, with a length of ~0.5 cm, was prepared for the CSMI. The three parts with lengths of ~1.0 cm, ~0.5 cm, and ~0.5 cm were prepared for the casting thin section (CTS) observations, XRD experiments, and QEMSCAN tests, respectively. The surface of the last sample (~1.0 thick and 1.0 cm wide) was polished and coated in gold for SEM secondary imaging.
The experimental steps of the digital core reconstruction via CT scanning were as follows.
(1)
The HPMI experiments were carried out, and the pore throat scale distribution obtained was used as a reference for the digital modeling of the core.
(2)
The plunger sample was scanned using a micro-CT with a spatial resolution of 3.5 μm/pixel, and a two-dimensional section map was obtained to analyze the homogeneity of the core sample. In addition, a small core (2 mm in diameter) was drilled from the plunger sample, and a micro-CT fine scan was carried out at a resolution of 2 μm/pixel.
(3)
The ImageJ and AVIZO 8.0 visualization softwares were used to carry out region selection, noise reduction, threshold segmentation, and post-processing of the grayscale images. The pores and framework were separated, the binarized three-dimensional (3D) digital core model was reconstructed, and the pore throat connectivity was analyzed using an image labeling algorithm.
(4)
The maximum sphere algorithm was used to extract the pore network model of the core, and the parameters such as the pore radius, throat length, and shape factor were calculated.

3. Experimental Results and Discussion

3.1. Petrophysical Properties and Pore Types

3.1.1. Pore Permeability Intersection Characteristics

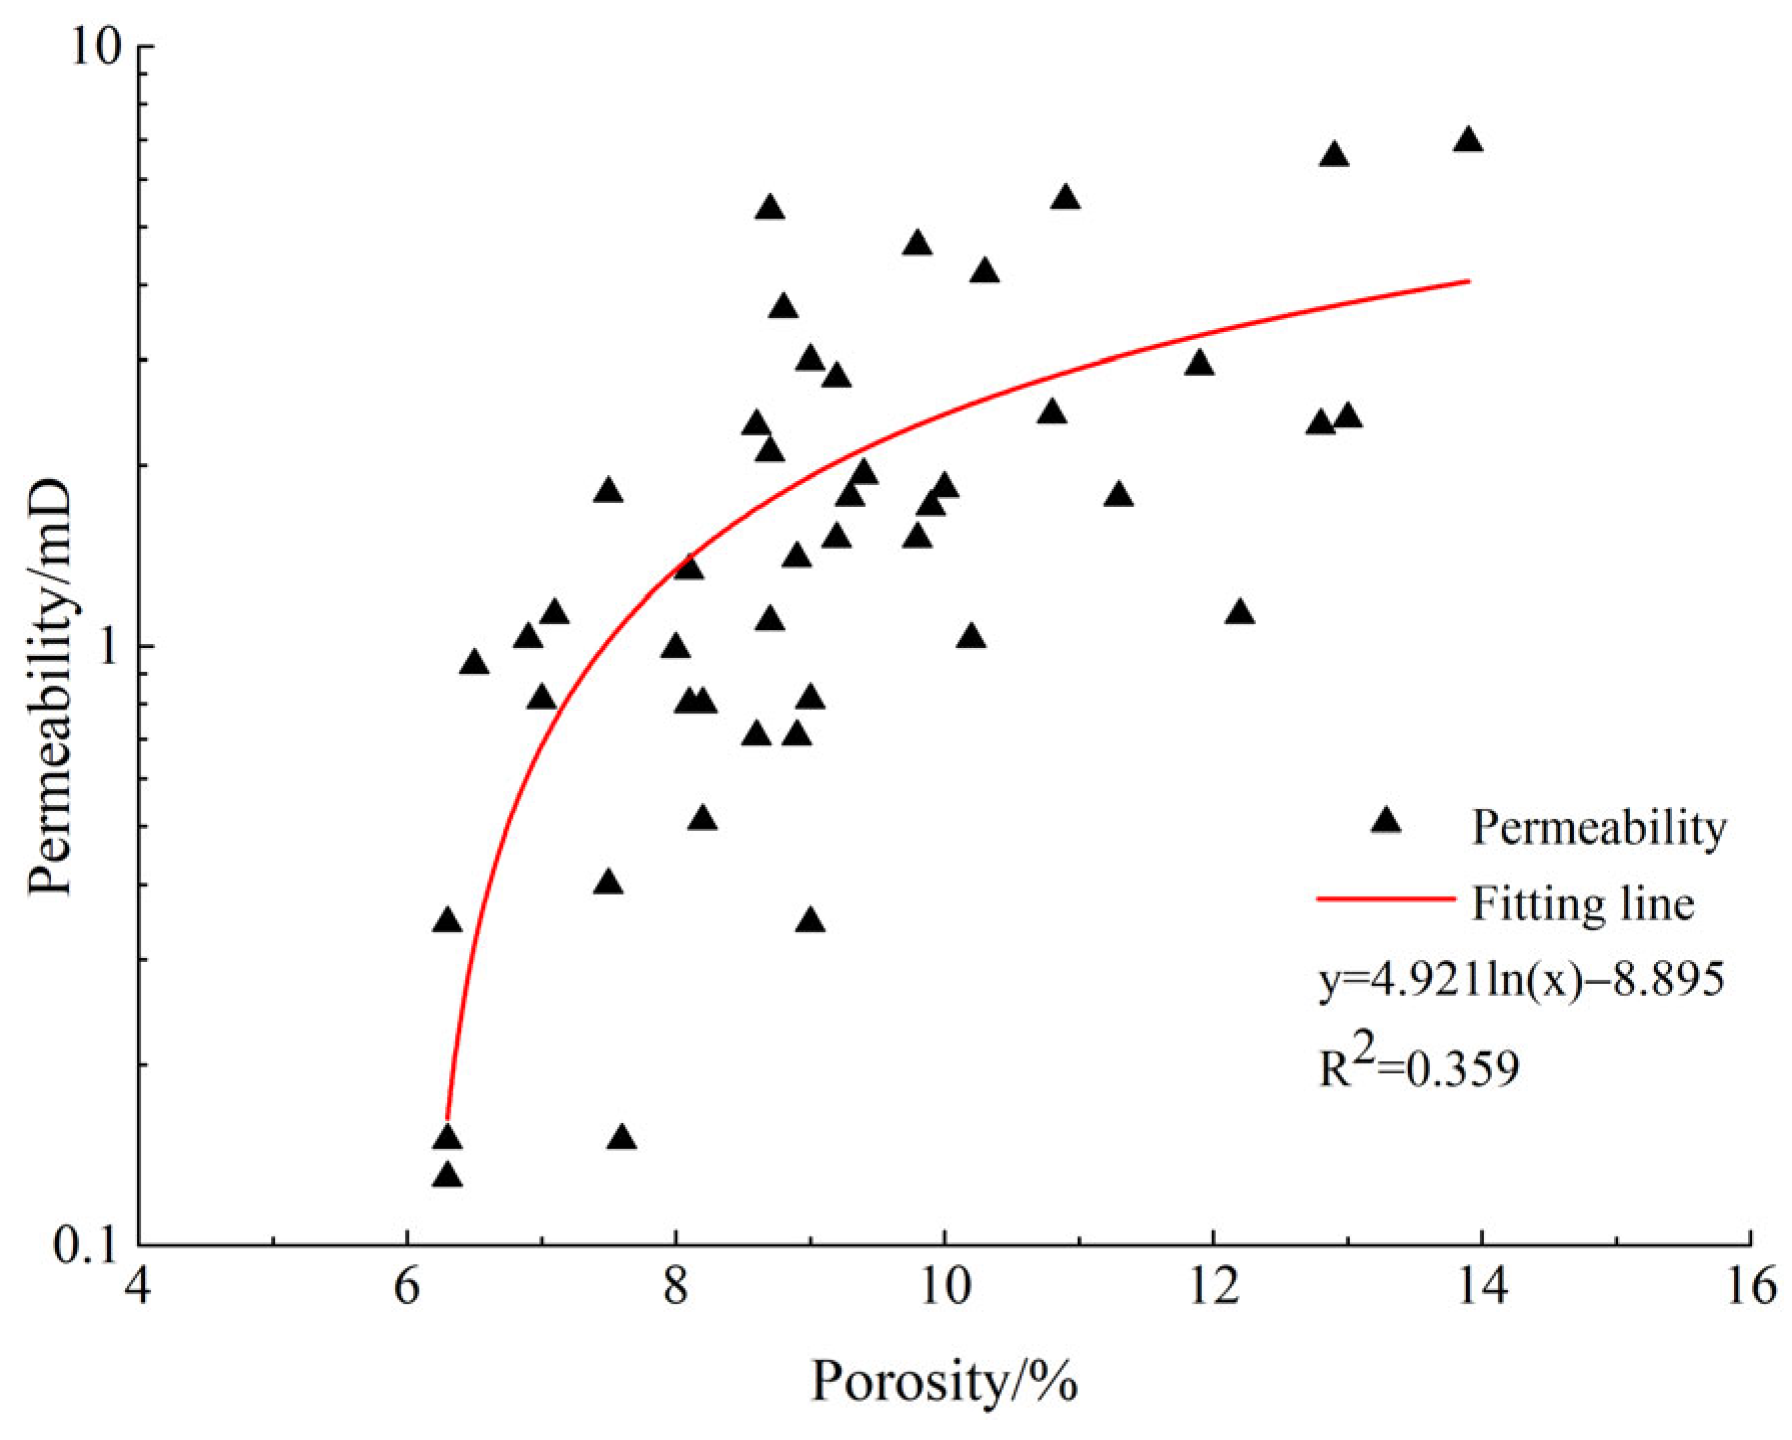
The porosity and permeability test results of the samples in the study area are shown in Figure 3. The samples were characteristic of poor reservoir quality, with the porosity and permeability of the samples being 6.3%–13.9% (avg. of 9.37%) and 0.131–6.930 mD (avg. of 1.97 mD), respectively, which belongs to the typical low porosity–low permeability-type tight reservoir. The correlation between porosity and permeability is weak, there is no obvious linear relationship between them, and the R2 is only 0.359. Samples with similar porosity exhibit different permeability; this may be attributed to differences in the microscopic pore structure. On the other hand, some samples developed microfractures with permeabilities up to 38.614 mD, indicating that fractures can improve reservoir permeability, but fractures have little effect on sample porosity. Moreover, due to the action of lithofacies and weathering leaching, the pore throat assemblages in this area are diverse, and the permeability variation coefficient is above 0.5, indicating that the reservoir heterogeneity is strong.
These findings imply that the tight glutenite samples have dual media properties, that is, the pores with primary particles such as gravel in the skeleton are filled with secondary sand-grade particles, and the interstitial spaces between the sand-grade particles are filled with clay-grade particles such as silt and mud, and thus, complex and varied pore-fracture spaces are created through various levels of particle contact. Therefore, it can be deduced that, due to the large differences in the micropore and fracture structures of the tight reservoirs, the connection between them is complicated. As a consequence, the porosity–permeability intersection map will display the characteristics of weak regularity and a scattered distribution, which needs further discussion.

3.1.2. Classification of Pore Types

The pore types, morphology, and mineral distribution characteristics were identified from CTS and SEM observations. In general, the glutenite in this area is mainly lithic sandstone. For the type I gritstone samples, the gravel was mainly composed of clay rock and cryptocrystalline rock, and the sandy was mainly composed of coarse sand-grade quartz and rock debris (Figure 4a–c and Figure 5a,d). The interstitial materials were heterogeneous, but were mainly composed of argillaceous and clay minerals such as kaolinite and hydrated mica, and the cementation was due to calcareous calcite cementation. The gravel particle size range was large, mainly distributed in the range of 2.7–8 mm. Medium-coarse-grained sand was filled between gravels, with a particle size distribution of 0.5–1.6 mm, and mainly composed of coarse-grained quartz and rock cuttings. The particle sorting was moderate. Filamentous illite adhered to the surface of debris particles, and the rounding was mainly subangular surround. For the type II fine conglomerate samples, the gravel was mainly composed of fine-grained rock, mudstone debris, and igneous rock, and the composition types were various (Figure 4d–f and Figure 5b,e). The gravel particle size was mainly distributed in the range of 2–5 mm. The sandy composition was mainly quartz, and the sandy particle size was mainly distributed in the range of 0.21–1.66 mm, mainly in the fine–medium sand grade. The particle sorting was poor. The overall structure of the core sample was loose, and there was point contact between the debris particles. The montmorillonite and illite were filled in intergranular pores, and the interstitial material was mainly altered volcanic ash. For the type III medium conglomerate samples, the gravel was mainly composed of volcanic rock, tuff rock, and cryptocrystalline rock. The interstitial material was mainly composed of clay, that is, the clay debris was transformed into a matrix after crushing and filling between the particles (Figure 4g–i, and Figure 5c,f). Its composition was mainly illite, chlorite, and some kaolinite. In addition, it can be seen that the leaf-like chlorite aggregates were attached to the surface of the debris particles in a thin film structure, filled between the debris particles, with obvious double crystals and deep alteration. The gravel particle size was mainly distributed in the range of 3–20 mm. The sandy composition was mainly quartz and debris, and quartz secondary enlargements; the sandy particle size was mainly distributed in the range of 0.6–1.5 mm. Intergranular dissolved pores were mainly developed, and gravel fractures were developed between larger gravels with a diameter of about 18.92 μm.
The CTS and SEM results suggest that the authigenic clay minerals are dominated by illite, followed by chlorite and kaolinite. The illite occurs in the intergranular pores and has a booklet-like shape, while the chlorite and kaolinite are mainly distributed in the core matrix in the form of particles (Figure 5f). Furthermore, the physical properties of coarse sandstone were the best, followed by the fine conglomerate, and medium conglomerate was the worst.
In addition, reservoir pores can be divided into three categories: primary pores, secondary pores, and microfractures. (1) The primary pores are mainly intergranular pores and intercrystalline pores (Figure 5a,d). The primary pores are the most ideal reservoir space and seepage channel; the pore particle contour is clear and presents a regular multilateral shape and good connectivity, which account for a small proportion and contribute relatively little to the reservoir porosity. The primary pores mainly appear in the fine conglomerate, while the proportion in medium conglomerate and coarse sandstone is relatively small. This indicates that most of the primary pores have been lost after the reservoir has undergone strong compaction of deep ultra-high pressure, and only a small number of primary pores can be preserved under abnormal high-pressure conditions. (2) The secondary pores are mainly dissolution intergranular pores, dissolution intragranular pores, feldspar dissolution pores, and matrix dissolution pores (Figure 5b,c,e), which account for a large proportion and contribute greatly to reservoir porosity. The shape of dissolved pores is irregular and the pore size varies greatly, but the seepage capacity is strong. In particular, the solubility of CO2 increases under deep ultra-high pressure conditions, and the migration of CO2 contributes to the formation of secondary pores. Therefore, dissolution pores play a key role in changing reservoir properties. (3) The microfractures are relatively well developed in this area (Figure 4h,i and Figure 5e). The primary fractures are mainly structural fractures and inter-grain fractures, which developed along the edge of the gravel. The secondary fractures are mainly dissolution fractures, which can be observed in the highly tectonic and dissolution areas. It is mainly developed in the middle conglomerate, and the edges are mostly slightly soluble particles arranged in teeth. Notably, the fractures in this area are very sensitive to the change of pressure. The increase in pressure can easily result in the closure of the fracture, and it is difficult for it to open again, thus affecting the flow capacity of the fluid in the reservoir. Correspondingly, the total surface porosity of the glutenite reservoirs in this area is about 8%, and the microfractures provide effective channels for oil and gas seepage between the reservoirs.
The analysis shows that under the diagenesis and tectonic action of deep ultra-high pressure, the throats in the reservoir further shrink to form a sheet or point throat, and the throat radius becomes smaller, which makes the contact mode between particles change from line contact to point contact. Meanwhile, the complex mineral composition and structural characteristics of the reservoirs in this area result in various pore types. Due to the differences in the debris transport mechanism and sedimentary differentiation between the different sedimentary microfacies, there are also significant differences in the argillaceous matrix and rock grain size of the different microfacies of the glutenite reservoirs. In addition, under the influence of dissolution, compaction, and cementation, the reservoirs have developed a low porosity, low permeability, and strongly heterogeneous pore structure, which in turn affect the reservoir performance. Although CTS and SEM can be used to determine the pore types and estimate their sizes, they fail to yield accurate quantitative pore throat structure parameters.

3.2. Pore Structure Characterization Based on HPMI and CSMI

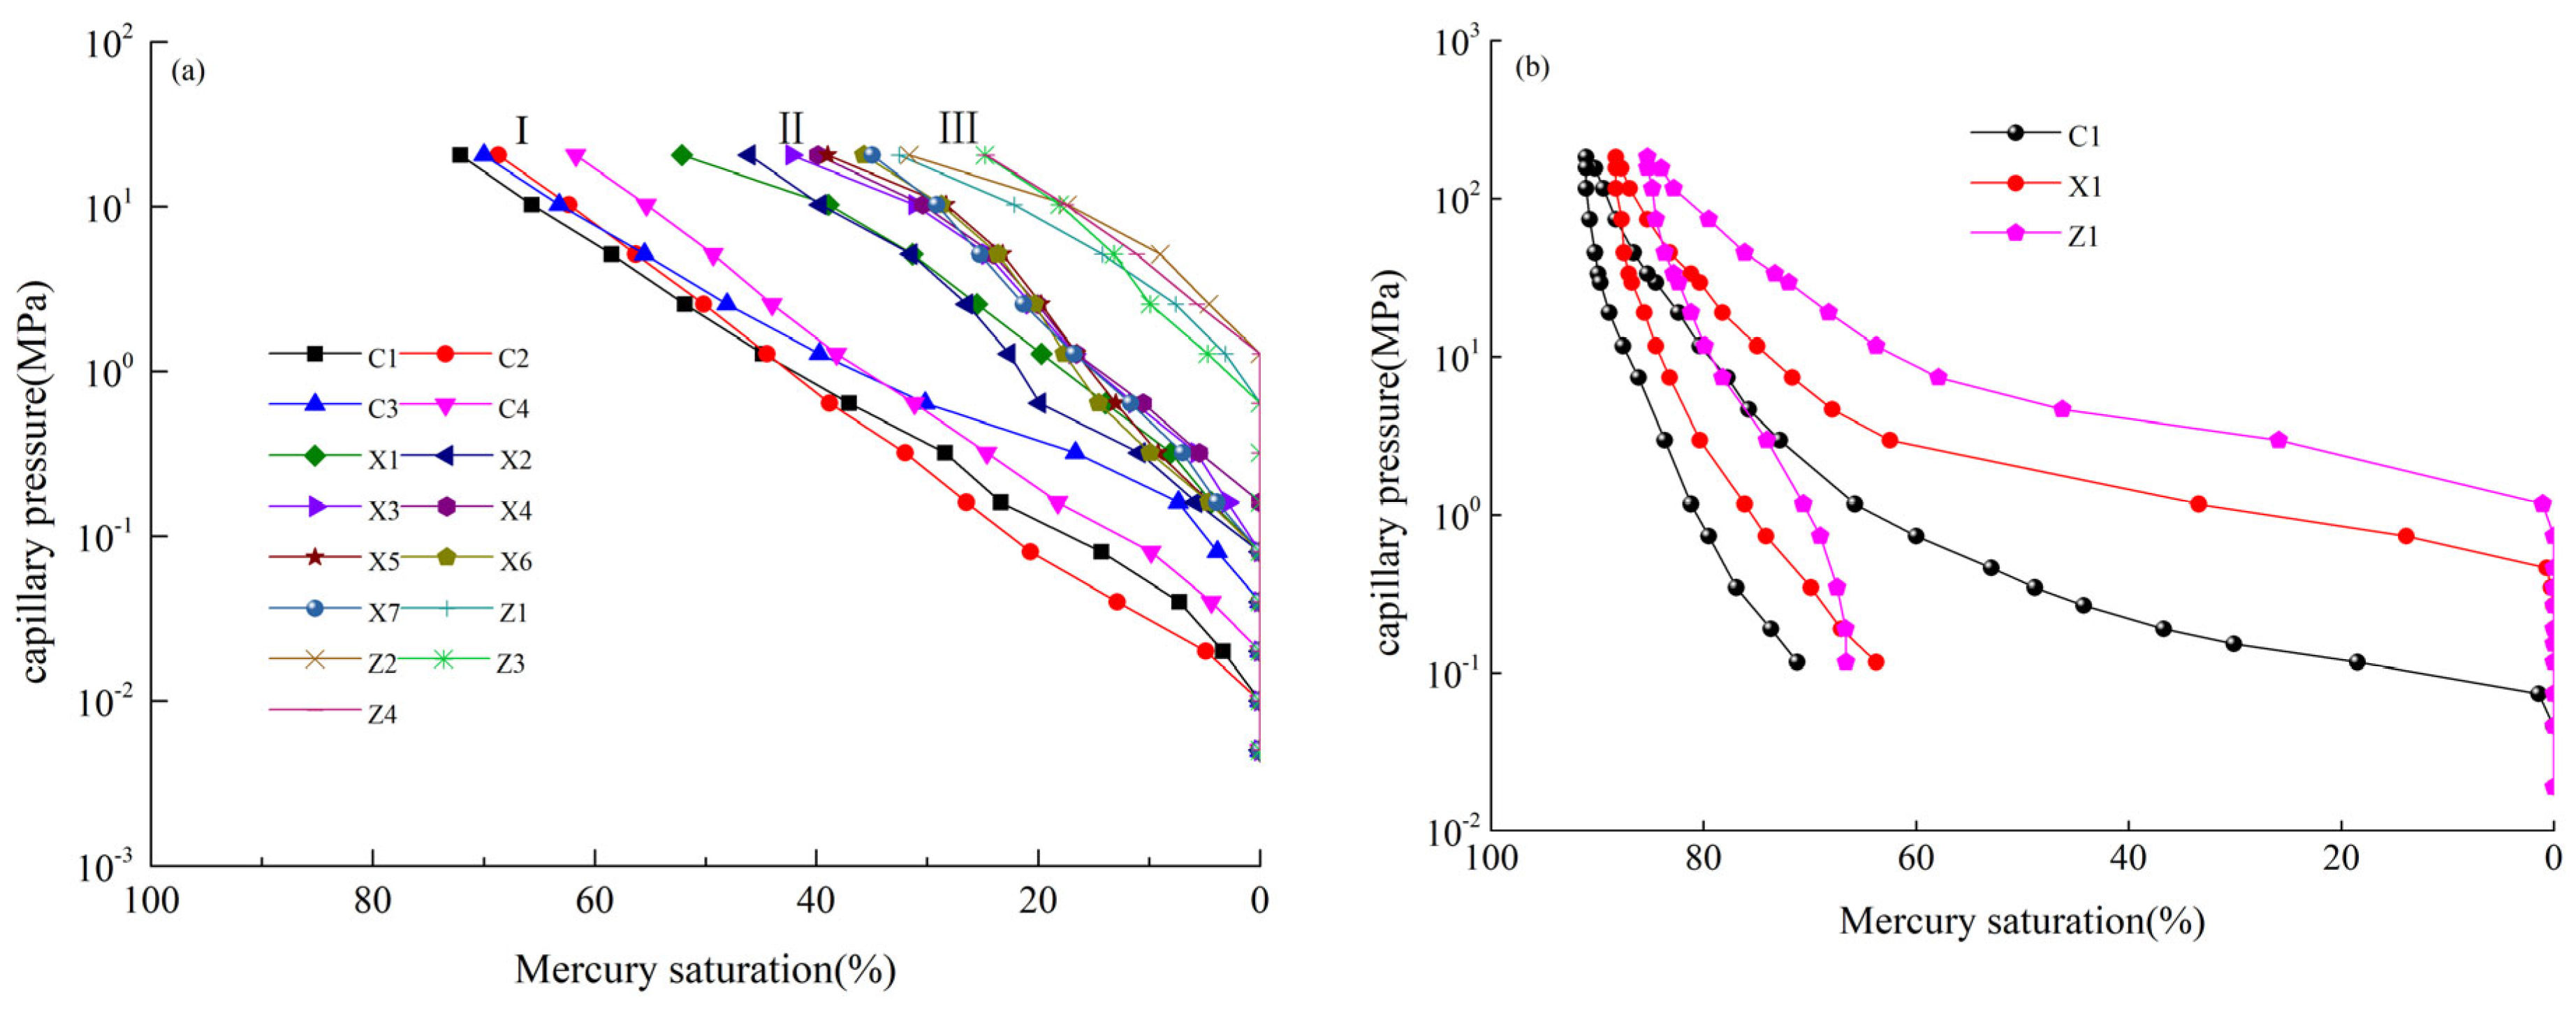
Pore-throat-scale analysis is crucial for evaluating reservoir seepage characteristics. CSMI has a low mercury injection rate, and each mercury injection time can be considered to be quasi-static. For this reason, it can distinguish between pores and throats. Meanwhile, HPMI can accurately detect the pore size of small pore throats due to the high mercury injection pressure, which becomes the basis of the implemented reservoir classification and evaluation. The CSMI and HPMI capillary pressure curves of the three types of core samples are shown in Figure 6. The capillary pressure curves of the three types of core samples are slightly rough and skewed. Overall, the curve has few horizontal parts, indicating that the pore throat sorting is poor.
The type I gritstone samples were mainly characterized by a wide pore throat, low threshold pressure, and low displacement pressure. The average porosity volume of a sample was 1243 × 10−3 cm3 (Table 2), and the pore structure of such samples requires a lower starting pressure, with an average of 0.015 MPa. The median pore throat radius was 2.0005 μm, while the average pore throat radius was 2.3432 μm. The proportion of intergranular pores was high, and the maximum mercury saturation was about 91.06%. The average sorting coefficient was 2.0253, and the pore throat sorting was relatively good. Thus, the pore structure of type I samples showed high storage capacity and seepage capacity. The type II fine conglomerate was dominated by medium-sized pore throats, medium threshold pressure, and low displacement pressure. The median pore throat radius was 0.3704 μm, while the average pore throat radius was 2.0249 μm. The average porosity volume of this type of sample was 1344 × 10−3 cm3, the average sorting coefficient was 0.2286, and the pore throat sorting was relatively general. The pore structure of the II type sample was similar to that of the type I sample, but the starting pressure was moderate, with an average of 0.073 MPa. The type II samples comprised mainly intergranular dissolved pores and residual intergranular pores, and the maximum mercury saturation was about 88.24%. Therefore, the pore structure of this type of sample has a relatively good reservoir capacity and seepage capacity. For the type III medium conglomerate samples, the pore throat structure was mainly characterized by a narrow pore throat, and high threshold pressure and displacement pressure. The displacement pressure was 3.13454 MPa (Table 2), and the saturated median pressure was 7.9889 MPa, resulting in small pore throats and low reservoir permeability. The average porosity volume of this type of reservoir was 598 × 10−3 cm3, which requires higher starting pressure, with an average of 0.874 MPa. The median pore throat radius was 0.0939 μm, while the average pore throat radius was 0.0661 μm. The proportion of dissolved pores and intercrystalline pores was high and the maximum mercury saturation was about 85.29%. Additionally, mercury injection is difficult and there is almost no horizontal section in the capillary pressure curve; the average sorting coefficient was 0.038, and the sample heterogeneity was strong. As a result, the storage capacity and seepage capacity of this reservoir pore structure are poor.
Additionally, the three types of samples had low mercury removal efficiency, this exhibits that the distinction between pores and throats is large, the Jiamin effect is strong, and the starting pressure gradient is large when the formation fluid is produced in this area. In general, it can be seen that the lower the core permeability is, the smaller the average pore throat radius is, indicating that some large-scale and connected pores in the tight glutenite core have a positive effect on seepage. Conversely, the lower the permeability, the greater the displacement pressure, indicating that permeability is an important index by which to evaluate the core seepage capacity.
Figure 7 shows the proportions of the pore throat distribution and the permeability contributions of the three types of samples obtained from the capillary pressure curves. The pore throat radius was mainly distributed in the range of 0.005–10.00 μm, which can be divided into four orders of magnitude: nanopores, micro-nanopores, sub-micropores, and micropores and fractures (Figure 7a). Overall, the average pore radius of more than 80% of the tight glutenite samples in this area is less than 1 μm. When the core permeability is between 0.28 and 0.59 mD, the proportion of nanopores and micro-nano pores is over 60%; with the increase in core permeability, the proportion of sub-micro pores and micropores and fractures increases gradually. When the core permeability is between 2.12 and 5.83 mD, the proportion of sub-micro pores and micropores and fractures is about 78%, indicating that the pore structure of the rock is closely related to the permeability. With increasing permeability, the proportion of macropores increases, and the main peak shifts to the sub-micro pores and micropores. The lower the core permeability, the larger the proportion of nanopores, which decreases the connectivity of the pores in the core. Compared with the type II samples and type III samples, the type I samples have a higher proportion of macropores. This indicates the deterioration of physical properties and pore throat connectivity, reduced average pore radius, and decreased pore sorting with decreasing permeability.
Moreover, the main pore throats contributing to seepage of the three types of samples are 0.63–6.31 μm, 0.25–1.13 μm, and 0.12–0.56 μm, respectively, indicating that the main contribution to permeability was made by the submicron-micron pores (Figure 7b). Although the distribution of the proportion of small-scale pore throats is much higher than that of large-scale pore throats, the permeability of the tight glutenite reservoir is mainly contributed to by the large-scale pore throats. In addition, it should be noted that information about some of the relatively large pores is missing from the HPMI, which may be attributed to the shielding effect.

3.3. Quantitative Characterization of Micron Pore Throat Structure

3.3.1. CT Grayscale Image Analysis

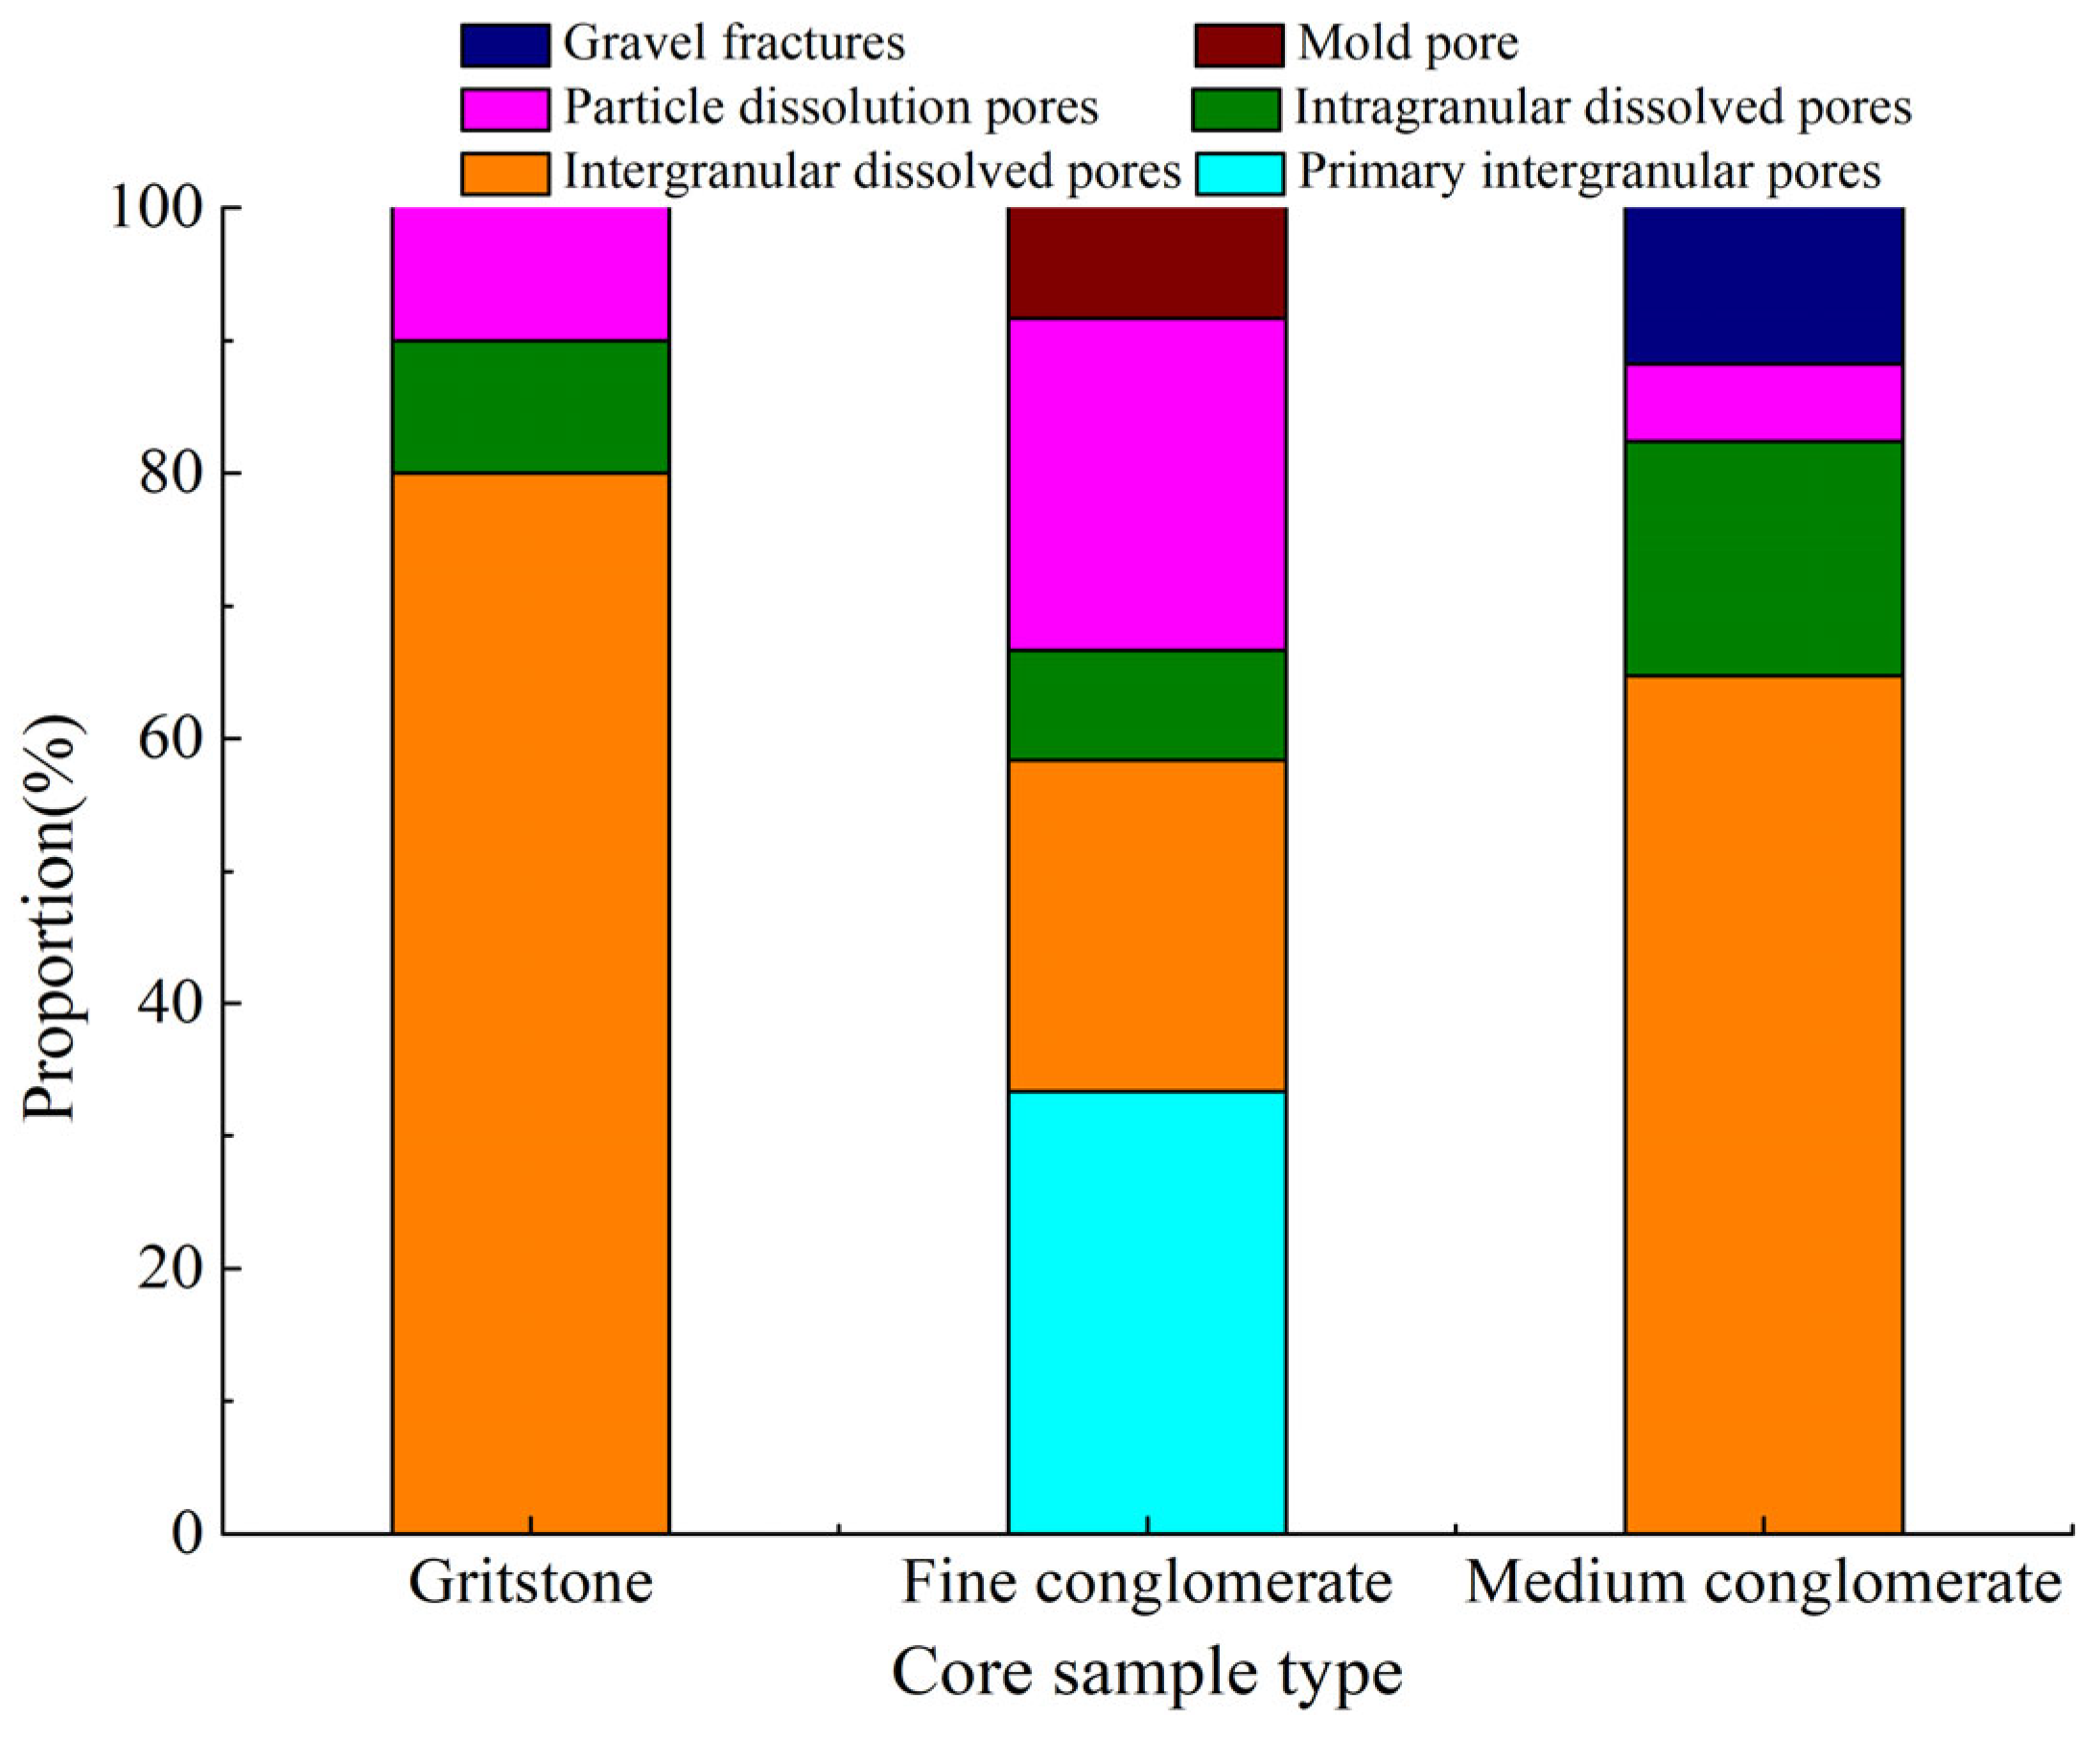
A two-dimensional (2D) grayscale image of the pore structure of a sample obtained via X-CT is shown in Figure 8. The gray value of the image is related to the mineral composition represented by the voxel. The lower gray value represents the core pores and fractures, the higher gray value represents the framework grains composed of quartz and rock fragments, and the white areas represent the carbonate cement [26,28]. The CT 2D grayscale image shows that the sample exhibits obvious heterogeneity, and the lithology is relatively tight. The gravel particles in the sample do not contain obvious pores, and the pores are mainly distributed in the clay minerals around the gravel particles. It can be obtained that the arrangement of rock skeleton particles in the tight glutenite reservoir is extremely irregular and the roundness is poor. The lithology of the three types of samples is different, and the types of reservoir space are also different (Figure 9), with the deterioration of reservoir physical properties, the number of black pores gradually decreases. Specifically, the intergranular dissolution pores and remaining intergranular pores of type I gritstone samples are mainly developed (Figure 8a,b and Figure 9), accounting for 80% of the total pores. The intragranular dissolution pores and particle dissolution pores account for 10% of the total pores. The black pores are distributed throughout the entire rock interface, indicating that it has the best reservoir connectivity and the highest permeability. For the type II fine conglomerate, the mixed layer clay of the reservoir is formed due to the mixed layer of illite/montmorillonite and chlorite/montmorillonite. The primary intergranular pores account for 33.33% of the total pores, while the intergranular dissolved pores and the particle dissolved pores account for 25% of the total pores, respectively (Figure 8c and Figure 9). Meanwhile, the intragranular dissolved pores and mold pores account for 8.33% of the total pores. It has relatively good reservoir connectivity and permeability.
For the type III medium conglomerate samples, the intergranular dissolved pores and intragranular dissolved pores are mainly developed (Figure 8d,e and Figure 9), accounting for 64.71% and 17.65% of the total pores, respectively. Notably, some microfractures such as cross-tortuous gravel microfractures are also developed, accounting for 11.76% of the total pores, which were produced by mechanical compaction and tectonic stress during reservoir formation. For example, the brittle minerals in the core could fracture to form compressive fractures under strong stress. However, it can be observed that large gravels occupy about 1/2 of the cross-sectional area, and bright high-density minerals are distributed throughout the rock skeleton. This results in the fact that, although some microfractures are developed in this type of sample, some pores are only connected through intergranular fractures due to the low development degree of micropores in gravels and the strong heterogeneity of the sample. As a result, the reservoir connectivity is the poorest and the permeability is the lowest.

3.3.2. Image Processing

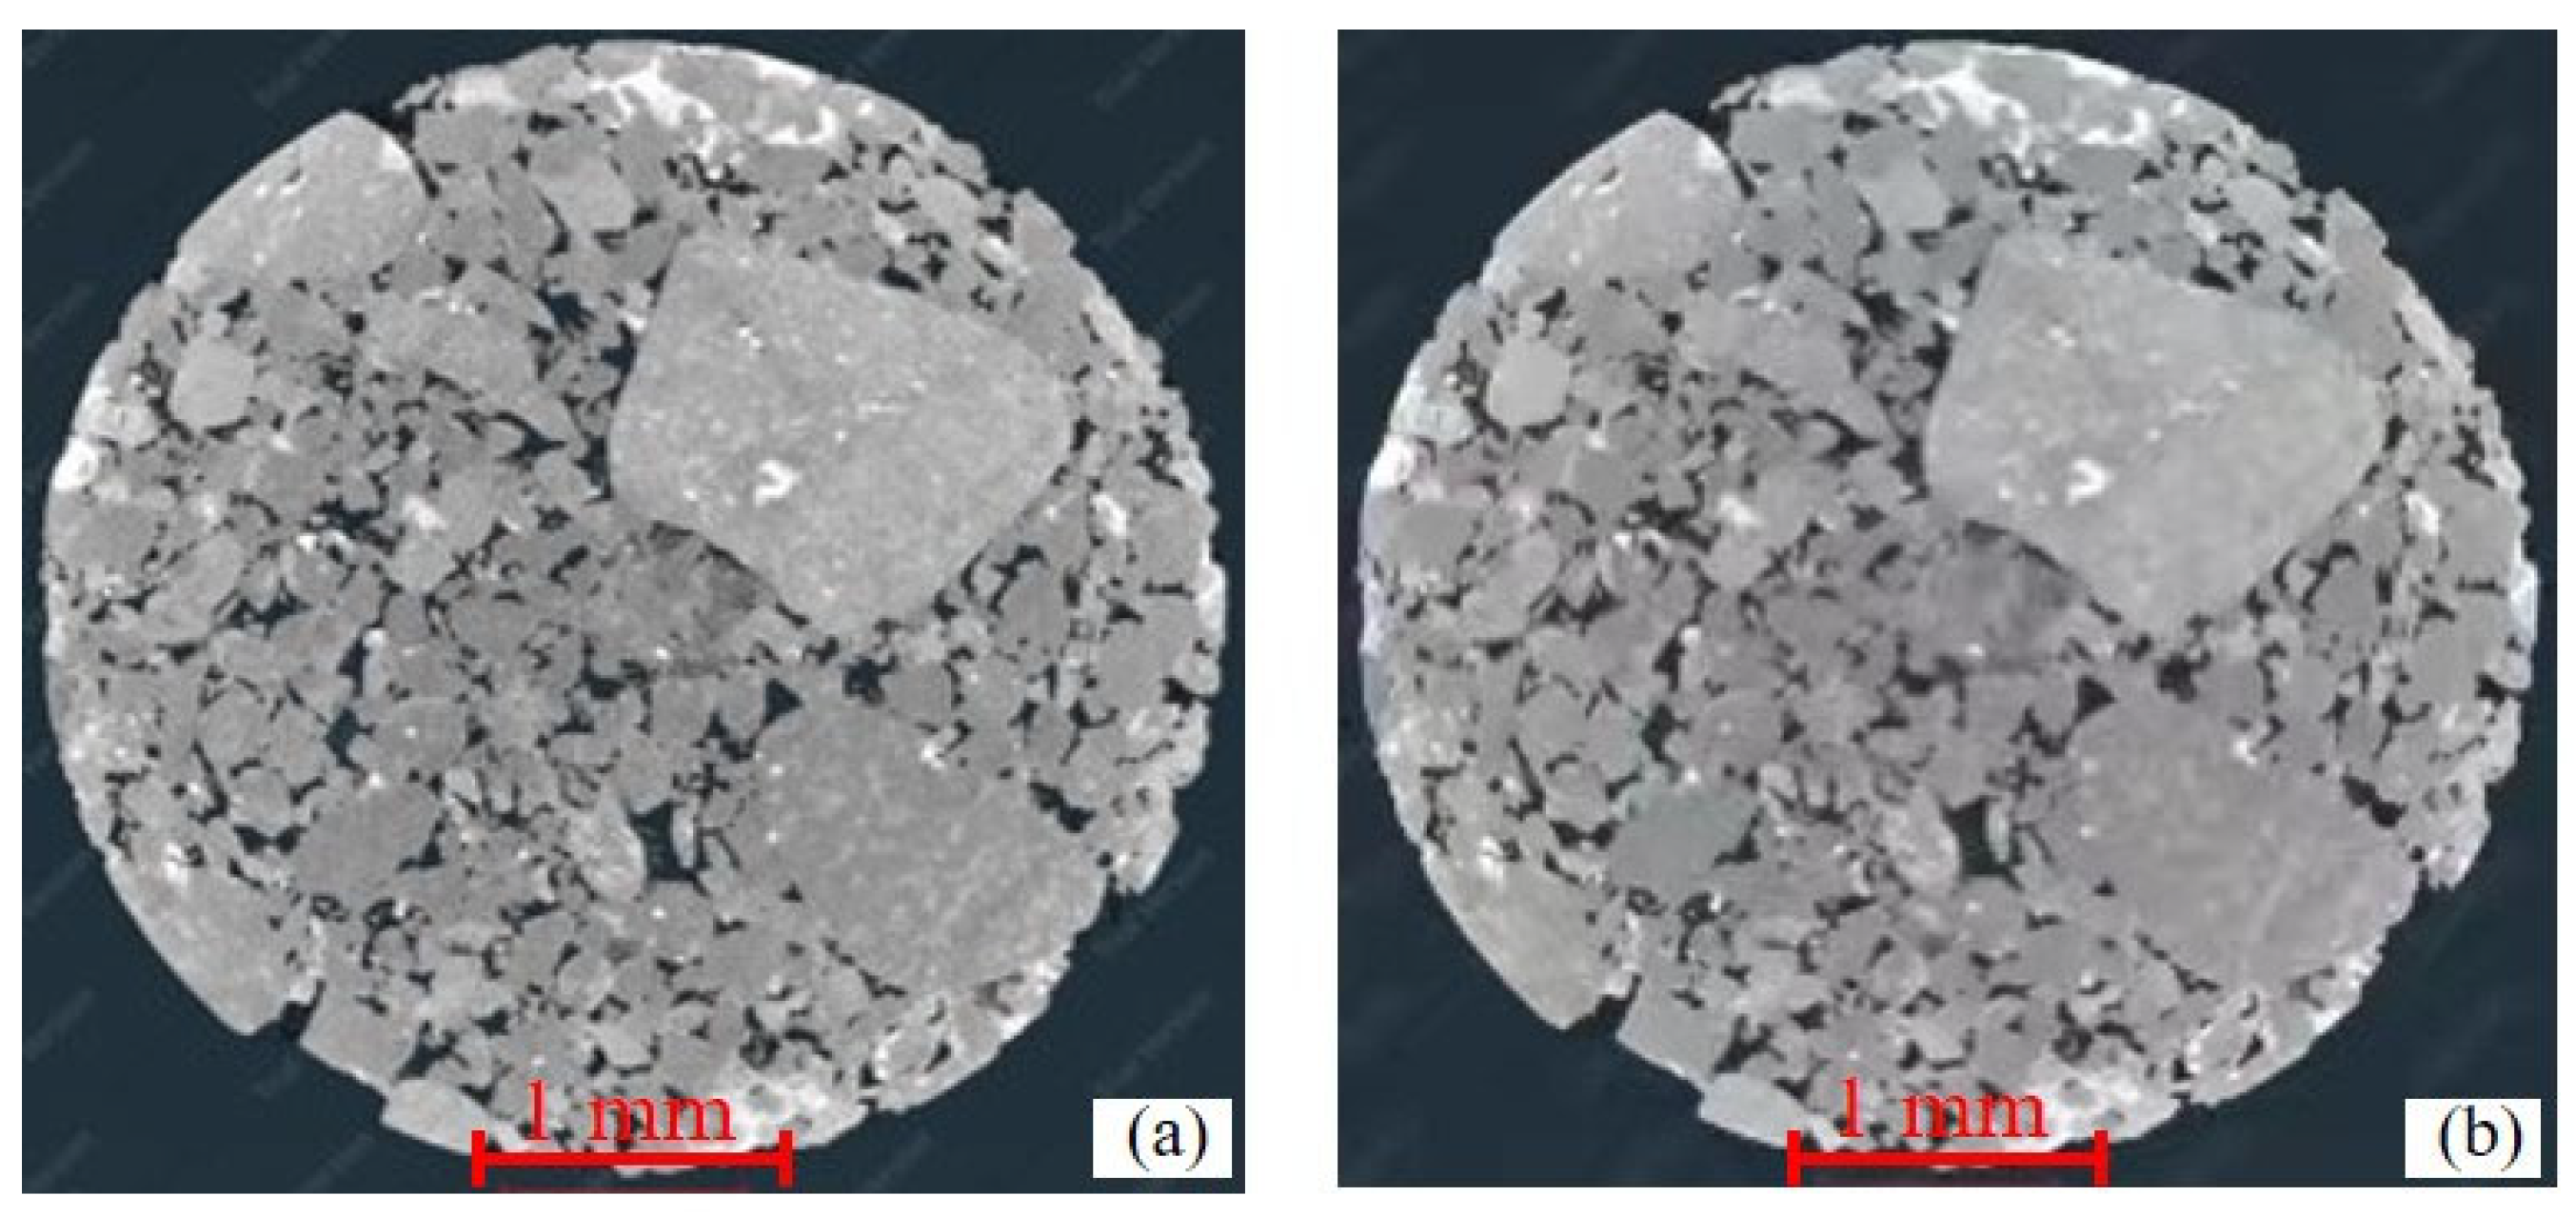
Due to the mechanical vibrations of the system itself, there was noise in the CT image obtained via CT scanning. Noise reduction filtering is often used to improve image quality and accuracy. Gaussian filtering, median filtering, and mean filtering can be conducted to denoise images [29]. In this study, the median filtering algorithm was employed for image noise reduction. The median filtering algorithm can not only remove noise, but can also protect the edge of the image. By eliminating isolated noisy points, a better image restoration can be obtained, which lays the foundation for image segmentation of the sample pore-fracture. After noise reduction and brightness adjustment of the CT images, the image noise was significantly reduced (Figure 10).
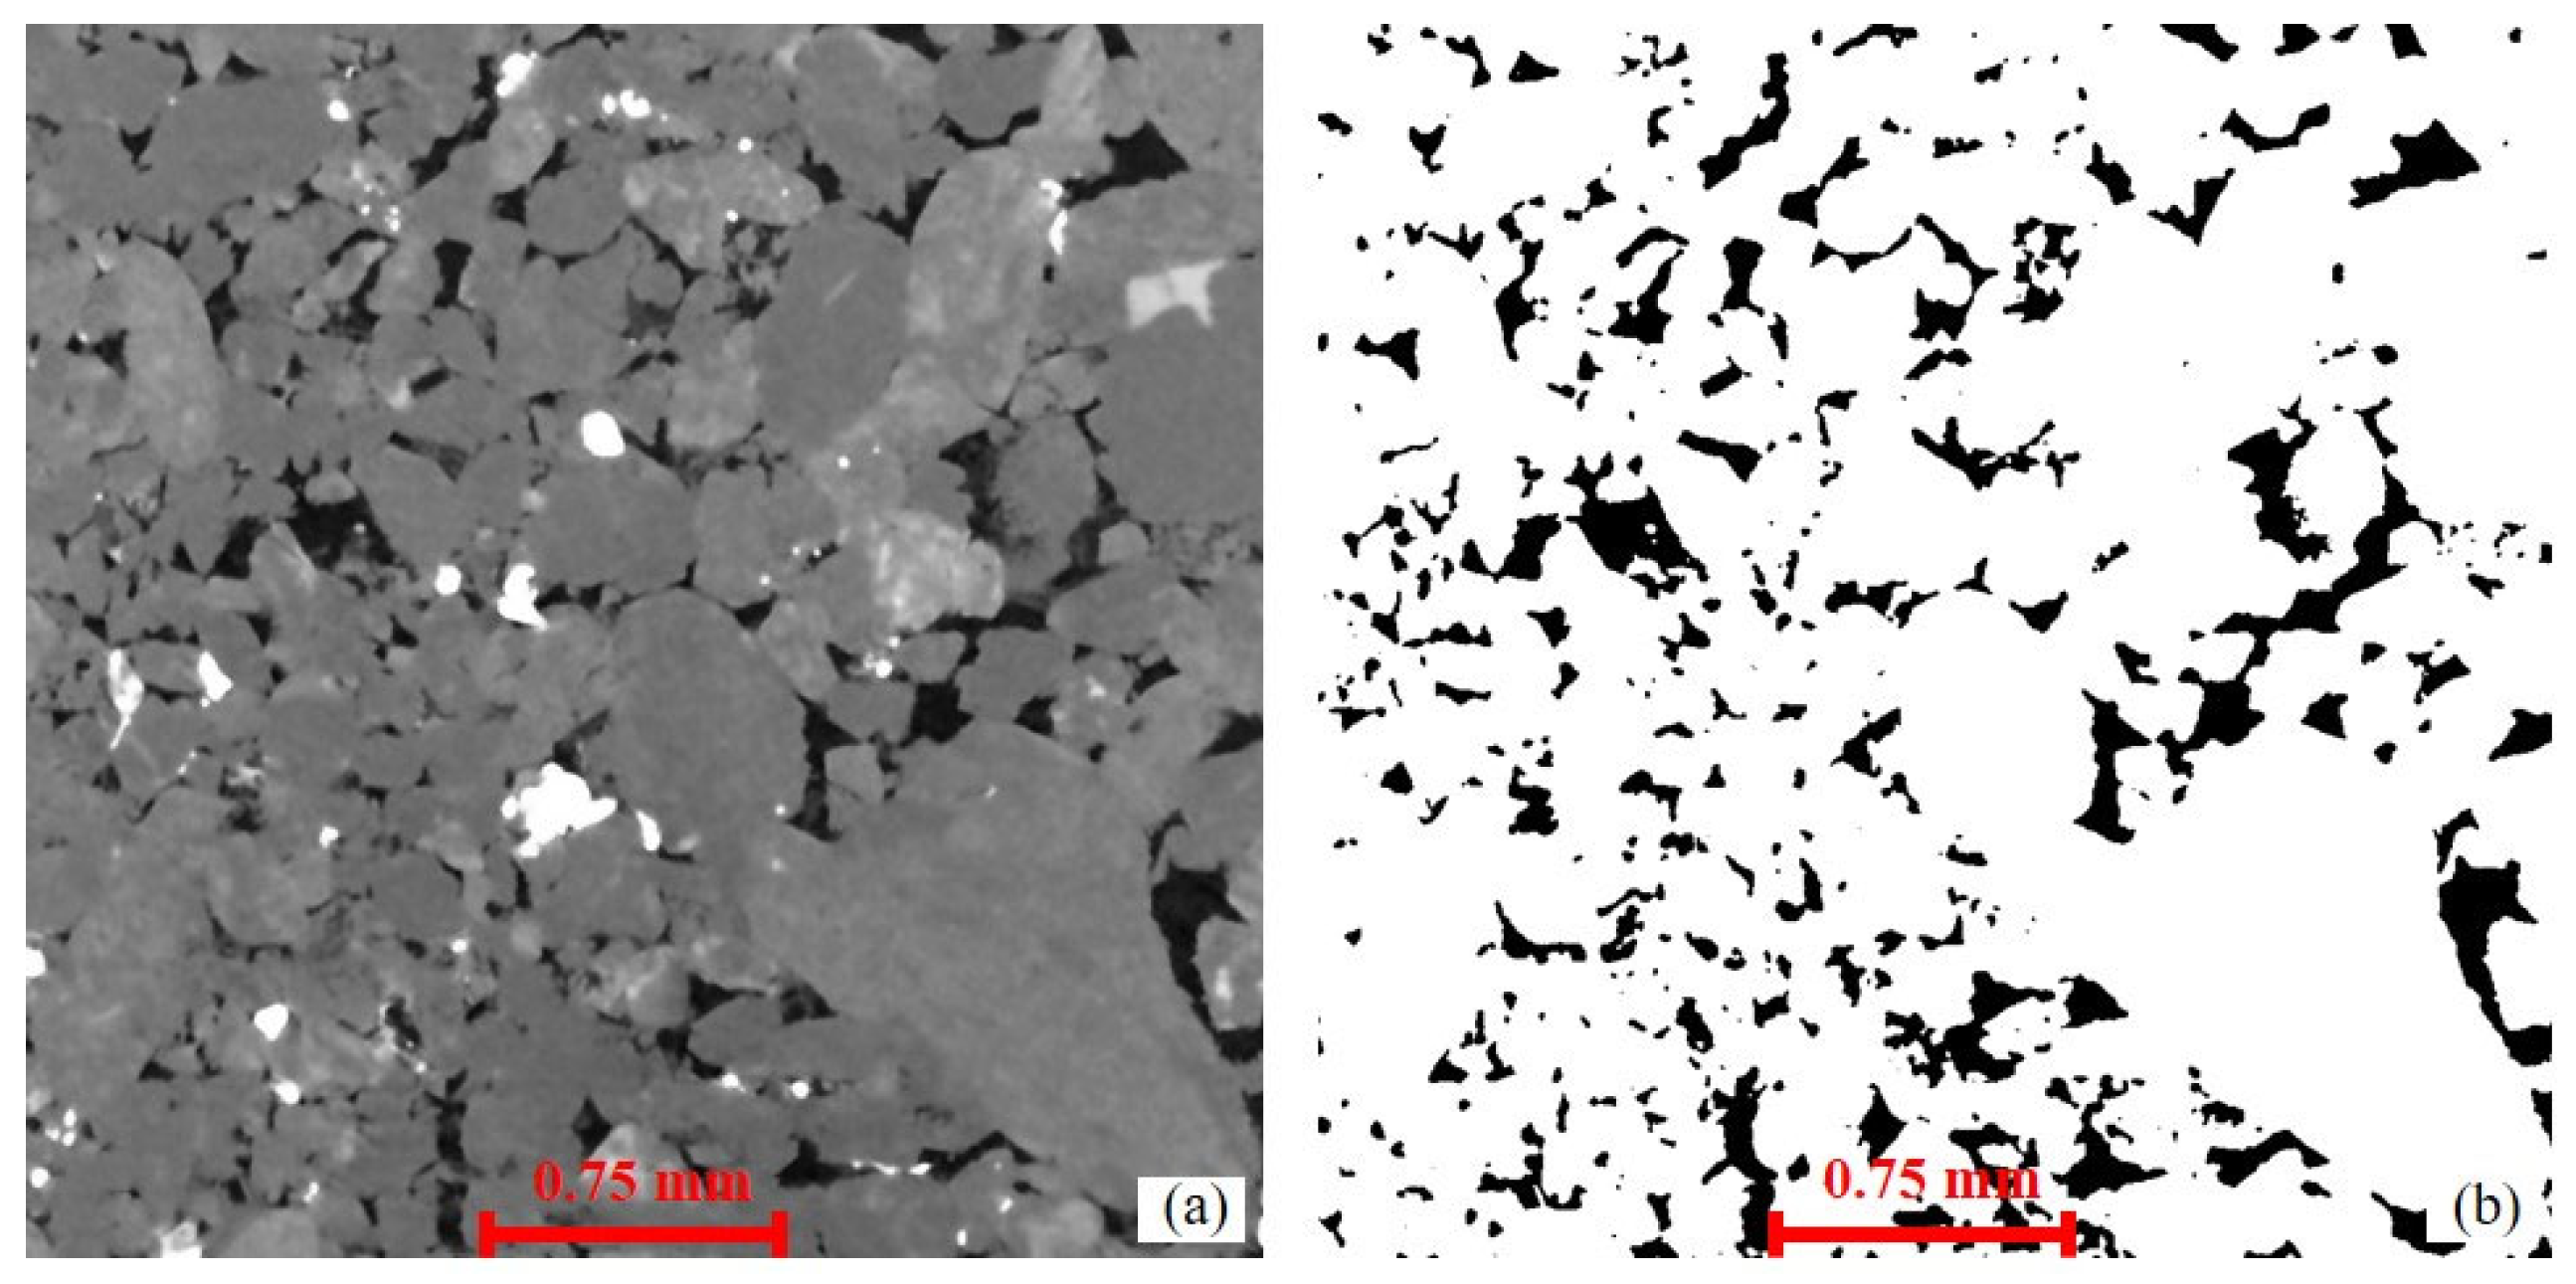
Furthermore, the CT grayscale images were imported into the AVIZO 8.0 3D visualization software, and human–computer interaction threshold segmentation was carried out to better distinguish between the rock skeleton and pores. Due to the tight lithology of the sample, the core was composed of pores and a tight matrix. A 3D reconstructed pore structure of the sample that was consistent with the actual core was obtained by segmenting the pore and matrix. The determination of the threshold was based on the measured porosity of the core and naked eye observations. Taking sample C1 as an example, the images before segmentation are shown in Figure 11a. First, the porosity of the core was measured using a porosimeter, and the porosity of the sample was 7.1%. Second, the image was segmented using thresholds of different sizes, and the core pore segmentation results corresponding to the different thresholds were observed via the human–computer interaction system. Through multiple segmentation adjustments, it was determined that when the threshold value was moderate, the segmented porosity was consistent with the measured porosity, and a binarized CT image could be obtained (Figure 11b).

3.3.3. Three-Dimensional Digital Core Pore Network Model Reconstruction

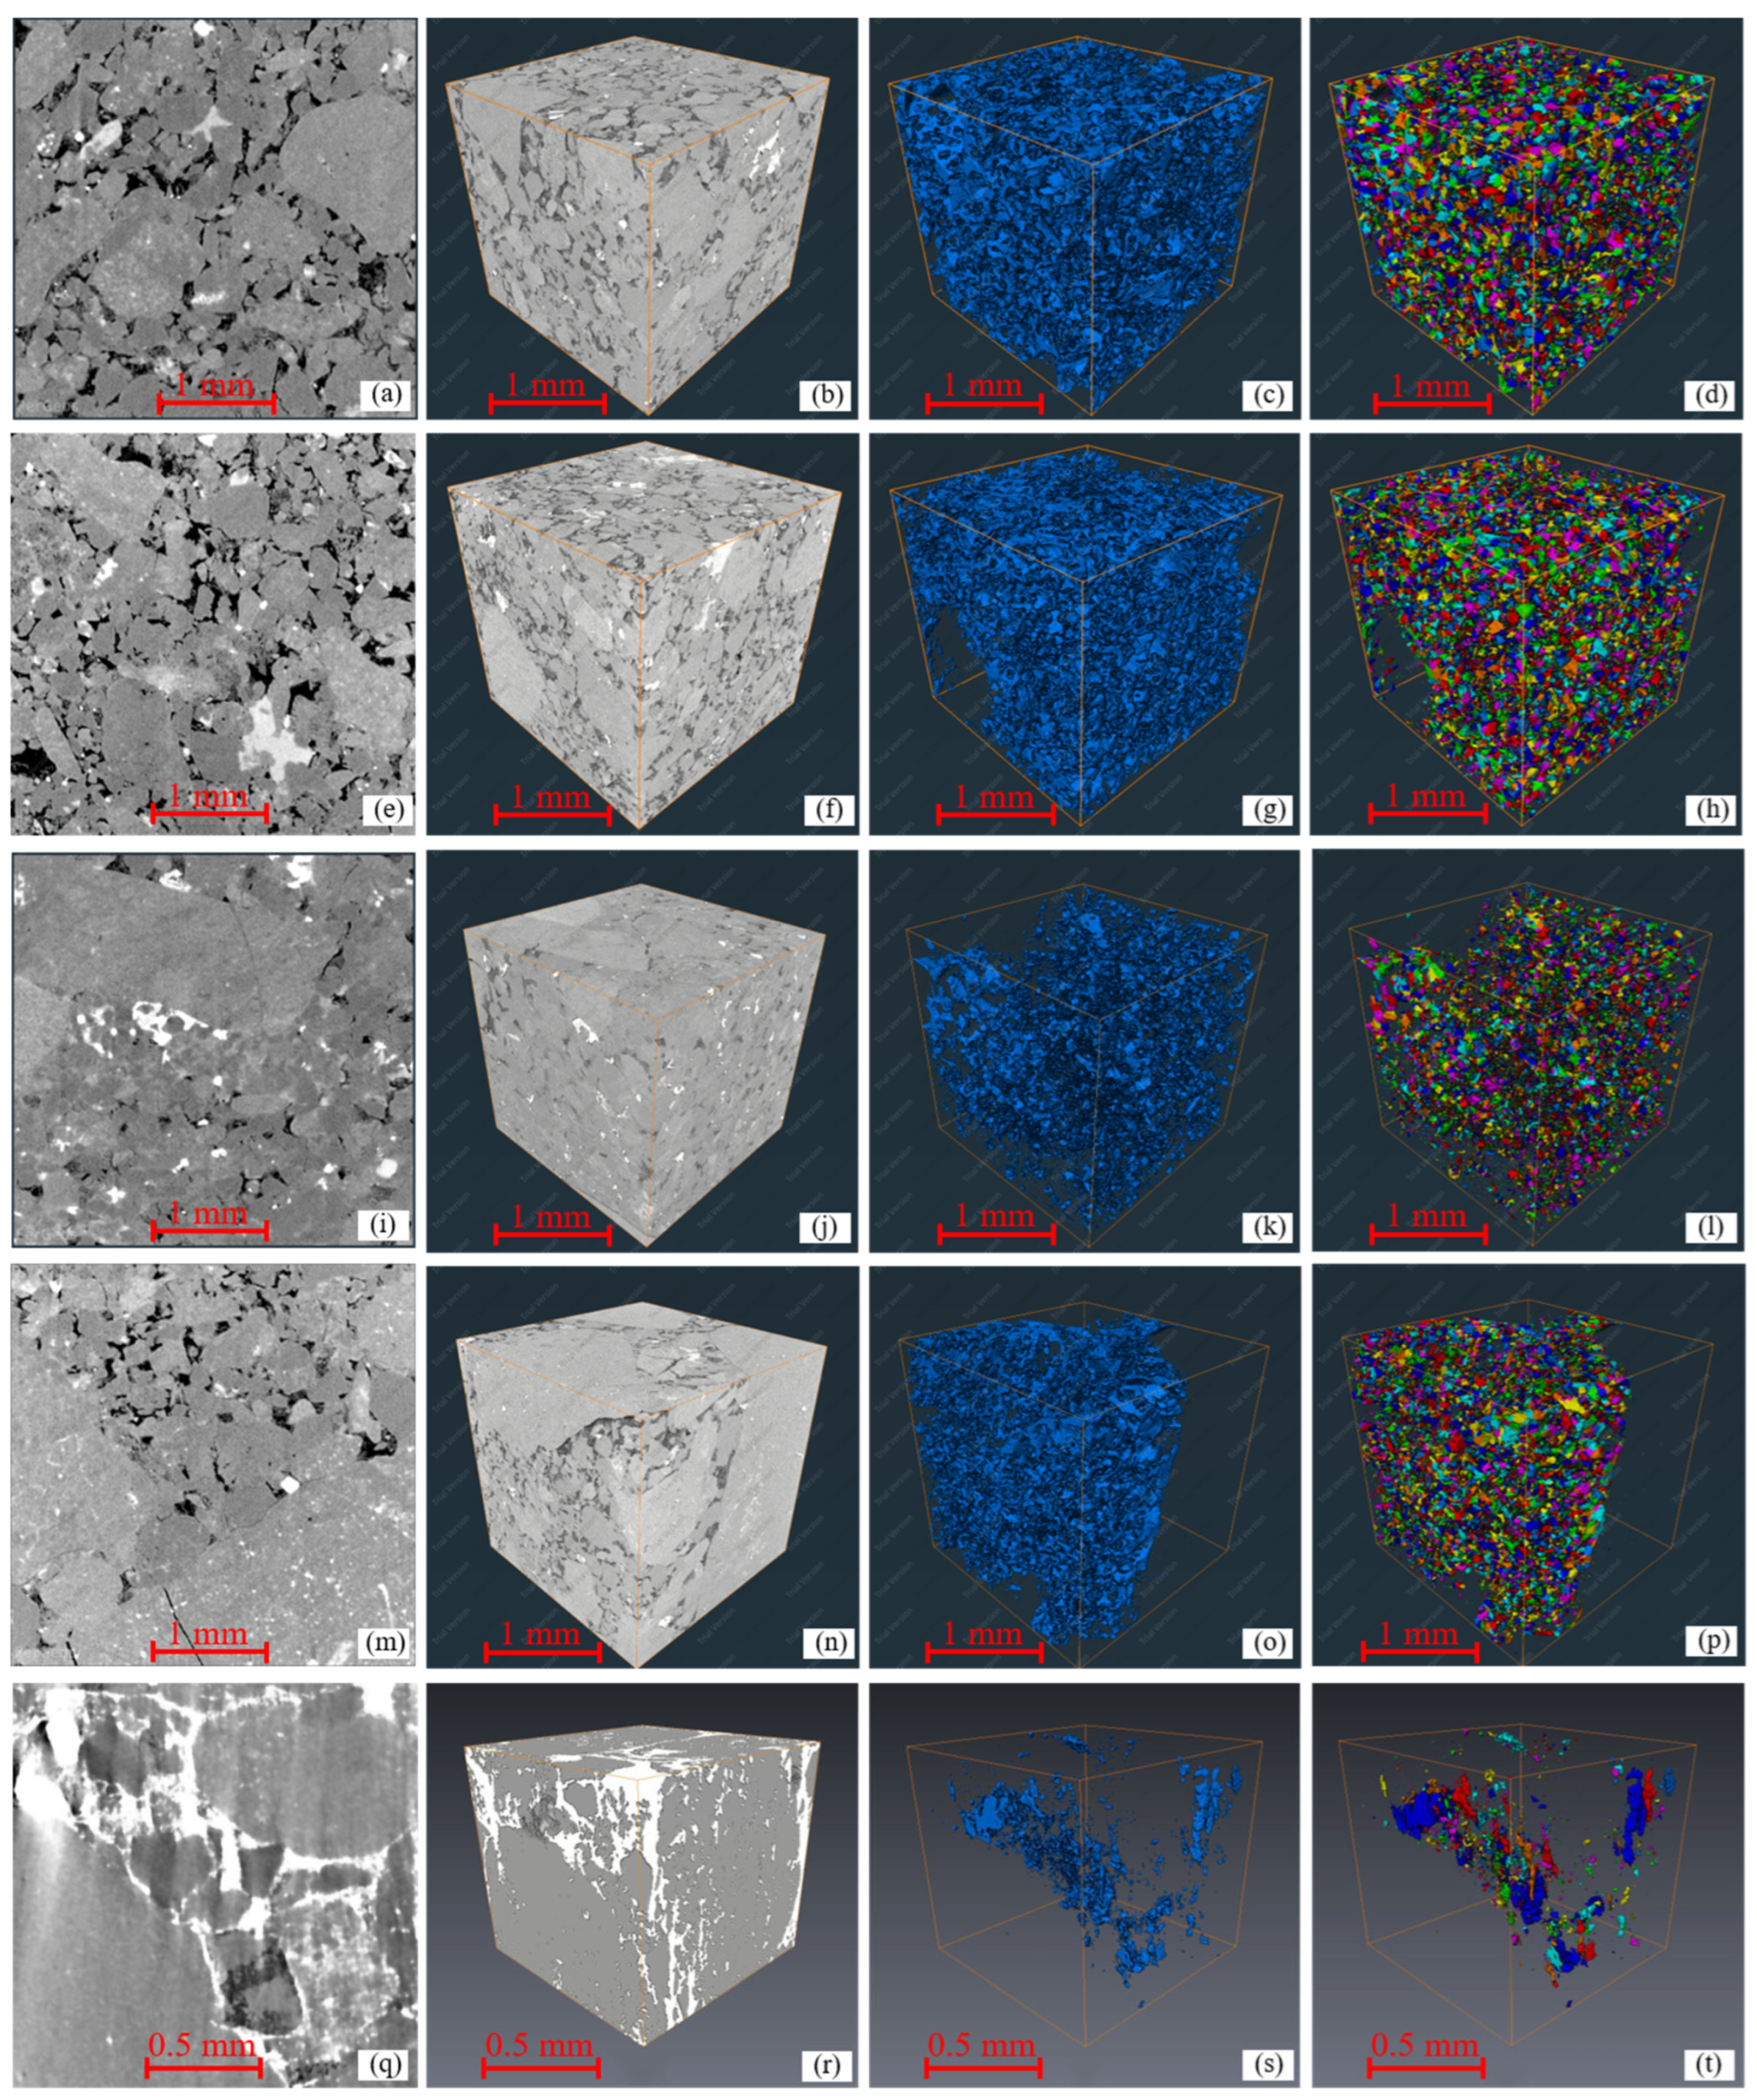
A 3D grayscale image consistent with the real core was obtained by stacking multiple layers of 2D grayscale images in sequence (Figure 12a,b,e,f,m,n,q,r). The black regions with the lowest brightness in the 3D images correspond to the pore spaces, the dark gray areas correspond to the clay minerals, and the white areas correspond to the high-density skeleton composed of quartz and rock fragments. The binarized 3D digital core of the pore-fracture structure was obtained (Figure 12c,g,k,o,s). Figure 12 shows the distribution of the pore-fracture structure in the rock skeleton while the matrix is transparent and the pores are blue. The 3D digital core imaging reveals that the pore types of the glutenite core are mainly continuous sheets or are isolated. The former has good connectivity and mainly consists of connected pores and microfractures, while the isolated micropores are mainly composed of unconnected isolated spaces in the core, with poor connectivity and clear boundaries between the particles, which mainly play the role of oil and gas reservoirs.
Specifically, the type I samples mainly contain a large number of continuous sheets or strip-shaped pores, with fewer isolated pores; it can be deduced that this is related to the interconnection of the pores such as the intergranular dissolution pores, primary intergranular pores, and strip fractures in the core. There were two main reasons for the development of this pore structure. (1) Soluble sites in unstable minerals (carbonates, feldspars, and detritus) can produce selective dissolution when exposed to organic acids and acidic CO2 fluids. For example, the matrix part of the gritstone can be dissolved, resulting in the formation of small pores at the dissolution sites. (2) Intergranular dissolution pores are formed by the dissolution of mineral particles from the edge to the center. For example, potassium feldspar particles dissolve along the cleavage to form framework-like dissolution pores. The type II samples mainly develop banded and isolated pores, which is related to the development of primary intergranular pores and intergranular dissolved pores. The formation of this pore structure can be attributed to the following processes: (1) The micropores between the particles are not sufficiently compacted during the formation of the reservoir, and as a result, the intergranular pores can be formed after being partially filled and compacted, and the pore size can reach microns. (2) The black oval structural pores with different shapes formed when the gravel particles are dissolved, and these pores are often semi-filled by chlorite, siliceous material, and calcite.
The type III samples have fewer contiguous pores and more isolated pores. Large gravel occupies nearly half of the space in the digital core image and the pores in the large gravel are very few, which is related to the development of intergranular/intragranular dissolved pores and intercrystalline pores. The formation of this pore structure can be attributed to the following processes: (1) The dissolved pores are formed by the dissolution of carbonate mineral particles such as feldspar and calcite. Their shape is mostly elliptical and the pore size is submicron. (2) During the transformation of dolomite to fine crystals and microcrystals, the volume gradually decreases, and the crystals are in lattice contact to form intergranular pores. The connectivity is poor and can be regarded as the local reservoir space. Furthermore, compared with the three types of glutenite samples, the shale core mainly develops dispersed banded dissolution pores and isolated organic pores (Figure 12s). It can be seen that the number of pores is small and the connectivity is significantly poor. Notably, the heterogeneity of the sample pores is negatively correlated with the sample permeability, that is, the lower the sample permeability, the stronger the heterogeneity.
Essentially, the proportion of connected pores to the total pores is equivalent to the proportion of effective pores to the total pores, and the connectivity of the pore throats can be calibrated using an image marking algorithm. After marking the adjacent pore bodies as the same pore cluster, if the first slice and the last slice of the 3D digital core have the same mark, the pore is defined as a connected pore-fracture; otherwise, it is regarded as an isolated or disconnected pore [29,33], and the different colors represent different pore clusters (Figure 12d,h,l,p,t). According to the results of identification of the pore and fracture types in the cores, the connected pores mainly present banded or flake structures. Overall, type I sample C1 has more connected pores, and the ductility and connectivity of the continuous micropores are good. The measured porosity of the core is 7.1%, and the permeability is 5.83 mD. However, the matrix of shale sample J1 is relatively tight, the high-brightness and high-density minerals are distributed in long strips, and the pore distribution is mainly characterized by isolated pore clusters. Although the pore clusters have a large scale, the overall connectivity is poor, and most of the pores are invalid pores. The measured porosity of the sample is 7.3%, and the permeability is only 0.03 mD. The pore connectivity identification results indicate that the pore connectivity of the sample contributes more to the seepage than the pore scale. Specifically, when the intergranular dissolution micropores and primary intergranular pores are concentrated and developed, the pores have a better connectivity.

3.3.4. Quantitative Characterization of 3D Pore and Fracture Parameters

The 3D connected pore-fracture structure network model of the core was extracted from the digital core image using the maximum sphere algorithm [33]. This model is a pore model with an equivalent pore space topology and effectively includes the geometric features of the pores, which simplifies the digital core and retains the pore distribution characteristics. That is, the relatively large sphere of the model is defined as the pore, and the narrow sphere connecting two large spheres is defined as the throat. Therefore, the microscopic pore structure of the core can be quantitatively characterized by analyzing the parameters of the model, such as the pore throat radius, shape factor, and coordination number (Figure 13).
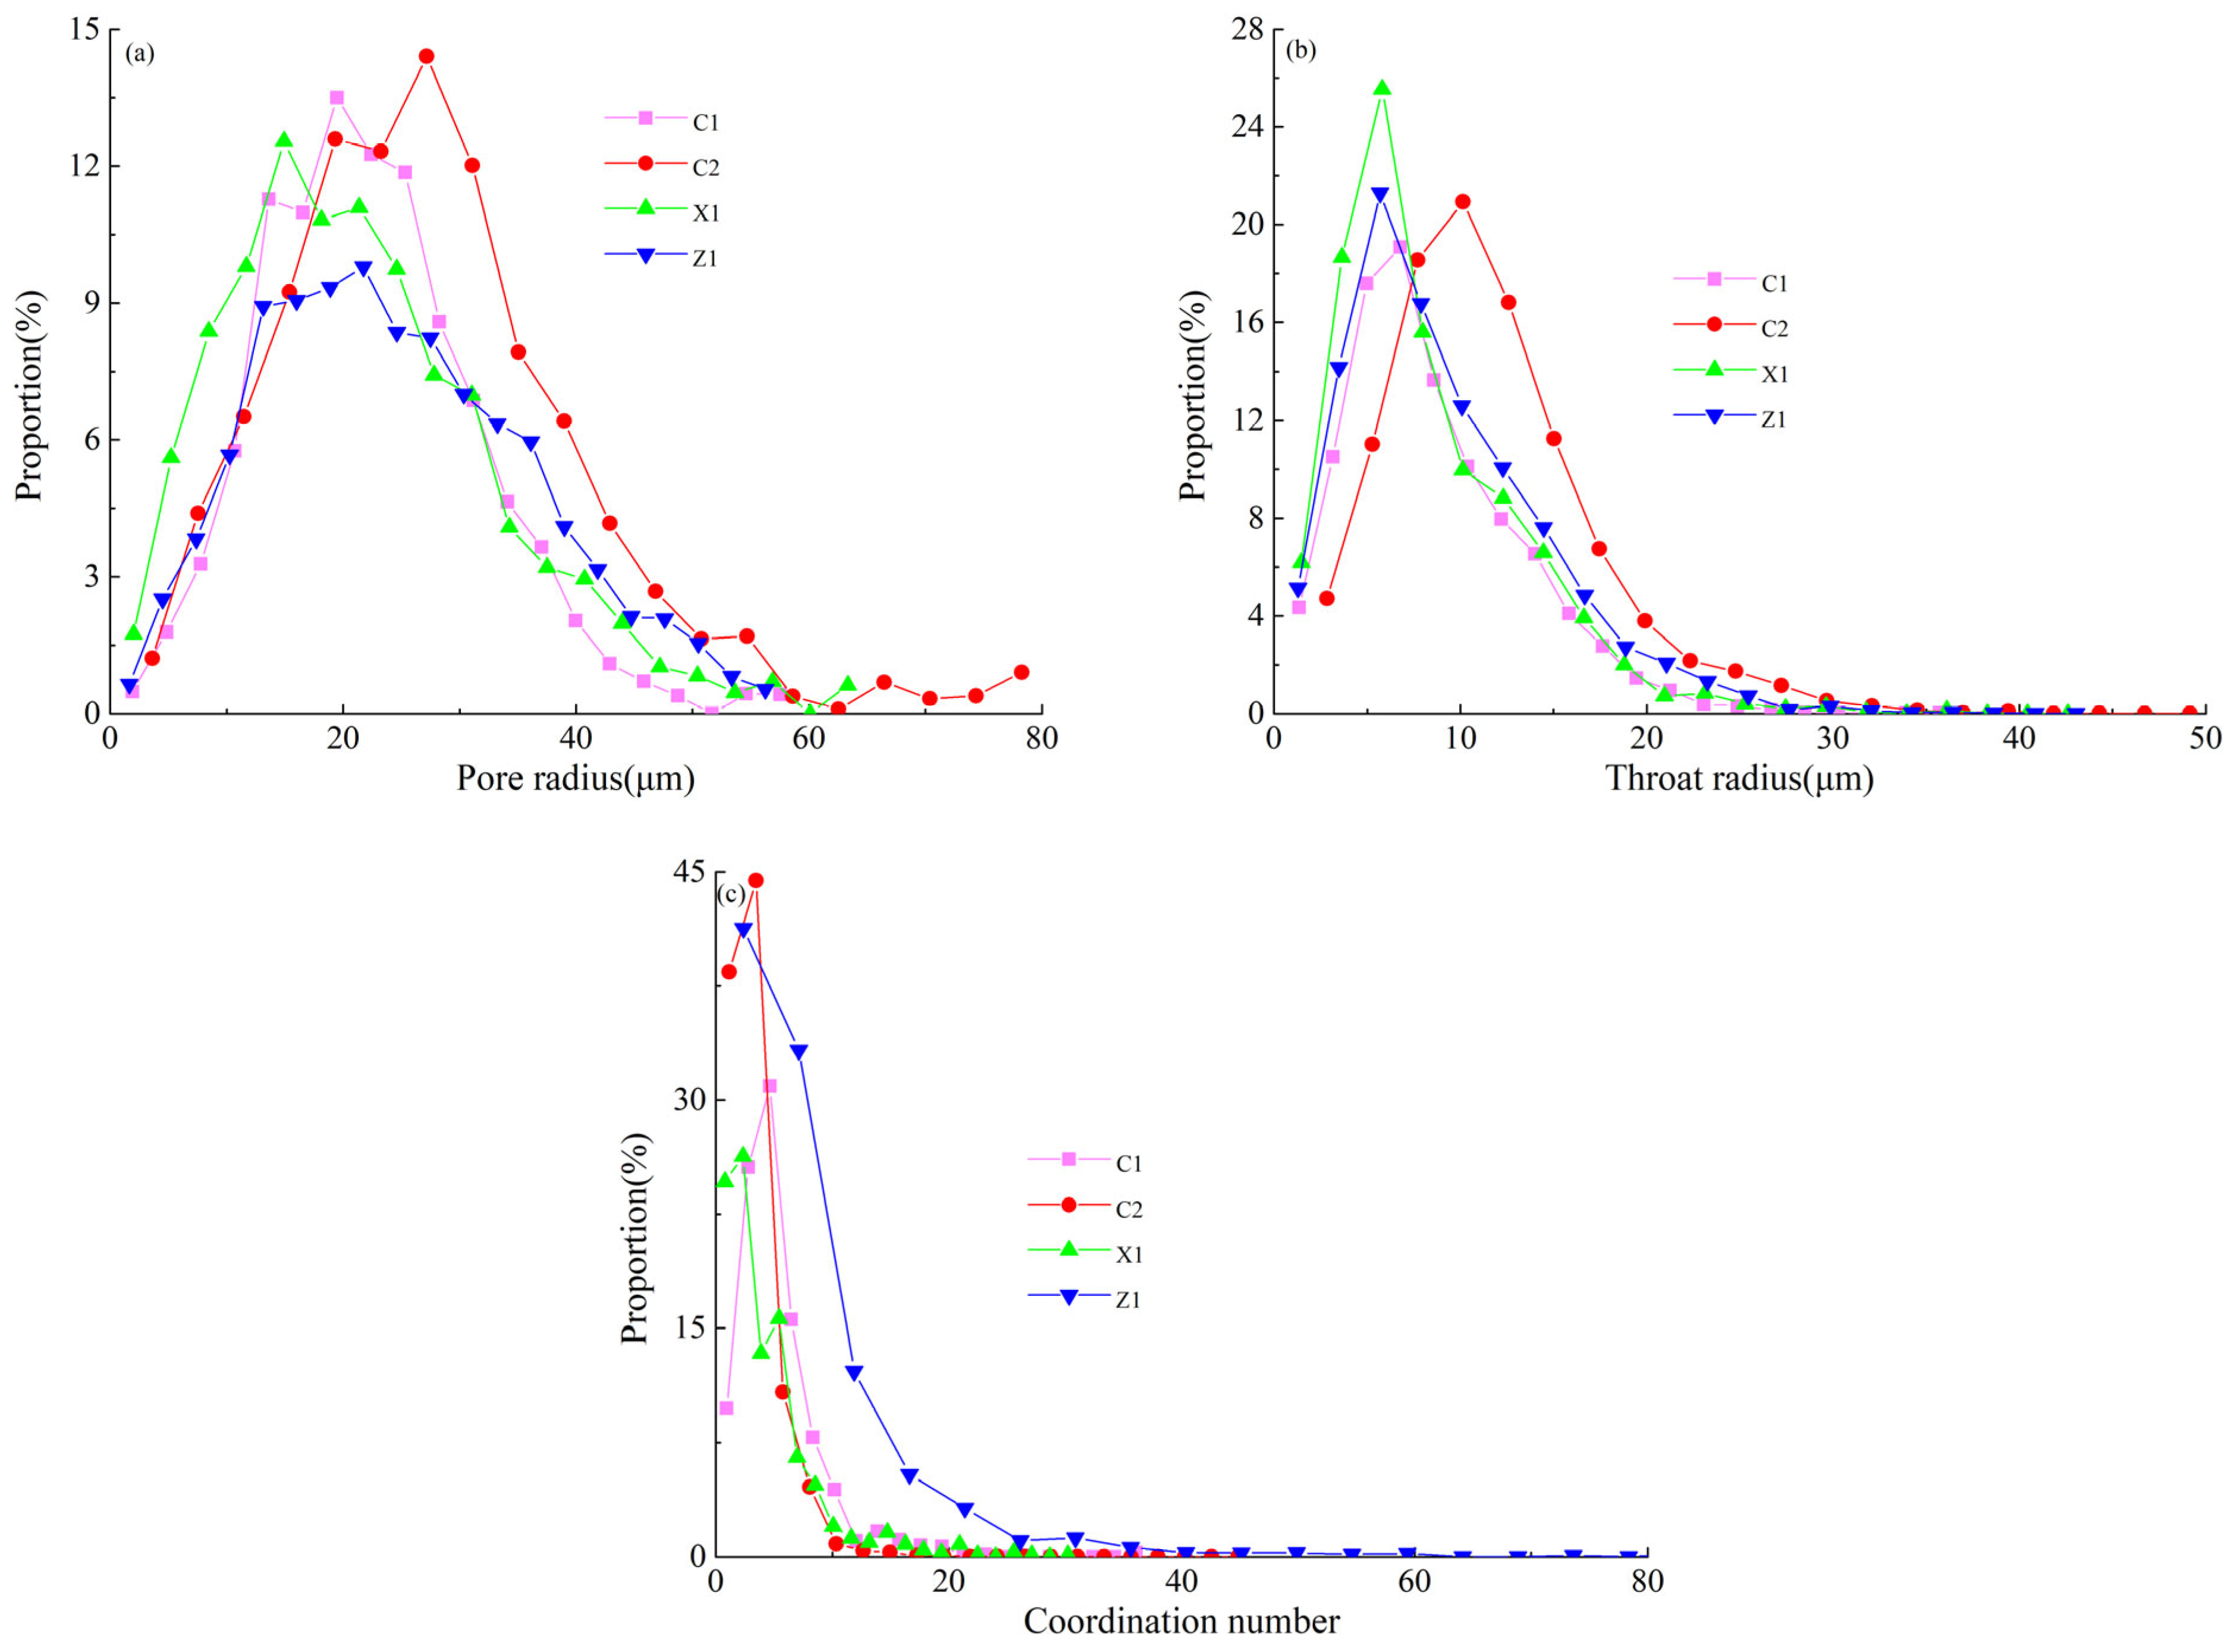
Table 3 and Figure 14 are the results of pore throat parameter analysis obtained by the pore network model. The pore radii in the three types of samples were mainly in the range of 12.25–45.75 μm. With an increase in permeability, the curve exhibits a right-shifting trend. The average pore radius of type I gritstone samples, type II fine conglomerate samples, and type III medium conglomerate samples was 41.48 μm, 32.67 μm, and 28.94 μm, respectively. The average and peak pore radius of the type I samples are higher than those of the type II and type III samples; this shows that the type I samples have better physical properties and a relatively larger pore scale. The throat radius of the two types of samples is mostly in the range of 3.35–25.35 μm, and the average throat radius of the three types of samples is 26.07 μm, 22.05 μm, and 21.06 μm, respectively. As the permeability decreases, the throat radius decreases, which indicates that there is a positive correlation between large pore throat and reservoir connectivity, and the core throat plays the main role in controlling it. Additionally, the average pore and throat shape factor of the two types of samples is mostly around 0.0390, indicating that the pore and throat sections of the core are mainly triangular in shape. Additionally, the average coordination number of the three types of samples is mostly 4–10, 3–7, and 2–5, respectively, indicating that poor pore throat connectivity makes the permeability decrease. In general, this is consistent with the test results of mercury injection experiments and the identification results of digital core connectivity.

3.4. Comprehensive Characterization of Full-Scale Pore Size

To illustrate the pore characteristics of a tight glutenite reservoir as a whole, the pore size distribution curves under different test methods can be obtained by fitting the HPMI, CSMI, and micro-CT experimental results (Figure 15). Essentially, when the pore size is less than 1 μm, the HPMI can show the change in the small pore size more accurately, while the micron CT and CSMI are more effective at characterizing medium and large pores. This is mainly because micron CT is limited by its resolution, and CSMI is limited by its small mercury injection pressure, which makes it difficult to capture small-sized pores. Additionally, previous studies have demonstrated that, in the range of 5–1000 nm, the HPMI pore distribution curve gradually deviates from the CT scan experimental results and low-temperature N2 adsorption curve as the pore size decreases, and the smaller the pore size, the greater the distribution difference. This is because HPMI is mainly aimed at the connected pore throats in the sample, the measured pore size distribution map mainly reflects the connected pores, so it can better reflect the real pore throat distribution characteristics in the core. Therefore, for glutenite reservoirs with developed nanopores and a high pore–throat ratio, HPMI can better reflect the changes in small pores such as fine nanopores.
The full-scale pore size distribution curve of the three types of samples can be obtained via secondary segmentation fitting (Figure 15), which represents the pore distribution of the entire glutenite reservoir. It can be seen that the pore size distribution in the study area exhibits cross-scale characteristics. The pores in the tight glutenite have a wide size range of 5 nm to 80 μm and predominantly exhibit Gaussian and bimodal distribution patterns, which can span 2–4 orders of magnitude. This implies that the sample contains intergranular pores and microfractures with sizes of >50 μm, and the nano-scale pores are mostly intergranular micropores and intragranular dissolved pores with sizes of 5–100 nm. Moreover, the peak value of the type III samples is on the left, indicating that the micro-pores in this type of sample are well developed and the medium-large pores are less developed. The peak value of the type II samples is in the middle, indicating that the micro-pores and macro-pores are relatively well developed in this type of samples. The peak value of type I samples is on the right, indicating that the micro-pores in this type of sample are not developed and the macro-pores are more developed. The results indicate that the overall physical properties of the type I samples are the best, followed by the type II samples and type III samples, which is consistent with the above analysis. On the other hand, it should be noted that the nanopores are widely distributed in this area, and they play a certain role in oil and gas storage and seepage. However, it is difficult for a single pore type to connect, and this is not sufficient to form an effective flow channel. Therefore, the exploration of glutenite reservoirs should focus on submicron–micron pores and microfractures, which are abundant and can have an important impact on seepage.

3.5. Microscopic Heterogeneity Analysis of Tight Glutenite

3.5.1. Microscopic Heterogeneity of Matrix Mineral Distribution

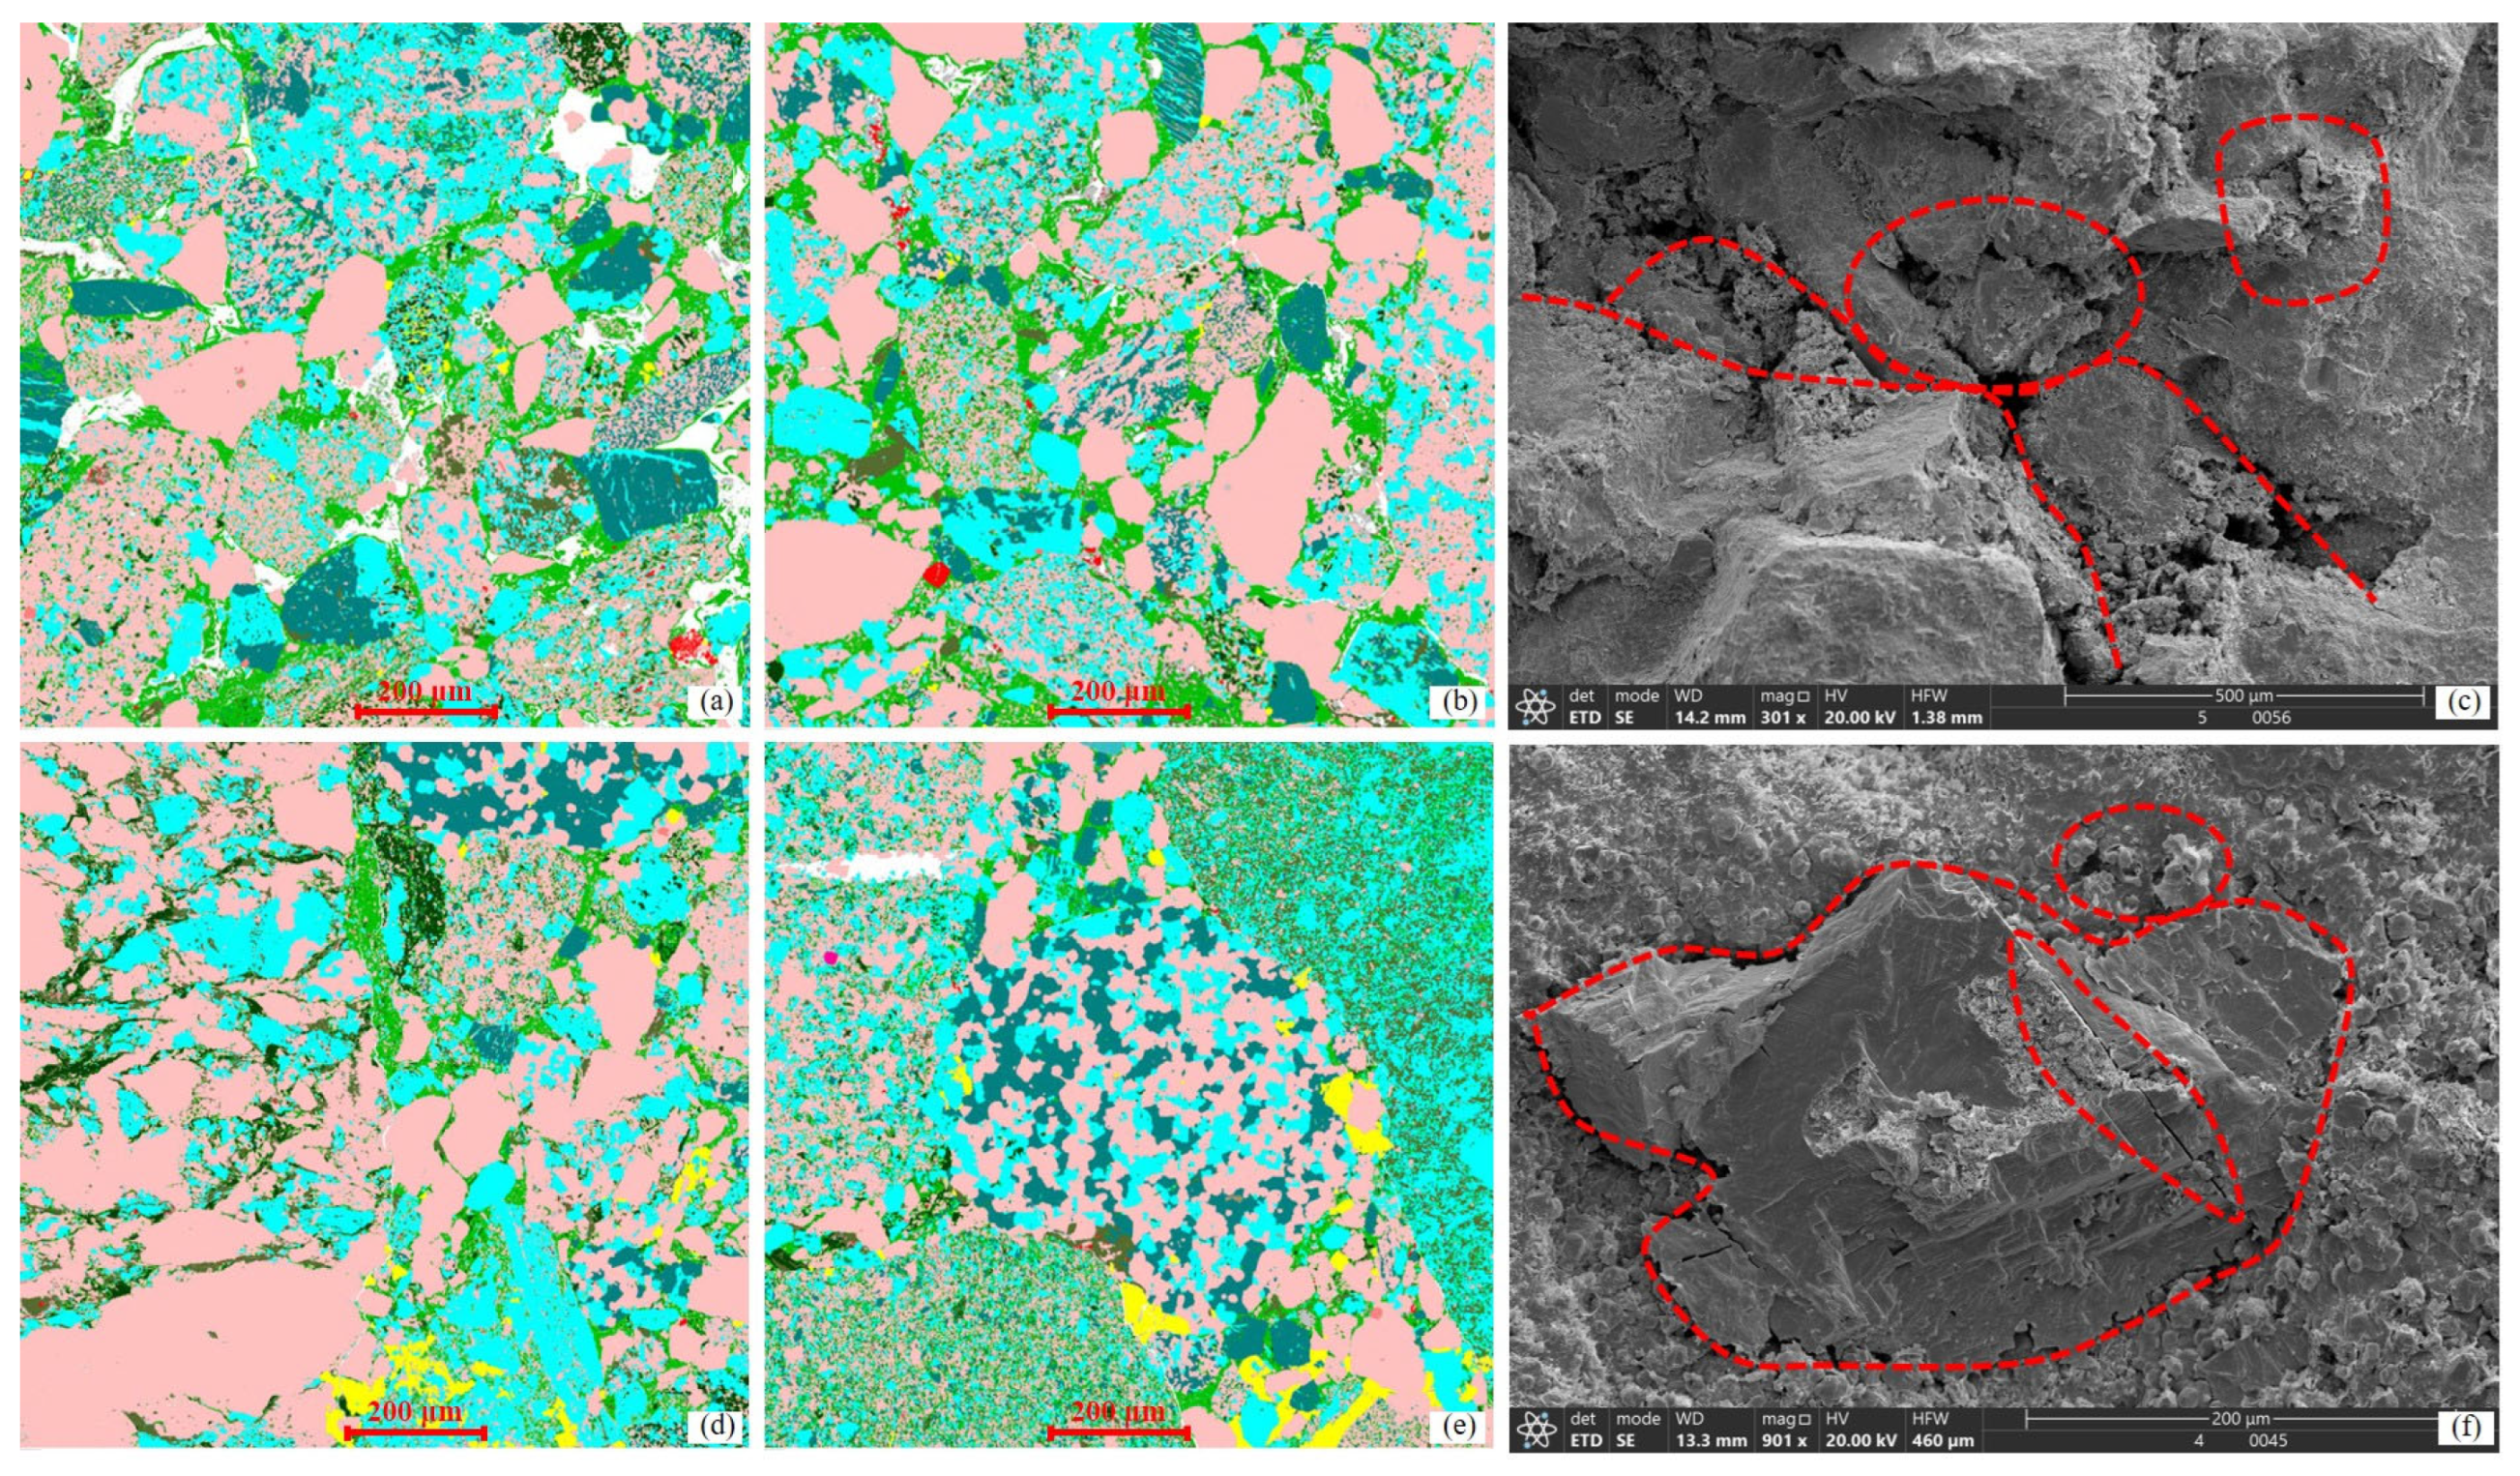
Based on the full-scale pore size distribution characteristics of the tight glutenite reservoir samples, the micro-heterogeneity of matrix mineral composition and its influence on the seepage of tight glutenite were studied by QEMSCAN mineral analysis system combined with MAPS technology. The results are presented in Figure 16 and Figure 17. Results indicated that the main mineral composition of the tight glutenite matrix in the study area is quartz, followed by albite, potassium feldspar, and illite, with a small amount of calcite, muscovite, apatite, and epidote (Figure 16). Specifically, quartz has a mineral composition that ranges from 36.32% to 54.52%, with an average of 45.42%. Albite mineral’s mass percentage varies from 19.71% to 28.19%, with an average of 23.95%. Potassium feldspar has a mineral content that varies from 4.33% to 10.94%, with an average of 7.64%. Illite’s mass percentage varies between 7.02% and 14.51%, with an average of 10.77%. Moreover, there are various types of nano-scale mineral intercrystalline pores in the tight matrix, and the scale is less than 1 μm. Its morphology comprises irregular small balls and narrow strips, mostly embedded in the surface layer of particle interstitials and mineral crystals, which may be related to the lack of mineral particle structure and dissolution effect. Moreover, the content of brittle minerals such as feldspar and calcite in the three types of samples is greater than that of clay, and there is a large space for fracturing. The content of intergranular pyrite is relatively high, and the proportion of macro-scale dissolution pores is relatively small. In general, the lithology and mineral composition distribution of the three types of glutenite samples has strong vertical and horizontal heterogeneity.
The analysis suggested that, under the high pressure of the overlying strata, the abnormally high pressure in the deep or ultra-deep strata will make it difficult to form effective pores, which will result in low reservoir porosity or failure to form effective reservoir space. However, the main body of the lower assemblage in the southern margin has found effective-scale reservoir space in strata deeper than 6000 m, which can be attributed to the mineral composition of the core. That is: (1) The content of rigid minerals in the core of the study area is high and the compaction resistance is strong. In particular, the content of quartz is about 45.42%, which means that quartz has strong compressive resistance and is conducive to protecting pores under the overlying ultra-high pressure. (2) Early cementation and strong compaction will destroy reservoir pore space, but the rich chlorite film can have an anti-compaction effect, which will help to preserve reservoir pores. (3) Under high temperature and ultra-high pressure reservoir conditions, the solubility of acidic fluids such as CO2 in pore fluids increases. Since the migration of acidic fluids promotes the dissolution of reservoir feldspar minerals, secondary pores can be formed, which helps to improve reservoir space. (4) Ultra-high pressure reservoirs generally have abnormally high pressure, which helps to slow down the increase in vertical effective stress, thereby protecting the pore structure of the reservoir [34], and the protective effect is positively correlated with the strength of abnormally high pressure.
Furthermore, due to the strong heterogeneity of the distribution of minerals such as rigid minerals and chlorite films in the reservoir, their effects on pores are different. It can be observed that some complex storage and migration spaces such as the intragranular dissolved pores and cement micropores in the core were not strongly compacted during the formation process (Figure 17b,c), and as a result, the micron-scale mineral particles are loosely cemented and water-sensitive clay minerals are distributed in the fractures. It can be deduced that under the action of water flooding, these mineral particles would dissolve or slip, and the contact relationship and arrangement of the mineral particles would change, easily blocking the nano-micron-scale pore throats [34,35]. Therefore, this water-sensitive phenomenon reduces the permeability of the core, and the argillaceous cemented minerals in the core mainly exhibit plastic deformation, which is difficult to effectively recover from.

3.5.2. Influence of Microscopic Heterogeneity on Seepage in Tight Glutenite

Previous research worldwide has reported that tight glutenite has poor physical properties and strong heterogeneity. Additionally, several researchers have conducted basic research on how the heterogeneity of microscopic pore throats affects the seepage process inside the core. The typical microscopic pore throat heterogeneity is shown in Figure 17c,f. The large-scale intergranular/intragranular pores and microfractures are widely developed in tight glutenite (red dashed line in Figure 17). Meanwhile, the micropores in the clay interstitials can play the role of throats in connecting pores (intergranular/intragranular pores) and microfractures, and as a result, these areas generally have better reservoir and seepage capacity. The injection fluid will tend to flow along these preferential channels, at the same time, when the main seepage channel is formed, new seepage channels will no longer formed; this is the microscopic heterogeneity caused by seepage heterogeneity. For deep ultra-high pressure and low-permeability glutenite, the influence of heterogeneity is more significant due to its fine pore throat and large seepage resistance. The correlation analysis results are in good accordance with those of previous studies [34,35,36,37].

4. Conclusions

In this study, the microscopic pore structure and its heterogeneity have been thoroughly investigated by performing an integration of XRD, CTS, SEM, HPMI, CSMI, X-CT, and QEMSCAN on a glutenite reservoir, which overcomes the pitfalls of using a single technique for pore structure characterization. This combination method provides new insights for studying the overall pore structure characteristics of similar reservoirs. The main conclusions of this study can be drawn as follows:
(1)
The mineral distribution and pore structure characteristics of tight glutenite reservoirs at the study site are significantly different. Based on the lithology and capillary pressure curve of the reservoir, three types can be distinguished: The wide and large pore throat and high reservoir quality are characteristics of type I reservoir samples. Type II and type III reservoir samples have medium and low pore throats, and moderate and poor reservoir qualities, respectively. As the permeability decreases, the average and median pore throat radius gradually decrease, which reflects the fact that the connected pores and macropores of tight glutenite play a critical role in seepage.
(2)
The various pore throat types and mineral distributions are due to the differences in compaction, dissolution, and cementation. The continuous sheet pores have good connectivity, which is related to the interconnection of primary intergranular pores and strip fractures, while the connectivity of isolated pores is significantly poorer, which is related to the development of intragranular dissolved pores and intercrystalline pores. This demonstrates the deterioration of physical properties and pore throat connectivity, reduced average pore radius, and decreased pore sorting as permeability decreases.
(3)
The pore throat scale ranges from nanometers to micrometers. They have a wide size range of between 5 nm to 80 μm, and predominantly exhibit Gaussian and bimodal distribution patterns. The effective pores were found to be attributed to the slowing effect of abnormally high pressure on the vertical stress, and the protective effect was positively correlated with the high pressure strength. Notably, the distribution of reservoir matrix minerals and the pore throat in the study block has strong microscopic heterogeneity. The stronger the heterogeneity of the tight glutenite reservoir, the more easily the injected fluid flows along the preferential seepage channel with pore development and connectivity.

Author Contributions

M.D.: Conceptualization, Experiment, Writing—original draft. Z.Y.: Investigation, Formal analysis. S.Y.: Conceptualization, methodology. C.F.: Investigation. G.W.: Investigation. N.J.: Funding acquisition. H.L.: Investigation. X.S.: Formal analysis, Writing—review and editing. All authors have read and agreed to the published version of the manuscript.

Funding

This work was supported by the Major scientific and technological research projects of China Petroleum “Study on the Seepage Law of Typical Low-Grade Oil Reservoirs and New Methods for Enhancing Oil Recovery” (2021DJ1102) and China Petroleum Science and Technology Major Project (2022kt1001).

Data Availability Statement

The data presented in this study are available on request from the corresponding author.

Acknowledgments

We are grateful to the editors and reviewers for their constructive comments and suggestions.

Conflicts of Interest

The authors declare no conflict of interest.

References

  1. Aguilera, R. Flow units: From conventional to tight-gas to shale-gas to tight-oil to shale-oil reservoirs. SPE Reserv. Eval. Eng. 2014, 17, 190–208. [Google Scholar] [CrossRef]
  2. Zou, C.; Zhang, G.; Yang, Z.; Tao, S.; Hou, L.; Zhu, R. Formation, distribution, potential and prediction of global conventional and unconventional hydrocarbon resources. Pet. Explor. Dev. 2015, 42, 13–25. [Google Scholar] [CrossRef]
  3. Wang, M.; He, J.; Liu, S.; Zeng, C.; Jia, S.; Nie, Z.; Wang, S.; Wang, W.; Zhang, C. Effect of Sedimentary Facies Characteristics on Deep Shale Gas Desserts: A Case from the Longmaxi Formation, South Sichuan Basin, China. Minerals 2023, 13, 476. [Google Scholar] [CrossRef]
  4. Hu, Z.; Zhang, R.; Zhu, K.; Li, D.; Jin, Y.; Guo, W.; Liu, X.; Zhang, X.; Zhang, Q. Probing the Pore Structure of the Berea Sandstone by Using X-ray Micro-CT in Combination with ImageJ Software. Minerals 2023, 13, 360. [Google Scholar] [CrossRef]
  5. Ahmad, S.; Ahmad, F.; Ullah, A. Integration of the outcrop and subsurface geochemical data, implications for the hydrocarbon source rock evaluation in the Lower Indus Basin, Pakistan. J. Pet. Explor. Prod. Technol. 2019, 9, 937–951. [Google Scholar] [CrossRef]
  6. Zhao, R.; Xue, H.; Lu, S.; Li, J.; Tian, S.; Wang, M.; Dong, Z. Multi-scale pore structure characterization of lacustrine shale and its coupling relationship with material composition, An integrated study of multiple experiments. Mar. Pet. Geol. 2022, 140, 105648. [Google Scholar] [CrossRef]
  7. Pang, X.; Jia, C.; Wang, W. Petroleum geology features and research developments of hydrocarbon accumulation in deep petroliferous basins. Pet. Sci. 2015, 12, 1–53. [Google Scholar] [CrossRef]
  8. Barabasch, J.; Schmatz, J.; Klaver, J.; Schwedt, A.; Klaver, J.; Urai, J. Large grain-size-dependent rheology contrasts of halite at low differential stress: Evidence from microstructural study of naturally deformed gneissic Zechstein 2 rock salt (Kristallbrockensalz) from the northern Netherlands. Solid Earth 2023, 14, 271–291. [Google Scholar] [CrossRef]
  9. Schmitt, M.; Fernandes, C.P.; Wolf, F.G.; Da Cunha Neto, J.A.B.; Rahner, C.P.; Dos Santos, V.S.S. Characterization of Brazilian tight gas sandstones relating permeability and angstrom-to micron-scale pore structures. J. Nat. Gas Sci. Eng. 2015, 27, 785–807. [Google Scholar] [CrossRef]
  10. Zhao, H.W.; Ning, Z.F.; Wang, Q.; Zhang, R.; Zhao, T.Y.; Niu, T.F.; Zeng, Y. Petrophysical characterization of tight oil reservoirs using pressure-controlled porosimetry combined with rate-controlled porosimetry. Fuel 2015, 154, 233–242. [Google Scholar] [CrossRef]
  11. Nelson, P.H. Pore-throat sizes in sandstones, tight sandstones, and shales. AAPG Bull. 2009, 93, 329–340. [Google Scholar] [CrossRef]
  12. Li, Y.; Zhao, Q.M.; Lyu, Q.; Xue, Z.J.; Cao, X.P.; Liu, Z.P. Evaluation technology and practice of continental shale oil development in China. Pet. Explor. Dev. 2022, 49, 1098–1109. [Google Scholar] [CrossRef]
  13. Afagwu, C.; Alafnan, S.; Mahmoud, M.; Akkutlu, Y.; Mahmoud, M. Modeling of natural gas self-diffusion in the micro-pores of organic-rich shales coupling sorption and geomechanical effects. J. Nat. Gas Sci. Eng. 2022, 106, 104757. [Google Scholar] [CrossRef]
  14. Clarkson, C.R.; Freeman, M.; He, L.; Agamalian, M.; Melnichenko, Y.; Mastalerz, M.; Bustin, R.; Radliński, A.; Blach, T. Characterization of tight gas reservoir pore structure using USANS/SANS and gas adsorption analysis. Fuel 2012, 95, 371–385. [Google Scholar] [CrossRef]
  15. Nooruddin, H.A.; Hossain, M.E.; Al-Yousef, H.; Okasha, T. Comparison of permeability models using mercury injection capillary pressure data on carbonate rock samples. J. Petrol. Sci. Eng. 2014, 121, 9–22. [Google Scholar] [CrossRef]
  16. Li, P.; Zheng, M.; Bi, H.; Wu, S.; Wang, X. Pore throat structure and fractal characteristics of tight oil sandstone: A case study in the Ordos Basin, China. J. Petrol. Sci. Eng. 2017, 149, 665–674. [Google Scholar] [CrossRef]
  17. Wang, P.; Nie, H.; Liu, Z.; Sun, C.; Cao, Z.; Wang, R.; Li, P. Differences in Pore Type and Pore Structure between Silurian Longmaxi Marine Shale and Jurassic Dongyuemiao Lacustrine Shale and Their Influence on Shale-Gas Enrichment. Minerals 2023, 13, 190. [Google Scholar] [CrossRef]
  18. Loucks, R.G.; Reed, R.M.; Ruppel, S.C.; Jarvie, D.M. Morphology, genesis, and distribution of nanometer-scale pores in siliceous mudstones of the Mississippian Barnett shale. J. Sediment. Res. 2009, 79, 848–861. [Google Scholar] [CrossRef]
  19. Lai, J.; Wang, G.; Cao, J.; Xiao, C.; Wang, S.; Pang, X.; Dai, Q.; He, Z.; Fan, X.; Yang, L. Investigation of pore structure and petrophysical property in tight sandstones. Mar. Petrol. Geol. 2018, 91, 179–189. [Google Scholar] [CrossRef]
  20. Li, Y.; Di, Q.; Hua, S. Visualization of foam migration characteristics and displacement mechanism in heterogeneous cores. Colloids Surf. A 2020, 607, 125336. [Google Scholar] [CrossRef]
  21. Wang, L.; Zhao, N.; Sima, L.; Meng, F.; Guo, Y. Pore structure characterization of the tight reservoir: Systematic integration of mercury injection and nuclear magnetic resonance. Energy Fuel 2018, 32, 7471–7484. [Google Scholar] [CrossRef]
  22. Wei, W.; Gao, Z.; Jiang, Z. The comparative study of shale pore structure between outcrop and core samples of Ziliujing Formation shale from the northeastern Sichuan Basin in China. Energy Rep. 2022, 8, 8618–8629. [Google Scholar] [CrossRef]
  23. Wennberg, O.; Ramalho, F.; Mafia, M.; Lapponi, F.; Chandler, A.; Cartesio, L.; Hunt, D. The characteristics of natural open fractures in acoustic borehole image logs from the pre-salt Barra Velha formation, Santos Basin, Brazil. J. Struct. Geol. 2023, 165, 104794. [Google Scholar] [CrossRef]
  24. Zhang, K.; Wang, Z.; Jiang, Y.; Wang, A.; Fan, C.; Xiang, B.; Zhou, N. Quantitative evaluation of the transporting capacity of unconformities: A Case Study from the Zhongguai Area, Junggar Basin, NW China. Mar. Pet. Geol. 2020, 114, 104199. [Google Scholar] [CrossRef]
  25. Forstner, S.; Laubach, S. Scale-dependent fracture networks. J. Struct. Geol. 2022, 165, 104748. [Google Scholar] [CrossRef]
  26. Wang, G.; Shen, J.; Chu, X.; Cao, C.; Jiang, C.; Zhou, X. Characterization and analysis of pores and fissures of high-rank coal based on CT three dimensional reconstruction. J. China Coal Soc. 2017, 42, 2074–2080. [Google Scholar] [CrossRef]
  27. Li, W.; Sun, W.; Tang, P.; Yan, T.; Li, Y. A method for rock fracture network characterization based on topological structure. Nat. Gas Ind. 2017, 37, 22–27. [Google Scholar] [CrossRef]
  28. Bera, B.; Mitra, S.K.; Vick, D. Understanding the micro structure of Berea Sandstone by the simultaneous use of micro-computed tomography (micro-CT) and focused ion beam-scanning electron microscopy (FIB-SEM). Micron 2010, 42, 412–418. [Google Scholar] [CrossRef]
  29. Golab, A.; Ward, C.R.; Permana, A.; Lennox, P.; Botha, P. High-resolution three-dimensional imaging of coal using microfocus X-ray computed tomography, with special reference to modes of mineral occurrence. Int. J. Coal Geol. 2013, 11, 97–108. [Google Scholar] [CrossRef]
  30. Lv, W.; Chen, S.; Gao, Y.; Kong, C.; Jia, N.; He, L.; Wang, R.; Li, J. Evaluating seepage radius of tight oil reservoir using digital core modeling approach. J. Pet. Sci. Eng. 2019, 178, 609–615. [Google Scholar] [CrossRef]
  31. Gasparrini, M.; Sassi, W. Natural sealed fractures in mudrocks: A case study tied to burial history from the Barnett Shale, Fort Worth Basin, Texas, USA. Mar. Pet. Geol. 2019, 55, 122–141. [Google Scholar] [CrossRef]
  32. Morad, S.; Al-Ramadan, K.; Ketzer, J. The impact of diagenesis on the heterogeneity of sandstone reservoirs: A review of the role of depositional facies and sequence stratigraphy. AAPG Bull. 2019, 94, 1267–1309. [Google Scholar] [CrossRef]
  33. Hasnan, H.K.; Sheppard, A.; Hassan, M.H.A.; Knackstedt, M.; Abdullah, W.H. Digital core analysis: Improved connectivity and permeability characterization of thin sandstone layers in heterolithic rocks. Mar. Pet. Geol. 2020, 120, 104549. [Google Scholar] [CrossRef]
  34. Zhao, L.; Chen, Y.; Ning, Z.; Fan, Z.; Wu, X.; Liu, L.; Chen, X. Stress sensitive experiments for abnormal overpressure carbonate reservoirs: A case from the Kenkiyak fractured-porous oil field in the littoral Caspian Basin. Pet. Explor. Dev. 2013, 40, 208–215. [Google Scholar] [CrossRef]
  35. Yang, Z.; Liu, X.; Li, H.; Lei, Q.; Luo, Y.; Wang, X. Analysis on the influencing factors of imbibition and the effect evaluation of imbibition in tight reservoirs. Pet. Explor. Dev. 2019, 46, 739–745. [Google Scholar] [CrossRef]
  36. Hu, J.; Sun, R.; Zhang, Y. Investigating the horizontal well performance under the combination of micro-fractures and dynamic capillary pressure in tight oil reservoirs. Fuel 2020, 269, 117375. [Google Scholar] [CrossRef]
  37. Li, P.; Gong, H.; Jiang, Z.; Zhang, F.; Liang, Z.; Wang, Z.; Wu, Y.; Shao, X. Characteristics and Influencing Factors of Multi-Scale Pore Structure Heterogeneity of Lacustrine Shale in the Gaoyou Sag, Eastern China. Minerals 2023, 13, 359. [Google Scholar] [CrossRef]
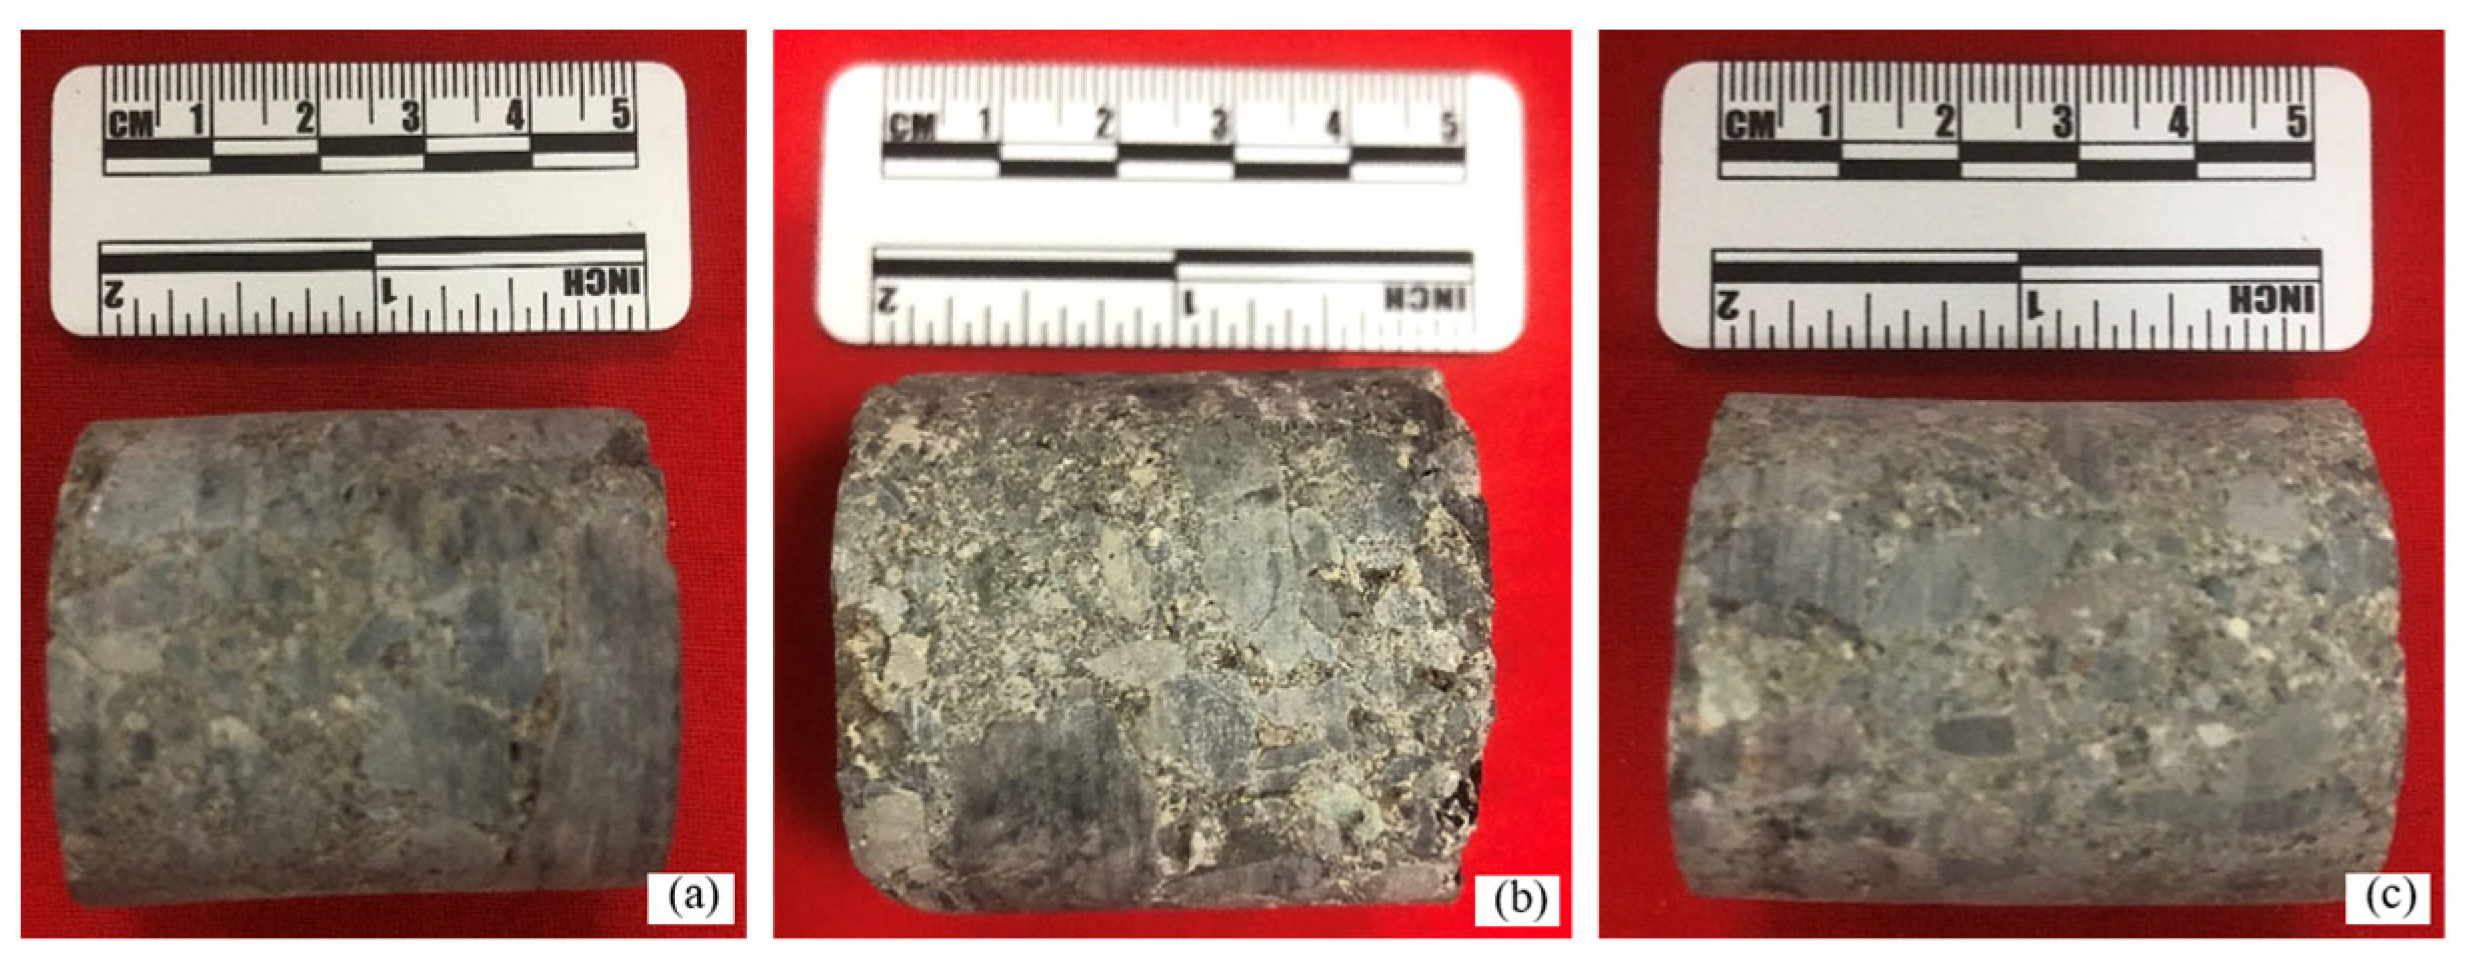
Figure 1. Core sample physical image. (a) Gritstone; (b) Fine conglomerate; (c) Medium conglomerate.
Minerals 13 00601 g001
Figure 2. Schematic diagram of CT scanning experimental system.
Minerals 13 00601 g002
Figure 3. The Intersection relationship between porosity and permeability.
Minerals 13 00601 g003
Figure 4. Pore types and rock thin section characteristics in CTS micrographs. (a) Clay and cryptocrystalline rock; (b) Calcareous calcite cementation; (c) Coarse quartz and debris, scale 0.5–1.6 mm; (d) Mudstone debris and igneous rock; (e) Fine–medium sand grade, scale 0.21–1.66 mm; (f) Altered volcanic ash; (g) Volcanic rock, tuff rock, and cryptocrystalline rock; (h) Obvious double crystals and deep alteration, gravel scale 3–20 mm; (i) Development of gravel fractures.
Minerals 13 00601 g004
Figure 5. Pore types, morphology and matrix mineral distribution characteristics. (a) Intergranular pore development; (b) Intergranular pores and dissolution intragranular pores; (c) Interstitial pores and matrix dissolution pores; (d) Intergranular pores and intercrystalline pores; (e) Intragranular pores and feldspar dissolution pores; (f) Intercrystalline pores.
Minerals 13 00601 g005
Figure 6. Capillary pressure curves of CSMI (a) and HPMI (b).
Minerals 13 00601 g006
Figure 7. The pore throat distribution (a) and permeability contributions (b) of different types of samples.
Minerals 13 00601 g007
Figure 8. CT scan 2D grayscale image. (a) Intergranular pores; (b) Intergranular dissolution pores and remaining intergranular pores; (c) Intragranular dissolution pores, strong heterogeneity; (d) Intergranular/ particle dissolution pores, strong heterogeneity; (e) Development of intragranular dissolved pores, mold pores, and microfractures.
Minerals 13 00601 g008
Figure 9. Proportion of different types of pores in tight glutenite samples.
Minerals 13 00601 g009
Figure 10. Noise reduction of CT images. (a) Before noise reduction; (b) After noise reduction.
Minerals 13 00601 g010
Figure 11. Human–computer interaction threshold segmentation. (a) The original 2D grayscale image; (b) Binary segmentation results (Black represents pores, and white represents rock matrix).
Minerals 13 00601 g011
Figure 12. The original 2D grayscale images of the samples C1 (a), C2 (e), X1 (i), Z1 (m), J1 (q). The reconstructed 3D grayscale images of the samples C1 (b), C2 (f), X1 (j), Z1 (n), J1 (r). The reconstructed binary digital core of the samples C1 (c), C2 (g), X1 (k), Z1 (o), J1 (s). The 3D pore-fracture spatial distribution extracted from the core matrix of the samples C1 (d), C2 (h), X1 (l), Z1 (p), J1 (t) (Notice that the matrix is transparent and the pores are blue, and the different colors represent different pore clusters).
Minerals 13 00601 g012
Figure 13. Pore-fracture network model of the sample C1 (a) The original 2D grayscale images. (b,c) The reconstruction process of the pore network model. (d) Pore network model. Notice that the balls in different diameters represent the pore, the blue tube bundles of different diameters correspond to the throats.
Minerals 13 00601 g013
Figure 14. Quantitative characterization of pore throat structural parameters. (a) Pore radius of three types of samples; (b) Throat radius of three types of samples; (c) Coordination number of three types of samples.
Minerals 13 00601 g014
Figure 15. Full-scale distribution curve of two types of samples.
Minerals 13 00601 g015
Figure 16. Mineral composition of different types of samples.
Minerals 13 00601 g016
Figure 17. Mineral distribution characteristics and microscopic pore throat heterogeneity of different types of samples. (a) Type I samples C1; (b) Type II samples X1; (c) Type I samples C1; (d) Type III samples Z1; (e,f) Type III samples Z2. Notice that the red dashed line represents the large-scale intergranular/intragranular pores and microfractures are widely developed.
Minerals 13 00601 g017
Table 1. Core sample information.
Sample TypeCore NumberDiameter (mm)Length (mm)Porosity (%)Permeability (mD)Mineral Mass Fraction (%)
QuartzPlagioclaseK-FeldsparCalciteAnkeriteSideriteMagnetiteClay Minerals
GritstoneC138.2348.217.15.8362.9724.4111.660.050.03000.88
C238.1549.327.86.5155.6526.6712.751.271.340.8701.45
Fine conglomerateX138.2748.377.32.1255.0826.9813.491.490.341.510.031.08
X238.1348.6710.11.0357.2324.2611.072.161.791.240.541.71
X338.1945.619.31.5076.2812.898.591.050.720.3800.09
X438.0249.379.11.6565.2819.859.630.381.960.720.142.04
Medium conglomerateZ138.1149.356.90.5968.3122.448.550.040.02000.64
Z238.0748.174.20.2873.9316.029.610.030.020.030.010.35
ShaleJ138.1349.857.30.0322.7451.899.370.187.080.990.037.72
Table 2. Experimental results of HPMI.
Sample TypeCore NumberAverage Pore Volume (10−3 cm3)Maximum Pore Throat Radius (μm)Average Pore Throat Radius (μm)Median Pore Throat Radius (μm)Mercury Saturation Median Pressure (MPa)Average Displacement Pressure (MPa)Starting Pressure (MPa)Maximum Mercury Saturation (%)Residual Mercury Saturation (%)Sorting Coefficient
GritstoneC112439.78142.3432.0010.3750.0770.01591.0671.182.025
Fine conglomerateX111441.41810.2920.3702.0250.5290.07388.2463.750.229
Medium conglomerateZ15980.23930.0660.0947.9893.1350.87485.2966.580.038
Table 3. Parameter table of pore throat structure.
Sample TypeCore
Number
Pore Characteristic ParametersThroat Characteristic Parameters
Minimum Pore Radius (μm)Maximum Pore Radius (μm)Average Pore Radius (μm)Pore Shape FactorMinimum Throat Radius (μm)Maximum Throat Radius (μm)Average Throat Radius (μm)Throat Shape FactorAverage Throat Length (μm)
GritstoneC11.9171.2640.090.03821.3549.1625.250.03823.69
GritstoneC21.8579.8141.870.03971.7349.8626.890.038173.72
Fine conglomerateX12.0163.3332.670.04031.4842.6122.050.03943.41
Medium conglomerateZ11.6356.2428.940.03971.2940.8321.060.03873.27
Disclaimer/Publisher’s Note: The statements, opinions and data contained in all publications are solely those of the individual author(s) and contributor(s) and not of MDPI and/or the editor(s). MDPI and/or the editor(s) disclaim responsibility for any injury to people or property resulting from any ideas, methods, instructions or products referred to in the content.