Article

A Toxicological Study of the Respirable Coal Mine Dust: Assessment of Different Dust Sources within the Same Mine

1
Department of Chemistry, New Mexico Institute of Mining and Technology, Socorro, NM 87801, USA
2
Department of Mineral Engineering, New Mexico Institute of Mining and Technology, Socorro, NM 87801, USA
3
College of Nursing, University of New Mexico-Health Sciences Center, Albuquerque, NM 87801, USA
4
Department of Energy and Mineral Engineering, The Pennsylvania State University, University Park, PA 16802, USA
*
Author to whom correspondence should be addressed.
Minerals 2023, 13(3), 433; https://doi.org/10.3390/min13030433
Submission received: 28 February 2023 / Revised: 14 March 2023 / Accepted: 17 March 2023 / Published: 18 March 2023
(This article belongs to the Special Issue Dust (Urban and Industrial) Medical Mineralogy and Geochemistry)

Abstract

:
Respirable coal mine dust (RCMD) exposure is one of the utmost health hazards to the mining community causing various health issues, including coal worker pneumoconiosis (CWP). Considering multiple potential sources of RCMD having different physicochemical properties within the same mine suggests a wide range of health impacts that have not yet been studied extensively. In this work, we investigate the toxicity of lab-created RCMD based on different sources: coal seam, rock dust, host floor, and host roof collected from the same mine. Comparative samples obtained from several mines situated in various geographic locations were also assessed. This work quantifies metal leaching in simulated lung fluids and correlates dissolution with in vitro immune responses. Here, dissolution experiments were conducted using two simulated lung fluids; Gamble solution (GS) and artificial lysosomal fluid (ALF). In vitro studies were performed using a lung epithelial cell line (A549) to investigate their immune responses and cell viability. Si and Al are the most dissolved metals, among several other trace metals, such as Fe, Sr, Ba, Pb, etc. RCMD from the coal seam and the rock dust showed the least metal leaching, while the floor and roof samples dissolved the most. Results from in vitro studies showed a prominent effect on cell viability for floor and roof dust samples suggesting high toxicity.

Graphical Abstract

1. Introduction

A major health risk to the mining industry is respirable coal mine dust (RCMD) [1,2,3]. Workers in coal mines are exposed to a significant amount of RCMD that has been released into the mine’s atmosphere as a result of different routine activities, such as cutting, drilling, blasting, and transportation [4,5,6,7]. Exposure to an elevated concentration of RCMD can lead to numerous diseases among coal workers and residential communities in close proximity. The diseases include silicosis, coal workers’ pneumoconiosis (CWP), mixed dust pneumoconiosis, dust-related diffuse fibrosis (DDF), progressive massive fibrosis (PMF), emphysema, and chronic bronchitis, all of which can be fatal in the worst- case scenario [5,8]. Although numerous work has been reported recently to limit exposure to RCMD, lung disorders brought on by RCMD still pose a serious threat to the coal mining industry. Early in the new millennium, it was discovered that CWP was becoming more common and severe [5,8,9].
According to its definition, RCMD is defined as airborne particulate matter with a particle size of less than 10 μm or having an average aerodynamic diameter of 4 μm [1,10,11,12,13,14]. Inhalation is the primary exposure method to RCMD [1]. While particles larger than 10 μm can be cleared to the gastrointestinal tract, particles smaller than 4 μm can pass through the nasal filtration system and reach the deep lung in the alveolar region [15,16]. There, they can deposit in two partitions of the lung: the acidic environment of the alveolar macrophages and the nearly neutral extracellular environment of the lungs’ interstitial fluid [17,18,19,20,21]. Despite the fact that numerous studies have clearly linked RCMD exposure levels and exposure times to the development of pneumoconiosis, many studies also imply that RCMD toxicity depends on multiple chemical and physical properties other than the concentration of RCMD [9,10,22,23,24,25,26,27,28]. Although the chemical and physical characteristics of RCMD are very much site-specific and may cause various toxicity levels, research into toxicity based on the source of RCMD is still quite limited [10,29].
Furthermore, numerous studies have linked the metal leaching capacity of dust particles, which may make it available for subsequent interactions with related body tissues and trigger inflammatory responses, to the toxicity of the dust particles [10,15,30]. Studies show that the amount of metal that might leach into physiological fluids depends on a number of physicochemical properties of the dust itself, including particle size and shape, mineralogy, and chemical composition [15,30,31,32]. The source of the dust, which controls many of the physicochemical characteristics of the dust, is therefore essential in establishing the toxicity of any particular dust. In our previous work on respirable coal mine dust samples, we reported toxicological impact based on geographical locations using mine dust from the Appalachians and the Rocky Mountains. Our results highlighted that RCMD from the Appalachians might pose a greater health risk due to its higher levels of silica and other toxic elements compared to dust from the Rocky Mountains region [10]. The current study focuses on the toxicity of respirable coal mine dust (RCMD) based on its ability to leach metals and the inflammatory response in connection to its particular sources. Here, metal leaching tests were carried out for the RCMD samples obtained from three different mines in simulated lung fluids (SLF), including Gamble solution (GS) and artificial lysosomal fluid (ALF), as well as in vitro reactions. Each mine’s coal seam, host floor, and host roof served as the sources for the RCMD samples since their physicochemical composition can vary, potentially producing various RCMD. Additionally, rock dust is used in underground coal mines to control the spreading of fire. These particles primarily consist of stable oxides, silicates, and carbonates, which can be another possible source of RCMD [33,34,35,36]. Further, the current study investigates RCMD produced from the rock dust gathered from each mine.

2. Materials and Methods

2.1. Dust Samples Collection and Preparation

Samples were collected from the coal seam, floor, roof, and rock dust within the same mine. Table 1 summarizes bulk sample information directly collected from the mine. During a shift, a miner inhales aerosolized materials. The bulk sample collection aimed to establish a representative collection of these substances. Coal samples were collected directly from the coal seam, while floor samples were taken from the mine floor. We also collected roof samples from the roof of the continuous machine and samples from rock dust. It should be noted that Mine 2 lacks a sample of rock dust due to that particular mine not having any.
The bulk sample was first reduced to smaller-sized particles using a jaw crusher or a mortar and pestle until it completely passed through the US standard sieve No. 6. (ASTM E11). The sample was then ground using media of zirconia 1/2″ × 1/2″ radius end cylinder, magnesia stabilized, in a 755RMV jar mill with 9.5 inches in diameter and 8.5 inches in height. To eliminate the large particles that the mill could not reduce, the material was first ground for 6 h and sieved using a USA standard sieve No. 120 (opening 125 μm). The material passing through the sieve was then pulverized for six more hours. The material was additionally crushed with a RETSCH XRD-Mill McCrone, which maintains the structure of the coal samples during the reduction process, in order to achieve a greater fraction of particles smaller than 10 μm. Using agate as the grinding medium, the operation was carried out in four steps over the course of five minutes. A next-generation cascade impactor (NGI, model 170 NGI, from MSP Corporation) with an attached aerosol generator and gravimetric stages were then used to separate the samples smaller than 10 μm fraction (mass mean aerodynamic diameter). A pump made by Copley Scientific that was set to flow at a flow rate of 60 L/min for 4 s was used to draw dust samples through an induction port after they had been weighed, loaded, and sealed inside hydroxypropyl methylcellulose capsules. The fractions smaller than 10 μm were gathered from various stages and used for future investigations.

2.2. Dust Characterization

The surface areas of the dust samples were determined using a 7-point N2 adsorption Brunauer–Emmet–Teller (BET) isotherm following outgassing at 150 °C for 16 h each. The particle size distributions of the dust samples were determined from the SEM images using the software package ImageJ. The mineral components of the dust sample were identified from the X-ray diffraction pattern collected using a PANalytical X’Pert Pro diffractometer (PANalytical B.V., Almelo, The Netherlands) equipped with a Cu Kα source.
The surface functional groups of the dust samples were determined using a Nicolet iS50 series FTIR coupled with a Ge-ATR crystal. The sample preparation for the FTIR-ATR analysis was done in a 2 mL centrifuge tube using ~10 mg of the dust samples and about 1 mL of isopropyl alcohol (IPA). The suspension of dust samples in IPA was then sonicated for 20 min and transferred to the ATR crystal using a Pasteur pipette, followed by overnight drying. FTIR spectra were collected using 250 scans at 4 cm−1 resolutions. The collected FTIR spectra were processed to the spectrum of bare crystal and only reported the processed spectra.
The elemental composition of metals in the dust samples was obtained using an inductively coupled plasma mass spectroscopy (ICP-MS, Agilent 7900) following the SK-PE-017 method. The microwave-based acid digestion method for coal samples was designed in two steps. In the first step, up to 200 mg of the dust samples is weighed and added to individual digestion tubes, followed by 10 mL of concentrated nitric acid. The microwave program we used was a 10-min ramp to 190 °C and held the temperature for 15 min with a 1200 W system power. In the second step, 2 mL of concentrated trace metal grade hydrofluoric acid was added, followed by a microwave program with a 20-min ramp to 230 °C and held for the next 15 min. A standard material CLB-1 from the USGS was used with each batch as a reference for the digestion method [37]. The digested samples were filtered and diluted to analyze using the ICP-MS.

2.3. Toxicological Assays

Toxicological assessments of the coal dust samples were performed using dissolution studies in simulated lung fluids in combination with in vitro studies using corresponding cell lines.

2.3.1. Batch Reactor Studies in Simulated Lung Fluids (SLFs)

Dissolution studies of the coal dust samples in simulated lung fluids (SLFs) were performed using a similar method described in our previous studies [10,15]. A custom-built glass reactor with a removable airtight top inside a dark room was used. Two simulated lung fluids, Gamble solution (GS) mimicking the interstitial lung environment and artificial lysosomal fluid (ALF) mimicking the acidic environment inside macrophages, were used to study the metal leaching from the coal dust. We used a dust loading of ~20 mg in 100 mL of the SLFs. Before adding the dust, SLFs were purged with oxygen to maintain an oxygenated environment. The reaction vessels were equipped with a heated water jacket to control the temperature at 37 °C with continuous mixing using a magnetic stirrer. During the reaction, a suspension aliquot of 1.5 mL was collected periodically using a disposable syringe connected to a 12 cm-long Teflon tube. The collected samples were centrifuged, filtered, and stored in the fridge. Then the collected samples were subjected to ICP-MS analysis to determine the dissolved metal concentration. All these dissolution experiments were performed in triplicate and reported only the average dissolved metal concentration with one standard deviation.

2.3.2. Cell Viability Assay

A549 is a human lung carcinoma epithelial cell line obtained from American Type Culture Collection (ATCC). These cells were cultured with Dulbecco’s modified Eagle’s medium (DMEM) with L-glutamine and supplemented with 10% fetal bovine serum. The cells were maintained in a 37 °C humidified atmosphere of 95% air and 5% CO2. The coal dust samples were first autoclaved and then suspended in the cell culture media. Before use, coal dust suspension was sonicated for 20 min.
When there was enough growth of cells, the media was aspirated and washed the cells with phosphate buffer solution (PBS). PBS was also aspirated, and Trypsin-EDTA solution was added to the flask and incubated for 8 min. After all the cells started to float, the media was added to inactivate the trypsin. The cells were counted by preparing a mixture of trypan blue and cell media of 1:1 using a cell counter. We prepared 20 mL cell-media mixture such that the concentration of cells became 20,000/mL. This was mixed well, and 100 µL was introduced in each well of the 96-well plate. They were allowed to adhere overnight inside the incubator. After 24 h, the media was changed, and the cells were treated with coal dust suspension to make the final concentration of 25, 50, and 100 µg/mL. 10 µg/mL of polyarsine oxide (PAO) was used as the positive control, and for the negative control, cells were kept untreated. The cells were then incubated for 48 h and treated with 20 µL of MTT solution (5 mg/mL) without removing the media. It was again incubated, and after 2 h, when the crystals formed, the supernatant solution was removed. The crystals were dissolved in DMSO by mixing with a multichannel micropipette. The absorbance was measured at 490 nm using a microplate reader.

2.3.3. In Vitro Immune Response and Inflammation Studies

A549 cells were monitored for confluence and appropriately passaged periodically. A549 were seeded at 2.0 × 10⁵ cells per well in 24 well plates. For mine dust in vitro exposures, cells were exposed to a low (10 µg/mL) and high (100 µg/mL) concentration of RCMD. Each of these cell lines were exposed to dust for 4 h, and each dust-treatment was run in either duplicate or triplicate technical replicates. Supernatants were then collected for further analysis.
Proinflammatory Panel 1 (Human) Kit V-Plex (K15049D-1, Meso Scale Diagnostics, Rockville, MD, USA) was used to assess cytokine expression in the A549 cells from dust exposures. The following cytokines were evaluated: IFN-γ, IL-1β, IL-2, IL-4, IL-6, IL-8, IL-10, IL-12p70, IL-13, and TNF-α. Briefly, the supernatant was collected and pipetted onto plates. These plates were incubated with gentle shaking for 2 h at room temperature. Plates were washed three times with buffer solution. Detection antibodies were added to the wells and reacted at room temperature for 1 h. Read buffer was added to each well, and plates were analyzed on an Meso Scale Discovery QuickPlex SQ instrument (Meso Scale Diagnostics, Rockville, MD, USA). Discovery Workbench software was used to calculate cytokine concentrations based on each cytokine standard curve. Change in protein expression was evaluated by the following, log (exposed cell concentration/control) and plotted according to each dust sample.

2.4. Standards and Chemicals

All chemicals used for this study were reagent grade or better, and standards were used as received. The standard material CLB-1 from USGS was used as a reference during the elemental analysis. All the chemicals used in this study are listed in the following sections.

2.4.1. Materials Used for Dissolution Study

Both Gamble solution (GS) and artificial lysosomal fluid (ALF) for the dissolution study were prepared using the method discussed in previous studies [10,15,38]. All solutions were prepared in purified water (18.2 MΩ, Milli-Q-A10). The following chemicals were used for the media preparation. Sodium chloride (NaCl, Acros, Geel, Belgium, +99.0%), Disodium hydrogen phosphate (Na2HPO4, Sigma-Aldrich, St. Louis, MO, USA, +99.0%), Sodium bicarbonate (NaHCO3, Sigma, 99.5%), Trisodium citrate dihydrate (C6H5Na3O7·2H2O, Sigma-Aldrich, +99%), Ammonium chloride (NH4Cl, VWR International, 99.5%), Glycine (NH2CH2COOH, Aldrich Chemical Company, +99%), Sodium dihydrogen phosphate (NaH2PO4, Sigma-Aldrich, +99.0%), L-cysteine (C3H7NO2S, Aldrich Chemical Company, 99%), Sodium hydroxide (NaOH, VWR International, Radnor, PA, USA, 97%), Citric acid monohydrate (C6H8O7·H2O, Fluka Analytical, St. Gallen, Switzerland, +99%), Calcium chloride dihydrate (CaCl2·2H2O, Fisher Scientific, Waltham, MA, USA, +99%), Sodium sulfate (Na2SO4, Sigma-Aldrich, +99%), Magnesium chloride hexahydrate (MgCl2·6H2O, Sigma-Aldrich, +99%), Disodium tartrate dihydrate (C4H4Na2O6·2H2O, Honeywell Riedel–de Haen, Seelze, Germany, 99.5%), Sodium L-lactate (C3H5NaO3, Sigma, 98%), Sodium pyruvate (C3H3NaO3, Sigma-Aldrich, +99%).

2.4.2. Materials Used for In Vitro Study

The following chemicals were used for the MTT assays and the media preparation. Dulbecco’s Modified Eagle’s Medium (DMEM) with L-Glutamine (Quality Biological, VWR), Fetal Bovine Serum (Avantor Seradigm, VWR), 0.25% Trypsin-EDTA 1X (Gibco, VWR), Dulbecco’s Phosphate Buffered Saline 1X without Calcium & Magnesium (Quality Biological, VWR), Trypan blue stain 0.4% (Invitrogen, Thermo-Fischer Scientific), 96-well tissue culture plate (Avantor, VWR), Dimethyl sulfoxide 99.9% (VWR life science, VWR), phenylarsine oxide (Spectrum chemical, VWR), 3-(4,5-Dimethylthiazol-2-yl)-2,5-diphenyltetrazolium bromide (MTT) 98% (VWR life science, VWR).

3. Results and Discussion

3.1. Physicochemical Characteristics

The shape and size distribution of the dust particles were analyzed using SEM images. A representation of the SEM images is illustrated in Figure 1. These confirm the particles’ irregular shape and micron-to-submicron size distribution. More than 400 particles were measured using the ImageJ software program for each sample to generate the particle size distribution. Figure S1 in Supporting Information and Table 2 report the size distributions, showing particles with an average size of 1.55 to 3.80 μm. Additionally, we estimated the PM10 and PM4 fractions. The results indicated that nearly all of the particles were PM10 and that more than 60% were PM4, which can be as high as 98% for some samples.
As expected, quartz was found to be a mineral common in all the samples, per the XRD data shown in Table 3. All the samples, except Mine 2_floor and rock dust, also contained kaolinite. Other minerals common among several samples were pyrite, muscovite, and calcite. There were trace levels of chlorite and dolomite, while siderite was identified in the Mine 1_Roof. Only Mine 1_Floor sample contained illite and microcline. It is also vital to be aware that the instrument’s detection range is only 1 to 2%, meaning that any minerals with lower abundances than this range were not reported in this work. The surface areas of the samples were determined using a 7-point N2 adsorption isotherm and reported in Table S1 in Supporting Information. Despite having a similar size distribution, the coal dust samples from various sources showed a broad range of specific surface areas, from 4.10 m2/g to 39.85 m2/g. Particularly, samples from the coal seam and rock dust tend to have lower surface areas than the floor and roof dust samples.
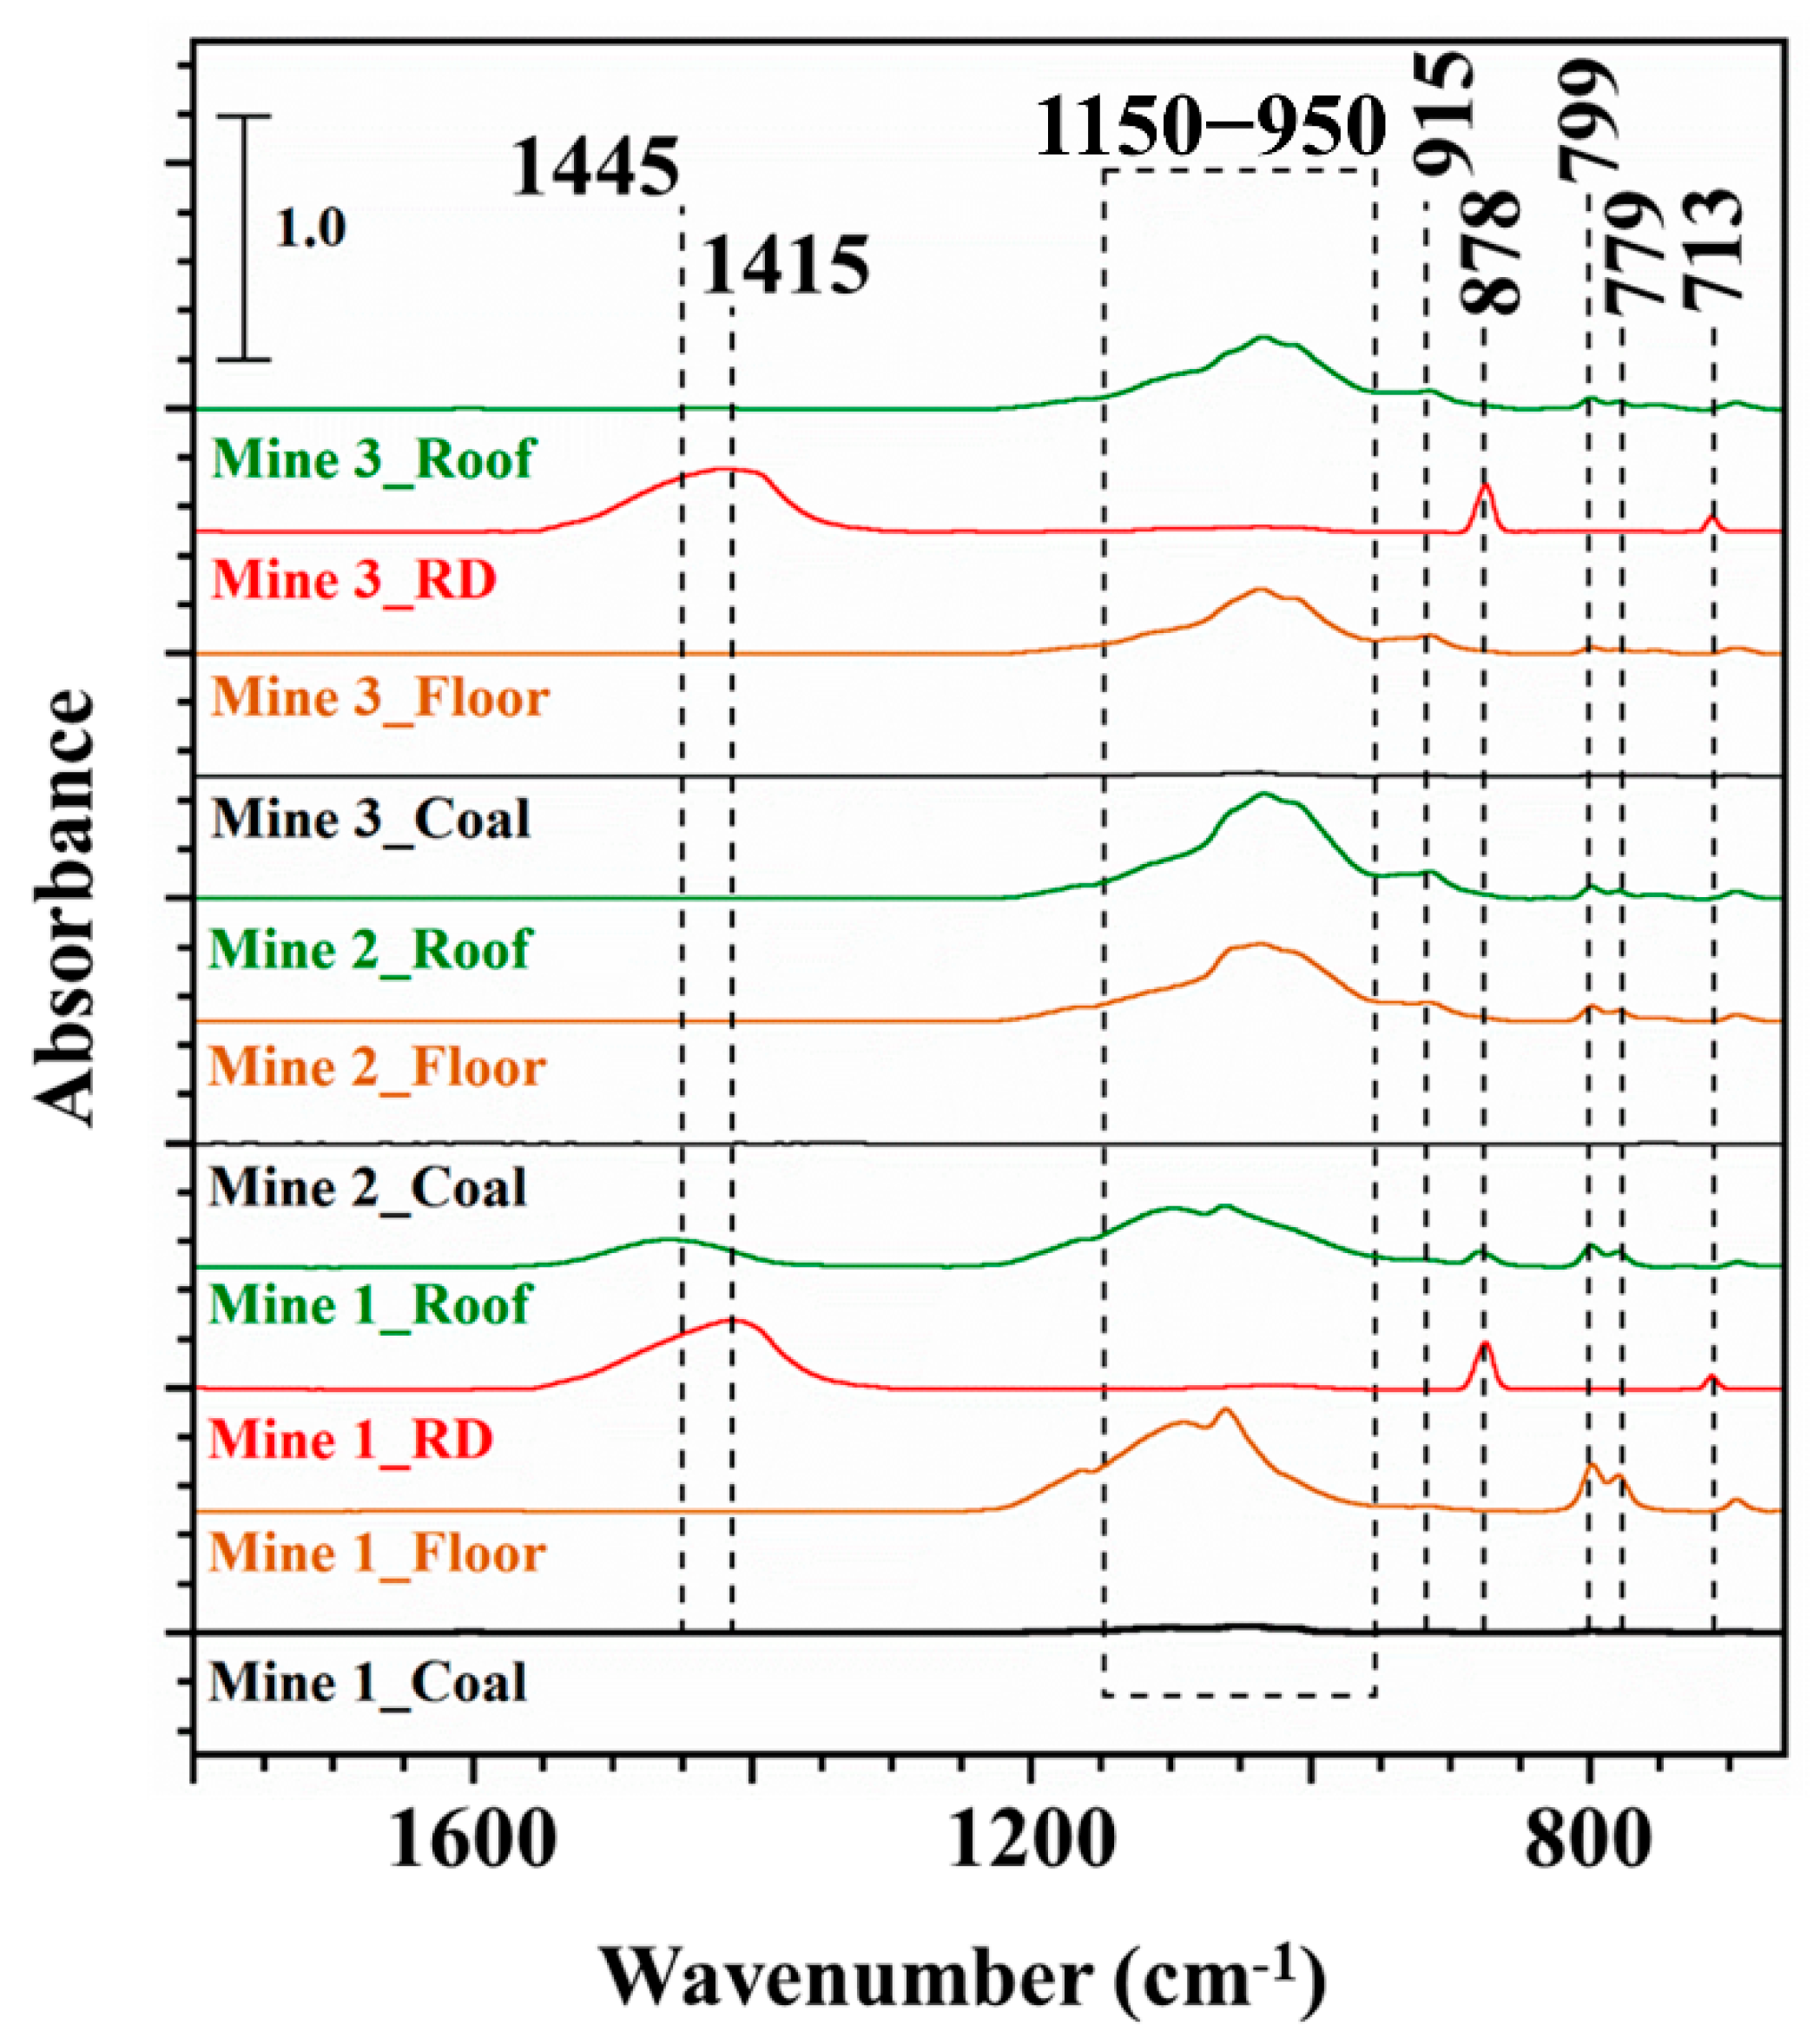
Additionally, the surface functional groups were identified using the FTIR spectra and reported in Figure 2, with the peak assignments presented in Table S2. The doublet at 799 and 779 cm−1 corresponds to the symmetric stretching of the Si-O-Si in representing the presence of low temperature quartz in all the samples, which agrees with the findings from the XRD data [39]. Further, a peak at 878 cm−1 corresponds to C-O bonds in carbonate, which is present only for the rock dust samples. Further, it is also evident that spectra of rock dust samples have peaks at 713 and 1415 cm−1, likely due to the N-H bending and stretching for the nitrates, respectively [39]. The small peak at 915 cm−1 represents the presence of kaolinite, a common clay mineral in the samples. Further, the absorption band at 950 to 1150 cm−1 represents the oxygen-containing functional groups such as S=O, Si-O-Si, Si-O-C, which is most apparent for the samples gathered from the floor or roof. Further, the peak at 1445 cm−1 is also not prominent for most of the samples, indicating the presence of an aliphatic –CH3 functional group [39]. It is also important to note that the samples collected from the coal seam tend to have the least functional groups on the surface.
Our results for the elemental analyses are shown in Table S3 in Supporting Information. In total, 30 elements were examined in each sample, but only those that showed signs of dissolution in the lung fluids were reported. The data for the quality control sample SRM-CLB 1 presented here is an average of five trials, and for the majority of measurements, the error was within the permitted range previously reported [37]. The elemental composition of dust indicates that Si, Al, and Fe were the main components, along with other trace metals such as Cr, Sr, Ba, and Pb. Furthermore, dust collected from the floor or roof of all three mines contains more silicon than coal seams or rock dust. Further, our results highlighted that roof and floor dust had more iron content than the other two types.

3.2. Metal Leaching in Simulated Lung Fluids (SLFs)

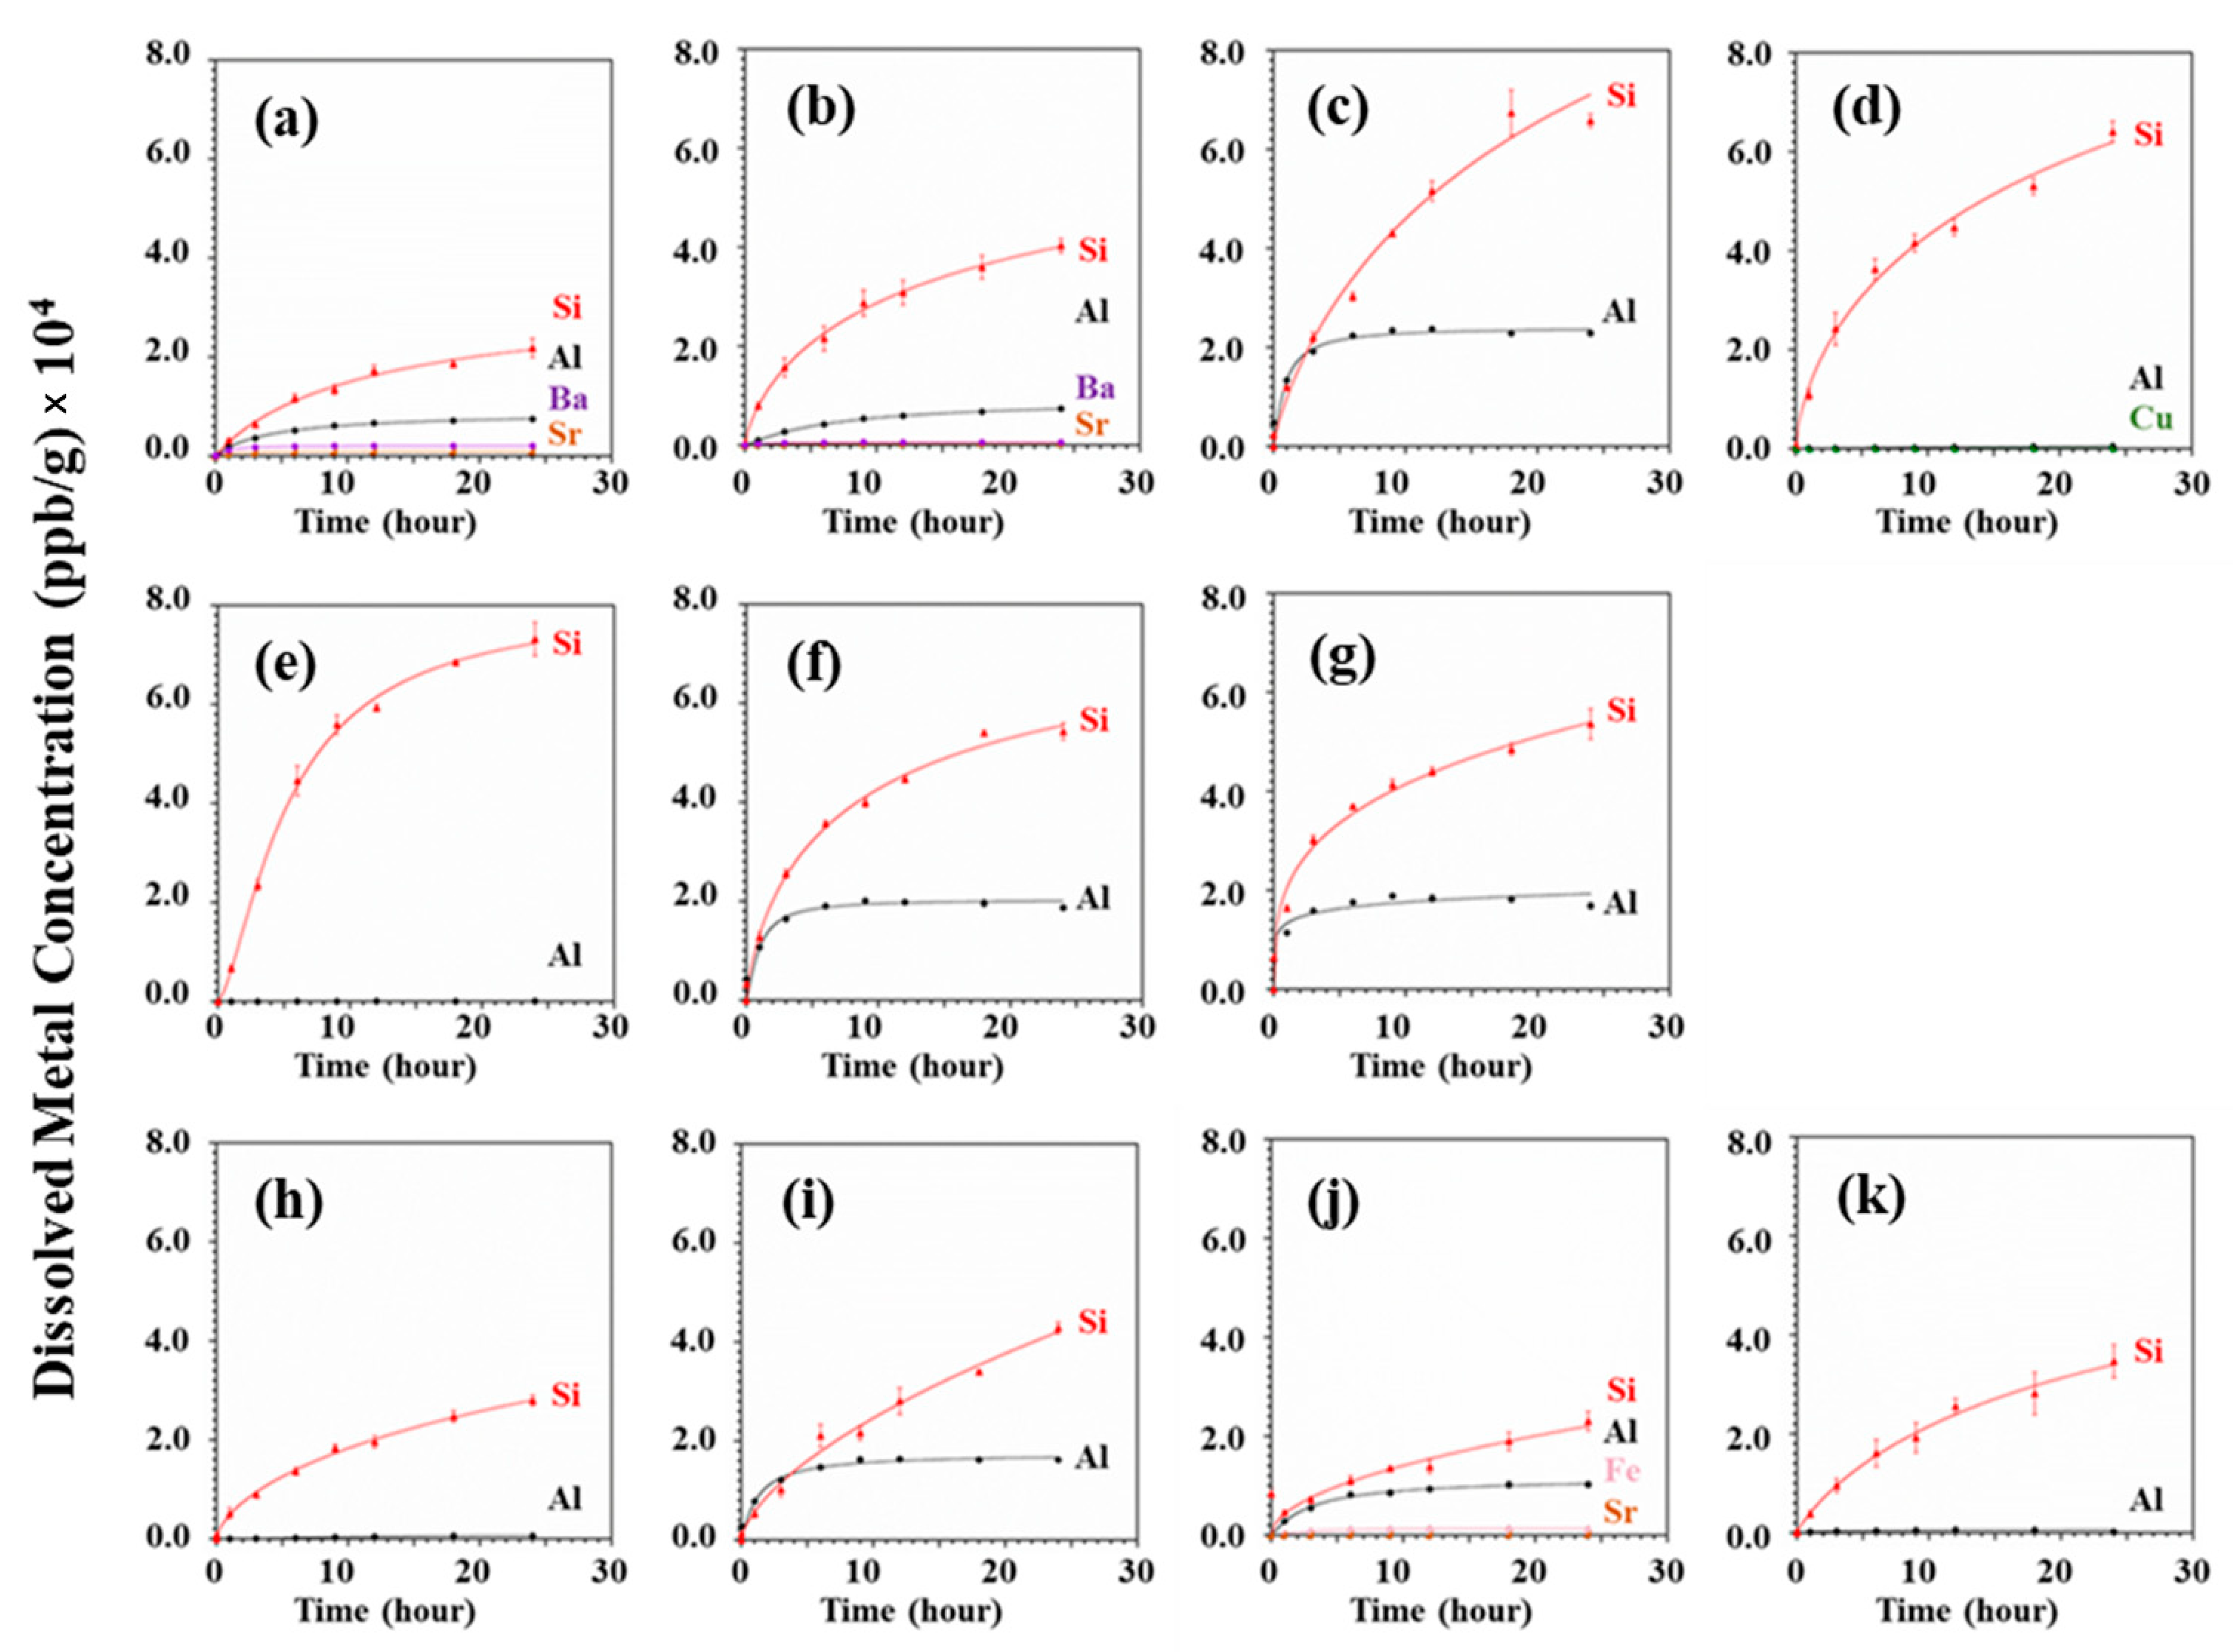
We carried out dissolution experiments for all the lab-created coal mine dust samples in Gamble solution (GS) and artificial lysosomal fluid (ALF). The mass-normalized amounts of dissolved metals in GS are shown in Figure 3, while those in ALF are shown in Figure 4. Si was the most dissolved element in GS from all the samples, while Al was also significantly dissolved in most instances. For the most part, all other metals did not disintegrate. However, in addition to Al and Si, mass normalized dissolution in ALF reveals a significant concentration for metals such as Fe, Cu, Sr, Mn, Ba, and Pb. The slightly more acidic pH of the ALF media, which supports the proton-promoted metal leaching, is likely to blame for the higher dissolution of all metals except Si in ALF [10,40]. Quartz (SiO2), an acidic oxide that tends to dissolve more in basic solutions, may account for a sizeable portion of the Si, causing a higher dissolution in GS [41]. As a result, the pH of Gamble solution, which is slightly alkaline (pH–7.3), favors the dissolving of Si, making it potentially bio-accessible. However, as demonstrated in Table 4, the extent of metal dissolution in each solution is not only influenced by the solution pH. It is evident that four samples taken from the same mine show differences in the metal leaching in the same dissolution medium. Additionally, samples taken from similar locations but from different mines show noticeable differences in metal dissolution. Remarkably, most of the samples from the floor and roof exhibit greater mass-based dissolution than those from the coal seam and the rock dust. Characterization data indicate that this pattern can be due to dust from floors and roofs having a larger surface area than dust from coal seams and rock dust. Hence, the floor and roof dust can potentially be more hazardous than the coal and rock dust on a mass basis because of their higher specific surface area, even though sample preparation was carried out under the same conditions for all samples.
All dissolved amounts were normalized to the respective surface area of the dust sample to explore the effects beyond particle size and surface area impact. The GS and ALF surface area normalized dissolved metal concentrations are illustrated in Figures S2 and S3, respectively, in the Supporting Information. After surface area normalization, the data reveal that the dissolution extents still vary significantly between samples, even in the same dissolving media (Table S4). These results highlight that the mineralogy, composition, and accessible elemental concentrations in the particular sample play a vital role in metal leaching. Thus, we normalized the dissolution data to the respective percentage elemental content in the fresh dust sample.
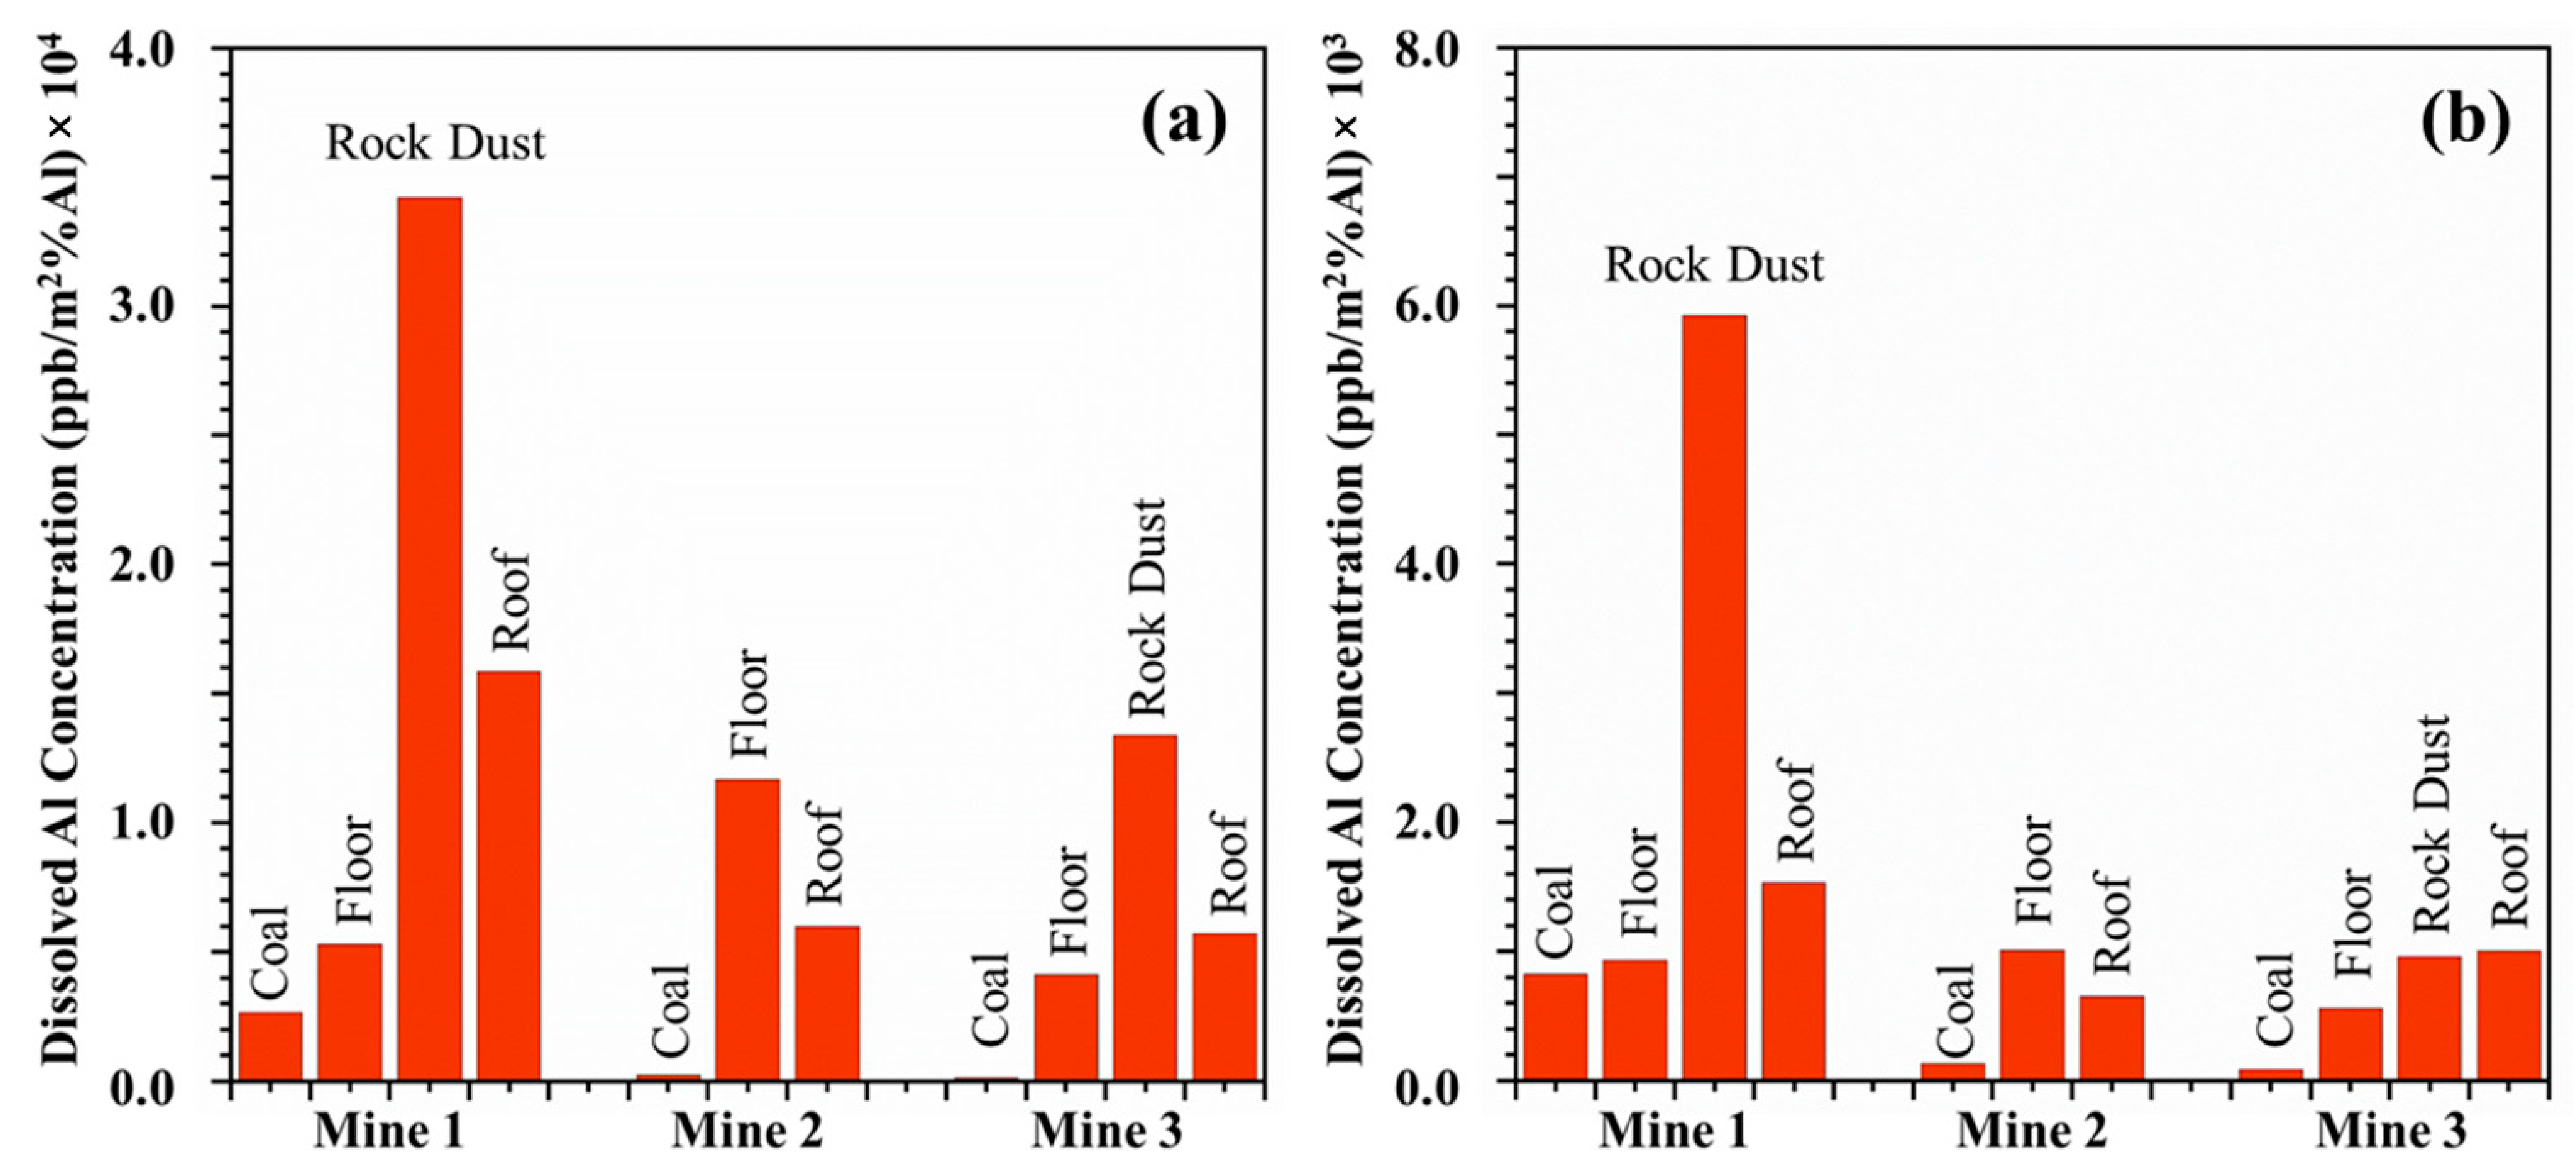
Al dissolution in both ALF and GS, normalized to %Al, is shown in Figure 5. The figure summarizes the dissolved metal concentrations for all the samples following a 24-h experiment on metal dissolution. The Al concentration in ALF, Figure 5a, reveals that the dissolution extents of all the samples vary significantly between the samples from the same mine. The extent of Al dissolution varies as follows: For Mines 1 and 3: rock dust > roof > floor > coal dust. The order for Mine 2 is floor > roof > coal. In GS, dissolution extent occurs in the same order as shown in Figure 5b. It is also crucial to remember that after all the normalization, identical samples from three distinct mines leached out varying amounts of aluminum in both ALF and GS media. Variable Al dissolving extent followed by complete normalization can be attributed to the sample’s unique physicochemical characteristics, which will be described further in this section.
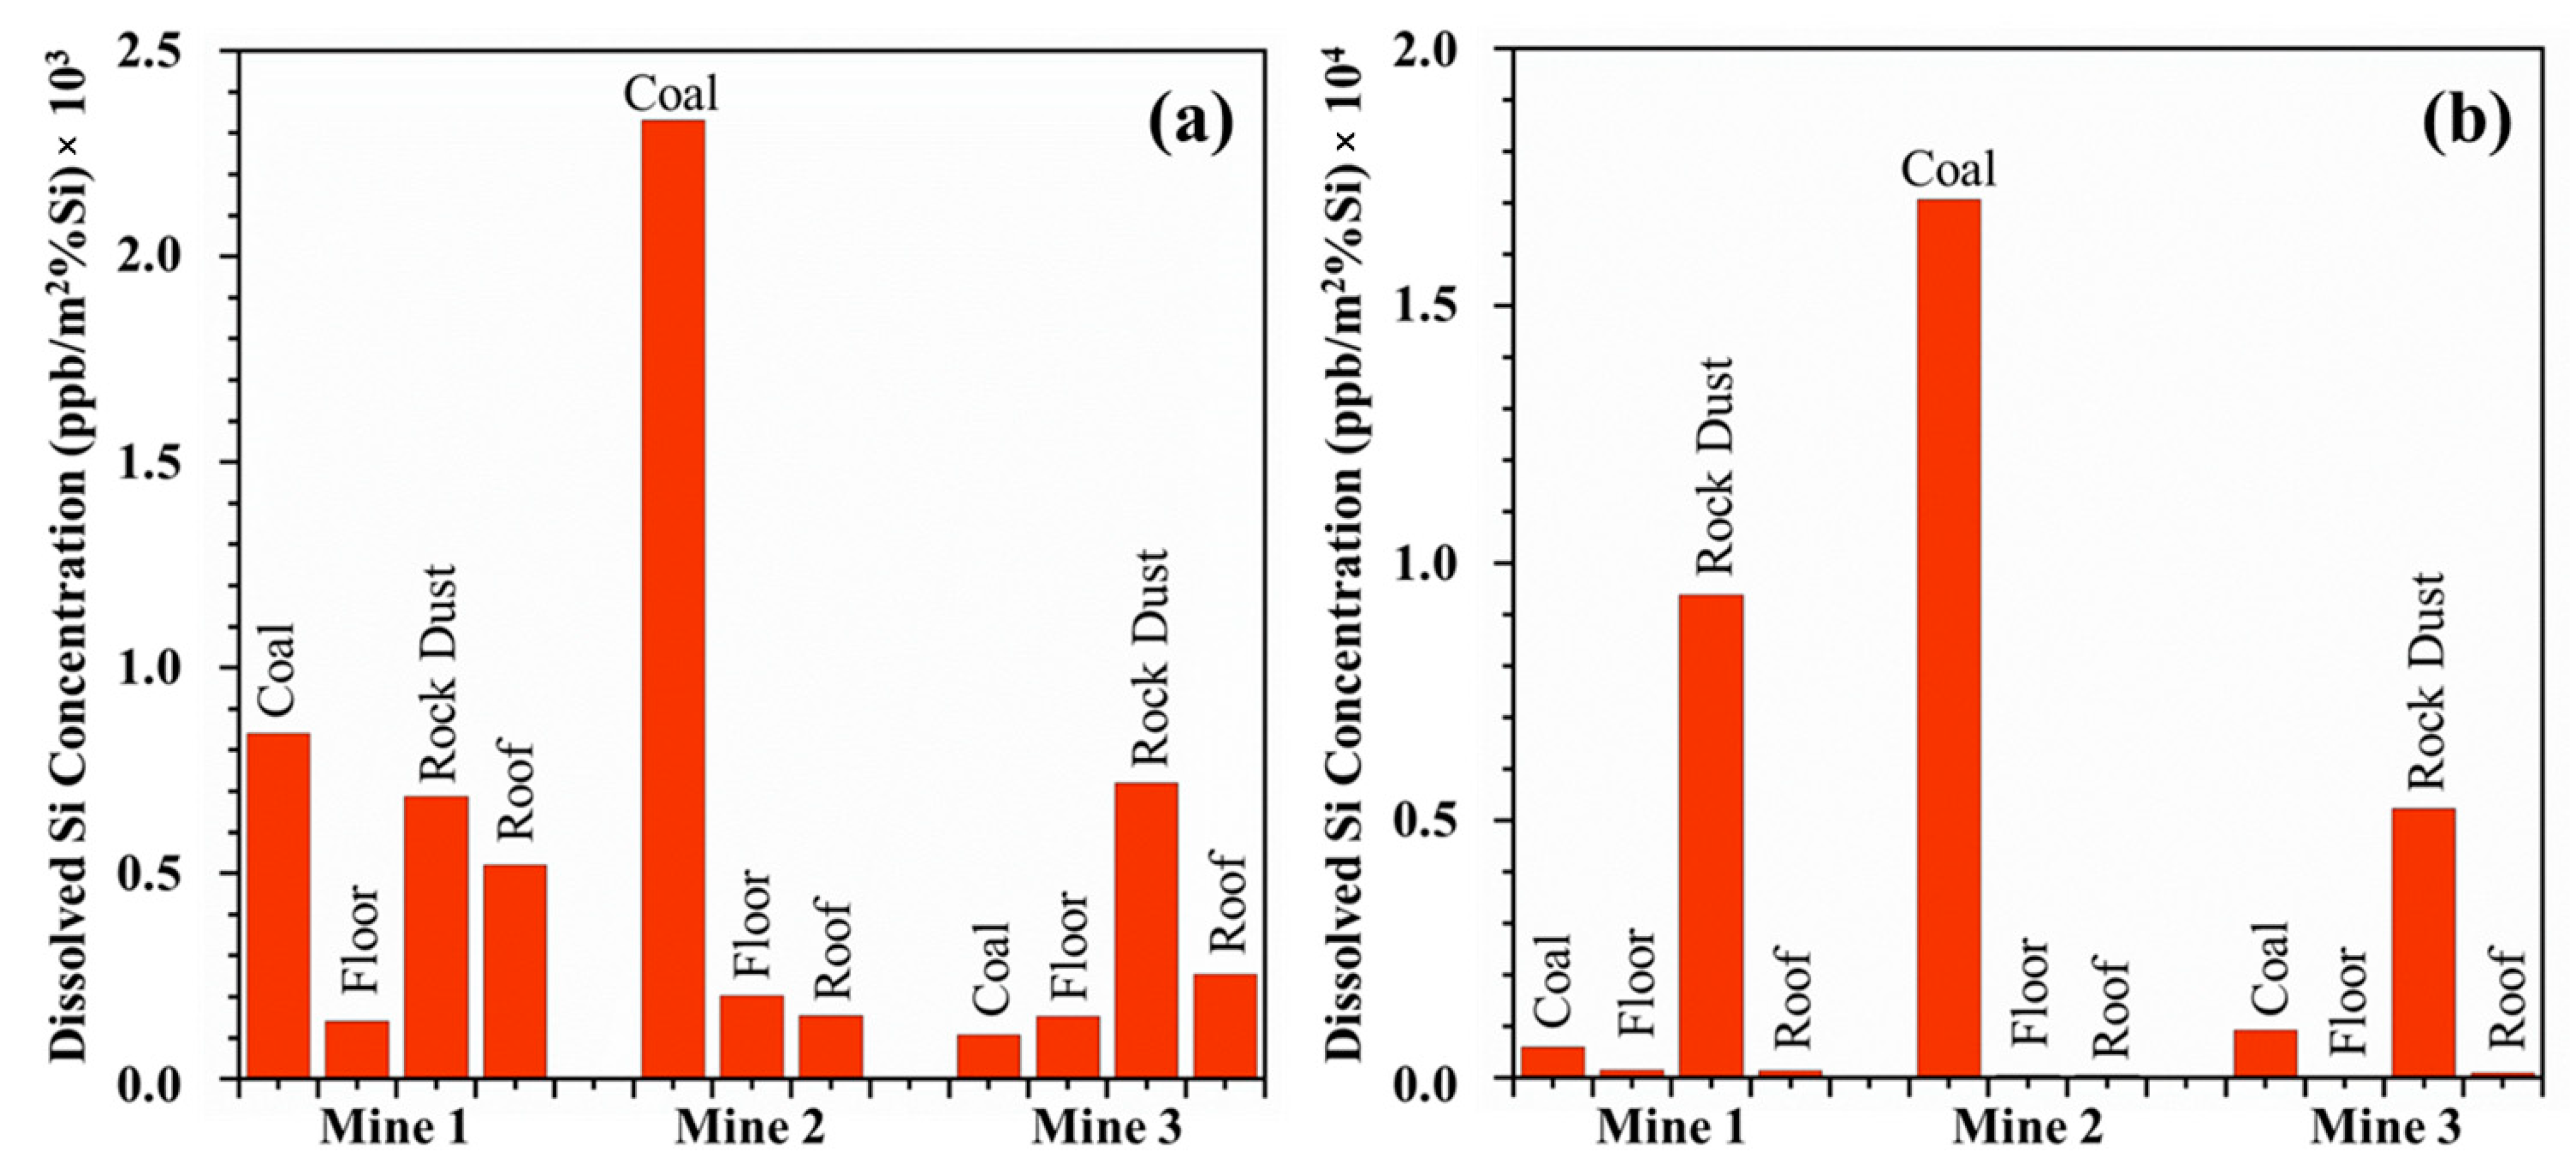
Figure 6 represents the %Si normalized dissolved Si concentration at the end of the dissolution experiment in ALF and in GS. It is evident that all the dust from the same mine has visible differences in Si leaching and that dust from similar sources from three different mines varies in Si leaching following all the normalization. However, as previously mentioned, having higher dissolution in GS, Si leaching capability comparison between samples would be more accurate for the dissolution in GS. The order of the leaching of Si in the GS is as follows: rock dust > coal > roof > floor. Floor and roof dust have very little disintegration.
Iron is another metal that displayed some degree of disintegration in ALF. Since there was no appreciable dissolution of Fe in GS, Fe dissolution is normalized only for the dissolution in ALF and illustrated in Figure 7. Our results highlight that Fe dissolving from the same sources and different mines still exhibit significant differences even after removing their variations in particle size, surface area, and %iron content in the fresh dust. Given that little or no dissolution was observed for other elements, no further normalization was performed for them.
The dissolution experiment thus revealed that Si, Al, and Fe were the primary components that dissolved from the dust samples when they came into contact with the SLFs. The samples from the same mine from various sources, such as coal seams, rock dust, floor dust, and roof dust, show noticeable differences in the leaching of metals. The amount of dissolved metals in the same bodily fluid varies when similar sample types are taken from different mines. These variations in dissolution, followed by the entire process of normalization, may be correlated to the mineralogy of the sample and its chemical composition. The XRD data in Table 3 indicate considerable differences in the mineral components of the samples taken from the same mine. Even the dust collected from comparable sources in three different mines contains a variety of minerals. For instance, the coal dust from Mine 1 only contained quartz and kaolinite, whereas the coal from Mine 2 showed pyrites and calcite, and the coal from Mine 3 contained muscovite, calcite, and dolomite. Additionally, it was found that the rock dust from Mine 1 contained quartz, chlorite, calcite, and dolomite, whereas Mine 3 had just quartz and calcite. Similarly, no other sample has the same mineral phases, whether from the same mine or another. The composition of minerals reveals no two samples have the same composition. As a primary contributing factor to metal leaching, mineralogy and composition have been identified previously [15]. While the sources from which dust is produced and its surroundings largely determine its mineralogy and composition, it is crucial to consider source-specific physicochemical features when evaluating dust-related toxicity rather than generalizing it.

3.3. In Vitro Studies on Cell Viability and Immuno Responses

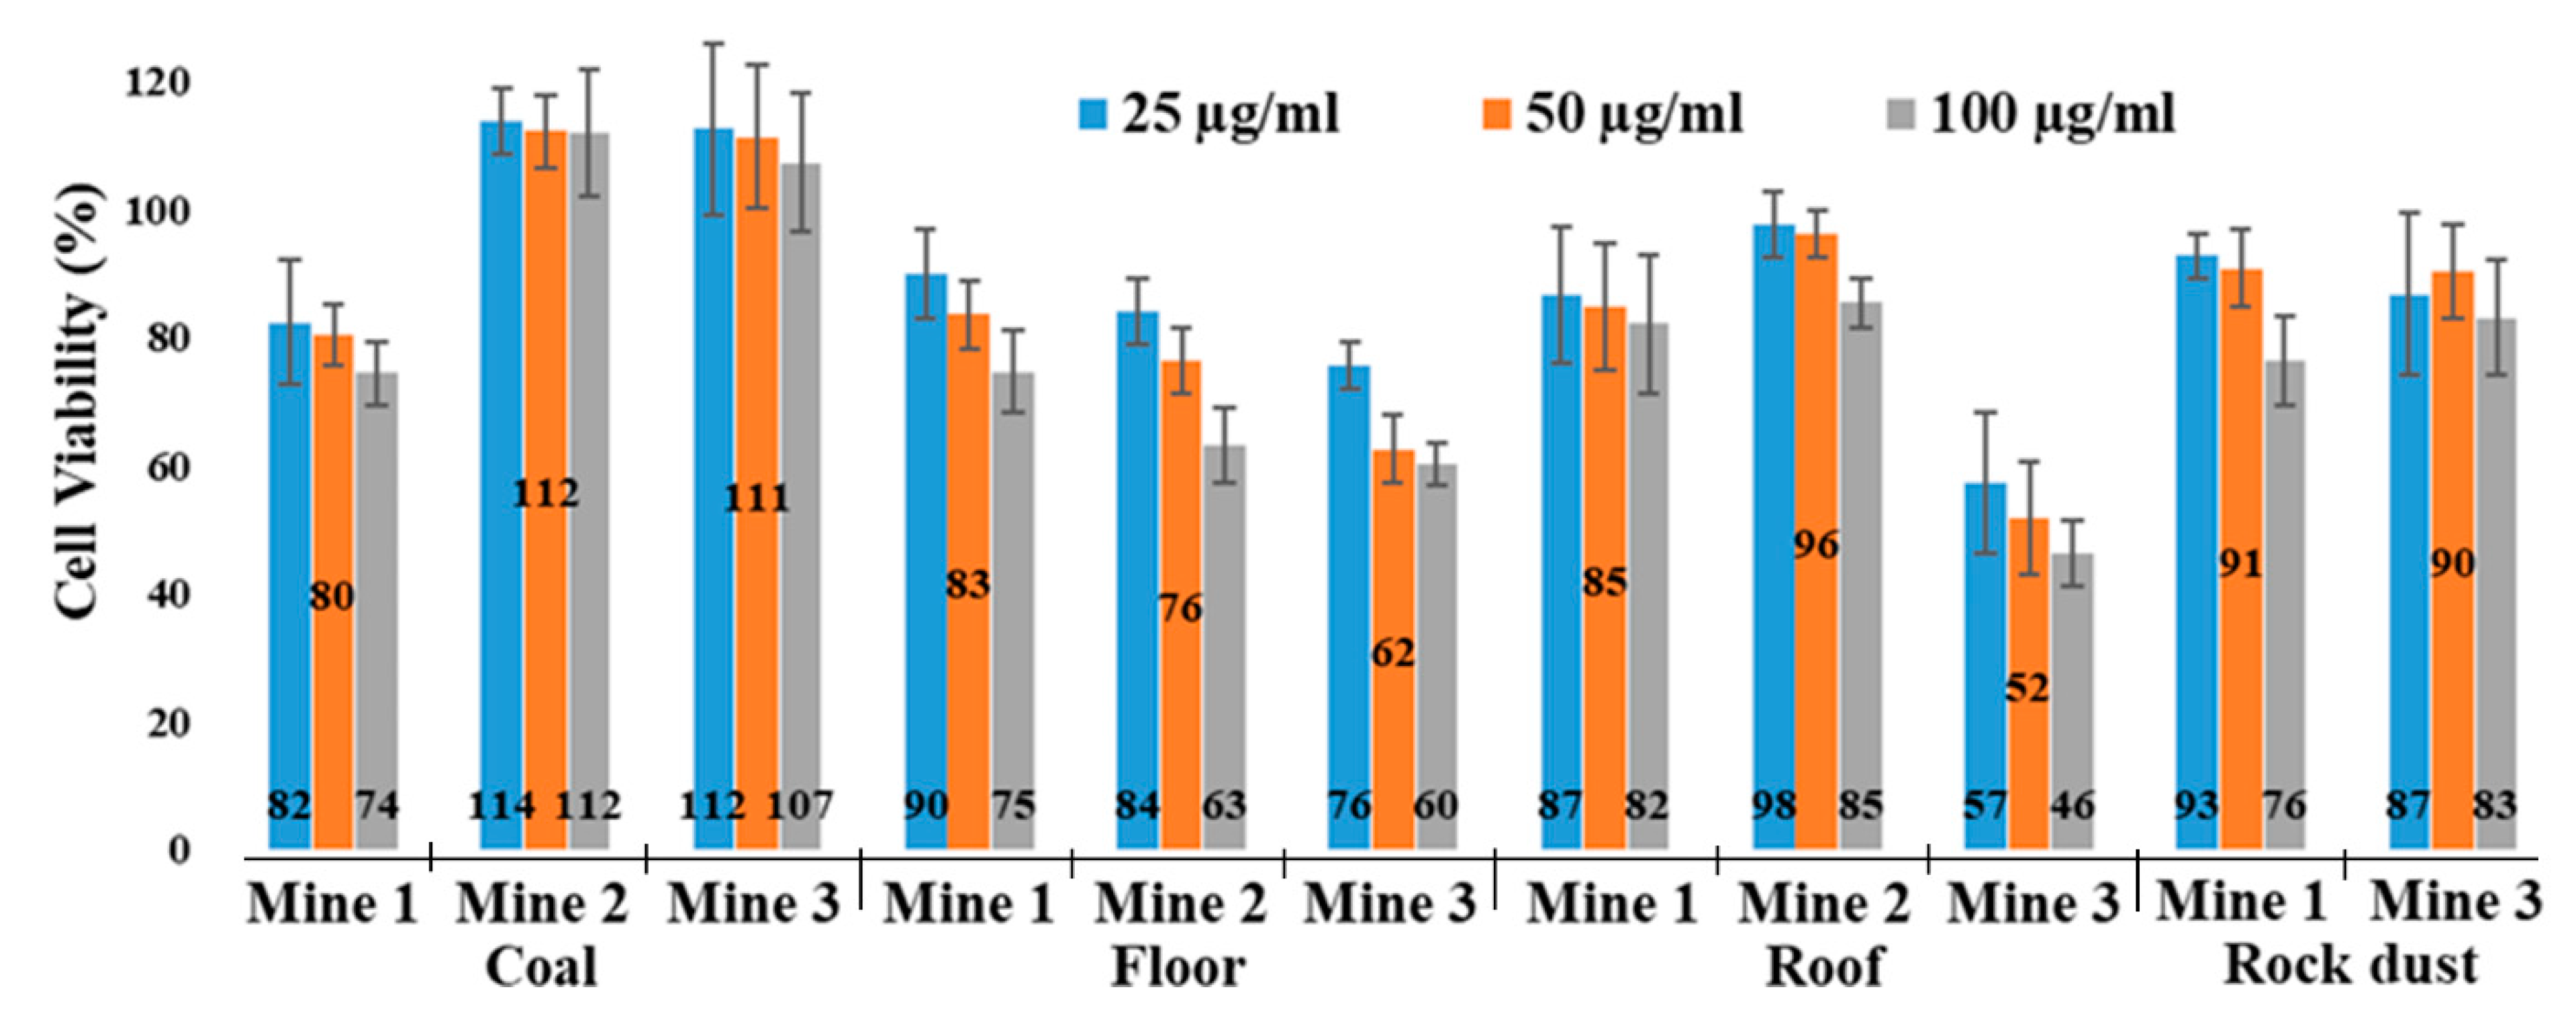
Cell viability tests were performed using MTT assay. Figure 8 shows the data for the dust samples studied under the current investigation. The lung epithelial cells were exposed to three different doses of dust, and all the coal dust samples showed at least some decreased viability with increased concentration. This effect was more prominent for roof and floor dust samples than coal and rock dust, which agrees with the results from the dissolution experiment, where dust from the floor and roof showed higher leaching capability on a mass basis. These data suggest if an individual is exposed to coal dust generated from the coal seam, floor, roof, and rock dust, the dust coming from the floor and roof will potentially cause higher toxicity.
Cytokines are biological signaling molecules frequently involved in chronic inflammatory conditions, including CWP. The results of the dust in vitro exposures for A549 cells are shown in Figure 9. After 4 h of in vitro dust exposure, most of the cytokines showed a mixed dose response, with both increasing and decreasing expressions when treated with dust. Interleukin-4 (IL-4) and interleukin-6 (IL-6) demonstrated an increase in expression across low (10 µg/mL) and high (100 µg/mL) treatment groups relative to controls (no dust exposure). Interleukin-13 (IL-13) and interleukin-1β (IL-1β) also showed an upregulated expression for most dust samples except for a few, i.e., Mine 2_Roof. Interleukin-10 (IL-10) showed a downregulated expression at high concentrations. Interleukin-2 (IL-2), tumor necrosis factor-alpha (TNF-α), and interferon-γ (IFN-γ) also showed a decrease in their expressions for most of the samples with a few exceptions, in particular at lower concentrations. While interleukin-8 (IL-8) showed an increase in expression for most of the samples, the data IL-8 and interleukin-12p70 (IL-12p70) were not conclusive since our expression levels were below the detection limit. Further, no dose–response relationship was observed for most of the cytokines except for IL-10. However, it is evident that both upregulated and downregulated impacts were more significant for samples from roof, floor, and rock dust compared to the coal seam.
Chronic inflammation is a primary symptom of pneumoconiosis, characterized by increased production of inflammatory cells, i.e., monocytes, macrophages, and neutrophils [42,43,44]. The cytokines reported in this work were selected based on their role in pneumoconiosis. Smaller dust particles (<4 µm) can clear the thorax and deposit in the terminal bronchioles and alveoli [45,46]. After detecting this foreign material, the epithelial cells activate the immune system response and trigger alveolar macrophages. This causes to release of cytokines, such as IL-1 and TNF-α. Previous work has reported that TNF-α, IL-6, and IL-1 are linked to CWP and silicosis via in vitro and clinical studies [47,48,49,50,51,52]. In these current results, IL-4, IL-6, IL-13, and IL-1β were upregulated mainly for roof and rock dust samples. However, our results also showed an immune suppressive effect (a downregulated response), in some of the cytokines studied. This inflammatory response obtained from most of the cytokines may have led to the activation of the mechanisms mentioned that cause scar tissue formation and, thus, lung diseases. Results also indicate that floor, roof, and rock dust may produce higher inflammatory stimulation with a higher expression in the cytokines that link to pneumoconiosis. Nevertheless, we propose further research on cytokine production in non-fibroblast cells.

4. Conclusions

The features and toxicity of RCMD are evaluated in the current study in connection to their unique intra- and inter-mine sources based on their metal leaching capabilities in SLFs. This work examined coal dust samples from the coal seam, the mine’s floor and roof, and rock dust samples from the same mine. We further assessed mine dust from three separate mines in various geographic regions. Our research suggests that the physicochemical characteristics such as specific surface area, available elemental content, mineralogy, and site-specific compositions of RCMD substantially impact the metal leaching in lung fluids and the overall toxicity of the results. This work reports that the dust produced by the mine’s floor and the roof had a higher specific surface area than the dust produced by the coal seam and the rock dust. On a mass basis, the greater surface area of the floor and roof dust resulted in more significant metal leaching and increased toxicity. The cell viability and cytokine expression assays also reveal that dust from the floor and roof can be more toxic than from coal seam dust. Our findings also imply that the composition and mineralogy of RCMD are highly sample-specific and primarily derived from the distinctive sources from which they were created. As the mineralogy and composition of the samples are essential factors in determining their toxicity, the toxicity of RCMD will depend on the source. Therefore, our findings suggest that metal leaching from RCMD is an inescapable occurrence regardless of its source. However, the extent of metal leaching is greatly influenced by the sources from which they are produced. During mining, workers in different locations within the mine will produce varying types and amounts of mine dust. Consequently, their exposure to mine dust is highly specific to their work location, which could lead to varying toxicity levels among coal workers. The findings of the current work thus increase miners’ awareness of the risks and encourage incorporating these variabilities into risk assessment models to create a safer working environment.

Supplementary Materials

The following supporting information can be downloaded at: https://www.mdpi.com/article/10.3390/min13030433/s1, Figure S1: Particle size distribution, prepared from the SEM images, for samples (a) Mine 1_Coal (b) Mine 1_Floor (c) Mine 1_RD (d) Mine 1_Roof (e) Mine 2_Coal (f) Mine 2_Floor (g) Mine 2_Roof (h) Mine 3_Coal (i) Mine 3_Floor (j) Mine 3_RD (k) Mine 3_Roof; Table S1: BET surface area measurements for the coal dust samples; Table S2: FTIR peak assignments; Table S 3: Elemental composition of samples; Figure S2: Surface area normalized dissolution of metals in GS from samples (a) Mine 1_Coal (b) Mine 1_Floor (c) Mine 1_Roof (d) Mine 1_RD (e) Mine 2_Coal (f) Mine 2_Floor (g) Mine 2_Roof (h) Mine 3_Coal (i) Mine 3_Floor (j) Mine 3_Roof (k) Mine 3_RD; Figure S3: Surface area normalized dissolution of metals in ALF from samples (a) Mine 1_Coal (b) Mine 1_Floor (c) Mine 1_Roof (d) Mine 1_RD (e) Mine 2_Coal (f) Mine 2_Floor (g) Mine 2_Roof (h) Mine 3_Coal (i) Mine 3_Floor (j) Mine 3_Roof (k) Mine 3_RD; Table S4: Surface area normalized dissolved of metals in GS and ALF following 24 h dissolution experiments.

Author Contributions

Conceptualization, M.D., V.S., G.R., P.R. and K.Z.; methodology, M.D., J.L., R.K. and V.S.; validation, M.D. and V.S.; formal analysis, M.D. and R.K.; investigation, M.D., J.L., R.K., Q.J., A.C., G.R., M.H.; resources, M.H., M.R., K.Z., P.R. and G.R.; writing—original draft preparation, M.D.; writing, review and editing, M.D., G.R., P.R., K.Z. and M.R.; visualization, M.D., V.S. and G.R.; supervision, P.R. and G.R.; project administration, P.R.; funding acquisition, P.R., G.R., M.R. and K.Z. All authors have read and agreed to the published version of the manuscript.

Funding

This research was funded by National Institute for Occupational Safety and Health (NIOSH), grant numbers #75D30119C06390 and #75D30121C12182, and by the National Institute of Environmental Health Sciences (NIH/NIEHS) under grants R21 ES032432 and R00 ES029104. The views, opinions, and recommendations expressed here are solely those of the authors and do not necessarily reflect the views of NIOSH. Mention of trade names, commercial products, or organizations does not imply endorsement by the authors or the funding organization.

Data Availability Statement

Not applicable.

Acknowledgments

The authors thank Maria Pineda, and Carlha Barreto for helping with the sample preparation, and Virgil Lueth, Bonnie Frey, and Kelsey McNamara at the New Mexico Bureau of Geology for providing training to perform XRD and total microwave digestion experiments.

Conflicts of Interest

The authors declare no conflict of interest. The funders had no role in the design of the study; in the collection, analyses, or interpretation of data; in the writing of the manuscript; or in the decision to publish the results.

References

  1. Shekarian, Y.; Rahimi, E.; Rezaee, M.; Su, W.-C.; Roghanchi, P. Respirable Coal Mine Dust: A Review of Respiratory Deposition, Regulations, and Characterization. Minerals 2021, 11, 696. [Google Scholar] [CrossRef]
  2. Shangguan, Y.; Zhuang, X.; Querol, X.; Li, B.; Moreno, N.; Trechera, P.; Sola, P.C.; Uzu, G.; Li, J. Characterization of deposited dust and its respirable fractions in underground coal mines: Implications for oxidative potential-driving species and source apportionment. Int. J. Coal Geol. 2022, 258, 104017. [Google Scholar] [CrossRef]
  3. Cohen, R.A.; Rose, C.S.; Go, L.H.T.; Zell-Baran, L.M.; Almberg, K.S.; Sarver, E.A.; Lowers, H.A.; Iwaniuk, C.; Clingerman, S.M.; Richardson, D.L.; et al. Pathology and Mineralogy Demonstrate Respirable Crystalline Silica Is a Major Cause of Severe Pneumoconiosis in U.S. Coal Miners. Ann. Am. Thorac. Soc. 2022, 19, 1469–1478. [Google Scholar] [CrossRef]
  4. McPherson, M.J. Subsurface Ventilation and Environmental Engineering; Springer Science & Business Media: New Delhi, India, 2012. [Google Scholar]
  5. Colinet, J.; Halldin, C.N.; Schall, J. Best Practices for Dust Control in Coal Mining; US Publication No. 2021-119, IC 9532; Department of Health and Human Services, Centers for Disease Control and Prevention, National Institute for Occupational Safety and Health, DHHS (NIOSH): Pittsburgh, PA, USA, 2021.
  6. Scaggs, M.L. Development and Implementation of a Standard Methodology for Respirable Coal Mine Dust Characterization with Thermogravimetric Analysis; Virginia Tech: Blacksburg, VA, USA, 2016. [Google Scholar]
  7. Sarkar, F. Assessment of Environmental Impacts of Different Mine Unit Operations on Mine Workers and the Workplaces: A Field-Based Investigation. J. Inst. Eng. (India) Ser. D 2022, 1–14. [Google Scholar] [CrossRef]
  8. National Academies of Sciences, Engineering and Medicine. Monitoring and Sampling Approaches to Assess Underground Coal Mine Dust Exposure; National Academies of Sciences, Engineering and Medicine: Washington, DC, USA, 2018. [Google Scholar] [CrossRef]
  9. Sarver, E.; Keles, C.; Rezaee, M. Beyond conventional metrics: Comprehensive characterization of respirable coal mine dust. Int. J. Coal Geol. 2019, 207, 84–95. [Google Scholar] [CrossRef]
  10. Salinas, V.; Das, M.; Jacquez, Q.; Camacho, A.; Zychowski, K.; Hovingh, M.; Medina, A.; Rubasinghege, G.; Rezaee, M.; Baltrusaitis, J.; et al. Characterization and Toxicity Analysis of Lab-Created Respirable Coal Mine Dust from the Appalachians and Rocky Mountains Regions. Minerals 2022, 12, 898. [Google Scholar] [CrossRef]
  11. Trechera, P.; Moreno, T.; Córdoba, P.; Moreno, N.; Zhuang, X.; Li, B.; Li, J.; Shangguan, Y.; Kandler, K.; Dominguez, A.O.; et al. Mineralogy, geochemistry and toxicity of size-segregated respirable deposited dust in underground coal mines. J. Hazard. Mater. 2020, 399, 122935. [Google Scholar] [CrossRef] [PubMed]
  12. Brown, J.S.; Gordon, T.; Price, O.; Asgharian, B. Thoracic and respirable particle definitions for human health risk assessment. Part. Fibre Toxicol. 2013, 10, 12. [Google Scholar] [CrossRef] [PubMed] [Green Version]
  13. Shangguan, Y.; Zhuang, X.; Querol, X.; Li, B.; Li, J.; Moreno, N.; Trechera, P.; Sola, P.C.; Uzu, G. Mineralogical and geochemical variations from coal to deposited dust and toxicity of size-segregated respirable dust in a blasting mining underground coal mine in Hunan Province, South China. Int. J. Coal Geol. 2021, 248, 103863. [Google Scholar] [CrossRef]
  14. Assemi, S.; Pan, L.; Wang, X.; Akinseye, T.; Miller, J.D. Size Distribution, Elemental Composition and Morphology of Nanoparticles Separated from Respirable Coal Mine Dust. Minerals 2023, 13, 97. [Google Scholar] [CrossRef]
  15. Hettiarachchi, E.; Paul, S.; Cadol, D.; Frey, B.; Rubasinghege, G. Mineralogy Controlled Dissolution of Uranium from Airborne Dust in Simulated Lung Fluids (SLFs) and Possible Health Implications. Environ. Sci. Technol. Lett. 2018, 6, 62–67. [Google Scholar] [CrossRef] [PubMed]
  16. Rahman, M.; Zhao, M.; Islam, M.S.; Dong, K.; Saha, S.C. Numerical study of nano and micro pollutant particle transport and deposition in realistic human lung airways. Powder Technol. 2022, 402, 117364. [Google Scholar] [CrossRef]
  17. Guney, M.; Bourges, C.M.-J.; Chapuis, R.P.; Zagury, G.J. Lung bioaccessibility of As, Cu, Fe, Mn, Ni, Pb, and Zn in fine fraction (<20 μm) from contaminated soils and mine tailings. Sci. Total Environ. 2017, 579, 378–386. [Google Scholar] [PubMed]
  18. Kastury, F.; Smith, E.; Juhasz, A.L. A critical review of approaches and limitations of inhalation bioavailability and bioaccessibility of metal(loid)s from ambient particulate matter or dust. Sci. Total Environ. 2017, 574, 1054–1074. [Google Scholar] [CrossRef] [PubMed]
  19. Alpofead, J.A.H.; Davidson, C.M.; Littlejohn, D. A novel two-step sequential bioaccessibility test for potentially toxic elements in inhaled particulate matter transported into the gastrointestinal tract by mucociliary clearance. Anal. Bioanal. Chem. 2017, 409, 3165–3174. [Google Scholar] [CrossRef] [Green Version]
  20. Martin, R.; Dowling, K.; Pearce, D.; Sillitoe, J.; Florentine, S. Health Effects Associated with Inhalation of Airborne Arsenic Arising from Mining Operations. Geosciences 2014, 4, 128–175. [Google Scholar] [CrossRef] [Green Version]
  21. Fahy, J.V.; Dickey, B.F. Airway Mucus Function and Dysfunction. N. Engl. J. Med. 2010, 363, 2233–2247. [Google Scholar] [CrossRef] [Green Version]
  22. Douglas, A.N.; Robertson, A.; Chapman, J.S.; Ruckley, V.A. Dust exposure, dust recovered from the lung, and associated pathology in a group of British coalminers. Occup. Environ. Med. 1986, 43, 795–801. [Google Scholar] [CrossRef] [Green Version]
  23. Beer, C.; Kolstad, H.A.; Søndergaard, K.; Bendstrup, E.; Heederik, D.; Olsen, K.E.; Omland, Ø.; Petsonk, E.; Sigsgaard, T.; Sherson, D.L.; et al. A systematic review of occupational exposure to coal dust and the risk of interstitial lung diseases. Eur. Clin. Respir. J. 2017, 4, 1264711. [Google Scholar] [CrossRef]
  24. Pandey, J.K.; Agarwal, D.; Gorain, S.; Dubey, R.K.; Vishwakarma, M.K.; Mishra, K.K.; Pal, A.K. Characterisation of respirable dust exposure of different category of workers in Jharia Coalfields. Arab. J. Geosci. 2017, 10, 183. [Google Scholar] [CrossRef]
  25. Zosky, G.R.; Hoy, R.F.; Silverstone, E.J.; Brims, F.J.; Miles, S.; Johnson, A.R.; Gibson, P.G.; Yates, D.H. Coal workers’ pneumoconiosis: An Australian perspective. Med. J. Aust. 2016, 204, 414–418. [Google Scholar] [CrossRef] [PubMed]
  26. Sellaro, R.; Sarver, E.; Baxter, D. A Standard Characterization Methodology for Respirable Coal Mine Dust Using SEM-EDX. Resources 2015, 4, 939–957. [Google Scholar] [CrossRef]
  27. Sarver, E.; Keles, C.; Lowers, H.; Zulfikar, R.; Zell-Baran, L.; Vorajee, N.; Sanyal, S.; Rose, C.; Petsonk, E.; Murray, J.; et al. Mineralogic analysis of respirable dust from 24 underground coal mines in four geographic regions of the United States. In A105. Silica, Inorganic Dust, and Mining; American Thoracic Society: New York, NY, USA, 2020; p. A2635. [Google Scholar]
  28. Johann-Essex, V.; Keles, C.; Sarver, E. A Computer-Controlled SEM-EDX Routine for Characterizing Respirable Coal Mine Dust. Minerals 2017, 7, 15. [Google Scholar] [CrossRef] [Green Version]
  29. Rahimi, E.; Shekarian, Y.; Shekarian, N.; Roghanchi, P. Investigation of respirable coal mine dust (RCMD) and respirable crystalline silica (RCS) in the U.S. underground and surface coal mines. Sci. Rep. 2023, 13, 1767. [Google Scholar] [CrossRef] [PubMed]
  30. Hettiarachchi, E.; Das, M.; Cadol, D.; Frey, B.A.; Rubasinghege, G. The Fate of Inhaled Uranium-Containing Particles upon Clearance to Gastrointestinal Tract. Environ. Sci. Process. Impacts 2022, 24, 1257–1266. [Google Scholar] [CrossRef]
  31. Ding, W.; Bao, S.; Zhang, Y.; Xiao, J. Mechanism and kinetics study on ultrasound assisted leaching of gallium and zinc from corundum flue dust. Miner. Eng. 2022, 183, 107624. [Google Scholar] [CrossRef]
  32. Zhang, X.; Wang, S.; Ling, L.; Hou, G.; Leng, S.; Ma, N.; Qiu, M.; Li, X.; Guo, X. The distribution and structural fingerprints of metals from particulate matters (PM) deposited in human lungs. Ecotoxicol. Environ. Saf. 2022, 233, 113324. [Google Scholar] [CrossRef]
  33. Azam, S.; Mishra, D.P. Effects of particle size, dust concentration and dust-dispersion-air pressure on rock dust inertant requirement for coal dust explosion suppression in underground coal mines. Process. Saf. Environ. Prot. 2019, 126, 35–43. [Google Scholar] [CrossRef]
  34. Luo, Y.; Wang, D.; Cheng, J. Effects of rock dusting in preventing and reducing intensity of coal mine explosions. Int. J. Coal Sci. Technol. 2017, 4, 102–109. [Google Scholar] [CrossRef] [Green Version]
  35. Man, C.; Teacoach, K. How does limestone rock dust prevent coal dust explosions in coal mines? Min. Eng. 2009, 61, 69. [Google Scholar]
  36. Huang, Q.; Honaker, R. Recent trends in rock dust modifications for improved dispersion and coal dust explosion mitigation. J. Loss Prev. Process. Ind. 2016, 41, 121–128. [Google Scholar] [CrossRef]
  37. Wilson, S.A. USGS Certificate of Analysis; Coal, Lower Bakerstown CLB-1; USGS Eastern Energy Resources Team: Reston, VA, USA, 1997. [CrossRef]
  38. Pelfrêne, A.; Cave, M.r.; Wragg, J.; Douay, F. In Vitro Investigations of Human Bioaccessibility from Reference Materials Using Simulated Lung Fluids. Int. J. Environ. Res. Public Health 2017, 14, 112. [Google Scholar] [CrossRef] [Green Version]
  39. Lin, S.; Liu, Z.; Zhao, E.; Qian, J.; Li, X.; Zhang, Q.; Ali, M. A study on the FTIR spectra of pre- and post-explosion coal dust to evaluate the effect of functional groups on dust explosion. Process. Saf. Environ. Prot. 2019, 130, 48–56. [Google Scholar] [CrossRef]
  40. Wiederhold, J.G.; Kraemer, S.M.; Teutsch, N.; Borer, P.M.; Halliday, A.N.; Kretzschmar, R. Iron Isotope Fractionation during Proton-Promoted, Ligand-Controlled, and Reductive Dissolution of Goethite. Environ. Sci. Technol. 2006, 40, 3787–3793. [Google Scholar] [CrossRef]
  41. Southwick, J.G. Solubility of Silica in Alkaline Solutions: Implications for Alkaline Flooding. Soc. Pet. Eng. J. 1985, 25, 857–864. [Google Scholar] [CrossRef]
  42. Ahn, H.S.; Kim, J.H.; Chang, H.S.; Kim, K.A.; Lim, Y. The Evaluation of IL-8 in the Serum of Pneumoconiotic patients. Tuberc. Respir. Dis. 1996, 43, 945. [Google Scholar] [CrossRef] [Green Version]
  43. Lee, J.S.; Shin, J.H.; Choi, B.-S. Serum Levels of IL-8 and ICAM-1 as Biomarkers for Progressive Massive Fibrosis in Coal Workers’ Pneumoconiosis. J. Korean Med. Sci. 2015, 30, 140–144. [Google Scholar] [CrossRef] [Green Version]
  44. Donaldson, K.; Brown, G.M.; Brown, D.M.; Robertson, M.D.; Slight, J.; Cowie, H.; Jones, A.D.; Bolton, R.E.; Davis, J.M. Contrasting bronchoalveolar leukocyte responses in rats inhaling coal mine dust, quartz, or titanium dioxide: Effects of coal rank, airborne mass concentration, and cessation of exposure. Environ. Res. 1990, 52, 62–76. [Google Scholar] [CrossRef]
  45. DeLight, N.; Sachs, H. Pneumoconiosis. In StatPearls; StatPearls Publishing: Treasure Island, FL, USA, 2021. Available online: https://www.ncbi.nlm.nih.gov/books/NBK555902/ (accessed on 20 January 2023).
  46. Mlika, M.; Adigun, R.; Bhutta, B.S. Silicosis. In StatPearls; StatPearls Publishing: Treasure Island, FL, USA, 2022. Available online: https://www.ncbi.nlm.nih.gov/books/NBK537341/ (accessed on 15 January 2023).
  47. Vanhee, D.; Gosset, P.; Boitelle, A.; Wallaert, B.; Tonnel, A. Cytokines and cytokine network in silicosis and coal workers’ pneumoconiosis. Eur. Respir. J. 1995, 8, 834–842. [Google Scholar] [CrossRef]
  48. Lassalle, P.; Gosset, P.; Aerts, C.; Fournier, E.; Lafitte, J.J.; Degreef, J.M.; Wallaert, B.; Tonnel, A.B.; Voisin, C. Abnormal secretion of interleukin-1 and tumor necrosis factor alpha by alveolar macrophages in coal worker’s pneumoconiosis: Comparison between simple, pneumoconiosis and progressive massive fibrosis. Exp. Lung. Res. 1990, 16, 73–80. [Google Scholar] [CrossRef]
  49. Castranova, V.; Vallyathan, V. Silicosis and coal workers’ pneumoconiosis. Environ. Health Perspect. 2000, 108, 675–684. [Google Scholar] [PubMed] [Green Version]
  50. Borm, P.J.A.; Palmen, N.; Engelen, J.J.M.; Buurman, W.A. Spontaneous and Stimulated Release of Tumor Necrosis Factor-alpha (TNF) from Blood Monocytes of Miners with Coal Workers’ Pneumoconiosis. Am. Rev. Respir. Dis. 1988, 138, 1589–1594. [Google Scholar] [CrossRef]
  51. Lee, J.-S.; Shin, J.-H.; Lee, J.-O.; Lee, W.-J.; Hwang, J.-H.; Kim, J.-H.; Choi, B.-S. Blood Levels of IL-Iβ, IL-6, IL-8, TNF-α, and MCP-1 in Pneumoconiosis Patients Exposed to Inorganic Dusts. Toxicol. Res. 2009, 25, 217–224. [Google Scholar] [CrossRef] [PubMed] [Green Version]
  52. Slavov, E.; Miteva, L.; Prakova, G.; Gidikova, P.; Stanilova, S. Correlation between TNF-alpha and IL-12p40-containing cytokines in silicosis. Toxicol. Ind. Health 2010, 26, 479–486. [Google Scholar] [CrossRef] [PubMed]
Figure 1. SEM images for the lab generated RCMD (a) Mine 1_Coal (b) Mine 1_Floor (c) Mine 1_RD (d) Mine 1_Roof (e) Mine 2_Coal (f) Mine 2_Floor (g) Mine 2_Roof (h) Mine 3_Coal (i) Mine 3_Floor (j) Mine 3_RD (k) Mine 3_Roof.
Minerals 13 00433 g001
Figure 2. FTIR spectra of the coal mine dust samples.
Minerals 13 00433 g002
Figure 3. Mass normalized dissolution of elements in GS from samples (a) Mine 1_Coal (b) Mine 1_Floor (c) Mine 1_Roof (d) Mine 1_RD (e) Mine 2_Coal (f) Mine 2_Floor (g) Mine 2_Roof (h) Mine 3_Coal (i) Mine 3_Floor (j) Mine 3_Roof (k) Mine 3_RD.
Minerals 13 00433 g003
Figure 4. Mass normalized dissolution of elements in ALF from samples (a) Mine 1_Coal (b) Mine 1_Floor (c) Mine 1_Roof (d) Mine 1_RD (e) Mine 2_Coal (f) Mine 2_Floor (g) Mine 2_Roof (h) Mine 3_Coal (i) Mine 3_Floor (j) Mine 3_Roof (k) Mine 3_RD.
Minerals 13 00433 g004
Figure 5. % Al normalized dissolved Al in (a) ALF and (b) GS from all three mines.
Minerals 13 00433 g005
Figure 6. % Si normalized dissolved Si in (a) ALF and (b) GS from all three mines.
Minerals 13 00433 g006
Figure 7. % Fe normalized dissolved Fe in ALF from all three mines.
Minerals 13 00433 g007
Figure 8. Cell viability data for the 11 dust samples from various sources (coal seam, floor, roof, and rock dust) of the three different mines.
Minerals 13 00433 g008
Figure 9. Results of coal dust exposures to A549 cells using low (10 µg/mL) and high (100 µg/mL) concentrations.
Minerals 13 00433 g009
Table 1. Details of the samples used in this study.
Mine IDMining MethodSourceSample ID
Mine 1Long wallCoalMine 1_Coal
Continuous miner machine floorMine 1_Floor
Rock dustMine 1_RD
Continuous miner machine roofMine 1_Roof
Mine 2Room & PillarCoalMine 2_Coal
Host floorMine 2_Floor
Host roofMine 2_Roof
Mine 3Room & PillarCoalMine 3_Coal
Host floorMine 3_Floor
Rock dustMine 3_RD
Host roofMine 3_Roof
Table 2. Size distribution calculated from the SEM images.
SampleAverage Particle Size (μm)PM10
(%)
PM4
(%)
Mine 1_Coal3.36 ± 2.4297.474.3
Mine 1_Floor3.31 ± 2.7497.373.5
Mine 1_RD3.80 ± 2.1398.260.3
Mine 1_Roof2.03 ± 1.20100.094.2
Mine 2_Coal2.17 ± 1.25100.091.0
Mine 2_Floor1.79 ± 0.90100.097.0
Mine 2_Roof1.55 ± 0.94100.097.8
Mine 3_Coal2.68 ± 1.6599.484.1
Mine 3_Floor3.65 ± 2.0197.870.0
Mine 3_RD3.29 ± 1.9399.571.7
Mine 3_Roof2.55 ± 1.8299.486.4
Table 3. Mineral composition of the coal dust samples from XRD results.
Sample IDQKPIMuMChCaDS
Mine 1_Coal--------
Mine 1_Floor------
Mine 1_RD------
Mine 1_Roof-----
Mine 2_Coal------
Mine 2_Floor------
Mine 2_Roof-----
Mine 3_Coal-----
Mine 3_Floor------
Mine 3_RD--------
Mine 3_Roof------
Note: Quartz (Q), Kaolinite (K), Pyrite (P), Illite (I), Chlorite (Ch), Muscovite (Mu), Microcline (M), Calcita (Ca), Dolomite (D), Siderite (S).
Table 4. Mass normalized dissolved metals in GS and ALF following 24 h of dissolution experiments.
SamplesAL (ppb/g)Si (ppb/g)Mn (ppb/g)Fe (ppb/g)Cu (ppb/g)Sr (ppb/g)Ba (ppb/g)Pb (ppb/g)
ALFGSALFGSALFGSALFGSALFGSALFGSALFGSALFGS
Mine 1_Coal24,157749130,62821,86719-2995-50-73098020902055269-
Mine 1_Floor42,106739538,26340,32446-4630-168-540393139956132-
Mine 1_RD3199554469164,0974349-6260-1681261289-325-1465-
Mine 1_Roof236,21022,903246,47465,7797381-311,387-176-879-2070-117-
Mine 2_Coal26112910,00773,24726-2181-699-315-272-447-
Mine 2_Floor216,19018,717195,79554,311671-85,658-146-299-2157-130-
Mine 2_Roof154,64616,914147,53253,60096-24,964-286-538-2308-108-
Mine 3_Coal1229671321327,95825-9168-784-210-154-2603-
Mine 3_Floor119,46216,223133,81242,885101-29,332-364-790-2172-310-
Mine 3_RD3281236476934,697570-2746-148-3106-33-31-
Mine 3_Roof58,54410,27764,09623,090367-129,782122697-220156982-1049-
Disclaimer/Publisher’s Note: The statements, opinions and data contained in all publications are solely those of the individual author(s) and contributor(s) and not of MDPI and/or the editor(s). MDPI and/or the editor(s) disclaim responsibility for any injury to people or property resulting from any ideas, methods, instructions or products referred to in the content.