Article

Improving Nickel Recovery in Froth Flotation by Purifying Concentrators Process Water Using Dissolved Air Flotation

1
Metso Outotec Finland Oy, Rauhalanpuisto 9, 02230 Espoo, Finland
2
Department of Bioproducts and Biosystems, School of Chemical Engineering, Aalto University, Vuorimiehentie 1, 02150 Espoo, Finland
3
Boliden Kevitsa Mine, Kevitsantie 730, 99670 Sodankylä, Finland
4
Metso Outotec Research Center, Kuparitie 10, 28330 Pori, Finland
5
Metso Outotec España SA, Avenida Arroyomolinos 11, 28925 Madrid, Spain
*
Author to whom correspondence should be addressed.
Minerals 2023, 13(3), 319; https://doi.org/10.3390/min13030319
Submission received: 2 February 2023 / Revised: 21 February 2023 / Accepted: 22 February 2023 / Published: 24 February 2023
(This article belongs to the Special Issue Water within Minerals Processing, Volume II)

Abstract

:
The pressure for saving water by closing the water loops in mineral processing is increasing continuously. The drivers for higher recirculating rates include water scarcity in dry areas, environmental legislation that is becoming stricter in most countries, limitations set for wet tailings management and the increased demands for social licenses to operate. At the same time, to make mineral processing sustainable, the recovery of valuable minerals should be maximized. This leads for a need to close the process water circulation. To see the effect of closed water circulation on metallurgical performance, flotation tests were carried out with nickel concentrate thickener overflow water before and after the process of water purification by dissolved air flotation (DAF). Both total nickel recovery and concentrate grade in laboratory scale flotation tests to the Ni rougher-scavenger concentrate increased after DAF treatment. Chemical and mineralogical characterizations revealed that after DAF treatment, the process water contained fewer metal hydroxides and less fine-grained silicate mineral particles, which is most likely the reason for the improvement in the nickel flotation performance. Based on the feasibility study, improved nickel recovery by DAF treatment of process water can bring economic benefits at a concentrator plant.

1. Introduction

The amount of water used for mineral processing varies significantly within the industry. Based on the data provided by mining companies, water used for mining and mineral processing fluctuates between 0.3 and 6.3 m3 per ton of ore processed [1]. The make-up water consumption depends on factors such as the type ore being processed and the geographical location, as in some cases water must be transported to site from a long distance [2,3]. In some cases, the regulations for tailings management limit the freshwater intake [4]. However, the freshwater consumption can be significantly decreased by recirculating the process water.
When the water circulation rate at a concentrator plant is increased, impurities accumulate in the process water and begin influencing on the metallurgical performance. For instance, the Kevitsa Ni-Cu-PGE concentrator plant in northern Finland has been experiencing a measurable impact of water quality on the flotation process. At Kevitsa, more than 95% of the process water is recycled and over time the effect of recycled water has become more noticeable. According to the plant experience, the quality of the process water in copper flotation circuit does not impact much on copper recovery, but for the nickel flotation circuit, the increase in impurities in the nickel circuit process water decreases the nickel recoveries. Recycled water from nickel thickener overflow accounts for less than 10% of the water added to the process, but its quality still has a negative impact on the nickel recovery in flotation and it needs to be cleaned before adding it back to the circuit to minimize the nickel recovery losses. [5,6]
The successful separation of pentlandite from silicate minerals depends on several factors that are already discussed in literature. Firstly, the serpentine group minerals, generally described by the formula (Mg, Fe)3Si2O5(OH)4, have been found to affect nickel recovery negatively by forming a hydrophilic slime coating on the pentlandite grain surfaces because of opposite surface potentials so that serpentine group minerals are positively charged, and surfaces of pentlandite grains are negatively charged [7,8,9,10,11]. Micrographs from scanning electron microscopy study have revealed that fine serpentine fibers coat pentlandite mineral surfaces and interfere with the collector adsorption [12]. Secondly, Cu, Ni and Fe metal ions form metal hydroxides at alkaline pH in process water that may adsorb on the surfaces of valuable minerals, make them less hydrophobic and decrease the recovery [9,13,14]. Thirdly, thiosulphate ions have been found to affect negatively on collector adsorption on sulphide minerals which may lead to decreased pentlandite recovery [5,6]. All these forms of impurities and harmful solids have been identified in Kevitsa nickel concentrate thickener overflow water.
Dissolved air flotation (DAF) has been widely used in industrial scale water treatment since the mid-1990s, with the main applications being at drinking water plants [15]. The separation of impurities in a DAF unit is based on microbubbles with a diameter less than 100 µm. The bubbles are generated by dissolving air into water under pressure, and the dissolution of air into water follows Henry’s law. The pressurized water is then released into a flotation basin. The impurities in the water attach to the air bubbles that raise to the top of the DAF reactor, while the clarified water is recovered from the bottom of the basin. DAF treatment can remove various type of impurities from water, including colloids (between 1 nm and 0.1 µm), fine (2.5 µm or less) and ultrafine (0.1 µm or less) particles, precipitates, and certain ions. Coagulant and flocculant are needed to collect the particles into flocs that can attach to the air bubbles. In earlier studies, the optimal particle floc size for removal has been on average between 15 and 30 µm [16,17]. However, the weight of the floc also has an impact on the recovery rate and the floc weight varies depending on the application and on the impurities being removed. At mineral processing plants, the impurities accumulating in the process water originate mainly from the ore [18,19,20]. Some water treatment trials have shown that DAF can remove more than 90% of suspended solids [21]. The advantage of DAF compared to other treatment methods, such as filtration, is that it can handle varying loads of solids in the water stream being treated. Therefore, DAF is a viable option for treating the internal streams at mineral processing plants where disturbances in process conditions often take place.
To implement DAF, water treatment test work on site is needed to avoid any changes in the composition of process water samples during transportation. It has previously been shown that the water composition may change rapidly [22]. In earlier studies, the use of DAF-treated processed water has improved the flotation performance for apatite [23]. Microflotation together with microfiltration has also been used for the removal of copper from mine effluent water [24]. The challenges in pentlandite recovery can be overcome to some extent by optimizing the collector and depressant reagent dosages in flotation [25,26]. However, treatment of the process water can also help to improve the recovery of valuable minerals. To be cost efficient it is often more practical to selectively treat internal water streams instead of combining all process water streams before treatment. In this study, the effect of purifying the nickel concentrate thickener overflow water with DAF on the metallurgical performance of nickel flotation was investigated. The target was to find out whether investing in DAF treatment would be technically and economically feasible. The economical calculations show that even a slight improvement in the metallurgical performance pays back the investment.

2. Materials and Methods

The flotation and DAF treatment tests were carried out at Boliden’s Kevitsa concentrator plant. Kevitsa is a low-grade Ni-Cu-PGE deposit, where nickel is carried mainly by pentlandite and copper by chalcopyrite. Platinum group metals are mainly associated with nickel minerals, while gold reports to the copper concentrate. Pyroxene group minerals are the main non-sulphide gangue in the ore. The grade of nickel carried by sulphide minerals is on average 0.22%. The average mineral composition of the Kevitsa ore is shown in Table 1 [27].
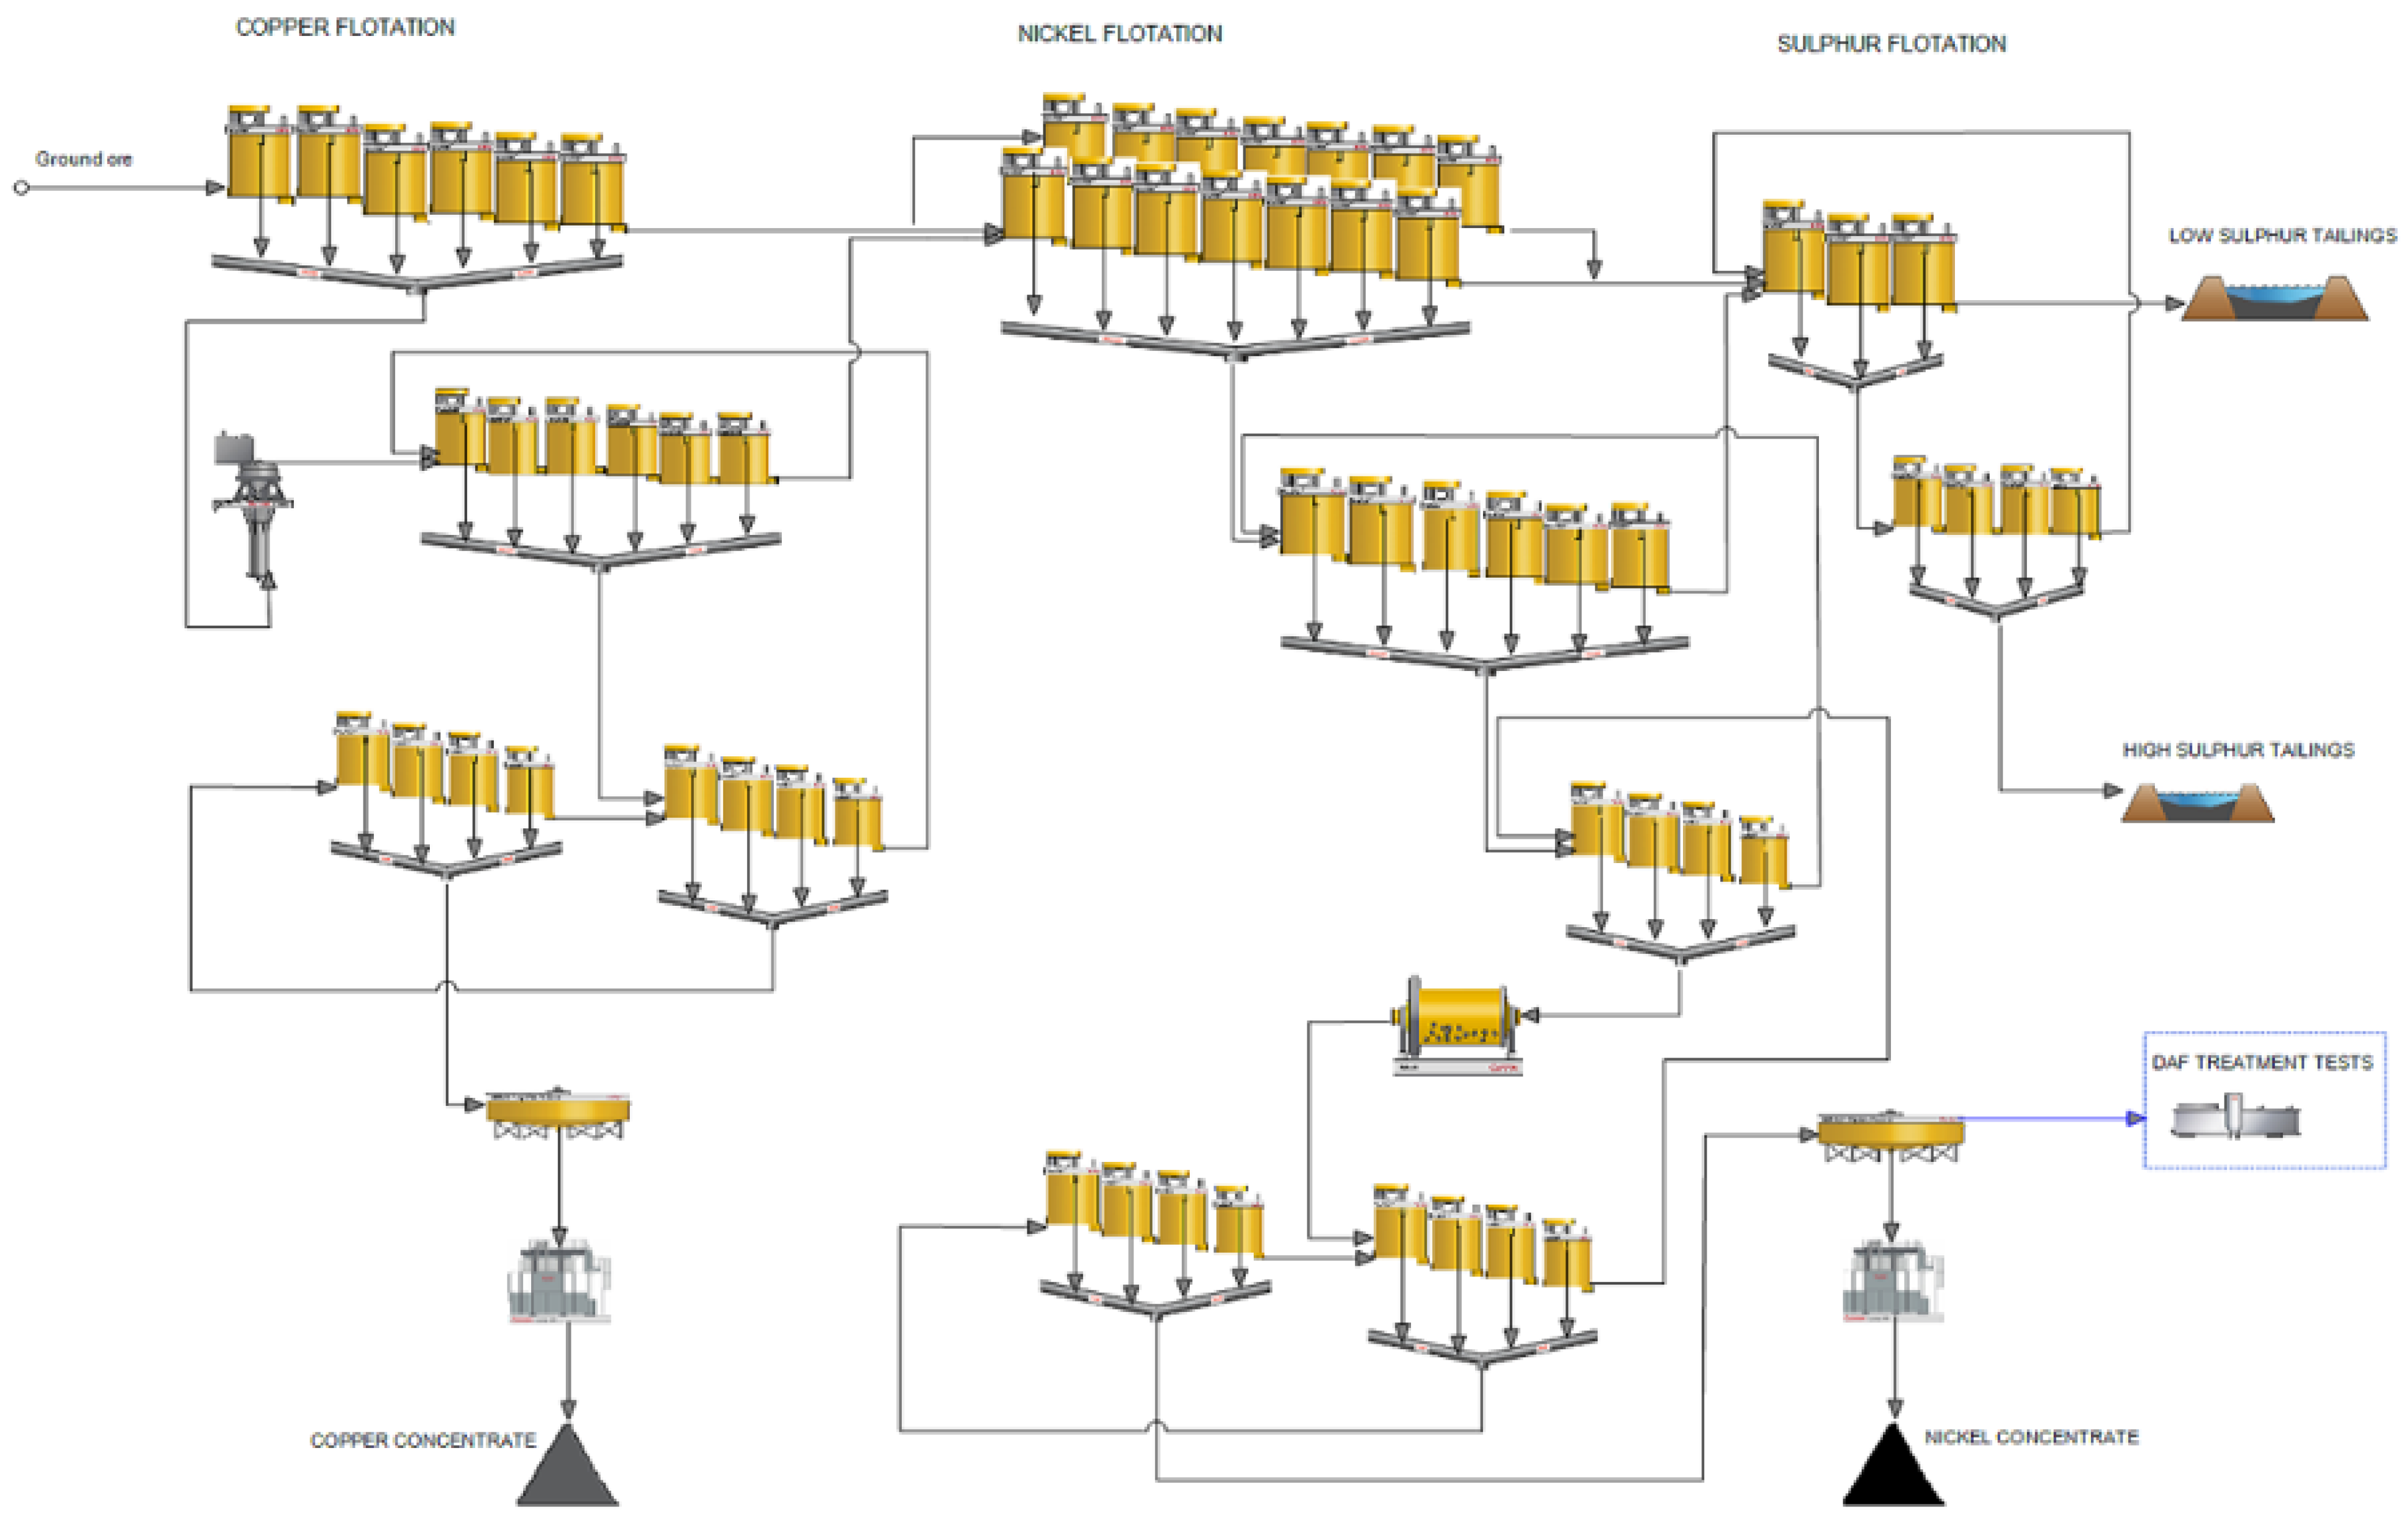
The flowsheet of the Kevitsa flotation circuit is shown in Figure 1. Copper and nickel minerals are separated by sequential flotation. Copper is floated first, and the copper scavenger tails is the feed to nickel flotation. Finally, pyrrhotite and other remaining sulphur-bearing minerals are floated and sent to the high sulphur tailings pond. The water samples used in the test work were taken from the plant nickel concentrate thickener overflow. Currently the overflow water is circulated in the process as such. [27]

2.1. Laboratory Flotation Tests

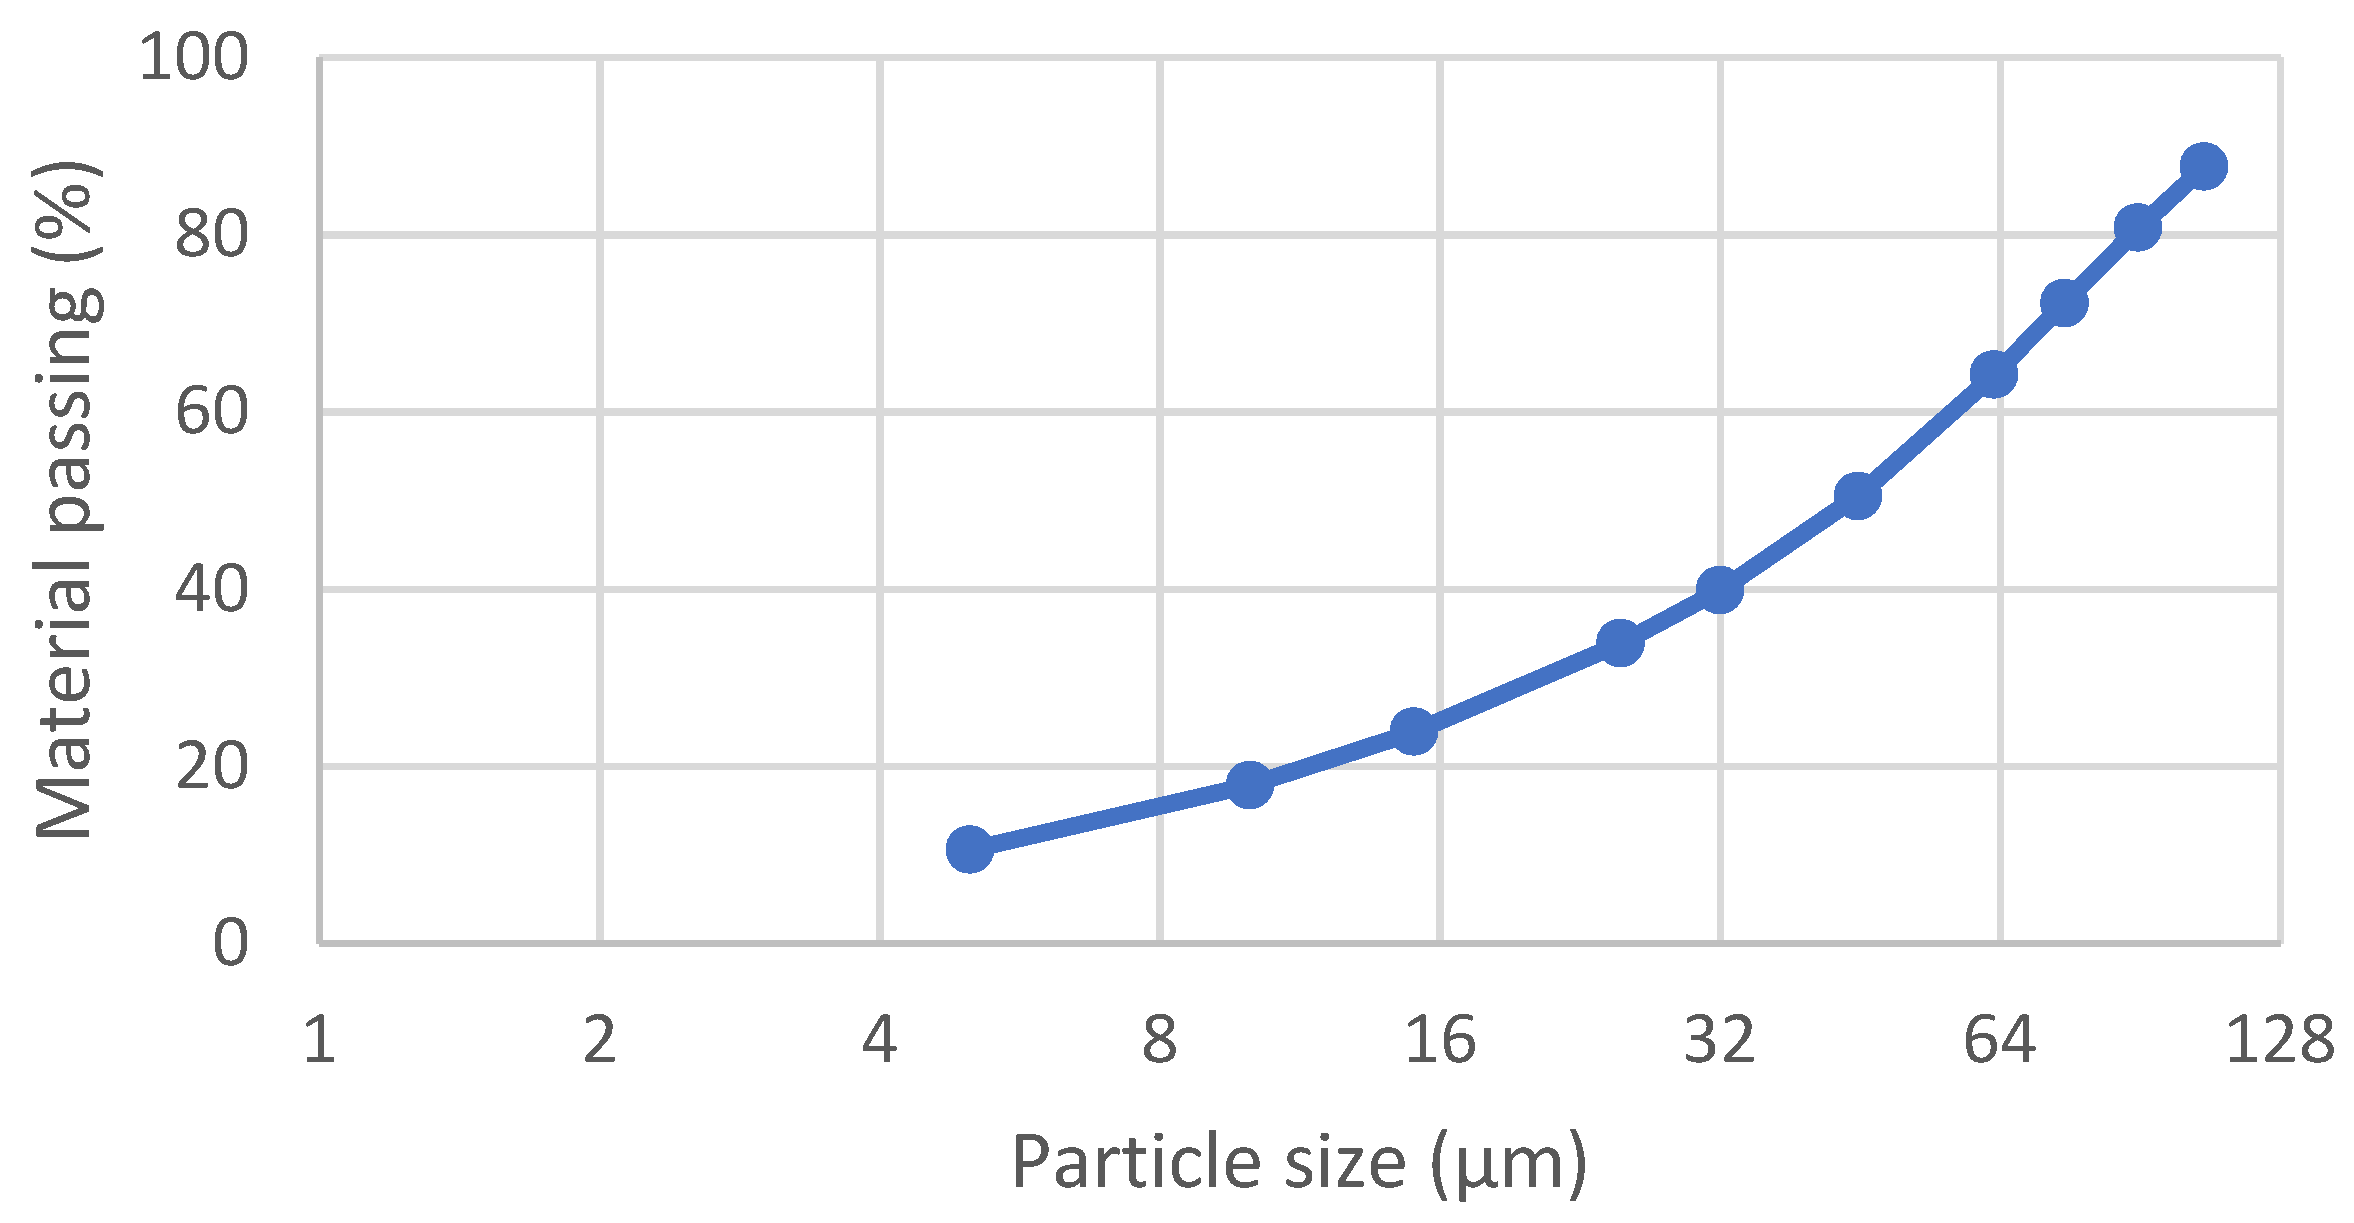
The Kevitsa Cu-Ni ore was used as feed material in the flotation tests carried out at the site laboratory. The sample was collected from the products of secondary and tertiary crushers in the concentrator process. The original sample size was less than 10mm, and it was screened at the site laboratory using a 4 mm screen. The 4 mm material was homogenized and split into 1 kg plastic bags using rotary splitter. Each flotation feed batch was ground in a laboratory grinding mill right before flotation to avoid excess oxidation of mineral surfaces. The target grind size was 75% passing 75 µm. The particle size distribution after grinding is shown in Table 2 and Figure 2.
The flotation tests were carried out shortly after taking the water sample. The laboratory flotation test flowsheet is shown in Figure 3.
Before starting the laboratory flotation test, process water pH was adjusted to 9.5 by lime addition. All tests were carried out at a temperature of 20 °C. Prior to flotation, the test feed batch was ground in a laboratory mill at 70% solids for 27 min. The tests were performed using an Outotec GTK LabCell flotation machine with a 2 L flotation cell. The rotor mixing speed was 1300 rpm and air feed rate 5 NL/min. The slurry was first conditioned for two minutes with 35 g/t CMC, 5 g/t Aerophine 3418A and 20 g/t Nasfroth 240 reagents. After that, copper rougher-scavenger flotation was carried out for 10 min. Copper scavenger tailings were conditioned again with 15 g/t CMC, 50 g/t SIPX and 10 g/t Nasfroth 240 reagents for two minutes before recovering the nickel rougher concentrate during 7.5 min of flotation. After another conditioning of slurry with 30 g/t SIPX for two minutes, nickel scavenger flotation was performed for 7.5 min.

2.2. DAF Treatment

The DAF treatment was conducted in a FlooDaf B5 container test unit. The pilot test system was equipped with a chemical dosing system, a compressor, and a local PLC (programmable logic control) with online monitoring manufactured by Metso Outotec. The air to generate bubbles in the size range of 50–100 μm was fed to the system at 6 bar pressure. The surface area of the rectangular flotation tank was 5 m2. An inclined baffle was fixed 60° to the horizontal between the contact and separation zones to reduce turbulence and to elevate the bubble-floc agglomerates towards the surface of the tank. The capacity of the standard FlooDaf B5 unit is up to 35 m3/h.
After optimizing the test conditions, the chemical dosages used were 90 ppm for cationic coagulant PAX XL-100 and 1.3 ppm for anionic flocculant Superfloc A120 for the nickel concentrate thickener overflow. pH was raised to 9 by using Ca(OH)2 at a dosing rate of 10 L/h as 20% milk of lime. The water feed flow rate to DAF treatment was 6.6 m3/h.

2.3. Analysis Methods

The non-treated and purified water samples were analysed after sampling on site, and for certain components at Metso Outotec Research Center, as specified in Table 3. ICP-OES (inductively coupled plasma optical emission spectrometer) was applied. The analyses were carried out both after filtration with a 0.45 µm filter and after microwave assisted dissolving. The analysis after filtration gives the amount of concentration of the impurity dissolved in the water sample. The microwave assisted dissolving shows both colloidal and dissolved forms of the analysed element. The concentrations of dissolved Cu, Ni, Fe and SO42− were determined on-site by UV-Vis (ultraviolet-visible) spectrophotometry utilizing cuvette tests specific for each component and concentration range from the Hach company.
The solids removed by the DAF treatment from the Ni concentrate thickener overflow water were characterized at Metso Outotec Research Center. The main elements of the sample were analysed using ICP-OES after total dissolution. Nickel and iron content after bromine-methanol dissolution were analysed using ICP-OES to differentiate between Ni and Fe content in sulphide and silicate minerals. Sulphur and carbon contents were measured using an Eltra CS-2000 automatic analyser. The quantity of silica was analysed colorimetrically using a Hach DR 5000 UV-Vis spectrophotometer. The ferromagnetic material was analyzed by using Satmagan analyser. Polished resin section was prepared for mineralogical studies using a JEOL JSM-6490LV and 7000F scanning electron microscopes (SEM) equipped with an Oxford Instruments energy dispersive spectrometer (EDS). The imaging and EDS analyses were performed under routine conditions using 20 kV acceleration voltage and 1 nA beam current. Mineral quantification was performed using HSC Chemistry® software.
Student’s t-test was used to compare the mean values of the flotation test results. The analysis was performed with Microsoft Excel.

3. Results and Discussion

3.1. Flotation Test Results with and without DAF Treatment

The chemical analyses carried out for the water samples used in the flotation tests are given in Table 3. The tests coded as 01 were carried out with nickel concentrate thickener overflow water taken from the concentrator process, while the tests coded as 02 were carried out with the same thickener overflow water that had gone through the DAF treatment. The water samples were taken from the process on September 8, 10 and 11, 2020.
As Table 3 shows, despite the variations in the feed to the DAF treatment, it substantially decreased Cu, Ni, and SO42− content in the water. The amount of dissolved Si is lower after DAF treatment. The concentration of dissolved iron is low in each water sample, but the amount of colloidal Fe decreased significantly after DAF. Also, the chemical oxygen demand of the water (COD) that correlates with amount of thiosulphate ions, decreased in the water after DAF treatment. The amount of dissolved oxygen (DO) in the water increased after DAF treatment, but it most likely does not correlate with the froth flotation performance, because the stage of oxidation will change again in grinding and conditioning with froth flotation reagents. Aluminum content in the water increased because of the use of Al-based coagulant.
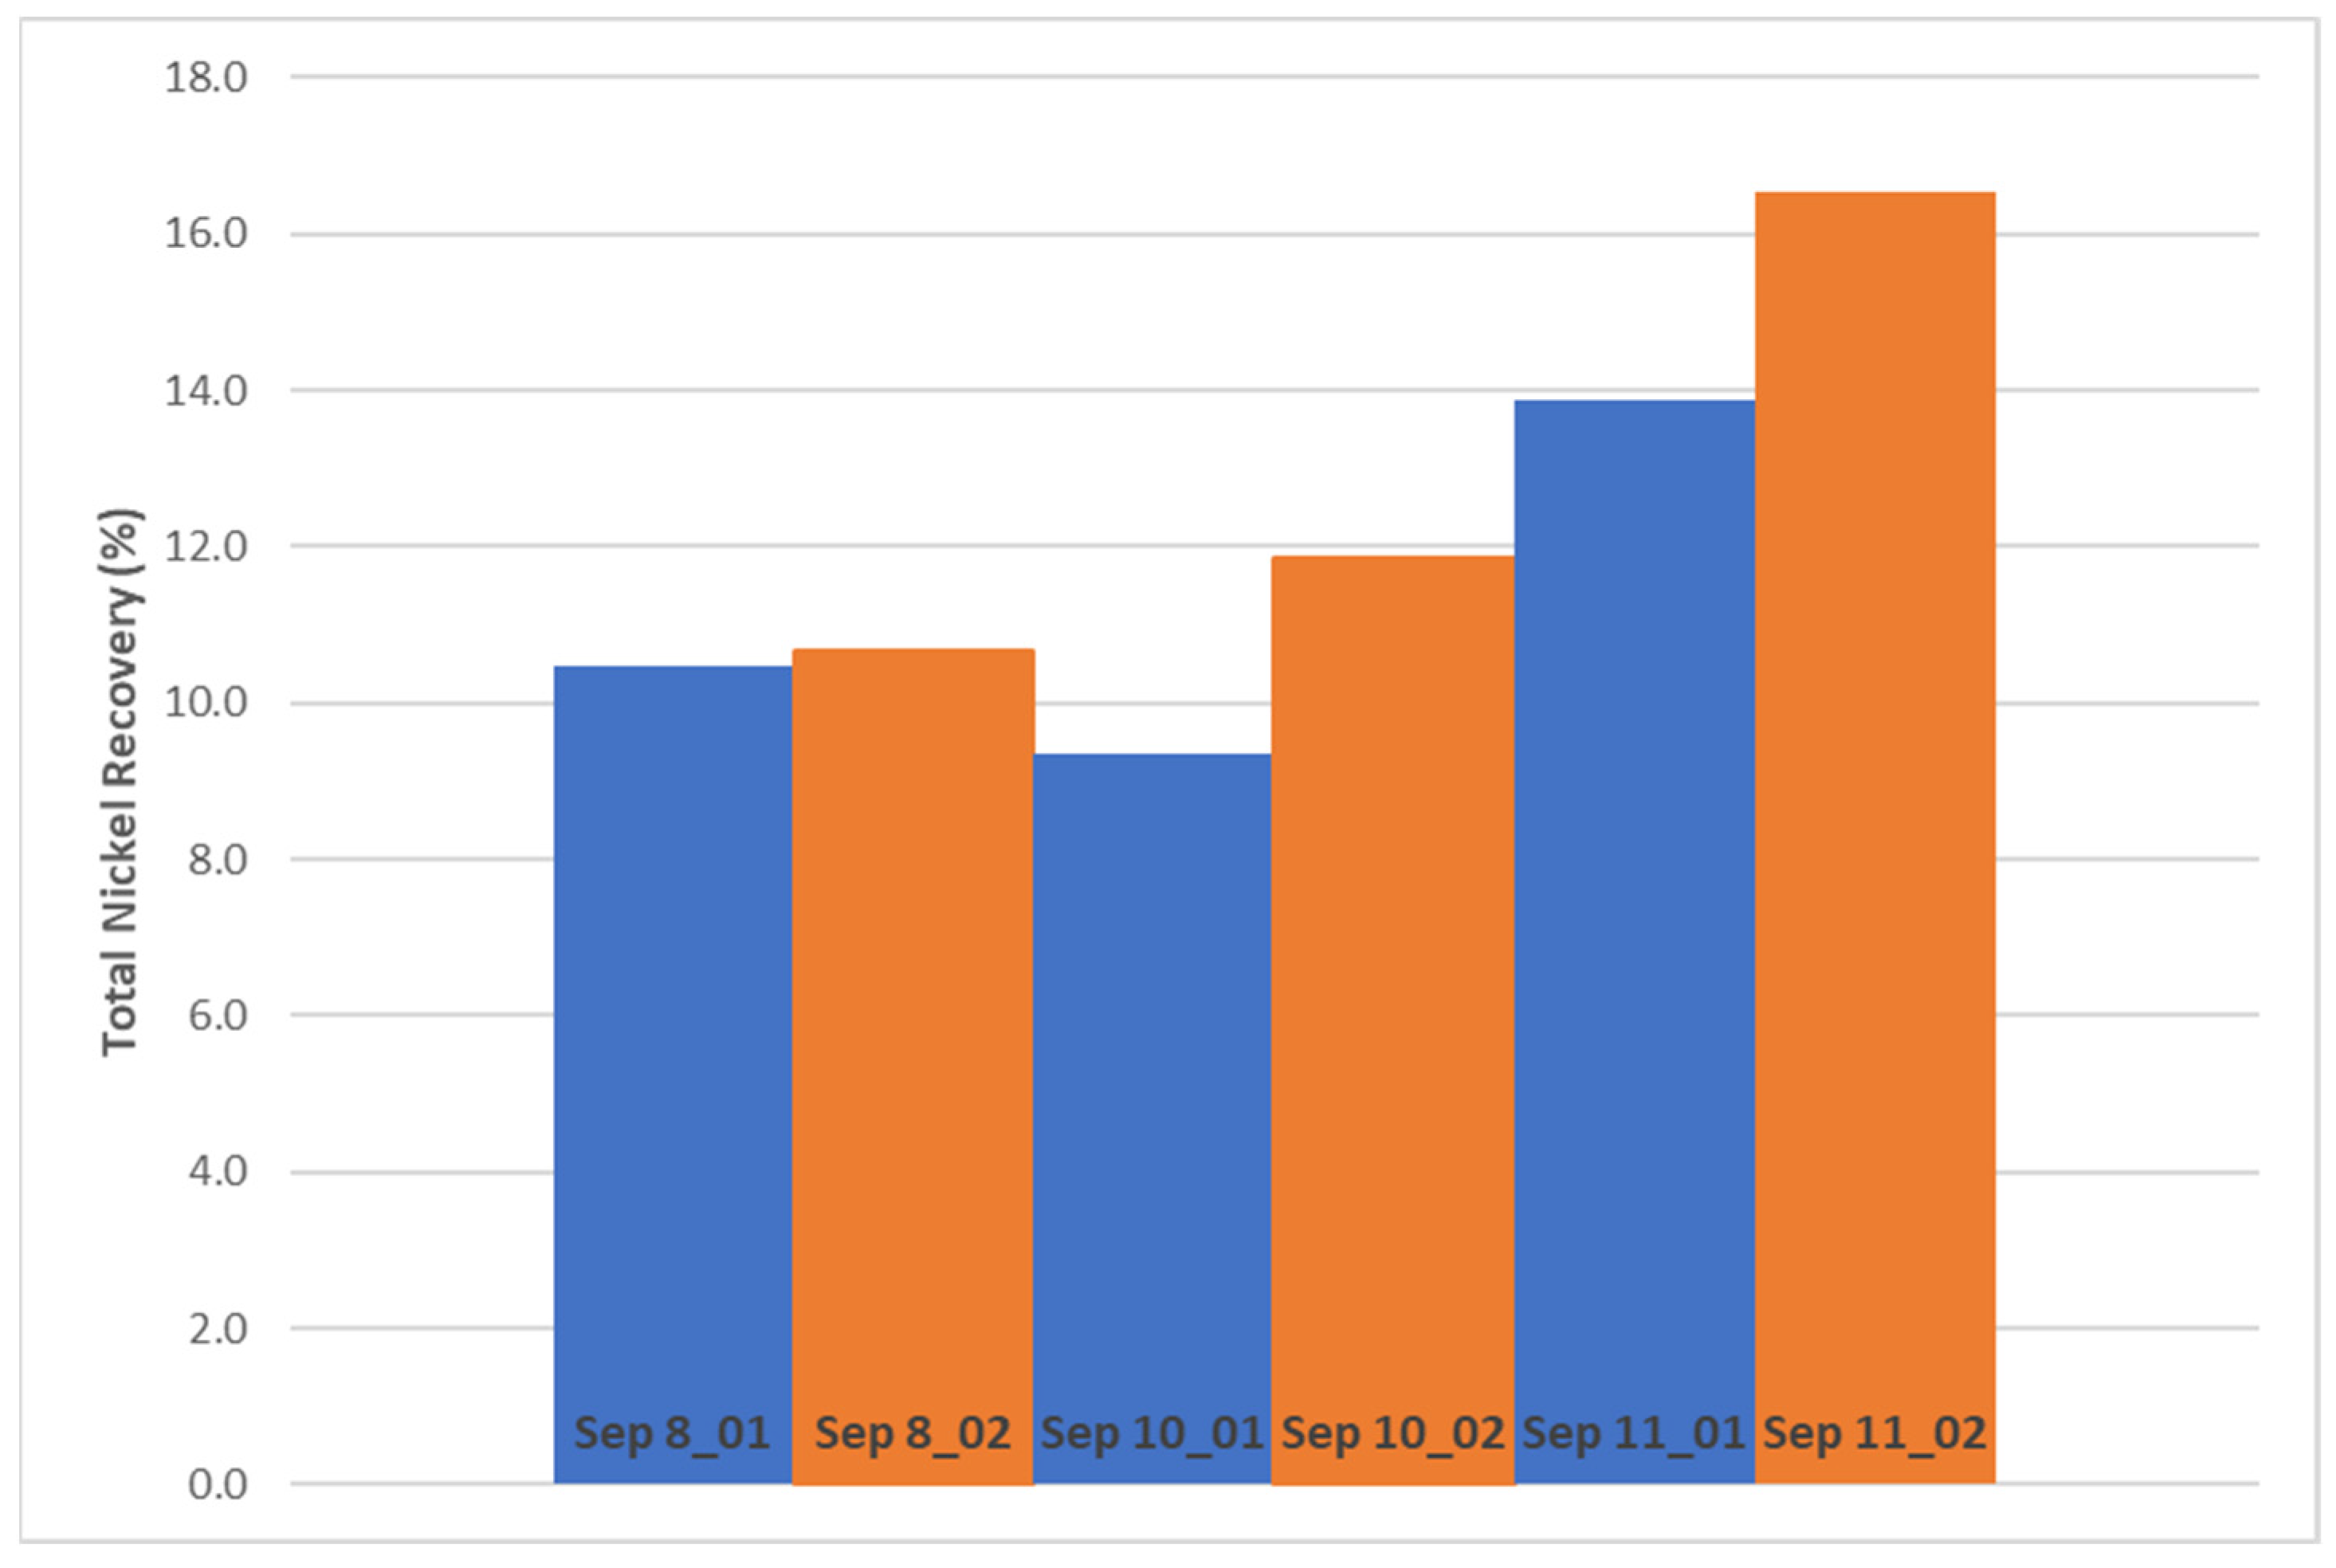
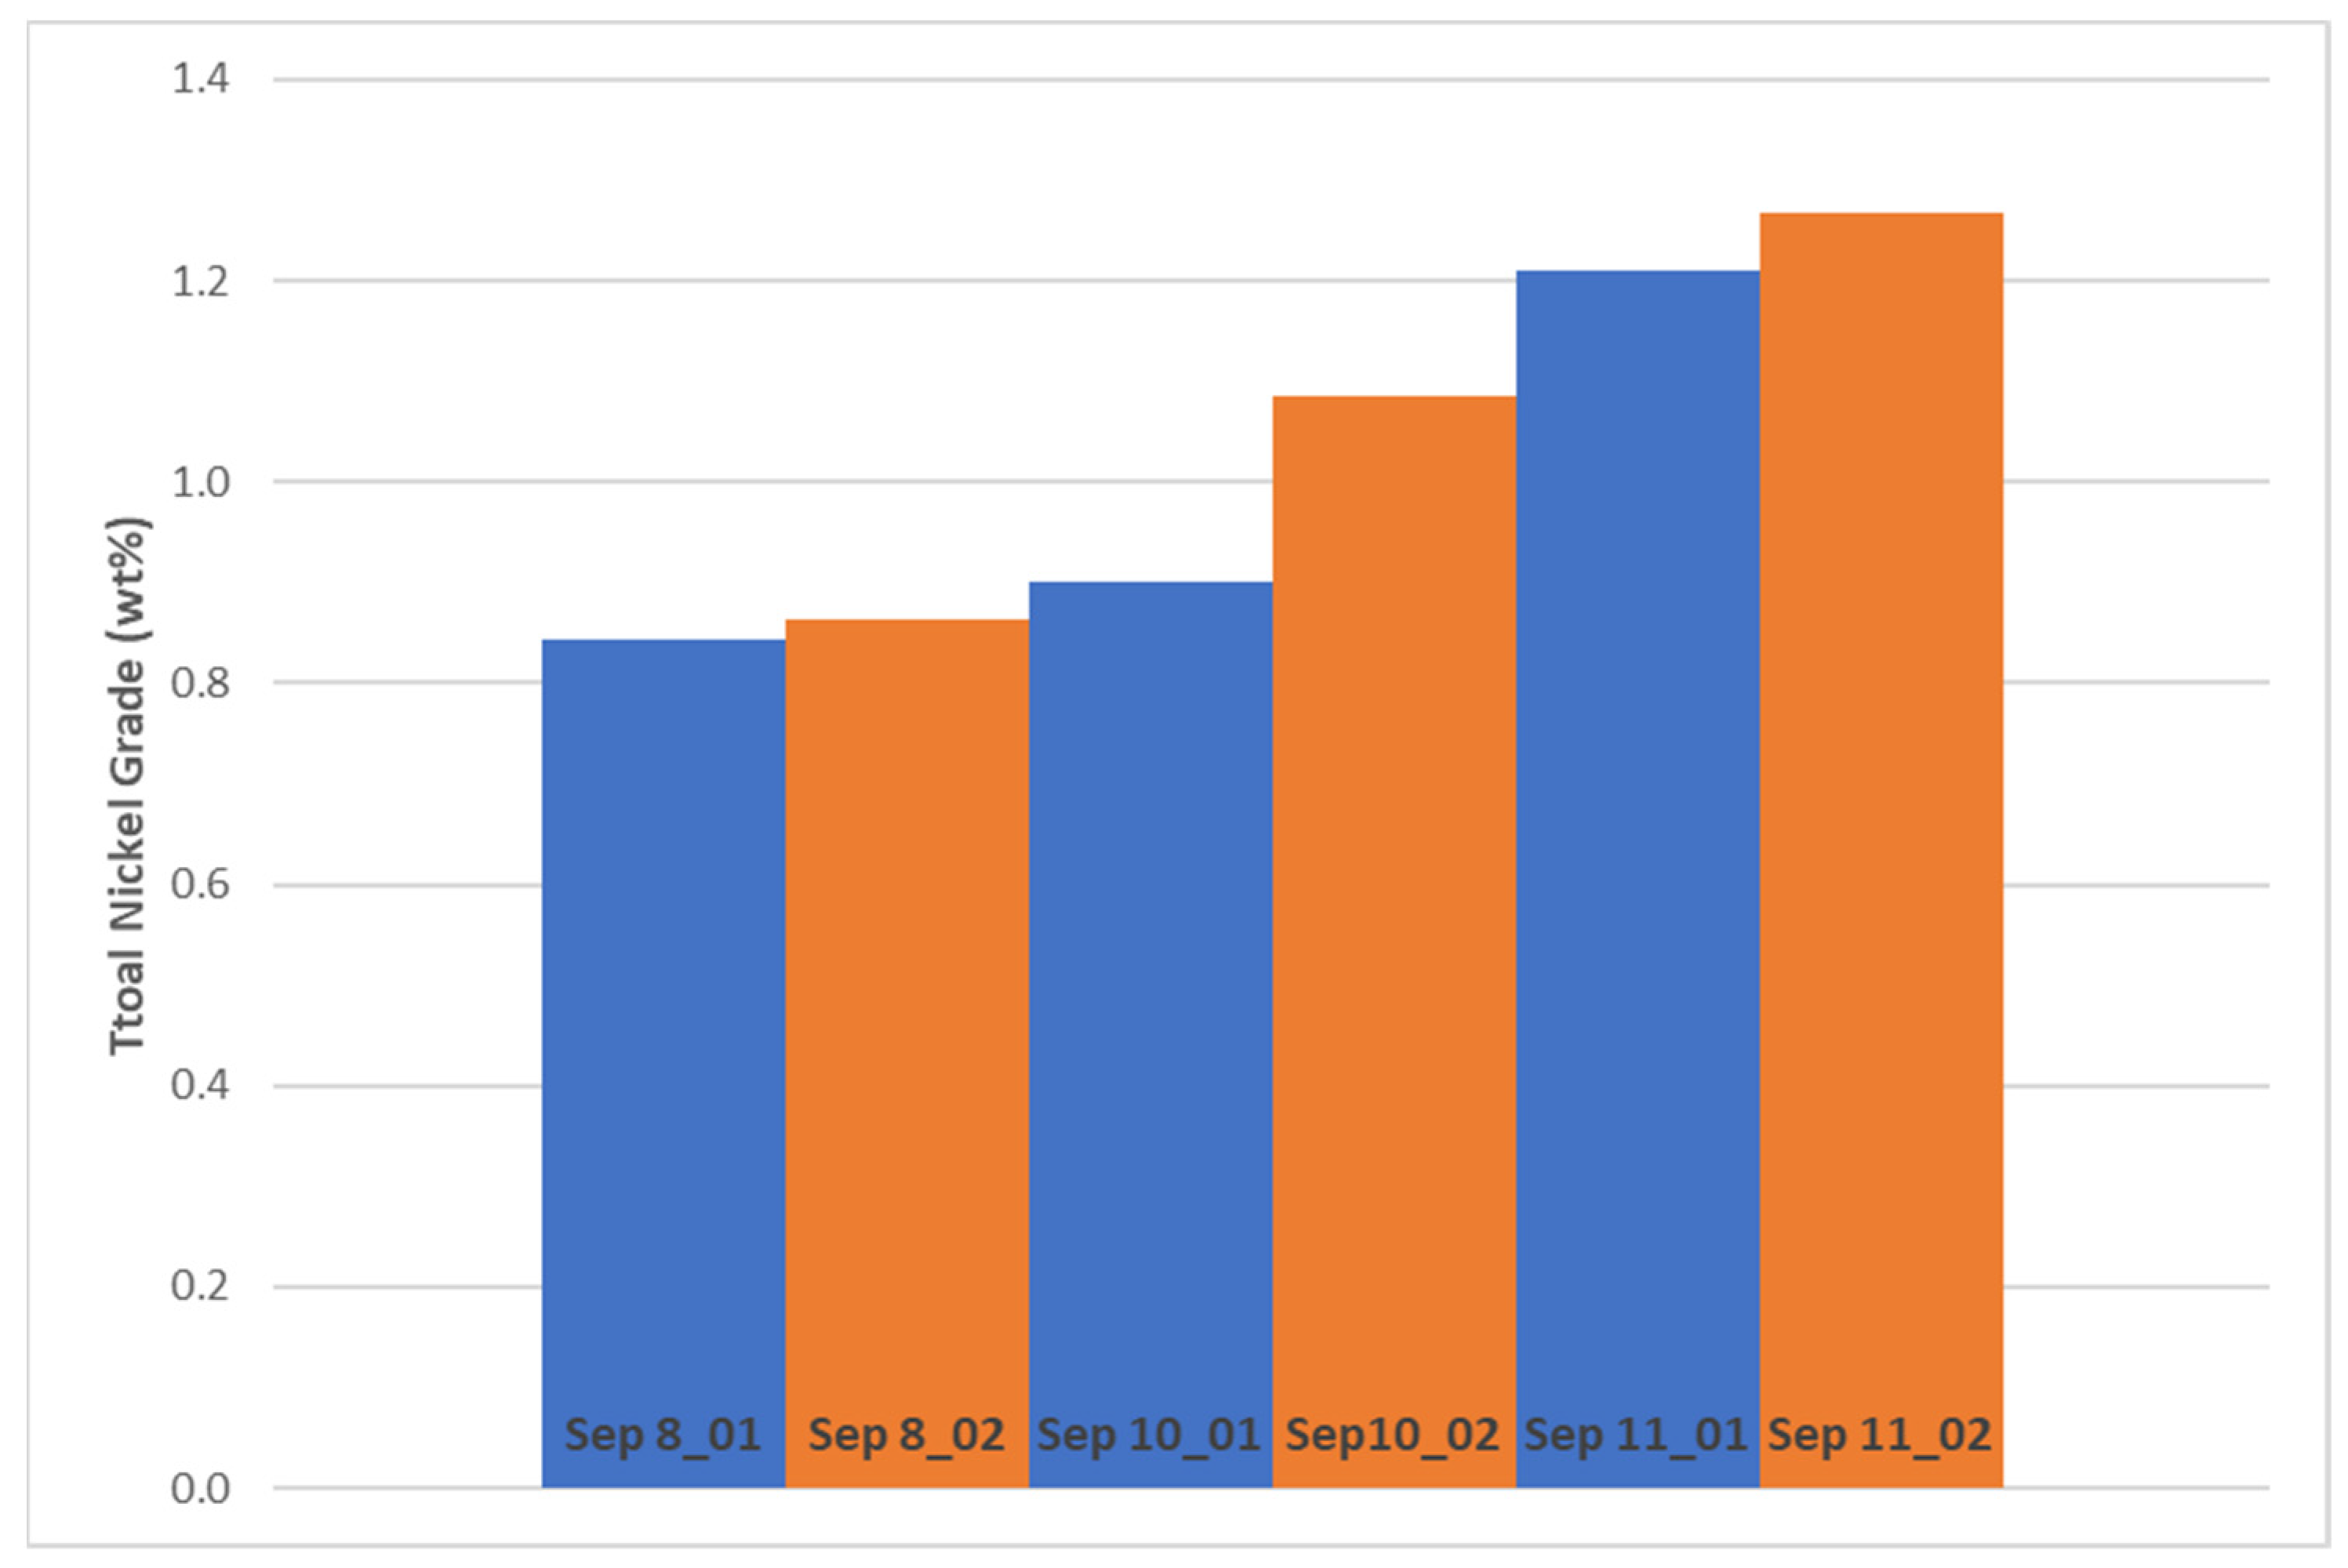
Figure 4 and Figure 5 illustrate that when using DAF treated water both nickel grade and recovery to the combined rougher scavenger nickel concentrate increased in each test pair. Flotation conditions and ore batches were similar in each test, and only the water quality varied due to the sampling date and fluctuating process conditions. Detailed mass balances for each flotation test are given in Appendix A.
A t-test assuming equal variances was performed to check if DAF treatment did improve nickel recovery significantly compared to the tests with the thickener overflow water without the treatment (Table 4). The one-tail P value of the test is 0.08, so there is a 92% probability that DAF treatment has a positive effect on the nickel recovery. When working with true plant water and the varying plant conditions, 92% probability is a good value. Based on the test data it cannot be concluded which individual impurities in the process water had the most significant effect on the nickel recovery, but the overall removal of fine solids and colloids was clearly beneficial for the nickel flotation.

3.2. Chemical and Mineralogical Characterization of the DAF Overflow Solids

The solids removed from the Ni concentrate thickener overflow water from DAF were analyzed chemically and mineralogically. The results of the chemical analysis are provided in Table 5.
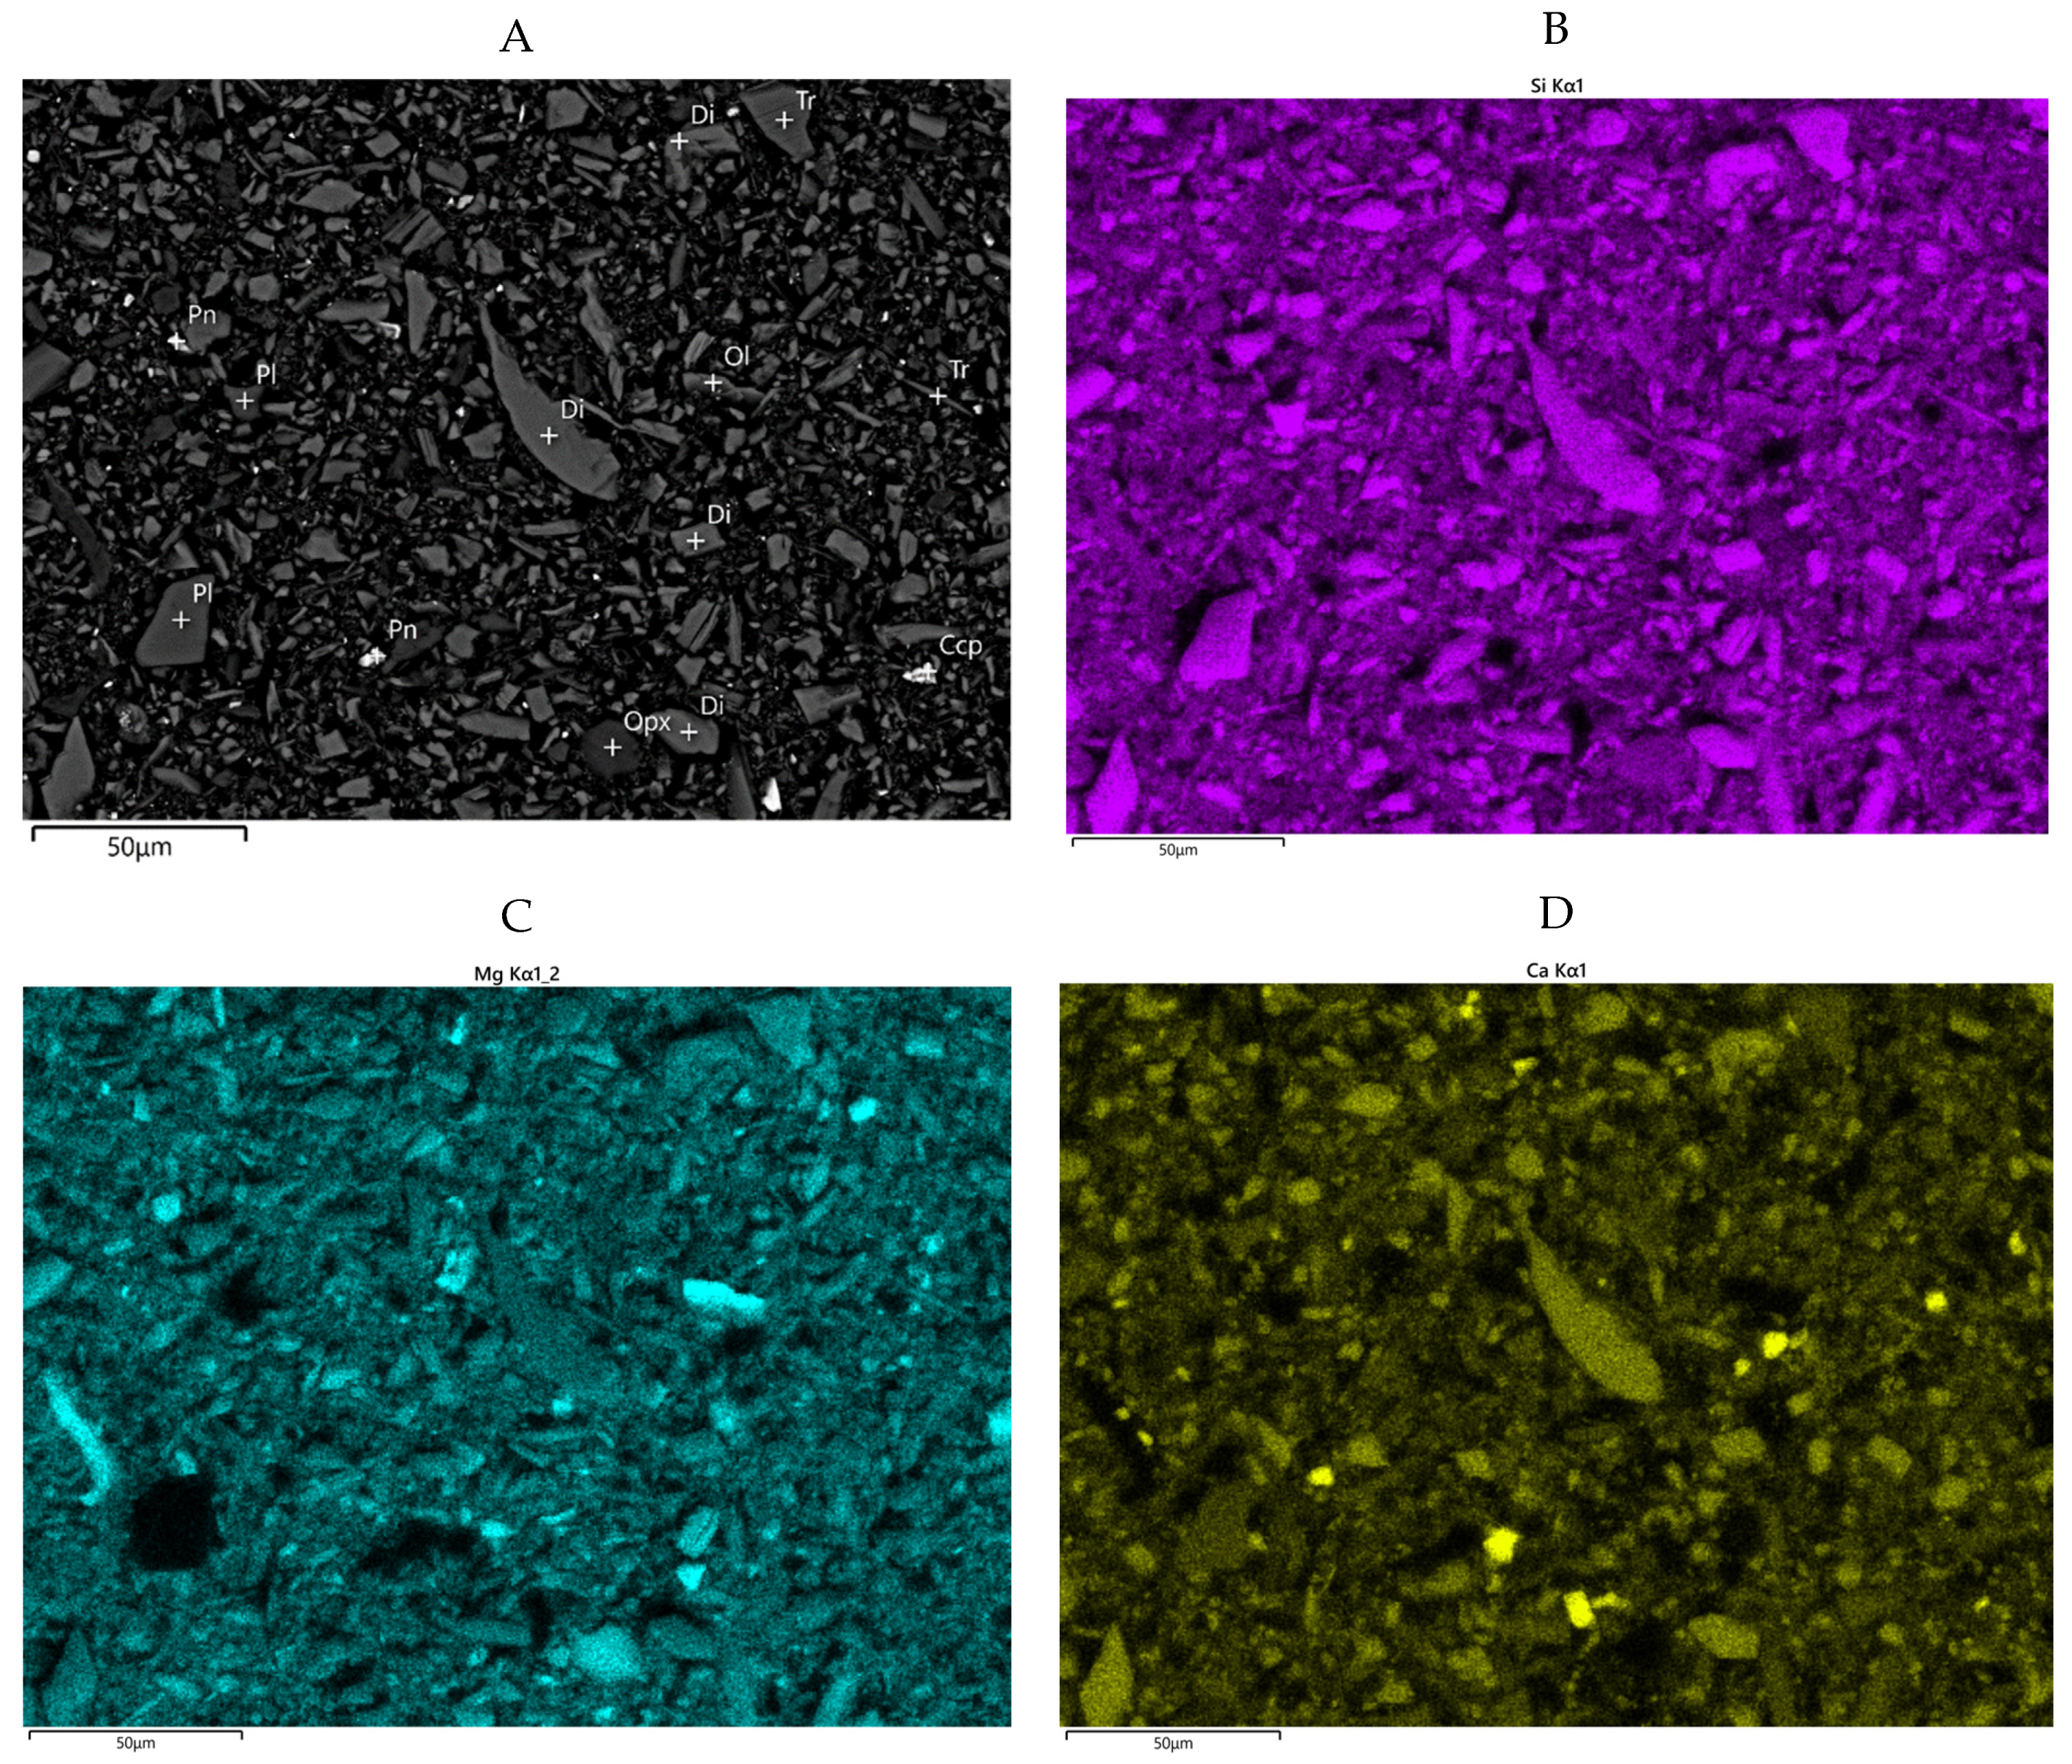
The scanning electron microscope observations showed that the sample consists mainly of silicate minerals. The most typical mineral is diopside (Di), followed by tremolite (Tr) and hornblende with accessory. The cumulative amount of those minerals together with chlorite and plagioclase (Pl) is 74.3 wt% of the sample. Magnesium-rich silicates (18.2 wt%) present in the sample are olivine (Ol), serpentine, orthopyroxenes (Opx), such as enstatite and talc. Disseminated pyrrhotite, pentlandite (Pn) and chalcopyrite (Ccp) grains were observed (Table 6 and Figure 6).

3.3. Mechanism of Impurity Removal from Process Water by Using DAF Technology

Water impurities, such as fine silicate mineral particles, metal hydroxides and thiosulphate ions that are known to have a negative impact on pentlandite flotation performance were removed from the thickener overflow water by the DAF treatment. After process water purification, xanthate adsorption on the mineral surfaces is improved in froth flotation. The fine silicate minerals can attach to the air microbubbles in the DAF process when their surface potential becomes close to neutral after the dosing of the lime, coagulant, and flocculant chemicals. Metal ions react with the hydroxides formed after the aluminum based coagulant addition and can raise to the top of the DAF flotation tank with the microbubbles. In general, any particles having a specific gravity close to the specific gravity of water, low charge and hydrophobic surfaces could be removed using the DAF technique. Hydrodynamic and surface forces, i.e., ion-electrostatic, London-van der Waals and hydrophobic forces determine the probability of adhesion of a particle or floc on a bubble. These forces form the basis for the extended DLVO (Derjaguin, Landau, Verwey, and Overbeek) theory. In addition, the surface roughness of particles plays a role in the particle-bubble interactions in solid-liquid-solid systems, such as DAF [28,29,30,31,32,33].
As DAF treatment is not selective towards specific impurities in the process water, some other water treatment method could also be suitable and lead to similar improvements in froth flotation as DAF. However, DAF has been found to be a versatile purifying method for critical components, while for example ion-exchange treatment is unable to remove colloids. DAF does not have similar clogging issues as filters. In addition, it has been shown that the DAF process remains in a state of control even when the quality of the process water changes continuously, which is often the case at concentrator plants [34]. DAF has been found to be an industrially reliable technology, as it has been used, e.g., in the pulp and paper industry for decades. It must be noted that impurity removal from process water does not need to be complete but an increase in froth flotation nickel recovery is seen also after partial removal of impurities from the water. Therefore, DAF can be seen as a viable stand-alone option for purifying the internal water streams at a concentrator plant.

3.4. Net Present Value Calculation

A net present value calculation was carried out based on the test results. It must be noted that the calculation is applicable only for the studied case of Kevitsa. The cold weather conditions, i.e., the need of locating the equipment indoors in a heated building and insulation of outdoor piping, have been considered in the calculation. For a plant located in warmer climate, the construction costs would be lower.
The following initial data was used in for the net present value calculation:
  • Industrial size DAF capacity 30 m3/h water feed
  • Discount rate 10%
  • DAF investment cost including equipment, engineering, piping, EIA, construction, procurement, and logistics with safety margin 3.6 M€. The figure considers that the solids removed at DAF from water have no commercial value and would be pumped to the plant tailings area.
  • Additional Ni concentrate tonnages recovered are estimated at 230 t/y. The figure is based on a conservative estimation that an increase of 2.6 percentage points in Ni rougher scavenger concentrate Ni recovery in laboratory scale could correspond to 1 percentage point recovery increase in plant scale to the final nickel concentrate.
  • Price of Nickel 13,000 €/t with 60% of the revenue for the concentrator
  • PAX XL-100 coagulant 300 €/t
  • Superfloc A120 flocculant 4000 €/t
  • Ca(OH)2 200 €/t
  • Estimated labor cost 50,000 €/a for the first year, 25,000 €/a for the following years
  • Estimated cost of electricity and other utilities, such as pressurized air 70,000 €/a
  • The net present value calculated over 10 years based on the data above is 5.0 M€.
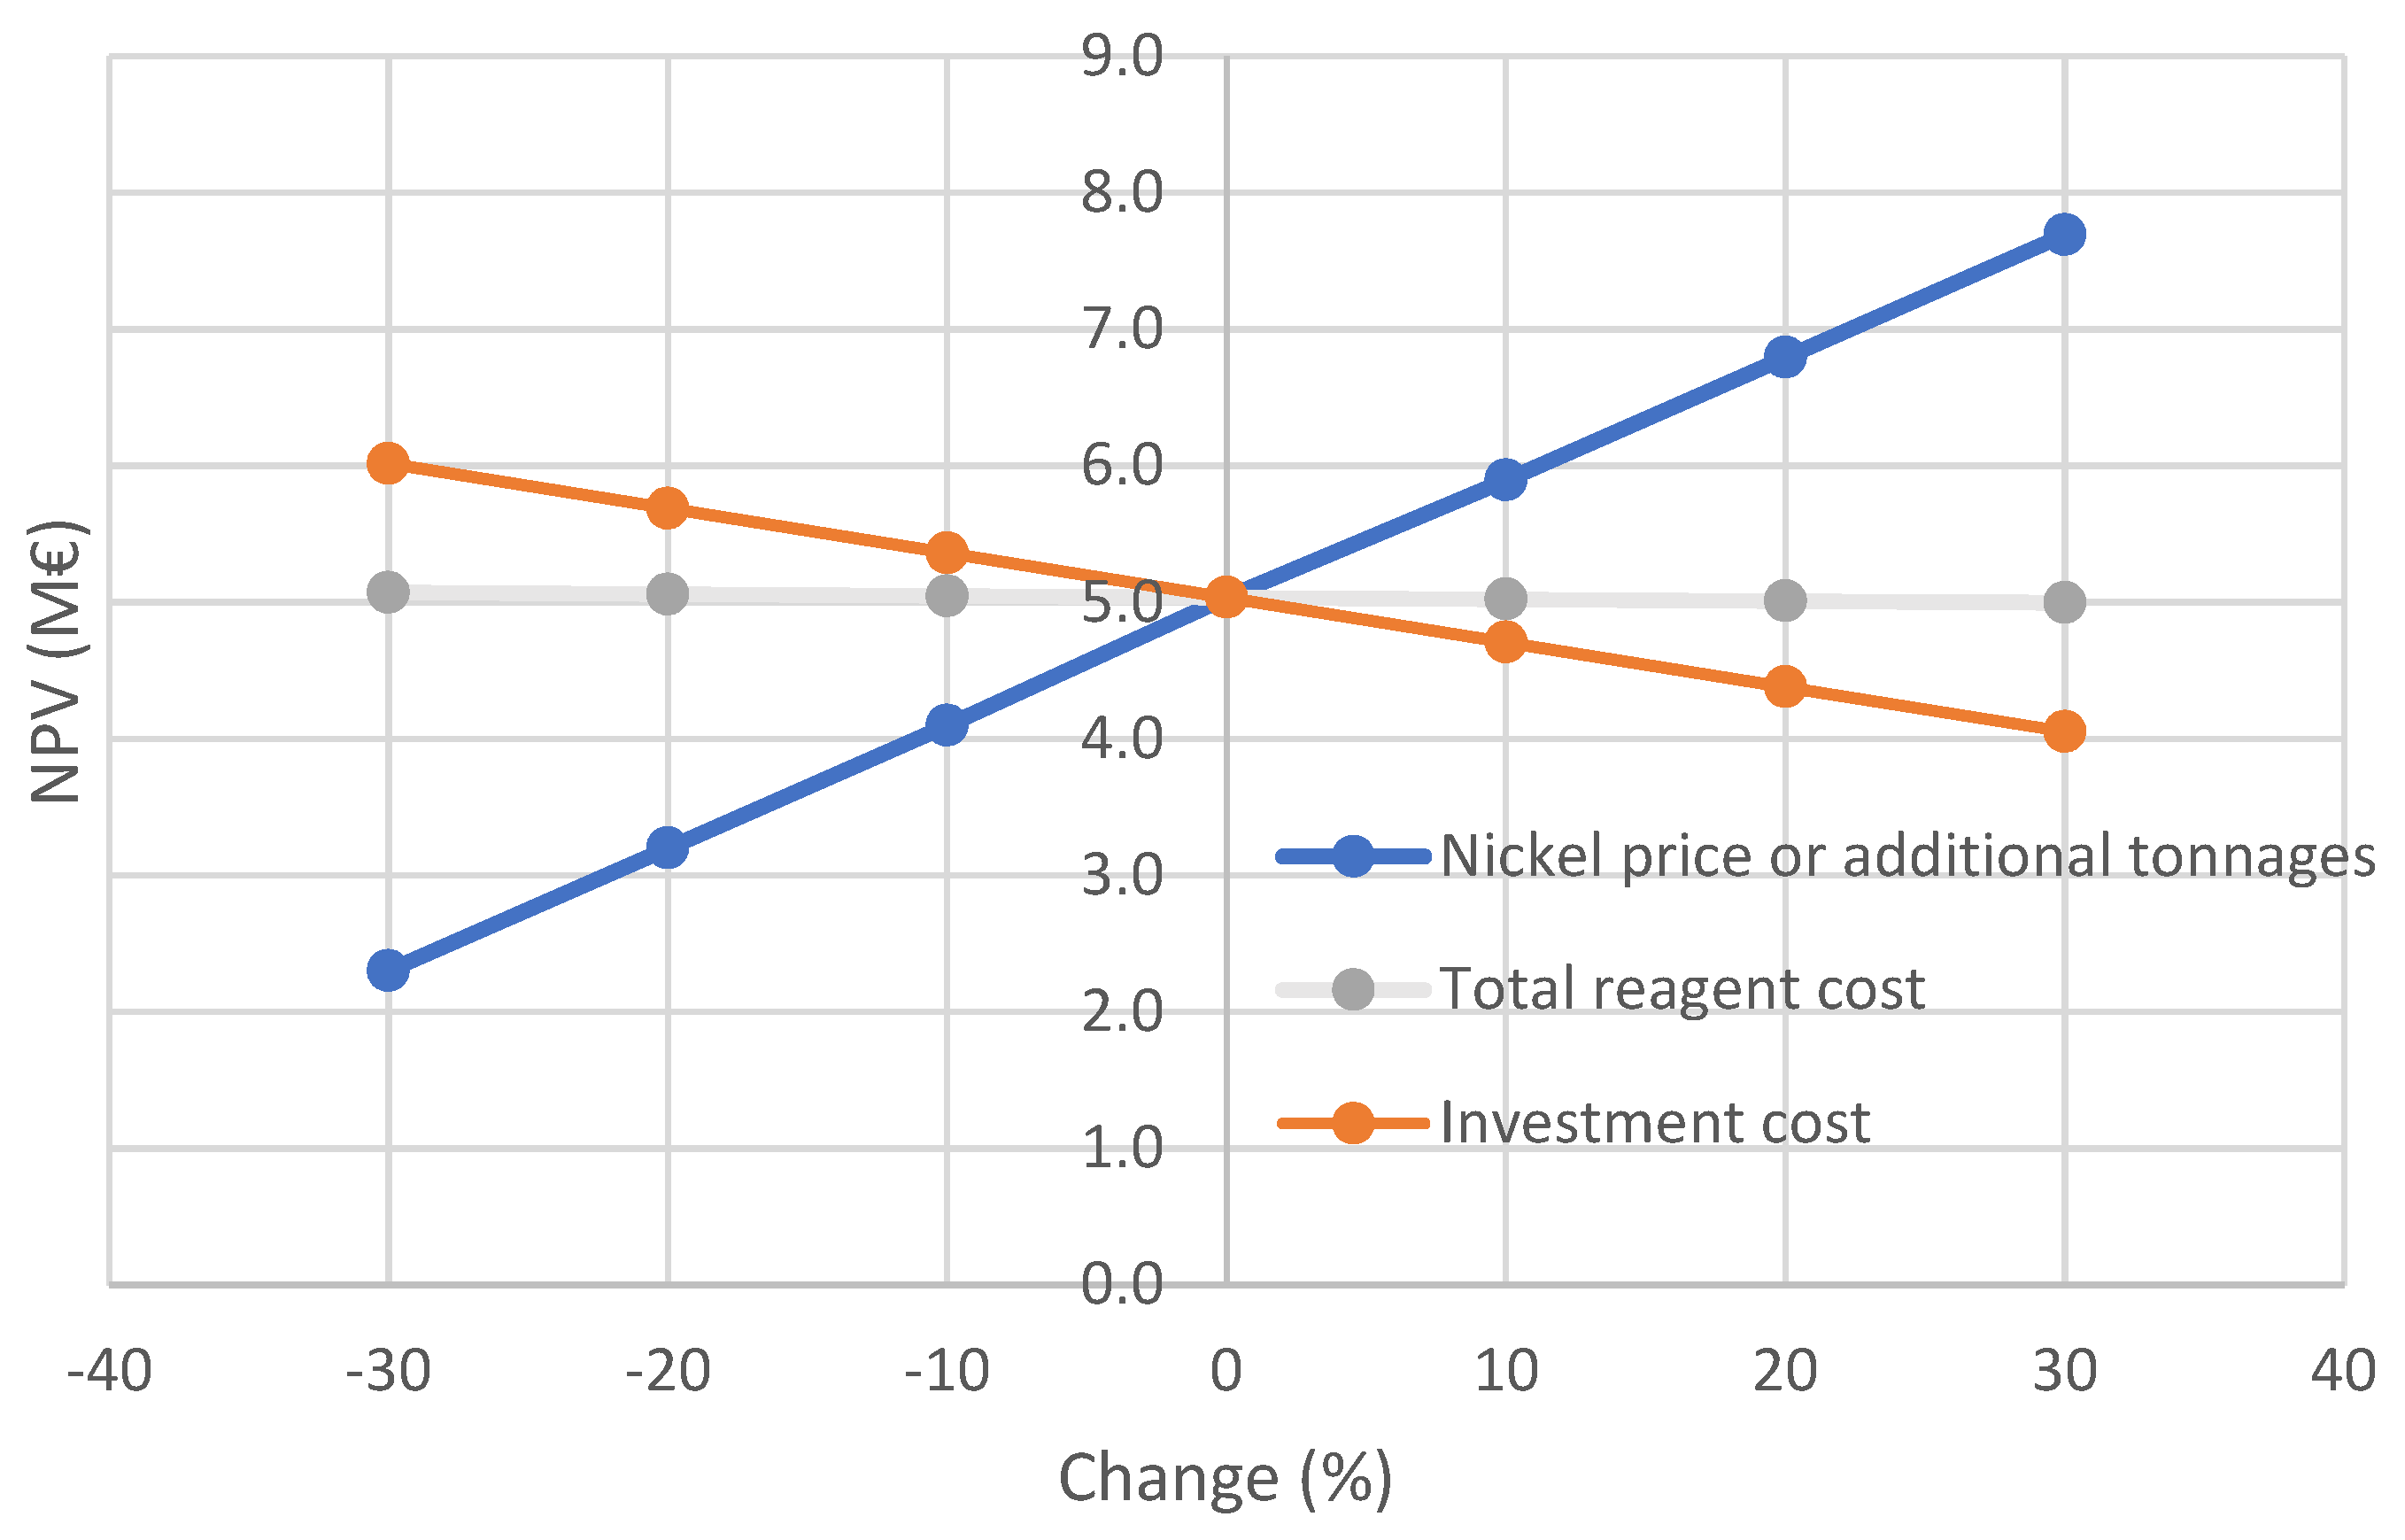
The sensitivity of the net present value calculation was tested by changing the price of nickel, additional produced nickel tonnages, DAF investment cost and the total reagent costs using the calculation above as the base case. The price of nickel and additional tonnages have the same proportional effect on the NPV calculation. Figure 7 shows that the additional revenue for the concentrator is the key parameter defining the feasibility of the additional DAF water treatment in the process. It can be also seen that even with much lower water treatment and/or flotation performance and thereby at lower additional produced nickel tonnages, the investment would be profitable.

4. Conclusions

It is known that pentlandite flotation is sensitive to fine solids. The target of the study was to reduce the overall solids load in the circulating thickener overflow process water. The results indicate that DAF treatment efficiently improves Ni concentrate thickener OF quality and thereby the nickel recovery in flotation. DAF removes silicate minerals, metal hydroxides and thiosulphate ions, each of them being individually harmful for nickel recovery based on earlier studies [7,8,9,10,11,12,13,14]. The total nickel recovery to the Kevitsa Ni rougher-scavenger concentrate in laboratory scale increased by 2.6 percentage points at 0.06 percentage points increase in Ni grade when carrying out DAF treatment at optimized conditions compared to non-treated water. This is a significant improvement in the metallurgical performance of the flotation circuit. Improved nickel recovery was seen also with other corresponding test pairs of the same campaign. Statistical testing indicates that there is a 92% probability that the observed increase in Ni recovery is due to DAF treatment.
Economic calculations indicate that even with conservative assumptions on the nickel price and additional concentrate tonnages the net present value over ten years is positive. Consequently, DAF would be a feasible and profitable investment for the concentrator plant. It aids the closing of the plant water circuits and the saving of fresh water. As the nickel thickener overflow comprises less than 10% of the water added to the Kevitsa process, it would be worth studying if treating other process water streams could bring additional improvements on the flotation performance. The results can be seen to be encouraging also for other nickel concentrators to test improving flotation performance by treating the circulating water streams using DAF, as the harmful effects of impure process water on pentlandite recovery have been shown widely.
To further improve the reliability of the results, and to investigate the effect of each impurity in the process water on the nickel recovery in flotation, a pilot campaign of several months with automated flocculant and coagulant dosing system would be needed.
Author Contributions

Conceptualization, A.A. and E.S.; data curation, A.A.; formal analysis, A.A. and R.D.; funding acquisition, E.S.; investigation, T.M.K.L., A.L. and S.H.; methodology, A.A. and E.S.; project administration, E.S.; resources, E.S. and B.M.; supervision, O.D.; validation, A.A. and T.M.K.L.; visualization, A.A. and A.L.; writing—original draft, A.A.; writing—review and editing, A.A., B.M. and R.D. All authors have read and agreed to the published version of the manuscript.

Funding

This research was funded by Business Finland.

Conflicts of Interest

The authors declare no conflict of interest.

Appendix A

Table A1. Mass balance for flotation test Sep 08_01.
StreamMass (g) MeasuredMass (g) BalancedTotal Solids Rec %Cu % MeasuredCu % BalancedCu Rec %Ni % MeasuredNi % BalancedNi Rec %
Feed 1000100.0 0.40100.0 0.2579100.0
Cu_RC36.836.83.689.079.0784.13.643.6452.0
Cu_RT 96396.3 0.065515.88 0.128548.0
Cu_ScC9.279.270.9271.2801.2802.9881.6801.6806.04
Cu_ScT 95395.4 0.053712.89 0.113441.9
Ni_RC18.0118.011.8020.5410.5412.4541.0901.0907.62
Ni_RT 93593.6 0.044310.44 0.094634.3
NiScC14.0514.051.4060.3270.3271.1570.5260.5262.867
Tails92192192.20.0400.0409.280.0880.08831.46
Cu_RC+Cu_ScC 46.14.61 7.5087.1 3.2558.1
Ni_RC+Ni_ScC 32.13.21 0.4473.61 0.84310.48
Table A2. Mass balance for flotation test Sep 08_02.
StreamMass (g) MeasuredMass (g) BalancedTotal Solids Rec %Cu % MeasuredCu % BalancedCu Rec %Ni % MeasuredNi % BalancedNi Rec %
Feed 1002100.0 0.400100.0 0.2553100.0
Cu_RC34.434.43.439.759.7583.63.783.7850.8
Cu_RT 96796.6 0.067716.35 0.130149.2
Cu_ScC10.2410.241.0221.3301.3303.401.7601.7607.05
Cu_ScT 95795.5 0.054212.95 0.112642.2
Ni_RC18.2518.251.8220.5210.5212.3751.1301.1308.07
Ni_RT 93993.7 0.045110.57 0.092934.1
NiScC13.4013.401.3380.3280.3281.0980.4980.4982.610
Tails92592592.40.0410.0419.480.0870.08731.49
Cu_RC+Cu_ScC 44.64.45 7.8287.1 3.3257.8
Ni_RC+Ni_ScC 31.73.160 0.4393.47 0.86210.68
Table A3. Mass balance for flotation test Sep 10_01.
StreamMass (g) MeasuredMass (g) BalancedTotal Solids Rec %Cu % MeasuredCu % BalancedCu Rec %Ni % MeasuredNi % BalancedNi Rec %
Feed 1003100.0 0.37100.0 0.2705100.0
Cu_RC31.1231.123.1019.669.6680.14.474.4751.3
Cu_RT 97296.9 0.076719.87 0.136048.7
Cu_ScC13.1413.141.3101.5701.5705.501.9001.9009.20
Cu_ScT 95995.6 0.056214.37 0.111939.5
Ni_RC14.8014.801.4750.6130.6132.4181.1401.1406.22
Ni_RT 94494.1 0.047511.96 0.095833.3
NiScC13.3613.361.3310.3610.3611.2860.6370.6373.136
Tails93193192.80.0430.04310.670.0880.08830.19
Cu_RC+Cu_ScC 44.34.41 7.2685.6 3.7160.5
Ni_RC+Ni_ScC 28.162.806 0.4933.70 0.9019.35
Table A4. Mass balance for flotation test Sep 10_02.
StreamMass (g) MeasuredMass (g) BalancedTotal Solids Rec %Cu % MeasuredCu % BalancedCu Rec %Ni % MeasuredNi % BalancedNi Rec %
Feed 1000100.0 0.367100.0 0.2498100.0
Cu_RC31.1431.143.1139.749.7482.74.494.4956.0
Cu_RT 96996.9 0.065417.29 0.113544.0
Cu_ScC9.869.860.9861.7201.7204.622.2002.2008.68
Cu_ScT 95995.9 0.048412.66 0.092135.4
Ni_RC13.2913.291.3290.8930.8933.241.5301.5308.14
Ni_RT 94694.6 0.03659.43 0.071927.22
NiScC13.9813.981.3980.4060.4061.5480.6650.6653.72
Tails93293293.20.0310.0317.880.0630.06323.50
Cu_RC+Cu_ScC 41.04.10 7.8187.3 3.9464.6
Ni_RC+Ni_ScC 27.272.726 0.6434.78 1.08711.86
Table A5. Mass balance for flotation test Sep 11_01.
StreamMass (g) MeasuredMass (g) BalancedTotal Solids Rec %Cu % MeasuredCu % BalancedCu Rec %Ni % MeasuredNi % BalancedNi Rec %
Feed 998100.0 0.36100.0 0.2797100.0
Cu_RC32.132.13.218.648.6477.34.134.1347.5
Cu_RT 96696.8 0.084122.66 0.151852.5
Cu_ScC9.509.500.9522.1502.1505.702.6002.6008.85
Cu_ScT 95695.8 0.063516.96 0.1343.7
Ni_RC18.1818.181.8220.8530.8534.331.5901.59010.36
Ni_RT 93894.0 0.048212.63 0.099133.3
NiScC13.7813.781.3810.5330.5332.0500.7110.7113.51
Tails92492492.60.0410.04110.580.0900.09029.81
Cu_RC+Cu_ScC 41.64.17 7.1683.0 3.7856.3
Ni_RC+Ni_ScC 32.03.20 0.7156.38 1.21113.87
Table A6. Mass balance for flotation test Sep 11_02.
StreamMass (g) MeasuredMass (g) BalancedTotal Solids Rec %Cu % MeasuredCu % BalancedCu Rec %Ni % MeasuredNi % BalancedNi Rec %
Feed 1002100.0 0.379100.0 0.2715100.0
Cu_RC29.1229.122.9069.829.8275.33.813.8140.8
Cu_RT 97397.1 0.096524.72 0.165659.2
Cu_ScC12.0512.051.2032.4802.4807.872.6502.65011.74
Cu_ScT 96195.9 0.066616.85 0.134447.5
Ni_RC21.5321.532.1490.8950.8955.071.6201.62012.82
Ni_RT 93993.7 0.047611.78 0.100434.7
NiScC13.9513.951.3920.5530.5532.0310.7230.7233.71
Tails92592592.40.0400.0409.750.0910.09130.95
Cu_RC+Cu_ScC 41.24.11 7.6783.2 3.4752.5
Ni_RC+Ni_ScC 35.53.54 0.7617.10 1.26716.53

References

  1. Northey, S.A.; Mudd, G.M.; Werner, T.T.; Haque, N.; Yellishetty, M. Sustainable water management and improved corporate reporting in mining. Water Resour. Ind. 2019, 21, 100104. [Google Scholar] [CrossRef]
  2. Kinnunen, P.; Obenaus-Emler, R.; Raatikainen, J.; Guignot, S.; Guimera, J.; Ciroth, A.; Heiskanen, K. Review of closed water loops with ore sorting and tailings valorisation for a more sustainable mining industry. J. Clean. Prod. 2021, 278, 123237. [Google Scholar] [CrossRef]
  3. Ihle, C.F.; Kracht, W. The relevance of water recirculation in large scale mineral processing plants with a remote water supply. J. Clean. Prod. 2018, 177, 34–51. [Google Scholar] [CrossRef]
  4. Kotiranta, T.; Horn, S.; Jansson, K.; Reuter, M.A. Towards a “minimum impact” copper concentrator: A sustainability assessment. In Proceedings of the Procemin 11th International Mineral Processing Conference, Santiago, Chile, 21–23 October 2015. [Google Scholar]
  5. Kirjavainen, V.; Schreithofer, N.; Heiskanen, K. Effect of calcium and thiosulfate ions on flotation selectivity of nickel-copper ores. Miner. Eng. 2002, 15, 1–5. [Google Scholar] [CrossRef]
  6. Mhonde, N.; Schreithofer, N.; Corin, K.; Mäkelä, M. Assessing the Combined Effect of Water Temperature and Complex Water Matrices on Xanthate Adsorption Using Multiple Linear Regression. Minerals 2020, 10, 733. [Google Scholar] [CrossRef]
  7. Edwards, C.R.; Kipkie, W.B.; Agar, G.E. The effect of slime coatings of the serpentine minerals, chrysotile and lizardite, on pentlandite flotation. Int. J. Miner. Process. 1980, 7, 33–42. [Google Scholar] [CrossRef]
  8. Kirjavainen, V.; Heiskanen, K. Some factors that affect beneficiation of sulphide nickel–copper ores. Miner. Eng. 2007, 20, 629–633. [Google Scholar] [CrossRef]
  9. Liu, W.; Moran, C.J.; Vink, S. A review of the effect of water quality on flotation. Miner. Eng. 2013, 53, 91–100. [Google Scholar] [CrossRef]
  10. Pietrobon, M.C.; Grano, S.R.; Sorbieraj, S.; Ralston, J. Recovery mechanisms for pentlandite and MgO-bearing gangue minerals in nickel ores from Western Australia. Miner. Eng. 1997, 10, 775–786. [Google Scholar] [CrossRef]
  11. Kusuma, A.M.; Liu, Q.; Zeng, H. Understanding interaction mechanisms between pentlandite and gangue minerals by zeta potential and surface force measurements. Miner. Eng. 2014, 69, 15–23. [Google Scholar] [CrossRef]
  12. Alvarez-Silva, M.; Uribe-Salas, A.; Waters, K.E.; Finch, J.A. Zeta potential study of pentlandite in the presence of serpentine and dissolved mineral species. Miner. Eng. 2016, 85, 66–71. [Google Scholar] [CrossRef]
  13. Nanthakumar, B.; Kelebek, S. Stagewise analysis of flotation by factorial design approach with an application to the flotation of oxidized pentlandite and pyrrhotite. Int. J. Miner. Process. 2007, 84, 192–206. [Google Scholar] [CrossRef]
  14. Shackleton, N.J.; Malysiak, V.; De Vaux, D.; Plint, N. Water quality—A comparative study between moncheite and pentlandite in mixture with pyroxene. Miner. Eng. 2012, 36–38, 53–64. [Google Scholar] [CrossRef]
  15. Edzwald, J.K. Review: Dissolved air flotation and me. Water Res. 2010, 44, 2077–2106. [Google Scholar] [CrossRef]
  16. Gorczyca, B.; Klassen, P. Optimization of solids separation in dissolved air flotation. Water Qual. Res. J. 2008, 43, 93–102. [Google Scholar] [CrossRef]
  17. Edzwald, J.K.; Walsh, J.P.; Kaminski, G.S.; Dunn, H.J. Flocculation and air requirements for dissolved air flotation. J. Am. Water Work. Assoc. 1992, 84, 92–100. [Google Scholar] [CrossRef]
  18. Kiuru, H.J. Development of dissolved air flotation technology from the first generation to the newest (third) one (DAF in turbulent flow conditions). Water Sci. Technol. 2001, 43, 1–7. [Google Scholar] [CrossRef]
  19. Rodrigues, R.T.; Rubio, J. DAF–dissolved air flotation: Potential applications in the mining and mineral processing industry. Int. J. Miner. Process. 2007, 82, 1–13. [Google Scholar] [CrossRef]
  20. Rubio, J.; Souza, M.L.; Smith, R.W. Overview of flotation as a wastewater treatment technique. Miner. Eng. 2002, 15, 139–155. [Google Scholar] [CrossRef]
  21. Levay, G.; Smart, R.S.C.; Skinner, W.M. The impact of water quality on flotation performance. J. S. Afr. Inst. Min. Metall. 2001, 101, 69–75. [Google Scholar]
  22. Le, T.M.K.; Miettinen, H.; Bomberg, M.; Schreithofer, N.; Dahl, O. Challenges in the assessment of mining process water quality. Minerals 2020, 10, 940. [Google Scholar] [CrossRef]
  23. Santos, M.A.; Capponi, F.; Ataíde, C.H.; Barrozo, M.A.S. Wastewater treatment using DAF for process water reuse in apatite flotation. J. Clean. Prod. 2021, 308, 127285. [Google Scholar] [CrossRef]
  24. Matis, K.A.; Peleka, E.N.; Zamboulis, D.; Erwe, T.; Mavrov, V. Air sparging during the solid/liquid separation by microfiltration: Application of flotation. Sep. Purif. Technol. 2004, 40, 1–7. [Google Scholar] [CrossRef]
  25. Kelebek, S.; Tukel, C. The effect of sodium metabisulfite and triethylenetetramine system on pentlandite–pyrrhotite separation. Int. J. Miner. Process. 1999, 57, 135–152. [Google Scholar] [CrossRef]
  26. Sibanda, V.; Khan, R.; Danha, G. The effect of chemical reagents on flotation performance of a pentlandite ore: An attainable region approach. Powder Technol. 2019, 352, 462–469. [Google Scholar] [CrossRef]
  27. Musuku, B.; Muzinda, I.; Lumsden, B. Cu–Ni processing improvements at First Quantum’s Kevitsa mine. Miner. Eng. 2016, 88, 9–17. [Google Scholar] [CrossRef]
  28. Palaniandy, P.; Adlan, M.N.; Aziz, H.A.; Hung, Y.T.; Murshed, M.F. Dissolved air flotation (DAF) for wastewater treatment. In Wastewater Treatment in the Service and Utility Industries, 1st ed.; Hung, Y.T., Wang, L.K., Shammas, N.K., Chen, J.P., Eds.; CRC Press: Boca Raton, FL, USA, 2017. [Google Scholar]
  29. Yoon, R.H.; Mao, L. Application of Extended DLVO Theory, IV Derivation of flotation rate equation from first principles. J. Colloid Interface Sci. 1996, 181, 613–626. [Google Scholar] [CrossRef]
  30. Gomez-Flores, A.; Bradford, S.A.; Hwang, G.; Heyes, W.; Kim, H. Particle-bubble interaction energies for particles with physical and chemical heterogeneities. Miner. Eng. 2020, 155, 106472. [Google Scholar] [CrossRef]
  31. Guven, O.; Celik, M.S.; Drelich, J.W. Flotation of methylated roughened glass particles and analysis of particle-bubble energy barrier. Miner. Eng. 2015, 79, 125–132. [Google Scholar] [CrossRef]
  32. Kyzas, G.Z.; Matis, K.A. Flotation in water and wastewater treatment. Processes 2018, 6, 116. [Google Scholar] [CrossRef] [Green Version]
  33. Ahveninen, R. The chemical aspects of poor floatability of fine pentlandite. Doctoral Thesis, Helsinki University of Technology, Esbo, Finland, 2000. [Google Scholar]
  34. TERAMS. Integrated Mining Technologies for More Sustainable Raw Material Supply. Available online: http://iterams.eu/Content/PublicArea/ITERAMS_Shortbook_201217.pdf (accessed on 20 February 2023).
Figure 1. Overall flowsheet of Kevitsa concentrator plant with the sampling point for the process water.
Minerals 13 00319 g001
Figure 2. Particle size distribution for the ground flotation feed on a logarithmic scale.
Minerals 13 00319 g002
Figure 3. Laboratory flotation test flowsheet. The abbreviations for the test products shown in the flowsheet are Cu_RC: copper rougher concentrate, Cu_RT: copper rougher tailings, Cu_ScC: copper scavenger concentrate, Cu_ScT: copper scavenger tailings, Ni_RC: nickel rougher concentrate, Ni_RT: nickel rougher tailings and NiScC: nickel scavenger concentrate.
Minerals 13 00319 g003
Figure 4. Total nickel recovery to Ni rougher-scavenger concentrate using process water without (01) and with (02) DAF treatment.
Minerals 13 00319 g004
Figure 5. Total nickel grade in Ni rougher-scavenger concentrate using process water without (01) and with (02) DAF treatment.
Minerals 13 00319 g005
Figure 6. Minerals found in the DAF overflow solids and distribution of elements. (A) Backscatter electron image; EDS maps of (B) Si, (C) Mg and (D) Ca distribution.
Minerals 13 00319 g006
Figure 7. Sensitivity of the NPV calculation.
Minerals 13 00319 g007
Table 1. Average mineral composition of the Kevitsa ore.
MineralAmount (wt%)
Pentlandite0.64
Violarite0.01
Ni Silicate/Ni Oxide0.01
Total Ni-Fe Sulphide0.66
Chalcopyrite0.87
Cubanite0.20
Total Cu-Fe Sulphide1.07
Pyrrhotite2.20
Pyrite0.05
Total Fe Sulphide2.25
Quartz0.09
Feldspar1.36
Mica1.03
Amphibole47.3
Diopside18.5
Orthopyroxene3.05
Olivine8.16
Talc0.29
Serpentine7.66
Chlorite4.19
Carbonate1.29
Fe-Oxide2.42
Fe-Cr-Oxide0.57
Other0.58
Total non-sulphide gangue96.01
Table 2. Particle size distribution for the ground flotation feed.
Sieve opening (µm)Material passing (%)
10687.7
9080.8
7572.3
6364.2
4550.5
3239.9
2533.9
1523.9
1017.9
510.6
Table 3. Process water sample composition before (01) and after (02) DAF treatment.
Component
(Analysis Method)
UnitAnalysed atTest
Sep 8_01Sep 8_02Sep 10_01Sep 10_02Sep 11_01Sep 11_02
Almg/lOnsitenm0.4360.0870.9080.0851.269
Ca (ICP)mg/lMORC *200213211220204208
Cu (dissolved) (UV-Vis)mg/lOnsite0.222<0.1<0.10.1640.105<0.1
Fe (dissolved) (UV-Vis)mg/lOnsite<0.2<0.2<0.2<0.2<0.2<0.2
Fe (dissolved+colloids) (ICP)mg/lMORC2814291
K (ICP)mg/lMORC626259606061
Mg (dissolved) (ICP)mg/lMORC767580777677
Mg (dissolved+colloids) (ICP)mg/lMORC998790828281
Na (ICP)mg/lMORC141139134133135137
Ni (dissolved) (UV-Vis)mg/lOnsite0.3380.1440.3080.1950.2220.197
S (ICP)mg/lMORC251251261263260255
Si (dissolved) (ICP)mg/lMORC5.63.87.245.62.7
Si (dissolved+colloids) (ICP)mg/lMORC606060606060
NO3mg/lMORC202015151520
SO42− (dissolved) (UV-Vis)mg/lOnsite706685679594686616
CODmg/lOnsite531089818346
DO (dissolved oxygen)%Onsite971039510395103
DOCmg/lMORC111216161514
TOCmg/lOnsite101215151311
ORPmVOnsite3.37.418121821
pH Onsite9.59.59.59.59.59.5
Temperature°COnsite14.515.315.716.515.715.3
Sp. conductivityµS/cmOnsite230023362319231922622329
TurbidityNTUOnsite9620nm **nmnmnm
* MORC = Metso Outotec Research Center, ** nm = not measured.
Table 4. Two-sample t-test.
ParameterNi Recovery without DAF TreatmentNi Recovery with DAF Treated Water
Mean12.916
Variance5.78.3
Observations44
Pooled Variance7
Hypothesized Mean Difference0
df6
t Stat−1.64
P(T ≤ t) one-tail0.08
t Critical one-tail1.94
P(T ≤ t) two-tail0.15
t Critical two-tail2.45
Table 5. Elemental composition of the solids removed from the thickener overflow water.
Element/OxideAmount (%)
Na2O0.53
MgO21.22
Al2O34.08
K2O0.2
CaO13.02
Fe tot5
Fe sulf0.67
Co0.01
Ni tot0.278
Ni sulf0.22
Cu0.031
C0.4
S0.54
SiO246.6
Ferromagnetic0.5
Table 6. Chemical composition of the minerals in the DAF overflow solids.
MineralFormulaAmount (wt%)
Ca- and/or Al-containing silicates: 74.27
DiopsideCaMgSi2O6
Amphiboles: TremoliteCa2(Mg,Fe)5Si8O22(OH)2
       HornblendeCa2(Fe,Mg)4Al(Si7Al)O22(OH,F)2
Chlorite(Fe2+Mg, Al, Fe3+)6(Si,Al)4º10(OH,O)8
Plagioclase(Na,Ca)(Si,Al)4º8
Mg silicates: 18.2
Olivine(Mg,Fe)2SiO4
SerpentineMg3(Si2O5)(OH)4
EnstatiteMg2Si2O6
TalcMg3Si4O10(OH)2
BiotiteK(Mg,Fe)3(Al,Fe)Si3O10(OH,F)22.4
Carbonates (calcite + dolomite)Ca(CO3)2, CaMg(CO3)23.19
PyrrhotiteFe(1-x)S0.73
Pentlandite(Fe,Ni)9S80.61
ChalcopyriteCuFeS20.09
MagnetiteFe3+2Fe2+O4≤0.5
Disclaimer/Publisher’s Note: The statements, opinions and data contained in all publications are solely those of the individual author(s) and contributor(s) and not of MDPI and/or the editor(s). MDPI and/or the editor(s) disclaim responsibility for any injury to people or property resulting from any ideas, methods, instructions or products referred to in the content.