Article

Fracture Identification Using Conventional Logs in Ultra-Low Permeability Sandstone Reservoirs: A Case Study of the Chang 6 Member of the Ordos Basin, China

1
Oilfield Department of Changqing Oilfield Company, Xi’an 710018, China
2
State Key Laboratory of Continental Dynamics and National, Department of Geology, Northwest University, Xi’an 710069, China
*
Author to whom correspondence should be addressed.
Minerals 2023, 13(2), 297; https://doi.org/10.3390/min13020297
Submission received: 4 January 2023 / Revised: 13 February 2023 / Accepted: 18 February 2023 / Published: 20 February 2023

Abstract

:
The identification of reservoir fractures is essential as it is an important factor in the design of a field development plan, which in turn affects the efficiency of hydrocarbon production. Water flooding and water channeling are serious due to the lack of objective understanding of the fracture development pattern in the tight oil reservoirs in the Triassic Change 6 member of Y well area, Ordos Basin, China. In this paper, we observed 104.6 m cores from 20 wells with a number of 150 fractures and an outcrop profile, then analyzed the main controlling factors for core fracture development, and finally established a fracture prediction method using conventional logging data. The results indicate that high-angle fractures accounted for 73.20%, fracture orientations were nearly east–west, fracture spacing between 0–10 cm accounted for 80.51%, fracture openings between 0–0.13 mm accounted for 89.27%, fracture down-cutting depths between 0–20 cm accounted for 80%, and 80.81% was not filled. In addition, we found that thin beds and fine sandstones are prone to develop fractures; Finally, our modified curve rate method was an effective method for fracture prediction. We conclude that fractures have the characteristics of high angle, small spacing, small opening, small down-cutting depth, and less filling. The modified curve change rate method is suitable for fracture prediction in tight sandstone reservoirs in the Triassic Change 6 member of the Y well area, Ordos Basin, China.

1. Introduction

Tight sandstone oil and gas has become one of China’s leading unconventional oil and gas resources, owing to advances in oil and gas exploration and development technology and expanding energy demand [1,2]. Tight sandstone reservoirs are characterized by poor physical properties, small pore throat radius, and strong heterogeneity [3,4]. In this context, the study of natural fractures in tight sandstone reservoirs is of great importance. On the one hand, natural fractures are highly correlated with the transport and accumulation of hydrocarbons, which has a positive effect on hydrocarbon development [5,6,7]. On the other hand, natural fractures also have some negative effects, such as water flooding and water channeling in water injection developments, which in turn can seriously affect the effectiveness of the development [8,9]. Therefore, fracture identification and evaluation are the key to hydrocarbon exploration and development in tight sandstone reservoirs [10].
There are two main ways to identify and evaluate natural fractures: core and logging data. The observation and description of cores is the most direct, effective, and reliable way to study fractures, providing first-hand information on fracture occurrence, fracture density, degree of filling, and hydrocarbon content [11,12]. Currently, a number of special logging techniques are available to qualitatively identify and quantitatively evaluate downhole fracture development, such as borehole sonic image logs and borehole electrical image logs [13,14]. However, the cost of coring and image logging is expensive, and the information obtained is limited. Therefore, the limited core and image logging data need to be fully understood in order to clarify the distribution pattern of fractures over the area, using “core/imaging scaled conventional logging” to develop an effective fracture identification model for conventional logs. Fracture responses from conventional logs are often complex, especially at low fracture densities [15]. Often, machine learning methods are introduced to predict fractures, including adaptive neuro-fuzzy inference systems, GA-BP neural networks, and Bayesian network theory and random forests [16,17,18]. However, machine learning often requires a large number of sample calibration learning, because the absence of any unlearned sample will lead to recognition errors [19]. The conventional logging response of fractures can be reflected in absolute values as well as in the relative change in curve curvature [20]. This feature serves as the basis for the differentiation method applied to the identification of cracks.
We take the tight oil reservoir of the Chang 6 member in the Y well area of the Ordos Basin as an example; the selected core length was 38.5 m from 20 wells. Porosity ranged from 4% to 10%, with an average value of 7.09%; permeability was mainly less than 0.4 mD, with an average value of 0.28 mD. First, the fracture characteristics of the core were fully observed and described, which laid the foundation for the overall understanding of fractures in the study area and calibration of conventional logs data. Further, we separately studied the relationship between fractures, lithology, and bedding thickness to clarify the influencing factors of fracture development. Finally, our modified curve change rate method was used to predict fracture passage from conventional logs data.

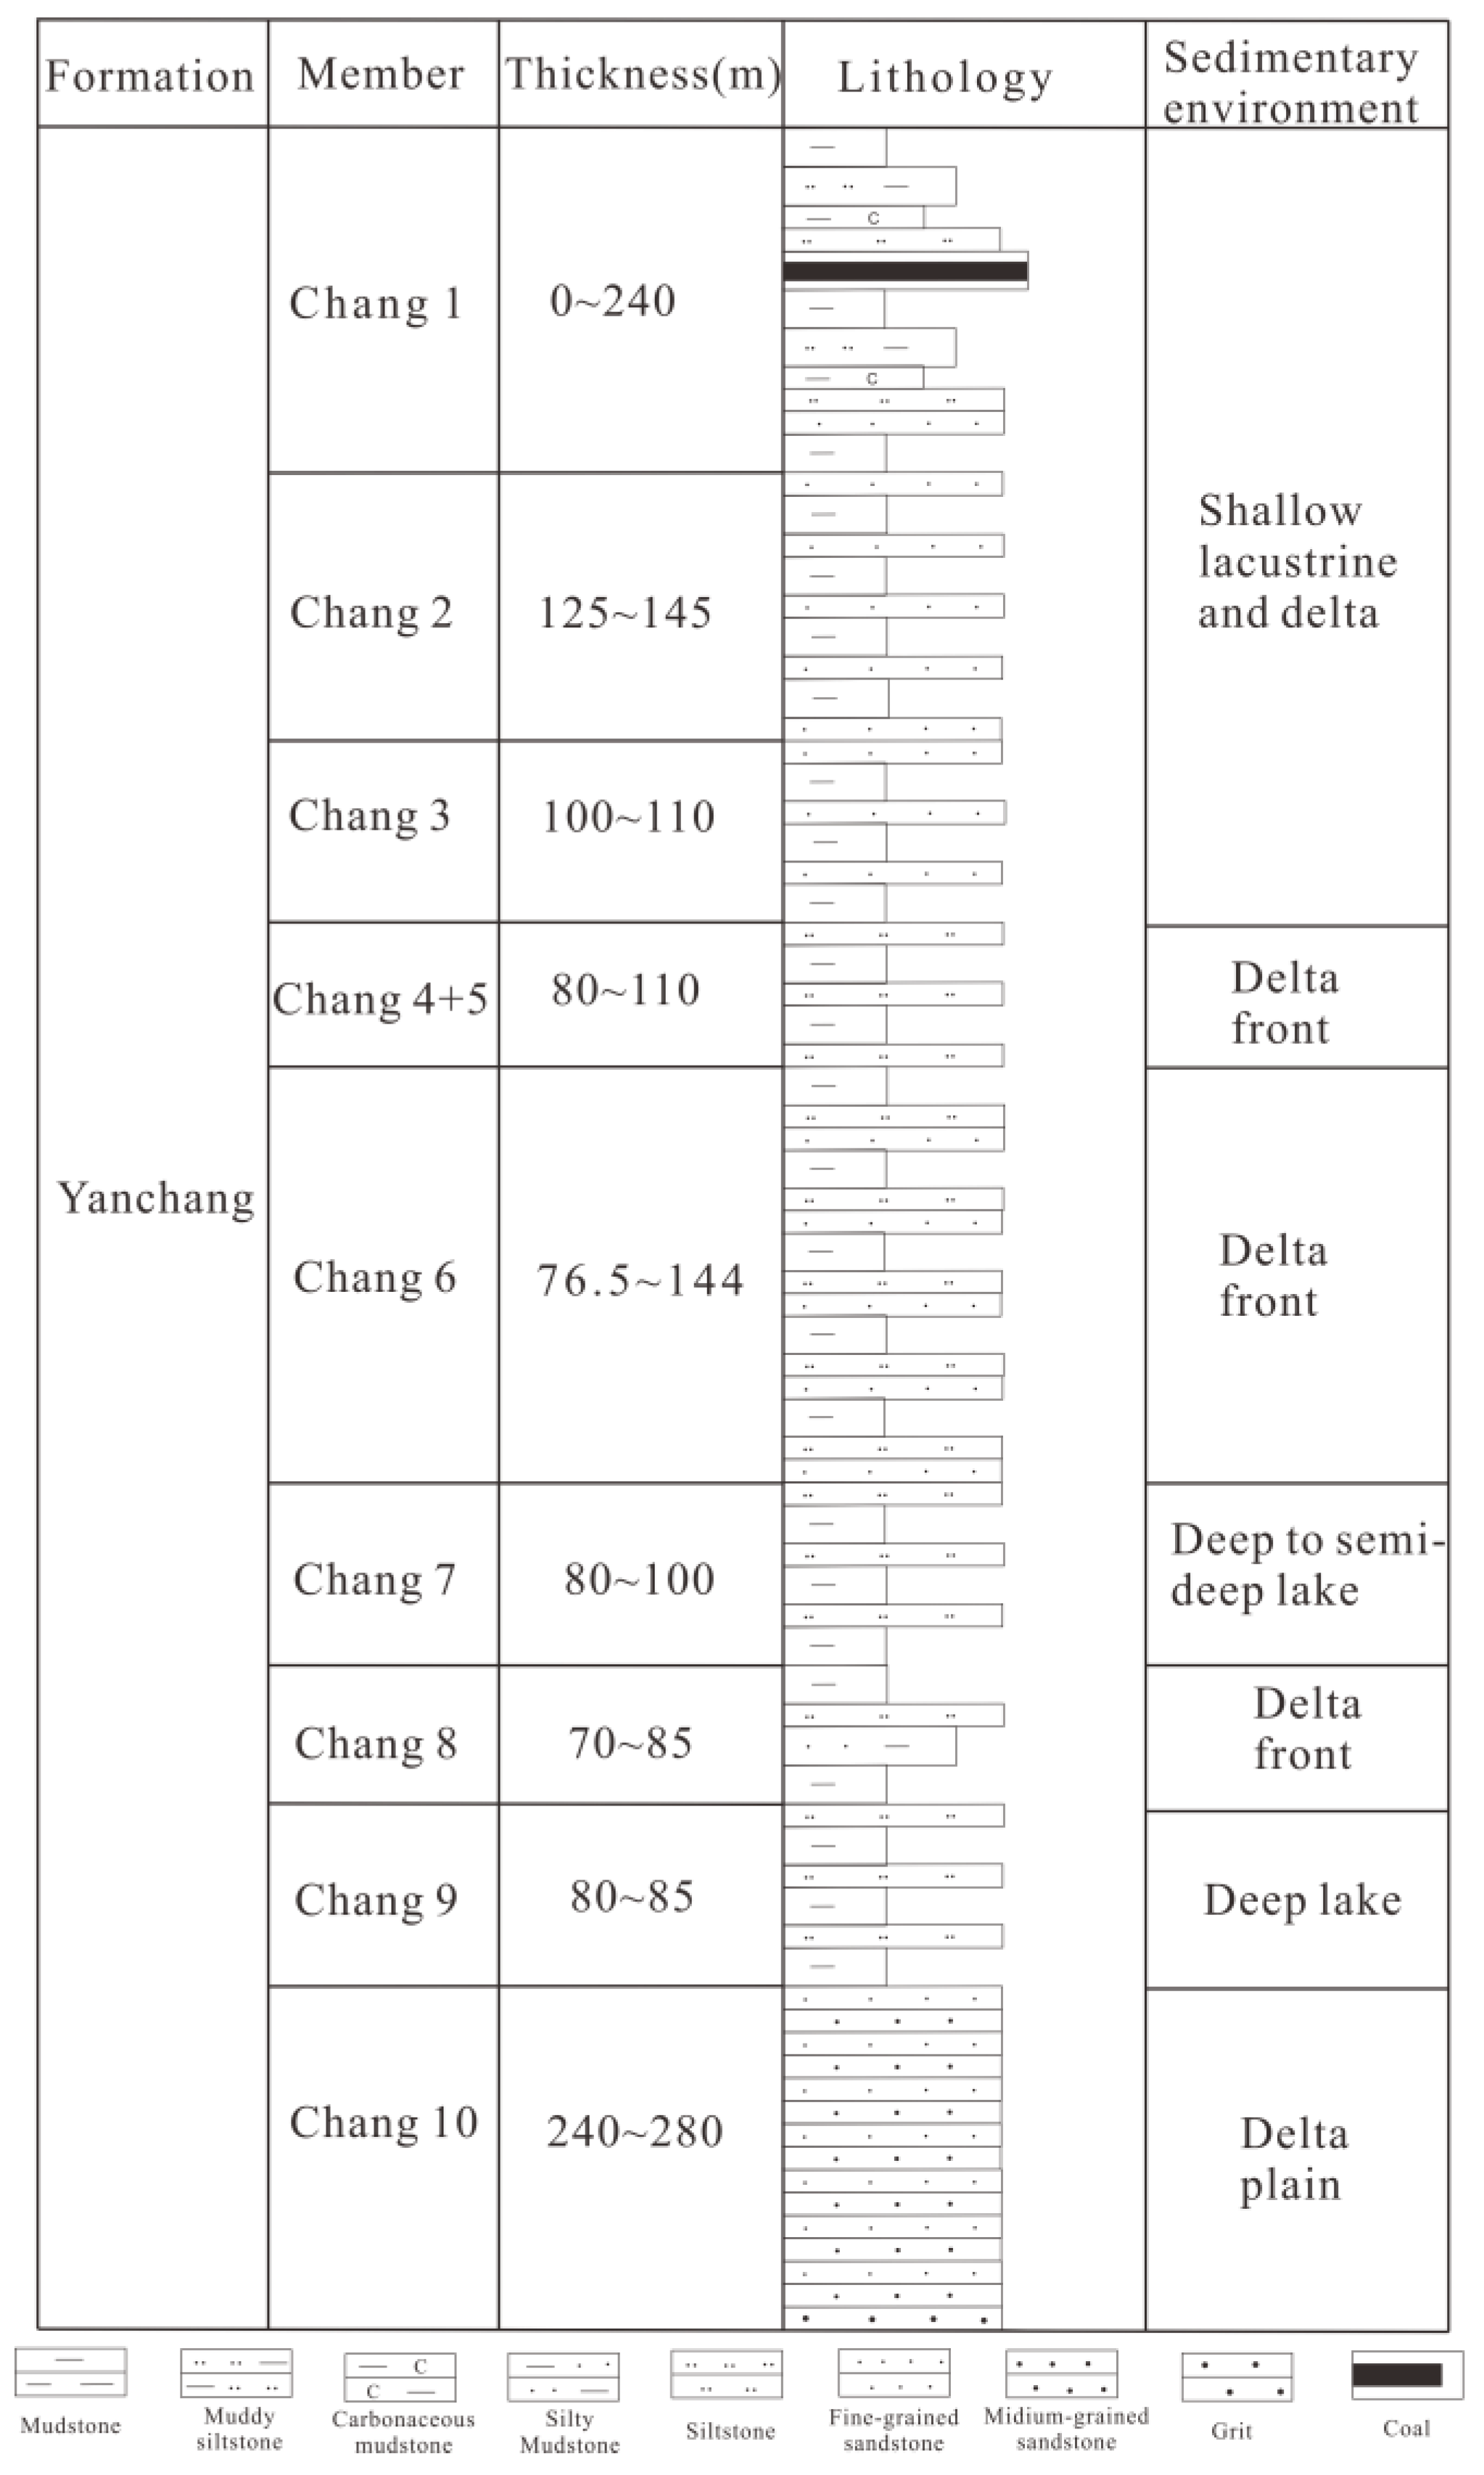
2. Geological Setting

The Ordos Basin covers an area of over 370,000 km2 and is located in north-central China [21,22]. The elevation of the basin is high in the east and low in the west, and it contains six tectonic units: the Jinxi folding belt, the Yishan slope, the Yimeng uplift, the western edge thrust belt, the Tianhuang depression, and the Weibei uplift [23,24]. The study area is a typical Loess Plateau landscape, located in the southwest of the Yishan slope in the Ordos Basin (Figure 1).
The Upper Triassic extensional stratigraphy is in the Ordos Basin and formed in a fluvial–lacustrine depositional environment with a thickness of 200 m–1400 m [25,26,27]. The Yanchang Formation can be subdivided into 10 members from bottom to top based on the depositional cycle (Figure 2). First, the lake gradually expanded during the depositional period from Chang 10 to Chang 7 and deposited extensive source rocks during the Chang 7 period. The lake then began to shrink during the Chang 6 to Chang 3 period, with shallow-water deltas prevailing. Finally, the lake basin declined rapidly during the Chang 2 and Chang 1 periods and the lacustrine depositional process ended [28,29]. The main oil-bearing reservoirs explored and developed in the Ordos Basin include the Chang 6, Chang 7, and Chang 8 members of the Upper Triassic [30]. A Chang 6 member was the target of this paper’s study, which developed in a lacustrine shallow-water delta environment [29,31].

3. Methods

3.1. Logging Curve Normalization

In the processing of logging data, the various logging curves have different magnitudes and vary too much in magnitude [32]. It is therefore necessary to first normalize the logging data by unifying the response values of each logging curve into a scalar with a scale in the range [0, 1]. For logging curves with approximately linear characteristics, the linear normalization equation can be expressed as follows:
X ( i ) = X i X m i n X m a x X m i n
where X is the normalized data, X l o g is the original logging data, X m a x is the maximum value of the logging curve response, and X m i n is the minimum value of the logging curve response.
The response value of the resistivity curve is non-linear and can be expressed logarithmically normalized as follows:
X ( i ) = log ( X i ) log ( X m i n ) log ( X m a x ) log ( X m i n )

3.2. Reconstructing Curves for Curve Change Rate

The curve change rate is a reflection of the change in the logging curve. The types of logging that are generally considered to have higher vertical resolution and shallow detection depths include acoustic, density, and neutron logs. A high or low value anomaly in the logging response, a significant change in the shape of the curve, and a sudden increase in the slope of the curve may indicate a fracture. The calculation of curve change rate can be expressed as follows:
Δ X ( i ) = | X ( i ) X ( i 1 ) | + | X ( i ) X ( i + 1 ) | 2
where Δ X i is the curve change rate of the logging curve at the current sampling point, X i is the log value at the current sampling point, X i 1 is the log value from the previous sampling point, and X i + 1 is the log value of the next sampling point.

3.3. Fracture Indicator Curve

Different logging curves have varied degrees of response to fractures. Combining the curve change rates of multiple logging curves can improve the prediction of fractures. The fracture indication curve for a single logging property can be expressed as follows.
F i = Δ X ( i ) Δ X ( t i g h t ) Δ X ( f r a c t u r e ) Δ X ( t i g h t )
where F i is a fracture indicator curve for a single logging property, Δ X ( t i g h t ) is the curve change rate for fractured undeveloped layers, and Δ X ( f r a c t u r e ) is the curve change rate for significantly fractured layers.
During numerous tests, we had tried different choices of trade-off parameters of the different curve change rates. We found GR (Gamma Ray, API), AC (Acoustic, μs/m), RLLD (Deep lateral Resistivity, ohm.m), RLLS (Shallow lateral Resistivity, ohm.m), and CAL (Caliper, cm) as the logging curves for fracture prediction due to their high correlation with fracture. First, we normalized the logging curves (AC, GR, and CAL by Equation (1) and RLLD and RLLS by Equation (2)); second, the curve change rates of the five logging curves were calculated by Equation (3); third, the fracture indication curves of the single logging curves were calculated by Equation (4). Finally, we extracted the values of the five fracture indication curves corresponding to the core fracture locations from 20 wells, including 214 data. Table 1 shows the average of fracture indication value for each well at the observed core fracture locations. We also calculated the average values of all data. The results claimed that FGR:FAC:FRLLD:FRLLS:FCAL = 3:5:5:5:2. Thus, we created a composite fracture indicator (CFI) curve for predicting fractures using the curve change rate of multiple logging curves. From Table 1, we found the AC, RLLD, and RLLS have similar contributions to the composite fracture indicator and tend to have the best prediction performance in most common cases. The GR and CAL underperform in comparison with AC, RLLD, and RLLS. Hence, we obtain the coefficient according to the weighting of each log (3:5:5:5:2), which can be expressed as follows:
C F I = 0.15 × F G R + 0.25 × F A C + 0.25 × F R L L D + 0.25 × F R L L S + 0.10 × F C A L

4. Results

Cores are the most direct evidence for the study of natural fracture characteristics. We observed and described the fractures in the cores of Chang 6 member of 20 wells in the Y well area of the Ordos Basin. In addition, fracture orientation was determined from paleomagnetic core orientation, outcrop, and borehole electrical image logs. We then analyzed the influence of lithology and bedding thickness on the fractures. Finally, we calculated the fracture indicator curve by the modified curve change rate method using conventional logs data.

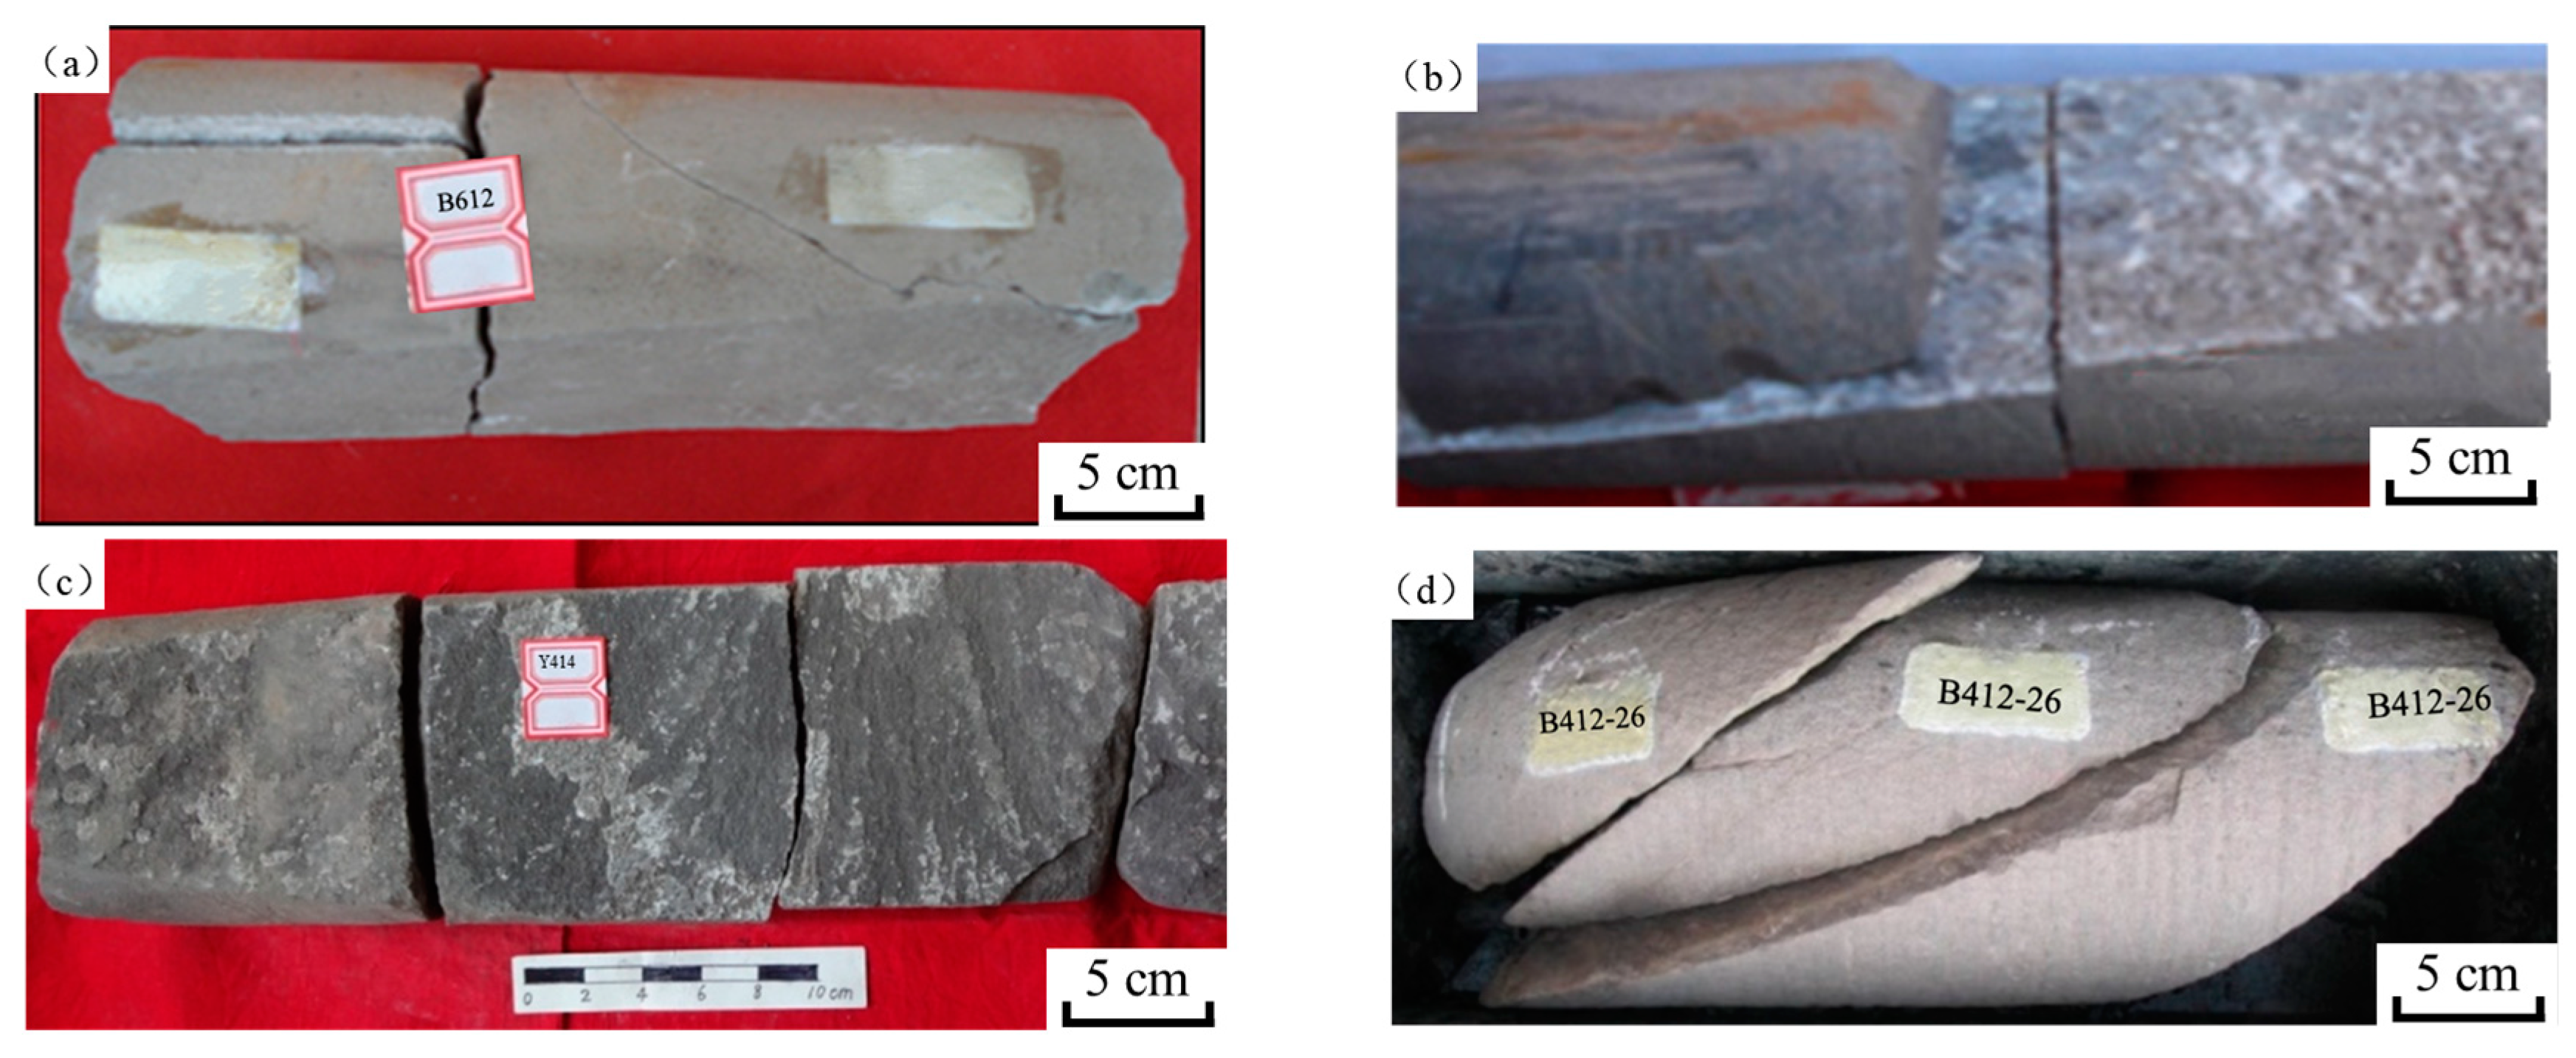
4.1. Natural Fracture Characteristics

4.1.1. Fracture Angle

According to the size of the inclination angle of the fracture, a fracture with an inclination angle greater than 70° is called a high-angle fracture, a fracture with an inclination angle between 30° and 70° is called an inclined fracture, and a fracture with an inclination angle less than 30° is called a low-angle fracture. We found a large number of high-angle fractures in the core observations. Figure 3a–c are high-angle fractures, and Figure 3d are low-angle fractures. We counted the angles of core fractures and found that high-angle fractures accounted for 73.20% (Figure 4).

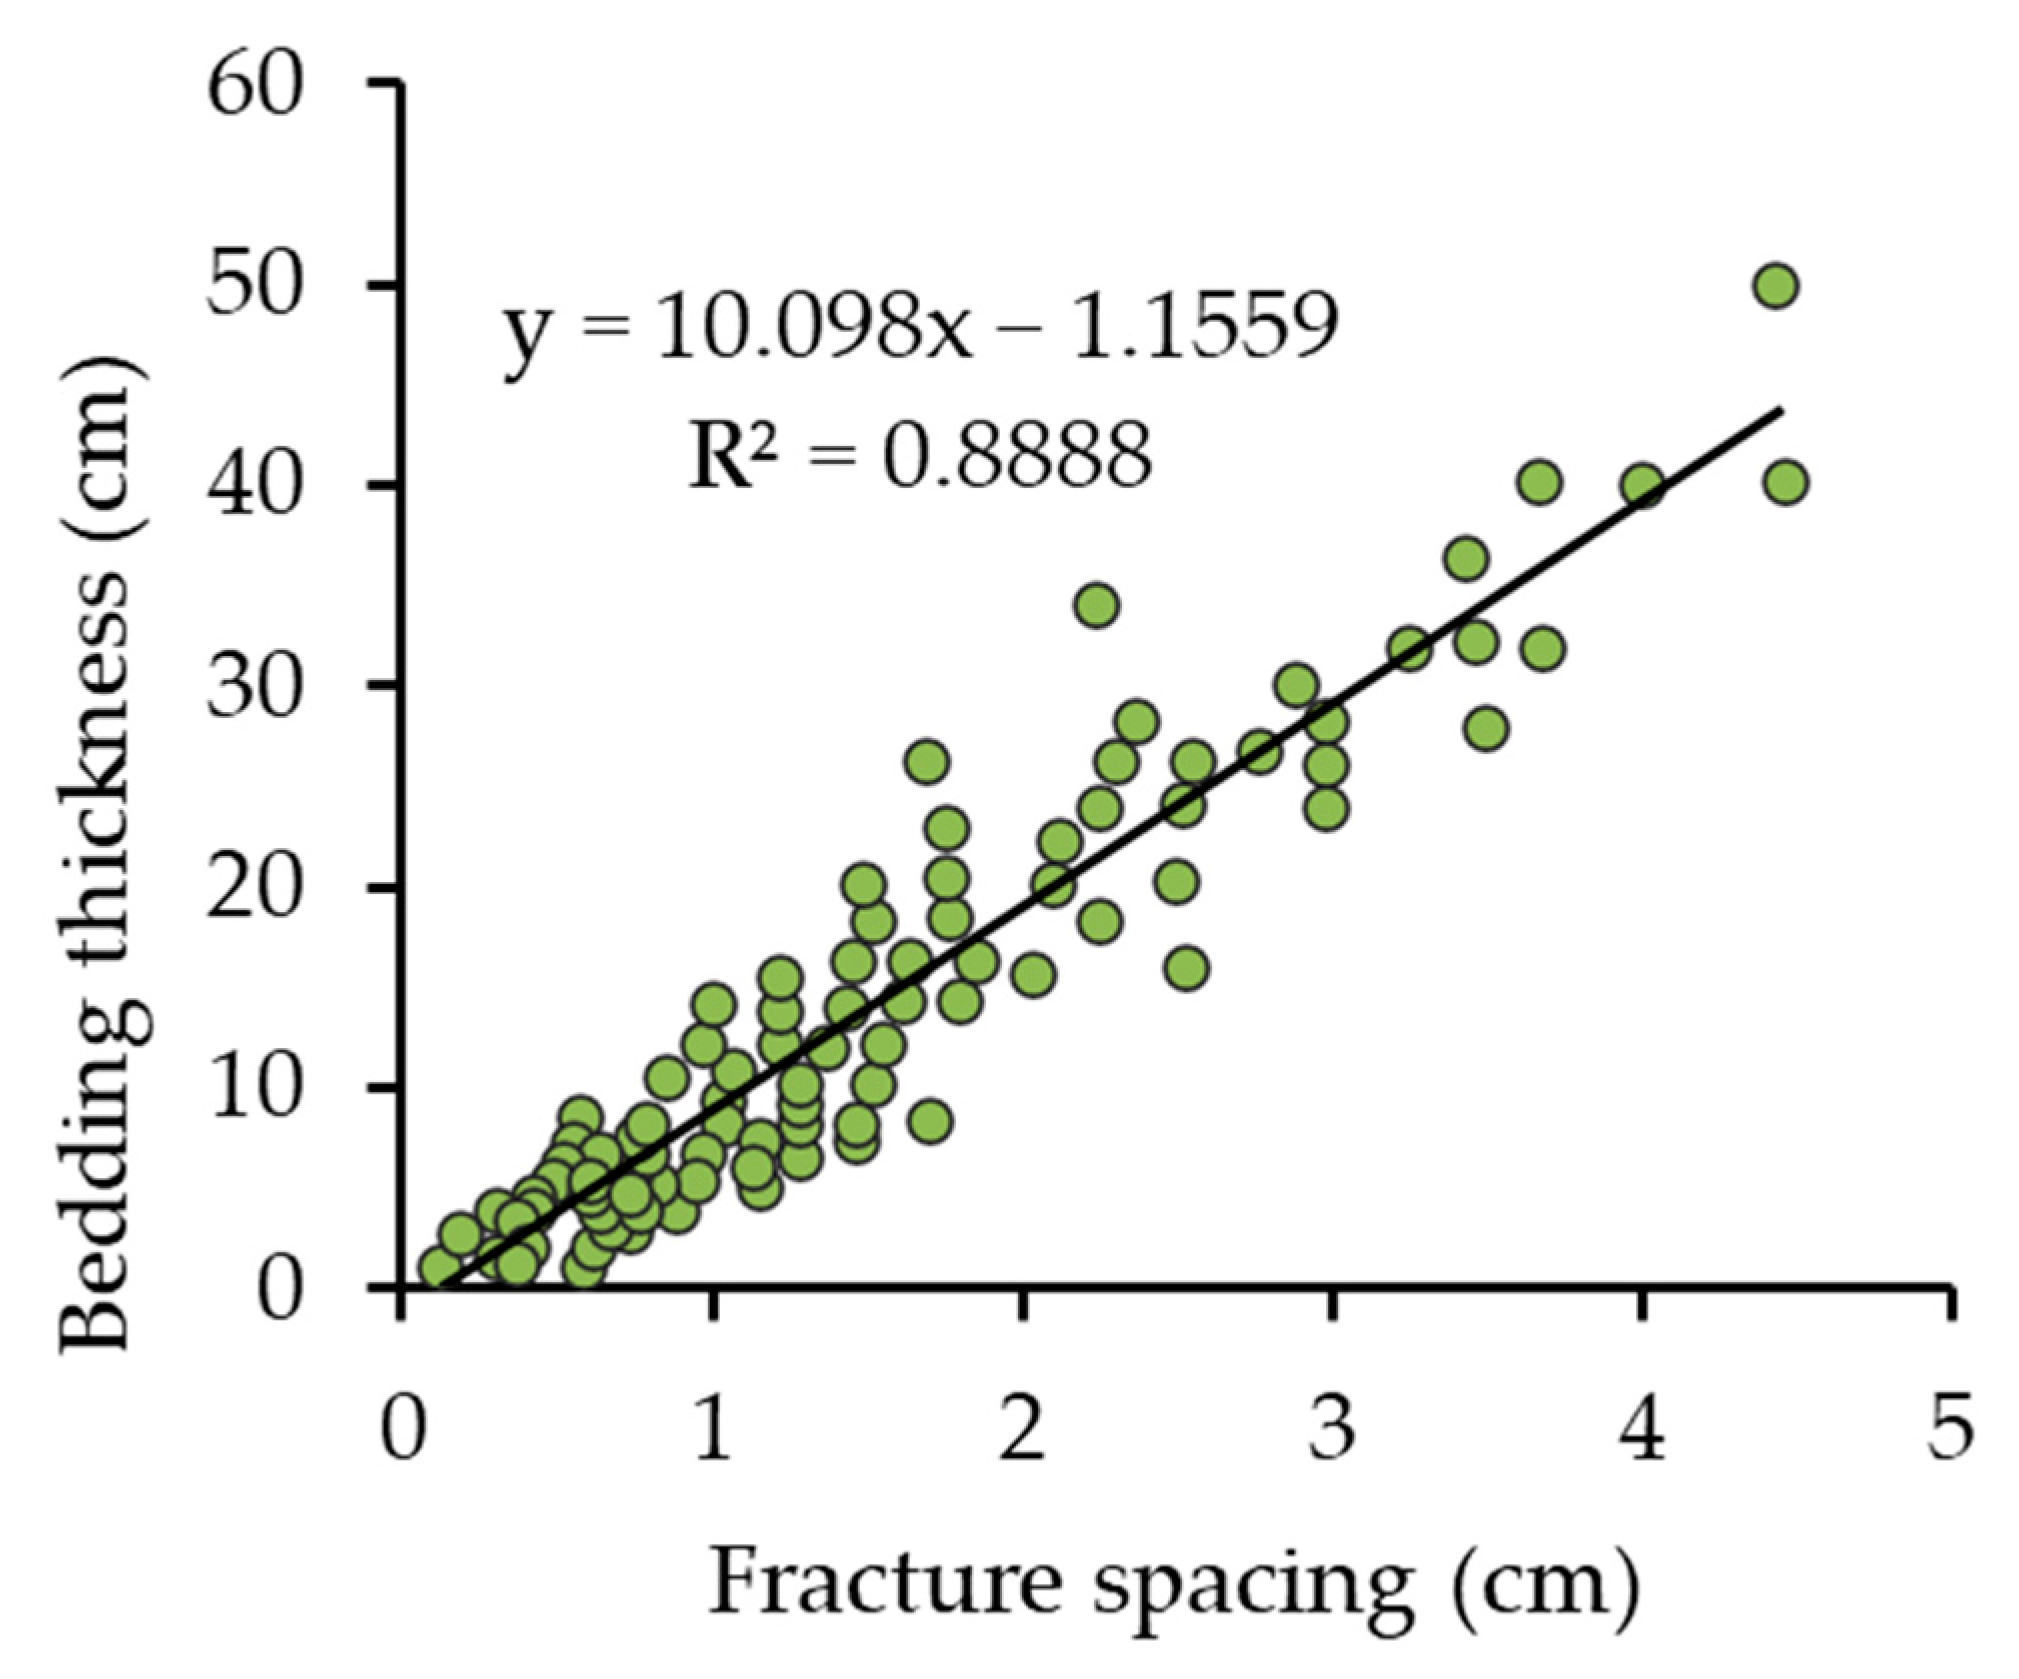
4.1.2. Fracture Density

Fracture density reflects the development degree of reservoir fractures. Our statistical fracture density results show that 50% of the wells have a fracture density greater than 0.6 m−1, and 25% of the cored wells have a fracture density of more than 1 m−1 (Figure 5).

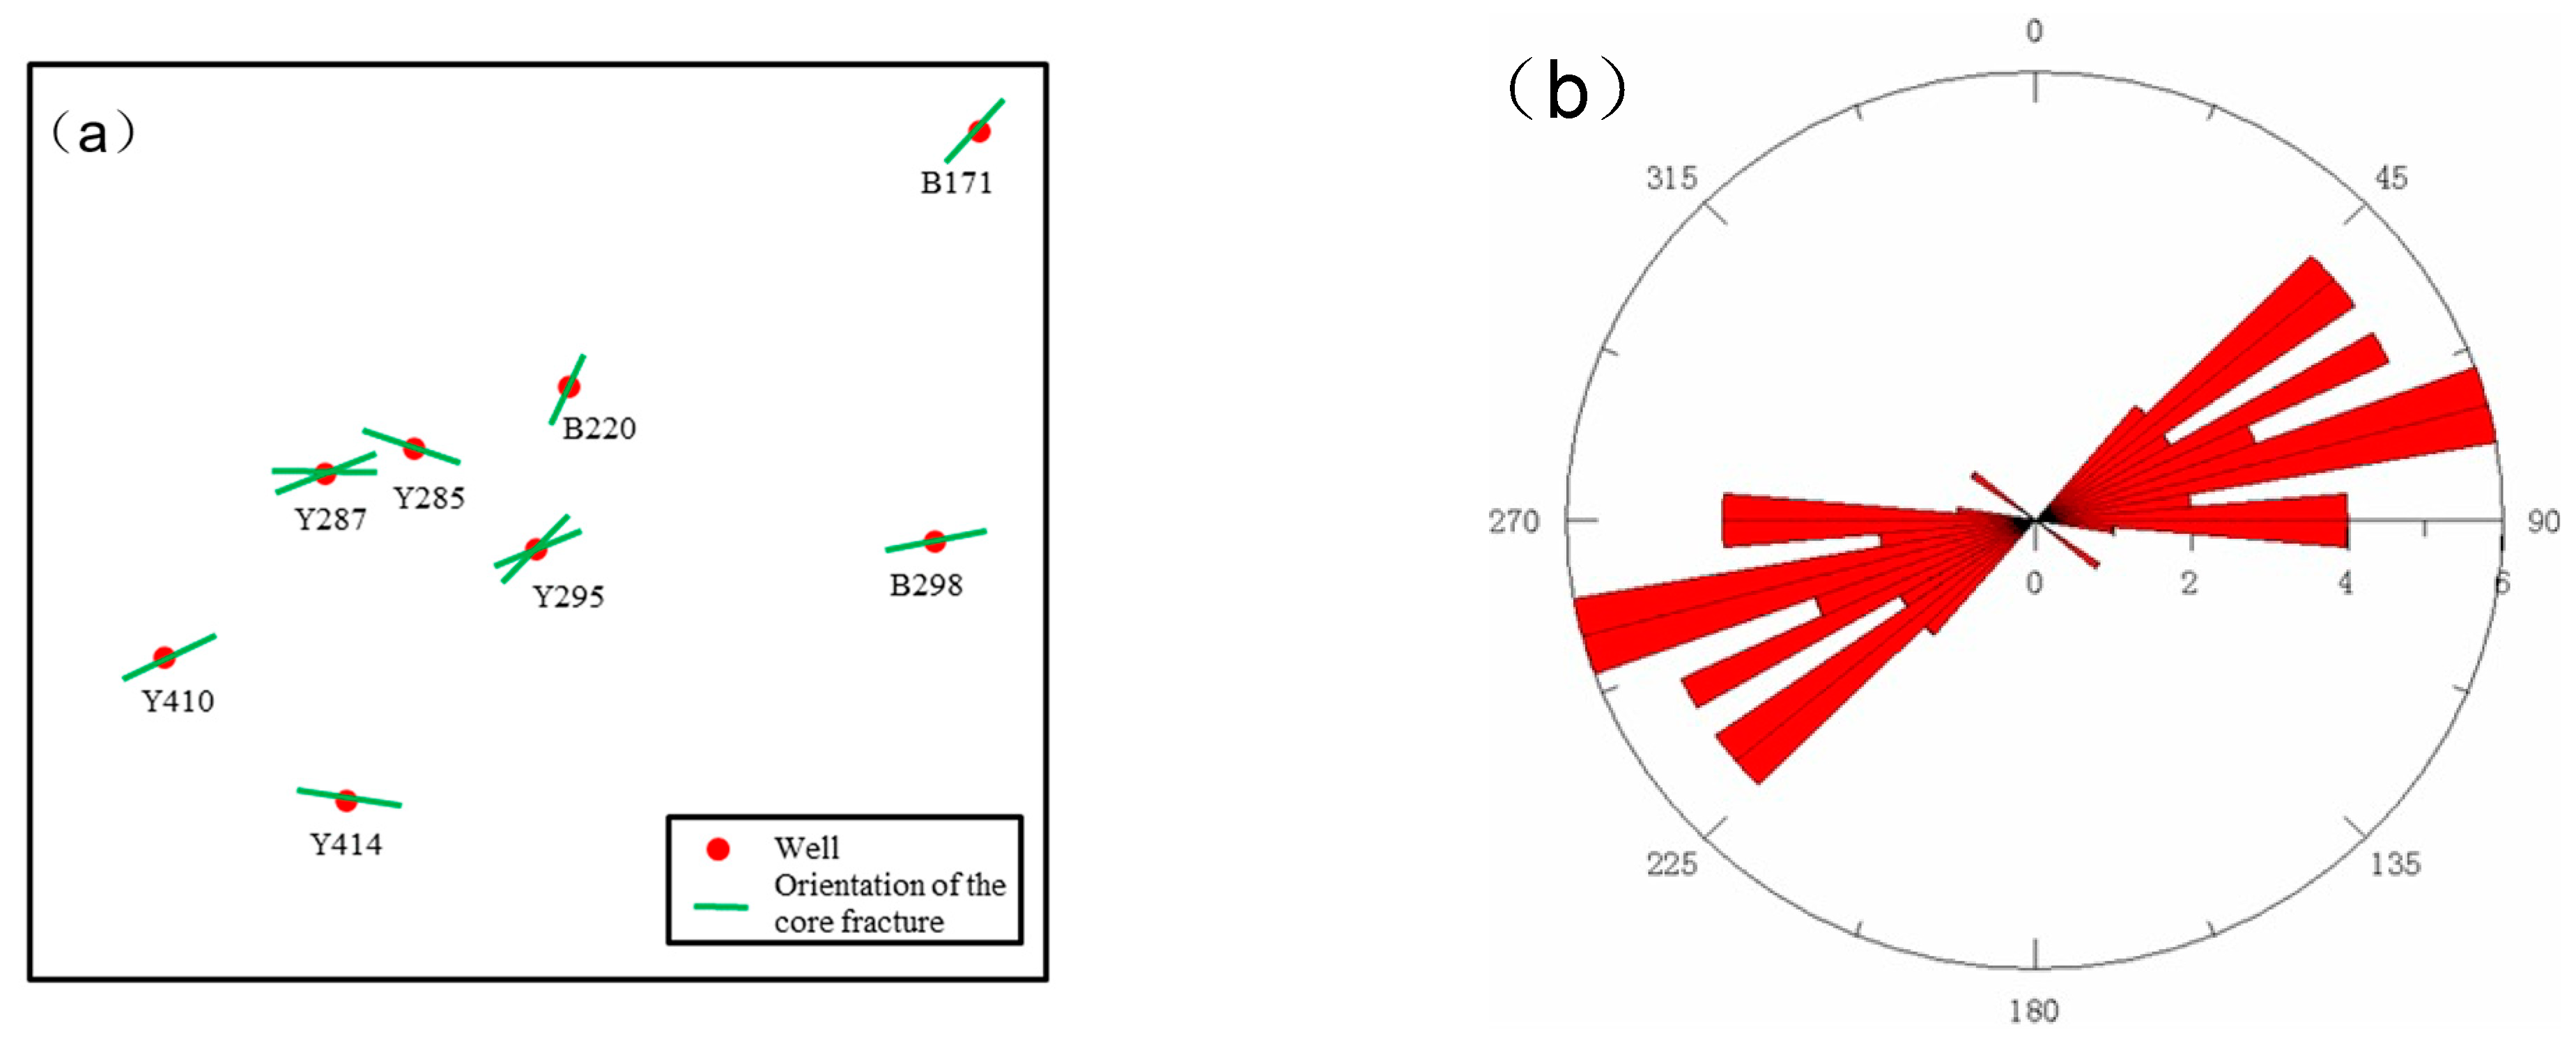
4.1.3. Fracture Orientation

The direction of the stable remanence recorded in the rock is consistent with the direction of the earth’s magnetic field when the rock acquires the remanence, and the earth’s magnetic field has the characteristics of a geocentric dipole field [33]. Paleomagnetic core reorientation methods enable the determination of core orientation through measurements of residual magnetic fields. We conducted paleomagnetic orientation measurements on the core fractures of 8 wells and determined that the fracture orientations range from NS 23.5° to NS 108.97°, and the main orientation is near EW (Figure 6a). The fracture orientation rosette diagram obtained from the statistics of the fracture characteristic information obtained by borehole electrical imaging logging shows that the fracture orientations range from NS 45° to NS 95.63°, and the main orientation is near EW (Figure 6b). In addition, we found a higher fracture strike NS 120° at an outcrop (Figure 6c).

4.1.4. Effectiveness of Fractures

We counted four aspects of fracture characteristics in cores, including fracture opening, spacing, cutting depth, and filling degree, to reflect the effectiveness of fractures (Figure 7). The results show that 89.27% of the fractures open between 0 and 0.13 mm, 80.51% of the fractures have less than 6 cm spacing, 80% of the fractures have a down-cutting depth of less than 20 cm, and 80.81% of the fractures have not been filled.

4.2. Influencing Factors for Fracture Development

The degree of fracture development is determined by a combination of stratigraphic lithology, rock thickness, and geological structure. The lithology of the different sandstones was determined by statistical analysis of grain size. We counted the development of fractures in different types of lithology (Figure 8). The frequency of fracture development for the different types of lithology was 32.68% for fine sandstone, 18.04% for siltstone, 17.78% for muddy siltstone, 14.64% for siltstone mudstone, 13.07% for mudstone, and 0.04% for medium sandstone. The fine sandstone has a fine grain size and is therefore more fractured, compared to the medium sandstone. The fine sandstone has a high porosity and is relatively well developed in shear fracture, compared to the siltstone and muddy siltstone. The fracture spacing index is the ratio of bedding thickness to fracture spacing, and the fracture spacing index is an important index for the evaluation of fractured reservoirs [34,35]. The cross-plot of bedding thickness and fracture spacing shows a positive correlation between fracture spacing and bedding thickness, with thin bedding having high fracture density and a fracture spacing index of 10.1 (Figure 9).

4.3. Fracture Identification Using Conventional Logs

We applied the improved curve change rate method in this paper to the Chang 6 member in the Y well area of the Ordos Basin. Figure 8 is the effect diagram of conventional logs fracture identification in Well Y298. Track 7 is the calculated CFI curve through formula (5) in Figure 10a, and Figure 10b–e are core photos corresponding to the corresponding intervals in Figure 10a. Our fracture prediction results are in good agreement with core fractures.

5. Discussion

In this paper, we obtain the basic characteristics of natural fractures observed through cores and outcrops in the Triassic Chang 6 member in the Y well area, Ordos Basin. The reservoir is fracture-rich and dominated by high-angle fractures consistent with the findings of Chen et al. [36]. The average density of fractures is 0.69 m−1 in the Y well area above the Jiyuan-Wuqi area [36]. The Yanchang Formation was subjected to tectonic stresses during the Yanshan period, and the orientation of the maximum principal stresses is NWW-SEE in line with our observations [37,38].
In addition, we developed the reservoir fracture prediction method using conventional logging data. The presence of fractures can lead to non-linear variations in the logging curve. The well that was not involved in the modeling was used for the case study, and the comprehensive fracture identification model presented verifies the validity of the method in this paper.

6. Conclusions

Fractures are important for ultra-low permeability reservoirs because they are a key channel for oil and gas transport. We investigated the Triassic Chang 6 member of Y well area in the Ordos Basin in this study. The fractures were found to be predominantly high-angle fractures, with most wells having a high fracture line density and a near east–west orientation. In particular, we note that fine sandstones and thin layers are more prone to fracture development. Finally, the fracture prediction results of our modified multi-conventional logging curve multi-weighted curve change rate method are in good agreement with the core. Our conclusions provide a better understanding of the fracture development characteristics of this Triassic Chang 6 member in the Y well area of the Ordos Basin. The conventional logs fracture identification model proposed by us can better reduce development risks and improve oil and gas production efficiency.

Author Contributions

Conceptualization, S.H., C.W., K.M. and H.Y.; methodology, S.H. and H.Y.; software, S.H. and K.M.; validation, S.H., K.M. and H.Y.; formal analysis, S.H. and C.W.; investigation, S.H. and C.W.; resources, S.H. and C.W.; data curation, C.W., Y.C., H.Z. and H.W.; writing—original draft preparation, S.H.; writing—review and editing, S.H. and K.M.; visualization, C.W., Y.C., H.Z. and H.W.; supervision, H.Y.; project administration, S.H. and H.Y.; funding acquisition, S.H. and H.Y. All authors have read and agreed to the published version of the manuscript.

Funding

This research was funded by National Natural Science Foundation of China (Grant No. 41902145), Natural Science Basic Research Plan in Shaanxi Province of China (Grant No. 2020JQ-594), Young researcher of science and technology and foreign expert service plan in Shaanxi Province (Grant Nos. 2021KJXX-28, 2021JZY-016) and the State Key Laboratory of Continental Dynamics at Northwest University in China. The authors of this article are very grateful for the support provided.

Data Availability Statement

The data presented in this study are available on request from the corresponding author.

Acknowledgments

The authors thank the reviewers for their valuable comments and are grateful to the editor for careful editing.

Conflicts of Interest

The authors declare no conflict of interest.

References

  1. Li, G.; Zhu, R. Progress, challenges and key issues of unconventional oil and gas development of CNPC. China Pet. Explor. 2020, 25, 1–13. [Google Scholar]
  2. Zou, C.; Yang, Z.; Zhu, R.; Zhang, G.; Hou, L.; Wu, S.; Tao, S.; Yuan, X.; Dong, D.; Wang, Y.; et al. Progress in China’s unconventional oil & gas exploration and development and theoretical technologies. Acta Geol. Sinica 2015, 89, 979–1007. [Google Scholar]
  3. Law, J.B.; Curtis, J.B. Introduction to unconventional petroleum systems. AAPG Bull. 2002, 86, 1851–1852. [Google Scholar]
  4. Liu, K.; Wang, R.; Shi, W.; Travé, A.; Martín-Martín, J.D.; Baqués, V.; Qi, R.; Lin, J.; Ye, H. Diagenetic controls on reservoir quality and heterogeneity of the Triassic Chang 8 tight sandstones in the Binchang area (Ordos Basin, China). Mar. Pet. Geol. 2022, 146, 105974. [Google Scholar] [CrossRef]
  5. Ameen, M.; MacPherson, K.; Al-Marhoon, M.; Rahim, Z. Diverse fracture properties and their impact on performance in conventional and tight-gas reservoirs, Saudi Arabia: The Unayzah, South Haradh case study. AAPG Bull. 2012, 96, 459–492. [Google Scholar] [CrossRef]
  6. Xiao, L.; Li, J.; Mao, Z.; Yu, H. A method to evaluate pore structures of fractured tight sandstone reservoirs using borehole electrical image logging. AAPG Bull. 2020, 103, 205–226. [Google Scholar] [CrossRef]
  7. Zeng, L.; Su, H.; Xiaomei, T.; Peng, Y.; Gong, L. Fractured tight sandstone oil and gas reservoirs: A new play type in the Dongpu depression, Bohai Bay Basin, China. AAPG Bull. 2013, 97, 363–377. [Google Scholar] [CrossRef]
  8. Li, Y.; Shang, Y.; Yang, P. Modeling fracture connectivity in naturally fractured reservoirs: A case study in the Yanchang Formation, Ordos Basin, China. Fuel 2018, 211, 789–796. [Google Scholar] [CrossRef]
  9. Sava, D.; Mavko, G. Rock physics-based integration of geologic and geophysical data for fracture characterization. Lead. Edge 2007, 26, 1140. [Google Scholar] [CrossRef]
  10. Zeng, L.; Xiang-Yang, L. Fractures in sandstone reservoirs with ultra-low permeability: A case study of the Upper Triassic Yanchang Formation in the Ordos Basin, China. AAPG Bull. 2009, 93, 461–477. [Google Scholar] [CrossRef]
  11. Zhou, X.; Cao, C.; Yuan, J. The research actuality and major progresses on the quantitative forecast of reservoir fractures and hydrocarbon migration law. Adv. Earth Sci. 2003, 18, 398–404. [Google Scholar]
  12. Luo, Q. Core Observation and Description of Tight Sandstone Fractured Reservoir. Xinjiang Pet. Geol. 2010, 31, 229–231. [Google Scholar]
  13. Chatterjee, R.; Datta Gupta, S.; Mandal, P. Fracture and stress orientation from borehole image logs: A case study from Cambay basin, India. J. Geol. Soc. India 2017, 89, 573–580. [Google Scholar] [CrossRef]
  14. Dias, L.O.; Bom, C.R.; Faria, E.L.; Valentín, M.B.; Correia, M.D.; de Albuquerque, M.P.; de Albuquerque, M.P.; Coelho, J.M. Automatic detection of fractures and breakouts patterns in acoustic borehole image logs using fast-region convolutional neural networks. J. Pet. Sci. Eng. 2020, 191, 107099. [Google Scholar] [CrossRef]
  15. Lyu, W.; Zeng, L.; Li, Z.; Liu, G.; Zu, K. Fracture responses of conventional logs in tight-oil sandstones: A case study of the Upper Triassic Yanchang Formation in southwest Ordos Basin, China. AAPG Bull. 2016, 100, 1399–1417. [Google Scholar] [CrossRef]
  16. Bhattacharya, S.; Mishra, S. Applications of machine learning for facies and fracture prediction using Bayesian Network Theory and Random Forest: Case studies from the Appalachian basin, USA. J. Pet. Sci. Eng. 2018, 170, 1005–1017. [Google Scholar] [CrossRef]
  17. Ja’fari, A.; Kadkhodaie-Ilkhchi, A.; Sharghi, Y.; Ghanavati, K. Fracture density estimation from petrophysical log data using the adaptive neuro-fuzzy inference system. J. Geophys. Eng. 2012, 9, 105–114. [Google Scholar] [CrossRef]
  18. Xue, Y.; Cheng, L.; Mou, J.; Zhao, W. A new fracture prediction method by combining genetic algorithm with neural network in low-permeability reservoirs. J. Pet. Sci. Eng. 2014, 121, 159–166. [Google Scholar] [CrossRef]
  19. Dong, S.; Zeng, L.; Lyu, W.; Xu, C.; Liu, J.; Mao, Z.; Tian, H.; Sun, F. Fracture identification by semi-supervised learning using conventional logs in tight sandstones of Ordos Basin, China. J. Nat. Gas Sci. Eng. 2020, 76, 103131. [Google Scholar] [CrossRef]
  20. Aghli, G.; Soleimani, B.; Moussavi-Harami, R.; Mohammadian, R. Fractured zones detection using conventional petrophysical logs by differentiation method and its correlation with image logs. J. Pet. Sci. Eng. 2016, 142, 152–162. [Google Scholar] [CrossRef]
  21. Shi, Y.; Xiao, L.; Mao, Z.; Guo, H. An identification method for diagenetic facies with well logs and its geological significance in low-permeability sandstones: A case study on Chang 8 reservoirs in the Jiyuan region, Ordos Basin. Acta Pet. Sin. 2011, 32, 820–828. [Google Scholar]
  22. Yu, H.; Wang, Z.; Rezaee, R.; Zhang, Y.; Nwidee, L.N.; Liu, X.; Verrall, M.; Iglauer, S. Formation water geochemistry for carbonate reservoirs in Ordos basin, China: Implications for hydrocarbon preservation by machine learning. J. Pet. Sci. Eng. 2020, 185, 106673. [Google Scholar] [CrossRef]
  23. Jiang, Z.; Mao, Z.; Shi, Y.; Wang, D. Multifractal Characteristics and Classification of Tight Sandstone Reservoirs: A Case Study from the Triassic Yanchang Formation, Ordos Basin, China. Energies 2018, 11, 2242. [Google Scholar] [CrossRef] [Green Version]
  24. Yu, H.; Lebedev, M.; Zhou, J.; Lu, M.; Li, X.; Wang, Z.; Han, T.; Zhang, Y.; Johnson, L.M.; Iglauer, S. The rock mechanical properties of lacustrine shales: Argillaceous shales versus silty laminae shales. Mar. Pet. Geol. 2022, 141, 105707. [Google Scholar] [CrossRef]
  25. Qiao, J.; Zeng, J.; Jiang, S.; Wang, Y. Impacts of sedimentology and diagenesis on pore structure and reservoir quality in tight oil sandstone reservoirs: Implications for macroscopic and microscopic heterogeneities. Mar. Pet. Geol. 2020, 111, 279–300. [Google Scholar] [CrossRef]
  26. Bai, Y.; Zhao, J.; Wu, W. Methods to determine the upper limits of petrophysical properties in tight oil reservoirs: Examples from the Ordos and Songliao Basins. J. Pet. Sci. Eng. 2021, 196, 107983. [Google Scholar] [CrossRef]
  27. Fu, Y.; Luo, J.; Shi, X.; Cao, J.; Mao, Q.; Sheng, W. Implications of lithofacies and diagenetic evolution for reservoir quality: A case study of the Upper Triassic chang 6 tight sandstone, southeastern Ordos Basin, China. J. Pet. Sci. Eng. 2022, 218, 111051. [Google Scholar] [CrossRef]
  28. Liu, H.; Yang, Y.; Wang, F.; Deng, X.; Liu, Y.; Nan, J.; Wang, J.; Zhang, H. Micro pore and throat characteristics and origin of tight sandstone reservoirs: A case study of the Triassic Chang 6 and Chang 8 members in Longdong area, Ordos Basin, NW China. Petr. Explor. Dev. 2018, 45, 239–250. [Google Scholar] [CrossRef]
  29. Yang, S.; Bao, Z.; Wang, N.; Qu, X.; Lin, Y.; Shen, J.; Awan, R.S. Diagenetic evolution and its impact on reservoir quality of tight sandstones: A case study of the Triassic Chang 6 Member, Ordos Basin, northwest China. Mar. Pet. Geol. 2020, 117, 104360. [Google Scholar] [CrossRef]
  30. Dai, J.; Li, J.; Luo, X.; Zhang, W.; Hu, G.; Ma, C.; Guo, J.; Ge, S. Stable carbon isotope compositions and source rock geochemistry of the giant gas accumulations in the Ordos Basin, China. Org. Geochem. Adv. Nat. Gas Geochem. Chin. Sediment. Basins 2005, 36, 1617–1635. [Google Scholar] [CrossRef]
  31. Dang, B.; Zhao, H.; Li, W.H.; Yang, X.Q.; Dang, Y.C. Characteristic of sedimentary microfacies in Chang 6 oil-bearing Formation of Yanchang formation of Ansai oil field. Nat. Gas Geosci. 2004, 15, 587–600. [Google Scholar] [CrossRef]
  32. Jing, J.; Wei, W.; Mei, Z.; Li, Z. Method of well logging interpretation for fracture reservoirs of carbonate rock—A case study in Tahe oil field. Prog. Geophys. 2005, 20, 78–82. [Google Scholar]
  33. Sugimoto, T.; Yamamoto, Y.; Yamamoto, Y.; Lin, W. A Method for Core Reorientation Based on Rock Remanent Magnetization: Application to Hemipelagic Sedimentary Soft Rock. Mater. Trans. 2020, 61, 1638–1644. [Google Scholar] [CrossRef]
  34. Narr, W.; Lerche, I. A method for estimating subsurface fracture density in core. AAPG Bull. 1984, 68, 637–648. [Google Scholar]
  35. Narr, W. Fracture density in the deep subsurface: Techniques with application to Point Arguello oil field. AAPG Bull. 1991, 75, 1300–1323. [Google Scholar]
  36. Chen, S.; Lei, J.; Liu, C.; Yao, J.; Li, Y.; Li, S.; Su, K.; Xiao, Z. Factors controlling the reservoir accumulation of Triassic Chang 6 Member in Jiyuan-Wuqi area, Ordos Basin, NW China. Pet. Explor. Dev. 2019, 46, 253–264. [Google Scholar] [CrossRef]
  37. Xiao, Z.; Ding, W.; Liu, J.; Tian, M.; Yin, S.; Zhou, X.; Gu, Y. A fracture identification method for low-permeability sandstone based on R/S analysis and the finite difference method: A case study from the Chang 6 reservoir in Huaqing oilfield, Ordos Basin. J. Pet. Sci. Eng. 2019, 174, 1169–1178. [Google Scholar] [CrossRef]
  38. Zhang, Y.; Wei, S.; Shuwen, D. Changes of Late Mesozoic Tectonic Regimes around the Ordos Basin (North China) and their Geodynamic Implications. Acta Geol. Sin.-Engl. Ed. 2011, 85, 1254–1276. [Google Scholar] [CrossRef]
Figure 1. The location of research area.
Minerals 13 00297 g001
Figure 2. Stratigraphic column of the Yanchang Formation in the southwestern Ordos Basin.
Minerals 13 00297 g002
Figure 3. Core photos, (ac) high-angle fractures, (d) low-angle fractures.
Minerals 13 00297 g003
Figure 4. Histogram of core fracture angle.
Minerals 13 00297 g004
Figure 5. Histogram of core fracture density.
Minerals 13 00297 g005
Figure 6. Fractures orientation (a) Paleomagnetic core re-orientation, (b) Borehole electrical imaging logs rosette diagram, (c) Outcrop (strike: NE 60°, dip: NE 120°, inclination: 87°).
Minerals 13 00297 g006aMinerals 13 00297 g006b
Figure 7. Histogram of fracture development effectiveness parameters (a) fracture opening, (b) fracture spacing, (c) fracture down-cutting depth, (d) fracture filling degree.
Minerals 13 00297 g007
Figure 8. Fracture development of different types of lithology.
Minerals 13 00297 g008
Figure 9. The cross-plot of fracture spacing and bedding thickness.
Minerals 13 00297 g009
Figure 10. (a) Fracture identification effect of conventional logs in well Y298 (CAL, caliper; SP, spontaneous potential; GR, gamma ray; AC, acoustic log; CNL, compensated neutron; DEN, density; RD, deep resistivity; RS, shallow resistivity; PERM, permeability; SW, water saturation; Sand, the content of sandstone; Shale, the content of shale; CFI, composite fractures indicator), (be) Core photos, depth positions correspond to track 9 of (a).
Minerals 13 00297 g010
Table 1. Average of fracture indication values for a single logging property from 20 wells at core observed fracture locations.
Well NameFGRFACFRLLDFRLLSFCAL
Y1190.5020.8370.7130.8250.342
B1710.4820.8040.9040.8280.322
B1810.4430.7390.8650.7380.283
B2200.4900.8170.8400.7960.330
Y2950.4420.7370.8330.8320.282
B2740.4570.7610.8550.7500.297
B4030.4160.6930.8060.8530.256
B4240.5370.8940.8130.7730.377
B4580.4660.7770.7900.7460.306
B4690.4380.7300.7710.8140.278
B2980.4920.8200.8050.7480.332
B4720.4800.7990.7840.7070.320
B4750.4700.7840.8130.8060.310
B4790.5270.8780.8070.7690.367
Y2870.4810.8010.7300.7290.321
B4960.4340.7240.8080.8330.274
Y2850.4990.8320.8120.8370.339
Y4100.5360.8930.7860.7110.376
B1190.4580.7630.8140.8420.298
Y4140.4950.8250.7690.7550.335
Average0.4770.7950.8060.7850.317
Disclaimer/Publisher’s Note: The statements, opinions and data contained in all publications are solely those of the individual author(s) and contributor(s) and not of MDPI and/or the editor(s). MDPI and/or the editor(s) disclaim responsibility for any injury to people or property resulting from any ideas, methods, instructions or products referred to in the content.

