1. Introduction
Over the past couple of decades, new fatigue monitoring technology has been developed and deployed. Typically, these technologies use measurements such as the PERCLOS (Percentage of Eyelid Closure) and sleep measures, among others [
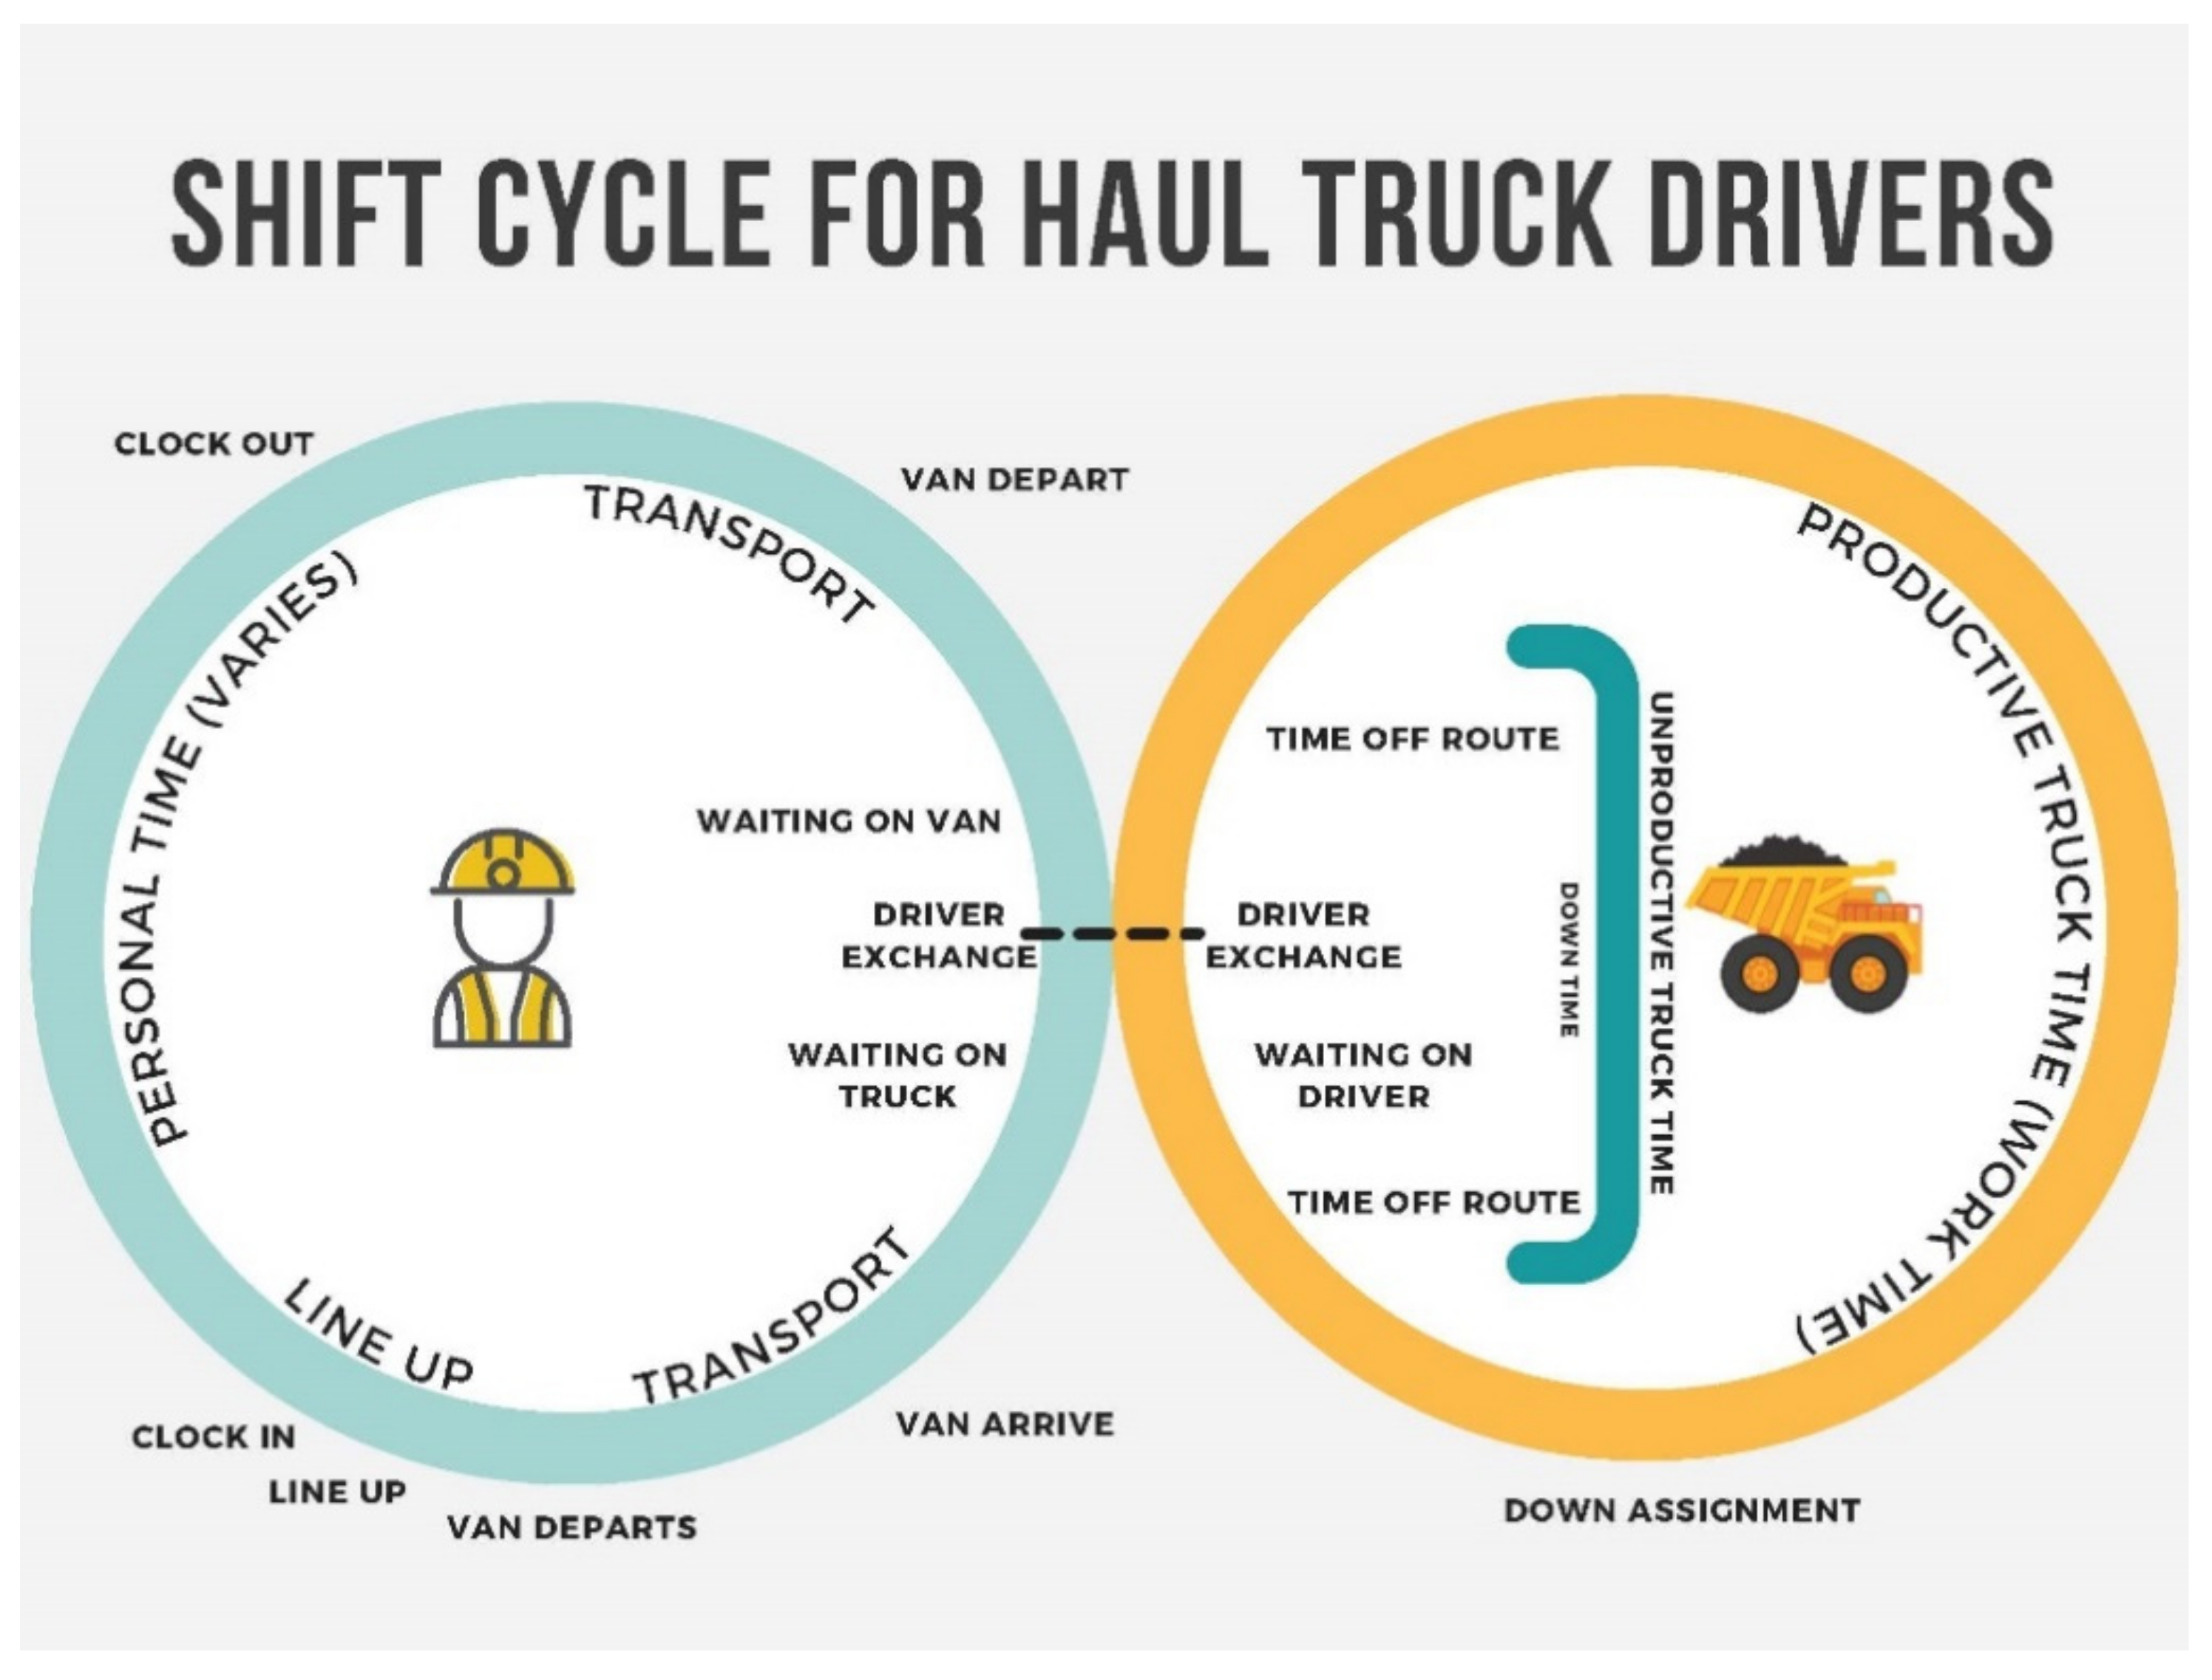
1]. These technologies demonstrate the ability to assess the fatigue states of operators. However, these systems lack the ability to assess performance measures (reaction time) and subjective fatigue experiences of operators. Another issue of these systems is that they allow for tracking during the productive truck time while often neglecting personal time (see
Figure 1).
To systematically assess factors that affect operator fatigue, there is a need for comprehensive tools that go beyond the measurement of outcomes of fatigue state, such as eye closure. Wearable devices provide an opportunity to address this issue by providing more comprehensive measures of operator fatigue. This methods paper provides an overview of the introduction of wearable tools and custom applications as a means to assess and manage operator fatigue.
Smartwatches have built-in functionality, such as sleep and activity tracking, which are constantly improving in accuracy. Moreover, many of these devices provide coding platforms to create third-party custom applications. In the context of this study, an application was developed that allowed repeated measurement of reaction time and subjective ratings of fatigue states.
The benefit of this approach is that it provides a simplified performance measurement that reflects individual operators’ fatigue levels by linking subjective and objective measurements. This functionality will provide an opportunity to gain access to the fatigue levels of operators with the potential to make a determination of fitness for duty. While other fatigue management tools exist, issues related to user acceptance hinder their adoption and use, resulting in low levels of engagement. This is unlike wearable devices, which have the potential to increase the engagement levels of operators since these devices provide additional functionality that benefits users beyond the job-specific context.
This paper provides an overview of the methods used to create an assessment tool, using an off-the-shelf wearable watch to assess reaction time and subjective measures of fatigue. The watch was used at various mine sites, and initial results are shown. This paper provides important lessons learned and the next steps needed to fully develop these toolkits. The goal of the paper is not to compare systems, but to evaluate the feasibility of off-the-shelf technologies to assess fatigue. The following sections provide background on available tools and current approaches for fatigue management. A gap analysis is provided, as well as the fundamental science behind reaction times and subjective fatigue measures. A key element of the background is a matrix of needs for reaction time and a subjective measure of fatigue. Next, various tools are considered, and the background of the application development process is provided. Then, the methods of developing an application, its testing, and the unique challenges of deploying wearables at a mine site are provided. Finally, the paper concludes with the next steps and important findings.
2. Background
For the purpose of this paper, a brief review of operator fatigue is provided here. A more thorough review of fatigue in mining can be found in Drews et al., 2020 [
1], or in Talebi et al., 2021 [
3]. After providing a review of operator fatigue in mining, we give an overview of reaction times, signal detection theory, and common subjective measures of fatigue. This background gives a conceptual theory and requirements for application development and assessment thresholds of functionality. Finally, the wearable technology and application development process are reviewed, and methods are presented.
2.1. Overview of Fatigue Causes and Effects
Several studies provide insight into and an understanding of what causes fatigue. One of these studies divides the origin of fatigue into lack of sleep and/or long work hours (LWHs) and boredom [
4]. A broader categorization of causes of fatigue divides them into individual-based and work-based causes [
5]. Of importance here is that the actions of both organizations and workers influence fatigue and that responsibility for fatigue management rests on both.
Organizational contributors to fatigue include time on shift, number of breaks, shift type, shift pattern, total work time and recovery, and type of work [
5]. At the individual level, pre-existing medical conditions and age-related challenges are some of the major contributors [
5]. While the above categorization focuses on organizational and individual contributors, another way to categorize them is into general, mental, and muscular [
6], which relates to the definition of fatigue proposed by Frone and Tidwell, 2015 [
7].
Table 1 summarizes the factors, definitions, and impact of fatigue contributors [
6]. Considering mining operations’ nature, contributors such as shift work, LWHs, repetitive work, and others tend to cause fatigue in operators. Therefore, it is clear that the mining industry has factors that increase the risk of fatigue and make it quite difficult to manage. Mabbott and Lloyd, 2005, show how important it is to explore and understand the variables related to fatigue in mining in general and what its influences are on organizations more specifically [
8].
After identifying the causes of fatigue, we established one fundamental question that needs an answer: what are the effects of fatigue? A common understanding is that fatigue is considered an organizational threat that could lead to accidents and incidents in an industrial environment. Consequentially, organizations dedicate themselves to better controlling fatigue due to its organizational impact.
Fatigue impacts that are demonstrated at the individual level include [
4]:
Reduced decision-making ability;
Reduced ability to do complex planning;
Reduced communication skills;
Reduced productivity or performance;
Reduced attention and vigilance;
Reduced ability to handle stress on the job;
Increased reaction time in speed and thought;
Loss of memory or the ability to recall details;
Failure to respond to changes in surroundings or information provided;
Inability to stay awake (e.g., falling asleep while operating machinery or driving vehicles);
Increased tendency for risk taking;
Increased forgetfulness;
Increased errors in judgment.
Drews et al., 2020, provide a case study that explores the effect of fatigue in a mining environment [
1]. Among their findings, they report similar effects of fatigue, but also identify the importance of operators’ awareness when experiencing fatigue. Finally, Dawson and McCulloch, 2005, explore at the organizational level how fatigue relates to incidents [
9]. They present an error trajectory, which includes several layers that contribute to an incident. It is important to understand the presented layers in order to prevent fatigue-related incidents from happening. An important aspect of fatigue and incidents is that they are present in many industries and tend to follow a similar error trajectory [
9].
2.2. Assessing Fatigue
Recent history has seen a growth in the number of available fatigue monitoring systems based on newly developed technologies. Each of these systems tries to address fatigue using different combinations of sensors, measurements, and techniques [
4]. Measurements among those systems are accomplished using cognitive tests, EEG, pupillometry, fitness for duty tests, and others [
1,
8,
10,
11].
Even though several technologies have been developed, there is a necessity to investigate fatigue from a socio-technical systems perspective [
1,
12]. Most tools utilize sensor data and tend not to consider individual operators’ experiences. Therefore, considering the nature of fatigue, there is an additional benefit from assessing subjective measurements, which could be included in the development of predictive models of fatigue.
Another important consideration in the context of the different systems is the degree to which they are experienced as invasive and potentially a distraction. Drews et al., 2020, exemplify in their study how technologies can have low acceptance and can be considered a distraction to operations [
1]. As an example, EEG caps and camera-based systems have faced resistance from operators due to the feeling of “having their privacy invaded”.
One final problem that persists when analyzing fatigue monitoring systems is related to their validation. Validating fatigue-monitoring technologies continues to be a challenge even though technologies have evolved and health and safety standards have improved [
13]. Ultimately, it is a challenge to provide an optimal technological solution that is well accepted by its users, provides real-time or predictive information, and can be enforced throughout mining operations [
13]. With this in mind, any auxiliary development towards this optimal technological solution is of value.
Talebi, E. et al., 2021 and 2022, used existing operational data and fatigue monitoring system data to model fatigue in the mining industry [
3,
14]. They showed that existing technologies do not sufficiently explain the fatigue variance across many dimensions, suggesting there is a gap in the available data. IoT technology has been shown in other fields to be a proven method and tool to potentially fill data gaps. Therefore, more detailed data are needed to properly model and predict fatigue.
2.3. Psychological Assessments of Fatigue
Psychological assessments of fatigue have been used in investigating fatigue in a wide range of contexts. To provide an overview of the methods and paradigms used to study fatigue, we will discuss the following three approaches in more detail [
15,
16]: psychomotor vigilance tasks (PVTs); signal detection theory (SDT); Karolinska Sleepiness Scale (KSS).
SDT is a theoretical paradigm that was first studied in the early 1950s with a focus on human performance in the context of radar detection. At the core of SDT is the assumption that any type of signal needs to be identified in the context of noise [
17]. SDT is applied when an operator needs to distinguish signal from noise, and it has been utilized in several fields [
18].
2.3.1. Psychomotor Vigilance Tasks
A PVT is a simple reaction time task, where a participant is presented with a stimulus and instructed to respond to the presence of the stimulus [
19]. For example, one test involves presenting light on a screen, with the participant being required to respond by pressing a key on a keyboard. Measures of reaction times provide a metric to assess vigilance or fatigue.
Basner et al., 2011, demonstrate that the PVT is sensitive to sleep deprivation, making it a potential indicator of fatigue. One advantage of the PVT is that it is possible to perform the assessments outside of the laboratory [
20]. The tests were originally performed on the PVT-192 (Ambulatory Monitoring Inc., Ardsley, NY, USA), a handheld device built specifically for the test and considered to be its gold standard [
20]. Other studies, such as Matsangas and Shattuck, 2018, explore the use of a wrist-worn device to execute the PVT test and support its use for short PVT tests [
21]. Kay et al., 2013, and Matsangas and Shattuck, 2018, verify the possibility of using a touch screen to execute the test and conclude that it is feasible, especially when the gesture used to record the RT is a finger tap on the screen [
21,
22].
One of the limitations of the PVT is that its traditional version requires 10 min of data collection, making it difficult to use in an environment where the available time for data collection is limited. Fortunately, the brief psychomotor vigilance test (PVT-B), which lasts 3 min, provides good evidence that the test duration can be reduced to achieve an equilibrium between the test reliability and its operational feasibility [
20,
23].
Because the PVT measures the reaction times of participants, it is informative to assess the sensitivity of this measure to fatigue. The literature suggests that reaction times become slower when participants are fatigued [
24,
25]. This trend is even more pronounced when the reaction time task is more complex (e.g., when participants need to distinguish between executing a response to a green stimulus while inhibiting a response to a red stimulus) [
26]. In addition, mental fatigue, especially sleepiness, has the greatest effect, while muscular fatigue does not lead to changes in reaction times [
27].
2.3.2. Signal Detection Theory
To provide an example of the application of SDT, consider an experiment in which participants are exposed to visual stimuli and need to respond if the stimulus is green (yes), while they are instructed not to respond when it is red. Conceptually, there are four combinations between stimuli (green and red) and responses (yes, green stimulus, no red stimulus) (see
Figure 2). The combinations between stimuli and responses can be labeled as in
Figure 2, with, for example, the presence of a green stimulus resulting in a positive response, referred to as a Hit.
Both hit and correct rejections are the expected answers; on the other hand, misses and false alarms are incorrect answers. These categories are important for statistical analysis and a better understanding of a person’s behavior [
28]. Of particular interest here are changes in response behavior (reduction in hits and increase in misses) when examining the fatigue levels of an operator.
2.3.3. Karolinska Sleepiness Scale (KSS)
To explore the subjective experience of fatigue, beyond the use of objective measures such as reaction times, a number of scales have been developed. Here, we discuss the KSS, which was developed by Åkerstedt and Gillberg, 1990, to assess the subjective level of sleepiness at a certain time of the day [
29]. It instructs participants to describe the level of sleepiness they experienced in the last 10 min. The scale has been validated in a number of contexts, such as shift work, jetlag, driving abilities, and others [
30].
Table 2 provides the labels and ratings of this scale.
Overall, the combination of the use of a reaction time measure with the assessment of subjective levels of fatigue provides a method to assess the fatigue of operators in their operational environment.
2.4. Fatigue Assessment Tool Selection Decision-Making Approach
A variety of approaches could be used to develop an application and select the tools to assess fatigue in the operational environment. A key consideration in technology development and assessment considers the technical factors of sensors and data collection, as well as human factors such as user acceptance and motivations. There are minimum technological thresholds on reaction time tests that must be considered. User adoption is a critical metric. Each of these factors was integrated into the team’s development approaches to create the application and select the tool. In addition, we identified a number of gaps in existing monitoring technology:
Smartwatches are a good candidate technology for this research due to the equilibrium between economic investment, sensors, on-the-shelf availability, and customization.
When focusing on wrist-wearable devices, there are additional opportunities for integration that are associated with this technology.
Table 3 shows the summary of open research topics/applications of wrist-wearable devices for the mining industry [
31]. Mardonova and Choi, 2018, consider that smartwatches do not have health and safety capacities, but the most recent smartwatches act both as a traditional smartwatch and a fitness tracker [
31].
Ultimately, Fitbit technology was chosen for this study due to the wide adoption of Fitbits and their established versatility. This tool is widely adopted by users. Fitbit also has platforms that allow for application development and API (Application Programming Interface) integration with other systems.
3. Method
This section will cover a methodological approach to developing and testing a wearable device and custom application for assessing fatigue called Real-Time Fatigue Monitoring (RTFM).
3.1. Scope Definition
The system was designed to create a tool capable of executing fatigue assessments throughout an operational shift. For that matter, the number of interactions with operators with the application was kept to a minimum. The application, when running on the smartwatch, only shows the time of day in its default state to avoid distracting operators or causing them to want to interact with it. The final interface is presented in
Figure 3 and consists of the application icon on the smartwatch (1), default screen (2), assessment question screen (3), KSS assessment screen (4), confirmation screen (5), and RT assessment screen (6, 7, and 8).
Figure 4 demonstrates the logic behind the RTFM application and how the operator should interact with it. It is also part of the support and training material that was provided to operators and managers to guarantee a standard operational procedure (SOP).
3.2. System Architecture
As the Fitbit (Versa 2 devices) hardware lacked unique identifiers available for use, a tool was developed to uniquely identify each device and to ensure the middleware’s security. Uniquely identifying each device allows for aggregating data at an individual level. In order to do so, the Fitbit user id, which is a unique user identifier composed of six alphanumeric characters available in the Fitbit system, is extracted via an authentication process.
The authentication process takes place on a webpage designed exclusively for that reason, and it also helps to explore data available from third-party applications, such as the sleep data collected by Fitbit, if there is a need for it. The webpage guides users through the authentication process and was developed using HTML, CSS, Kotlin, and JavaScript.
The authentication front-end process is straightforward. First, users navigate to a URL provided to them.
The application server, developed in Kotlin, and utilizing the Spring Boot framework, was responsible for managing all the business rules and communication with the database. The server was hosted on Amazon Web Services (AWS), to ensure availability and scalability.
The middleware layer provides endpoints that receive information from the RTFM app in the form of an API. An endpoint is a communication channel that expects a certain type of information; when the information is received, it executes pre-designed commands and finishes by sending a response back. The communication channels follow the HTTP protocol [
32] and expect structured data. Alongside being the standard communication protocol, HTTP protocols also provide developers with a variety of established response codes that can be easily understood.
3.3. System Data Handling and Analysis
The database system chosen for the study was PostgreSQL. PostgreSQL is a powerful, open-source object-relational database system with over 30 years of active development that has earned it a strong reputation for reliability, feature robustness, and performance [
33].
The database fields, their descriptions, and variable types are shown in
Table 4. The table lists important variables and data captured from the application. Some of the data are created as an identifier of each user and for connecting tables, and some are the ones measured by the application. Fatigue level is measured using the KSS. After that, the RT test exposes operators to visual stimuli 20 times, measuring response times in milliseconds and assessing the response as correct or incorrect.
3.4. Case Study
Using this Fitbit app, we collected data on reaction times and subjective experiences of fatigue for a total of 85 operators. For this study, no criteria were used to select the operators, and we only had access to the data of the individuals that companies selected. Data collection began in October 2020 and ended in March 2022. The initial data set was analyzed to eliminate incorrectly collected data or data that consisted of implausibly fast (RT < 250) or slow (RT > 1250) response times. In addition, participants were eliminated from the data set who displayed stereotypical response patterns of incorrect trials. A total number of 56,587 observations remained for complete analysis.
4. Results
The results of the study are shown in the upcoming section. Reaction time statistics, subjective measures, and signal detection results are shown to assess the effectiveness of the application and wearable device.
4.1. Reaction Times (RTs)
Overall, the mean reaction time was 540 ms with a minimum of 256 and a maximum of 1250 ms, and an SD of 131.4 ms.
To analyze the RTs across all 24 h of the day for valid trials (i.e., a green screen is presented with an RT > 250 ms and RT < 1250 ms is produced), all other types of trials were filtered from the data set (i.e., no response to green screen, response to red screen, and no response to red screen).
Figure 5 shows the RTs during the two different shift periods based on the hour of the day. Note that the
y axis is not included in the scale section from 0 to 399 ms to illustrate the overall pattern of the data better. Overall, comparing the response times at night (highlighted area) and daytime, it is clear that drivers had slower reaction times during the night shift. In addition, the fastest reaction times were measured between 1 am and 4 am.
Reaction Times during Day and Night Shifts
The next analysis focused on a comparison between the RTs during the night shift and day shift. Overall RTs during the day shift were expected to be lower than during the night shift, leading to this comparison. For the purpose of this analysis, the RT data were aggregated based on the hour of the day to minimize issues related to statistical testing due to inflated degrees of freedom. An Analysis of Variance (ANOVA) revealed a significant effect of shift (F(1,72) = 4.2;
p < 0.05) (RT night = 555 ms vs. day = 543) and site (F(2,72) = 5.8;
p < 0.005).
Table 5 summarizes the descriptive statistics of this analysis.
4.2. Subjective Measures of Fatigue
The subjective ratings of the KSS were analyzed using an ANOVA identical to the analytical approach described above for the RTs.
We hypothesized that the overall KSS score during the day shift would be lower than during the night shift. For the purpose of this analysis, the KSS score was aggregated based on the hour of the day (see
Table 6). An ANOVA revealed a significant effect of shift (F(1,72) = 94.8;
p < 0.001), (KSS night = 3.5 ms vs. day = 2.8).
An additional analysis was performed to explore the relationship between the KSS scores and the RT data since the effects of the above analysis appear to be not quite aligned. The Pearson correlation coefficient was r = 0.134 and not significant (p = 0.262), suggesting that the two measures assess different aspects of fatigue.
4.3. Signal Detection Theory-Based Analyses
The precision of the responses was analyzed using the theoretical framework of signal detection theory. Shown below are the results of the analyses. The most important cells are shown in green (see
Figure 2), showing the number of hits and correct rejections.
The statistical test to analyze for differences between day and night shifts revealed that there was a difference in terms of accuracy of responses (Pearson Chi-Square Tests (df = 3, Chi2 = 15.720,
p = 0.001), suggesting a lower accuracy of responses during the night shift compared to the day shift (see
Table 7).
5. Discussion
The analyses described above indicate strongly that the use of objective reaction time measurements appears to be a valid approach to assessing fatigue of the operators. As shown in
Figure 5, the aggregated response times slow significantly during the night shift compared to the day shift. The analysis of the subjective ratings of operator fatigue using the KSS indicates similar effects of shift as indicated by the RTs. The analysis of RTs using a signal detection paradigm suggests that there are differences between night and day shifts in terms of accuracy and signal detection performance.
Comparing the RTs and the KSS scores revealed a non-significant correlation between these measures, suggesting that there is a potential dissociation between these measures. Each of the measures appears to be tracking something different from the users. Future research is required to identify the reasons for this lack of a relationship.
The results of this study help to manage the workforce in the mining industry with respect to fatigue. Using a wearable device has advantages over other available fatigue management systems, such as cost, ease of use, and more secondary uses. In addition, mean reaction times can be used to predict the level of fatigue of the individual throughout the shift. Therefore, health and safety managers can monitor and manage the fatigue of the operators.
6. Conclusions
The reliability of using wearable watches to assess performative and subjective measures of fatigue was demonstrated using off-the-shelf wearable watches and custom applications. A system such as this will complement the mature fatigue monitoring systems currently on the market. Existing systems lack the ability to assess performance measures and subjective measures in real-time. Additionally, many of these systems are shown to not consider many human factors in their implementation, limiting their operational usefulness and adoption. Wearable devices allow a wide range of data points, such as activity and sleep, and have constantly improving base technology. There are other secondary uses of a wearable device that help improve a user’s perception of the device, improving adoption and user acceptance.
The results of this methods study show that the device adequately measures reaction time with the same precision shown in the literature. The ability to link RT and subjective fatigue measures highlights the importance of both measures as a comprehensive approach to monitor fatigue. Future development efforts will focus on utilizing the data from the app to provide feedback at the individual and organizational levels. This should allow operators and the organization to monitor fatigue more effectively.
Mine sites need these complementary tools for a robust and sustainable measure of fatigue. Wearable devices are more likely to create engagement and provide feedback over time. All the analyses in this study show that objective reaction time measurements are a promising approach to assessing operator fatigue. A comparison of the RTs and the KSS scores revealed that these measures appear to assess different aspects of fatigue. Future research is required to identify the reasons for this lack of a relationship.
For the next step of this research, it is recommended the sleep data captured from Fitbit be used in conjunction with the data described above. In addition, other individual data, such as activity level, age, food intake, diet, etc., can be used to make a comprehensive model for predicting fatigue. The research would also benefit from a comparative analysis of other fatigue-tracking systems. In order to ensure that the tools for performing the fatigue assessment are effective and reliable, more work is needed. For that, it is necessary to further establish the number of tests needed to properly assess the mean reaction time for each individual. So, for the next step of this research, we propose a model that can use the reaction time data to find the mean RT for each individual to assess their fatigue level. Thus, IoT, as exemplified by Fitbit, will provide advancements in collecting more comprehensive data that could improve operator fatigue management in the future.
Author Contributions
For this research article, contributions of the authors are as follows: Conceptualization, J.M., E.T., W.P.R. and F.A.D.; methodology, J.M., W.P.R. and F.A.D.; software, J.M.; validation, W.P.R. and F.A.D.; formal analysis, J.M. and F.A.D.; investigation, J.M. and E.T.; resources, W.P.R.; data curation, J.M. and F.A.D.; writing—original draft preparation, J.M., E.T. and W.P.R.; writing—review and editing, E.T., W.P.R. and F.A.D.; visualization, J.M. and E.T.; supervision, W.P.R.; project administration, W.P.R.; funding acquisition, W.P.R. All authors have read and agreed to the published version of the manuscript.
Funding
Funding for testing the application was partially provided by the National Institute for Occupational Safety and Health (NIOSH) with grant number 75D30119C05500.
Data Availability Statement
The data presented in this study are not publicly available due to confidentiality.
Acknowledgments
We would like to express our gratitude to the National Institute for Occupational Safety and Health (NIOSH) for funding and the mining companies, their management, and all of the people supporting this research.
Conflicts of Interest
The authors declare no conflict of interest.
References
- Drews, F.A.; Rogers, W.P.; Talebi, E.; Lee, S. The Experience and Management of Fatigue: A Study of Mine Haulage Operators. Min. Metall. Explor. 2020, 37, 1837–1846. [Google Scholar] [CrossRef]
- Lee, S. Exploring Fatigue Management of Haul Truck Drivers through a Socio-Technical Perspective. Master’s Thesis, Science in Mining Engineering, University of Utah, Salt Lake City, UT, USA, 2022. [Google Scholar]
- Talebi, E.; Rogers, W.P.; Morgan, T.; Drews, F.A. Modeling mine workforce fatigue: Finding leading indicators of fatigue in operational data sets. Minerals 2021, 11, 621. [Google Scholar] [CrossRef]
- Caldwell, J.A.; Caldwell, J.L.; Thompson, L.A.; Lieberman, H.R. Fatigue and its management in the workplace. Neurosci. Biobehav. Rev. 2019, 96, 272–289. [Google Scholar] [CrossRef]
- Williamson, A.; Friswell, R. Fatigue in the workplace: Causes and countermeasures. Fatigue Biomed. Health Behav. 2013, 1, 81–98. [Google Scholar] [CrossRef]
- Techera, U.; Hallowell, M.; Stambaugh, N.; Littlejohn, R. Causes and consequences of occupational fatigue: Meta-Analysis and systems model. J. Occup. Environ. Med. 2016, 58, 961–973. [Google Scholar] [CrossRef]
- Frone, M.R.; Tidwell, M.C.O. The meaning and measurement of work fatigue: Development and evaluation of the three-dimensional work fatigue inventory (3d-wfi). J. Occup. Health Psychol. 2015, 20, 273–288. [Google Scholar] [CrossRef]
- Mabbott, N.; Lloyd, R. Driver fatigue through nightshifts in succession. In proceeding of the Rail Achieving Growth Conference, Melbourne, VIC, Australia, January 2006. [Google Scholar]
- Dawson, D.; McCulloch, K. Managing fatigue: It’s about sleep. Sleep Med. Rev. 2005, 9, 365–380. [Google Scholar] [CrossRef]
- Choi, M.; Koo, G.; Seo, M.; Kim, S.W. Wearable Device-Based System to Monitor a Driver’s Stress, Fatigue, and Drowsiness. IEEE Trans. Instrum. Meas. 2018, 67, 634–645. [Google Scholar] [CrossRef]
- Dawson, D.; Searle, A.K.; Paterson, J.L. Look before you (s)leep: Evaluating the use of fatigue detection technologies within a fatigue risk management system for the road transport industry. Sleep Med. Rev. 2014, 18, 141–152. [Google Scholar] [CrossRef]
- Aaronson, L.S.; Teel, C.S.; Cassmeyer, V.; Neuberger, G.B.; Pallikkathayil, L.; Pierce, J.; Press, A.N.; Williams, P.D.; Wingate, A. Defining and measuring fatigue. J. Nurs. Scholarsh. 1999, 31, 45–50. [Google Scholar] [CrossRef]
- Hartley, L.; Horberry, T.; Mabbott, N. Review of Fatigue Detection and Prediction Technologies. Inst. Res. Saf. Transp. 2000, 1–42. [Google Scholar]
- Talebi, E.; Rogers, W.P.; Drews, F.A. Environmental and Work Factors That Drive Fatigue of Individual Haul Truck Drivers. Mining 2022, 2, 542–565. [Google Scholar] [CrossRef]
- Van Dongen, H.P.A. Comparison of Model Predictions to Experimental Data: Rectifying False Impressions. Aviat. Space Environ. Med. 2004, 75, A122–A124. [Google Scholar]
- Hursh, S.R.; Redmond, D.P.; Johnson, M.L.; Thorne, D.R.; Belenky, G.; Balkin, T.J.; Storm, W.F.; Miller, J.C.; Eddy, D.R. Fatigue Models for Applied Research in Warfighting. Aviat. Space Environ. Med. 2004, 75, 1–10. [Google Scholar]
- Swets, J.A. The History of Signal Detection Theory. International Encyclopedia of Social and Behavior Sciences; Elsevier: New York, NY, USA, 2001; pp. 14078–14082. [Google Scholar] [CrossRef]
- Stanislaw, H.; Todorov, N. Calculation of signal detection theory measures. Behav. Res. Methods Instrum. Comput. 1999, 3, 137–149. [Google Scholar] [CrossRef]
- Dinges, D.I.; Powell, J.W. Microcomputer analysis of performance on a portable, simple visual RT task sustained operations. Behav. Res. Methods Instrum. Comput. 1985, 17, 652–655. [Google Scholar] [CrossRef]
- Basner, M.; Mollicone, D.; Dinges, D.F. Validity and sensitivity of a brief psychomotor vigilance test (PVT-B) to total and partial sleep deprivation. Acta Astronaut. 2011, 69, 949–959. [Google Scholar] [CrossRef]
- Matsangas, P.; Shattuck, N.L. Agreement between the 3-Minute Psychomotor Vigilance Task (PVT) Embedded in a Wrist-Worn Device and the Laptop-Based PVT. In Proceedings of the Human Factors and Ergonomics Society Annual Meeting; Sage CA: Los Angeles, CA, USA, 2018; Volume 62, pp. 666–670. [Google Scholar]
- Kay, M.; Rector, K.; Consolvo, S.; Greenstein, B.; Wobbrock, J.O.; Watson, N.F.; Kientz, J.A. PVT-touch: Adapting a reaction time test for touchscreen devices. In Proceedings of the 7th International Conference on Pervasive Computing Technologies for Healthcare and Workshops, Venice, Italy, 5–8 May 2013. [Google Scholar]
- Basner, M.; Rubinstein, J. Fitness for duty: A 3-minute version of the psychomotor vigilance test predicts fatigue-related declines in luggage-screening performance. J. Occup. Environ. Med. 2011, 53, 1146–1154. [Google Scholar] [CrossRef]
- Welford, A.T. Fundamentals of Skill; METHUEN & CO LTD: London, UK, 1968; pp. 240–286. [Google Scholar]
- Welford, A.T.; Birren, J.E.; Schaie, K.W. Handbook of the Psychology of Aging; VanNostrandReinhold: New York, NY, USA, 1977; pp. 450–496. [Google Scholar]
- Singleton, W.T. Deterioration of performance on a short-term perceptual-motor task. In W. F. Floyd & A. T. Welford, Symposium on fatigue, 1st ed.; H. K. Lewis & Co.: London, UK, 1953; Volume 1, pp. 163–172. [Google Scholar]
- Kroll, W. Effects of local muscular fatigue due to isotonic and isometric exercise upon fractionated reaction time components. J. Mot. Behav. 1973, 5, 81–93. [Google Scholar] [CrossRef]
- Wickens, T.D. Elementary Signal Detection Theory, 1st ed.; Oxford University Press: London, UK, 2001; pp. 87–202. [Google Scholar]
- Åkerstedt, T.; Gillberg, M. Subjective and objective sleepiness in the active individual. Int. J. Neurosci. 1990, 52, 29–37. [Google Scholar] [CrossRef]
- Shahid, A.; Wilkinson, K.; Marcu, S.; Shapiro, C.M. STOP, THAT and One Hundred Other Sleep Scales; Springer Science & Business Media: New York, NY, USA, 2012; pp. 1–406. [Google Scholar]
- Mardonova, M.; Choi, Y. Review of wearable device technology and its applications to the mining industry. Energies 2018, 11, 547. [Google Scholar] [CrossRef]
- MDN Web Docs, 2021, An Overview of HTTP-HTTP|MDN. Available online: https://developer.mozilla.org/en-US/docs/Web/HTTP/Overview (accessed on 20 December 2020).
- The PostgreSQL Global Development Group. Available online: https://www.postgresql.org/ (accessed on 5 May 2021).
| Disclaimer/Publisher’s Note: The statements, opinions and data contained in all publications are solely those of the individual author(s) and contributor(s) and not of MDPI and/or the editor(s). MDPI and/or the editor(s) disclaim responsibility for any injury to people or property resulting from any ideas, methods, instructions or products referred to in the content. |
© 2023 by the authors. Licensee MDPI, Basel, Switzerland. This article is an open access article distributed under the terms and conditions of the Creative Commons Attribution (CC BY) license (https://creativecommons.org/licenses/by/4.0/).


