


Frothing Performance of Frother-Collector Mixtures as Determined by Dynamic Foam Analyzer and Its Implications in Flotation

 ,
,  ,
,  ,
,  ,
, 
 and
and
Abstract
:1. Introduction
2. Materials and Methods
2.1. Materials
2.2. Methods
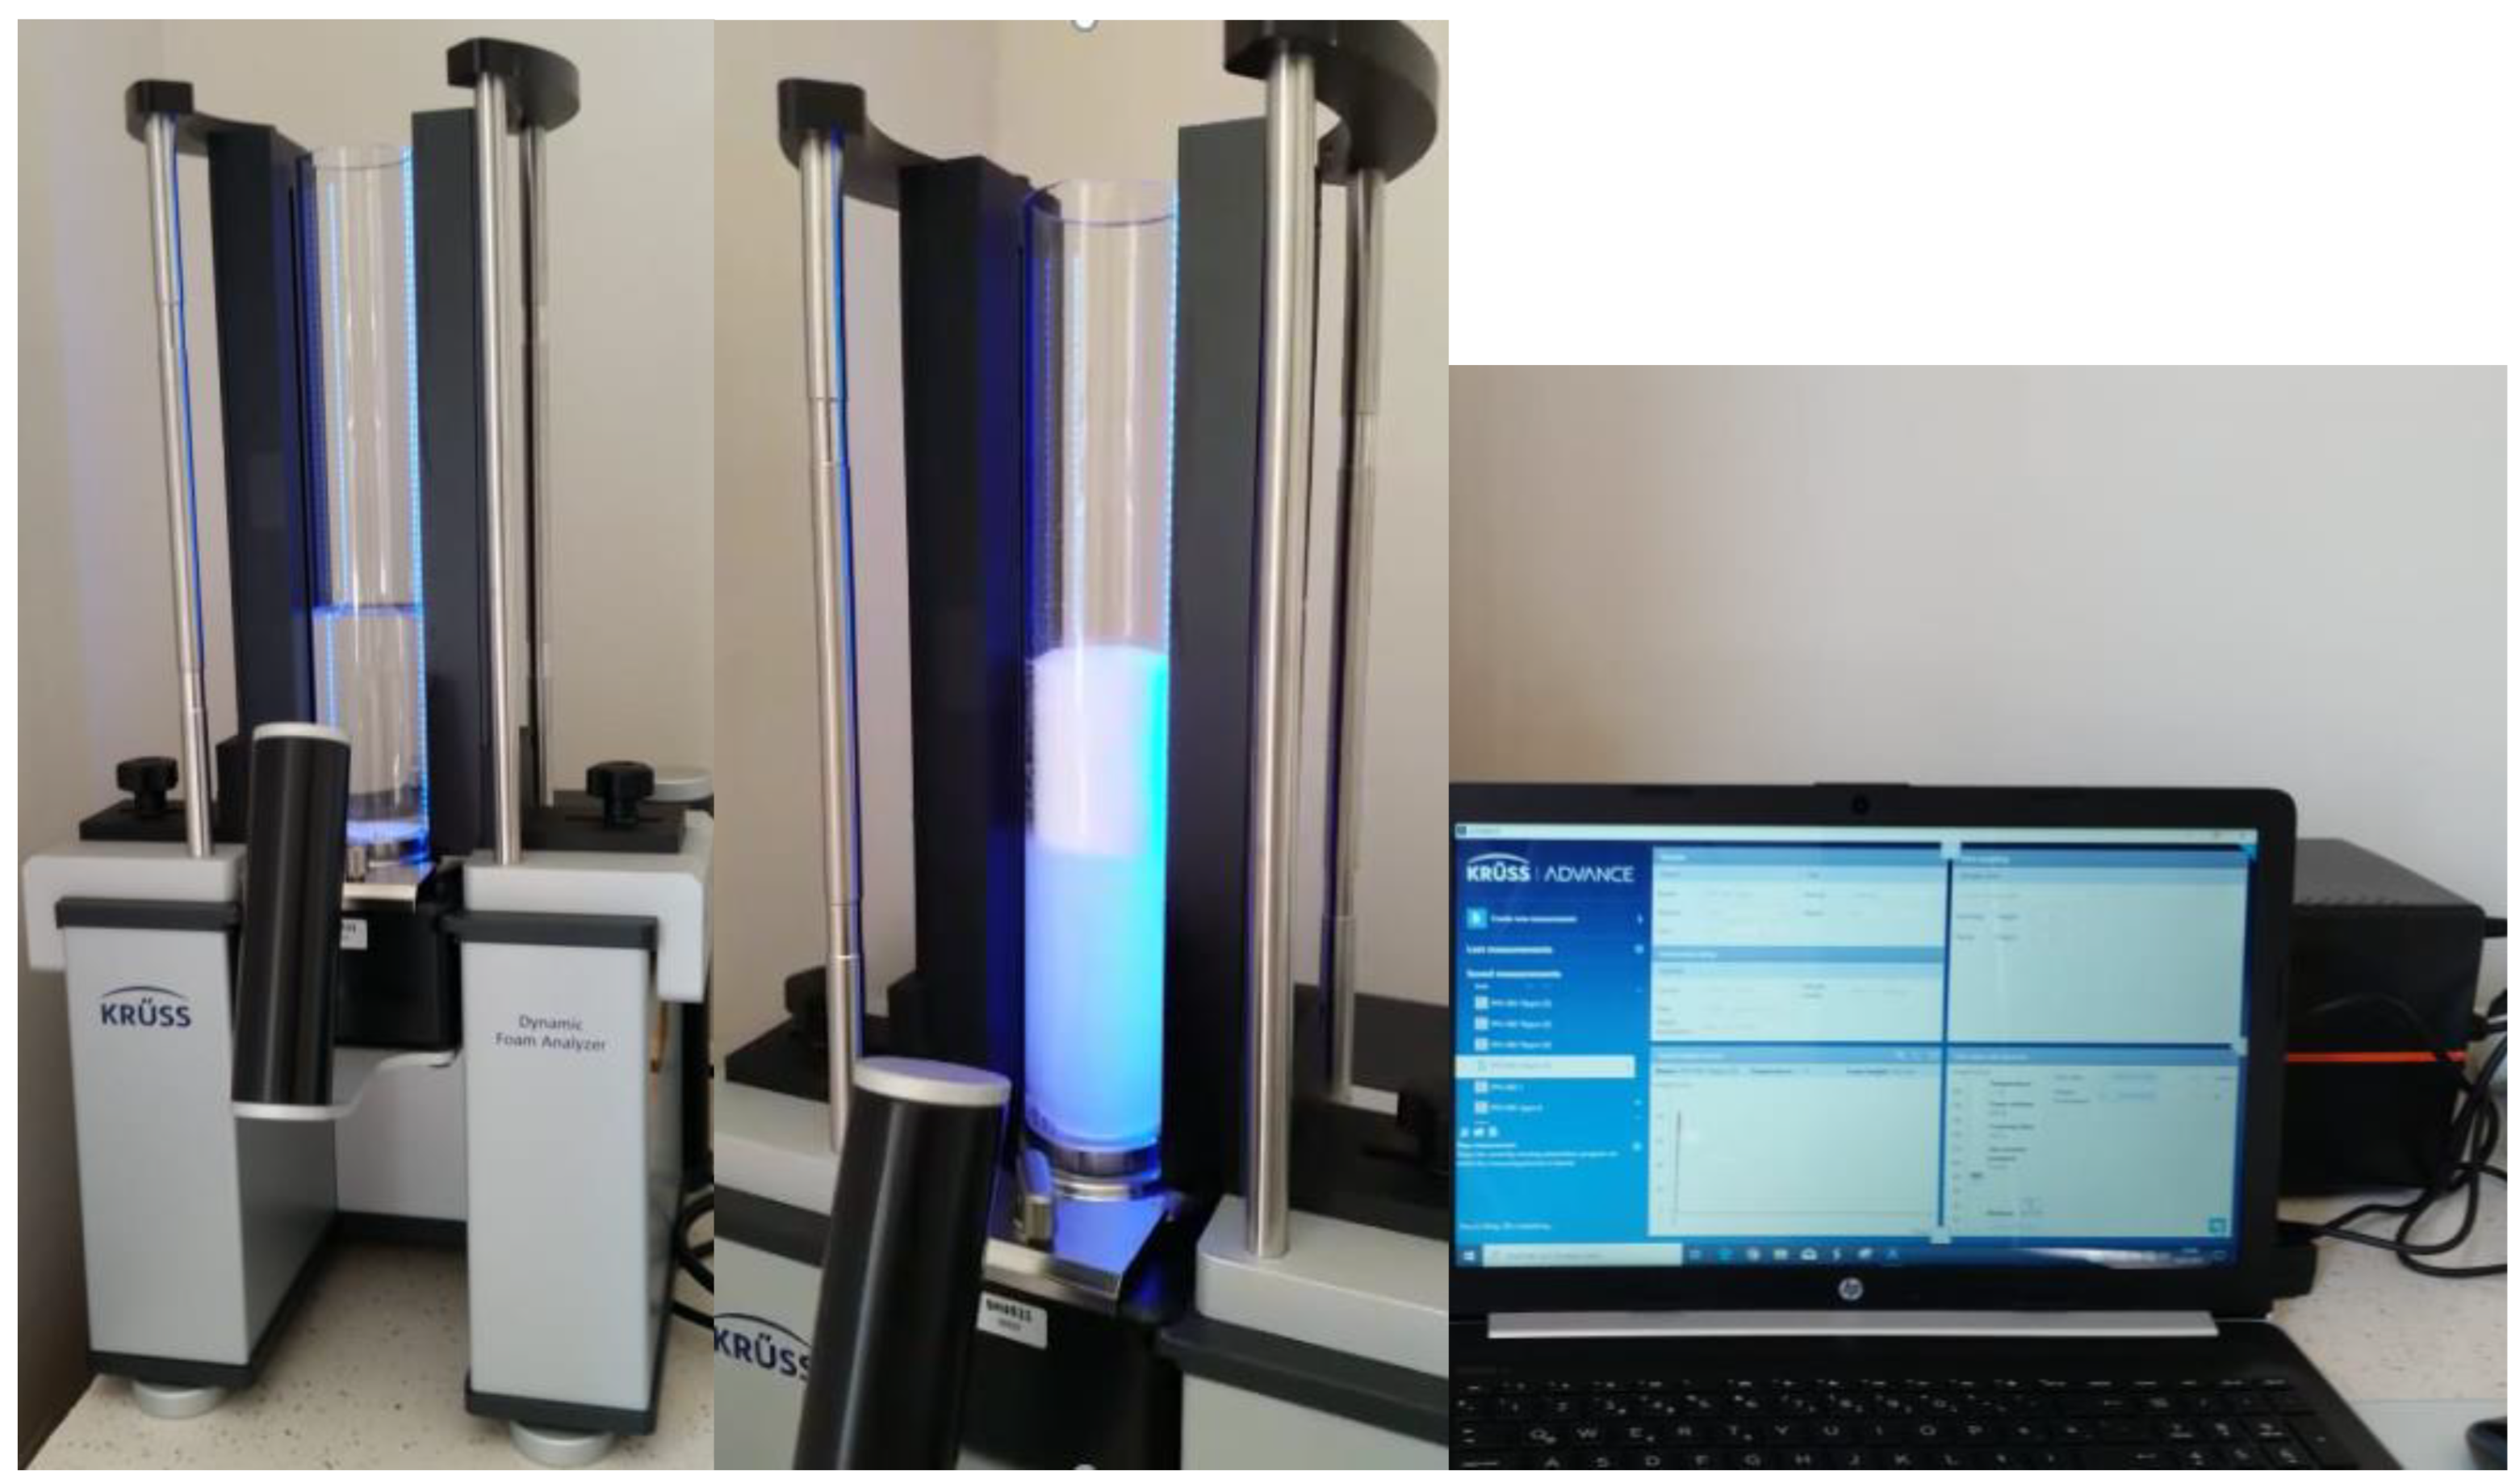
2.2.1. Dynamic Foam Stability Experiments
2.2.2. Modeling Studies
3. Results and Discussion
3.1. Dynamic Foam Stability Experiments
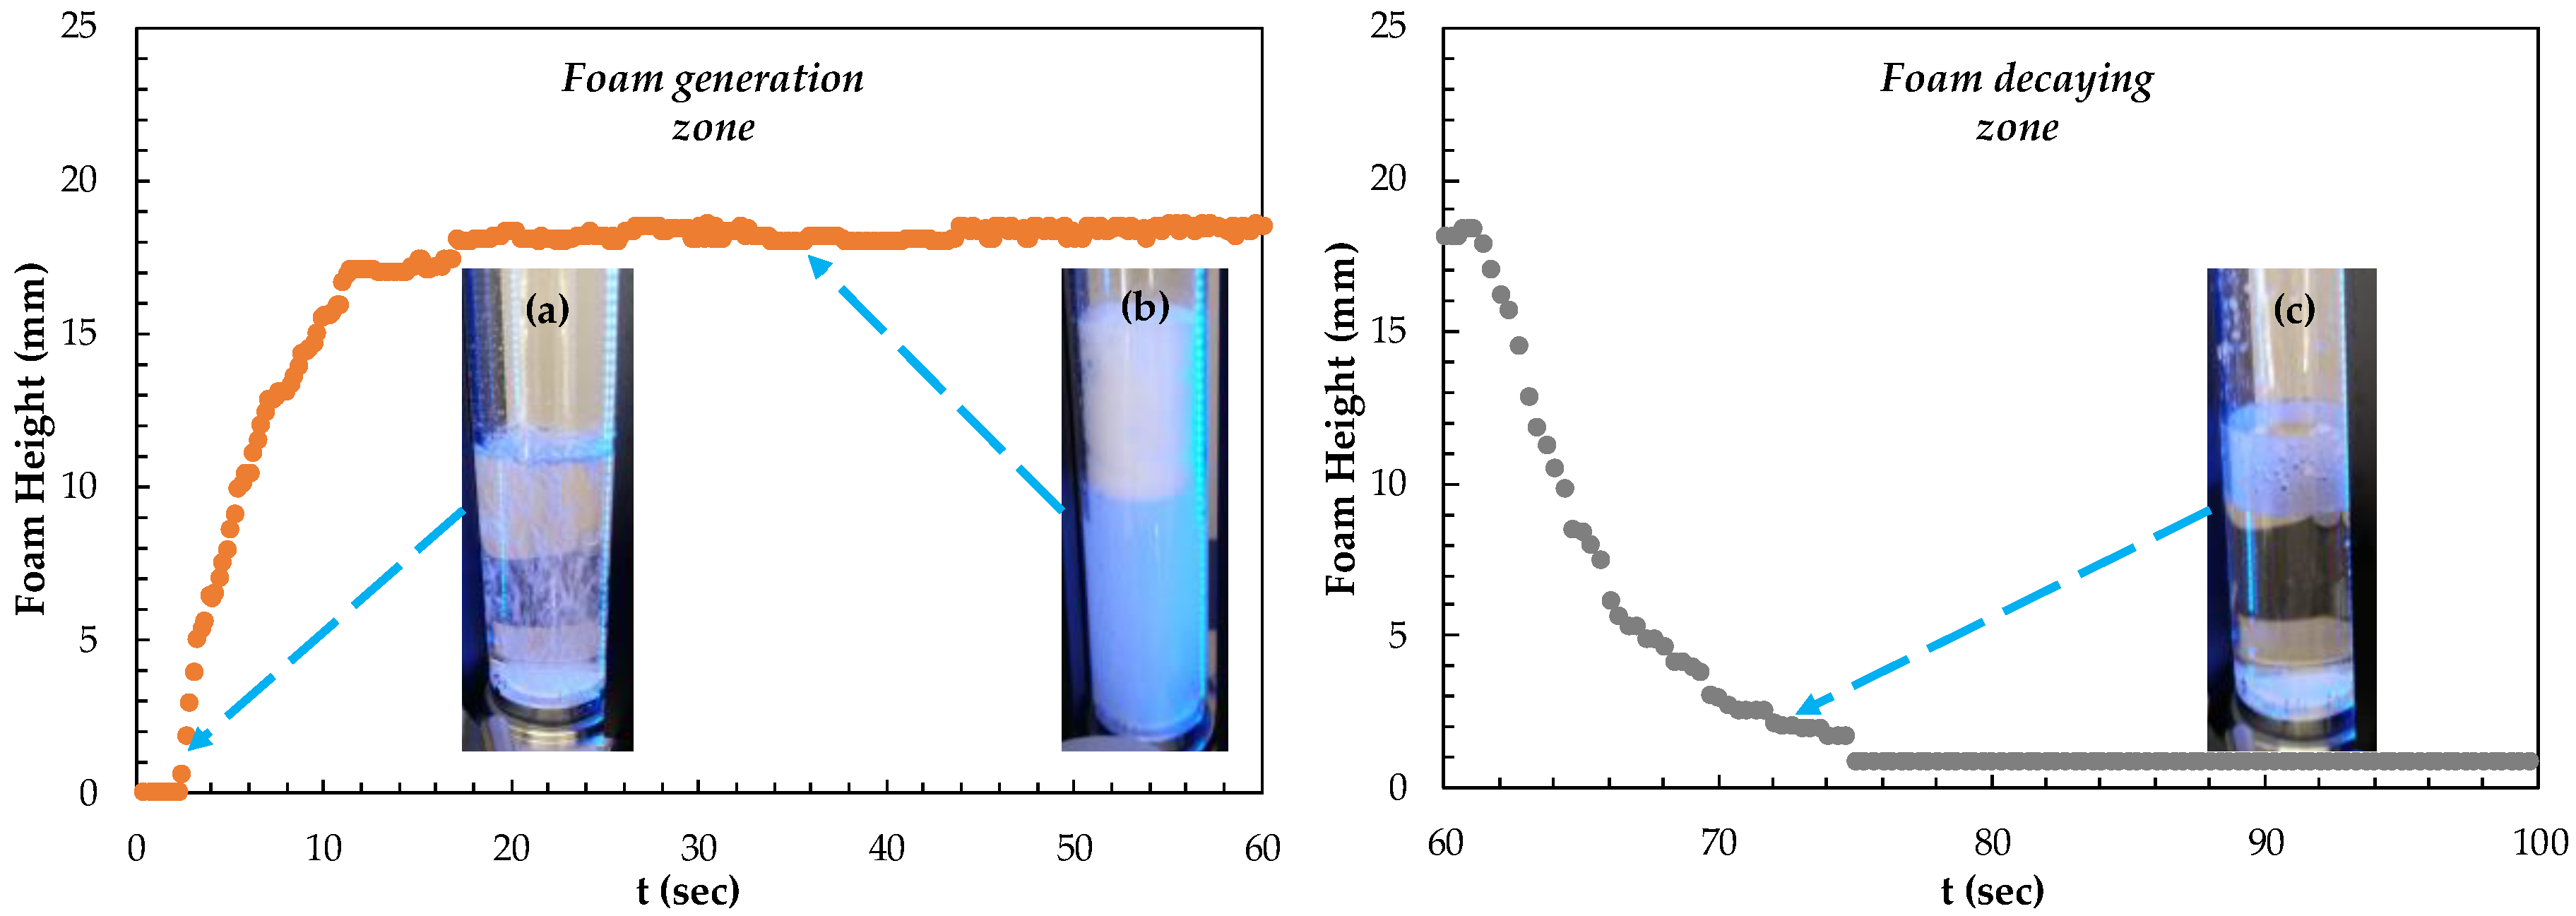
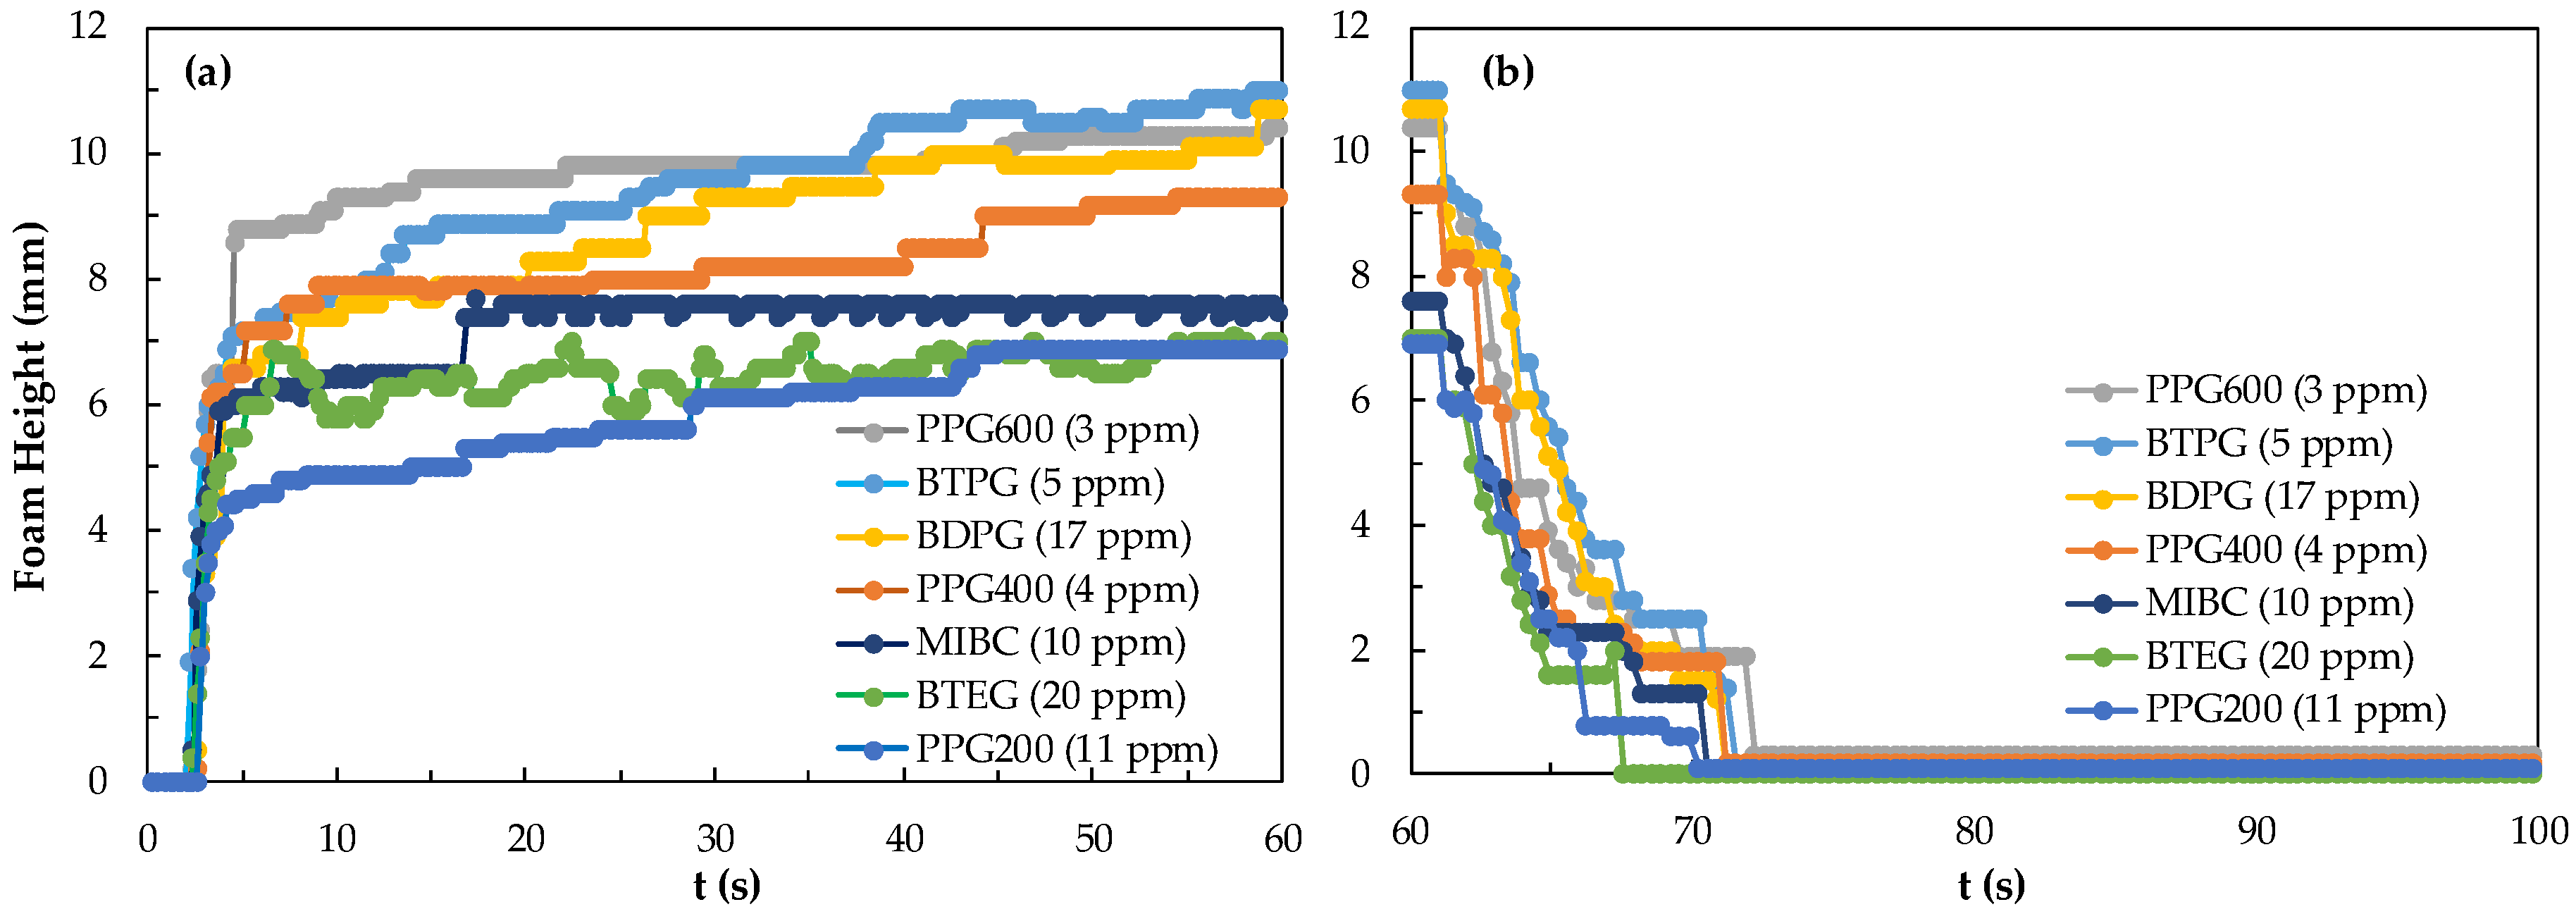
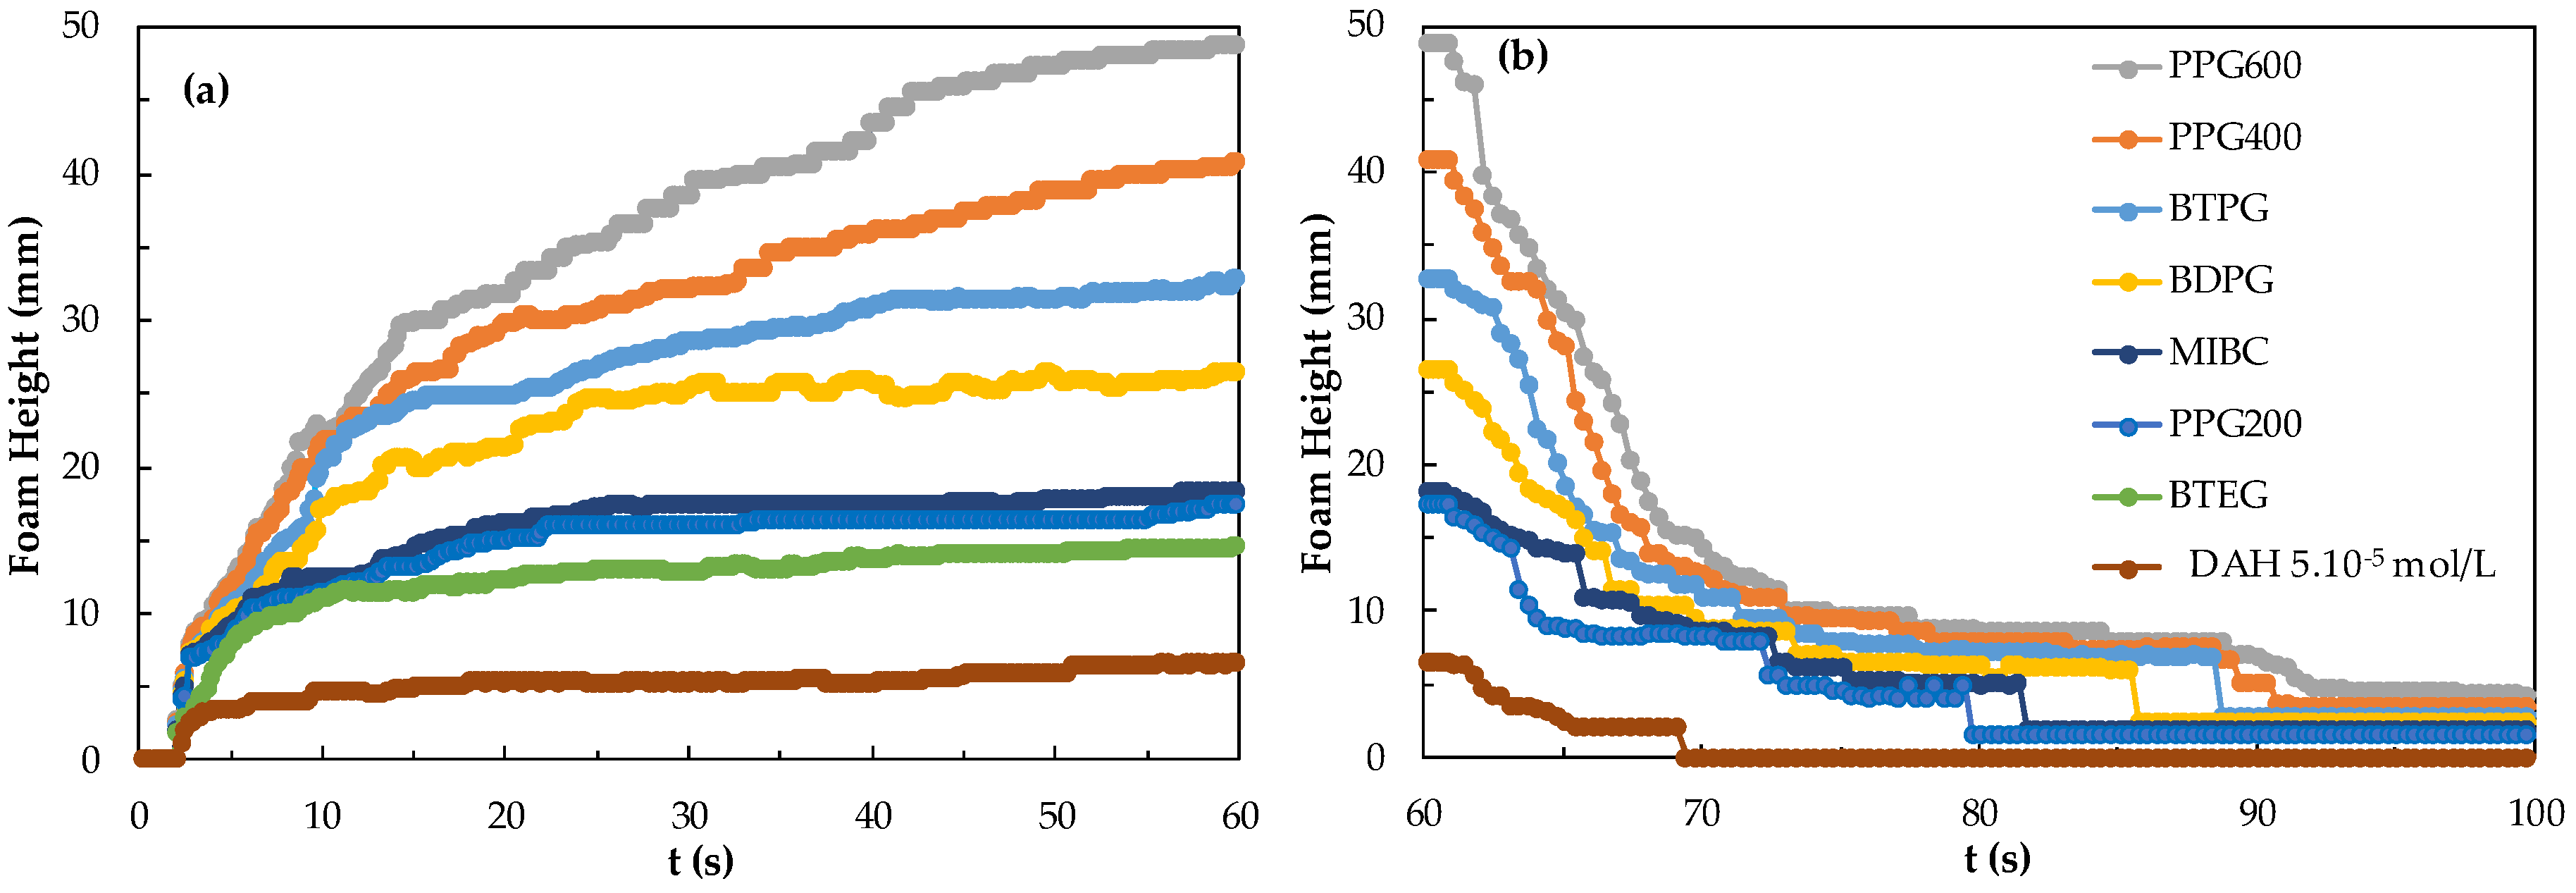
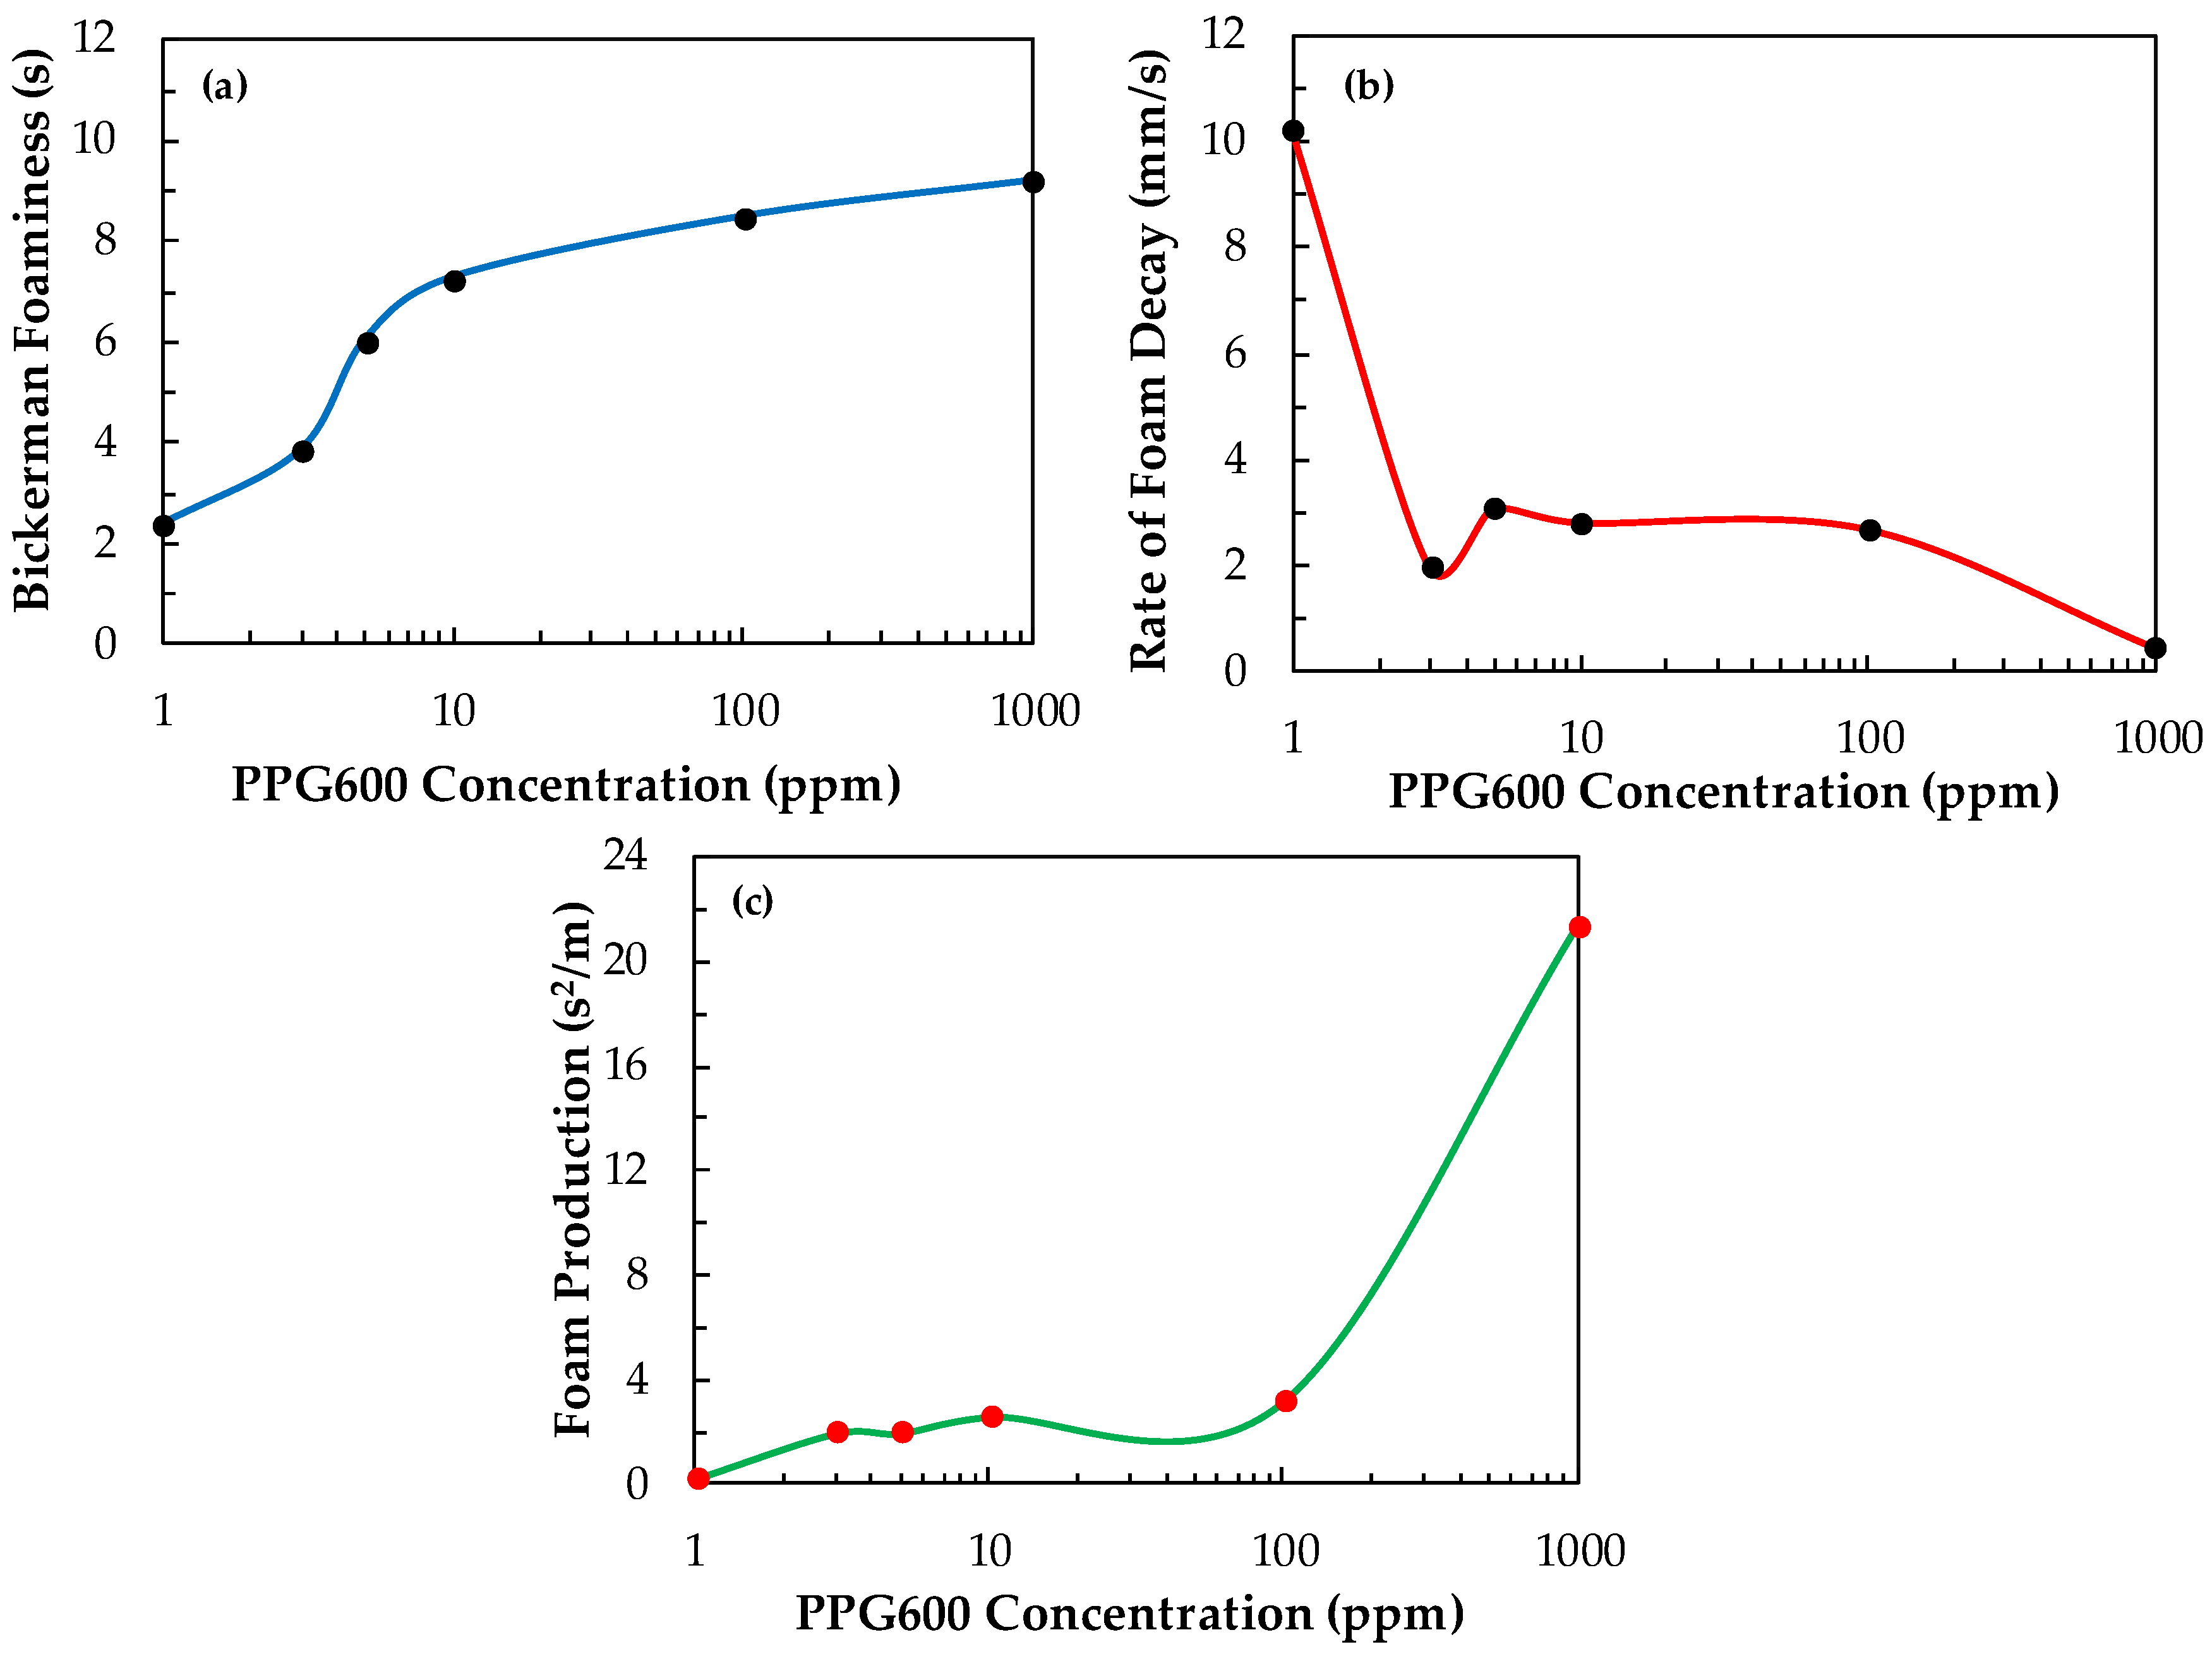
3.1.1. Foam Stability and Foam Decaying of Frothers
3.1.2. Foam Stability and Foam Decaying of Collectors
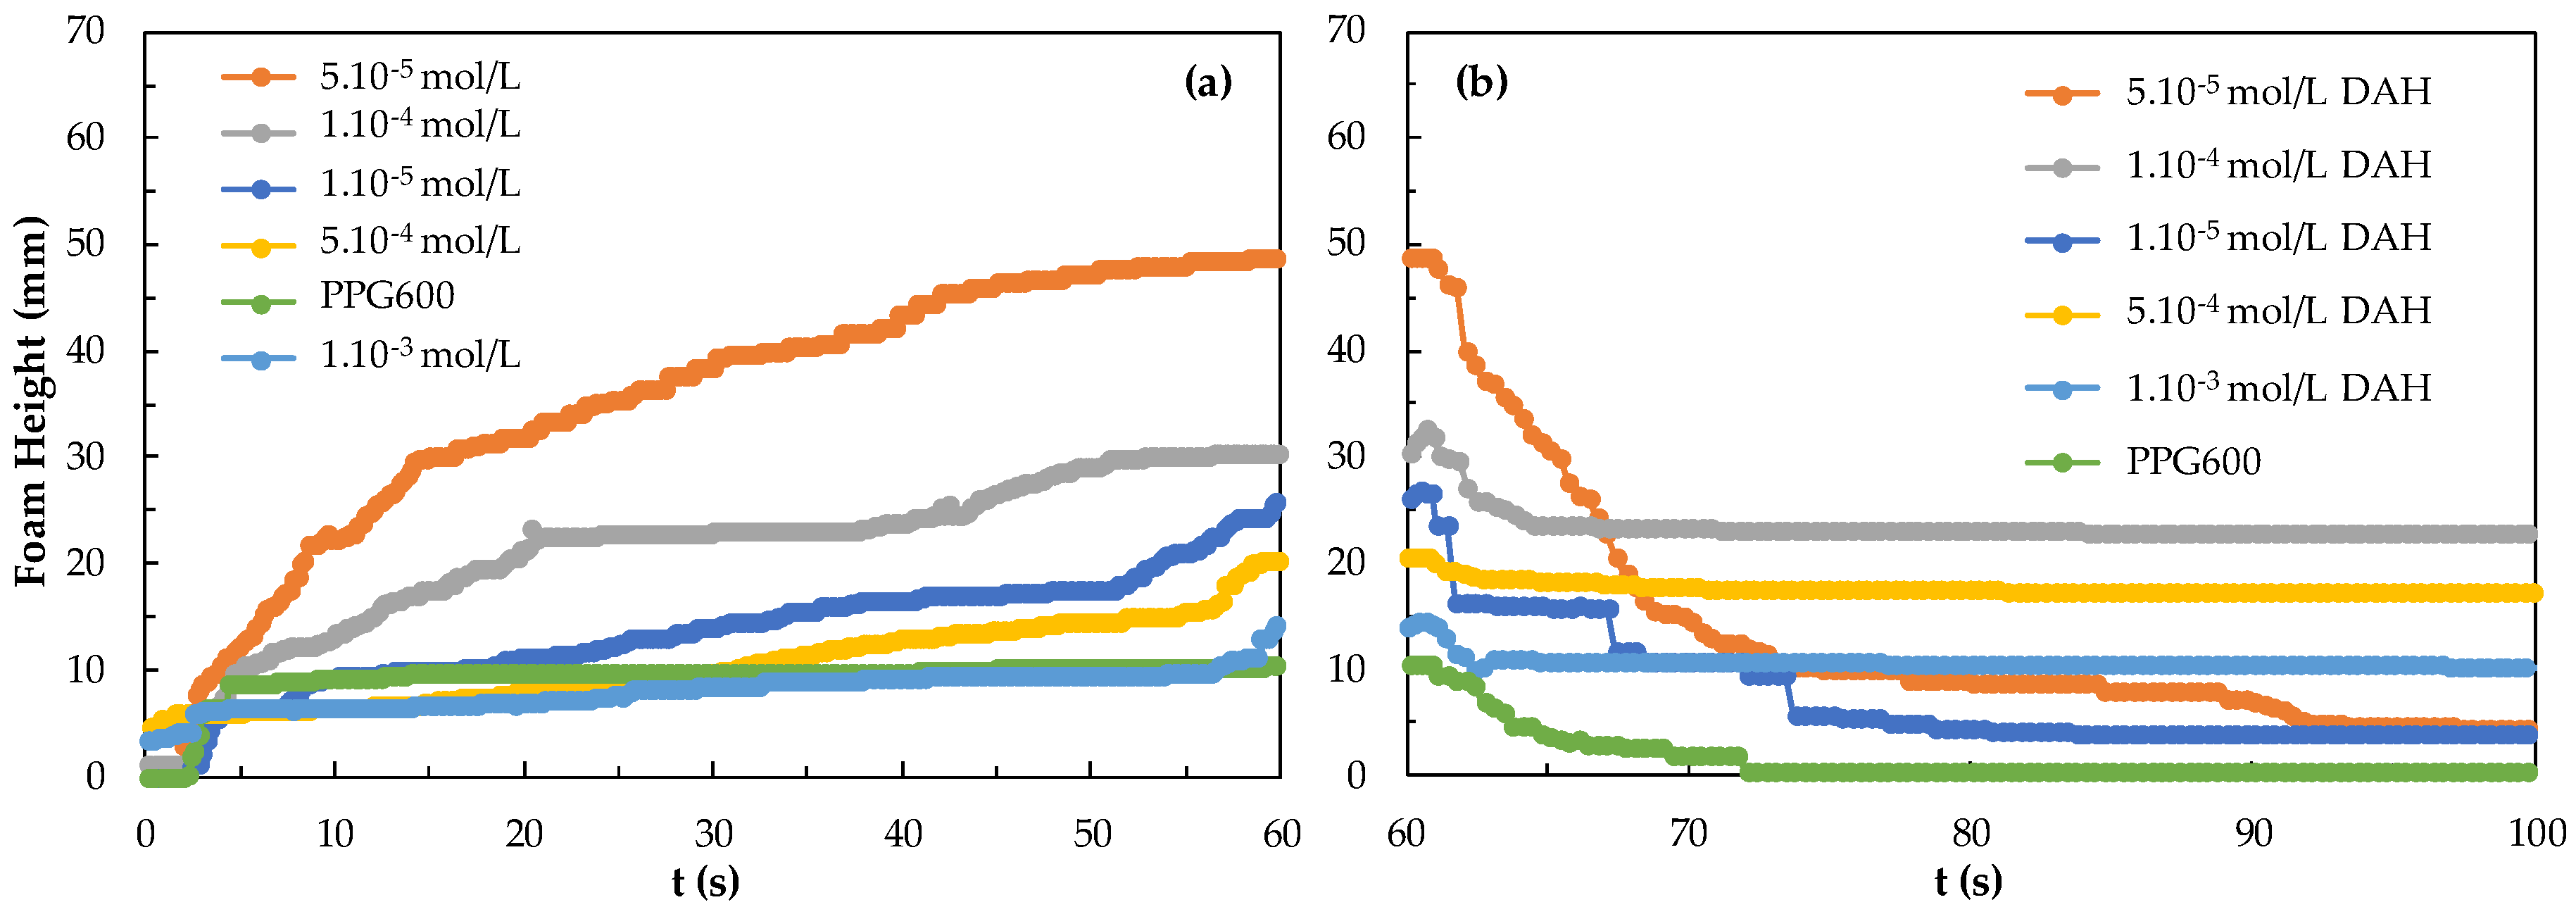
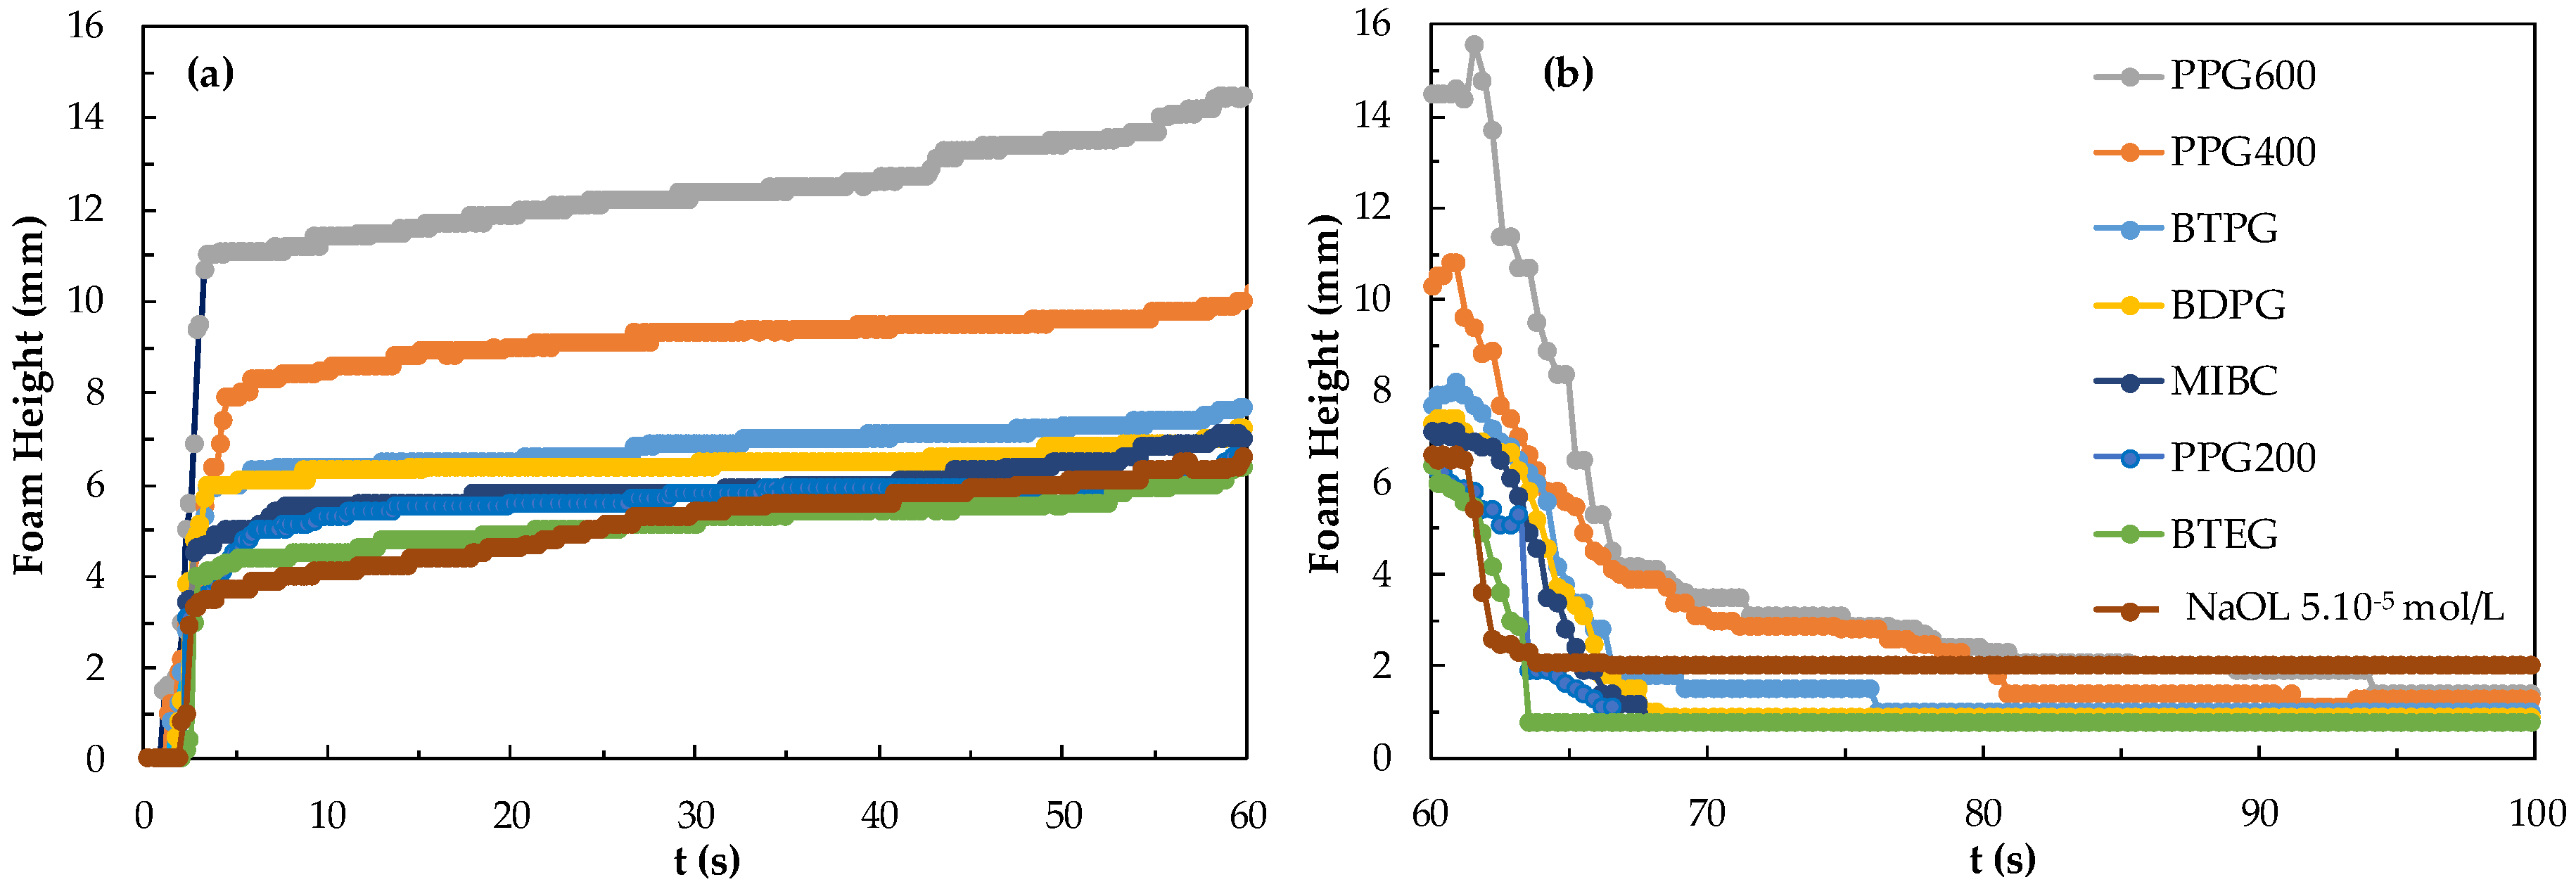
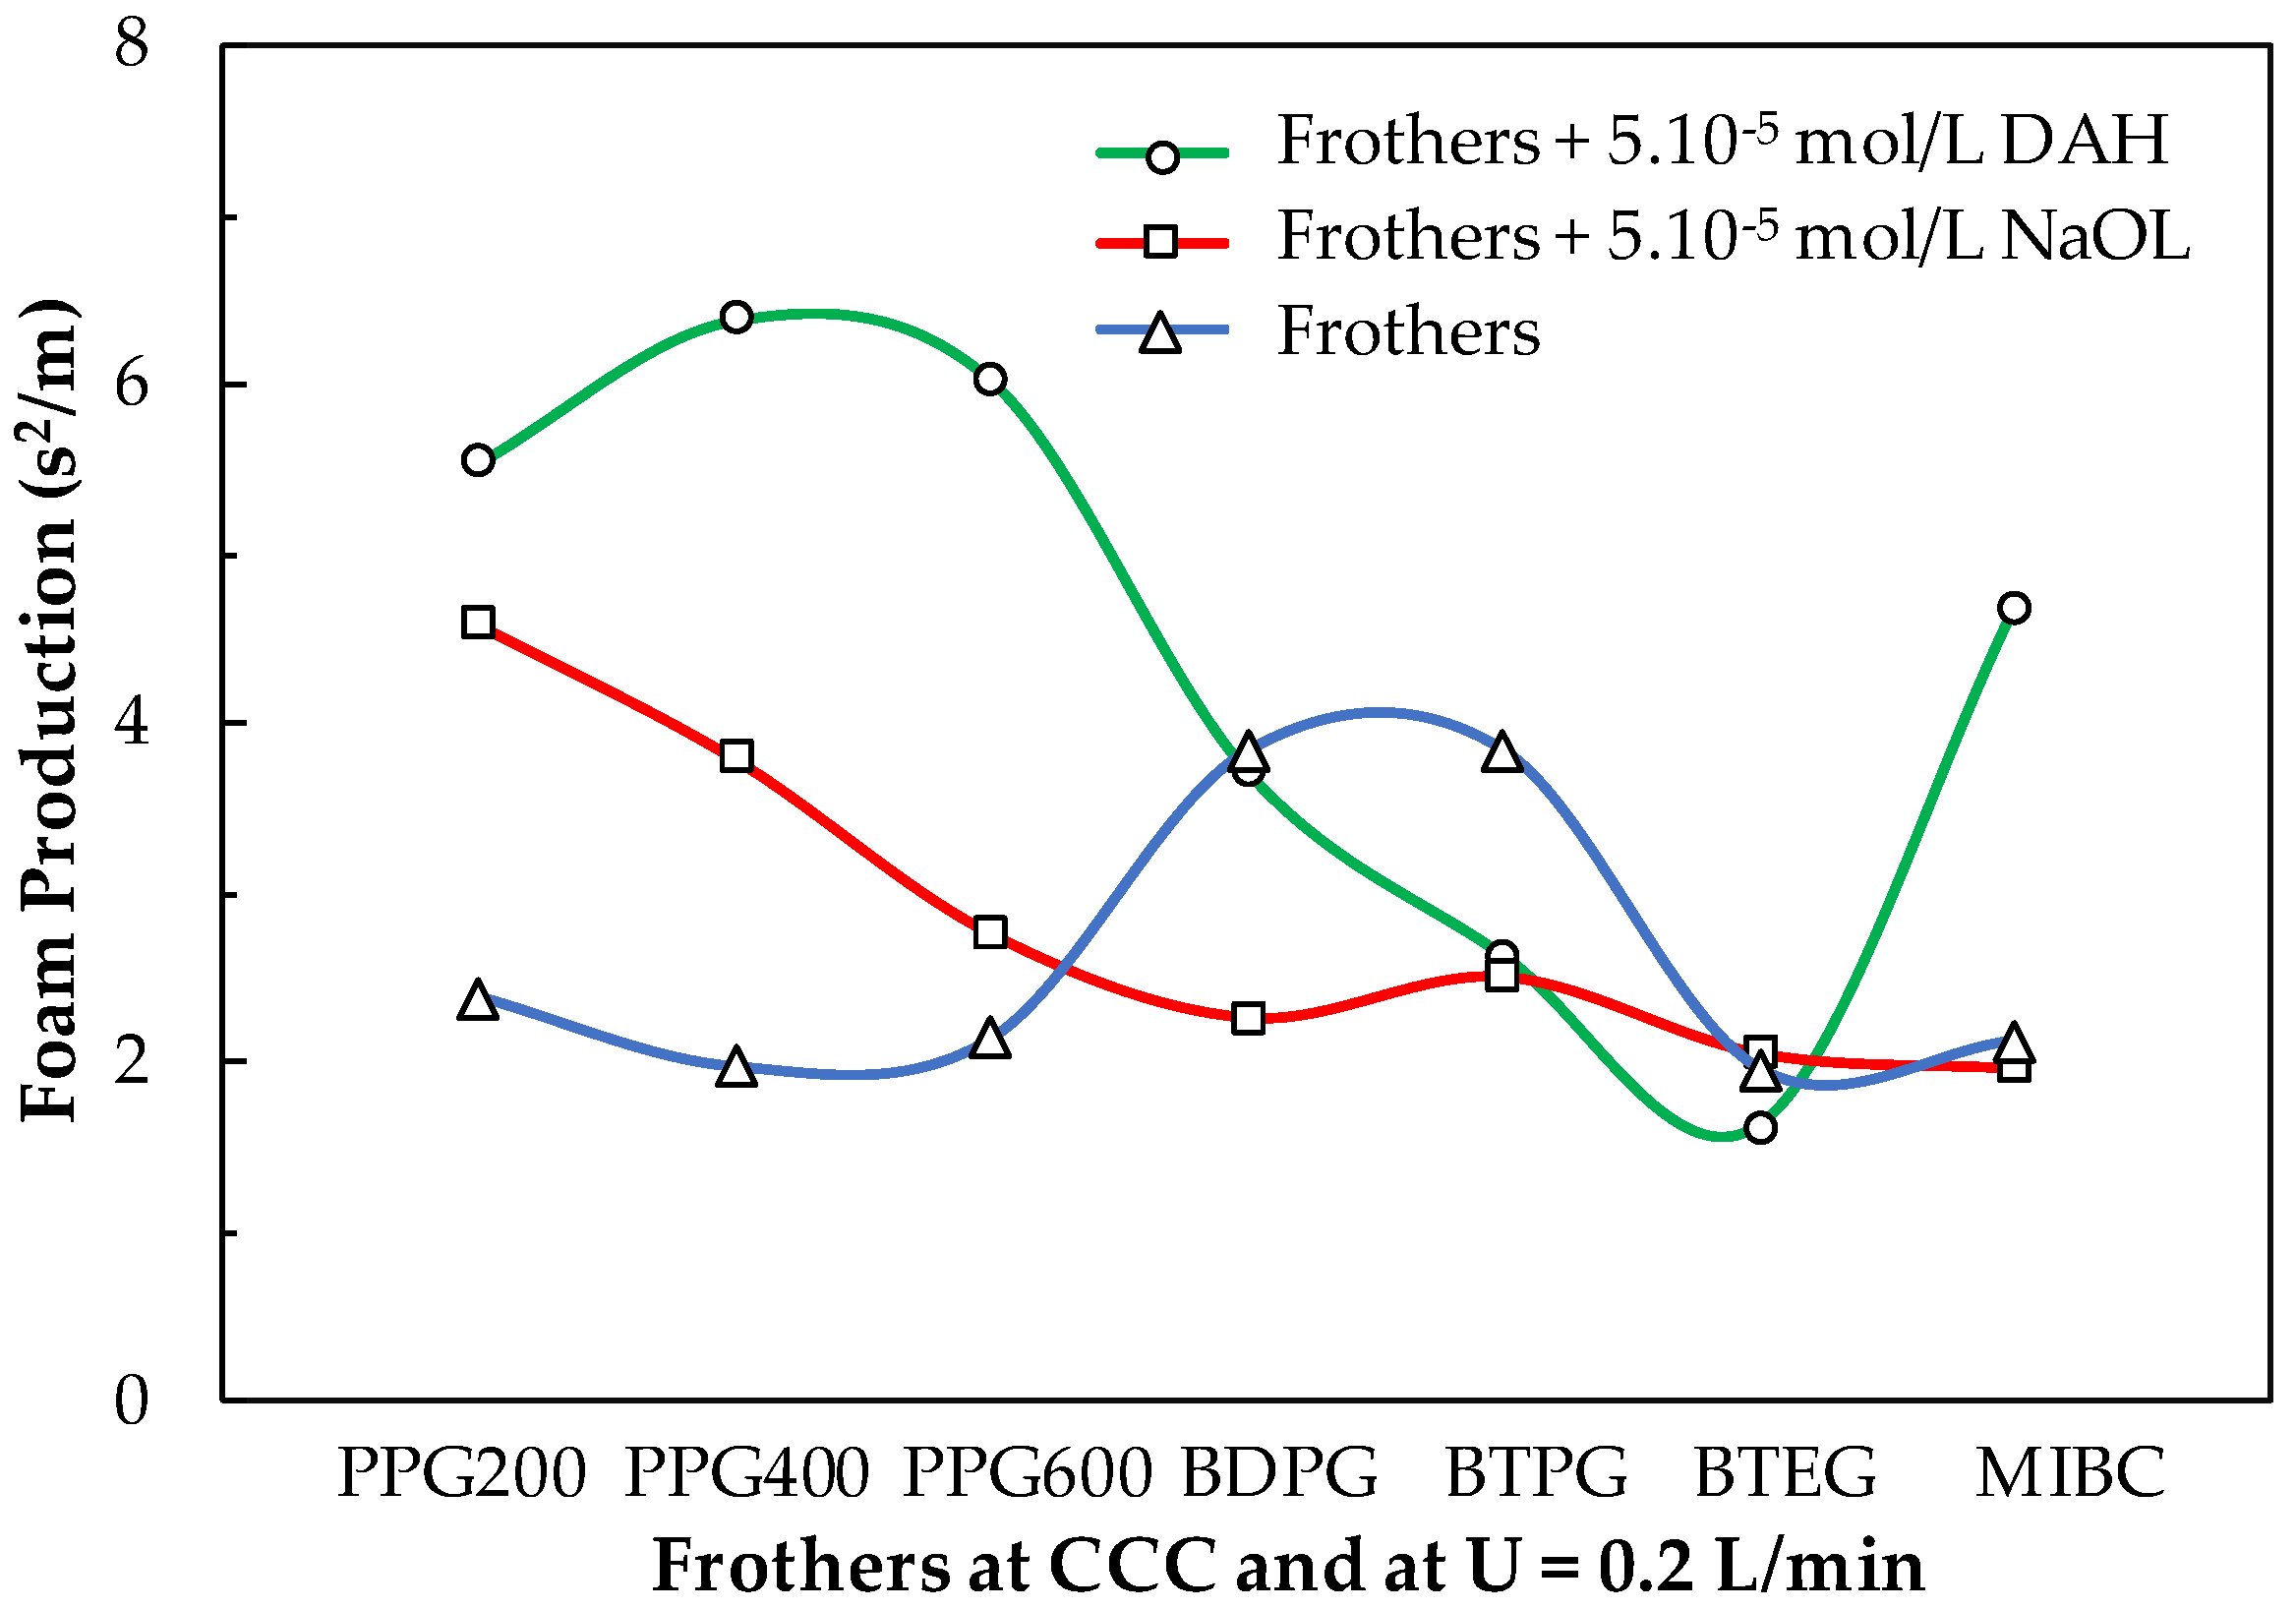
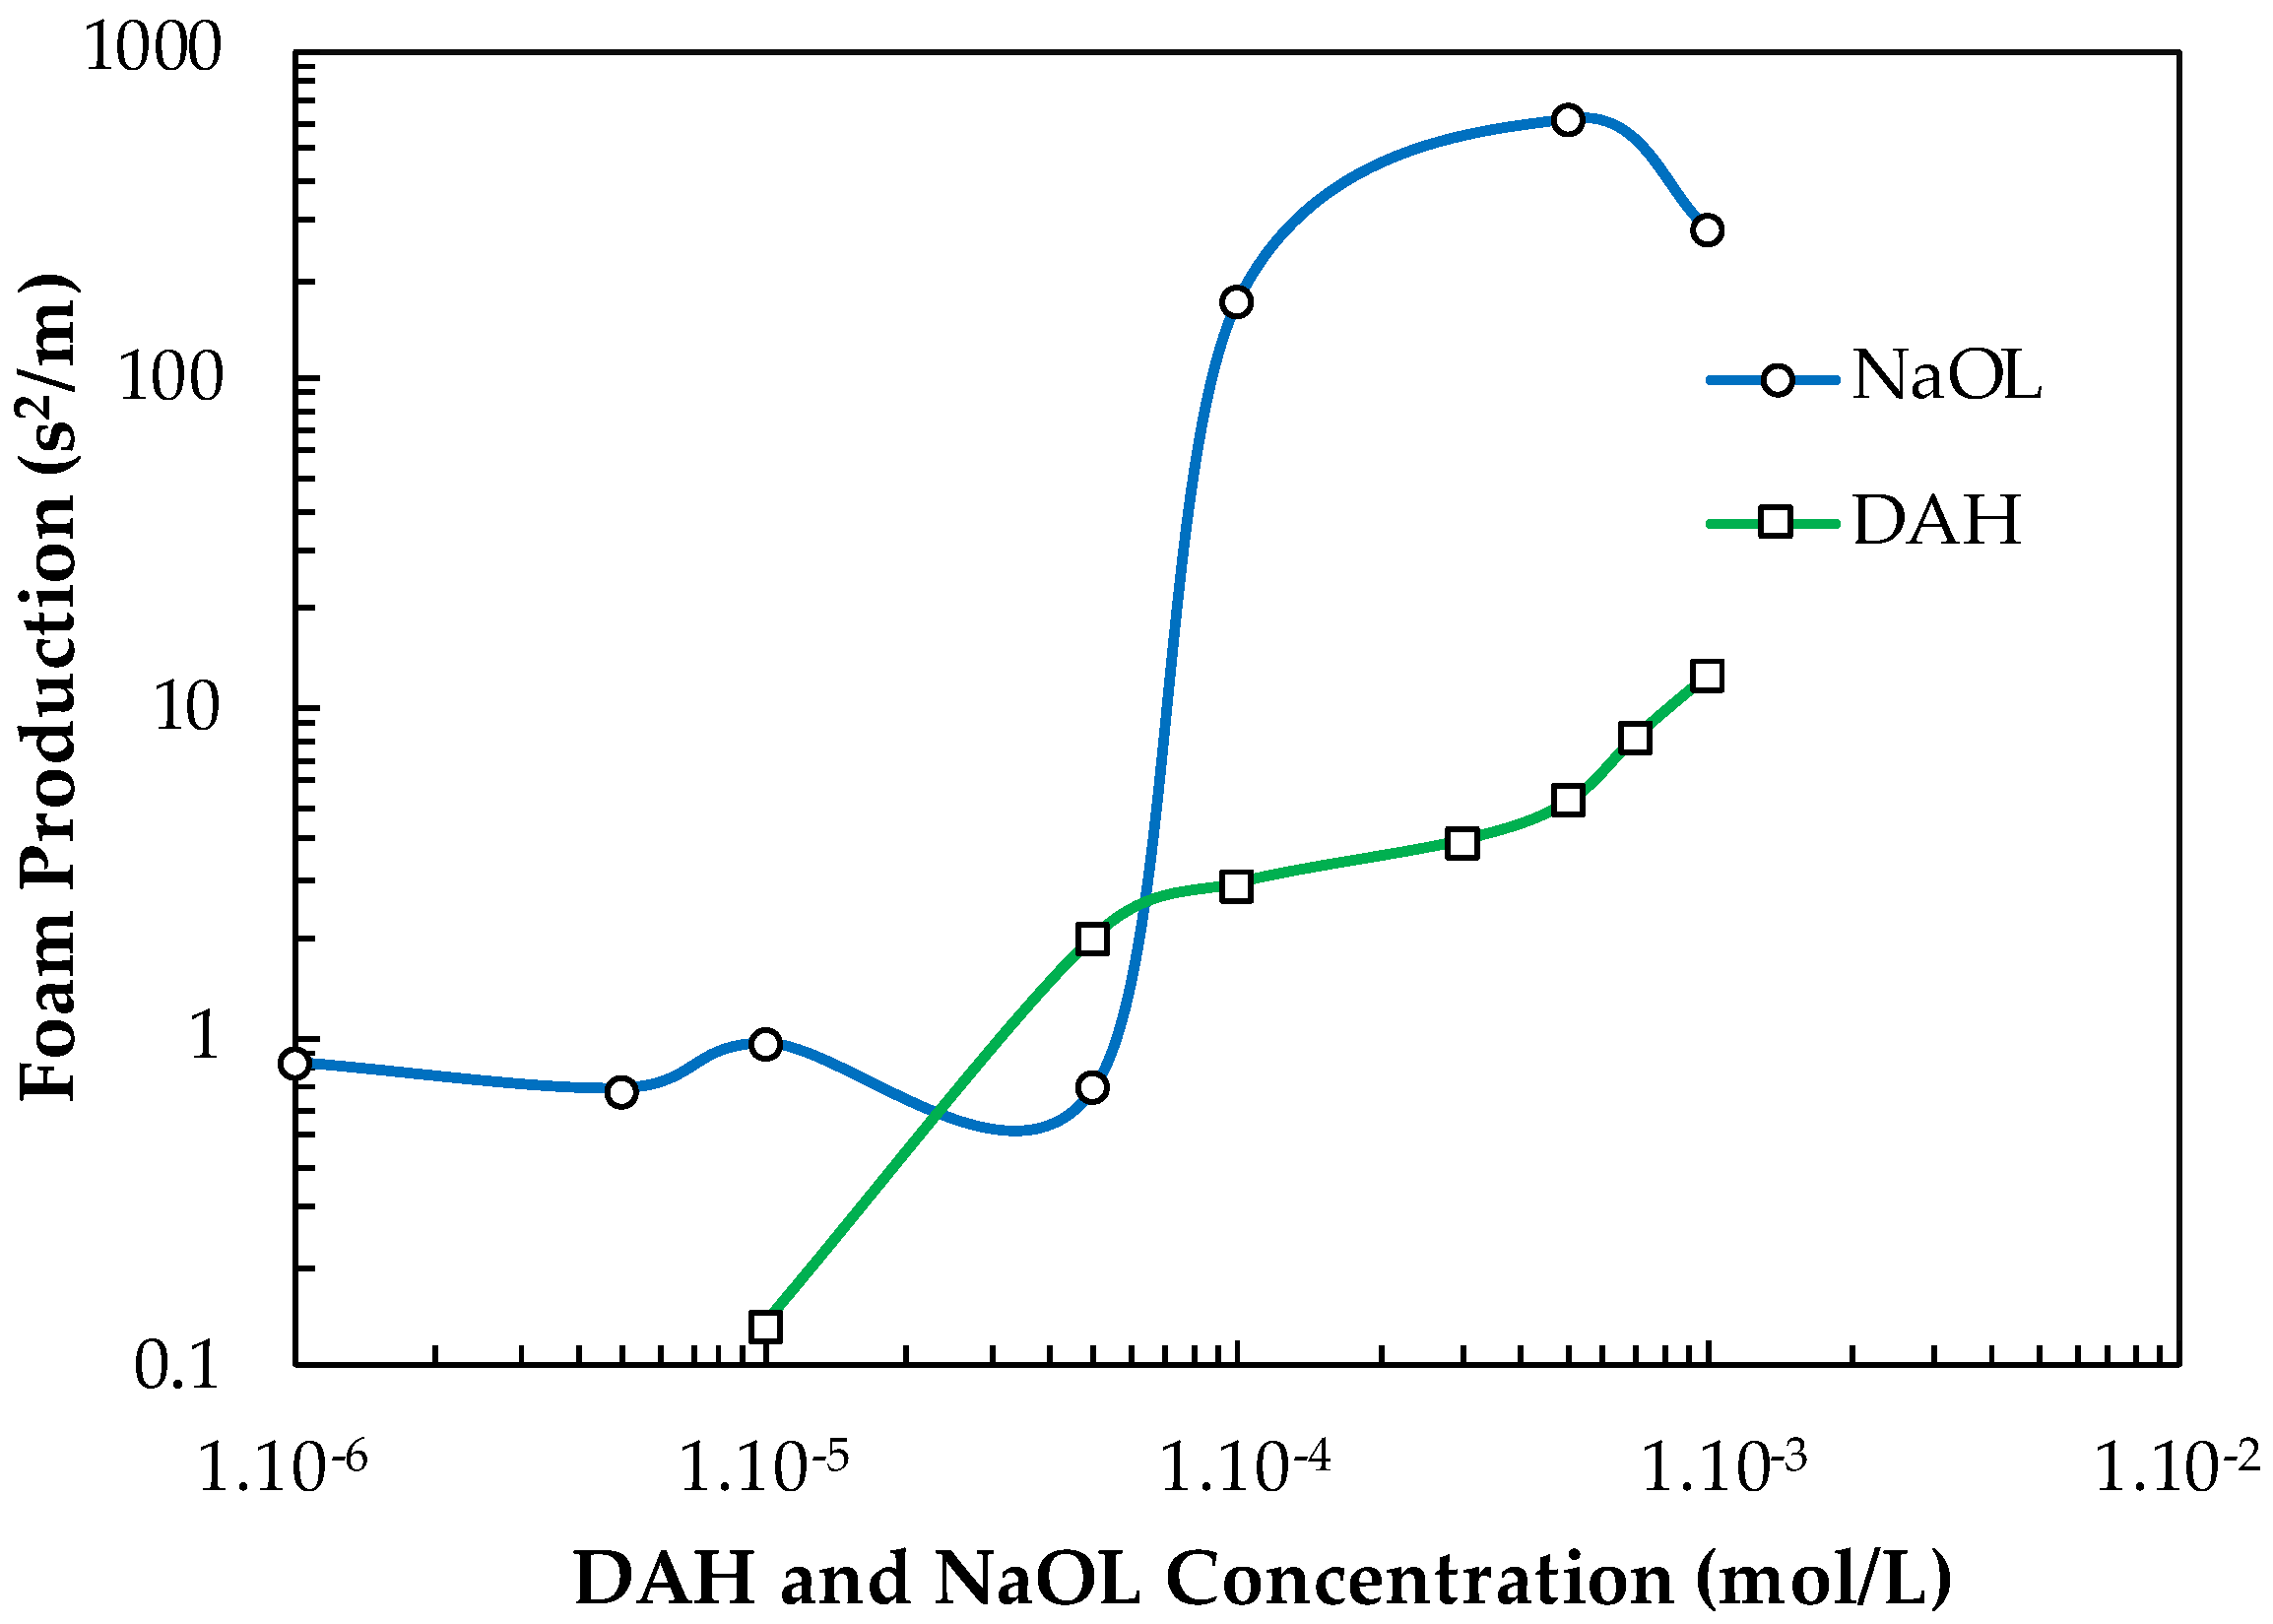
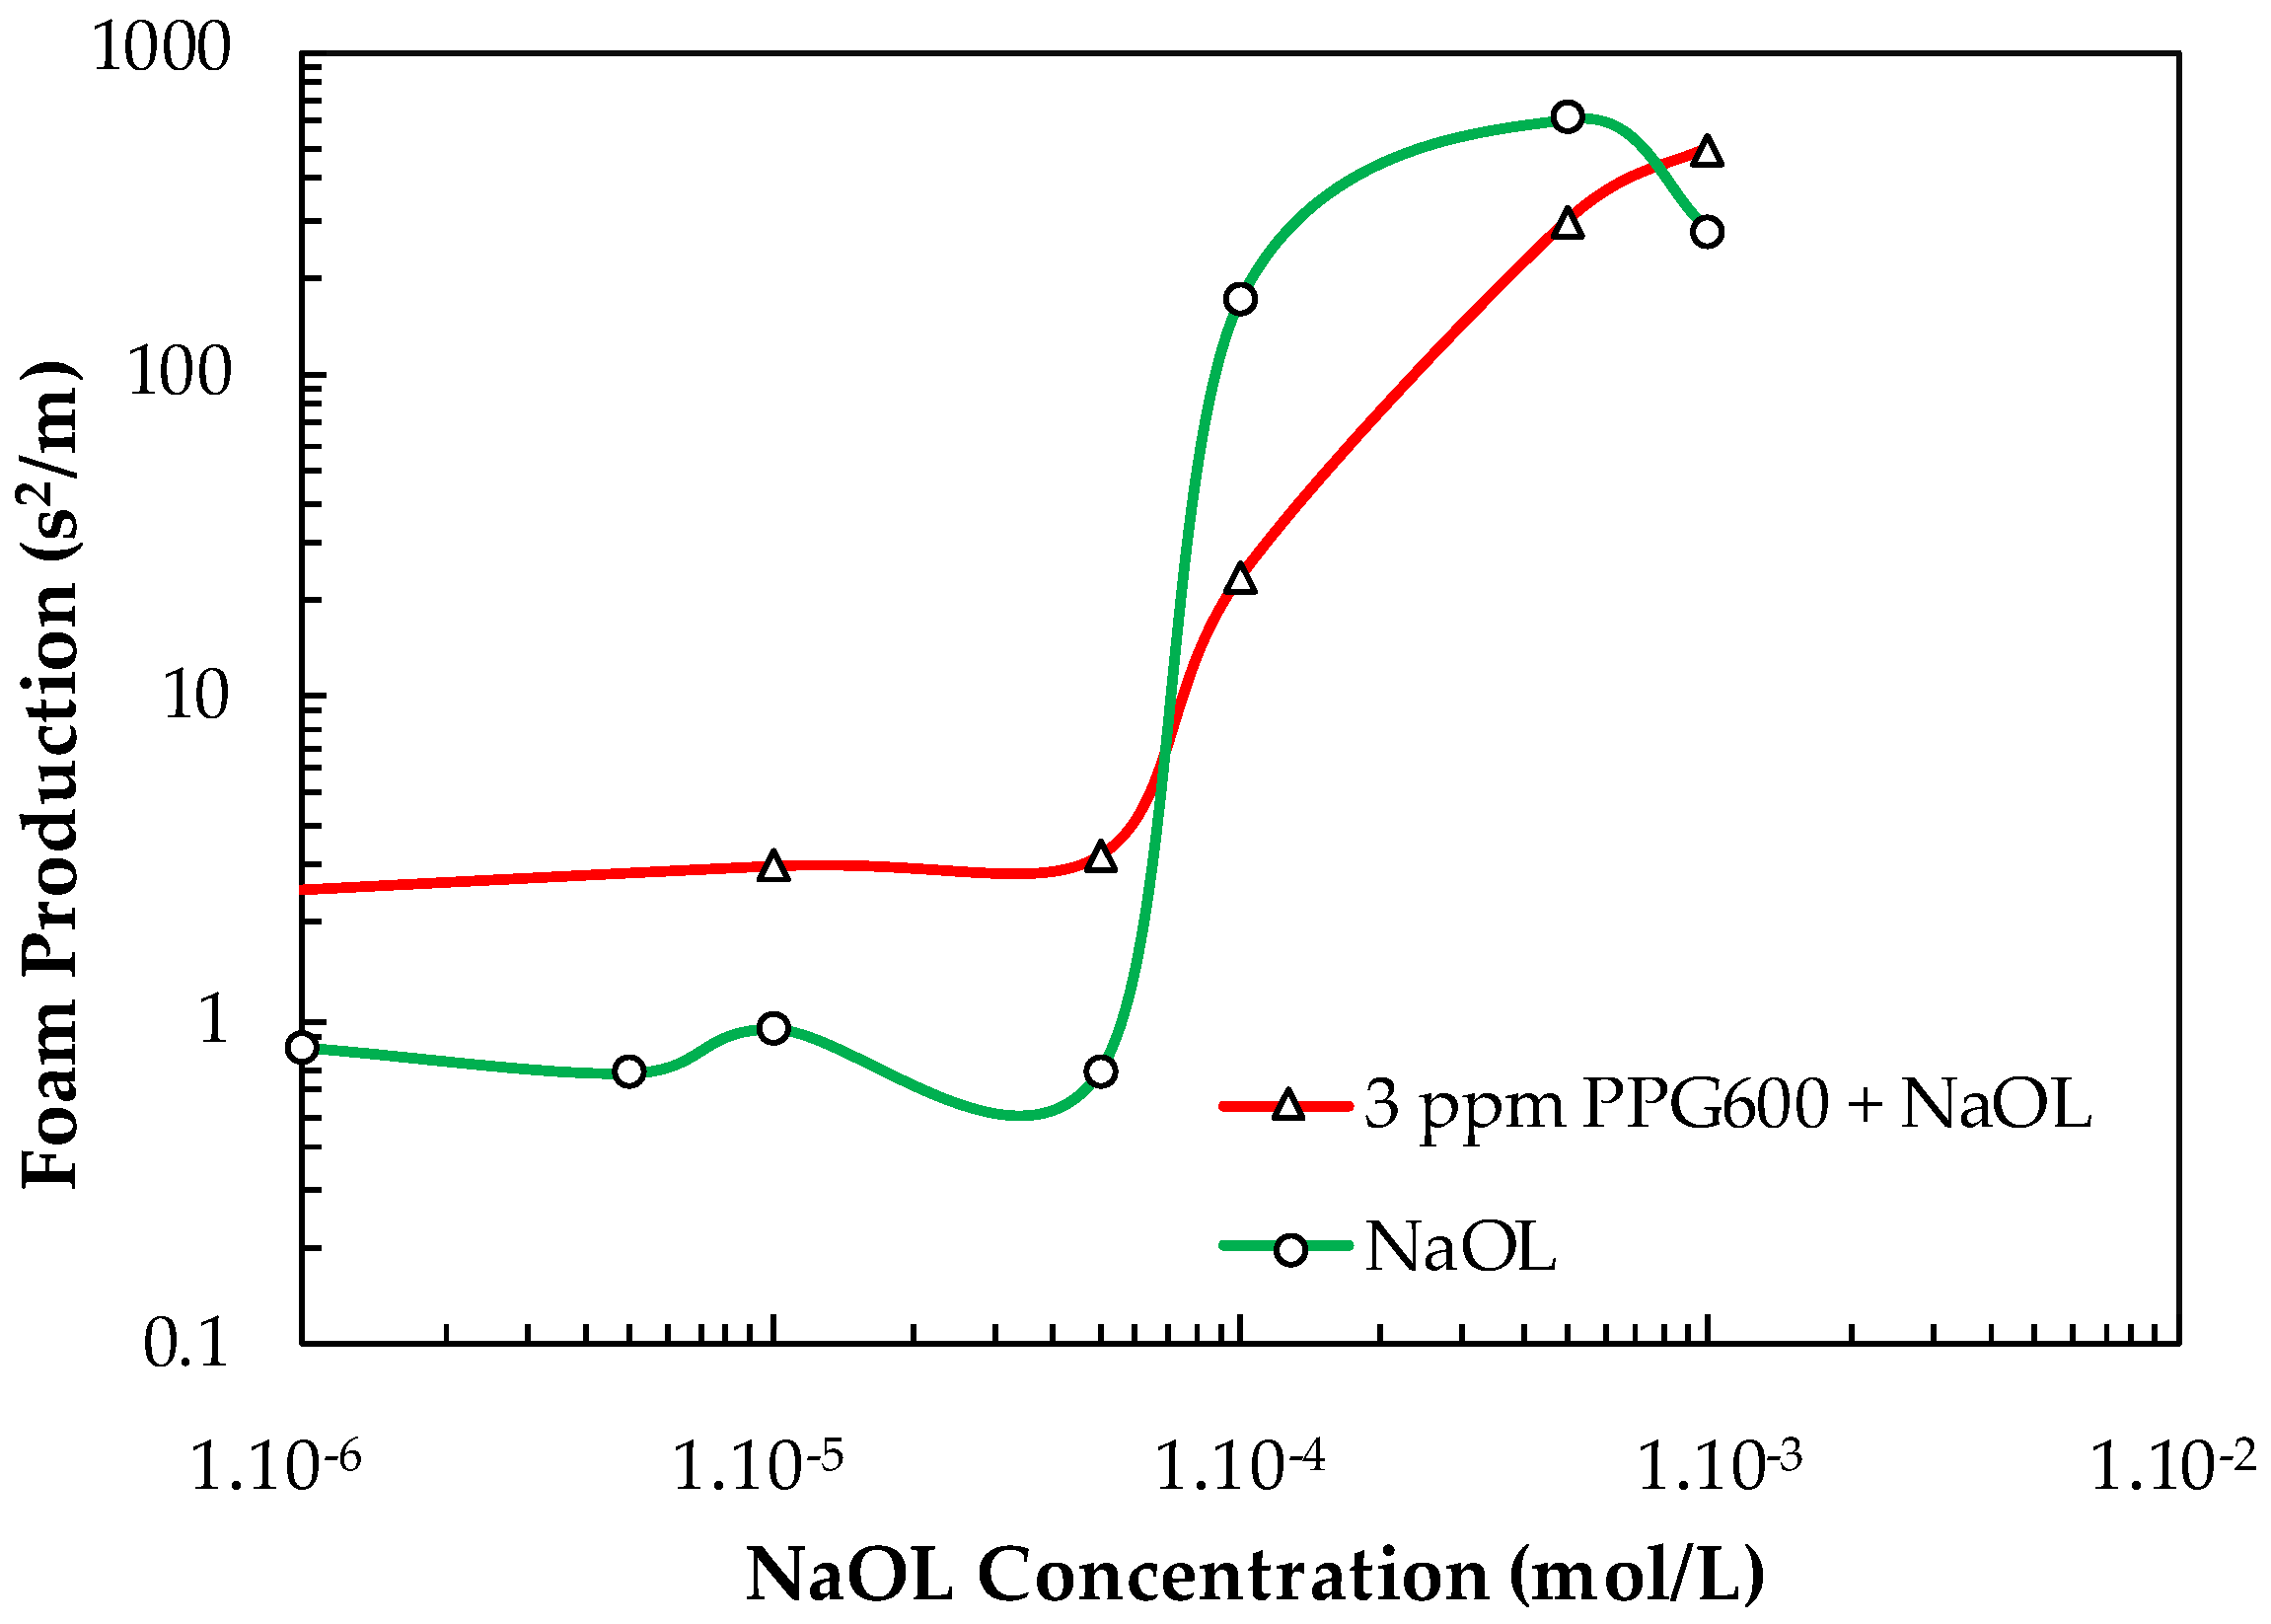
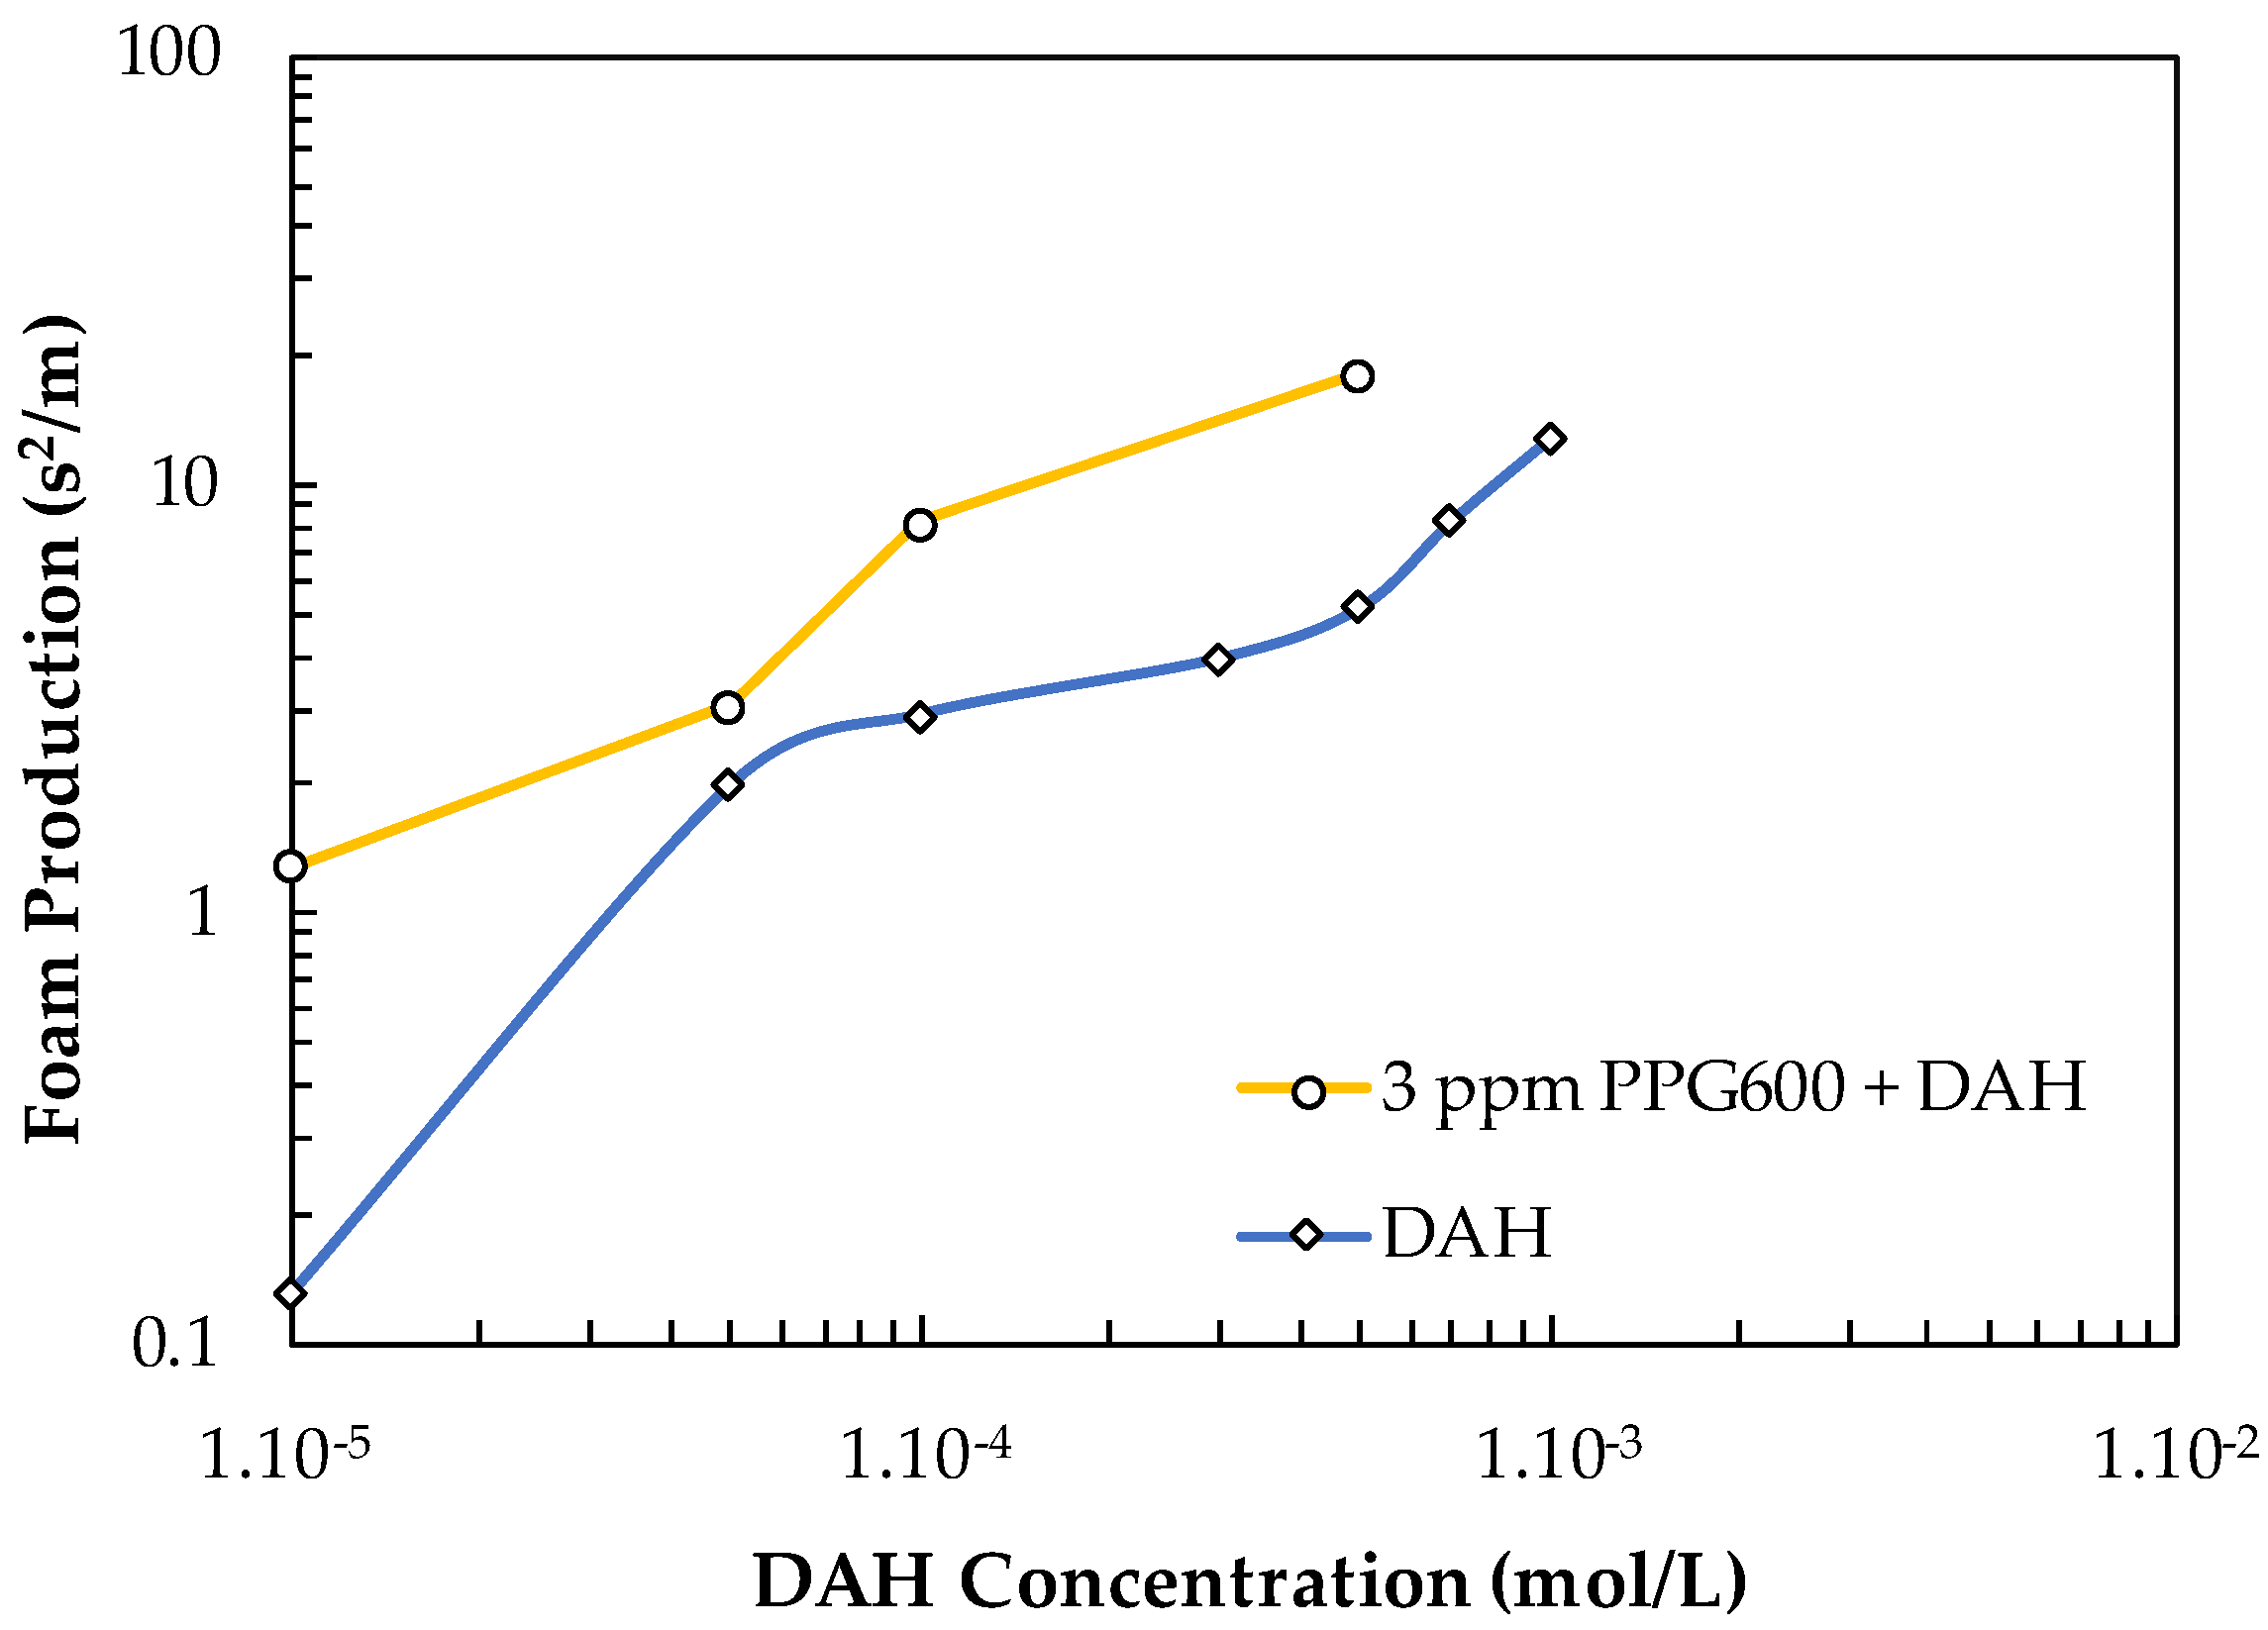
3.1.3. Frothers in the Presence of Collectors
3.2. Modeling Studies
4. Conclusions
Author Contributions
Funding
Data Availability Statement
Conflicts of Interest
Appendix A

| Frothers | CCC (ppm) | Foaminess (s) | dh/dt (mm/s) | Foam Production (s2/mm) | St. Dev. (s2/mm) |
|---|---|---|---|---|---|
| PPG200 | 11 | 2.60 | 1.09 | 2.38 | 0.18 |
| PPG400 | 4 | 3.51 | 1.78 | 1.97 | 0.11 |
| PPG600 | 3 | 3.92 | 1.84 | 2.13 | 0.11 |
| BDPG | 17 | 4.03 | 1.05 | 3.84 | 0.19 |
| BTPG | 5 | 4.15 | 1.08 | 3.85 | 0.19 |
| BTEG | 20 | 2.68 | 1.37 | 1.96 | 0.15 |
| MIBC | 10 | 2.90 | 1.37 | 2.12 | 0.15 |
| C (ppm) | Foaminess (s) | dh/dt (mm/s) | Foam Production (s2/mm) | St. Dev. (s2/mm) | |
|---|---|---|---|---|---|
| PPG600 | 1 | 2.38 | 10.21 | 0.23 | 0.02 |
| 3 | 3.85 | 1.95 | 1.97 | 0.10 | |
| 5 | 6.03 | 3.05 | 1.98 | 0.07 | |
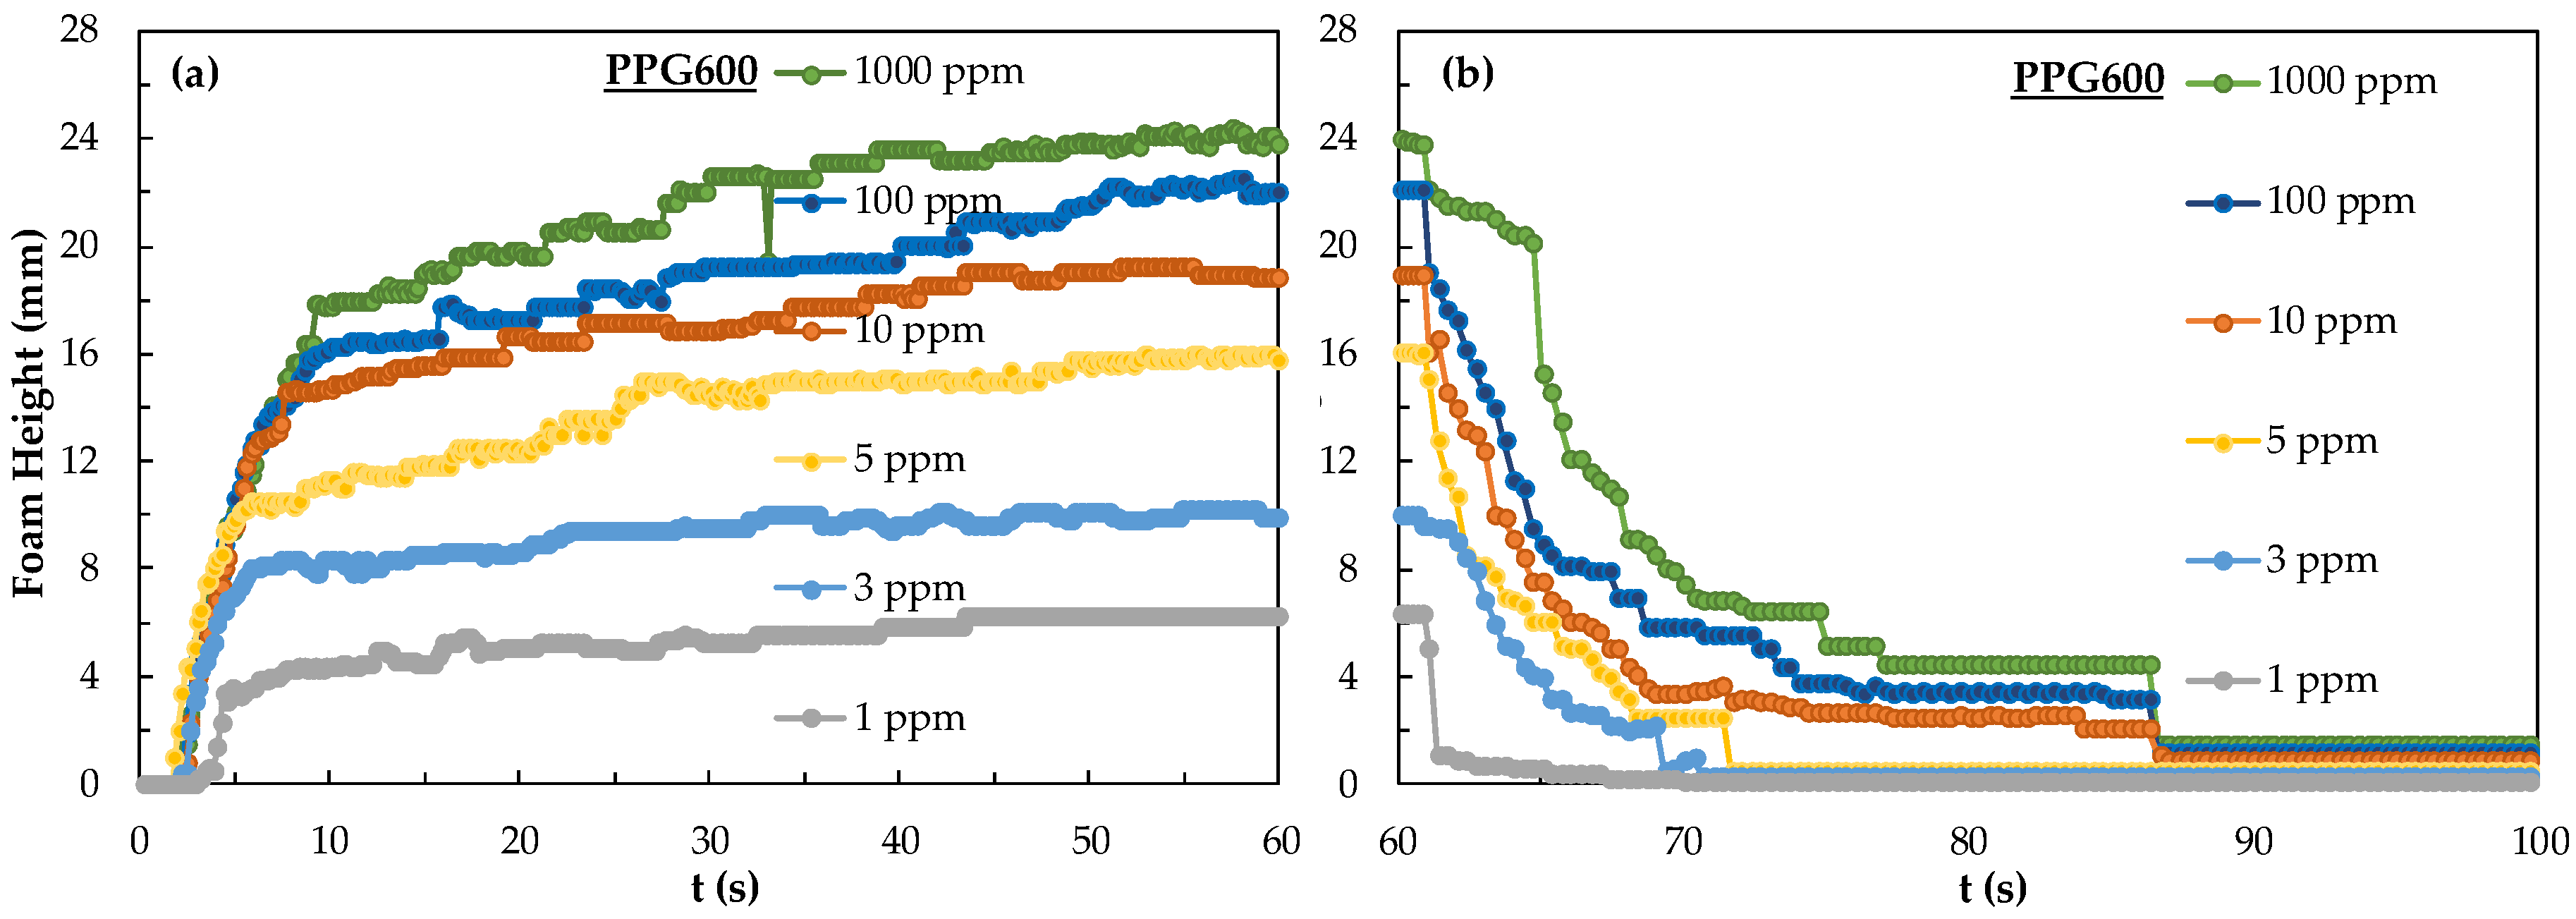
| 10 | 7.28 | 2.79 | 2.61 | 0.07 | |
| 100 | 8.48 | 2.67 | 3.18 | 0.04 | |
| 1000 | 9.20 | 0.43 | 21.38 | 0.23 |
| C (mol/L) | Foaminess (s) | dh/dt (mm/s) | Foam Production (s2/mm) | St. Dev. (s2/mm) | |
|---|---|---|---|---|---|
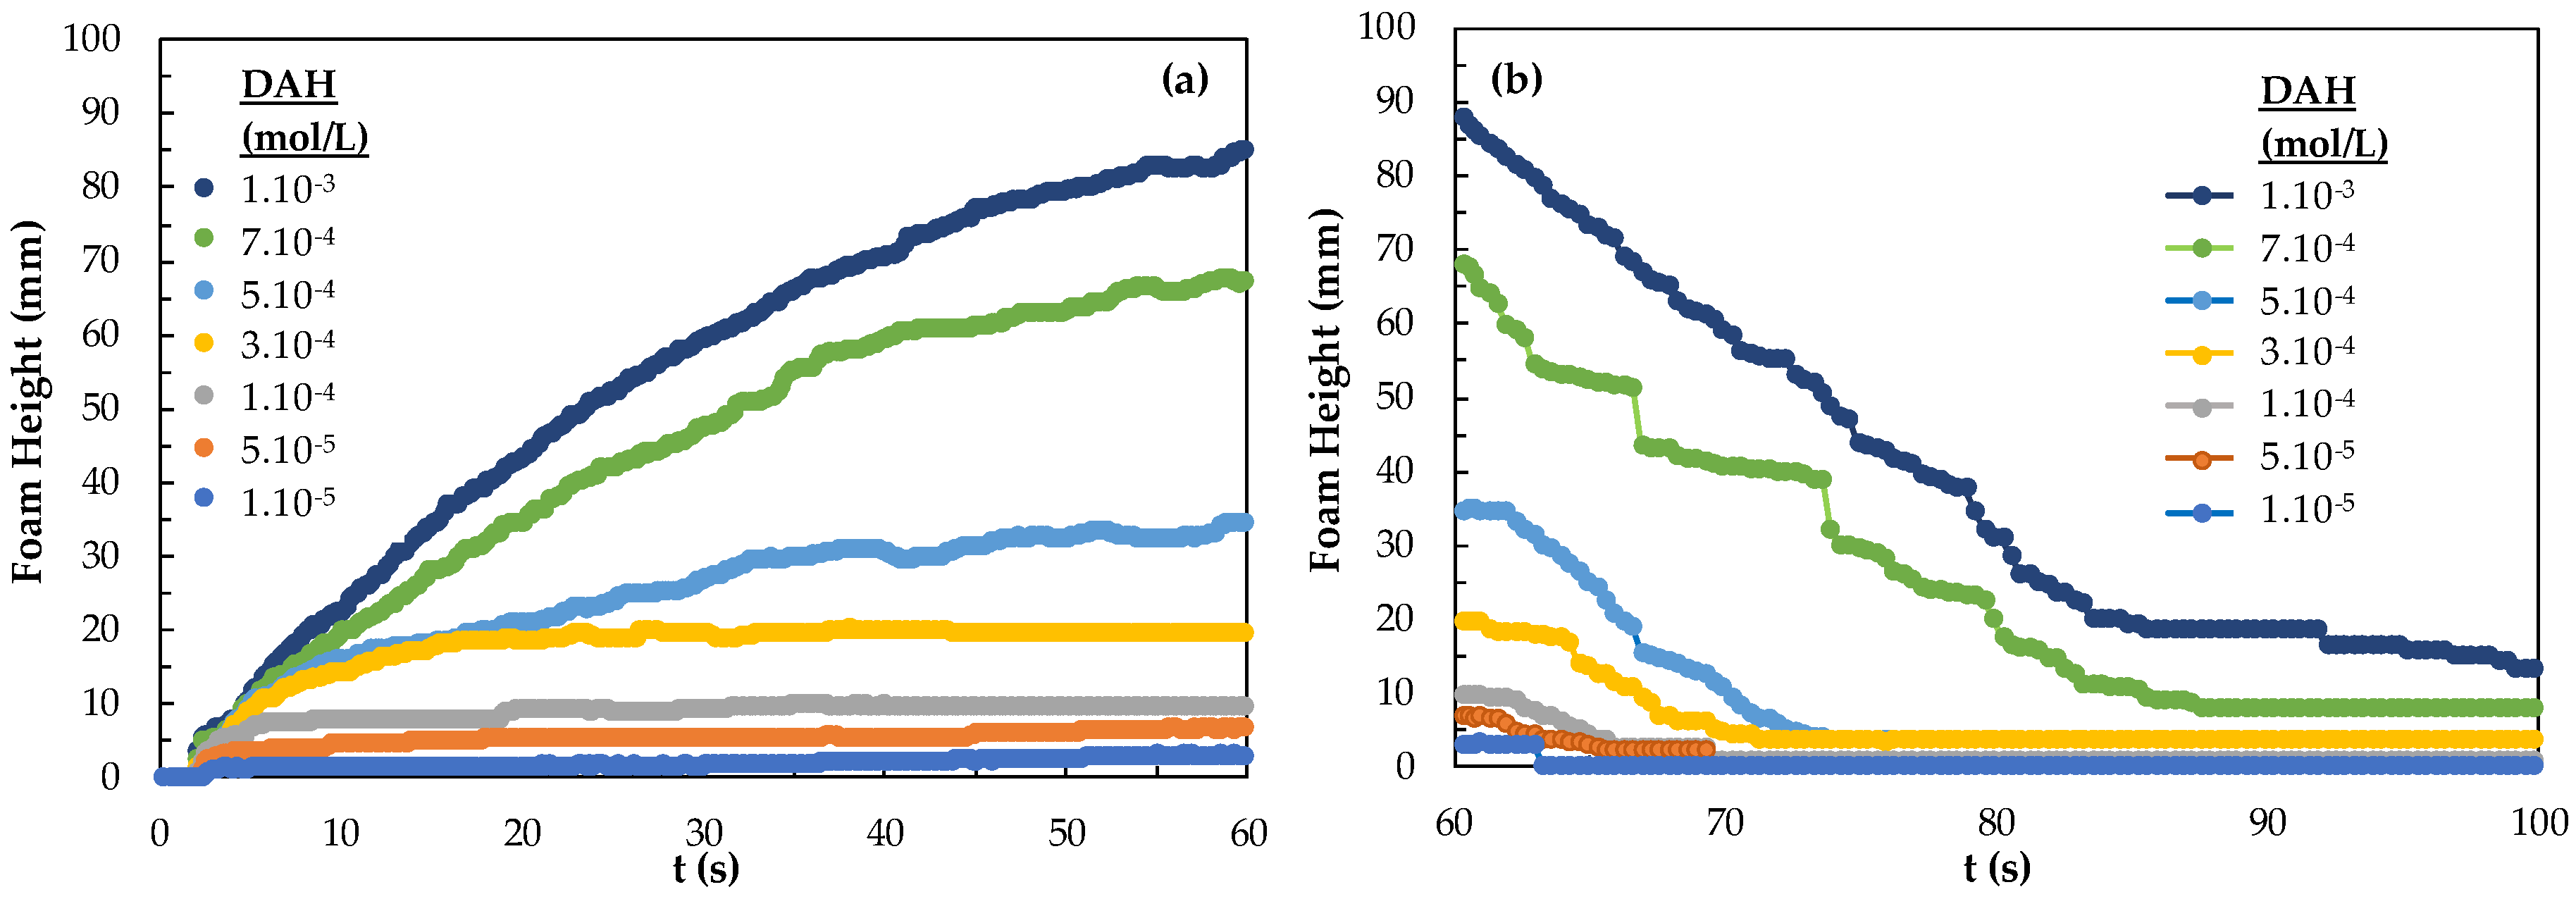
| DAH | 1.10−5 | 1.17 | 8.82 | 0.13 | 0.01 |
| 5.10−5 | 2.49 | 1.23 | 2.02 | 0.08 | |
| 1.10−4 | 3.69 | 1.26 | 2.93 | 0.08 | |
| 3.10−4 | 7.65 | 1.93 | 3.96 | 0.05 | |
| 5.10−4 | 13.12 | 2.53 | 5.19 | 0.04 | |
| 7.10−4 | 27.37 | 3.31 | 8.26 | 0.03 | |
| 1.10−3 | 32.35 | 2.52 | 12.82 | 0.04 |
| CCC (ppm) | Foaminess (s) | dh/dt (mm/s) | Foam Production (s2/mm) | St. Dev. (s2/mm) | |
|---|---|---|---|---|---|
| PPG200 | 11 | 6.56 | 1.18 | 5.54 | 0.08 |
| PPG400 | 4 | 15.42 | 2.41 | 6.39 | 0.04 |
| PPG600 | 3 | 18.40 | 3.05 | 6.03 | 0.03 |
| BDPG | 17 | 10.03 | 2.70 | 3.72 | 0.04 |
| BTPG | 5 | 12.37 | 4.70 | 2.63 | 0.02 |
| BTEG | 20 | 5.50 | 3.40 | 1.62 | 0.03 |
| MIBC | 10 | 6.90 | 1.47 | 4.69 | 0.07 |
| CCC (ppm) | Foaminess (s) | dh/dt (mm/s) | Foam Production (s2/mm) | St. Dev. (s2/mm) | |
|---|---|---|---|---|---|
| PPG200 | 11 | 2.49 | 0.54 | 4.59 | 0.18 |
| PPG400 | 4 | 4.07 | 1.07 | 3.79 | 0.09 |
| PPG600 | 3 | 5.88 | 2.13 | 2.76 | 0.05 |
| BDPG | 17 | 2.79 | 1.23 | 2.27 | 0.08 |
| BTPG | 5 | 3.09 | 1.23 | 2.51 | 0.08 |
| BTEG | 20 | 2.41 | 1.17 | 2.06 | 0.09 |
| MIBC | 10 | 2.68 | 1.36 | 1.97 | 0.07 |
| C (mol/L) | Foaminess (s) | dh/dt (mm/s) | Foam Production (s2/mm) | St. Dev. (s2/mm) | |
|---|---|---|---|---|---|
| DAH | 0 | 3.92 | 1.84 | 2.13 | 0.11 |
| 1.10−5 | 11.65 | 8.94 | 1.30 | 0.01 | |
| 5.10−5 | 20.06 | 6.53 | 3.07 | 0.02 | |
| 1.10−4 | 20.85 | 2.53 | 8.22 | 0.04 | |
| 5.10−4 | 14.14 | 0.78 | 18.12 | 0.13 |
| C (mol/L) | Foaminess (s) | dh/dt (mm/s) | Foam Production (s2/mm) | St. Dev. (s2/mm) | |
|---|---|---|---|---|---|
| NaOL | 0 | 3.92 | 1.84 | 2.13 | 0.11 |
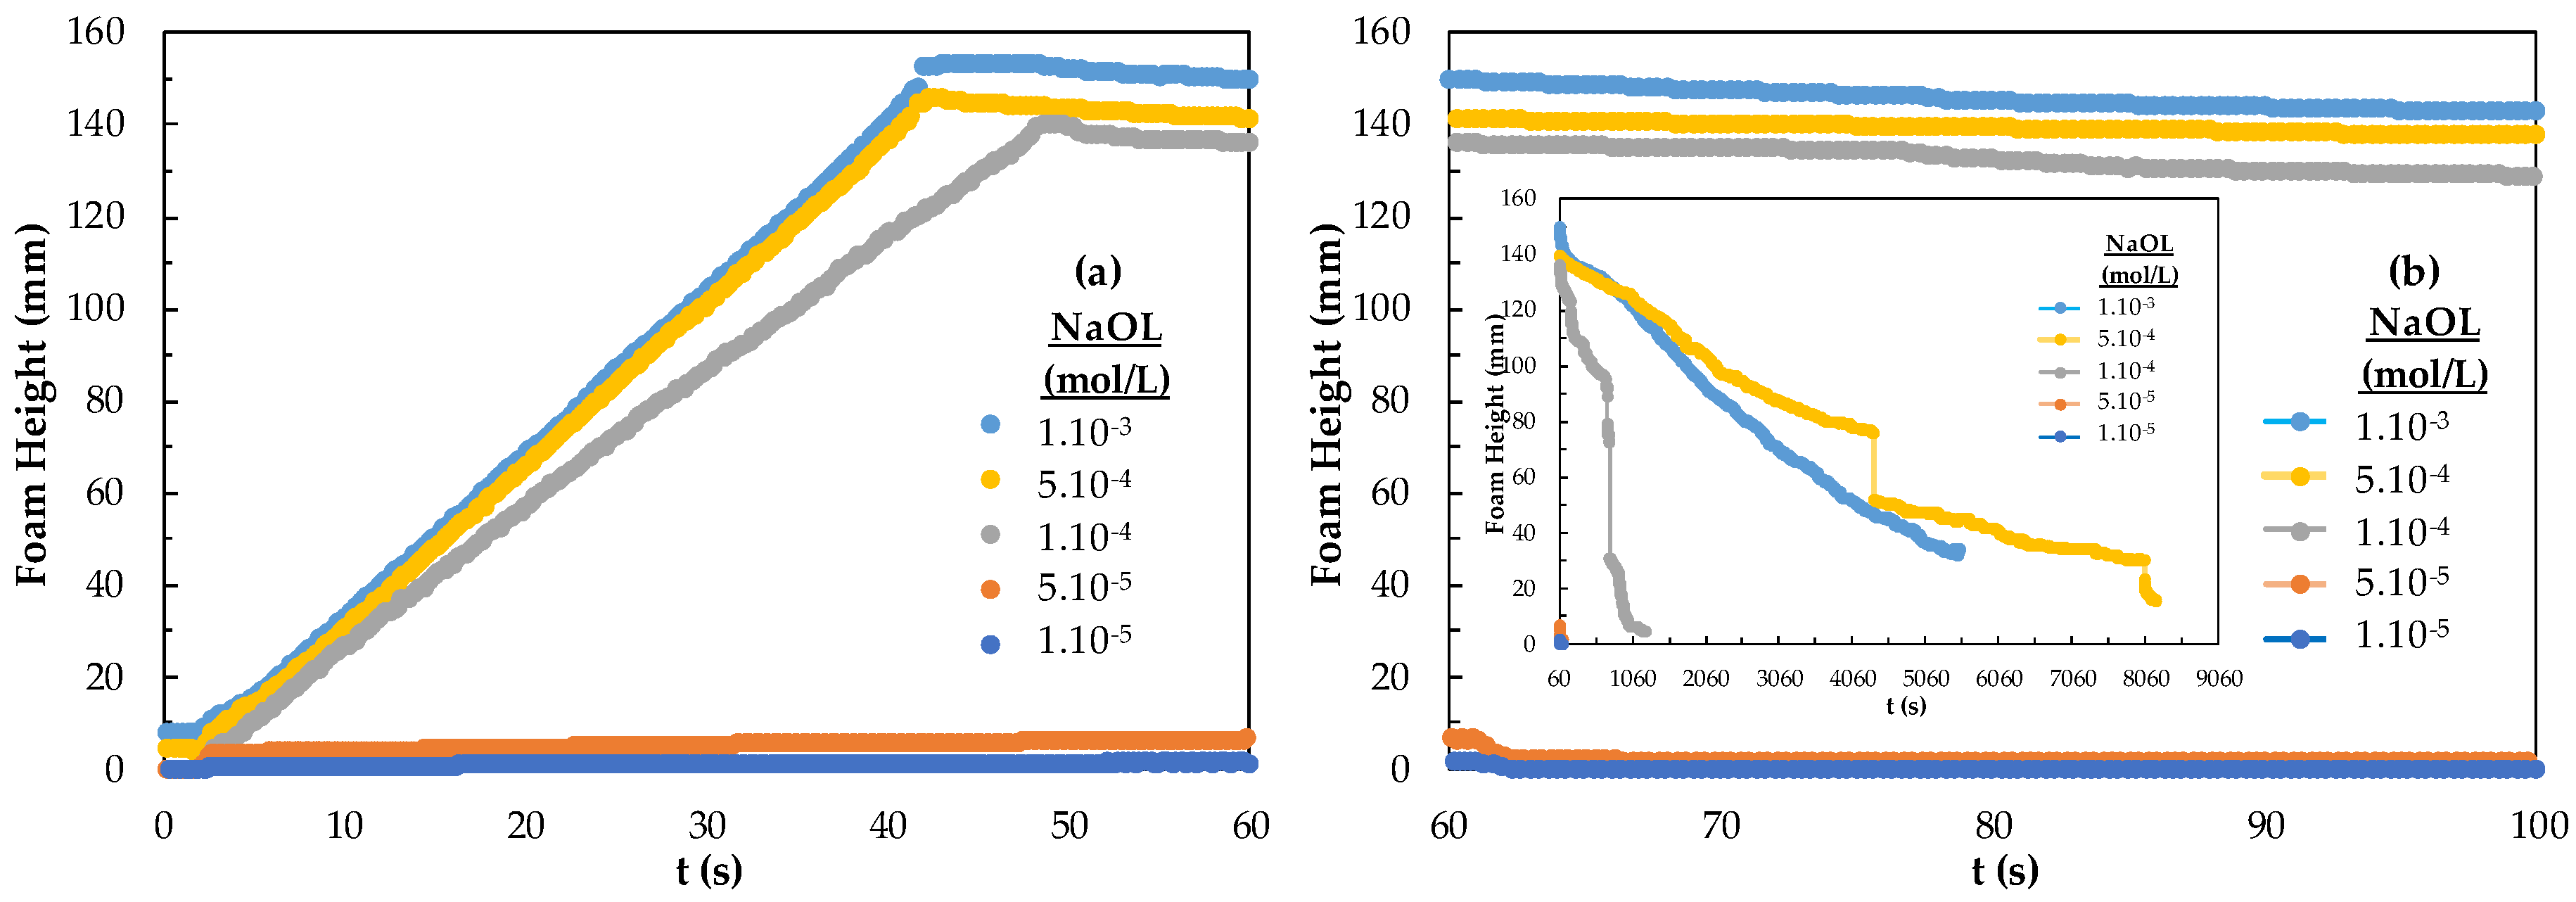
| 1.10−5 | 2.83 | 0.94 | 3.00 | 0.11 | |
| 5.10−5 | 4.60 | 1.43 | 3.22 | 0.07 | |
| 1.10−4 | 35.32 | 1.50 | 23.51 | 0.07 | |
| 5.10−4 | 104.54 | 0.35 | 297.24 | 0.28 | |
| 1.10−3 | 103.52 | 0.21 | 498.42 | 0.48 |
References
- George, P.; Nguyen, A.V.; Jameson, G.J. Assessment of true flotation and entrainment in the flotation of submicron particles by fine bubbles. Miner. Eng. 2004, 17, 847–853. [Google Scholar] [CrossRef]
- Benzaazoua, M.; Bussiere, B.; Kongolo, M.; McLaughlin, J.; Marion, P. Environmental desulphurization of four Canadian mine tailings using froth flotation. Int. J. Miner. Process. 2000, 5, 57–74. [Google Scholar] [CrossRef]
- Mbamba, C.K.; Harrison, S.T.L.; Franzidis, J.P.; Broadhurst, J.L. Mitigating acid rock drainage risks while recovering low-sulfur coal from ultrafine colliery wastes using froth flotation. Miner. Eng. 2012, 29, 13–21. [Google Scholar] [CrossRef]
- Yoon, R.H. The role of hydrodynamic and surface forces in bubble–particle interaction. Int. J. Miner. Process. 2000, 58, 129–143. [Google Scholar] [CrossRef]
- Karakashev, S.I.; Grozev, N.A.; Ozdemir, O.; Guven, O.; Ata, S.; Bournival, G.; Batjargal, K.; Boylu, F.; Hristova, S.; Çelik, M.S. Physical restrictions of the flotation of fine particles and ways to overcome them. Physicochem. Probl. Miner. Process. 2022, 58, 153944. [Google Scholar] [CrossRef]
- Severov, V.V.; Filippova, I.V.; Filippov, L.O. Use of fatty acids with an ethoxylated alcohol for apatite flotation from old fine-grained tailings. Miner. Eng. 2022, 188, 107832. [Google Scholar] [CrossRef]
- Foucaud, Y.; Collet, A.; Filippova, I.V.; Badawi, M.; Filippov, L.O. Synergistic effects between fatty acids and non-ionic reagents for the selective flotation of scheelite from a complex tungsten skarn ore. Miner. Eng. 2022, 182, 107566. [Google Scholar] [CrossRef]
- Derjaguin, B.V.; Dukhin, S.S.; Rulyov, N.N. Kinetic Theory of Flotation of Small Particles. In Surface and Colloid Science; Matijević, E., Good, R.J., Eds.; Springer: Boston, MA, USA, 1984. [Google Scholar]
- Pyke, B.; Fornasiero, D.; Ralston, J. Bubble particle heterocoagulation under turbulent conditions. J. Colloid Interface Sci. 2003, 265, 141–151. [Google Scholar] [CrossRef]
- Miettinen, T.; Ralston, J.; Fornasiero, D. The limits of fine particle flotation. Miner. Eng. 2010, 23, 420–437. [Google Scholar] [CrossRef]
- Abrahamson, J. Collision rates of small particles in a vigorously turbulent fluid. Chem. Eng. Sci. 1975, 30, 1371–1379. [Google Scholar] [CrossRef]
- Schubert, H. On the turbulence-controlled microprocesses in flotation machines. Int. J. Miner. Process. 1999, 56, 257–276. [Google Scholar] [CrossRef]
- Gaudin, A.M.; Groh, J.O.; Henderson, H.B. Effect of Particle Size on Flotation; AIME Technical Publications: Englewood, NJ, USA, 1931; Volume 414, pp. 3–23. [Google Scholar]
- Yalcin, T.; Byers, A. Dissolved gas flotation in mineral processing. Miner. Process. Extr. Metall. Rev. 2006, 27, 87–97. [Google Scholar] [CrossRef]
- Tao, Y.J.; Liu, J.T.; Yu, S.; Tao, D. Picobubble enhanced fine coal flotation. Sep. Sci. Technol. 2006, 41, 3597–3607. [Google Scholar] [CrossRef]
- Geldenhuys, S.; McFadzean, B. Column diameter effects on dynamic froth stability measurement. In Proceedings of the XXIX International Mineral Processing Congress (IMPC 2018), Moscow, Russia, 17–21 September 2018. [Google Scholar]
- Batjargal, K.; Guven, O.; Ozdemir, O.; Boylu, F.; Çelik, M.S. Effect of frother and collector mixture on froth stability in ultra-fine size quartz/DAH flotation system. In Proceedings of the 17th International Mineral Processing Symposium (IMPS 2022), Istanbul, Turkiye, 15–17 December 2022. [Google Scholar]
- Bikerman, J.J. The unit of foaminess. Trans. Faraday Soc. 1938, 34, 0634–0638. [Google Scholar] [CrossRef]
- Karakashev, S.I.; Georgiev, P.; Balashev, K. Foam production—Ratio between foaminess and rate of foam decay. J. Colloid Interface Sci. 2012, 379, 144–147. [Google Scholar] [CrossRef]
- Karakashev, S.I.; Grozev, N.A.; Ozdemir, O.; Batjargal, K.; Guven, O.; Ata, S.; Bournival, G.; Boylu, F.; Çelik, M.S. On the frother’s strength and its performance. Miner. Eng. 2021, 171, 107093. [Google Scholar] [CrossRef]
- Pugh, R.J. Bubble and Foam Chemistry; CUP, Cambridge Press: Cambridge, UK, 2016; Volume 12, pp. 405–419. [Google Scholar]
- Schwarz, S. The Relationship between Froth Recovery and Froth Structure. Ph.D. Thesis, Ian Wark Research Institute, University of South Australia, Adelaide, Australia, 2004. [Google Scholar]
- Neethling, S.J.; Brito-Parada, P.R. Predicting flotation behaviour the interaction between froth stability and performance. Miner. Eng. 2018, 120, 60–65. [Google Scholar] [CrossRef]
- Holmberg, K. Surfactant and Polymers in Aqueous Solution, 2nd ed.; John Wiley & Sons Ltd.: Chichester, UK, 2003. [Google Scholar]
- Guven, O.; Batjargal, K.; Ozdemir, O.; Karakashev, S.I.; Grozev, N.A.; Boylu, F.; Çelik, M.S. Experimental procedure for the determination of the critical coalescence concentration (CCC) of simple frothers. Minerals 2020, 10, 617. [Google Scholar] [CrossRef]
- Karakashev, S.I.; Grozev, N.A.; Batjargal, K.; Guven, O.; Özdemir, O.; Boylu, F.; Çelik, M.S. Correlations for easy calculation of the critical coalescence concentration (CCC) of simple frothers. Coatings 2020, 10, 612. [Google Scholar] [CrossRef]
- Batjargal, K.; Guven, O.; Ozdemir, O.; Karakashev, S.I.; Grozev, N.A.; Boylu, F.; Çelik, M.S. Adsorption Kinetics of Various Frothers on Rising Bubbles of Different Sizes under Flotation Conditions. Minerals 2021, 11, 304. [Google Scholar] [CrossRef]
- Gence, N.; Ozdag, H. Surface properties of magnesite and surfactant adsorption mechanism. Int. J. Miner. Process. 1995, 43, 37–47. [Google Scholar] [CrossRef]
- Woodburn, E.T.; Flynn, S.A.; Cressey, B.A.; Cressey, G. The effect of froth stability on the beneficiation of low-rank coal by flotation. Powder Technol. 1984, 40, 167–177. [Google Scholar] [CrossRef]
- Subrahmanyam, T.V.; Forssberg, E. Froth Stability Particle Entrainment and Drainage in Flotation. Int. J. Miner. Process. 1988, 23, 33–53. [Google Scholar] [CrossRef]
- Batjargal, K.; Guven, O.; Ozdemir, O.; Karakashev, S.; Grozev, N.A.; Boylu, F.; Çelik, M.S. Bubbling properties of frothers and collectors mix system. Physicochem. Probl. Miner. Process. 2022, 58, 152890. [Google Scholar] [CrossRef]


| Chemical | Hydroxyl Value (mgKOH/g) | Molecular Weight (g/mol) | Formula | HLB | pH (1% Solution) | Molecular Stucture |
|---|---|---|---|---|---|---|
| PPG200 (n~3.5) | 510~623 | 180~220 | HO(C3H6O)nH | 10.55 | 5.0~7.0 |   |
| PPG400 (n~6.5) | 255~312 | 360~440 | HO(C3H6O)nH | 8.69 | 5.0~7.0 | |
| PPG600 (n~10) | 170~208 | 540~660 | HO(C3H6O)nH | 8.25 | 5.0~7.0 | |
| BTPG (n = 3) | ~75 Polyglycols | 248.36 | C4H9(C3H6O)nOH | 6.63 | 5.0~7.0 | 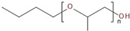 |
| BTEG (n = 3) | ≥50%–<100% Polyglycols | 206.2793 | C4H9(C2H4O)nOH | 8.05 | 5.0~7.0 |   |
| BDPG (n = 2) | 98.5 Polyglycols | 190.28 | C4H9(C3H6O)nOH | 6.75 | 5.0~7.0 |   |
| MIBC | w/w: ≥100% | 102.17 | CH3CH(OH)CH2–CH(OH)CH3 | 6.53 | 5.0~6.0 |  |
| Chemical | Form | Purity (%) | Formula | Molecular Weight (g/mol) | CMC (mol/L) | Density (g/cm3) | Molecular Structure |
|---|---|---|---|---|---|---|---|
| DAH | solid | ≥99% | C12H28ClNa | 221.81 | 1.5·10−2 (25 °C) | 1.0 (20 °C) |  |
| NaOL | solid | ≥97% | C18H33NaO2 | 304.44 | 3·10−3 | 0.9 |  |
Disclaimer/Publisher’s Note: The statements, opinions and data contained in all publications are solely those of the individual author(s) and contributor(s) and not of MDPI and/or the editor(s). MDPI and/or the editor(s) disclaim responsibility for any injury to people or property resulting from any ideas, methods, instructions or products referred to in the content. |
© 2023 by the authors. Licensee MDPI, Basel, Switzerland. This article is an open access article distributed under the terms and conditions of the Creative Commons Attribution (CC BY) license (https://creativecommons.org/licenses/by/4.0/).
Share and Cite
Batjargal, K.; Guven, O.; Ozdemir, O.; Karakashev, S.I.; Grozev, N.A.; Boylu, F.; Çelik, M.S. Frothing Performance of Frother-Collector Mixtures as Determined by Dynamic Foam Analyzer and Its Implications in Flotation. Minerals 2023, 13, 242. https://doi.org/10.3390/min13020242
Batjargal K, Guven O, Ozdemir O, Karakashev SI, Grozev NA, Boylu F, Çelik MS. Frothing Performance of Frother-Collector Mixtures as Determined by Dynamic Foam Analyzer and Its Implications in Flotation. Minerals. 2023; 13(2):242. https://doi.org/10.3390/min13020242
Chicago/Turabian StyleBatjargal, Khandjamts, Onur Guven, Orhan Ozdemir, Stoyan I. Karakashev, Nikolay A. Grozev, Feridun Boylu, and Mehmet Sabri Çelik. 2023. "Frothing Performance of Frother-Collector Mixtures as Determined by Dynamic Foam Analyzer and Its Implications in Flotation" Minerals 13, no. 2: 242. https://doi.org/10.3390/min13020242
APA StyleBatjargal, K., Guven, O., Ozdemir, O., Karakashev, S. I., Grozev, N. A., Boylu, F., & Çelik, M. S. (2023). Frothing Performance of Frother-Collector Mixtures as Determined by Dynamic Foam Analyzer and Its Implications in Flotation. Minerals, 13(2), 242. https://doi.org/10.3390/min13020242