Abstract
Egypt’s mineral resources are an effective means of raising the country’s income. Consequently, searching for deep subsurface ore deposits is essential. In this study, we map the subsurface structure and the occurrence of related gold-ore mineralization deposits in ophiolitic-assemblage rocks around the Wadi El-Saqia area in the Central Eastern Desert of Egypt. Our approach combines airborne geophysical data (aeromagnetic mapping) and geochemical analyses. We enhanced the aeromagnetic data and interpreted them using edge-detection methods, such as the first-order vertical derivative (FVD), the analytic signal (AS), the total horizontal derivative (THD), the tilt derivative (TD), the tilt angle (TA), the theta map, both grid and porphyry analyses from the Centre for Exploration Targeting (CET), and Euler deconvolution (ED) techniques. Utilizing these methods, we located the main structural lineaments/contacts that control the distribution of hydrothermal alteration zones. In addition, our geochemical analyses use the mineral chemistry of pyroxene and plagioclase to describe their tectonic and magmatic evolution. The airborne geophysical results revealed that NW–SE, NE–SW, N–S, and E–W structural orientations are prevalent in the studied area, with depths ranging from less than 50 m to about 600 m. To validate the findings, we carried out geochemical sampling, which indicates that pyrite, galena, pyrrhotite, and electrum contain good percentages of gold (ranging from 0.01–0.09 wt%, 0.03–0.1 wt%, 0.12–0.14 wt%, and 53.55–55.01 wt%, respectively). In this study, we were thus able to find preferred locations for gold mineralization, which highlights the value of combining aeromagnetic and geochemical data for mineral exploration.
1. Introduction
The central part of the Eastern Desert (CED) in Egypt is regarded as a location rich in mineral resources, with more than 120 occurrences of gold ore and gold-containing bodies recognized [1]. These gold sources can be divided into the categories of strata-bound, non-stratabound (most prevalent), and placer gold deposits [2]. In volcanic and metavolcanic rocks, non-stratabound deposits have been discovered to contain vein-type enrichment or dispersed mineralization (examples include the WadiAllaqi, Atalla, Abu Marawat, El-Sid, Sukari, and Atud gold mines). In the Wadi Allaqi, Abu Marawat, and Sukari regions, the gold is retained in quartz veins parallel to deeply rooted NW–SE to NNW–SSE shear zones. Conversely, at Atalla and El-Sid, the gold is hosted in NE–SW veins that run parallel to a shallow shear zone near Atud.
Ref. [3] has proposed a novel tectonic model for non-stratabound gold deposits. According to this model, the gold deposits were created by hydrothermal solutions, formed by magmatic or metamorphic processes or a combination of both, at a deeper crustal level. Despite several locations and studies in the CED, most of these sites remain underutilized because gold mining is expensive and complicated. Additionally, because gold often occurs in low concentrations, gold deposits are challenging to locate and define.
To explore the ores of the upper crust, it is essential to combine a variety of geological, structural, geophysical, geochemical, and mineralogical information [4,5,6,7,8]. Identifying geological structures and carrying out regional surveys is significant for investigating ore deposits in order to determine the best available morphologies for fluid flow and magma placement. Mineralization can also be maximized in a variety of geodynamic patterns [4,9,10,11]. Furthermore, surface surveys may not identify the critical geologic structures that are necessary for the assembly of mineralized systems and other Earth resources [12,13].
The fusion of geochemical and geophysical data may have broad applications in mineral discovery [9,14,15,16]. Recently, the precise decipherment of geological formations has been accomplished using edge/contact delineation of aeromagnetic data [10,11,12,13,17]. In the present study, we incorporate aeromagnetic and geochemical approaches to map the potential locations of gold mineralization. Thus, the objective of the present work is to integrate reliable and affordable geophysical and geochemical approaches—which are crucial for the analysis and exploration of ore deposits, such as those for copper, gold, and other minerals—to support future mineral-exploration plans and save time and effort. In particular, we employ lithological mapping to identify the structures of the hydrothermal alteration zones around Wadi El-Saqia in Egypt’s CED. In mineral exploration, the aeromagnetic approach has been applied to locate porphyry and advantageous locations for ore bodies, as well as to define structures, including faults, contacts, lineaments, and intrusions. Such structures are essential for determining where mineralization occurs. Edge identification is critical when using magnetic-field data to constrain geological interpretations [18]. Using the observed magnetic properties of rocks, such as magnetic susceptibility, enables us to achieve our major goal of using magnetic-field data to study the geological context and identify the precise sizes and positions of the sources [17]. The boundaries of sources buried at various depths on an observational plane have been investigated previously using various enhancement filters [19,20]. Several investigations have improved the effectiveness of filters in identifying the edges of buried magnetic sources accurately [5,21,22]. Various enhancing techniques can be used to attain the objectives for such studies. These methods include (FVD), (THD) [23], (AS), (TD) [24], (TA), and Theta filtering [25]. Automatic methods for identifying magnetic patterns of porphyry and defining geospatial lines have been used to locate ore bodies in advantageous locations [26,27,28].
Mineral analyses have been used to detect the tectonic setting and magma nature of host rock by analyzing fresh pyroxene and plagioclase minerals in metabasaltic rocks [29]. These methods can also be used to document the variation in the Ag–Au percentages in pyrrhotite, pyrite, sphalerite, galena, polybasite, and electrum in order to estimate its impact on the recovery of Au and Ag from Wadi El-Saqia ore deposits.
2. Geological Outlines
2.1. Location and Topography
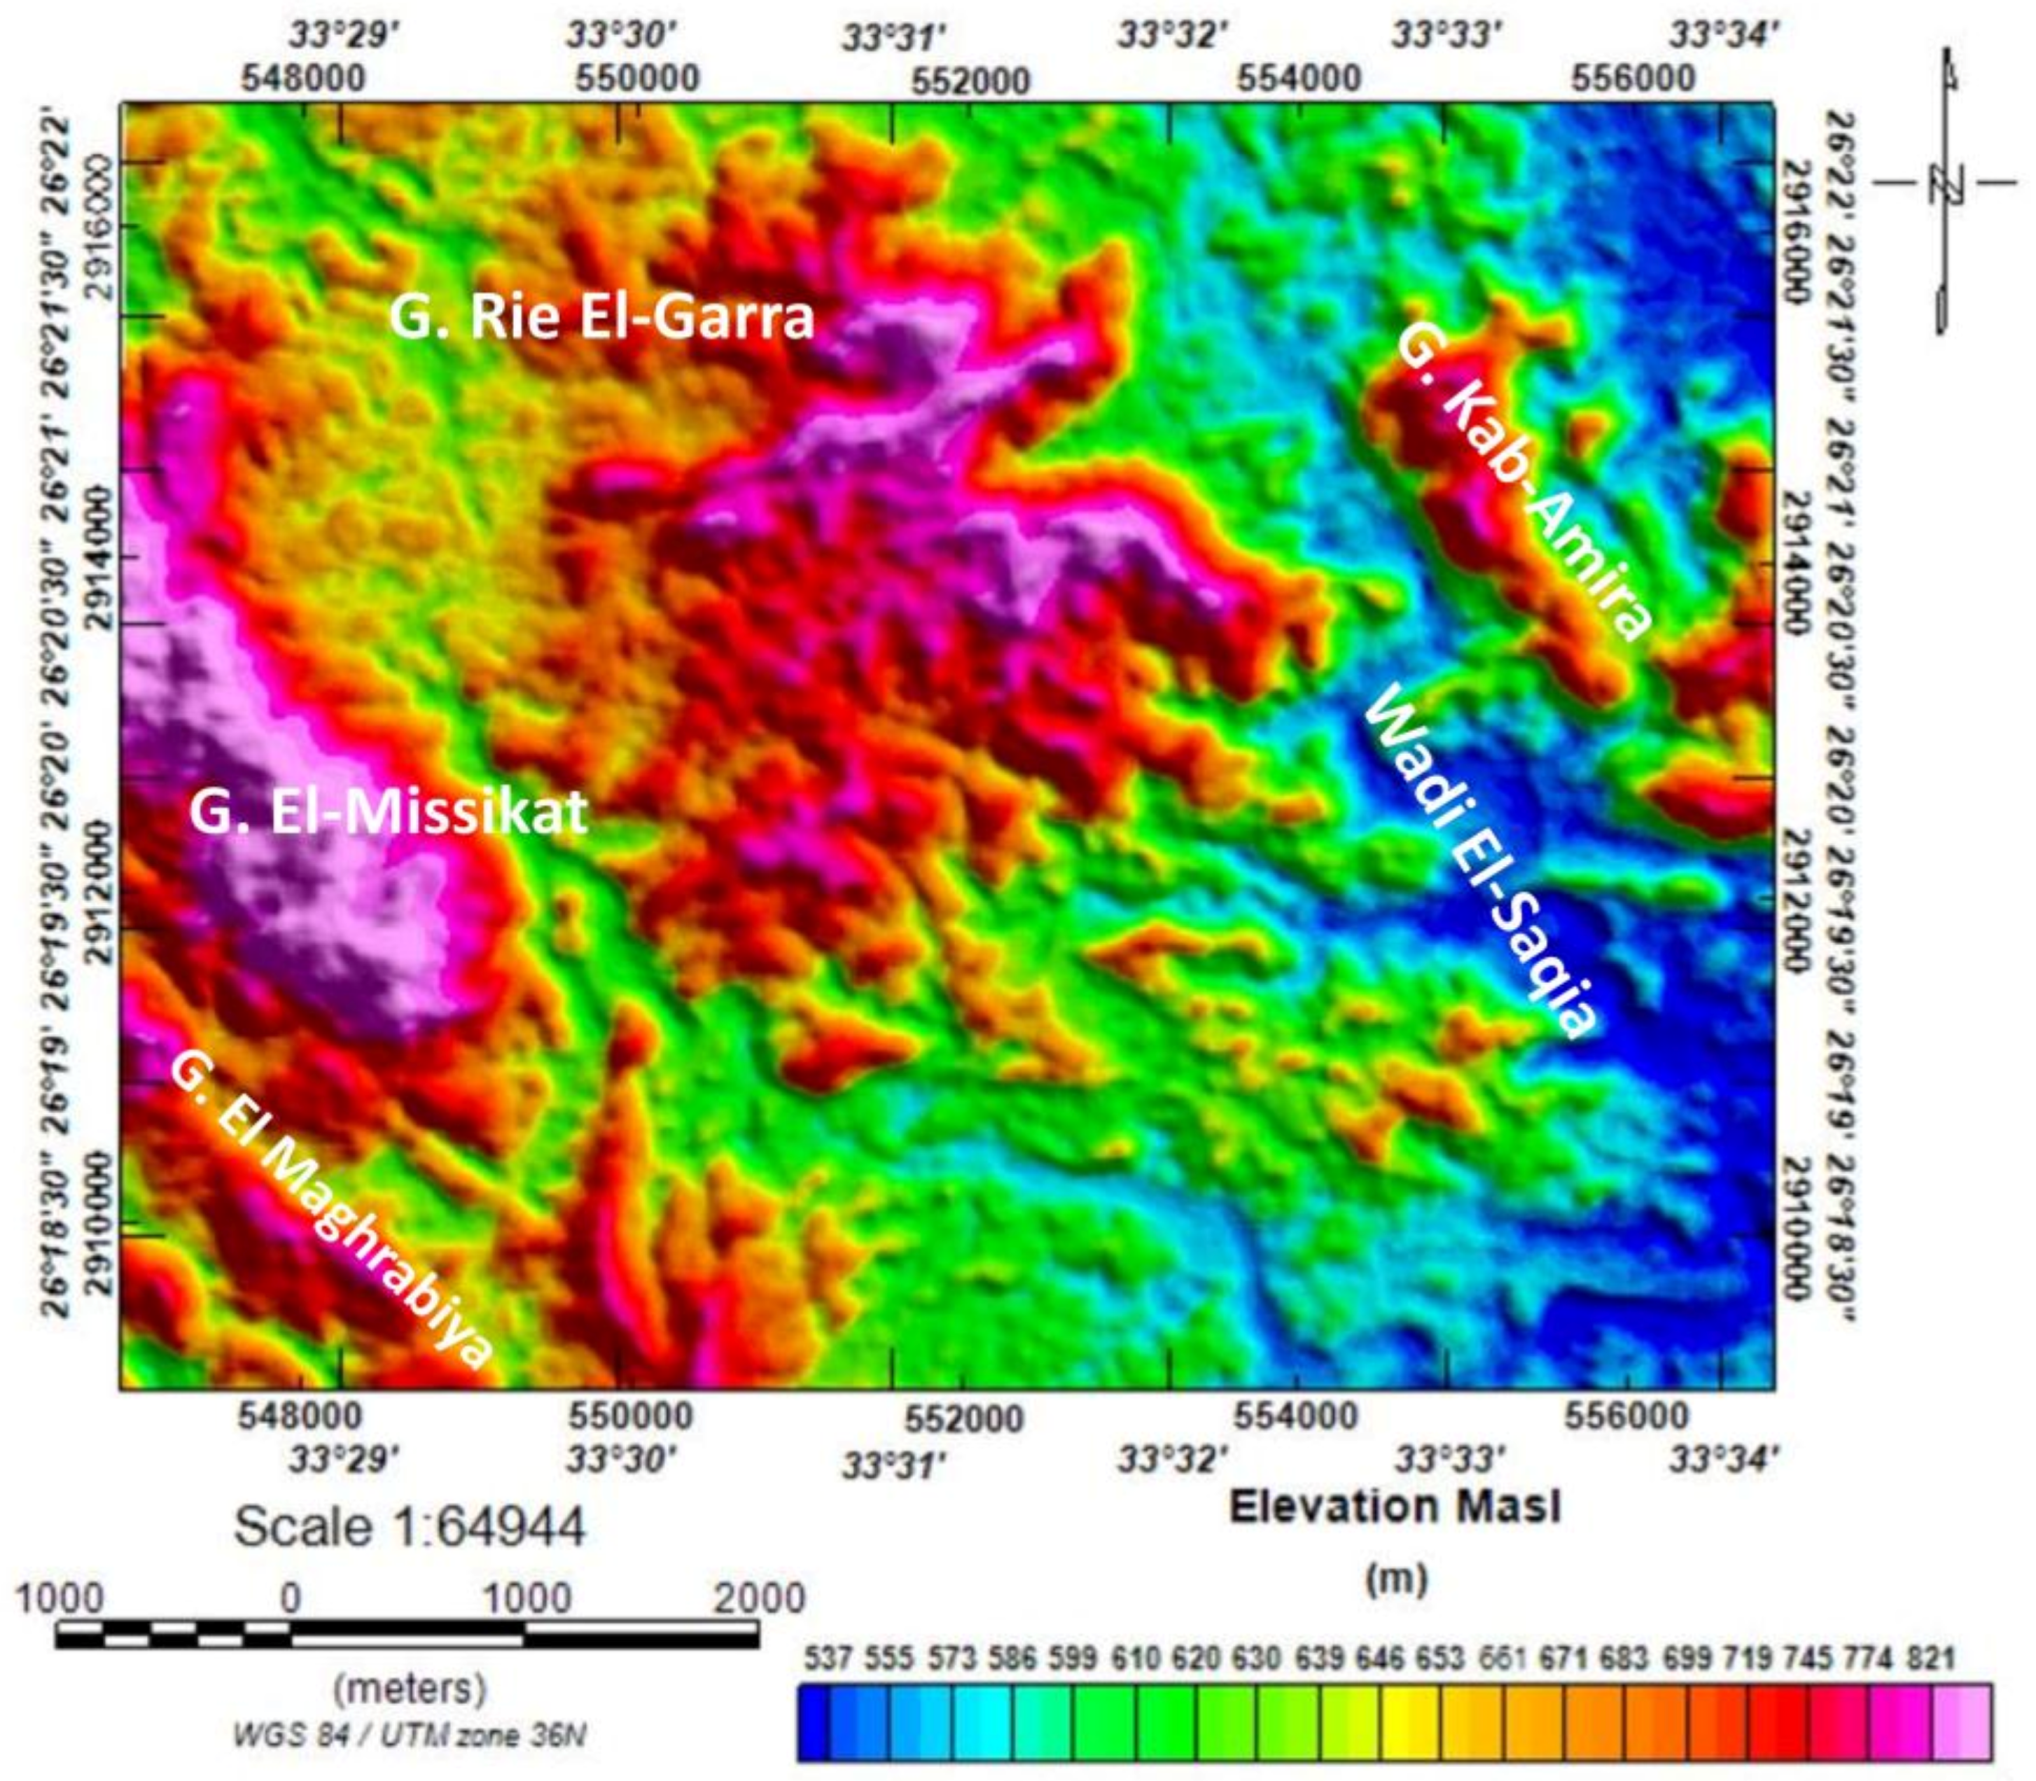
The Wadi El-Saqia study area is located in the CED, Egypt. The map in Figure 1 shows that it is roughly 90 km2 in size and is bordered by latitudes 26°18′ to 26°22′ N and longitudes 33°29′ to 33°34′ E. (Figure 1a). The area is composed chiefly of basement rocks—primarily metavolcanic and granitic rocks—and it contains relatively high, craggy mountains with several notable peaks. In addition, metasediment rocks are located on the eastern side of the area near Wadi El-Saqia and on the northwestern side near G. Rie El-Garra (Figure 1b). Topographically, the shaded relief map of a digital elevation model (DEM) of the area under investigation shows that the topography varies from 500 m to 1000 m (Figure 2). The highest points are G. El-Missikat (about 1000 m), G. Rie El-Garra (about 900 m), G. Kab-Amira (about 820 m), and G. El-Magharabiya (about 800 m).
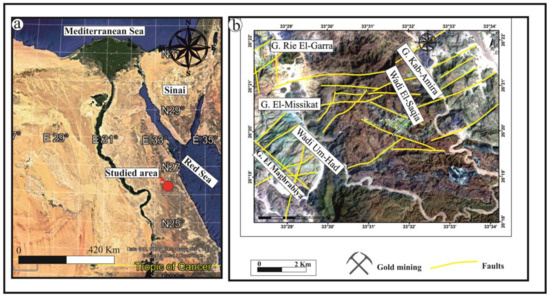
Figure 1.
(a) Wadi El-Saqia location map. (b) Landsat R–G–B band combination image 5–3–2 of Wadi El-Saqia and its surroundings, illustrating the locations of surface structures and of the gold mine.

Figure 2.
A shaded relief map of a digital elevation model (DEM) of the studied area, illustrating the topographic variance.
2.2. Structure and Geological Setting
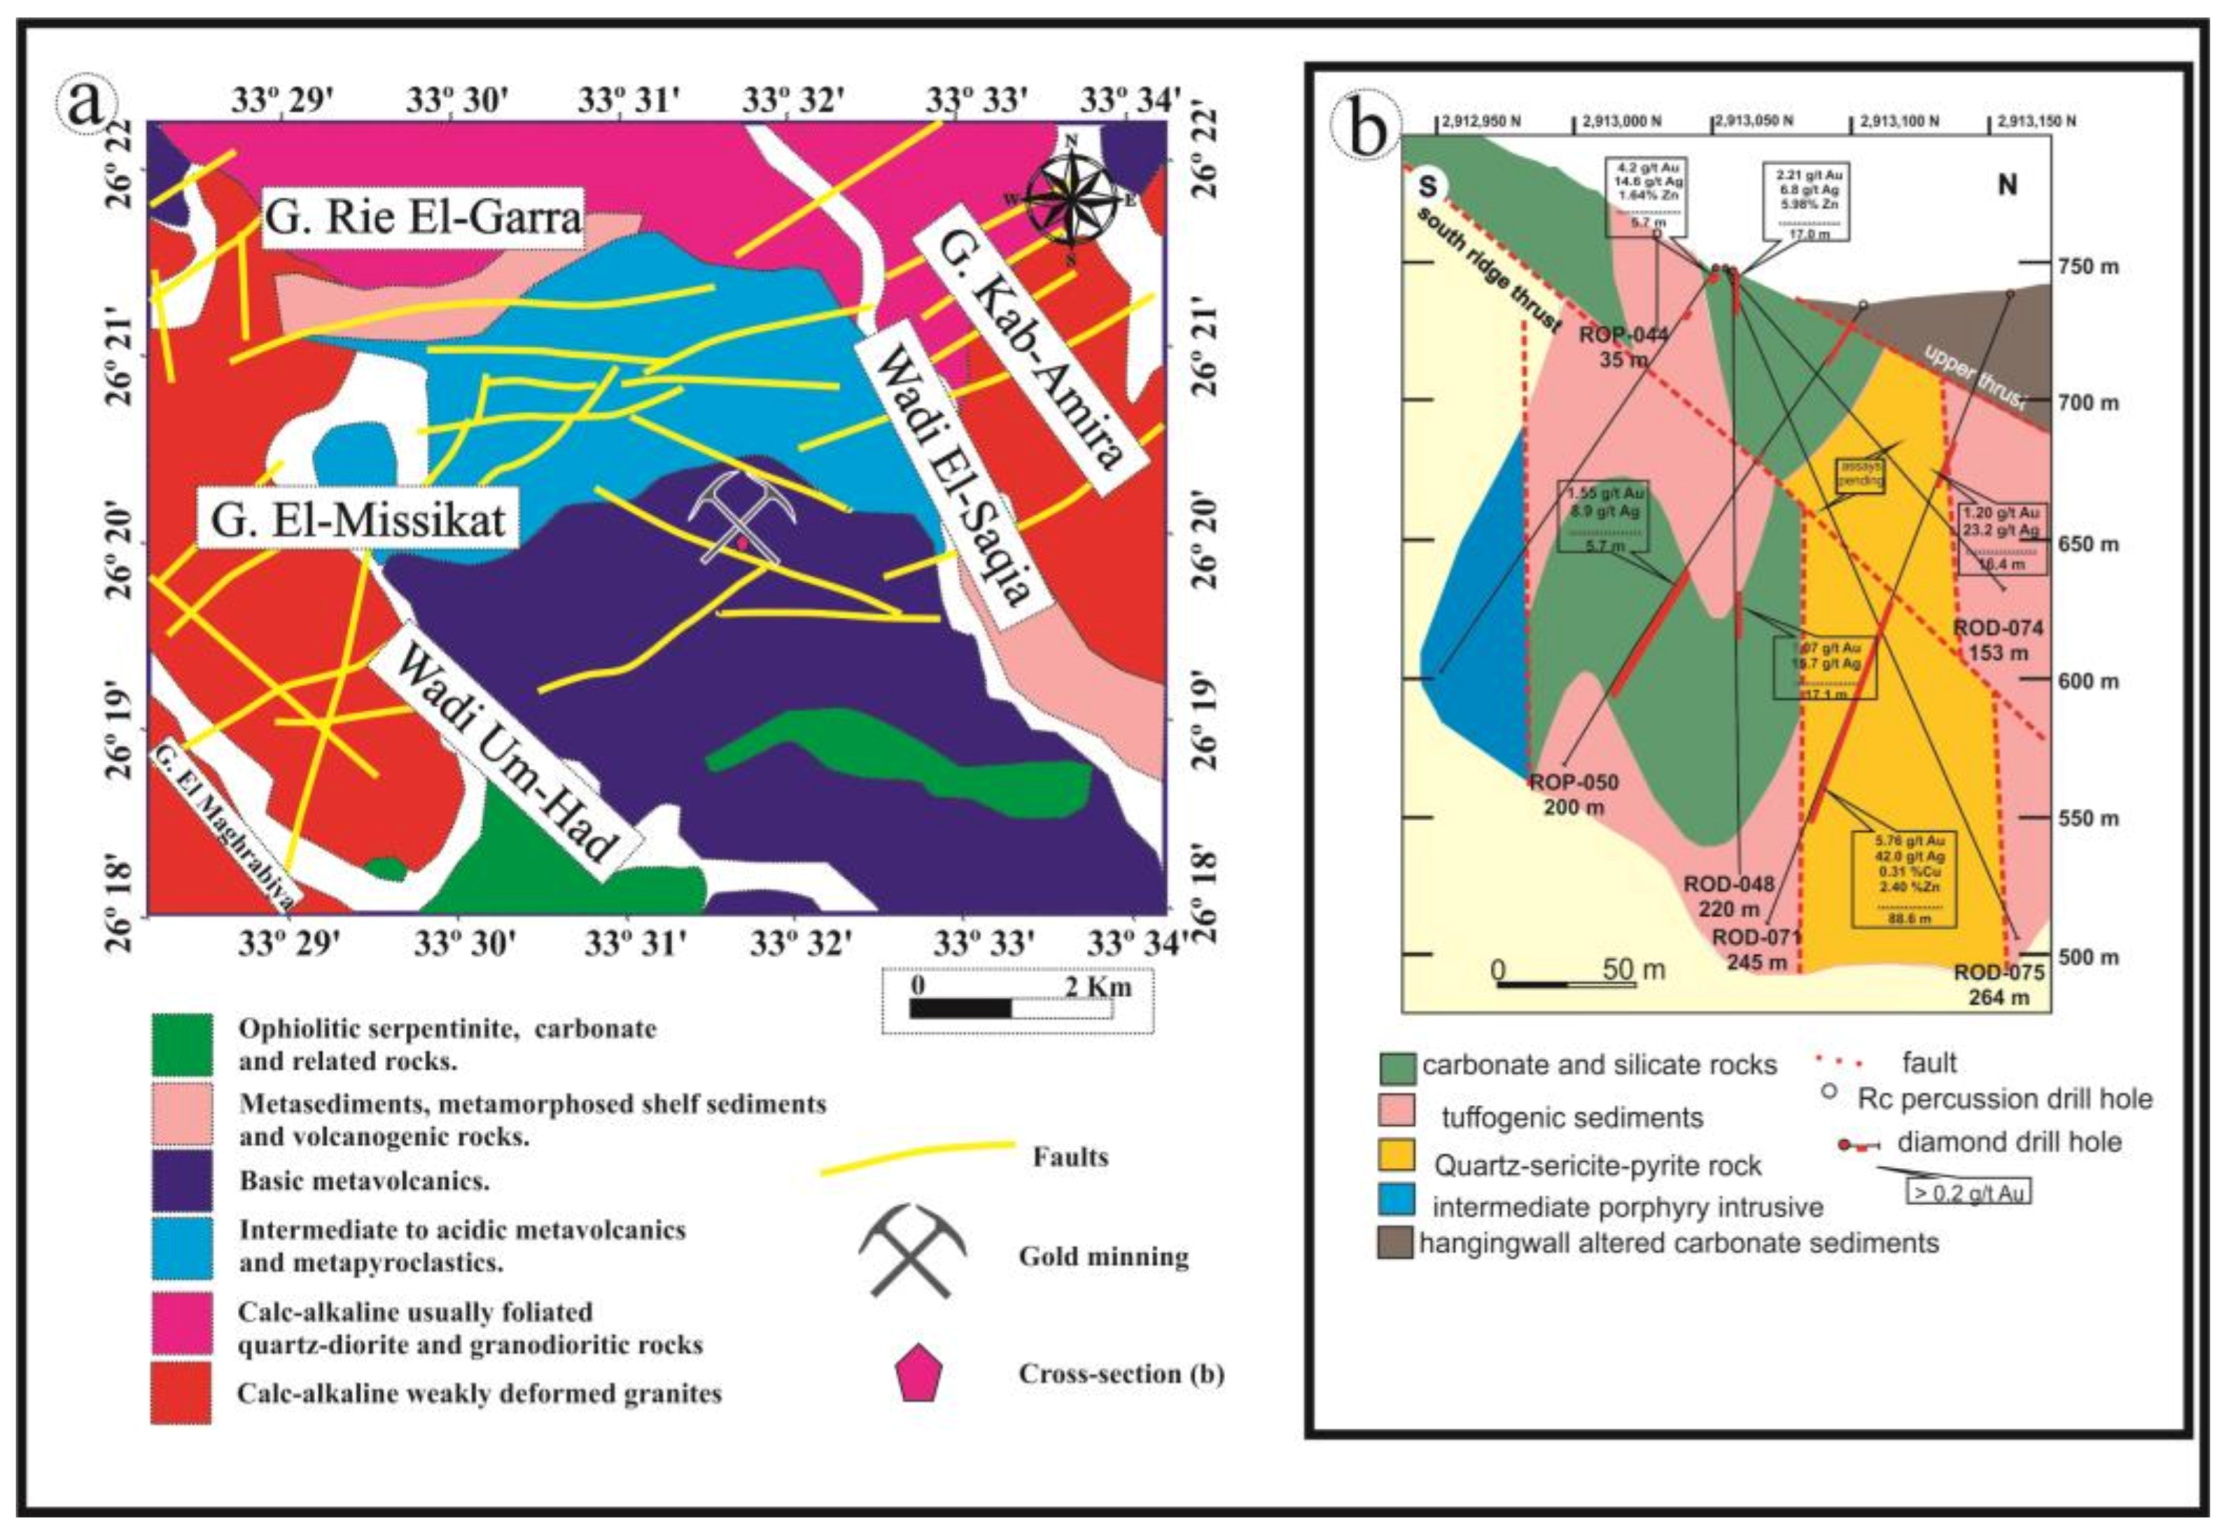
Shear zones, fractures, and faults are the primary structural components of the studied region. They include NE–SW fractures that correspond to trends in the Gulf of Aqaba and thrust faults that trend NW–SE through the Gulf of Suez and the Red Sea [30]. Many fractures and normal faults have NNW–SSE and ENE–WSW trends [31]. Three orogenic deformations have been identified [32]: Meatiqian (influenced by the ancient Nile craton) [33], Abu Diwan (which produced the NNW–SSE fractures), and Abu Ziran (which affected the NW–SE compression trend). There are fewer instances of other tendencies, such as E–W and N–S. The research region contains four main tectonic tendencies that are aligned along the directions NW–SE, NE–SW, NNE–SSW, and NNW–SSE, with slight traces of an E–W trend. A broad overview of the geological map, modified after [30] (Figure 3), shows that the Wadi El-Saqia area contains four main tectonic trends (NE–SW, NW–SE, NNW–SSE, and NNE–SSW), with minor traces of an E–W trend. Because of the Red Sea tectonics, the study region is severely fragmented, and it is still prone to tectonic reactivation. Geologically, the Shadli metavolcanic rocks—which are regarded as enormous masses of bimodal island-arc metavolcanic existence in the Nubian Shield—include the Wadi El-Saqia metavolcanics [34,35,36,37,38]. These rocks formed from volcanic and volcaniclastic materials from the island arc. Weakly metamorphosed metabasaltic rocks (basic metavolcanics) are confined to the southeast region of the studied area (Figure 3a). Ore deposits are thought to be hosted by metabasaltic and carbonate rocks (gossans) (Figure 4a).

Figure 3.
(a) Wadi El-Saqia geological map modified after [30]. (b) A subsurface geological section in the gold-mine area showing the locations of gold-mineralization zones associated with subsurface faults, modified after [39].

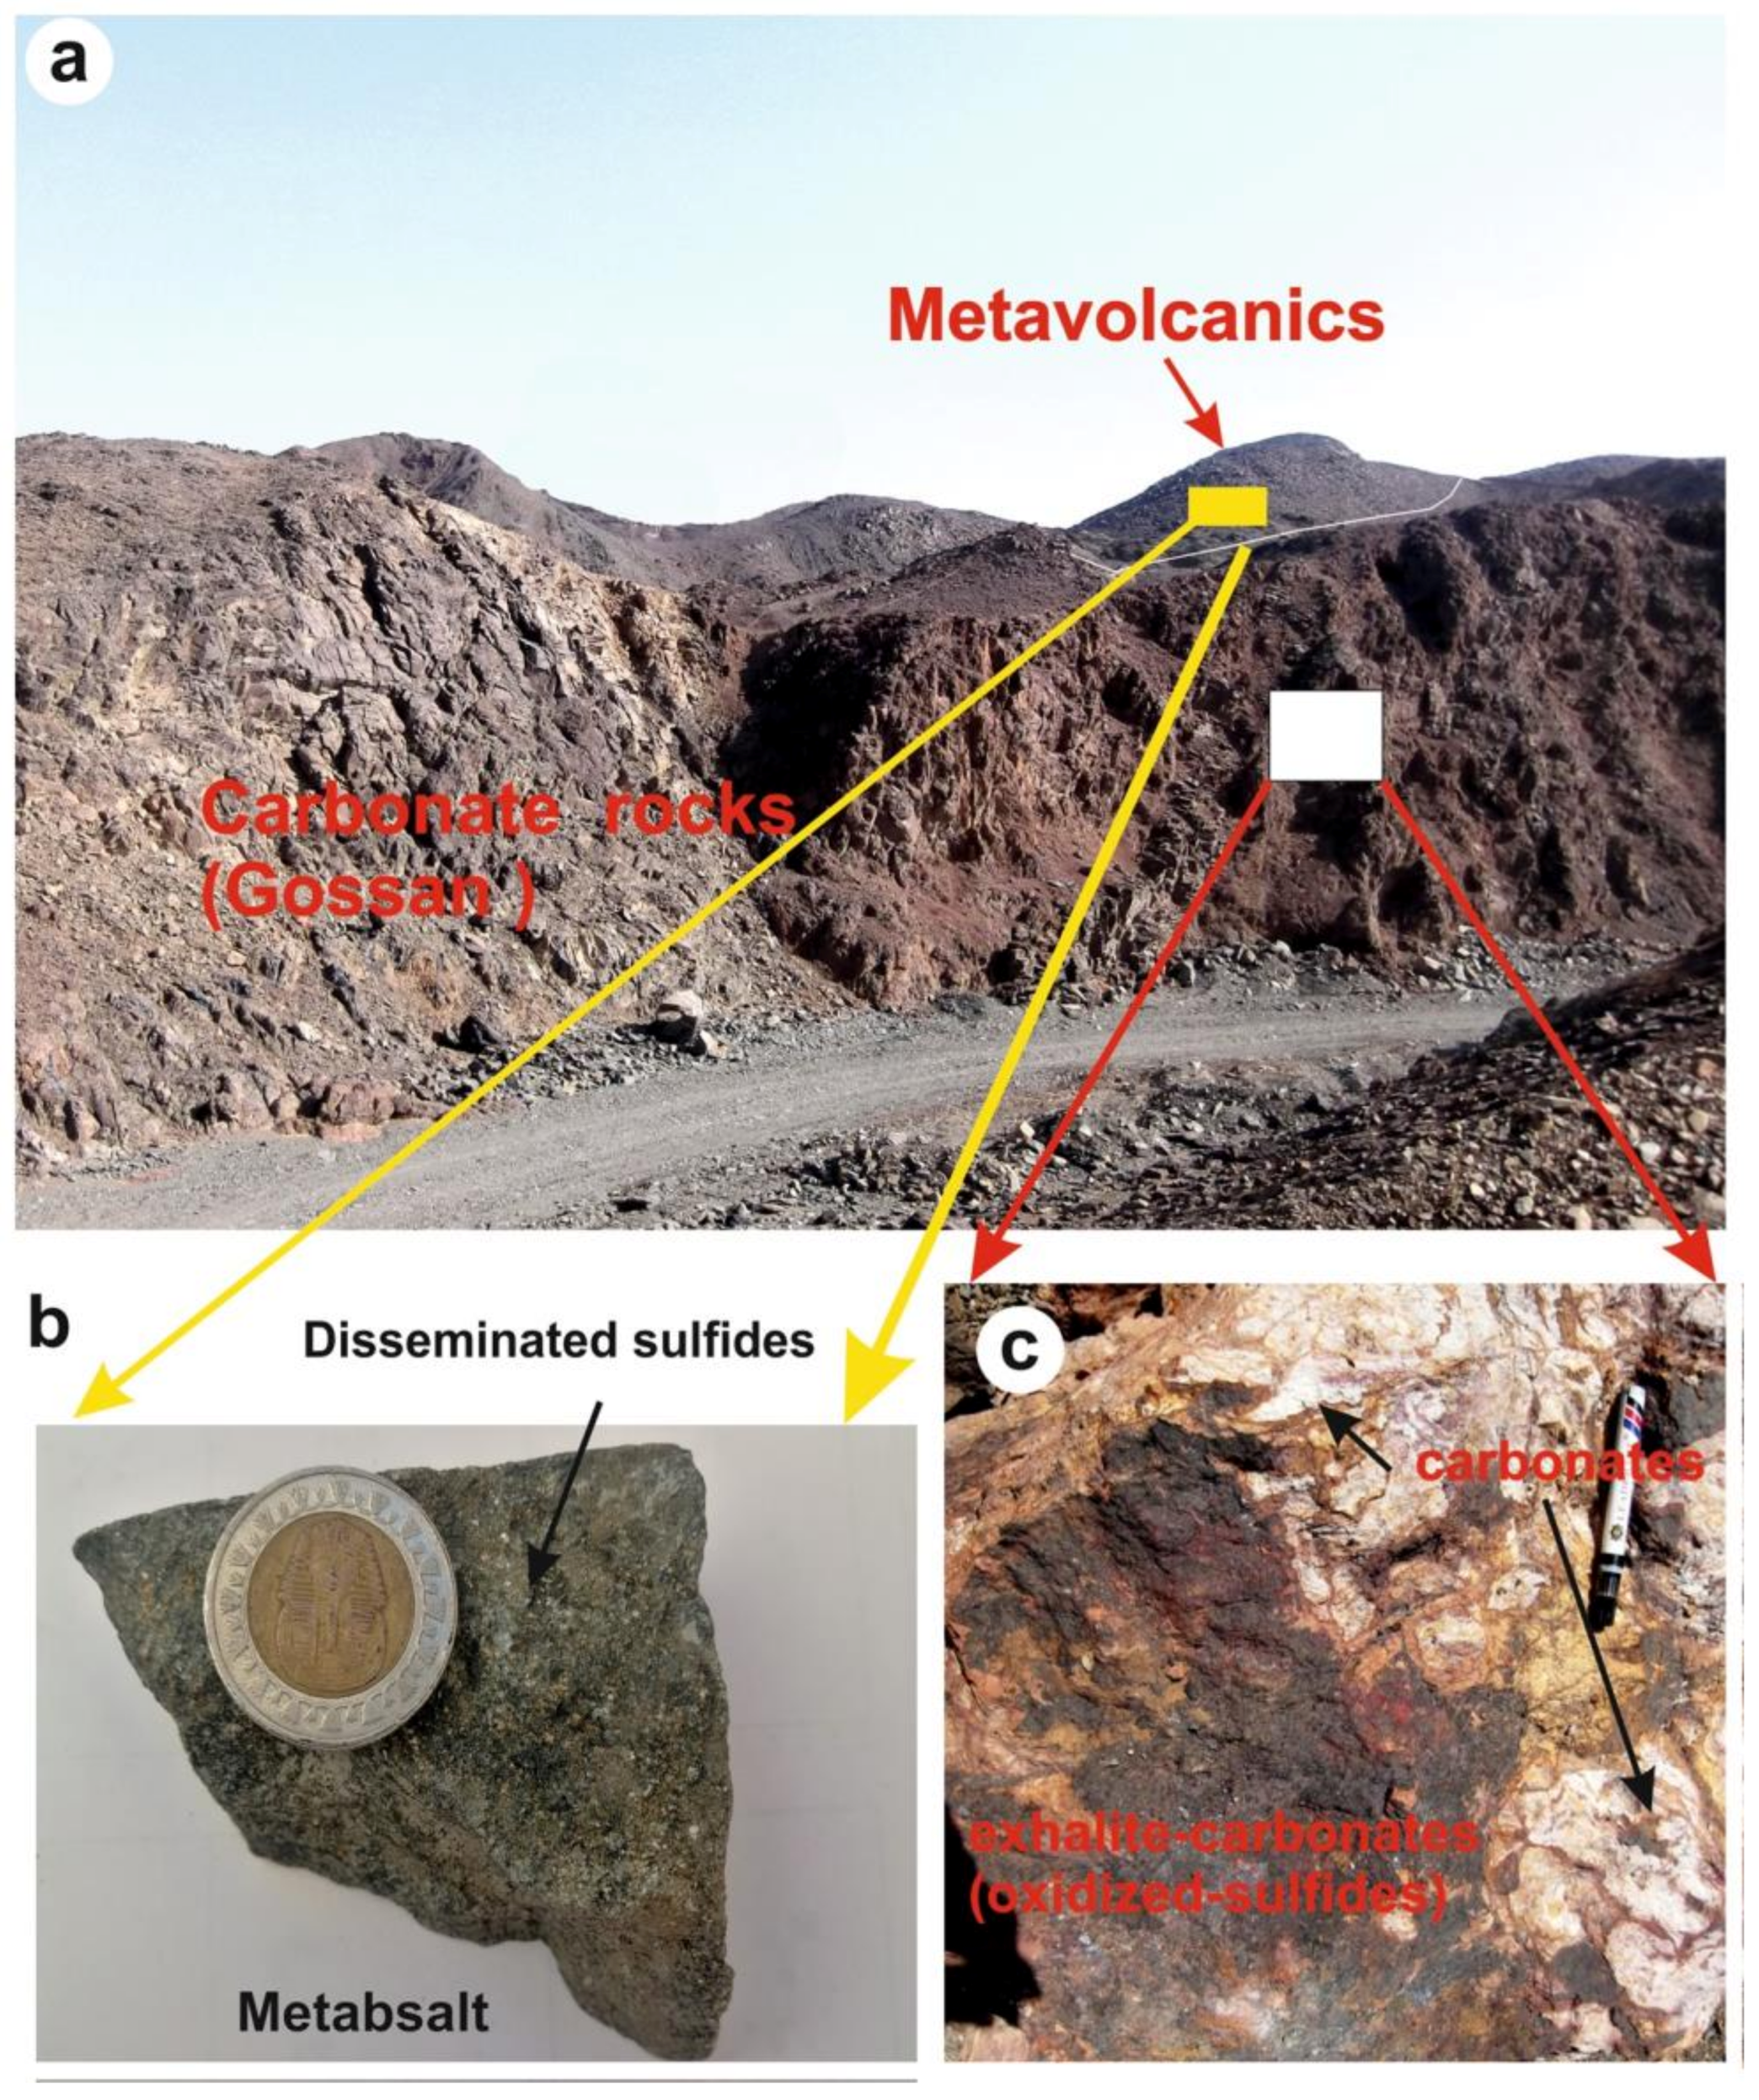
Figure 4.
Field photographs showing (a) contact between carbonate rocks (gossans) and meta-volcanics, (b) a close-up view of sulfide disseminated in metabasaltic rock, and (c) a close-up view of reddish massive oxidized sulfides in carbonate rocks.
2.3. Mineralization
On a broader scale, mineralization in the study region is structurally regulated, even if no extreme structural constraints are observed between the gold and sulfide mineralization zones. In most cases, gold and sulfide mineralization is found as disseminated ore hosted by metabasaltic rocks (Figure 4b) or as semi-massive ore deposits hosted in carbonate rocks (gossans) that exhibit zoning with exhalites (hematite+sulfide+carbonate) [40] (Figure 4c). In most cases, the gold and sulfide mineralization occurrences are disseminated, semi-massive, and hosted by metabasaltic or carbonate rocks (gossans) that exhibit zoning with exhalites–carbonates facies (Figure 4b and Figure 4c, respectively). The Rodruin gold mine, which was reported in December 2017, is one of the newer mining sites in the study area. It is situated about 18 km east of the company’s Hamama West mineral deposit. (Figure 1b) [39]. The mineralization seems widespread and may have a replacement origin (Figure 3b). A high-grade sulfide deposit is located in an altered rock block that opens both along the strike and at the profound end. Due to its proximity to the SRT and upthrust structures, it practically operates in a “blind” state [39]. A high-grade, semi-massive sulfide mineralization with high-grade Ag and Au percentages (26.8 and 142.4 g/t, respectively) is found below the SRT hole as an example of subsurface mineralization [39].
3. Materials and Methods
To accomplish the aim of this study, we used integrated airborne geophysical and geochemical approaches. We employed the airborne geophysical and aeromagnetic data to identify fracture zones/subsurface faults that serve as conduits for hydrothermal solutions. We additionally used geochemical and field data to validate the findings.
We used the following techniques:
3.1. Processing and Interpretation of Airborne Magnetic Data
In 1984, the Aero Service Company collected total magnetic-intensity (TMI) map data [41] for the Egyptian General Petroleum Corporation (EGPC) and the Egyptian Geological Survey and Mining Authority (EGSMA). The survey was carried out along contiguous routes separated by 1.5-km intervals in the NE–SW direction, with azimuths of 45° and 225° from true north, using aircraft flying 120 m above the terrain. The finished TMI magnetic data were reviewed, condensed, and displayed as contour maps. These data were made ready for further processing by digitizing the maps and correcting for the international geographic reference field (IGRF), which has an inclination of 37.2°, a declination of 1.9°, and a primary magnetic-field intensity of 42,425 nT. In the next phase, we used the reduction-to-pole (RTP) approach to remove the inclination and declination influences from the TMI data.
We used Geosoft software to construct the RTP map [42] and employed this procedure to move the magnetic anomalies precisely above their proper sources. Using airborne magnetic surveys, which support mapping structures and lithologies, is an excellent method for constructing lithostructural maps [43,44], particularly in concealed areas [45]. To facilitate the delineation of lineaments and build maps of structural complexity, the RTP map process uses many filters and techniques, including (FVD), (THD), (AS), (TD), (TA), Theta filters, and the porphyry-analysis methods from the Centre for Exploration Targeting (CET) to reveal the structural discontinuities in the study area [24,46,47,48,49].
3.1.1. Regional–Residual Separation
We separated the regional and residual components of the RTP map using a spectral-analysis approach (the Radial Average Power Spectrum Technique). On the RTP map, we employed this method to differentiate between the regional and residual maps [50]. This process makes use of the fast Fourier transform (FFT).
3.1.2. First-Order Vertical Derivative (FVD) Method
An FVD map is essential for finding near-surface magnetic properties associated with geological formations. Since it is sensitive to magnetic sources close to the surface, it fits the upward-continuation map and can potentially emphasize local anomalies while attenuating regional abnormalities. Ref. [51] employed the first vertical derivative to eliminate lengthy waveforms generated by magnetic causative entities. The zero-contour value of the FVD map makes it easier to distinguish between lithological and structural elements.
3.1.3. Total Horizontal Gradient (THG) Method
The THG technique is generally insensitive to data noise and intervention effects among nearby sources. It is highly efficient in detecting structures, such as faults from the periphery of an anomaly. Refs. [52,53] proposed several assumptions about the sources; this method is frequently used in mineral exploration. It is less sensitive to data noise because it only considers the first-order horizontal derivatives of the magnetic field. If M (x, y) is the magnetic field and its horizontal derivatives are ∂M/∂x and ∂M/∂y, then the THG (x, y) is given by Equation (1):
3.1.4. Tilted Derivative (TD) Method
The TD method has been used to map shallow basement formations and find possibilities for mineral prospecting; however, it is useless for this purpose because the edges of deep sources are never detected. According to [24], the tilt-angle function given by Equation (2) is obtained by calculating the arctangent of the ratio of the vertical derivative (VDR) to the total horizontal derivative (THDR) of the potential field:
3.1.5. Analytical Signal (AS) Technique
Either the spatial or the frequency domains can be used to construct an analytical signal (AS) that reaches a maximum over separated bodies and their edges. A high AS amplitude is considered to indicate the presence of ophiolitic basic, metabasaltic, and metavolcanic rocks, which are usually associated with mineral occurrences that contain significant quantities of iron minerals. Its magnitude is independent of the direction of magnetization, and it is created by combining the horizontal and vertical derivatives of a magnetic anomaly [54,55,56]. This filter highlights discontinuities, shows the textures of anomalies, and improves the identification of short-wavelength anomalies [57]. The AS amplitude can be used to limit the extent of a lithological unit and identify the properties of the underlying structural framework. The square root of the sum of the squares of the x, y, and z derivatives is known as the 3D AS, as given by Equation (3):
3.1.6. Tilt Angle (TA) and Theta Filters
The TA filter was the initial method used to equate the amplitudes of different anomalies [16]. The bounds of the source bodies are established by the zero contour values of the TA filter. The ratio of the vertical components of the field’s THG equals the arctangent of the TA filter.
To specify the boundary of a magnetic entity, ref. [25] developed the Theta filter ( map). It is defined in terms of the ratio of THG to AS:
Depending upon the strike angle and amplitude, the theta technique may detect the edges and lateral boundaries of a magnetic anomaly [58].
3.1.7. CET Grid Analysis
The CET algorithm provides capabilities for enhancing, recognizing lineaments in, and assessing the structure and complex nature of airborne magnetic data [27,28]. This method generates a map of the density of contact occurrences that automatically delineates lineaments. It finds potential locations of ore deposits by combining numerous statistical techniques, including texture analysis, lineation outlining, vectorization, and using complexity analysis, to create a map of contact occurrence density.
3.1.8. CET Porphyry Analysis
Circular or semicircular features called porphyry-like intrusions contain zones of vulnerability at their edges or boundaries, through which hydrothermal solutions can flow. To find these structures and the related hydrothermal alterations, we applied the CET porphyry approach to the RTP data for the investigated area. The inner alteration zones, often associated with positive magnetic anomalies, are significantly less magnetic than the incursion and the altered zones [26]. We first applied this method in the research area by employing transform procedures to detect central peaks and circular features. We established the edges of sources by applying the amplitude-contrast transform. Finally, we used tracing to show the entire configuration.
3.2. Geochemical and Analytical Methods
Based on interpretations of the aeromagnetic data, we methodically gathered samples of carbonate rocks and metabasaltic rocks from various sites throughout the research area. We used a polarizing and reflecting microscope to perform petrographic analyses of 15 thin sections of basaltic and carbonate rocks. At the Vienna University in Austria, we used a JeolJSM-6400SEM with an energy-dispersive X-ray analysis (EDX) unit to perform electron-probe microanalyses of pyroxene, plagioclase, and mineral deposits (Mineralogy and Crystallography Institute). The analytical parameters we used were 20 eV channel width, 20 keV accelerating voltage, with cobalt employed for internal gain calibration. The standards we used to determine and calibrate the values of Si, K, Al, Fe, Mg, Mn, Ca, Ti, Cr, and Na were jadeite, chromite, garnet, and titanite. To ascertain their chemical compositions, we examined 53 spots from various minerals (8 in plagioclase, 8 in pyroxene, 9 in pyrite, 9 in sphalerite, 6 in galena, 6 in polypasite, 4 in electrum, and 3 in pyrrhotite minerals).
4. Results and Discussion
4.1. Airborne Magnetic Data
Removal of the declination of the research region resulted in several anomalies pointing northward, which is the only notable variation between the RTP and the TMI maps (Figure 5). The forms of the anomalies overlie the relevant causal bodies.
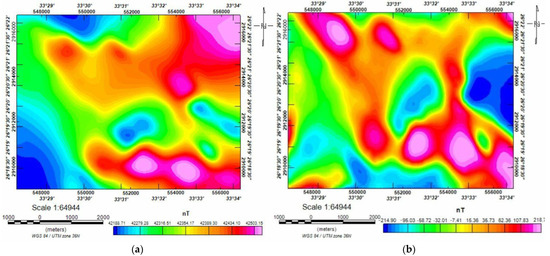
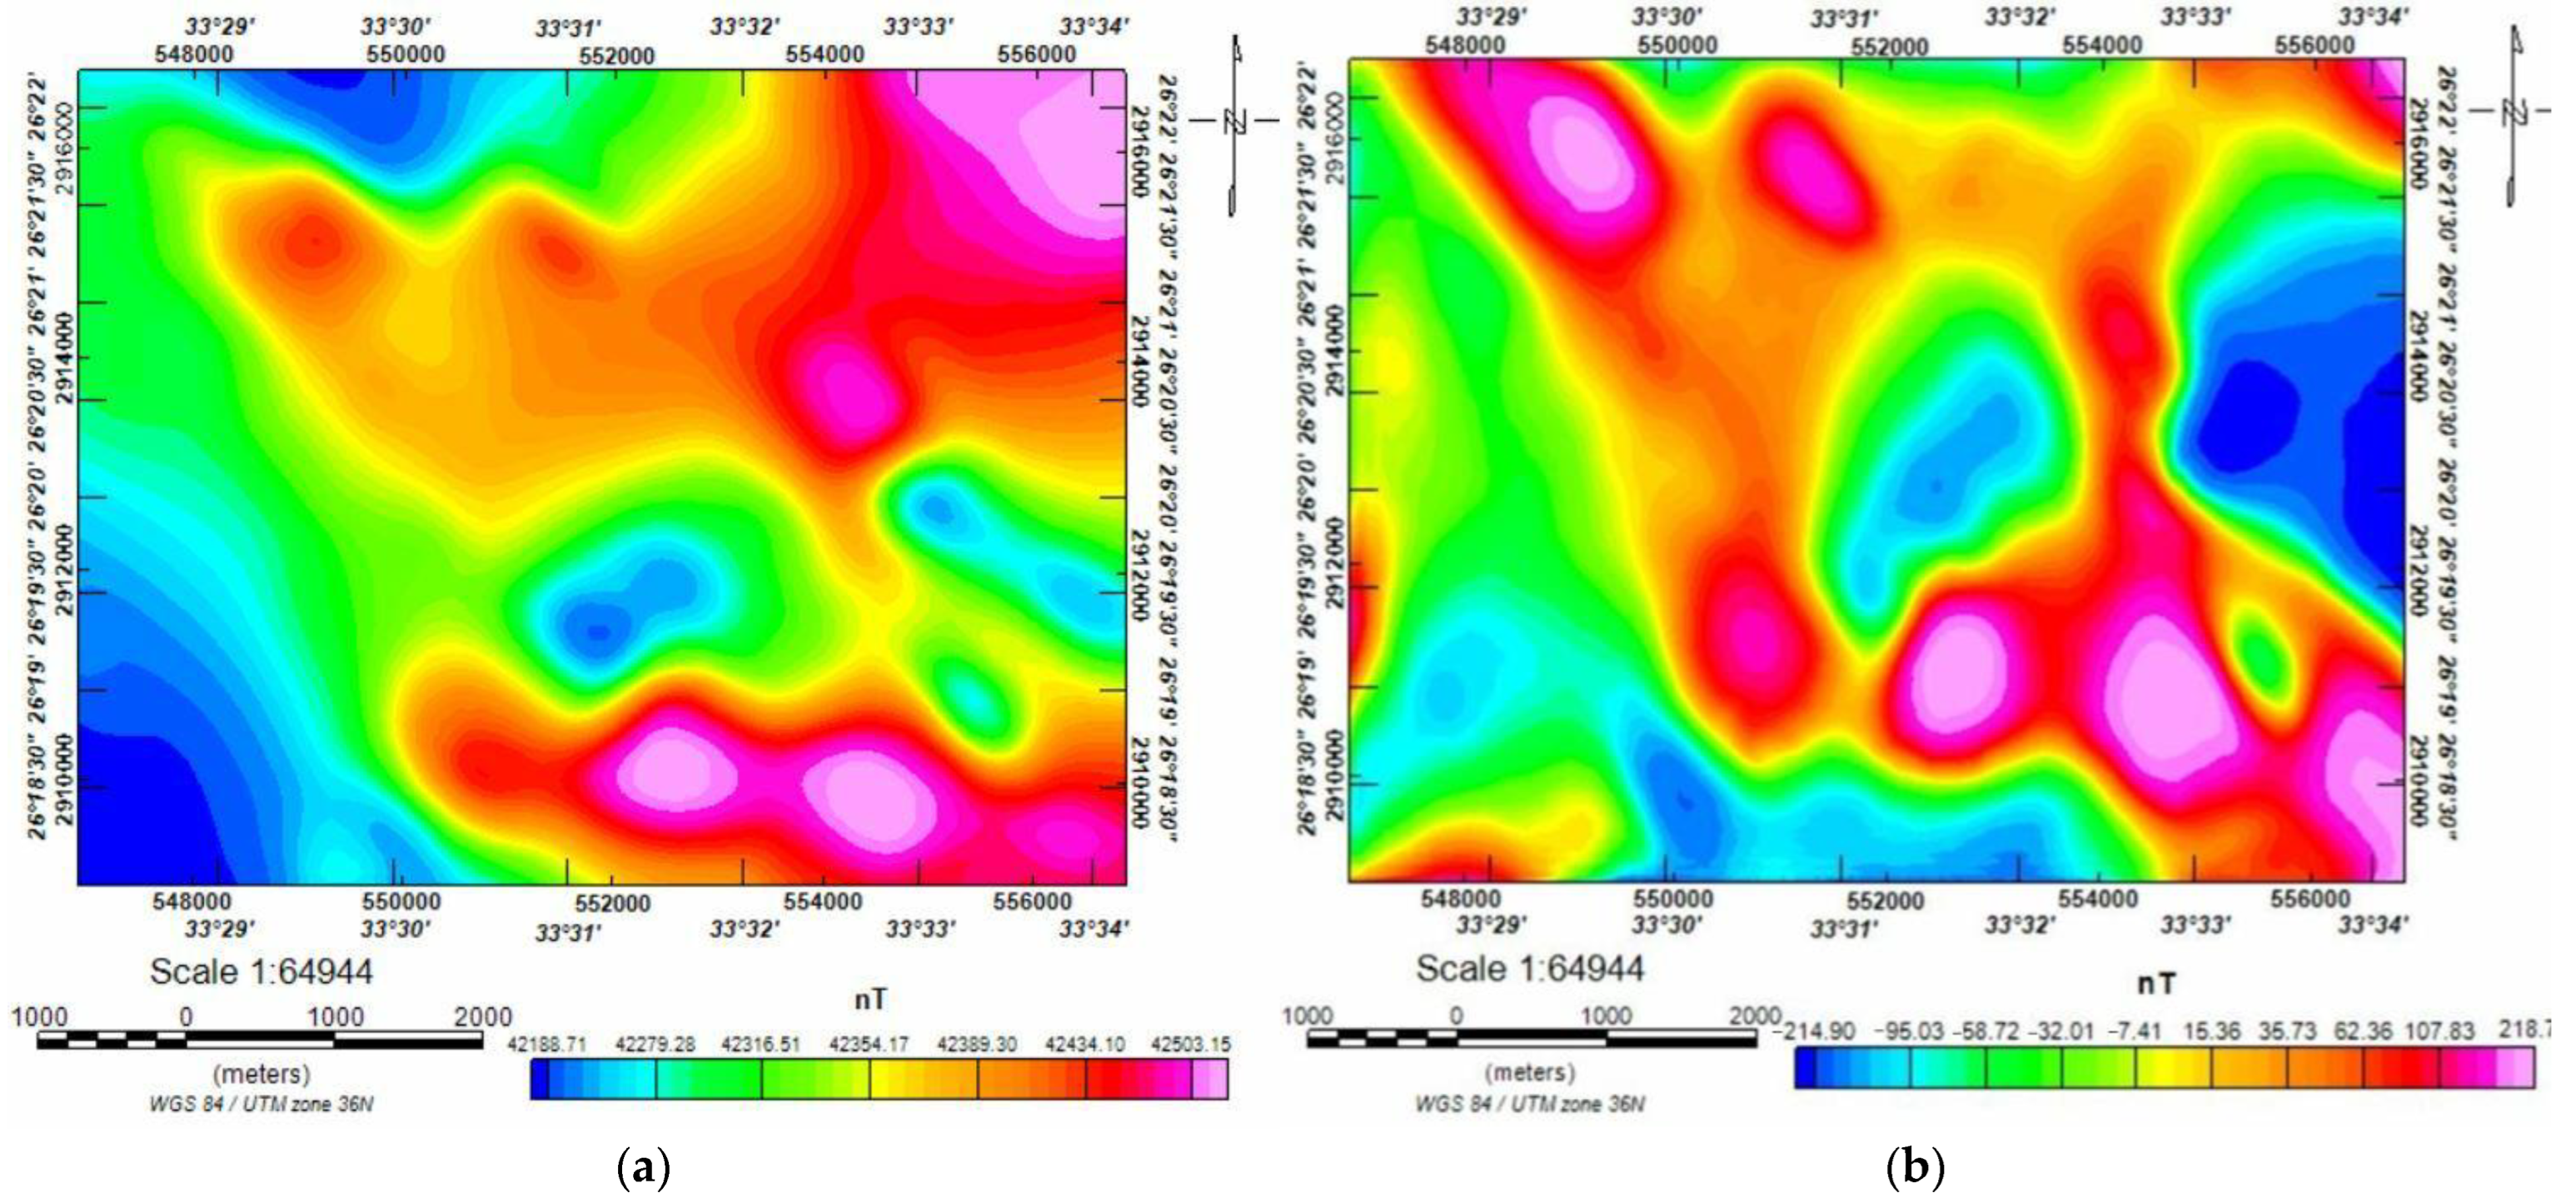
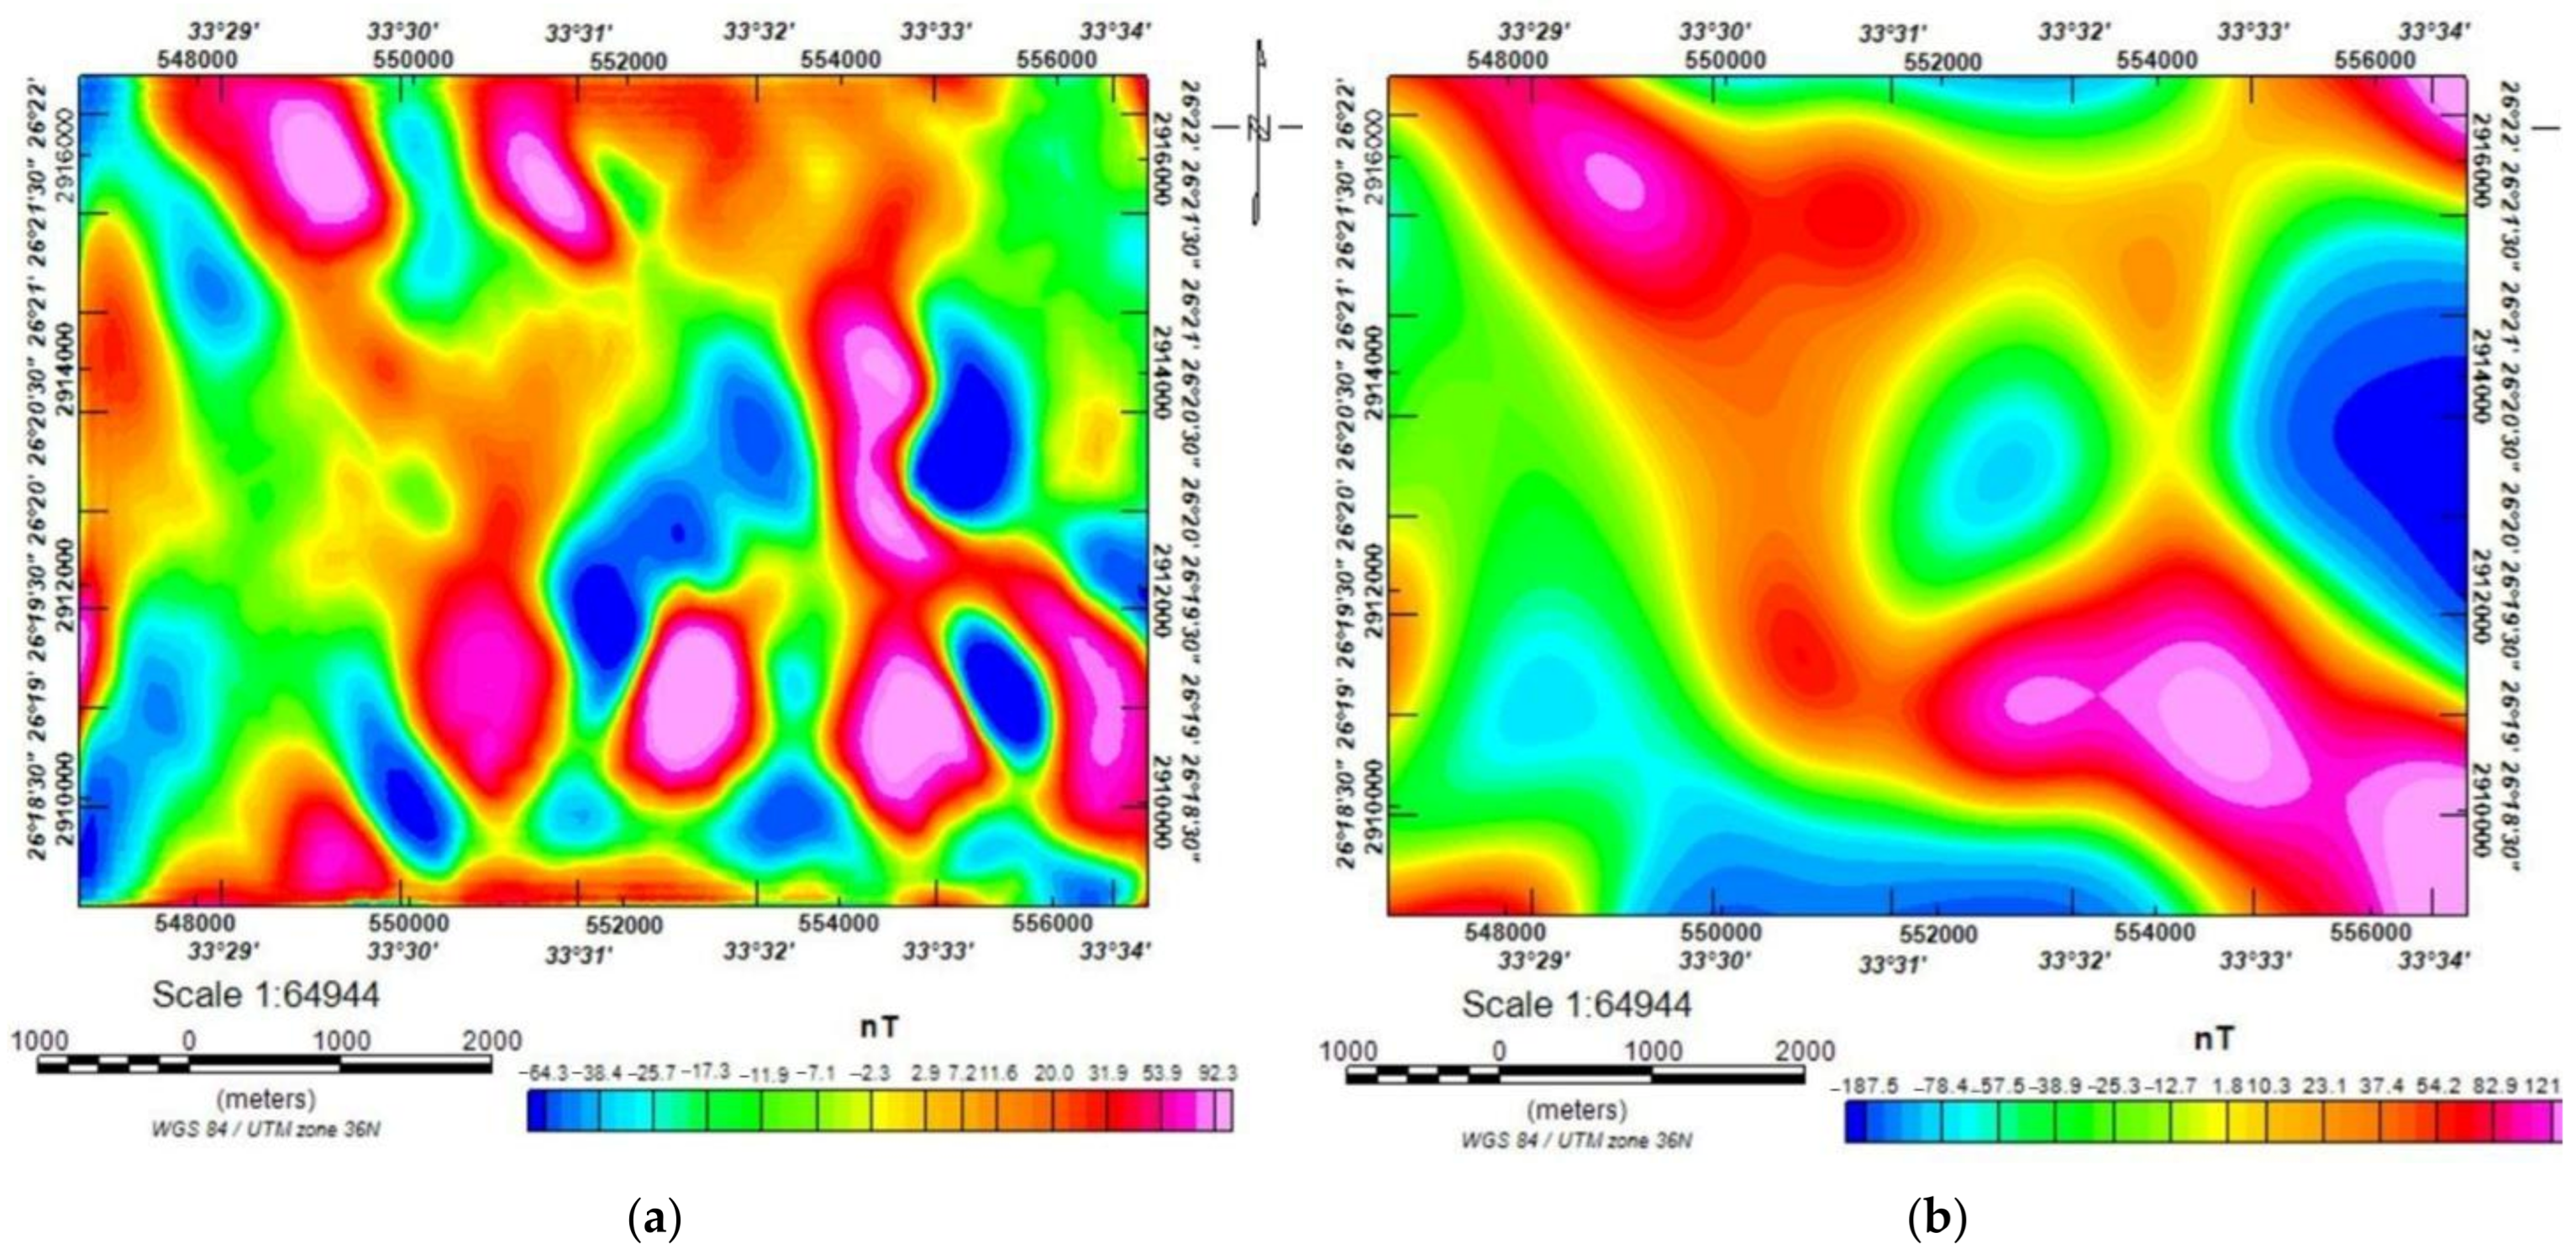
Figure 5.
(a) Total magnetic intensity (TMI) map and (b) Reduction to North Pole (RTP) map of the study area.
The RTP map reveals a range of magnetic intensities from 218 to −214.9 nT. The magnetized rocks in the area produce strong and low magnetic anomalies of both low and high frequencies, which are distinctive for this research location. The strong anomalies have high magnetic susceptibilities due to the abundance of iron in the ophiolitic assemblage and metavolcanic (metabasaltic) rocks [59]. On the other hand, Quaternary alluvium deposits, felsic rocks, intermediate–to–acidic metavolcanic, and pyroclastic rocks are the causes of low magnetic anomalies.
The maps in Figure 5 show negative magnetic anomalies (blue color) that are primarily oriented in the NE–SW, NW–SE, and N–S directions. These anomalies may be connected to the sedimentary deposits and weakly deformed calc–alkaline rocks. The negative magnetic anomaly in the central part of each map is located near the Rodruin gold-mining area. The Rodruin area is highly faulted and folded throughout the prospect area, making it structurally complicated. The dolomitic carbonate rock types at Rodruin, which are often severely worn, and the gossans at the surface appear to be linked to a large portion of the mineralized zones there. This mineralization covers a sizeable part of the southern ridge area and frequently contains high zinc values [39]. On the other hand, the strong and positive magnetic anomalies in the southern part of the area are related to the presence of the ophiolitic assemblage and metabasaltic rocks associated with the NE–SW and E–W running faults.
Our geophysical scheme also revealed three alteration zones near the Rodruin gold-mining region. The first zone is in the south and stretches east to west. This corresponds to the Mediterranean trend and to the major ductile shear zones that are located in the middle plane of the trend and which are connected to strike–slip faults and transgressed thrust faults. They are correlated with the collision between the Arabian Nubian shield and the Nile Craton in the west. The second is located north of the first zone. It expands the fault trend along the Gulf of Suez in the NW–SE direction. The third alteration zone runs in an easterly direction, parallel to the East African trend, and extends in the S–N direction [60,61].
Figure 6 shows the three components of the radially averaged power spectrum of the RTP magnetic map: deep sources, shallow sources, and Nyquist noise.
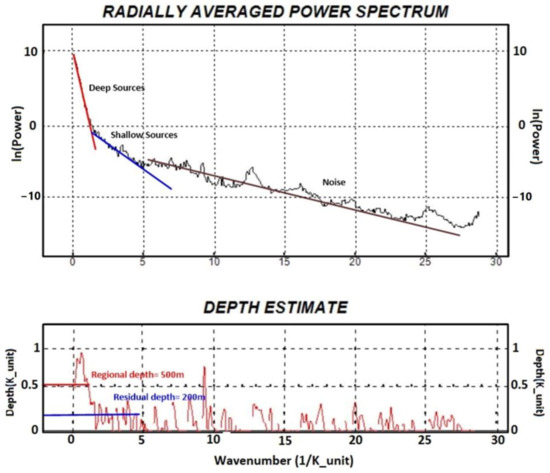
Figure 6.
The radially averaged power spectrum of the study area, as calculated from the RTP magnetic map.
A residual (high-pass) map is considered to be the most precise map for identifying shallow geological structures (Figure 7a). We applied a 0.288 cycle/unit cut-off wavelength to the RTP map, and the results show dominant structures in the NW–SE and E–W directions, which are connected to the local near-surface structures. The values of the magnetic anomalies in the investigated area vary from 82.3 nT to −84.3 nT. The region is home to various local anomalies with varying wavelengths and relatively high frequencies (elongated and circular). According to the geological map of the studied area [30], the strike–slip and transgressed thrust faults are connected to positive anomalies that stretch in the NW–SE and NE–SW directions. They include NE–SW fractures that correspond with the trends in the Gulf of Aqaba and with thrust faults that travel NW–SE (the Gulf of Suez or Red Sea trends).
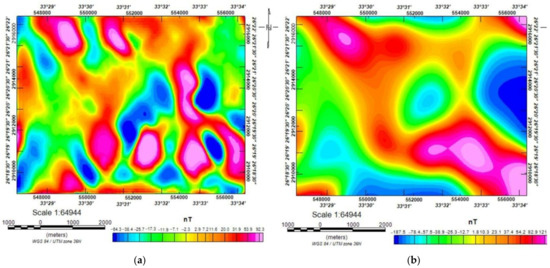
Figure 7.
(a) High-pass-filtered (residual) map of the study area. (b) Low-pass filtered (regional) map.
Deep-seated magnetic abnormalities can be seen on the regional (low-pass) magnetic map (Figure 7b). Deep structural patterns in the NW–SE, NE–SW, N–S, and E–W axes impact the region. The values of these magnetic anomalies range from 121.2 to −187.6 nT. Low magnetic anomalies (green and blue colors) are connected to the sedimentary cover and weakly deformed calc–alkaline rocks, and they extend in NW–SE and E–W directions. High magnetic anomalies (yellow, red, and pink colors) are related to the presence of the ophiolitic assemblage and metavolcanic rocks, and they extend in NE–SW and S–N directions.
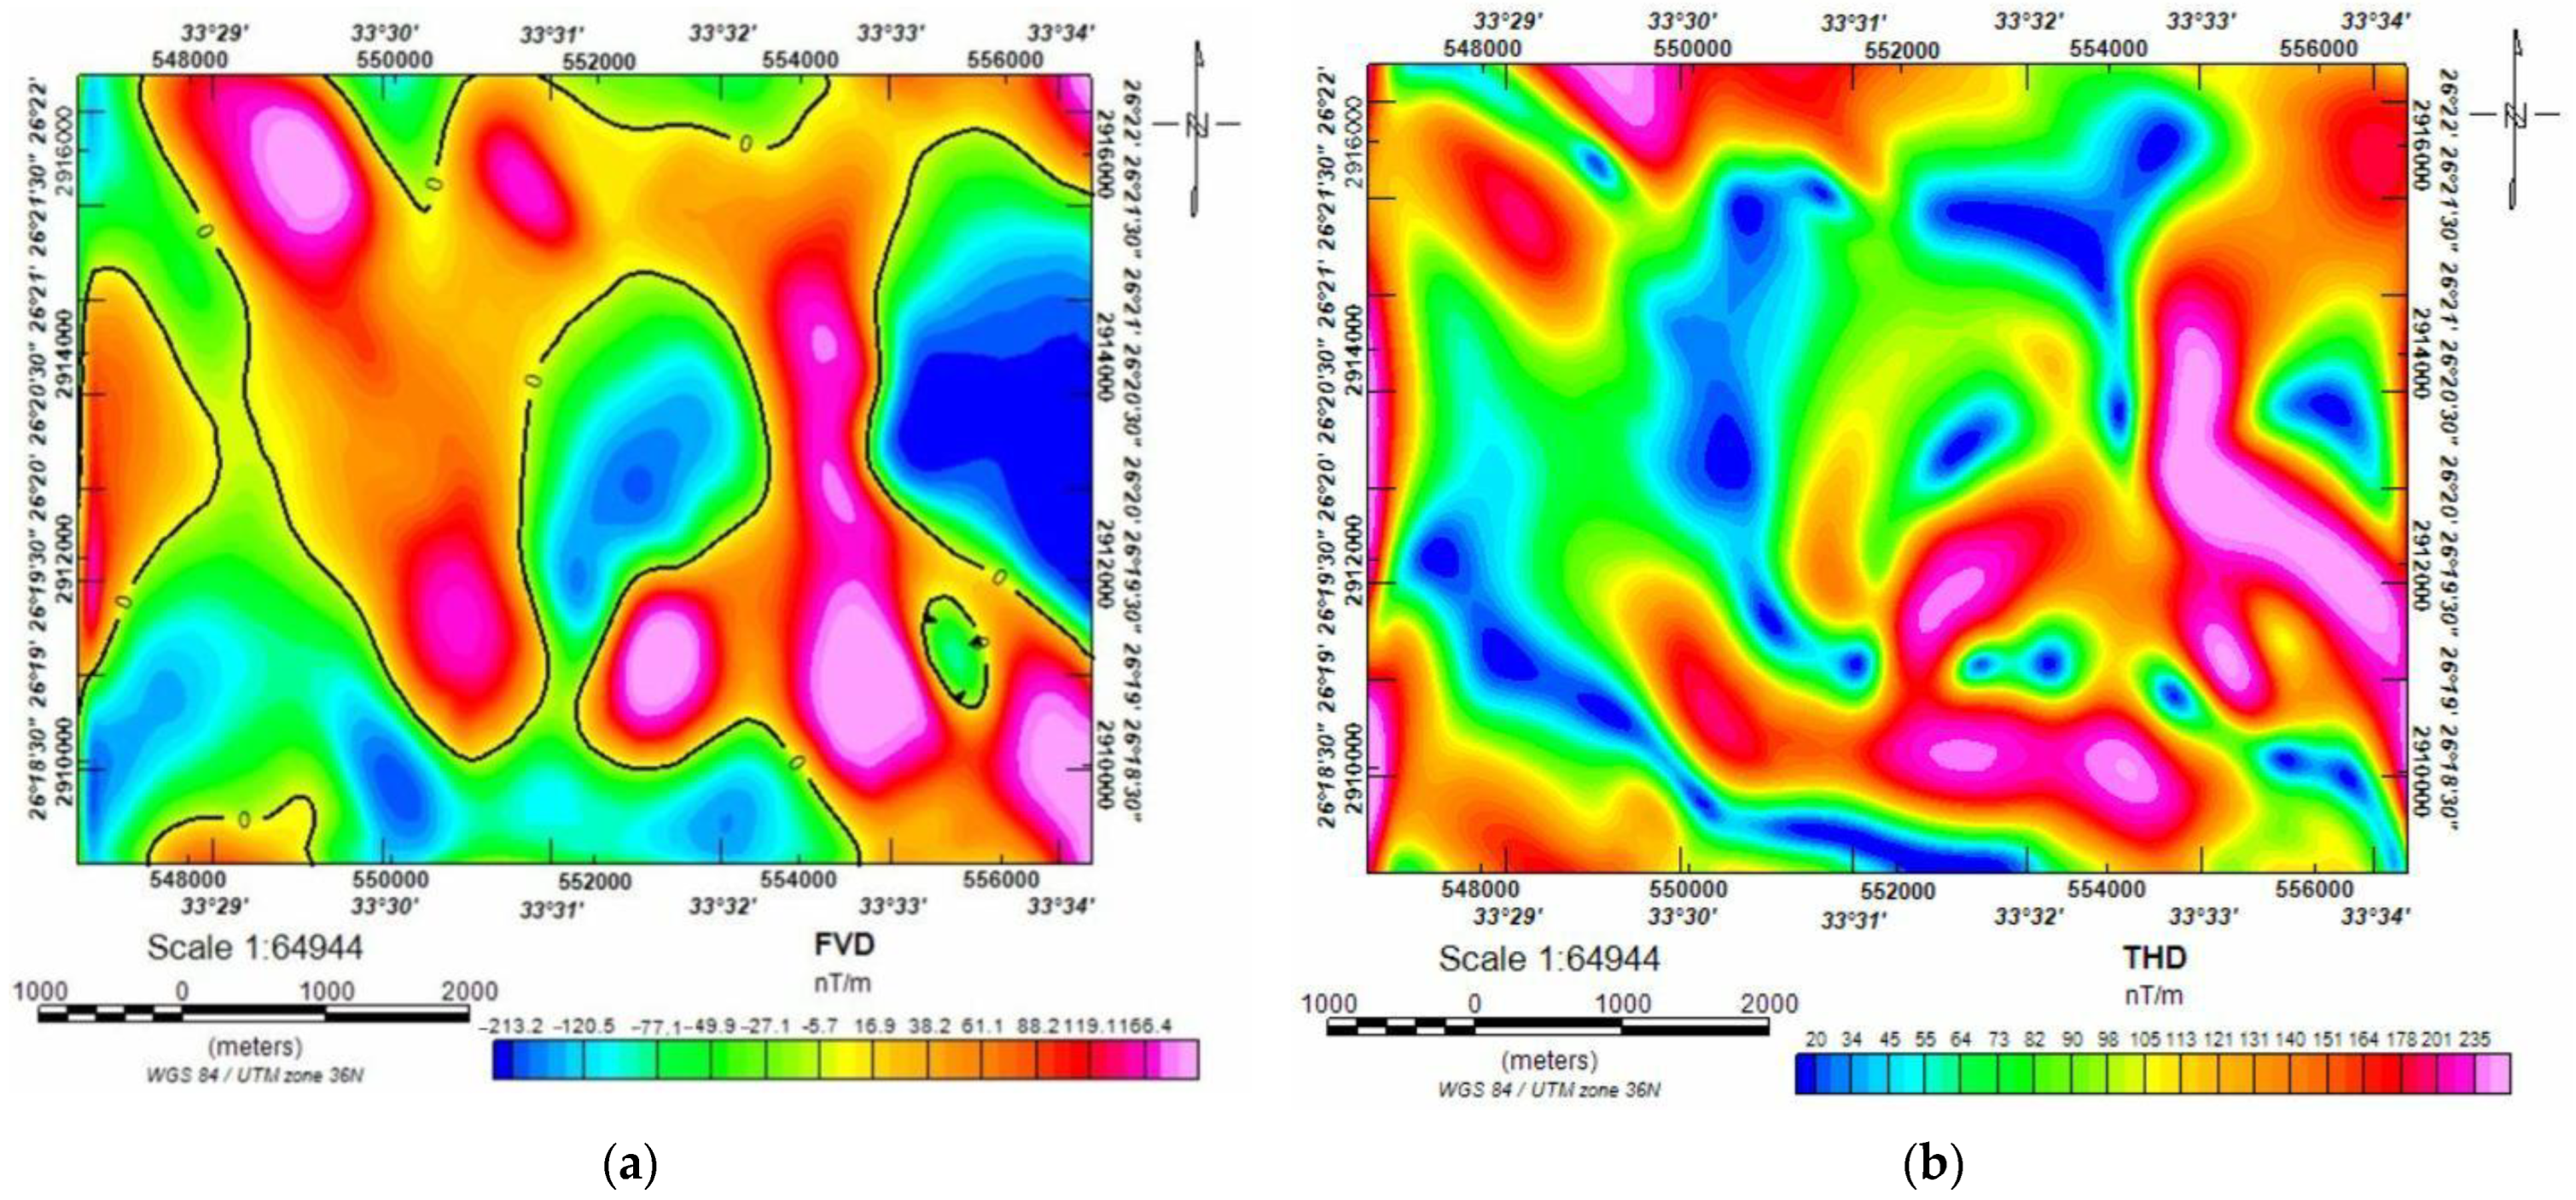
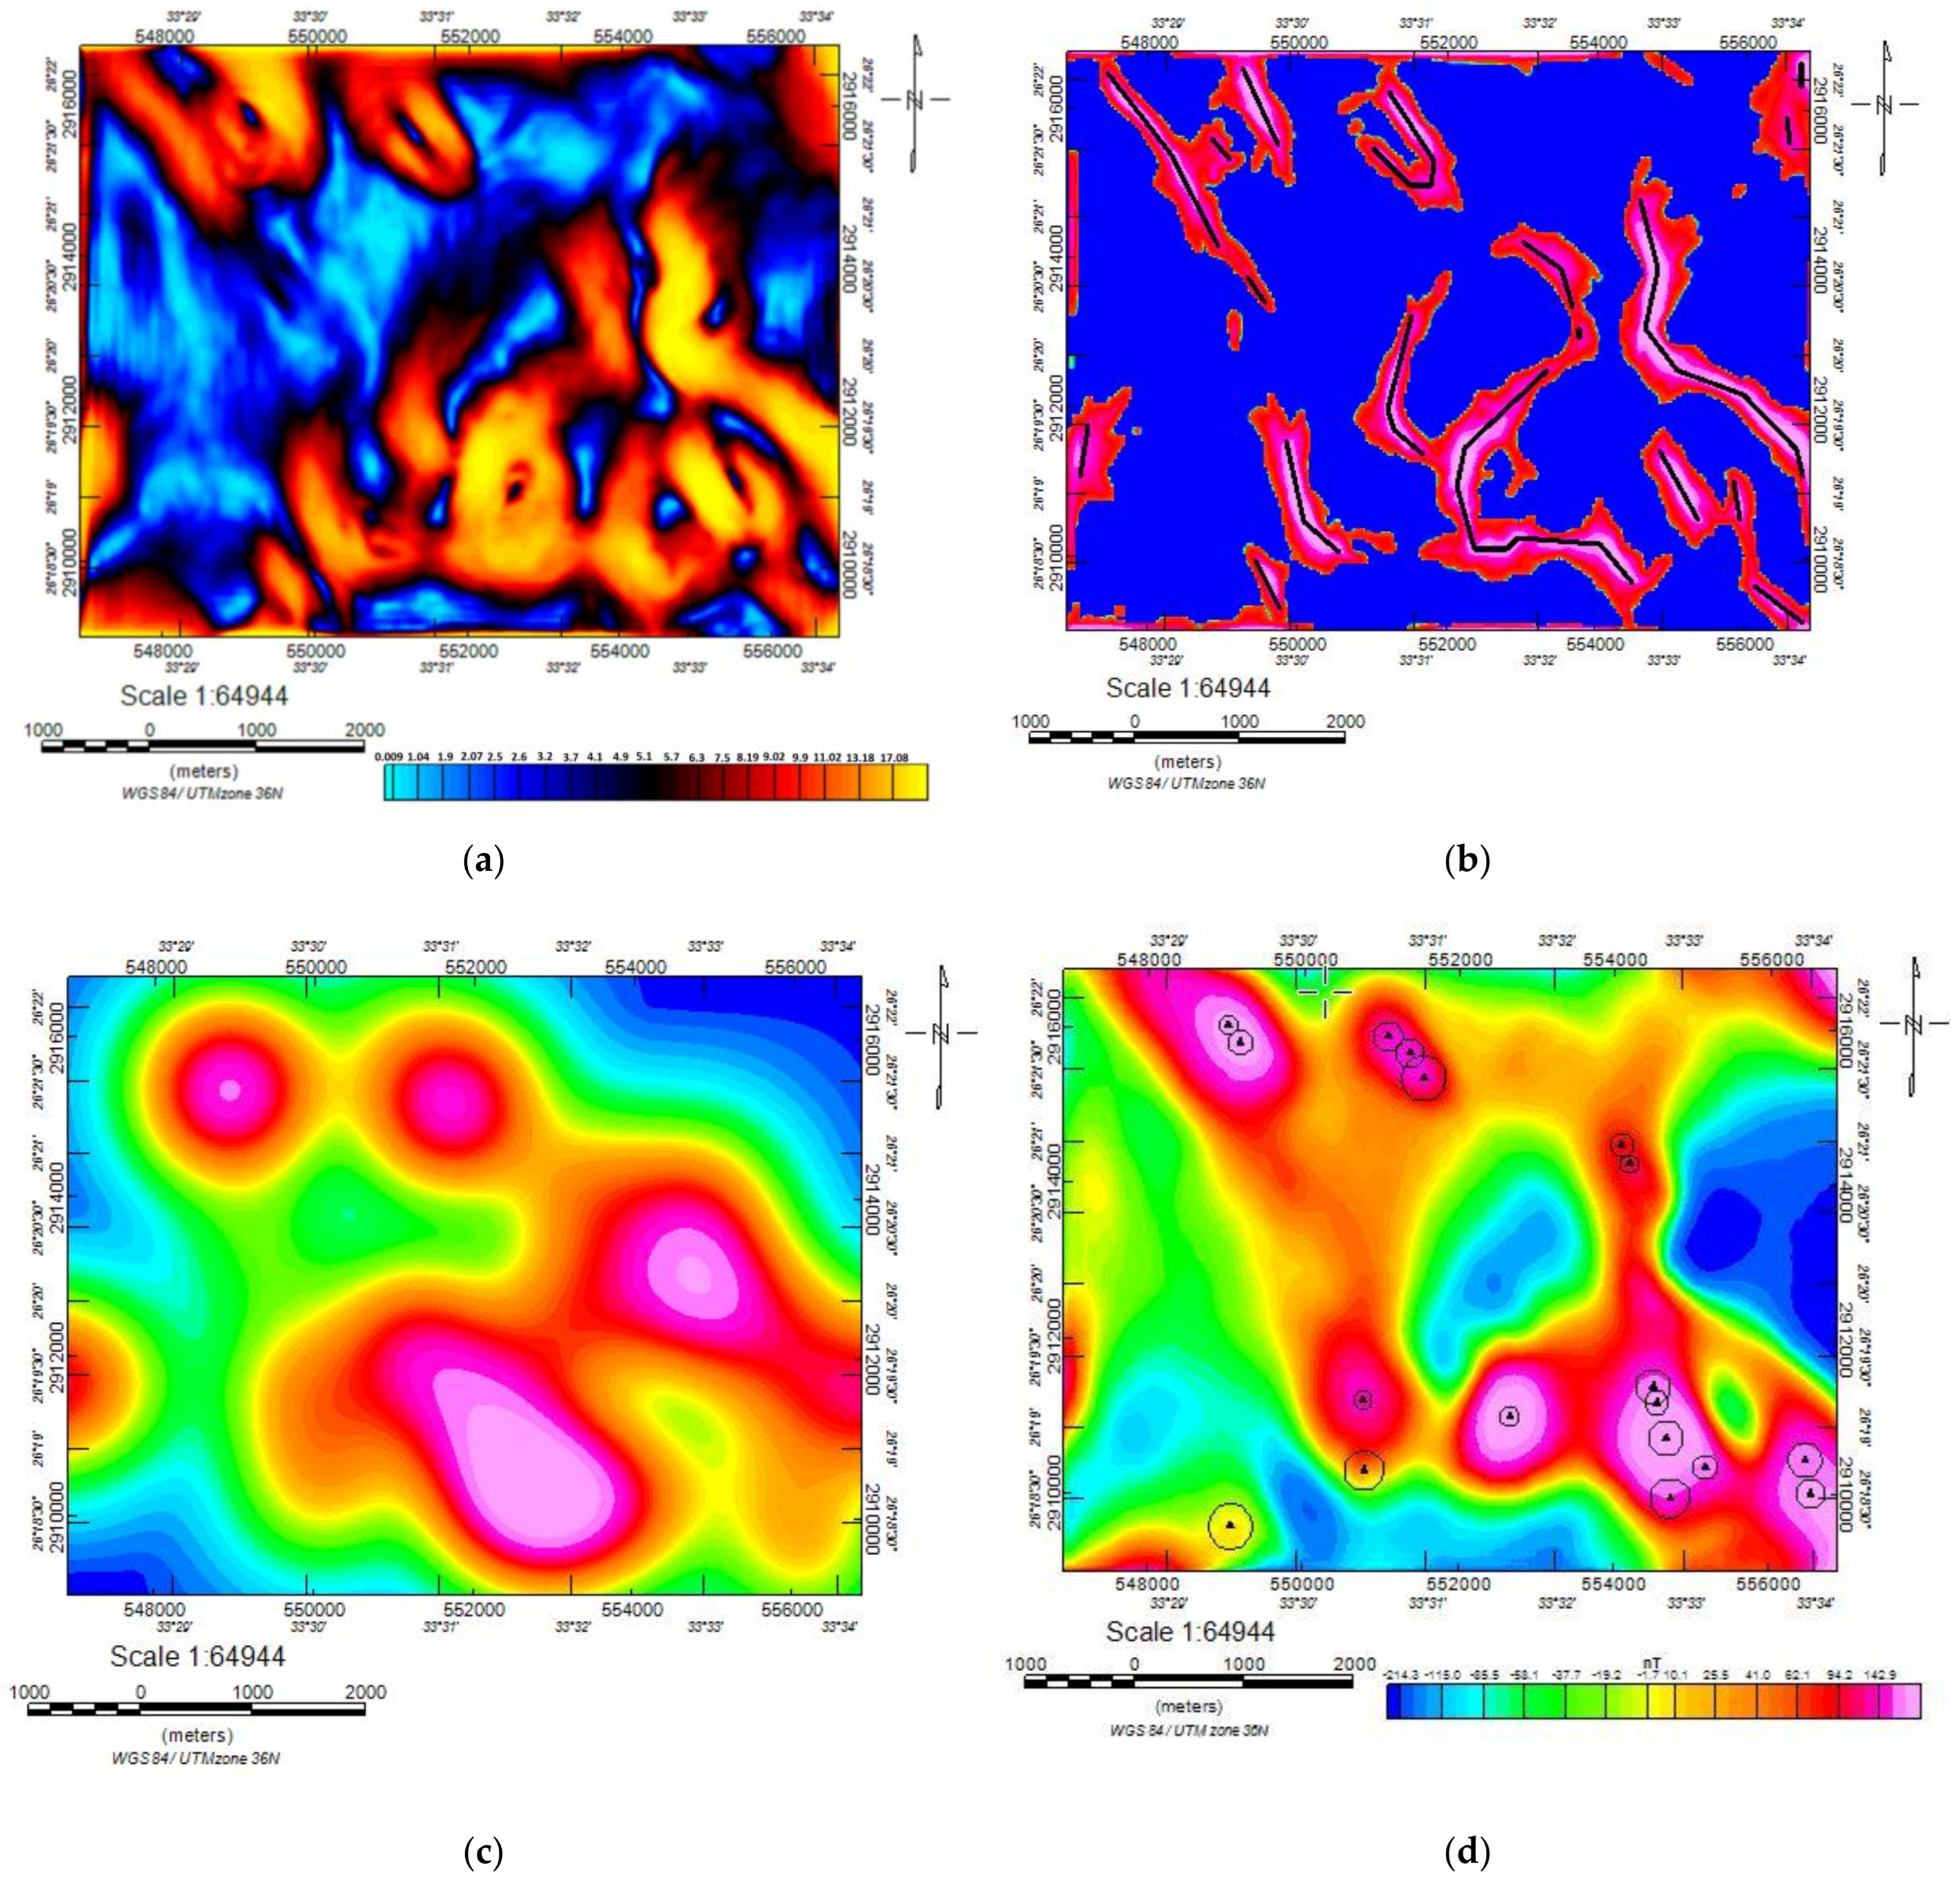
The FVD map (Figure 8a), in which the filter accentuates the short-wavelength anomalies associated with shallow sources, displays shallow structures, including faults/contacts. Interestingly, these anomalies fill the northeastern and northwesterly parts of the investigated area, indicating a relatively shallow depth for the underlying sources, which correspond to the ophiolitic assemblage and metavolcanic rocks. In contrast, for the western, central, and southern parts, we can infer deeper origins congruent with a sedimentary cover, metasediments, and calc–alkaline rocks. A brief glance at the map indicates that the region has a NE–SW tendency, and the directions that correspond to it are NW–SE, E–W, and N–S.

Figure 8.
(a) First-order vertical derivative (FVD) map of the research area. (b) Total Horizontal Derivative (THD) map.
We used the THG approach to identify the borders separating the region’s common rock units, with abrupt gradients appearing across fairly steep contacts between units with differing magnetic characteristics [62,63]. The anomalies vary in magnitude from 19.7 to 236 nT/m (Figure 8b). Significant anomalies run NW–SE, NE–SW, and N–S, corresponding to the main structural trend, which monitors the mineralization in the research area. The THG map identified the locality of the alteration zones, which is conformable with other approaches.
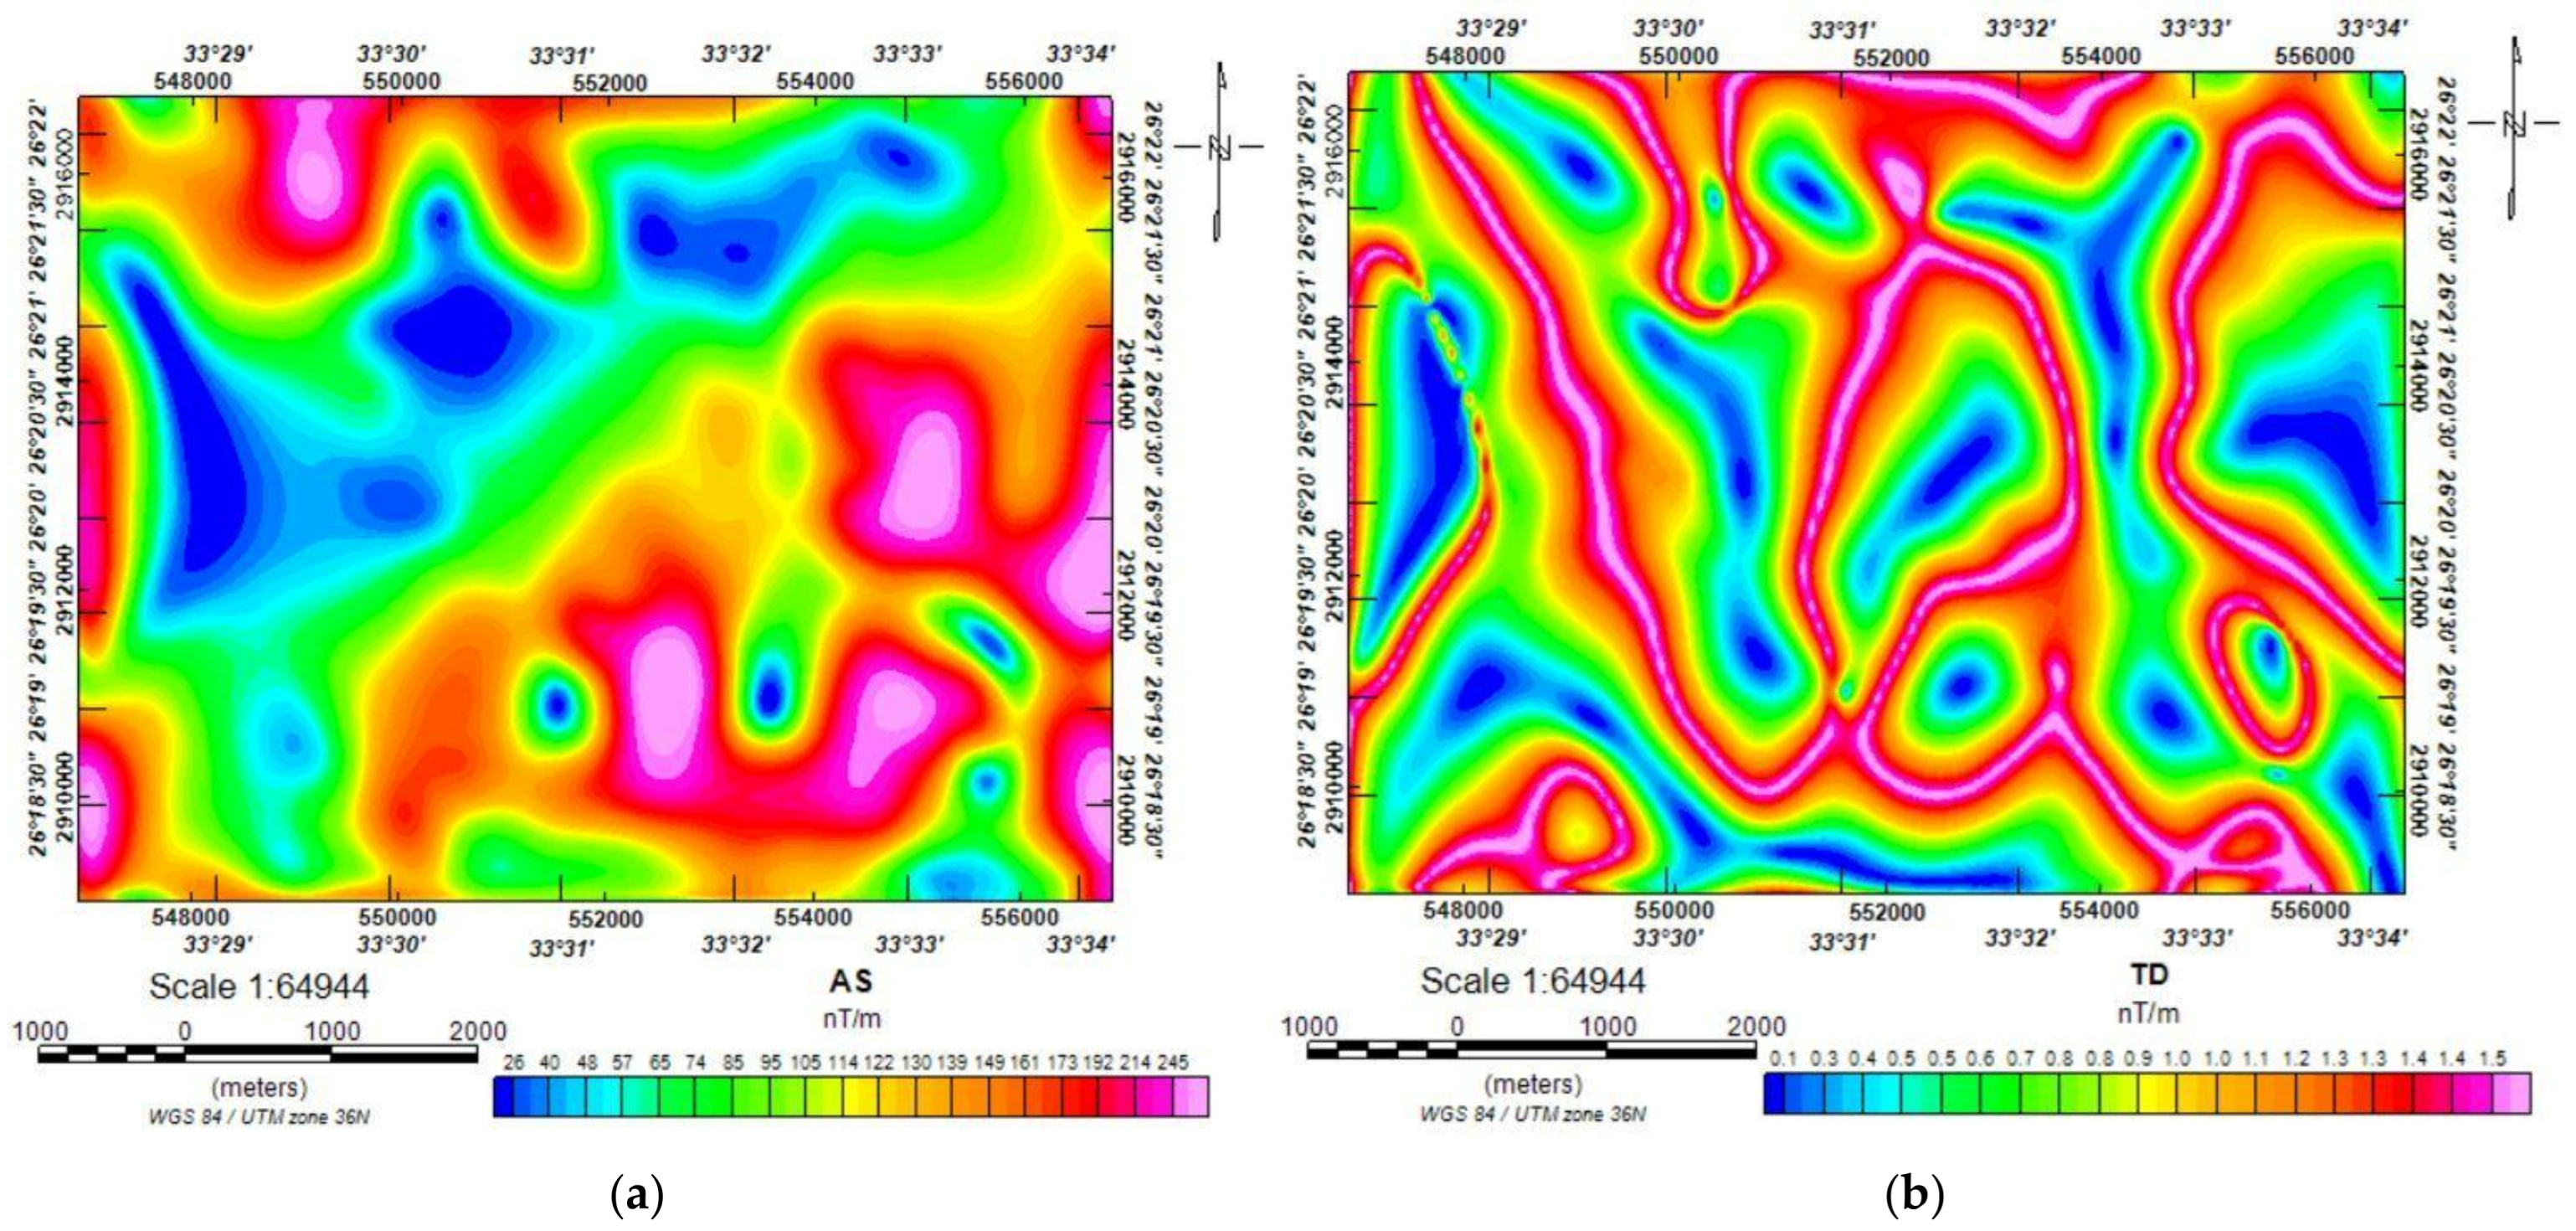
A detailed AS map is shown in Figure 9a. The trends in this map, which correspond to the mineralization within the research area, are NW–SE, NE–SW, and N–S.
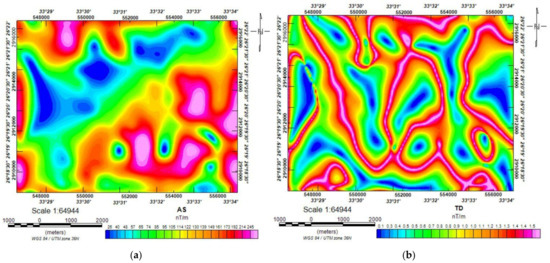
Figure 9.
(a) Map of the analytical signal (AS) of the research area. (b) Tilt-derivative (TD) map.
The calc–alkaline and sedimentary deposits of the region’s northern, western, and northwestern areas exhibit low magnetic values (shown in blue; 26.3–104.7 nT/m), a symptom of demagnetization. Conversely, in the eastern, southern, northwestern, and western regions, ophiolitic basic, ophiolitic assemblage, and metavolcanic rocks are associated with high magnetic anomalies (shown in pink; 118–265.9 nT/m). Compared to the southern and northwestern regions of the RTP map (Figure 5b), the AS algorithm highlights changes that are immediately noticeable close to the borders of the ophiolitic serpentinite region.
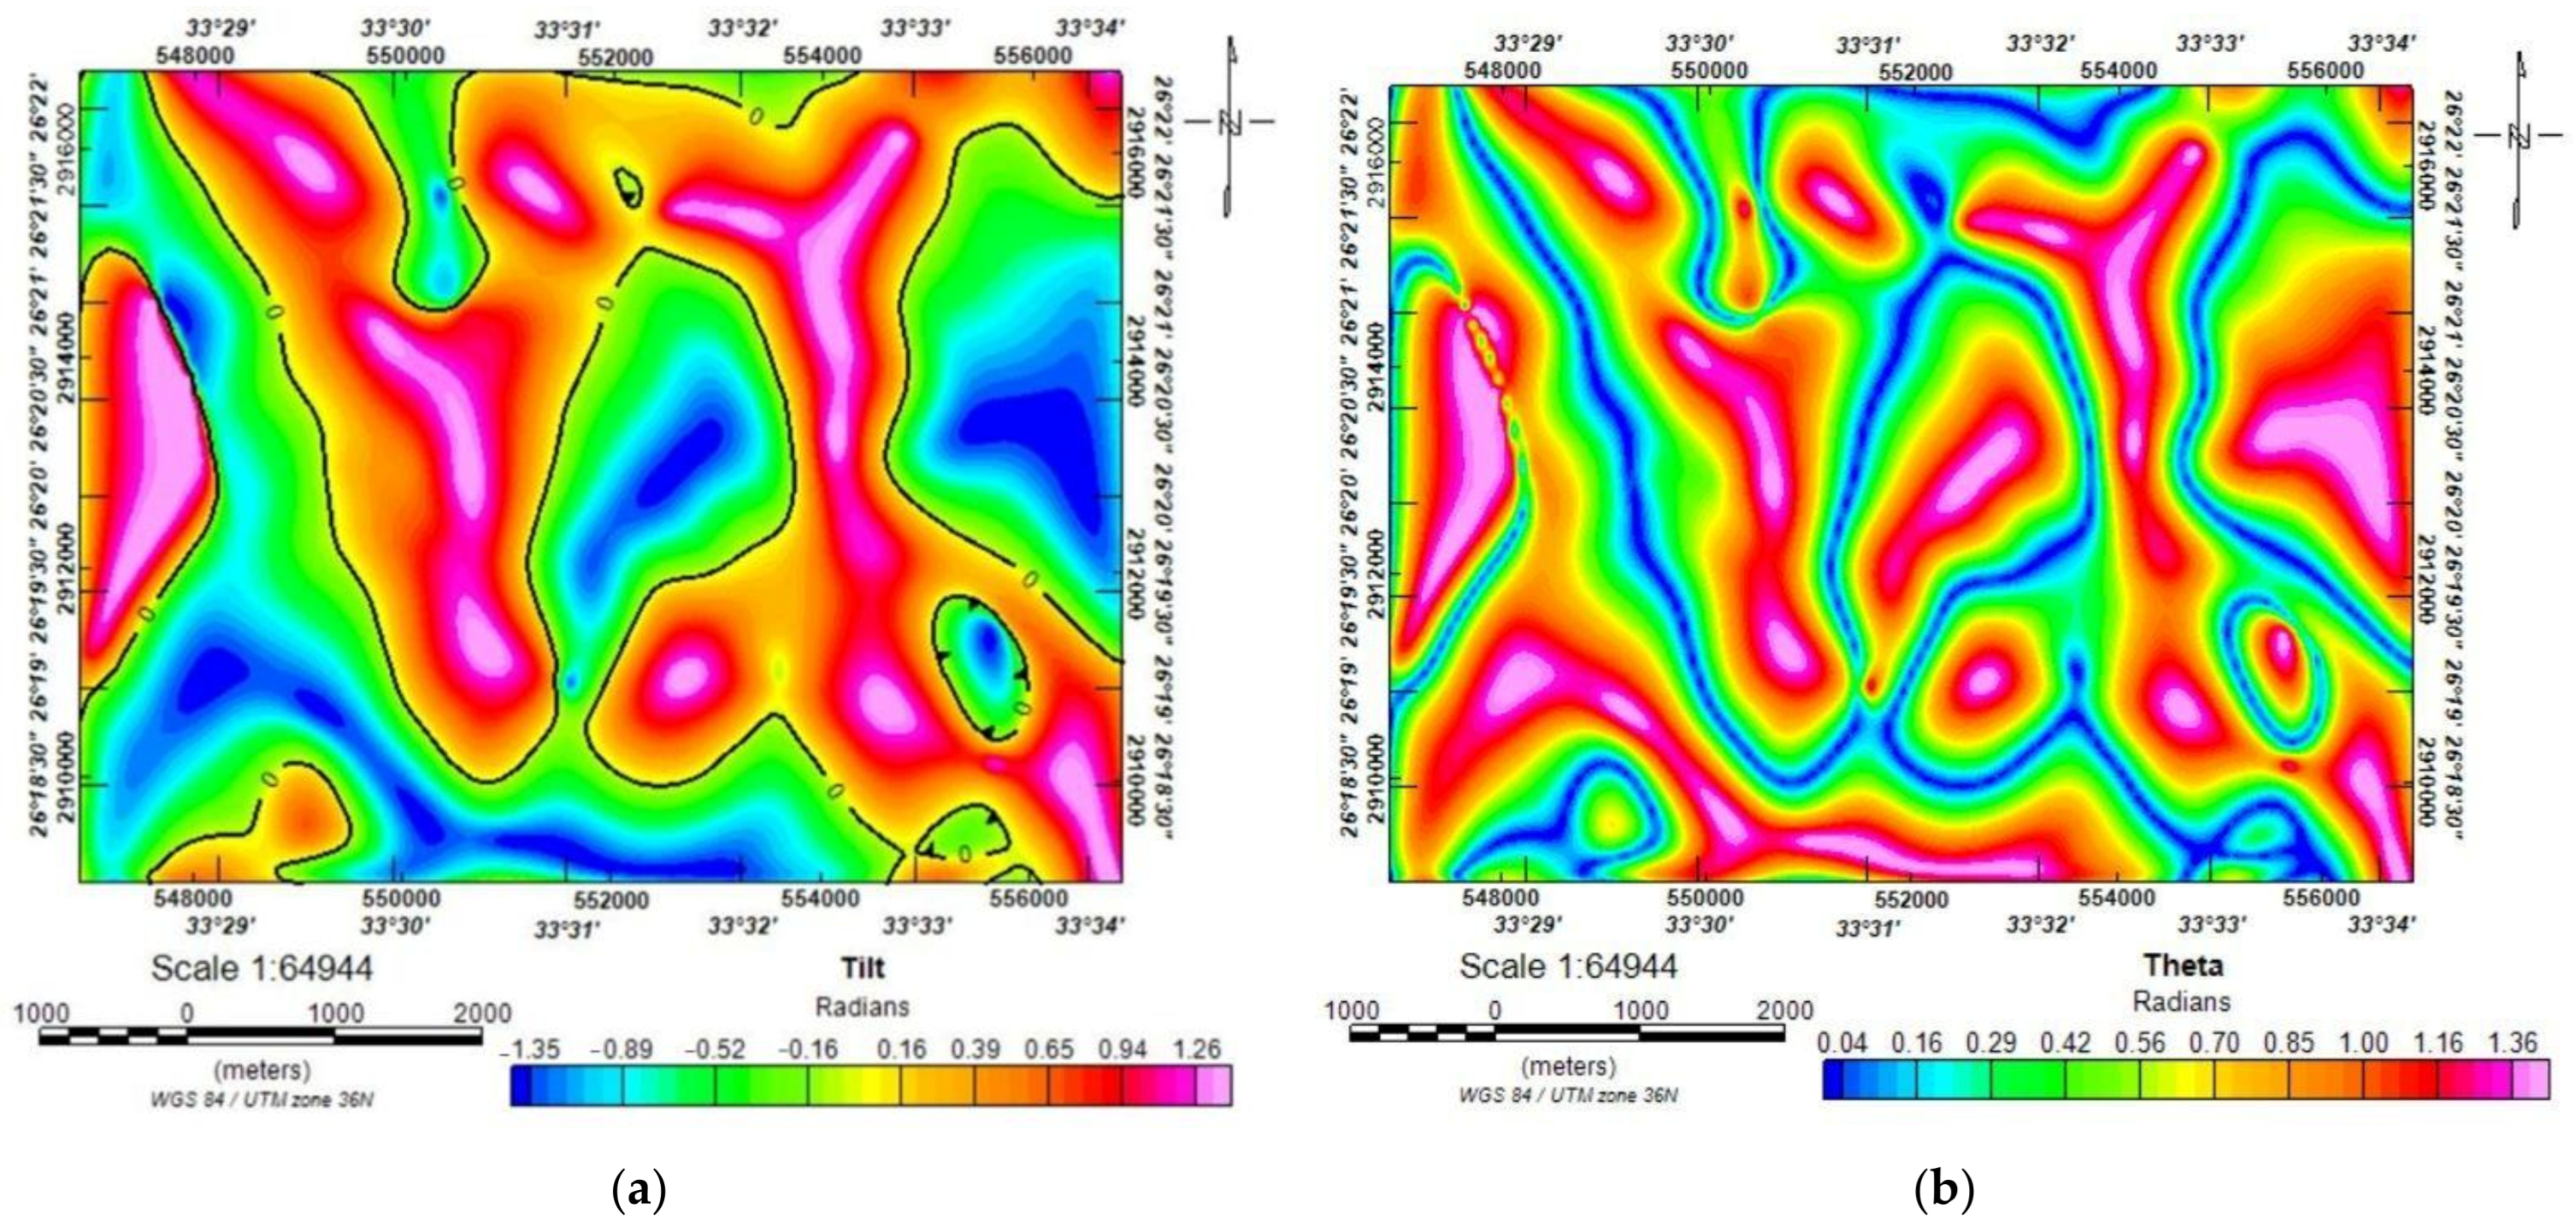
The TD anomalies range in magnitude from 0.1 to 1.5 radians (Figure 9b). The zero-contour value on the TD map essentially defines subsurface lineaments. It displays the same lineament trends as the FVD map, which are oriented NE–SW, NW–SE, E–W, and N–S. The borders of possible structures can also be identified using a TA map (Figure 10a). The NW–SE, NE–SW, and S–N structural tendencies are all present.

Figure 10.
(a) A tilt angle (TA) map of the study area. (The boundaries of anomalous sources are considered to be in vertical contact as a result of the zero contours). (b) A Theta map.
On the other hand, the Theta map of the study region shows the tilt angle map’s opposing amplitudes (Figure 10b). The Theta and TA maps both play roles in synchronizing and balancing between tiny and big amplitudes.
To discriminate laterally continuous lines, we employed successive maps with standard deviations (Figure 11a), which we assume to be the magnetic variance. We used the CET grid-analysis approach to detect linear structures in the aeromagnetic data. We subsequently applied amplitude thresholding to reduce the background and noise signals and enhance the resulting lineaments. By figuring out the axes of symmetry, phase symmetry can be used to locate patterns that resemble lines (Figure 11b). These linear features can be mapped using phase symmetry, which helps to clarify critical trends and lineations. By identifying favorable zones, we used this method to enhance mineral exploration; in this instance, we used just the advantageous characteristics. Ophiolitic rocks, sediments, and other geological units are clearly delineated here. We used amplitude thresholding to reduce background noise and signal strength. We then used skeletonization to thin the retrieved linear features. We transformed the skeleton, which includes the extracted linear properties, into lineaments, as demonstrated by the magnetic-lineaments map (Figure 11b). The identified prospective areas are derived from the patterns established by the CET grid approach in the NW–SE, NE–SW, N–S, and minor E–W structures. Zones with altered sediments are geologically related to ophiolitic assemblage rocks, which are favorable mineralization zones (Figure 11b).
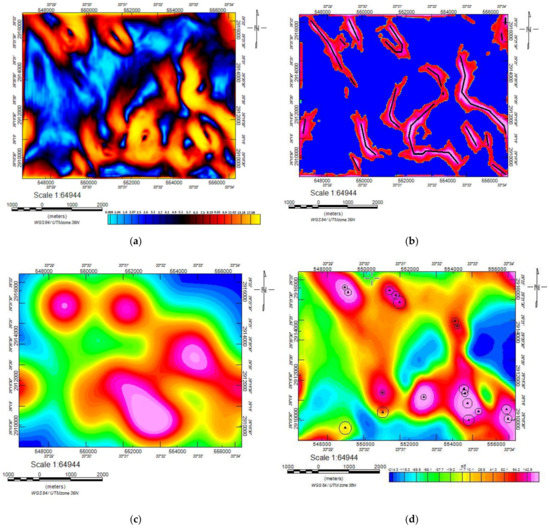
Figure 11.
(a) Standard-deviation map. (b) Phase symmetry map; the black lines are the faults inferred by the CET approach. (c) Figure illustrating the OE map. (d) The circular-boundary porphyry tracing (black circles and triangles) is overlaid on the RTP map of the research region.
We also employed an orientational entropy (OE) map of the structural complexity of the region to show the porphyry properties (Figure 11c). High levels of statistical unpredictability, and hence high levels of structural complexity, are thought to be present in high-entropy zones. This map displays areas with differently oriented zones. Most of these properties are shared by basic ophiolitic metavolcanic rocks and the ophiolitic assemblage. Since the NE–SW and NW–SE directions of these deposits are more common, more ore is likely to be deposited there.
One effective method for finding the porphyry features is the CET porphyry analysis. Using a boundary-mapping plugin, new porphyry-like features can be highlighted during a CET porphyry investigation. This tool uses the outputs from the Central Region Detection and Amplitude Difference Transform plugins, which offer recognized porphyry-center locations and generates circular traces around them. We superimposed this circular boundary tracing on the RTP map (Figure 11d), and the results indicate that the research region has a considerable number of probable porphyry-mineral deposits. These zones are found almost exclusively in the northern, eastern, and southern Rodruin gold-mine site, stretching in the NE–SW, N–S, and E–W directions. The CET approach is crucial for identifying potential locations for mineralization when favorable locations for porphyry and metal ores are located on the RTP map (Figure 11d), and they are structurally controlled by the lineaments detected by the vectorization lineaments map (Figure 11a).
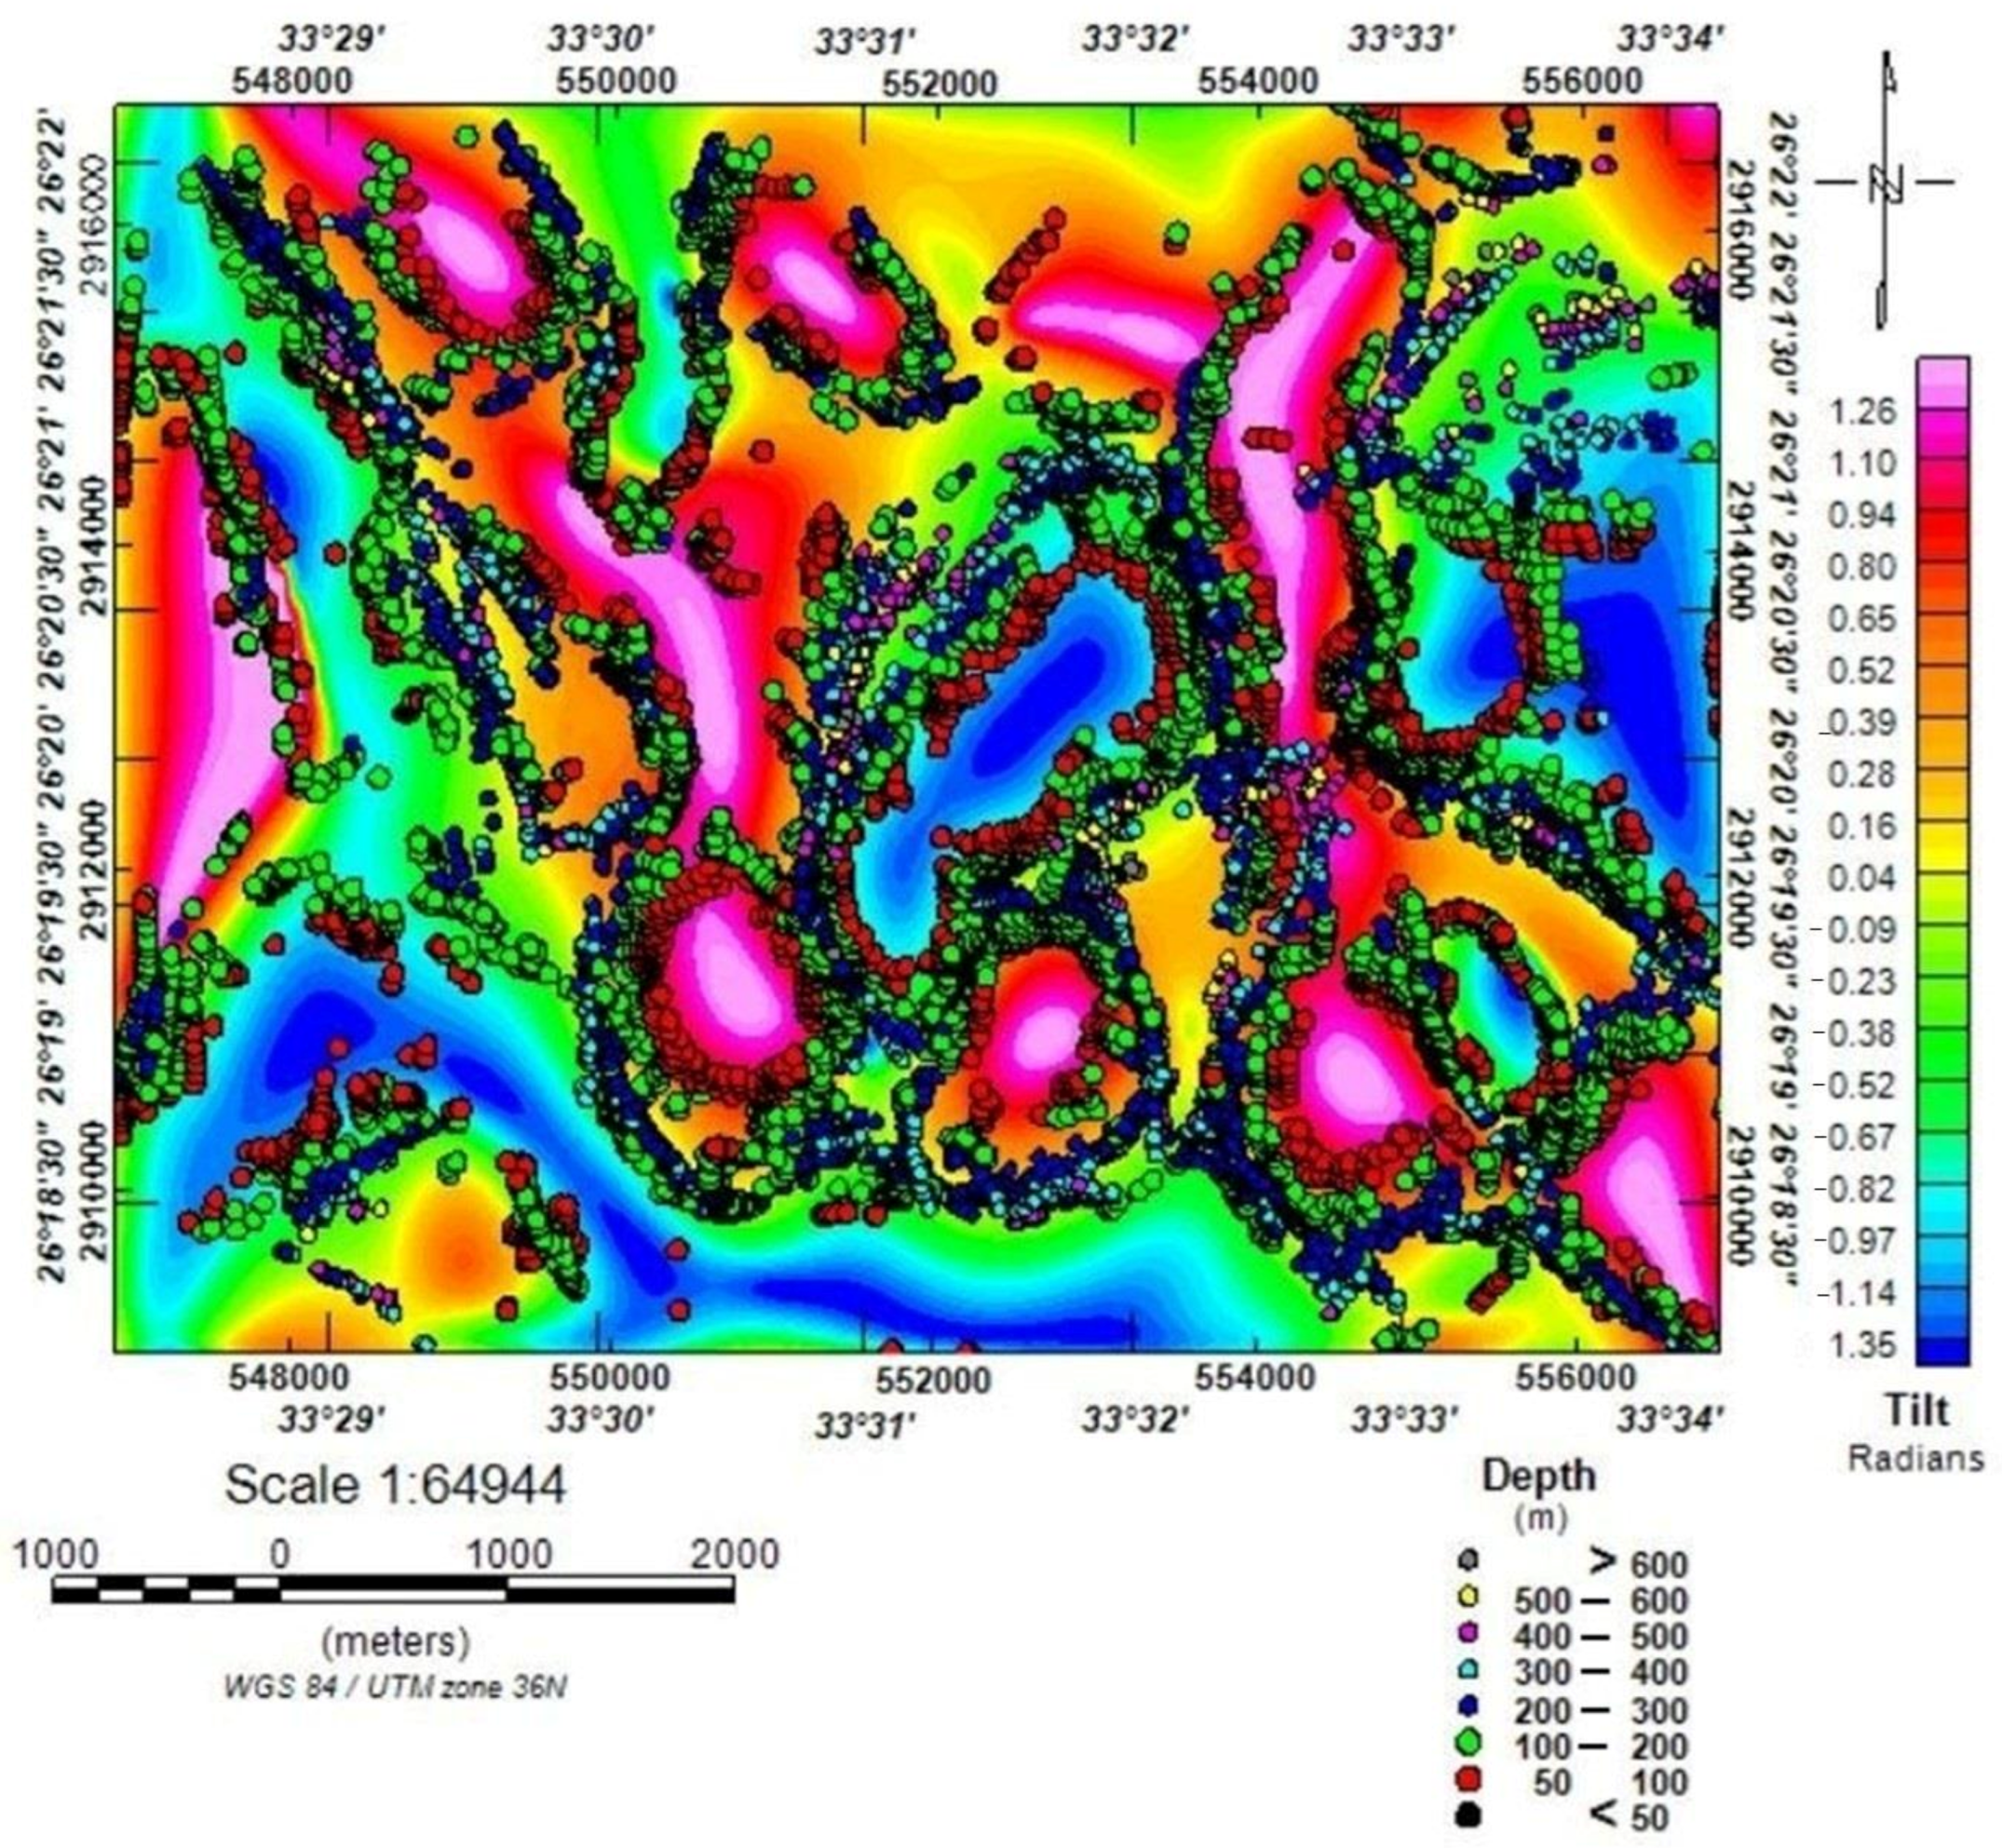
By employing SI = 0, the RTP grid applies the Euler deconvolution (ED) approach to calculate the lateral extent and depth of the magnetic resources (Figure. 12). The resulting ED map (Figure 12) demonstrates that the depths of the magnetic sources’ depths range from less than 50 m to roughly 600 m. These sources are oriented in the NE–SW, NW–SE, N–S, and E–W directions.

Figure 12.
ED solutions map of the study area using SI = 0 obtained from RTP magnetic map. The solutions are superimposed on the zero contours of the TA map.
The source sites identified using ED are compatible with the zero contours of the TAD map, as shown by Figure 12. Consequently, by comparing the ED and TAD results, we have obtained an understanding that is adequate for pinpointing the horizontal locations and borders of the magnetic-source bodies. The ED analysis virtually confirms the TAD findings, which are based on the hypothesis that vertical connections produce the margins of anomalous sources.
Aeromagnetic tools are efficient and appropriate geophysical techniques for us in inspecting mineralization, alteration, and promising exploration zones [42,43,44,45,46,47]. Several articles have examined the connection between gold mineralization zones and magnetic intensity [8,15,64]. In the present work, we determined the structural patterns and/or shear zones that govern and indicate mineralization areas using magnetic data and numerous methodologies. To understand better the past forces that have influenced the region, an interpretive context is needed to identify the main hydrothermal-alteration zones, fracturing, and fault systems. Tracing the lineaments from magnetic maps involves using the RTP, FVD, THD, AS, TD, TA, Theta, regional, and residual maps, as well as CET grid analysis.
The primary tectonic trends that affect the research region are oriented N–S, NE–SW, NW–SE, and E–W, while the main trends identified from the geological map are in the NW–SE, NE–SW, NNE–SSW, NNW–SSE, and E–W directions [30,39] (Figure 13). The island-arc rock groups, which include metasedimentary and metavolcanic layered units, and the ophiolitic rocks are divided by thrust faults that extend NE–SW and NEE–SWW and dip NW [65]. The East African trend, which can be seen as an ongoing direction of dike intrusion and faulting in Egypt, is congruent with the N–S trend. Due to the edge detection filters and the CET procedures that we used, based on the characteristics of the magnetic data, every edge detection filter has advantages and drawbacks of its own [22]. We found three separate alteration zones in the study area. The first alteration zone lies south of the Rodruin mining area and extends in the E–W direction. The second alteration zone runs in the S–N direction and is located east of the gold-mining regions. Finally, the third alteration zone runs NW–SE and is located northwest of the Rodruin mining area.
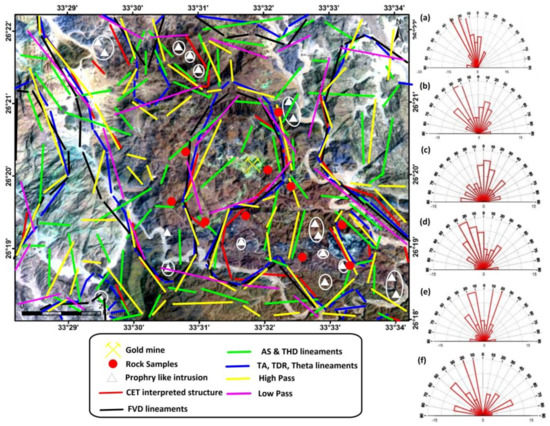
Figure 13.
This map shows the faults, contacts, and dykes beneath the surface of the region under study from (a) the CET grid analysis, (b) FVD, (c) AS and THD, (d) TA, Theta, and TD, (e) the high-pass, and (f) the low-pass maps. The rose diagrams display the primary and minor trends of the subsurface lineaments.
4.2. Geochemical Sampling Surveys
We performed geochemical analyses of rock samples collected along the mapped lineaments derived from the airborne magnetic data (Figure 13). The main aim of these studies is to constrain the geophysical results and detect occurrences of Au, Ag, and sulfide ore deposits. The geochemical investigations included the following steps:
4.2.1. Petrography and Mineral Chemistry of Silicates in the Host-Rock and Ore Samples
Our petrography and mineral-chemistry studies focused on fresh primary silicates (e.g., clinopyroxene and plagioclase) from the Wadi El-Saqia metabasalts, which represent the ore deposits’ host rock. Metabasalts are greenish-gray to black, massive, and exhibit a seriate–porphyritic texture (Figure 14a,b). They are essentially composed of plagioclase and clinopyroxenes (augite), with subordinate opaque minerals embedded in a fine-grained groundmass of the same minerals. Plagioclase occurs in the form of prismatic to sub-prismatic phenocrysts, sometimes partially altered to epidote (Figure 14a). Augite phenocrysts are usually varied in size, form euhedral and subhedral shapes, and are partially altered to chlorite (Figure 14b). Opaque minerals are found as disseminated, euhedral–to–subhedral magnetite that shows irregular contact with sulfide (mainly pyrrhotite) (Figure 14b,c). Clinopyroxenes (Cpxs) have augite composition (En36.24–40.26, Wo42.01–43.39, and Fs17.73–20.71; Table S1 [66]), with low Mg#, varying from 0.65 to 0.7 wt%, indicating that they originated from a more differentiated magma. The low TiO2 (0.18–0.37 wt%) and Na2O (0.18%–0.35 wt%) (Table S1) contents are typical of igneous Cpxs, suggesting a sub-oceanic origin from non-alkaline rocks [67,68]. The plagioclase composition in the Wadi El-Saqia metabasalts ranges from labradorite (An61.19–63.58) in fresh samples to albite (Ab 93.44–94.39) in altered samples, indicating spilitization of these samples (Table S1).
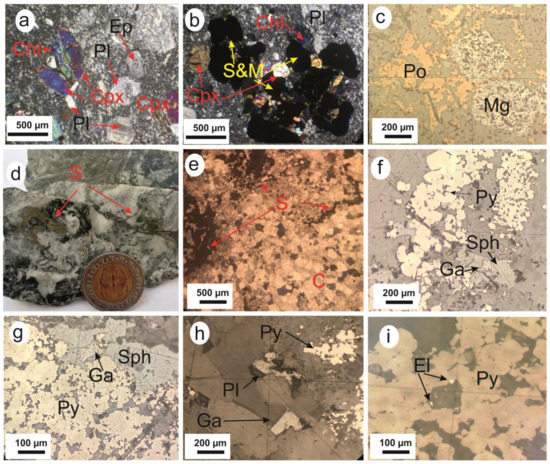
Figure 14.
(a) Mineral composition of metabasalt, showing clinopyroxene (Cpx) and plagioclase (Pl) phenocrysts, with chlorite (Chl) and epidote (Ep) as secondary minerals, embedded in a fine groundmass with porphyritic texture. (b) Clinopyroxene and plagioclase phenocrysts with opaque aggregates of sulfides and magnetite set in a fine groundmass. (c) Anhedral grains of pyrrhotite (Po) and euhedral magnetite (Mg). (d) Slab of carbonate rock with sulfide (Slf) veinlets from the core sample. (e) Sulfide (Slf) veinlets in carbonates (C). (f,g) Irregular contact between pyrite (Py) and sphalerite (Sph). (h) Isolated anhedral polybasite grains hosted in carbonate minerals. (i) Electrum (El) specks at the boundary of pyrite and carbonate minerals and as inclusions in the latter. (a,b,e) are ordinary optical microscope photos; (c,f–h,i) are reflected-light microscopy photos.
The sulfide minerals in the Wadi El-Saqia metabasalts were found as fine disseminations of anhedral pyrrhotite that were primarily located in contact with magnetite (Figure 14c). The only appearance of pyrrhotite in metabasalt suggests a low sulfur activity (aS2) and low oxygen fugacity (fO2) of their parental magma [69]. On the other hand, the semi-massive sulfide mineralization hosted in the Wadi El-Saqia carbonates was found as fracture-filling veinlets that alternate with carbonates (Figure 14c,d). They are represented mainly by pyrite with subordinate sphalerite and minor galena, in addition to the associated precious metals (gold and silver).
Pyrite is present as a significant constituent of semi-massive sulfide mineralization. It is found as aggregates filling deformed fractures in carbonates and/or as patches (Figure 14d–g). Chemically, pyrite is characterized by variable S and Fe content (50.31–52.80 wt% and 44.32–46.28 wt%, respectively), with low concentrations of Zn (0.01–0.10 wt%), As (0.01–2.14 wt%), Cu (0.05–0.07 wt%), Ag (0.03–0.55 wt%), and Au (0.01–0.09 wt%) (Table S2). Sphalerite ranks second in abundance and occurs either as anhedral patches, small veinlets filling carbonate fractures, or as micro inclusions in pyrite that, in turn, host inclusions of galena (Figure 14f,g). Sphalerite has narrow concentration ranges of Zn (66.01–67.74 wt%), Fe (0.44–0.65 wt%), and S (32.78–33.43 wt%), as well as low concentrations of Ag (0.01–0.06 wt%) and Se (0–0.01 wt%). Its Cd content ranges from 0.31 to 0.35 wt% and has Zn/Cd ratios, ranging from 189.14 to 213.81 wt%, suggesting magmatic–hydrothermal deposits [70]. (Table S2). Galena occurs as fine anhedral to subhedral inclusions hosted in sphalerite (Figure 14f,g). Chemically, the Pb concentration in galena ranges from 86.12 to 87.16 wt%, and the S concentration is in the range of 12.11–13.11 wt%. Galena also contains small amounts of Cu (0.01–0.1 wt%), Zn (0.01–0.07 wt%), and Ag (0.03–0.13 wt%) (Table S2). Polybasite is found as fine, isolated, anhedral grains enclosed in Wadi El-Saqia carbonate rocks (Figure 14h). Chemically, Ag, S, Cu, Sb, and As are the main constituents of polybasite (Table S2). The Ag concentration ranges from 65 to 71.15 wt%. The S, Cu, Sb, and As concentrations range from 13.89 to 16.09, 6.20 to 8.74, 4.48 to 8.42, and 1.67 to 3.13 wt.%, respectively (Table S2). Electrum is usually associated with pyrite, either as inclusions or on its boundaries (Figure 14i). The major constituents are Au (53.95–55.01 wt%) and Ag (40.85–42.21 wt%). At the same time, Fe, Cu, and S are found in trace amounts (Table S2). Pyrrhotite is a minor, sulfide mineral hosted in metabasaltic rocks with magnetite (Figure 14c). It is composed mainly of Fe (60.45–61.5 wt%) and S (37.55–38.1 wt%), with trace amounts of Au (0.12–0.14 wt%) (Table S2).
4.2.2. Geothermobarometry and the Tectono-Magmatic Setting
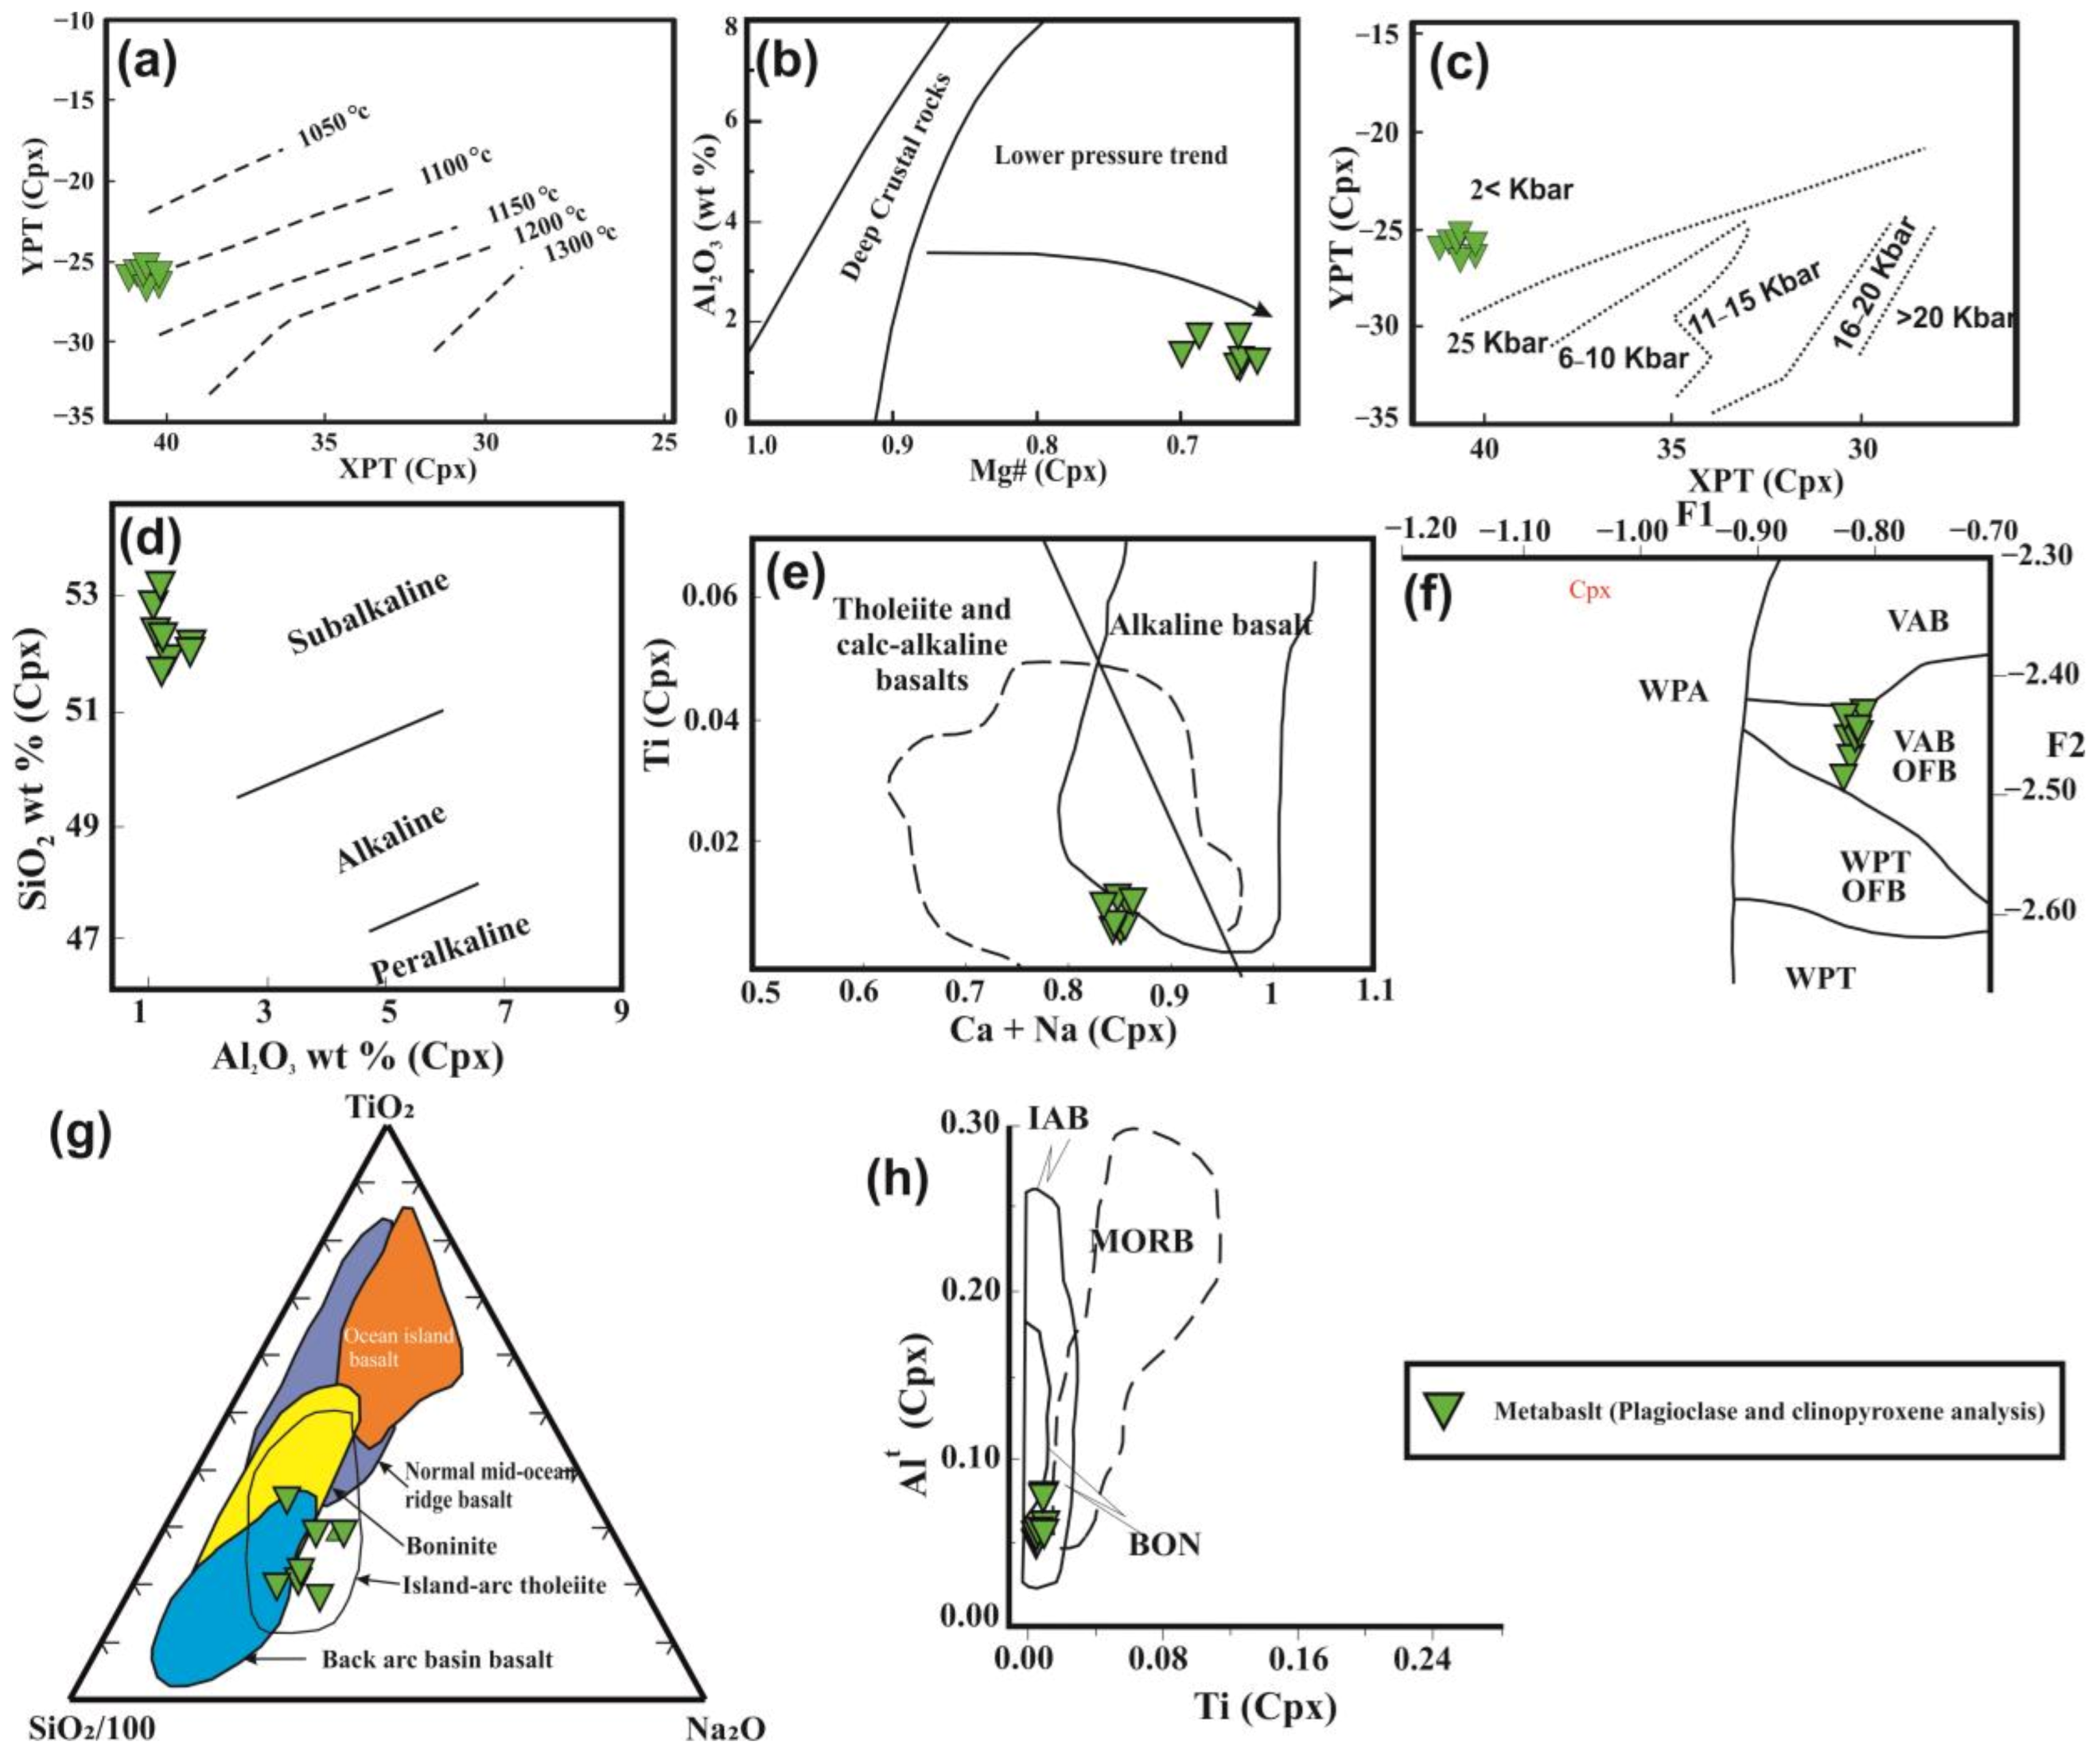
The crystallization conditions of the Wadi El-Saqia metabasalts can be determined from the compositions of the plagioclase and Cpx minerals [71]. The Cpx thermometers [72] indicate a low crystallization temperature, T ~ 1100 °C (Figure 15a); in addition, the high Al2O3 and low Mg# are similar to those of fractionated primary basaltic magma [73,74]. By using diagrams of Al2O3 versus Mg# and YPT versus XPT (Figure 15b and Figure 15c, [75] and [72] respectively) for Cpx, we found that the crystallization pressures P follow a low-pressure differentiation trend, with pressures <2 kb, suggesting that the present metabasalts formed in an extension environment.

Figure 15.
(a) YPT versus XPT diagram for the clinopyroxene crystallization temperature [72]. (b) Al2O3 (wt%) vs. Mg# diagram for Cpx [75]. (c) YPT versus XPT diagram for Cpx crystallization pressure [72]. (d) SiO2 vs. Al2O3 diagram for Cpx [67]. (e) Ti vs. Ca + Na diagram for Cpx [76]. (f) F1 vs. F2 diagram for Cpx [77]. (g) TiO2–SiO2/100–Na2O diagram for Cpx [78]. (h) Cations of Alt versus Ti for Cpx [78].
We used the analyzed Cpxs from the metabasalts to identify their magma nature and tectonic setting. The compositions of Cpxs from the Wadi El-Saqia metabasalts show sub-alkaline parental melts with tholeiitic affinity (Figure 15d and e), respectively [67] and [76]. In a diagram showing different tectonic settings, the Cpxs plot in the island-arc tholeiite, volcanic arc, or island-arc basalt fields (Figure 15f–h) [77,78,79]. From the tectonic setting, magma nature, P–T conditions, and the occurrence of sulfide and Au–Ag ore deposits (located along major shear zones), we classify these ore deposits as volcanogenic massive sulfide (VMS) deposits, which developed in an intra-oceanic, island-arc, tectonic regime [80,81].
4.2.3. Distributions of Source and Ore Deposits
Many of the structural and mineralogical characteristics of VMS deposits, as described by [82,83,84,85], are present in the Wadi El-Saqia ore deposits. These characteristics include: (1) based on the aeromagnetic results, the presence of Ag–Au and sulfide ore deposits in structurally controlled NNE–SSW, NNW–SSE, NW–SE, N–S, minor NE–SW, and E–W directions (Figure 13); (2) the assemblage of island-arc rock groups (metavolcanics/metavolcanoclastics and ophiolitic rocks), which are divided by thrust faults that extend NEE–SWW and NE–SW and dip NW [62]; (3) the presence of certain S–Zn–Pb sulfide ores and Ag–Au ore deposits [34,35,36,82], in addition to the presence of Cu–Zn sulfide ore deposits, in drilled holes in the Rodruin mine (Figure 1b) [31]; (4) metabasalt host rocks that show low metamorphosis in greenschist facies conditions [26,27,28,29,30]; (5) the low Zn/Cd ratios (189–214) of sphalerite, which are correlated with processes of mobilization and redeposition in VMS deposits [86]; and (6) the presence of exhalites-carbonates (Figure 4c) that mark the most promising VMS ore deposits [87,88].
5. Conclusions
By using derivative filtering—employing techniques like FVD, THG, AS, TA, Theta, TDR, and CET—to enhance airborne magnetic data, we found that the main structural trends impacting the area around Wadi El-Saqia are oriented in the N–S, NE–SW, NW–SE, and E–W directions, while the main trends identified from the geological map are oriented in the NW–SE, NE–SW, NNE–SSW, NNW–SSE, and E–W directions. Such structures govern mineralization in the research area. Based on the integration of geophysical techniques and local geology, we demonstrated that the mineral resources of the research region are related to the location of hydrothermal alteration zones, which are prevalent throughout the region, and which were formed when ophiolitic-assemblage rocks contacted metasediments and other rock units. Additional filtering-result maps—as well as the lineaments and preferred mineralization zones from the center of exploratory targeting—correspond to local geological studies. This research thus demonstrates that airborne magnetic data can significantly aid in the identification of alteration zones employed for mineral exploration. The CET approach has proven to be an excellent tool for building OE maps to identify lineaments that operate as potential hydrothermal-fluid plumbing systems. To validate these findings, we carried out geochemical sampling. Geochemically, we found that the metabasaltic rocks are of sub-alkaline nature with tholeiitic affinity, indicating that they formed in an island-arc tectonic regime. The ore-deposit associations are VMS deposits containing pyrite, sphalerite, galena, polypasite, and electrum minerals. The gold content ranges from 0.01–0.09 wt% in pyrite to 0.03–0.1wt% in galena to 0.12–0.14 wt% in pyrrhotite to 53.55–55.01 wt% in electrum, which suggests mineralization of hydrothermal origin. Moreover, there is a very high gold percentage (reached 26.8 g/t of gold) in the high-grade, gold–polymetallic, sulfide mineralization from the subsurface samples of the Aton company. In this study, we have thus established the value of combining aeromagnetic and geochemical data for mineral exploration by demonstrating how they may identify the structure and shear zones that govern the mineralization zones. Combining results are a valuable framework for future exploration of gold mineralization in the region.
Supplementary Materials
The following supporting information can be downloaded at: https://www.mdpi.com/article/10.3390/min13020237/s1, Table S1: Compositional data of clinopyroxene and plagioclase from metabasaltic rocks; Table S2: Compositional data of VMS and Ag-Au ore deposits.
Author Contributions
Conceptualization, A.A.E.-R., F.D. and O.A.; methodology, A.A.E.-R. and F.D.; software, A.A.E.-R. and F.D.; validation, A.A.E.-R. and F.D.; formal analysis, A.A.E.-R., F.D. and O.A.; investigation, A.A.E.-R. and O.A.; resources, A.A.E.-R. and O.A.; data curation, A.A.E.-R., F.D. and O.A.; writing—original draft preparation, A.A.E.-R. and O.A.; writing—review and editing, A.A.E.-R., O.A. and A.E.M.; visualization, A.A.E.-R.; supervision, A.A.E.-R. and O.A.; project administration, K.A. and M.S.F.; funding acquisition, K.A. and M.S.F. All authors have read and agreed to the published version of the manuscript.
Funding
This research was supported by Researchers Supporting Project number (RSP2023R351), King Saud University, Riyadh, Saudi Arabia.
Data Availability Statement
Data may be available from the corresponding authors upon reasonable request.
Acknowledgments
Thanks sincerely to the Researchers Supporting Project number (RSP2023R351), King Saud University, Riyadh, Saudi Arabia, for funding this research article. The authors thank the editors and reviewers for their valuable comments and suggestions.
Conflicts of Interest
The authors declare no conflict of interest.
References
- El Ramly, M.F. The occurrence of gold in the Eastern Desert of Egypt. Stud. Some Miner. Depos. Egypt. Geol. Surv. Egypt. 1970, 53–64. [Google Scholar]
- Botros, N.S. A new classification of the gold deposits of Egypt. Ore Geol. Rev. 2004, 25, 1–37. [Google Scholar] [CrossRef]
- Abu-Alam, T.; Grosch, E.; Abd El Monsef, M. Pan-African shear zone-hosted gold mineralization in the Arabian-Nubian shield. EGU Gen. Assem. Conf. Abstr. 2013, EGU2013-9893. [Google Scholar]
- Eldosouky, A.M.; El-Qassas, R.A.; Pour, A.B.; Mohamed, H.; Sekandari, M. Integration of ASTER satellite imagery and 3D inversion of aeromagnetic data for deep mineral exploration. Adv. Space Res. 2021, 68, 3641–3662. [Google Scholar] [CrossRef]
- Eldosouky, A.M.; El-Qassas, R.A.Y.; Pham, L.T.; Abdelrahman, K.; Alhumimidi, M.S.; El Bahrawy, A.; Mickus, K.; Sehsah, H. Mapping Main Structures and Related Mineralization of the Arabian Shield (Saudi Arabia) Using Sharp Edge Detector of Transformed Gravity Data. Minerals 2022, 12, 71. [Google Scholar] [CrossRef]
- Amer, O.; Kharbish, S.; Maged, A.; Khedr, F. Geochemical insight into granite hosted U-rich fluorite, Gabal El-Erediya area, Central Eastern Desert, Egypt: REE geochemical and fluid inclusion aspects. Arab. J. Geosci. 2021, 14, 1232. [Google Scholar] [CrossRef]
- Elwan, W.; Azzaz, S.; Balasi, M.; Amer, O. Petrogenesis of Maktali fractionated calc-alkaline younger granitoids, Central Eastern Desert, Egypt. Arab. J. Geosci. 2019, 12, 393. [Google Scholar] [CrossRef]
- Mohamed, A.; Abdelrady, M.; Alshehri, F.; Mohammed, M.; Abdelrady, A. Detection of Mineralization Zones Using Aeromagnetic Data. Appl. Sci. 2022, 12, 9078. [Google Scholar] [CrossRef]
- Kharbish, S.; Eldosouky, A.; Amer, O. Integrating mineralogy, geochemistry and aeromagnetic data for detecting Fe–Ti ore deposits bearing layered mafic intrusion, Akab El-Negum, Eastern Desert, Egypt. Sci. Rep. 2022, 12, 15474. [Google Scholar] [CrossRef]
- Pham, L.T.; Eldosouky, A.M.; Abdelrahman, K.; Fnais, M.S.; Gomez-Ortiz, D.; Khedr, F. Application of the improved parabola-based method in delineating lineaments of subsurface structures: A case study. J. King Saud Univ.-Sci. 2012, 33, 101585. [Google Scholar] [CrossRef]
- Dufréchou, G.; Harris, L.B.; Corriveau, L.; Antonoff, V. Regional and local controls on mineralization and pluton emplacement in the Bondy gneiss complex, Grenville Province, Canada interpreted from aeromagnetic and gravity data. J. Appl. Geophys. 2015, 116, 192–205. [Google Scholar] [CrossRef]
- Bencharef, M.H.; Eldosouky, A.; Zamzam, S.; Boubaya, D. Polymetallic mineralization prospectivity modelling using multi-geospatial data in logistic regression: The Diapiric Zone, Northeastern Algeria. Geocarto Int. 2022, 1–36. [Google Scholar] [CrossRef]
- An, S.; Zhou, K.; Wang, J.; Zhang, N.; Liao, S.; Feng, Q.; Zhang, Z. Interpretation of high resolution aeromagnetic data for structures study and exploration of polymetallic deposits in Kalatage area, eastern Tianshan (NW China). Geosci. J. 2020, 24, 315–327. [Google Scholar] [CrossRef]
- El-Desoky, H.M.; Shebl, A.; Abdel-Rahman, A.M.; Fahmy, W.; El-Awny, H.; El-Sherif, A.M.; El-Rahmany, M.M.; Csámer, Á. Multiscale mineralogical investigations for mineral potentiality mapping of Ras El-Kharit-Wadi Khashir district, Southern Eastern Desert, Egypt. Egypt. J. Remote Sens. Space Sci. 2022, 4, 941–960. [Google Scholar] [CrossRef]
- Shebl, A.; Abdellatif, M.; Elkhateeb, S.O.; Csámer, Á. Multisource data analysis for gold potentiality mapping of Atalla area and its environs, Central Eastern Desert, Egypt. Minerals 2021, 11, 641. [Google Scholar] [CrossRef]
- Shebl, A.; Abdellatif, M.; Hissen, M.; Abdelaziz, M.I.; Csámer, Á. Lithological mapping enhancement by integrating Sentinel 2 and gamma-ray data utilizing support vector machine: A case study from Egypt. Int. J. Appl. Earth Obs. Geoinf. 2021, 105, 102619. [Google Scholar] [CrossRef]
- Prasad, K.N.D.; Pham, L.T.; Singh, A.P.; Eldosouky, A.M.; Abdelrahman, K.; Fnais, M.S.; Gómez-Ortiz, D. A Novel Enhanced Total Gradient (ETG) for Interpretation of Magnetic Data. Minerals 2022, 12, 1468. [Google Scholar] [CrossRef]
- Eldosouky, A.M.; Abdelkareem, M.; Elkhateeb, S.O. Integration of remote sensing and aeromagnetic data for mapping structural features and hydrothermal alteration zones in Wadi Allaqi area, South Eastern Desert of Egypt. J. Afr. Earth Sci. 2017, 130, 28–37. [Google Scholar] [CrossRef]
- Hang, N.T.T. Application of directional derivative method to determine boundary of magnetic sources by total magnetic anomalies. Vietnam J. Earth Sci. 2017, 39, 360–375. [Google Scholar] [CrossRef]
- Thanh, L.P. Determination of subsurface lineaments in the Hoang Sa islands using enhanced methods of gravity total horizontal gradient. Vietnam J. Earth Sci. 2022, 44, 395–409. [Google Scholar]
- Eldosouky, A.M.; Pham, L.; Abdelrahman, K.; Fnais, M.; Gomez-Ortiz, D. Mapping structural features of the Wadi Umm Dulfah area using aeromagnetic data. J. King Saud Univ.-Sci. 2022, 34, 101803. [Google Scholar] [CrossRef]
- Eldosouky, A.M.; Pham, L.; Mohmed, H.; Pradhan, B. A comparative study of THG, AS, TA, Theta, TDX and LTHG techniques for improving source boundaries detection of magnetic data using synthetic models: A case study from G. Um Monqul, North Eastern Desert, Egypt. J. Afr. Earth Sci. 2020, 170, 103940. [Google Scholar] [CrossRef]
- Cordell, L.; Grauch, V.J.S. Mapping basement magnetization zones from aeromagnetic data in the San Juan Basin, New Mexico. In The Utility of Regional Gravity and Magnetic Anomaly Maps; Society of Exploration Geophysicists: Tulsa, OK, USA, 1985; pp. 181–197. [Google Scholar]
- Miller, H.G.; Singh, V. Potential field tilt—A new concept for location of potential field sources. J. Appl. Geophys. 1994, 32, 213–217. [Google Scholar] [CrossRef]
- Wijns, C.; Perez, C.; Kowalczyk, P. Theta map: Edge detection in magnetic data. Geophysics 2005, 70, L39–L43. [Google Scholar] [CrossRef]
- Macnae, J. Applications of geophysics for the detection and exploration of kimberlites and lamproites. J. Geochem. Explor. 1995, 53, 213–243. [Google Scholar] [CrossRef]
- Holden, E.-J.; Dentith, M.; Kovesi, P. Towards the automated analysis of regional aeromagnetic data to identify regions prospective for gold deposits. Comput. Geosci. 2008, 34, 1505–1513. [Google Scholar] [CrossRef]
- Core, D.; Buckingham, A.; Belfield, S. Detailed structural analysis of magnetic data—Done quickly and objectively. SGEG Newsl. 2009, 1–2. [Google Scholar]
- Barnes, S.J.; Roeder, P.L. The range of spinel compositions in terrestrial mafic and ultramafic rocks. J. Petrol. 2001, 42, 2279–2302. [Google Scholar] [CrossRef]
- Conoco, C. Geological map of Egypt, scale 1: 500,000-NF 36 NE-Bernice, Egypt. Egypt. Gen. Pet. Corp. Cairo 1987. [Google Scholar]
- Stern, R.J. The Najd fault system, Saudi Arabia and Egypt: A late Precambrian rift-related transform system? Tectonics 1985, 4, 497–511. [Google Scholar] [CrossRef]
- Habib, M.E. Arc ophiolites in the Pan-African basement between Meatiq and Abu Furad, Eastern Desert, Egypt. Bull. Fac. Sci. Assiut Univ. C Biol. Geol. 1987, 16, 241–283. [Google Scholar]
- Gass, I.G. The evolution of the Pan African crystalline basement in NE Africa and Arabia. J. Geol. Soc. 1977, 134, 129–138. [Google Scholar] [CrossRef]
- Shukri, N.M.; MANSOUR, M.S. Lithostratigraphy of Um Samuiki District, Eastern Desert, Egypt. In Evolution and Mineralization of the Arabian–Nubian Shield; King Abdulaziz University: Jeddah, Saudi Arabia, 1980. [Google Scholar]
- Hafez, A.; Shalaby, L.M. On the geochemical characteristics of the volcanic rocks at Umm Samiuki, Eastern Desert, Egypt. Egypt. J. Geol. 1983, 27, 73–92. [Google Scholar]
- Khudeir, A.A.; Ali, M.; El Habaak, G.H. The metavolcanics at Um Samiuki area, Egypt. Bull. Fac. Sci. Assiut Univ. 1988, 17, 73–101. [Google Scholar]
- Stern, R.J.; Kröner, A.; Rashwan, A.A. A late Precambrian (∼710 Ma) high volcanicity rift in the southern Eastern Desert of Egypt. Geol. Rundsch. 1991, 80, 155–170. [Google Scholar] [CrossRef]
- Abdel-Karim, A.-A.M.; Ali, S.; El-Awady, A.; Elwan, W.; Khedr, M.Z.; Tamura, A. Mineral and bulk–rock chemistry of Shadli bimodal metavolcanics from Eastern Desert of Egypt: Implication for tectonomagmatic setting and Neoproterozoic continental growth in the Arabian–Nubian Shield. Lithos 2019, 338, 204–217. [Google Scholar] [CrossRef]
- Resources, A. Aton Drills Further High Grade Gold-Polymetallic Sulphide Mineralisation at Rodruin, Returning 7.04 g/t Gold, 47.2 g/t Silver, 0.63% Copper and 7.18% Zinc over 36.9 Metres. Aton Company, Egypt, Mining, June 2022. Available online: https://atonresources.com/news/2022/aton-drills-further-wide-zones-of-oxide-mineralisation-at-rodruin-returning-1.72-g-t-gold-and-11.5-g-t-silver-over-75.2m-from/ (accessed on 13 June 2022).
- Shanks, W.P., III.; Koski, R.A.; Mosier, D.L.; Schulz, K.J.; Morgan, L.A.; Slack, J.F.; Ridley, W.I.; Dusel-Bacon, C.; Seal, R.R.; Piatak, N.M. Volcanogenic Massive Sulfide Occurrence Model: Chapter C in Mineral Deposit Models for Resource Assessment; U.S. Geological Survey: Baltimore, MD, USA, 2012. [Google Scholar]
- Aeroservice. Final Report on Airborne Magnetic/Radiation Survey in Eastern Desert, Egypt. Work Completed for the Egyptian General Petroleum Corporation (EGPC); Aero Service: Houston, TX, USA, 1984; Volume 6. [Google Scholar]
- Oasis Montaj Program, version. 8.4. Geosoft Mapping and Processing System. Geosoft Inc: Toronto, ON, Canada, 2015.
- Aitken, A.R.; Betts, P.G. Multi-scale integrated structural and aeromagnetic analysis to guide tectonic models: An example from the eastern Musgrave Province, Central Australia. Tectonophysics 2009, 476, 418–435. [Google Scholar] [CrossRef]
- Baratoux, L.; Metelka, V.; Naba, S.; Ouiya, P.; Siebenaller, L.; Jessell, M.; Naré, A.; Salvi, S.; Béziat, D.; Franceschi, G. Tectonic evolution of the Gaoua region, Burkina Faso: Implications for mineralization. J. Afr. Earth Sci. 2015, 112, 419–439. [Google Scholar] [CrossRef]
- Metelka, V.; Baratoux, L.; Naba, S.; Jessell, M.W. A geophysically constrained litho-structural analysis of the Eburnean greenstone belts and associated granitoid domains, Burkina Faso, West Africa. Precambrian Res. 2011, 190, 48–69. [Google Scholar] [CrossRef]
- Blakely, R.J.; Simpson, R.W. Approximating edges of source bodies from magnetic or gravity anomalies. Geophysics 1986, 51, 1494–1498. [Google Scholar] [CrossRef]
- Milligan, P.R.; Gunn, P.J. Enhancement and presentation of airborne geophysical data. AGSO J. Aust. Geol. Geophys. 1997, 17, 63–75. [Google Scholar]
- Pilkington, M.; Keating, P.B. The utility of potential field enhancements for remote predictive mapping. Can. J. Remote Sens. 2009, 35 (Suppl. S1), S1–S11. [Google Scholar] [CrossRef]
- Verduzco, B.; Fairhead, J.; Green, C.; MacKenzie, C. New insights into magnetic derivatives for structural mapping. Lead. Edge 2004, 23, 116. [Google Scholar] [CrossRef]
- El-Ata, A.S.A.; EI-Khafeef, A.A.; Ghoneimi, A.E.; Alnabi, S.H.A.; Al-Badani, M.A. Applications of aeromagnetic data to detect the Basement Tectonics of Eastern Yemen region. Egypt. J. Pet. 2013, 22, 277–292. [Google Scholar] [CrossRef]
- Keating, P. A simple technique to identify magnetic anomalies due to kimberlite pipes. Explor. Min. Geol. 1995, 4, 121–125. [Google Scholar]
- Grauch, V.J.S.; Cordell, L. Limitations of determining density or magnetic boundaries from the horizontal gradient of gravity or pseudogravity data. Geophysics 1987, 52, 118–121. [Google Scholar] [CrossRef]
- Phillips, J.D. Locating magnetic contacts: A comparison of the horizontal gradient, analytic signal, and local wavenumber methods. In SEG Technical Program Expanded Abstracts 2000; Society of Exploration Geophysicists: Tulsa, OK, USA, 2000; pp. 402–405. [Google Scholar]
- Nabighian, M.N. The analytic signal of two-dimensional magnetic bodies with polygonal cross-section: Its properties and use for automated anomaly interpretation. Geophysics 1972, 37, 507–517. [Google Scholar] [CrossRef]
- Roest, W.R.; Pilkington, M. Identifying remanent magnetization effects in magnetic data. Geophysics 1993, 58, 653–659. [Google Scholar] [CrossRef]
- Ansari, A.H.; Alamdar, K. Reduction to the pole of magnetic anomalies using analytic signal. World Appl. Sci. J. 2009, 7, 405–409. [Google Scholar]
- Roest, W.R.; Verhoef, J.; Pilkington, M. Magnetic interpretation using the 3-D analytic signal. Geophysics 1992, 57, 116–125. [Google Scholar] [CrossRef]
- Eldosouky, A.M. Aeromagnetic data for mapping geologic contacts at Samr El-Qaa area, north Eastern Desert, Egypt. Arab. J. Geosci. 2019, 12, 1–13. [Google Scholar] [CrossRef]
- Telford, W.M.; Geldart, L.P.; Sheriff, R.E.; Keys, D.A. Applied Geophysics; Cambridge University Press: Cambridge, UK; New York Press: New York, NY, USA, 1976; pp. 1–860. [Google Scholar]
- Klitzsch, E. Plate tectonics and cratonal geology in Northeast Africa (Egypt, Sudan). Geol. Rundsch. 1986, 75, 755–768. [Google Scholar] [CrossRef]
- Schandelmeier, H.; Richter, A.; Harms, U. Proterozoic deformation of the East Saharan Craton in southeast Libya, south Egypt and north Sudan. Tectonophysics 1987, 140, 233–246. [Google Scholar] [CrossRef]
- Grauch, V.J.S.; Johnston, C.S. Gradient window method: A simple way to separate regional from local horizontal gradients in gridded potential-field data. In Proceedings of the 2002 SEG Annual Meeting, Salt Lake City, UT, USA, 8–9 October 2002. [Google Scholar]
- Grauch, V.J.S.; Hudson, M.R. Guides to understanding the aeromagnetic expression of faults in sedimentary basins: Lessons learned from the central Rio Grande rift, New Mexico. Geosphere 2007, 3, 596. [Google Scholar] [CrossRef]
- Elkhateeb, S.O.; Abdellatif, M.A.G. Delineation potential gold mineralization zones in a part of Central Eastern Desert, Egypt using Airborne Magnetic and Radiometric data. NRIAG J. Astron. Geophys. 2018, 7, 361–376. [Google Scholar] [CrossRef]
- Abdel-Khalek, M.X. Tectonic evolution of the basement rocks in the southern and central Eastern Desert of Egypt. Evol. Miner. Arab.-Nubian Shield 2017, 1, 53–62. [Google Scholar]
- Morimoto, N. Nomenclature of pyroxenes. Mineral. Petrol. 1988, 68, 95–111. [Google Scholar]
- Le Bas, M.J. The role of aluminum in igneous clinopyroxenes with relation to their parentage. Am. J. Sci. 1962, 260, 267–288. [Google Scholar] [CrossRef]
- Delavari, M.; Amini, S.; Saccani, E.; Beccaluva, L. Geochemistry and petrogenesis of mantle peridotites from the Nehbandan Ophiolitic Complex, Eastern Iran. J. Appl. Sci. 2009, 9, 2671–2687. [Google Scholar] [CrossRef]
- Wright, J.; Lentz, D.; Rossiter, S.; Garland, P. Analysis of Au-Ag Mineralization in the Caribou Base-Metal VMS Deposit, New Brunswick; Examination of Micro-Scale Inter-and Intra-Sulphide Distribution and Its Relation to Geometallurgy. Minerals 2016, 6, 113. [Google Scholar] [CrossRef]
- Xuexin, S. Minor elements and ore genesis of the Fankou lead-zinc deposit, China. Miner. Deposita 1984, 19, 95–104. [Google Scholar] [CrossRef]
- Chen, P.; Fang, N.; Yuan, X. Geochemical insights from clinopyroxene phenocrysts into the magma evolution of an alkaline magmatic system from the Sanshui Basin, South China. Minerals 2021, 11, 1295. [Google Scholar] [CrossRef]
- Soesoo, A. A multivariate statistical analysis of clinopyroxene composition: Empirical coordinates for the crystallisation PT-estimations. GFF 1997, 119, 55–60. [Google Scholar] [CrossRef]
- Green, D.H.; Ringwood, A.E. The Genesis of Basaltic Magmas: Contributions in Mineralogy and Petrology. Contrib. Mineral. Petrol. 1967, 15, 103–190. [Google Scholar] [CrossRef]
- Lindsley, D.H. Pyroxene thermometry. Am. Mineral. 1983, 68, 477–493. [Google Scholar]
- DeBari, S.M.; Coleman, R.G. Examination of the deep levels of an island arc: Evidence from the Tonsina ultramafic-mafic assemblage, Tonsina, Alaska. J. Geophys. Res. Solid Earth 1989, 94, 4373–4391. [Google Scholar] [CrossRef]
- Leterrier, J.; Maury, R.; Thonon, P.; Girard, D.; Marchal, M. Clinopyroxene composition as a method of identification of the magmatic affinities of paleo-volcanic series. Earth Planet. Sci. Lett. 1982, 59, 139–154. [Google Scholar] [CrossRef]
- Nisbet, E.G.; Pearce, J.A. Clinopyroxene composition in mafic lavas from different tectonic settings. Contrib. Mineral. Petrol. 1977, 63, 149–160. [Google Scholar] [CrossRef]
- Beccaluva, L.; Macciotta, G.; Piccardo, G.; Zeda, O. Clinopyroxene composition of ophiolite basalts as petrogenetic indicator. Chem. Geol. 1989, 77, 165–182. [Google Scholar] [CrossRef]
- Loucks, R.R. Discrimination of ophiolitic from nonophiolitic ultramafic-mafic allochthons in orogenic belts by the Al/Ti ratio in clinopyroxene. Geology 1990, 18, 346–349. [Google Scholar] [CrossRef]
- Ohmoto, H. Formation of volcanogenic massive sulfide deposits: The Kuroko perspective. Ore Geol. Rev. 1996, 10, 135–177. [Google Scholar] [CrossRef]
- El-Rahman, A.; Surour, A.A.; El-Manawi, A.H.W.; El-Dougdoug, A.-M.A.; Omar, S. Regional setting and characteristics of the Neoproterozoic Wadi Hamama Zn–Cu–Ag–Au prospect: Evidence for an intra-oceanic island arc-hosted volcanogenic hydrothermal system. Int. J. Earth Sci. 2015, 104, 625–644. [Google Scholar] [CrossRef]
- Franklin, J.M.; Lydon, J.W.; Sangster, D.F. Volcanic-Associated Massive Sulfide Deposits; Economic Geology Publishing: Littleton, CO, USA, 1981. [Google Scholar]
- Hannington, M.D.; Poulsen, K.H.; Thompson, J.F.H.; Sillitoe, R.H. Volcanogenic Gold in the Massive Sulfide Environment; Society of Economic Geologists: Littleton, CO, USA, 1997. [Google Scholar]
- Hannington, M.D.; De Ronde, C.E.; Petersen, S. Sea-Floor Tectonics and Submarine Hydrothermal Systems; Society of Economic Geologists: Littleton, CO, USA, 2005. [Google Scholar]
- Piercey, S.J. The setting, style, and role of magmatism in the formation of volcanogenic massive sulfide deposits. Miner. Deposita 2011, 46, 449–471. [Google Scholar] [CrossRef]
- Gottesmann, W.; Kampe, A. Zn/Cd ratios in calcsilicate-hosted sphalerite ores at Tumurtijn-ovoo, Mongolia. Geochemistry 2007, 67, 323–328. [Google Scholar] [CrossRef]
- Peter, J.M. Ancient iron formations: Their genesis and use in the exploration for stratiform base metal sulphide deposits, with examples from the Bathurst Mining Camp. GeoText 2003, 4, 145–176. [Google Scholar]
- Spry, P.G.; Peter, J.M.; Slack, J.F. Meta-exhalites as exploration guides to ore. Rev. Econ. Geol. 2000, 11, 163–201. [Google Scholar]


Disclaimer/Publisher’s Note: The statements, opinions and data contained in all publications are solely those of the individual author(s) and contributor(s) and not of MDPI and/or the editor(s). MDPI and/or the editor(s) disclaim responsibility for any injury to people or property resulting from any ideas, methods, instructions or products referred to in the content. |
© 2023 by the authors. Licensee MDPI, Basel, Switzerland. This article is an open access article distributed under the terms and conditions of the Creative Commons Attribution (CC BY) license (https://creativecommons.org/licenses/by/4.0/).