
Design and Application of a Deep-Sea Engineering Geology In Situ Test System

 ,
,
Abstract
1. Introduction
2. Design of Deep-Sea Engineering Geology in Situ Test System
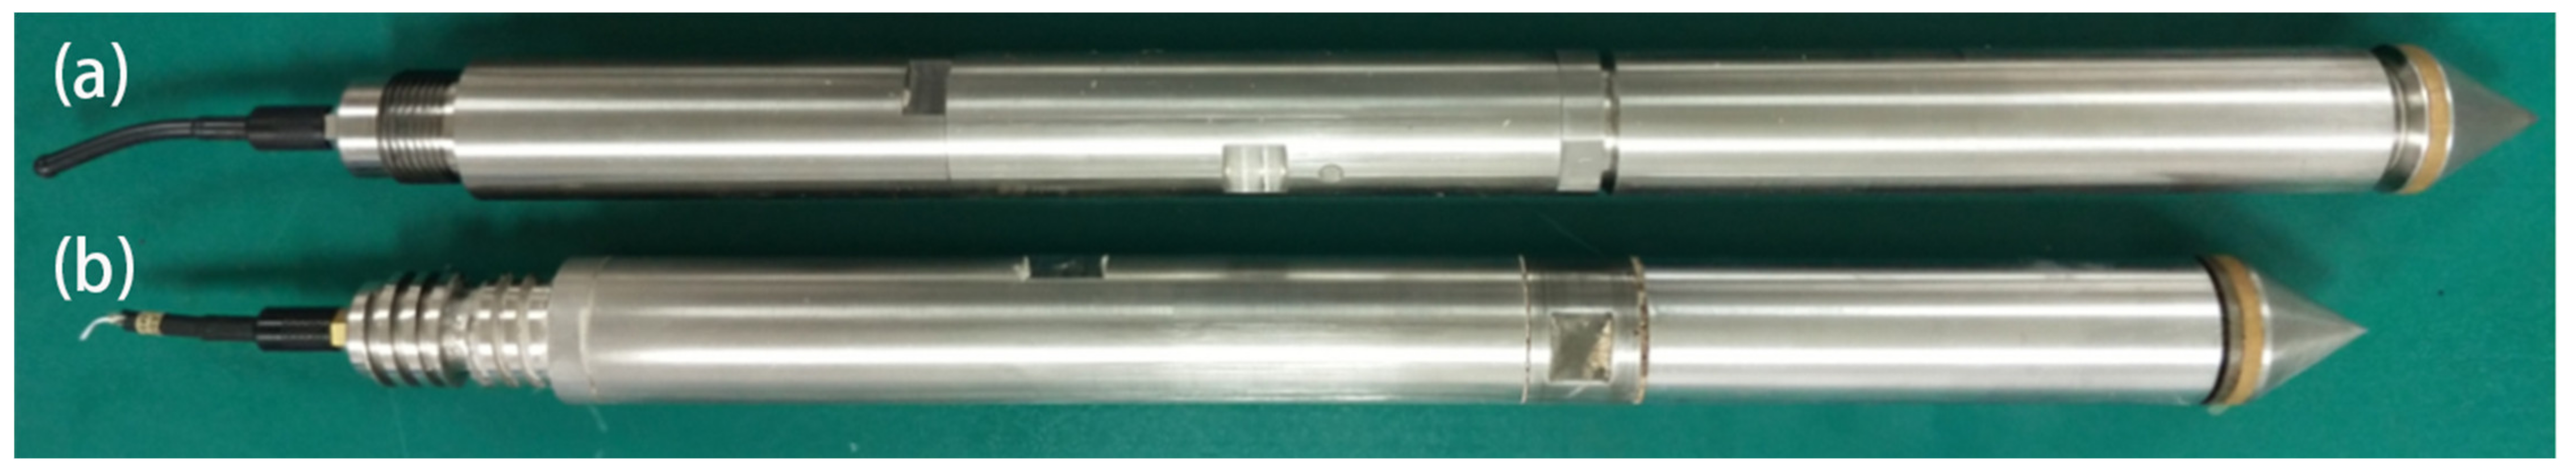
2.1. Design of Digital CPTu
2.2. Design of Cross-Shear Device
2.3. Design of Control System
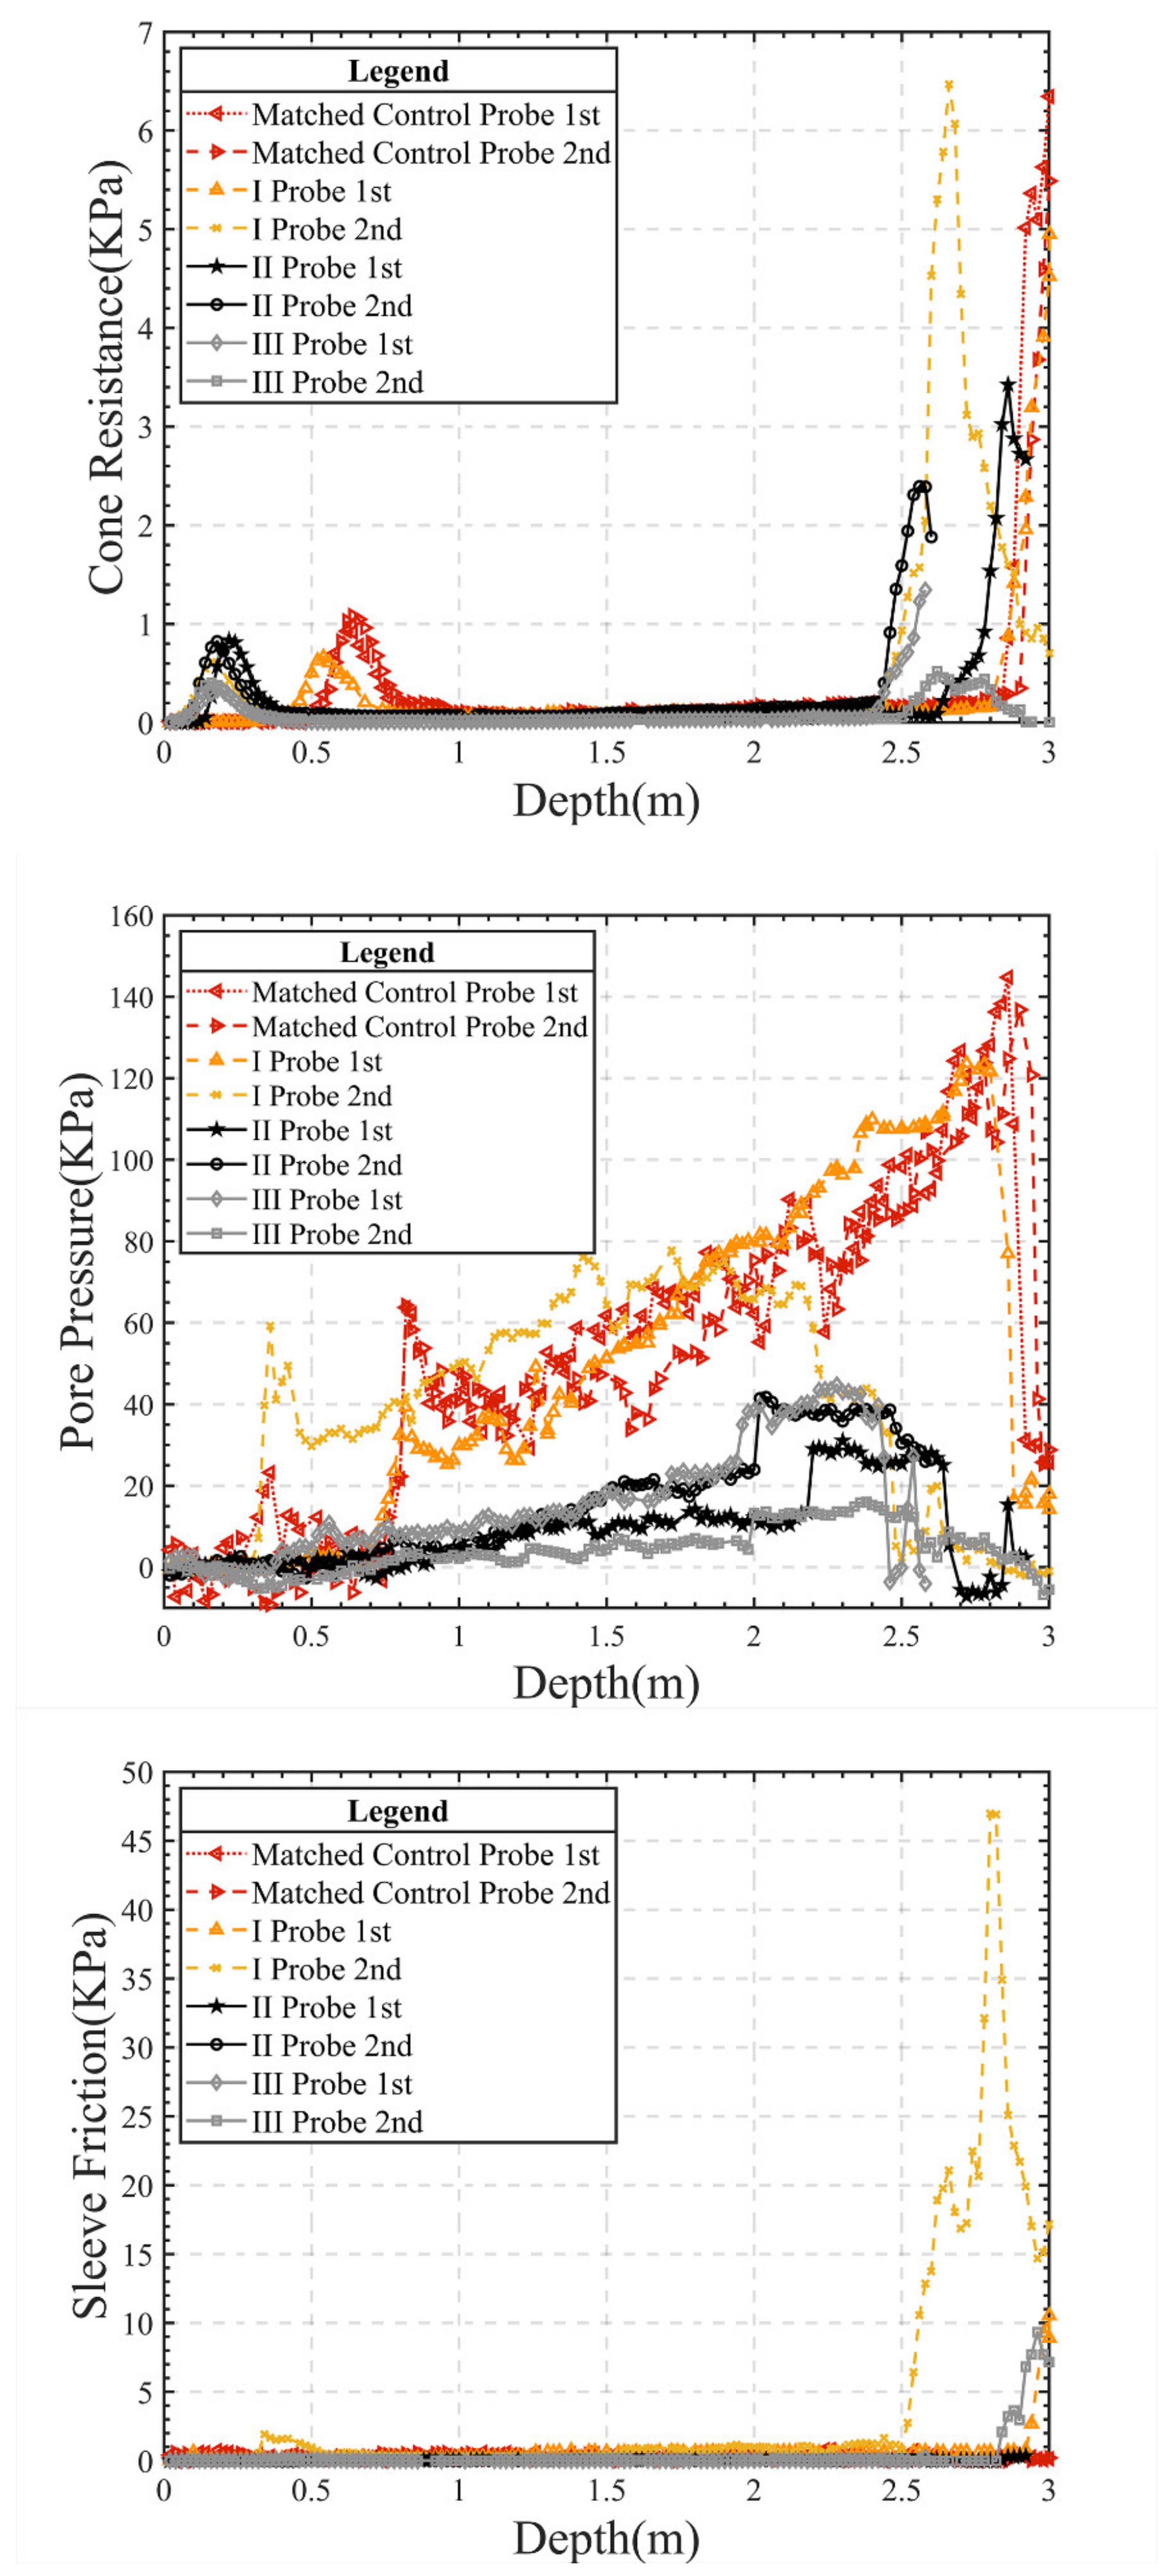
3. Land Experiment
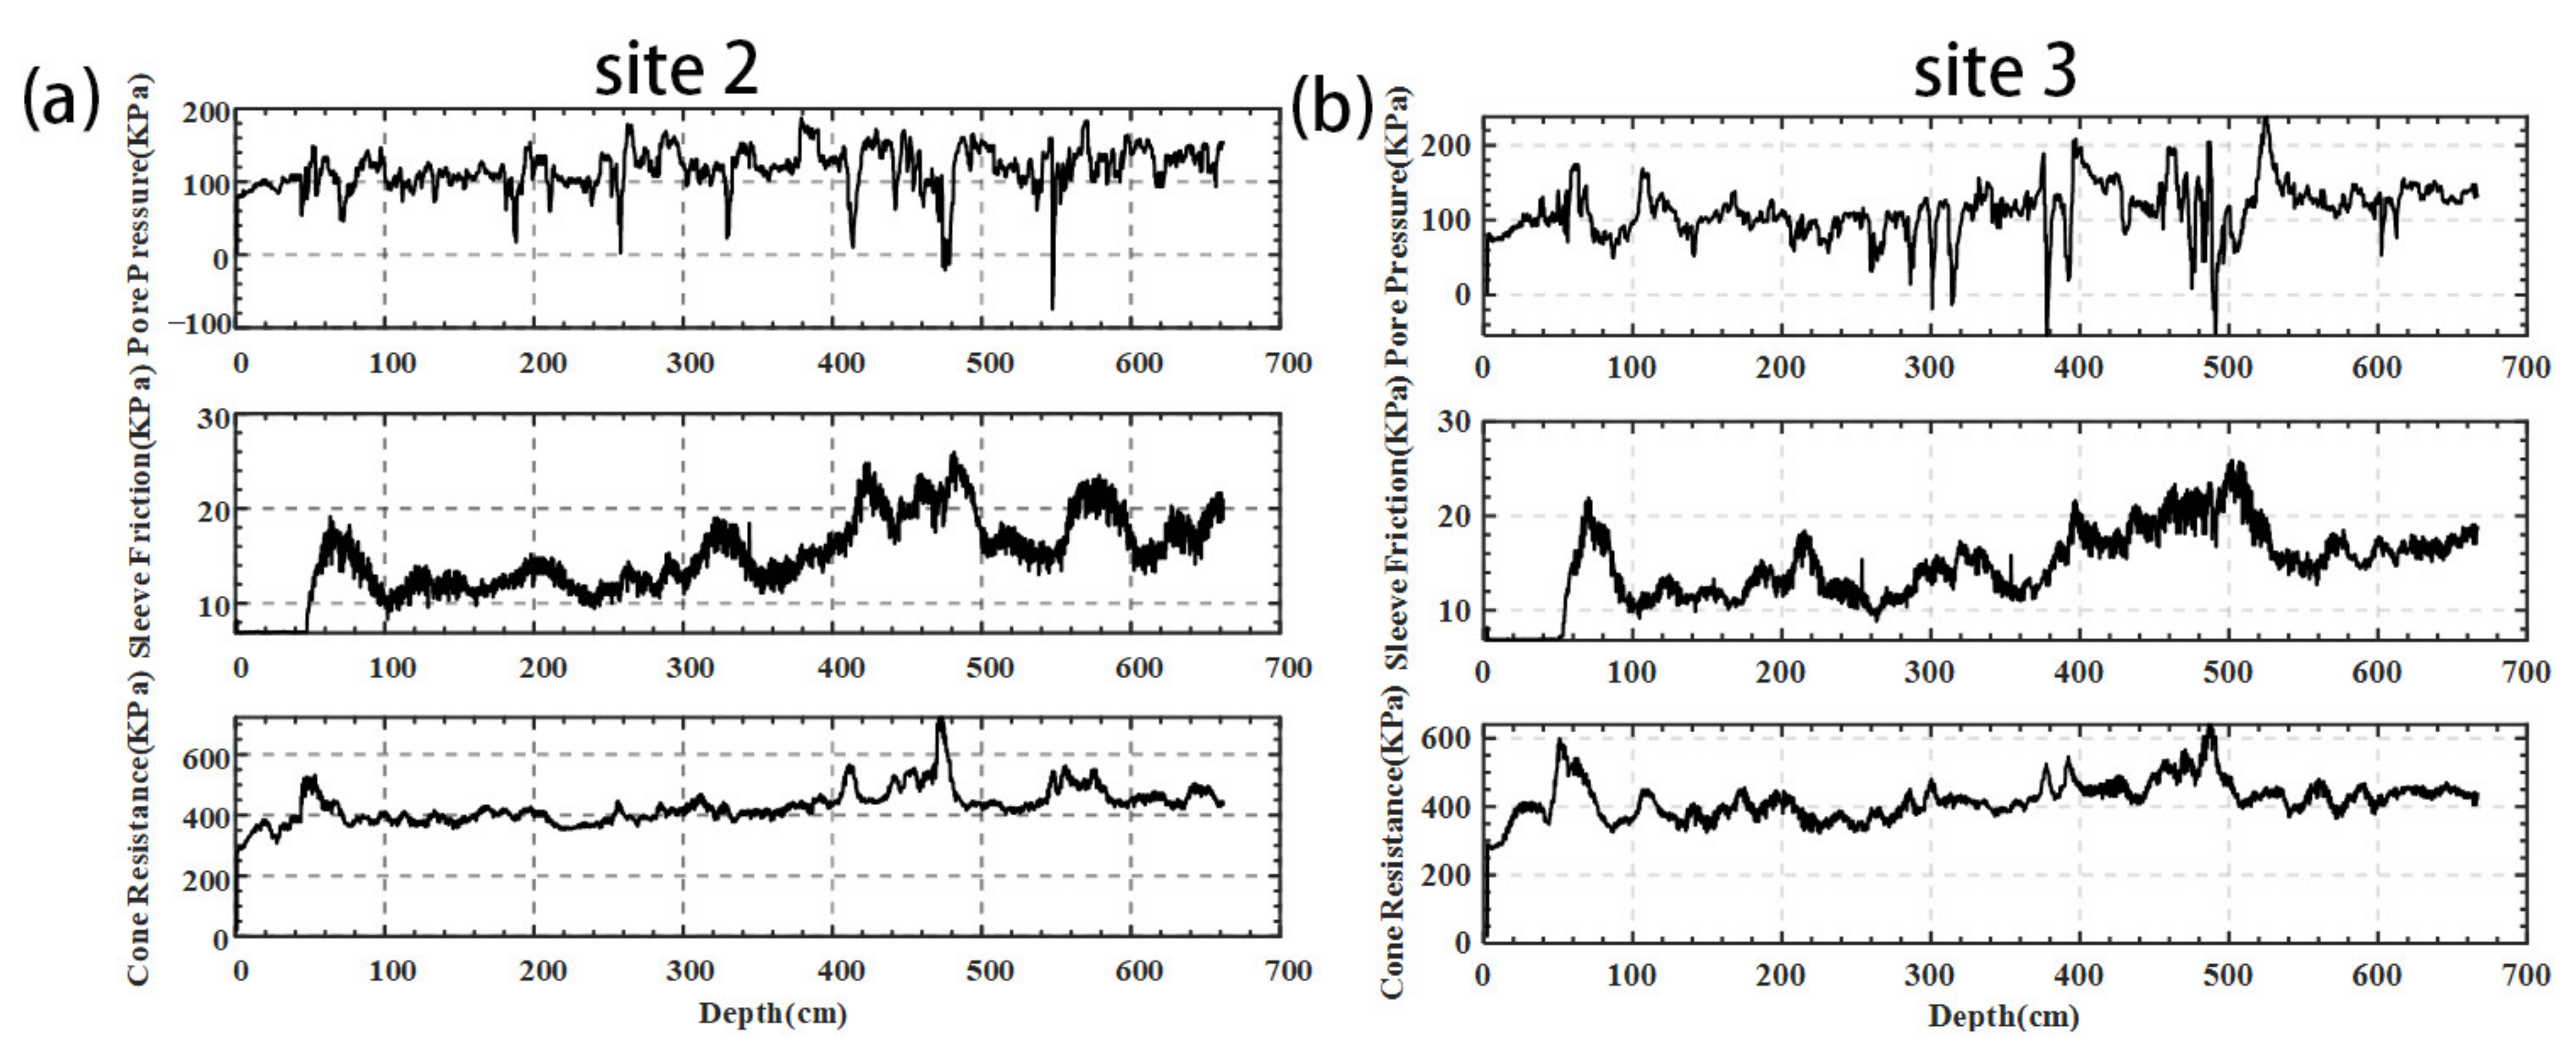
4. Sea Trials
4.1. Trail Site
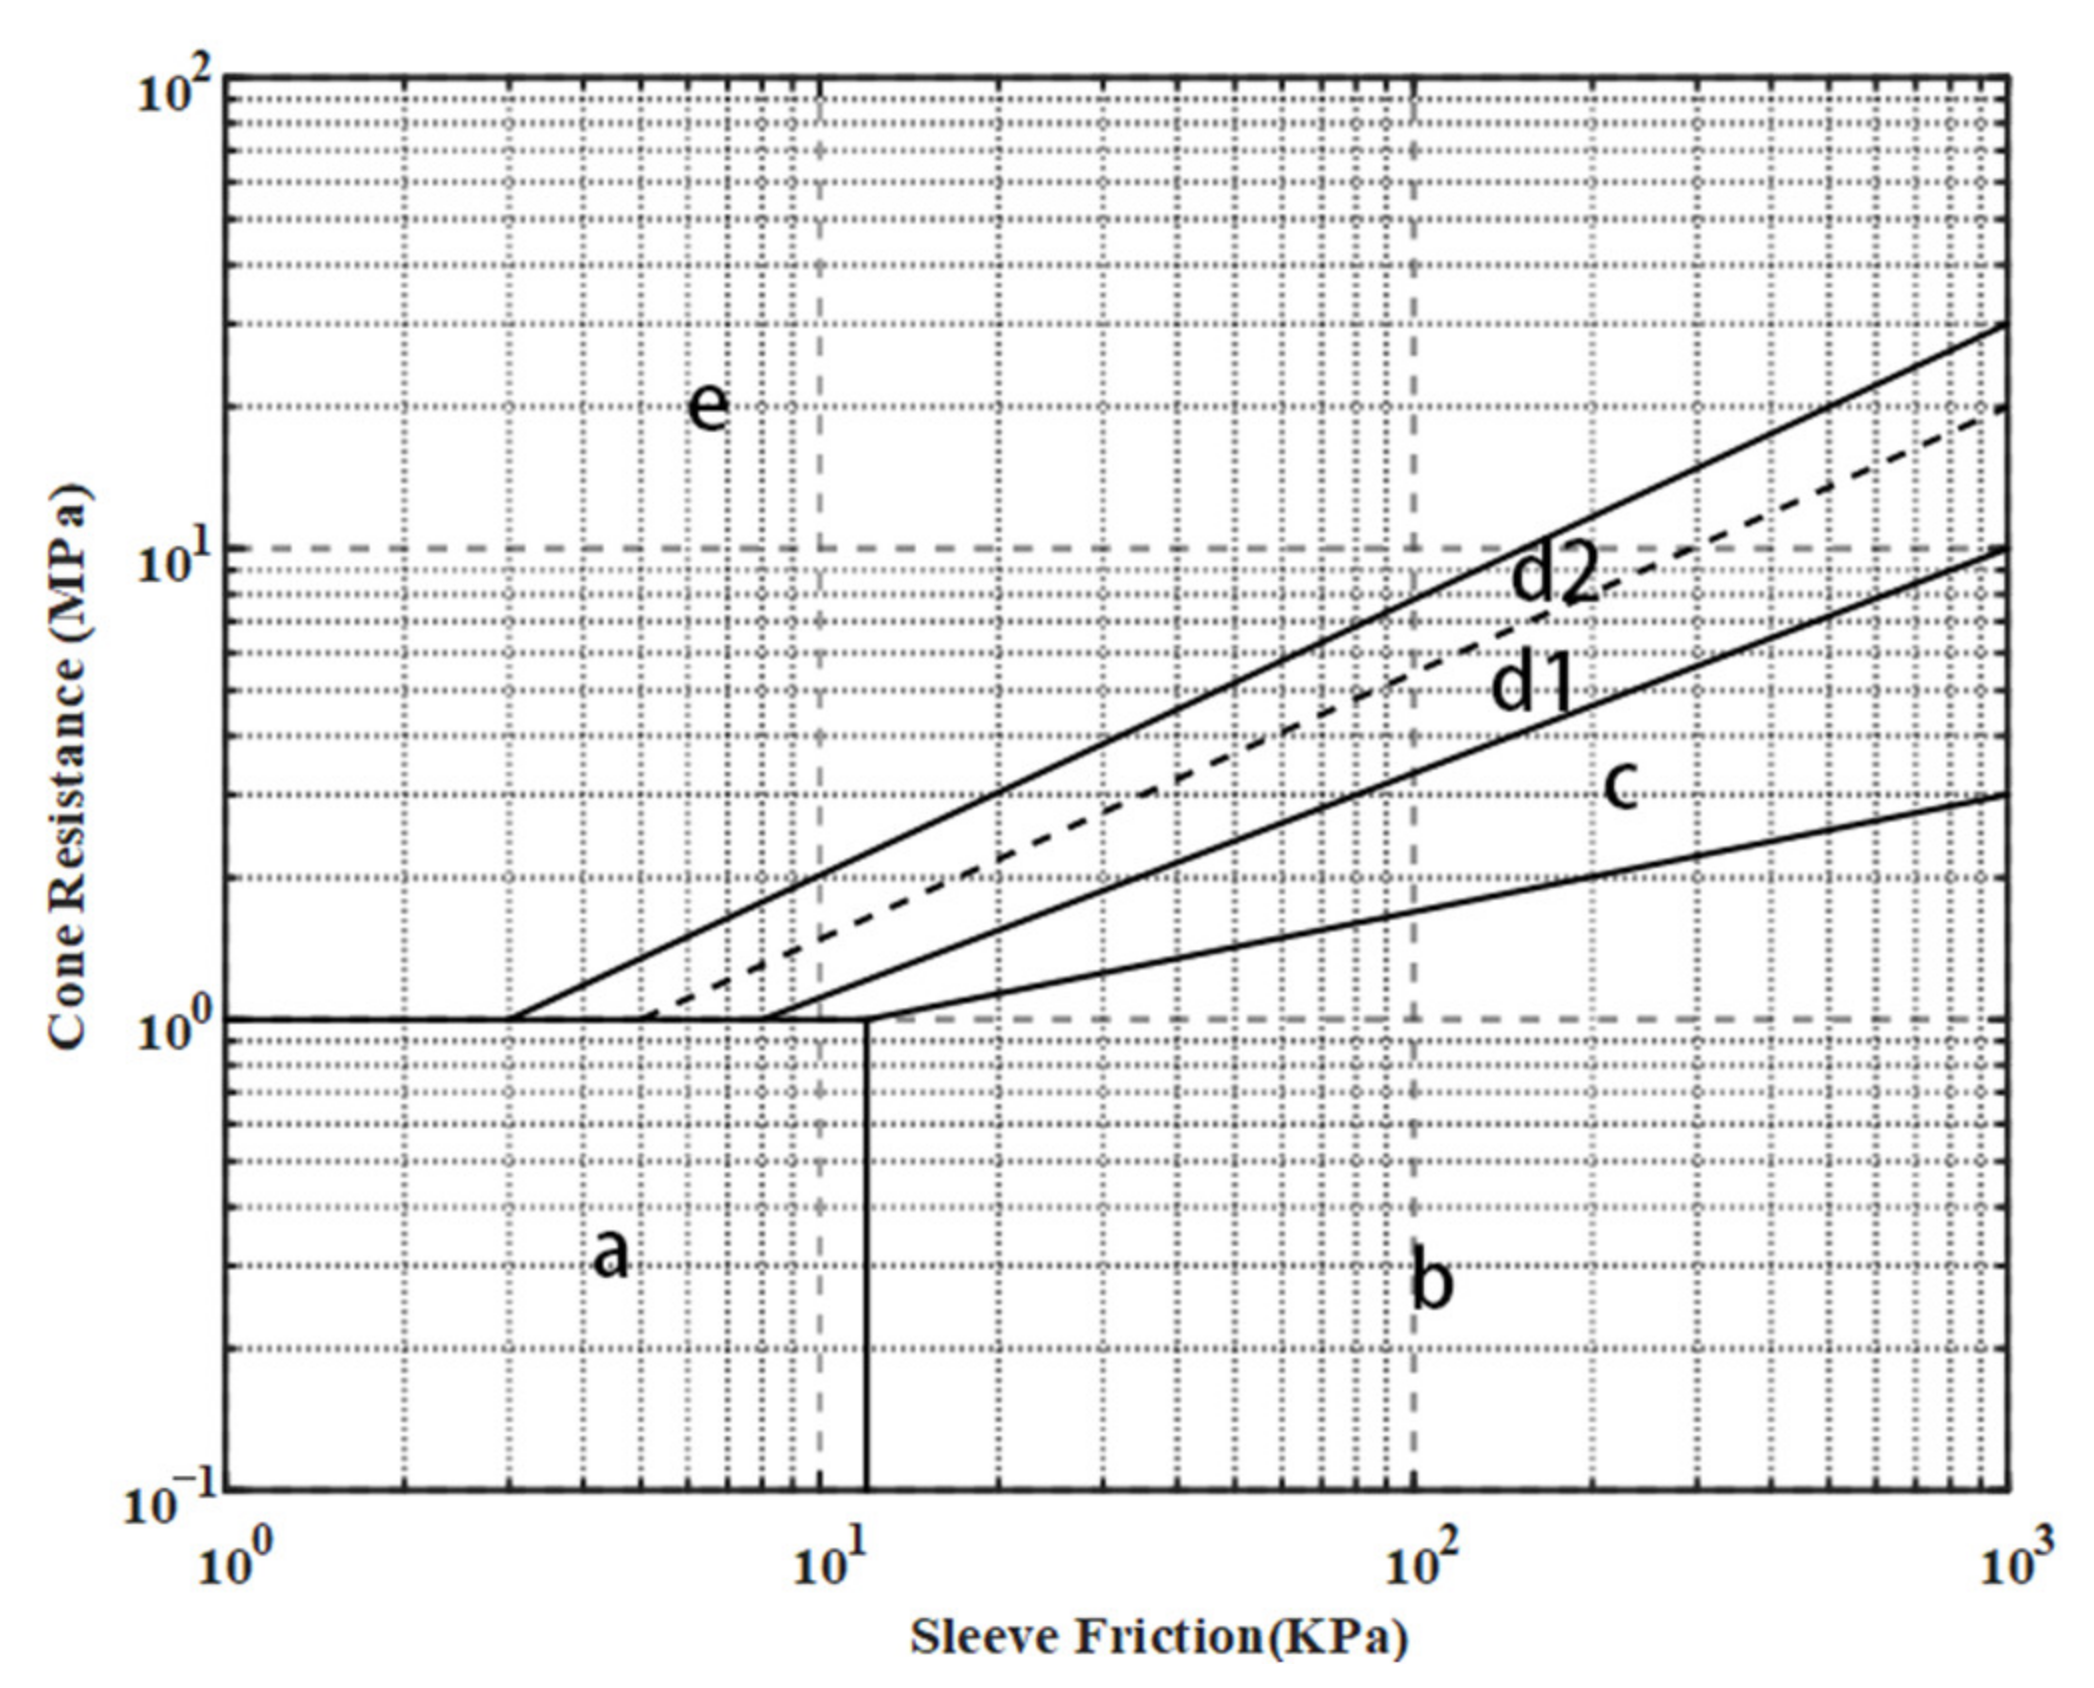
4.2. Data Processing
5. Conclusions
Author Contributions
Funding
Data Availability Statement
Acknowledgments
Conflicts of Interest
References
- Wang, X.M.; Sun, Z.S. Status and exploitation prospect of world- wide marine mineral resources. World Nonferrous Met. 2010, 6, 21–25. [Google Scholar] [CrossRef]
- Qi, H.E.; Wang, P. Current Situation and Prospect of Deep Sea Energy Development. Ocean. Dev. Manag. 2017, 34, 66–71. [Google Scholar]
- Kato, Y.; Fujinaga, K.; Nakamura, K.; Takaya, Y.; Kitamura, K.; Ohta, J.; Toda, R.; Nakashima, T.; Iwamori, H. Deep-sea mud in the Pacific Ocean as a potential resource for rare-earth elements. Nat. Geoence 2011, 4, 535–539. [Google Scholar] [CrossRef]
- Petersen, S.; Krätschell, A.; Augustin, N.; Jamieson, J.; Hein, J.R.; Hannington, M.D. News from the seabed—Geological characteristics and resource potential of deep-sea mineral resources. Mar. Policy 2016, 70, 175–187. [Google Scholar] [CrossRef]
- Schulte, E.; Handschuh, R.; Schwarz, W. Transferability of Soil Mechanical Parameters to Traction Potential Calculation of a Tracked Vehicle. In Proceedings of the 5th ISOPE Ocean Mining Symposium, Tsukuba, Japan, 15–19 September 2003. [Google Scholar]
- Barnes, C.R.; Tunnicliffe, V. Building the World’s First Multi-node Cabled Ocean Observatories (NEPTUNE Canada and VENUS, Canada): Science, Realities, Challenges and Opportunities. In Proceedings of the OCEANS 2008—MTS/IEEE Kobe Techno-Ocean, Kobe, Japan, 8–11 April 2008; pp. 1–8. [Google Scholar] [CrossRef]
- Ehlers, C.J.; Chen, J.; Roberts, H.H.; Lee, Y.C. The Origin of Near-Seafloor “Crust Zones” in Deepwater. Available online: https://digitalcommons.lsu.edu/geo_pubs/1624/ (accessed on 23 January 2023).
- Liangqing, S. Geotechnical properties of oceanic polymetallic nodule sediments. Acta Oceanol. Sin. 1999, 21, 47–54. [Google Scholar]
- Wu, H.Y.; Chen, X.M.; Gao, Y.Q.; He, J.S.; Liu, S.J. In-Situ shearing strength and penetration resistance testing of soft seabed sediments in western mining area. J. Cent. South Univ. Sci. Technol. 2010, 41, 1801–1806. [Google Scholar]
- Wang, C.; Yanjiang, Y.U.; Kou, B. Summary of Marine In-Situ Testing Methods. Ocean Dev. Manag. 2017, 34, 81–86. [Google Scholar]
- Chu, Y.; Cai, G.J.; Liu, S.Y. Study on Liquefaction Estimation Method Based on State Parameters of CPTU in Situ Measurement. China Earthq. Eng. J. 2014, 36, 905–910. [Google Scholar]
- Tang, A. A guide to penetration testing. Netw. Secur. 2014, 2014, 8–11. [Google Scholar] [CrossRef]
- Lu, F.C.; Qu, Y.D.; Liao, M.H. The Development Status and Applications of In Situ Cone Penetration Test Technology. Ocean Technol. 2004, 23, 32–36. [Google Scholar]
- Chen, Q.; Shi, Y.H.; Pan, Y. Downhole technology for submarine CPT and its device development. Ocean Eng. 2007, 25, 73–76. [Google Scholar]
- Sacchetto, M.; Trevisan, A.; Elmgren, K.; Melander, K. CPTWD (Cone Penetration Test While Drilling) a New Method for Deep Geotechnical Surveys. Geotechnical and Geophysical Site Characterization, Vol. 1 and 2; Millpress Science Publishers: Amsterdam, The Netherland, 2004. [Google Scholar]
- Lunne, T. The CPT in offshore soil investigations—A historic perspective. Proc. CPT 2010, 10, 71–113. [Google Scholar]
- Guo, S.Z.; Liu, R. Application of cone penetration test in offshore engineering. Chin. J. Geotech. Eng. 2015, 37, 207–211. [Google Scholar]
- Zhang, H.; Jia, Y.; Liu, X.; Wei, Z.; Ji, C.; Jiao, X.; Zhu, C. Progress in In-Situ Measurement of Sediment Mechanical Properties for Full Ocean Depth. Mar. Geol. Front. 2019, 35, 1–9. [Google Scholar]
- Bouwmeester, D.; Peuchen, J.; Van, D.; Sarata, B.; Willemse, C.; Van Baars, S.; Peelen, R. Offshore Technology Conference—Prediction of Breakout Forces for Deepwater Seafloor Objects. In Proceedings of the Offshore Technology Conference Offshore Technology Conference, Houston, TX, USA, 4 May 2009. [Google Scholar]
- Qi, C.; Xing, X.; Shi, Y.; Pan, Y. The Status and Development of Offshore Cone Penetration Testing at Home and Abroad. Geol. Res. South China Sea 2009, 8–89. [Google Scholar]
- Fudong, J.; Yonggang, J.; Xiaolei, L. Development and Application of New Offshore CPT Equipment. Coast. Eng. 2016, 35, 1–9. [Google Scholar]
- Shi-Min, L. Research on the Mechanical Structures of CPT System on Seabed of Shallow Ocean Area; Jilin University: Jilin, China, 2005. [Google Scholar]
- Dao-Hong, Q. Research on the Mechanical Structures of Tracked Carrier on CPT of Tidal Flat; Jilin University: Jilin, China, 2005. [Google Scholar]
- Jiang, Y.Y. The Study of Cone Penetration Testing Methods and the Application in Offshore Engineering; Tianjin University: Tianjin, China, 2011. [Google Scholar]
- Ji, F.; Jia, Y.; Liu, X.; Guo, L.; Zhang, M.; Shan, H. In Situ Measurement of The Engineering Mechanical Properties of Seafloor Sediment. Mar. Geol. Quat. Geol. 2016, 36, 191–200. [Google Scholar]
- Zhongde, G.; Xingsen, G.; Wei, Z.; Xing, W.; Xiaolei, L.; Jingbin, Z.; Jingxi, L.; Yonggang, J.; Tingkai, N. Multi-probe in-situ testing system and evaluation method for undrained shear strength of deep-sea shallow sediments. J. Eng. Geol. 2021, 29, 1949–1955. [Google Scholar]
- Liu, Y.; Zhu, H.Z.; Chen, G.B.; Zheng, H.J.; Wang, C.G. Development and application of the PeneVector Down-hole System. In Proceedings of the 15th National Conference on Engineering Geophysical Prospecting and Geotechnical Engineering Testing, Xiamen, China, 8–10 November 2017; pp. 55–56. [Google Scholar]
- Morgan, N.; Cathie, D. Tracked subsea trencher mobility and operation in soft clays. In Proceedings of the Sixteenth International Offshore and Polar Engineering Conference, Lisbon, Portugal, 1–6 July 2007. ISOPE-I-07-355. [Google Scholar]
- Hong, S.; Kim, H.W.; Choi, J.S. Transient dynamic analysis of tracked vehicles on extremely soft cohesive soil. In Proceedings of the International Society of Offshore & Polar Engineers Pacific/Asia Offshore Mech Symp, Daejeon, Republic of Korea, 17 November 2002. [Google Scholar]
- Dai, Y.; Liu, H.; Zhang, T.; Liu, S.J. Research on traction trafficability of seafloor tracked mining vehicle. China Sci. 2015, 10, 1203–1208. [Google Scholar]
- Steiner, A.; Kopf, A.J.; Henry, P.; Stegmann, S.; Apprioual, R.; Pelleau, P. Cone penetration testing to assess slope stability in the 1979 Nice landslide area (Ligurian Margin, SE France)—ScienceDirect. Mar. Geol. 2015, 369, 162–181. [Google Scholar] [CrossRef]
- Lunne, T. The Fourth James K. Mitchell Lecture: The CPT in offshore soil investigations—A historic perspective. Geomech. Geoengin. 2012, 7, 75–101. [Google Scholar] [CrossRef]
- Sultan, N.; Voisset, M.; Marsset, T.; Vernant, A.M.; Cauquil, E.; Colliat, J.L.; Curinier, V. Detection of free gas and gas hydrate based on 3D seismic data and cone penetration testing: An example from the Nigerian Continental Slope. Mar. Geol. 2007, 240, 235–255. [Google Scholar] [CrossRef]
- Boggess, R.; Robertson, P. CPT for Soft Sediments and Deepwater Investigations. In Proceedings of the Offshore Technology Conference, Houston, TX, USA, 2–5 May 2011. [Google Scholar] [CrossRef]
- Jorat, M.E.; Kreiter, S.; Mörz, T.; Moon, V.; de Lange, W. Utilizing Cone Penetration Tests for Landslide Evaluation. In Submarine Mass Movements and Their Consequences. Advances in Natural and Technological Hazards Research; Springer: Cham, Switzerland, 2014; Volume 37. [Google Scholar]
- Hawkins, R.A.; Markus, A. New Developments in Offshore Geotechnical Investigations. In Proceedings of the Offshore Site Investigation and Foundation Behaviour. Available online: https://onepetro.org/SUTOSIF/proceedings-abstract/OSIFB98/All-OSIFB98/SUT-OSIFB-98-259/3130 (accessed on 23 January 2023).
- Youjian, S.; Min, Q. The Development and Applications of Foreign Offshore Cone Penetration Test Technology. Urban Geotech. Investig. Surv. 2022, 192, 199–204. [Google Scholar]
- Robertson, P.K.; Robertson, K.L. Guide to Cone Penetration Testing and Its Application to Geotechnical Engineering; Gregg Drilling & Testing Inc.: Signal Hill, CA, USA, 2006. [Google Scholar]
- Robertson, P.K. Interpretation of cone penetration tests—A unified approach. Can. Geotech. J. 2009, 46, 1337–1355. [Google Scholar] [CrossRef]
- Fellenius, B.H.; Eslami, A. Soil profile interpreted from CPTu data. In Proceedings of the “Year 2000 Geotechnics” Geotechnical Engineering Conference, Asian Institute of Technology, Bangkok, Thailand, 27–30 November 2000; 18p. [Google Scholar]
- Eslami, A.; Fellenius, B.H. Pile capacity by direct CPT and CPTu methods applied to 102 case histories. Can. Geotech. J. 1997, 34, 886–904. [Google Scholar] [CrossRef]


| Cone Bottom Cross-Sectional Area | Cone Bottom Diameter /tolerance (mm) | Cone Angle (°) | Friction Sleeve Superficial Area | Friction Sleeve Length (mm) |
|---|---|---|---|---|
| 10 | 35.7/± 0.18 | 60/± 0.5 | 200 | 179/± 0.90 |
| Model Num | I | II | III | Non-Linear Error | Repeatability Error | Hysteresis Error |
|---|---|---|---|---|---|---|
| Cone Resident (MPa/FS) | 10 | 5 | 2 | 5% | 5% | 5% |
| Sleeve Friction (KPa/Fs) | 100 | 50 | 25 | 5% | 5% | 5% |
| Pore Pressure (MPa/FS) | 1 | 1 | 1 | 5% | 5% | 5% |
| Range (N/m) | Non-Linear Error /FS | Repeatability Error/FS | Hysteresis Error /FS |
|---|---|---|---|
| 6 | 0.5% | 0.5% | 0.5% |
| 9 | 0.5% | 0.5% | 0.5% |
| 12 | 0.5% | 0.5% | 0.5% |
| Width (mm) | Height (mm) | Thickness (mm) | Rod Diameter (mm) | Rod Length (mm) |
|---|---|---|---|---|
| 30 | 60 | 2 | 13 | 1060 |
| Cone Resistance (MPa) | Sleeve Friction (KPa) | Pore Pressure (MPa) |
|---|---|---|
| 30 | 375 | 1 |
| Length (mm) | Sectional Area | External Diameter (mm) | Taper Angle (°) |
|---|---|---|---|
| 650 | 10 | 35.68 | 60 |
Disclaimer/Publisher’s Note: The statements, opinions and data contained in all publications are solely those of the individual author(s) and contributor(s) and not of MDPI and/or the editor(s). MDPI and/or the editor(s) disclaim responsibility for any injury to people or property resulting from any ideas, methods, instructions or products referred to in the content. |
© 2023 by the authors. Licensee MDPI, Basel, Switzerland. This article is an open access article distributed under the terms and conditions of the Creative Commons Attribution (CC BY) license (https://creativecommons.org/licenses/by/4.0/).
Share and Cite
Zhong, K.; Chen, M.; Xie, C.; Zheng, J.; Chen, W.; Ou, W.; Yu, C. Design and Application of a Deep-Sea Engineering Geology In Situ Test System. Minerals 2023, 13, 184. https://doi.org/10.3390/min13020184
Zhong K, Chen M, Xie C, Zheng J, Chen W, Ou W, Yu C. Design and Application of a Deep-Sea Engineering Geology In Situ Test System. Minerals. 2023; 13(2):184. https://doi.org/10.3390/min13020184
Chicago/Turabian StyleZhong, Kaiming, Ming Chen, Chao Xie, Jinrong Zheng, Wei Chen, Wen Ou, and Chunliang Yu. 2023. "Design and Application of a Deep-Sea Engineering Geology In Situ Test System" Minerals 13, no. 2: 184. https://doi.org/10.3390/min13020184
APA StyleZhong, K., Chen, M., Xie, C., Zheng, J., Chen, W., Ou, W., & Yu, C. (2023). Design and Application of a Deep-Sea Engineering Geology In Situ Test System. Minerals, 13(2), 184. https://doi.org/10.3390/min13020184