Article

Experimental Investigation into the Proportion of Cemented Aeolian Sand-Coal Gangue-Fly Ash Backfill on Mechanical and Rheological Properties

School of Energy and Mining Engineering, China University of Mining and Technology, Beijing 100083, China
*
Author to whom correspondence should be addressed.
Minerals 2023, 13(11), 1436; https://doi.org/10.3390/min13111436
Submission received: 25 October 2023 / Revised: 8 November 2023 / Accepted: 11 November 2023 / Published: 13 November 2023
(This article belongs to the Special Issue Backfilling Materials for Underground Mining, Volume III)

Abstract

:
Aiming at the problems of large water secretion, poor suspensibility and low strength of cemented aeolian sand (AS)-fly ash (FA) backfill (CAFB) mixtures, CAFB was doped with fine coal gangue (CG) particles crushed to less than 4 mm and configured as cemented aeolian sand-coal gangue-fly ash backfill (CACFB) mixtures, in which coal gangue accounted for 8% of the mass ratio of the slurry. Through UCS and rheological experiments, using the response surface methodology and an orthogonal design, the following conclusions were drawn: (1) With the increase in ordinary Portland cement (PO) and slurry concentration, the UCS of the CACFB increased. (2) With the increase in the FA dosage, the UCS of the CACFB decreased first and then increased due to the gradual increase in FA dosage, destroying the reasonable ratio of the material and leading to the reduction in the material’s UCS, and with the growth in time, the volcanic ash effect of the FA caused the UCS of the material to increase. (3) With the increases in slurry concentration, the yield stress and viscosity coefficient of the slurry increased. (4) Reasonable proportions for CACFB should ensure the strength characteristics and rheological properties of the material. Through theoretical and experimental research, the final reasonable proportions were as follows: the concentrations of slurry, AS, CG, FA and PO were 77.5%, 42%, 8%, 17.5% and 10%, respectively. This ensured that the UCSs of the CACFB at 3 d, 7 d and 28 d were 1.2 MPa, 2.5 MPa and 4.3 MPa, respectively; the yield stress of the CACFB was 495 Pa, and the viscosity coefficient was 3.97 Pa·s. These reasonable proportions of the CACFB can meet the strength index and flow property of material industrial experiments.

Graphical Abstract

1. Introduction

It is expected that cemented aeolian sand-coal gangue-fly ash backfill (CACFB) will play a role in boosting the green development of urban agglomeration along the Yellow River, Yulin City, northern Shaanxi [1,2,3,4,5,6]. Yulin City is located at the southern edge of the Maowusu Sandy Land and is one of the national land desertification and sandy areas; most of the surface is surrounded by aeolian sand. Relevant experts and scholars have conducted specific research on CAFB, but due to the defective particle size of CAFB, CAFB slurry has the characteristics of water seepage, sedimentation, low strength and volume reduction, which leads to the process of a mine-filling system using CAFB as the main aggregate in a low valley [7,8,9,10,11,12,13,14]. With the high-speed development of the coal economy in the Yulin area, there are more and more coal resources to be found in industrial plazas, in water bodies, under railroads, and in depleted mines using room-and-pillar mining methods, as well as the emission of solid waste, such as coal gangue and fly ash, which is subject to more and more stringent environmental protection laws and regulations [13,15,16,17,18]. For the problems regarding CAFB, theoretical research, laboratory experiments and on-site industrial practice were adopted to a series of macroscopic and microscopic experiments, which were carried out to develop CACFB, and it was concluded that CACFB has the advantages of good suspensibility, low water secretion and high strength, which provides a strong reference for the related industrial filling application of using aeolian sand as a filling aggregate [19,20,21,22]. Koohestani, Koubaa, et al. [23] investigated the effects of adding maple sawdust on the mechanical and microstructural properties of cement paste backfill (CPB). The addition of 12.5% maple sawdust (by dry mass of binder) increased the strength development of CPB specimens at a later hydration age (91 maintenance days). However, at a higher maple sawdust content of 14.5%, the UCS showed less improvement. Liu et al. [24] investigated the key to quality control of the filler, and the strength of the filler affects the design for industrial applications. The results show that the UCS values obtained from oblique shear damage are usually higher than those obtained from axial cleavage damage for the same formulation and curing time. Xin et al. [25] investigated a new aeolian sand-cement-modified aerated slurry backfill (ACGPB) model. The addition of cement-modified gasified slag to aeolian sand material was proposed, and the relationship between the mechanism of ACGPB and the type and dosage of the activator was explored through a combination of slump tests, uniaxial compressive strength tests, microscopic tests and leaching toxicity tests. Kesimal et al. [26] investigated the effects of physical, chemical, and mineralogical properties of tailings and binders on the short-term and long-term unconfined compressive strength (UCS) of cement paste backfill (CPB) samples by using two different types of sulfide tailings (tailings T1 and T2) and silicate cementitious binders (B1 and B2). Koohestani et al. [27] investigated the effect of nanosilica (NS) addition on the development of the consistency and compressive strength of cement paste backfill (CPB). The study showed that 5% tetraethyl silicate and 0.5% ether-based polycarboxylate superplasticizers (by binder mass) provided the best compressive strength. Cao et al. [28] investigated the effect of structural factors on the uniaxial compressive strength (UCS) of consolidated tailings backfill (CTB) by experimentally investigating the effect of structural factors around the filling time (FT), the filling interval time (FIT) and the angle of the filling surface (FSA). Ruan et al. [2] investigated the long-term mechanical properties and leaching behavior of mine backfill material (MFPB) prepared using modified magnesium slag-fly ash cemented aeolian sand. The strength of the MFPB increased with curing time, reaching 4.984–17.140 MPa at 300 d. Hu et al. [29] investigated CPB by mixing different amounts (0%, 0.2%, 0.4% and 0.6%) of air-entraining agents with different compounds (tailings, cement, etc.). The quantitative relationship of AEA on the micro-characterization of the pore structure of CPB was established using nuclear magnetic resonance (NMR), scanning electron microscopy (SEM) and fractal theory. It was shown that the mesostructure of the backfill at 30% waste rock content was more reasonable and had better mechanical properties than the backfill at other ratios. The yield stress and viscosity are the key rheological parameters for evaluating the CACFB transport capacity in the design of pipeline reticulation systems [19,30,31,32,33]. Many experimental methods have been used to study the particle effects of concentration, size, distribution, shape, surface activity, etc., on the yield stress values of various suspension systems [34,35,36,37,38,39,40]. The yield stress is the critical shear stress that causes irreversible plastic deformation and allows the fluid to flow in the pipe [41,42,43,44]. The yield stress must be in the optimal range to allow for laminar transport of CACFB in the pipeline (velocity range 0.1 m/s to 1.5 m/s) without solids settling. The viscosity is the frictional resistance of two layers of concentrated fluid in the flow state. It is well known that the rheology of CACFB is influenced by various factors, such as the solids concentration, cement type and its concentration, chemical additives and their concentrations, particle size distribution, water chemistry and temperature [41,42,43,45,46,47]. This study mainly utilized UCS and rheological experiments to investigate the effects of PO, FA and concentration on the UCS of the material, as well as on the rheological parameters of the slurry; determine the optimal proportioning scheme of the slurry by adopting the response surface methodology and orthogonal methodology; and theoretically analyze the degree of influence of the three factors on the strength and rheological properties of the material through numerical analysis methods.

2. Materials and Methods

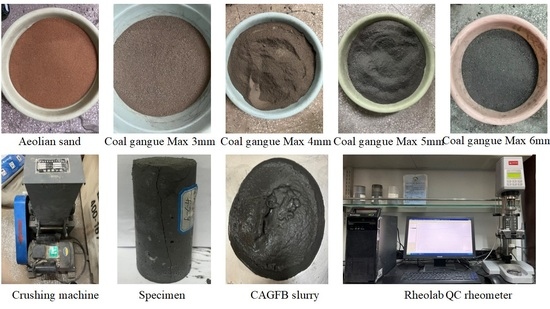
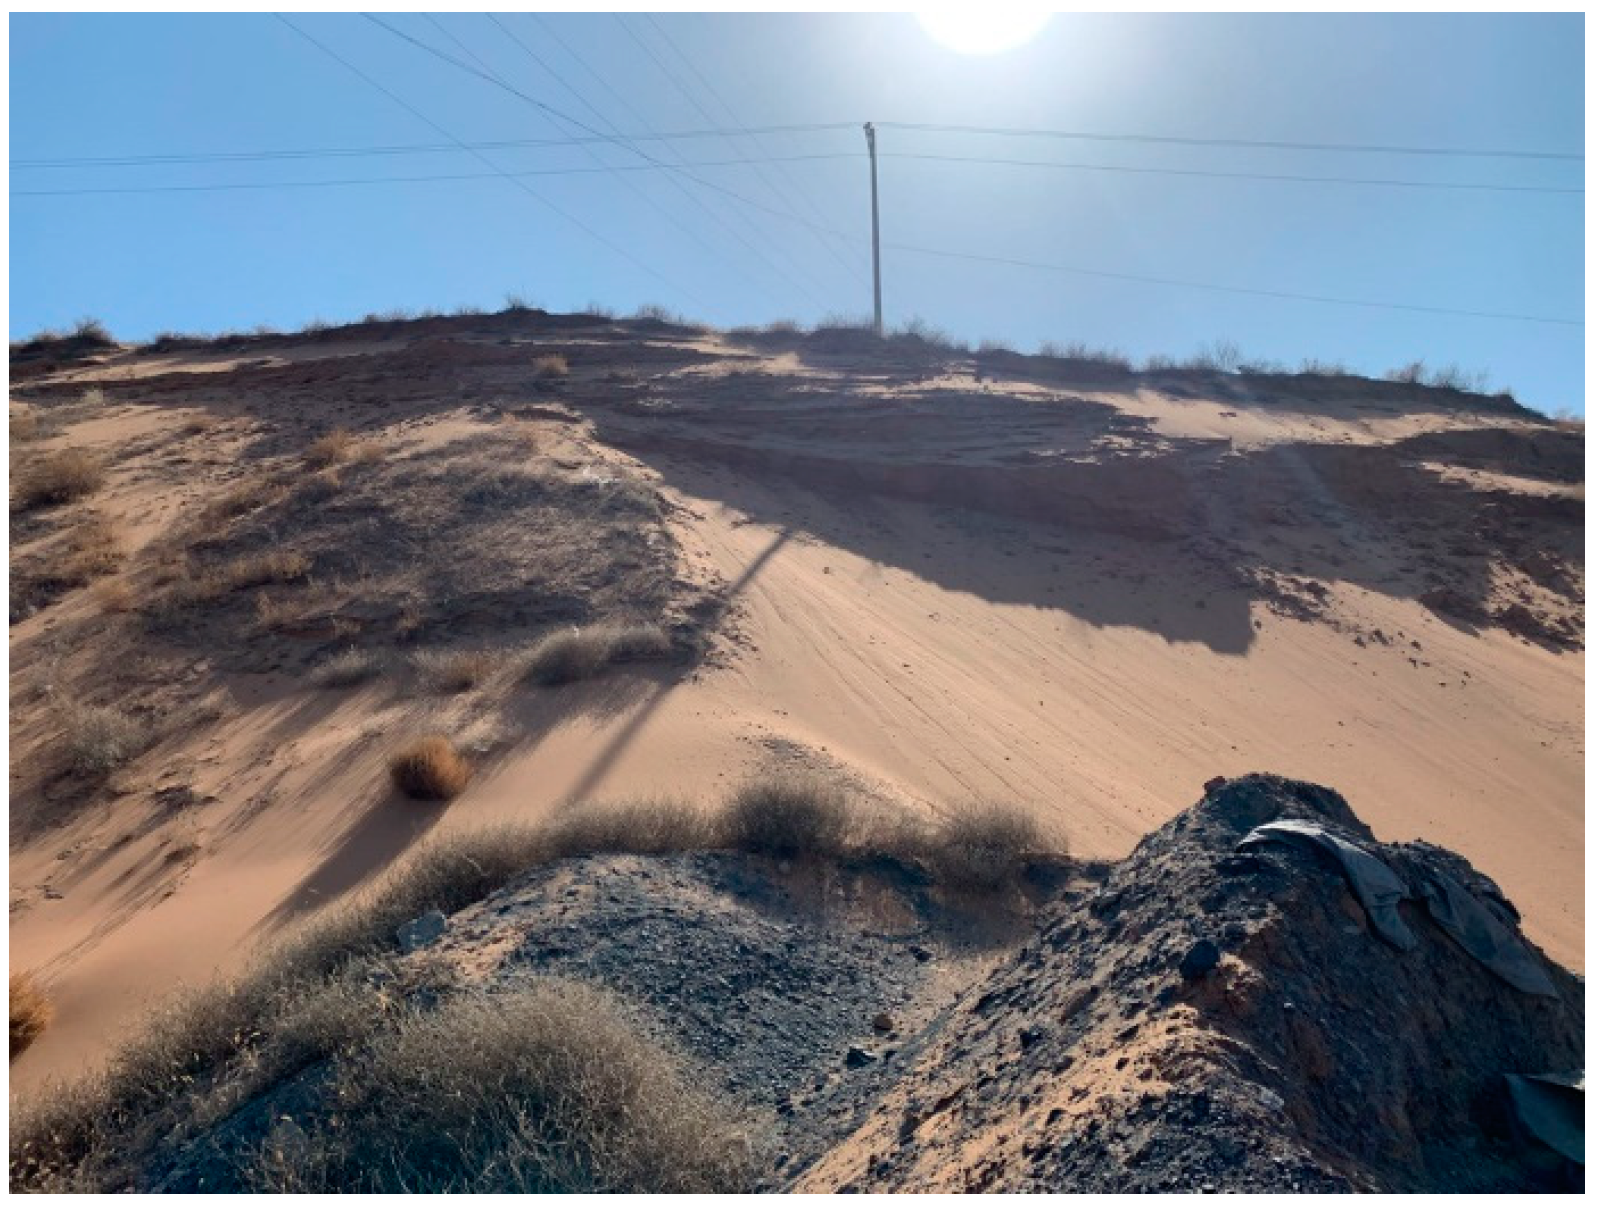
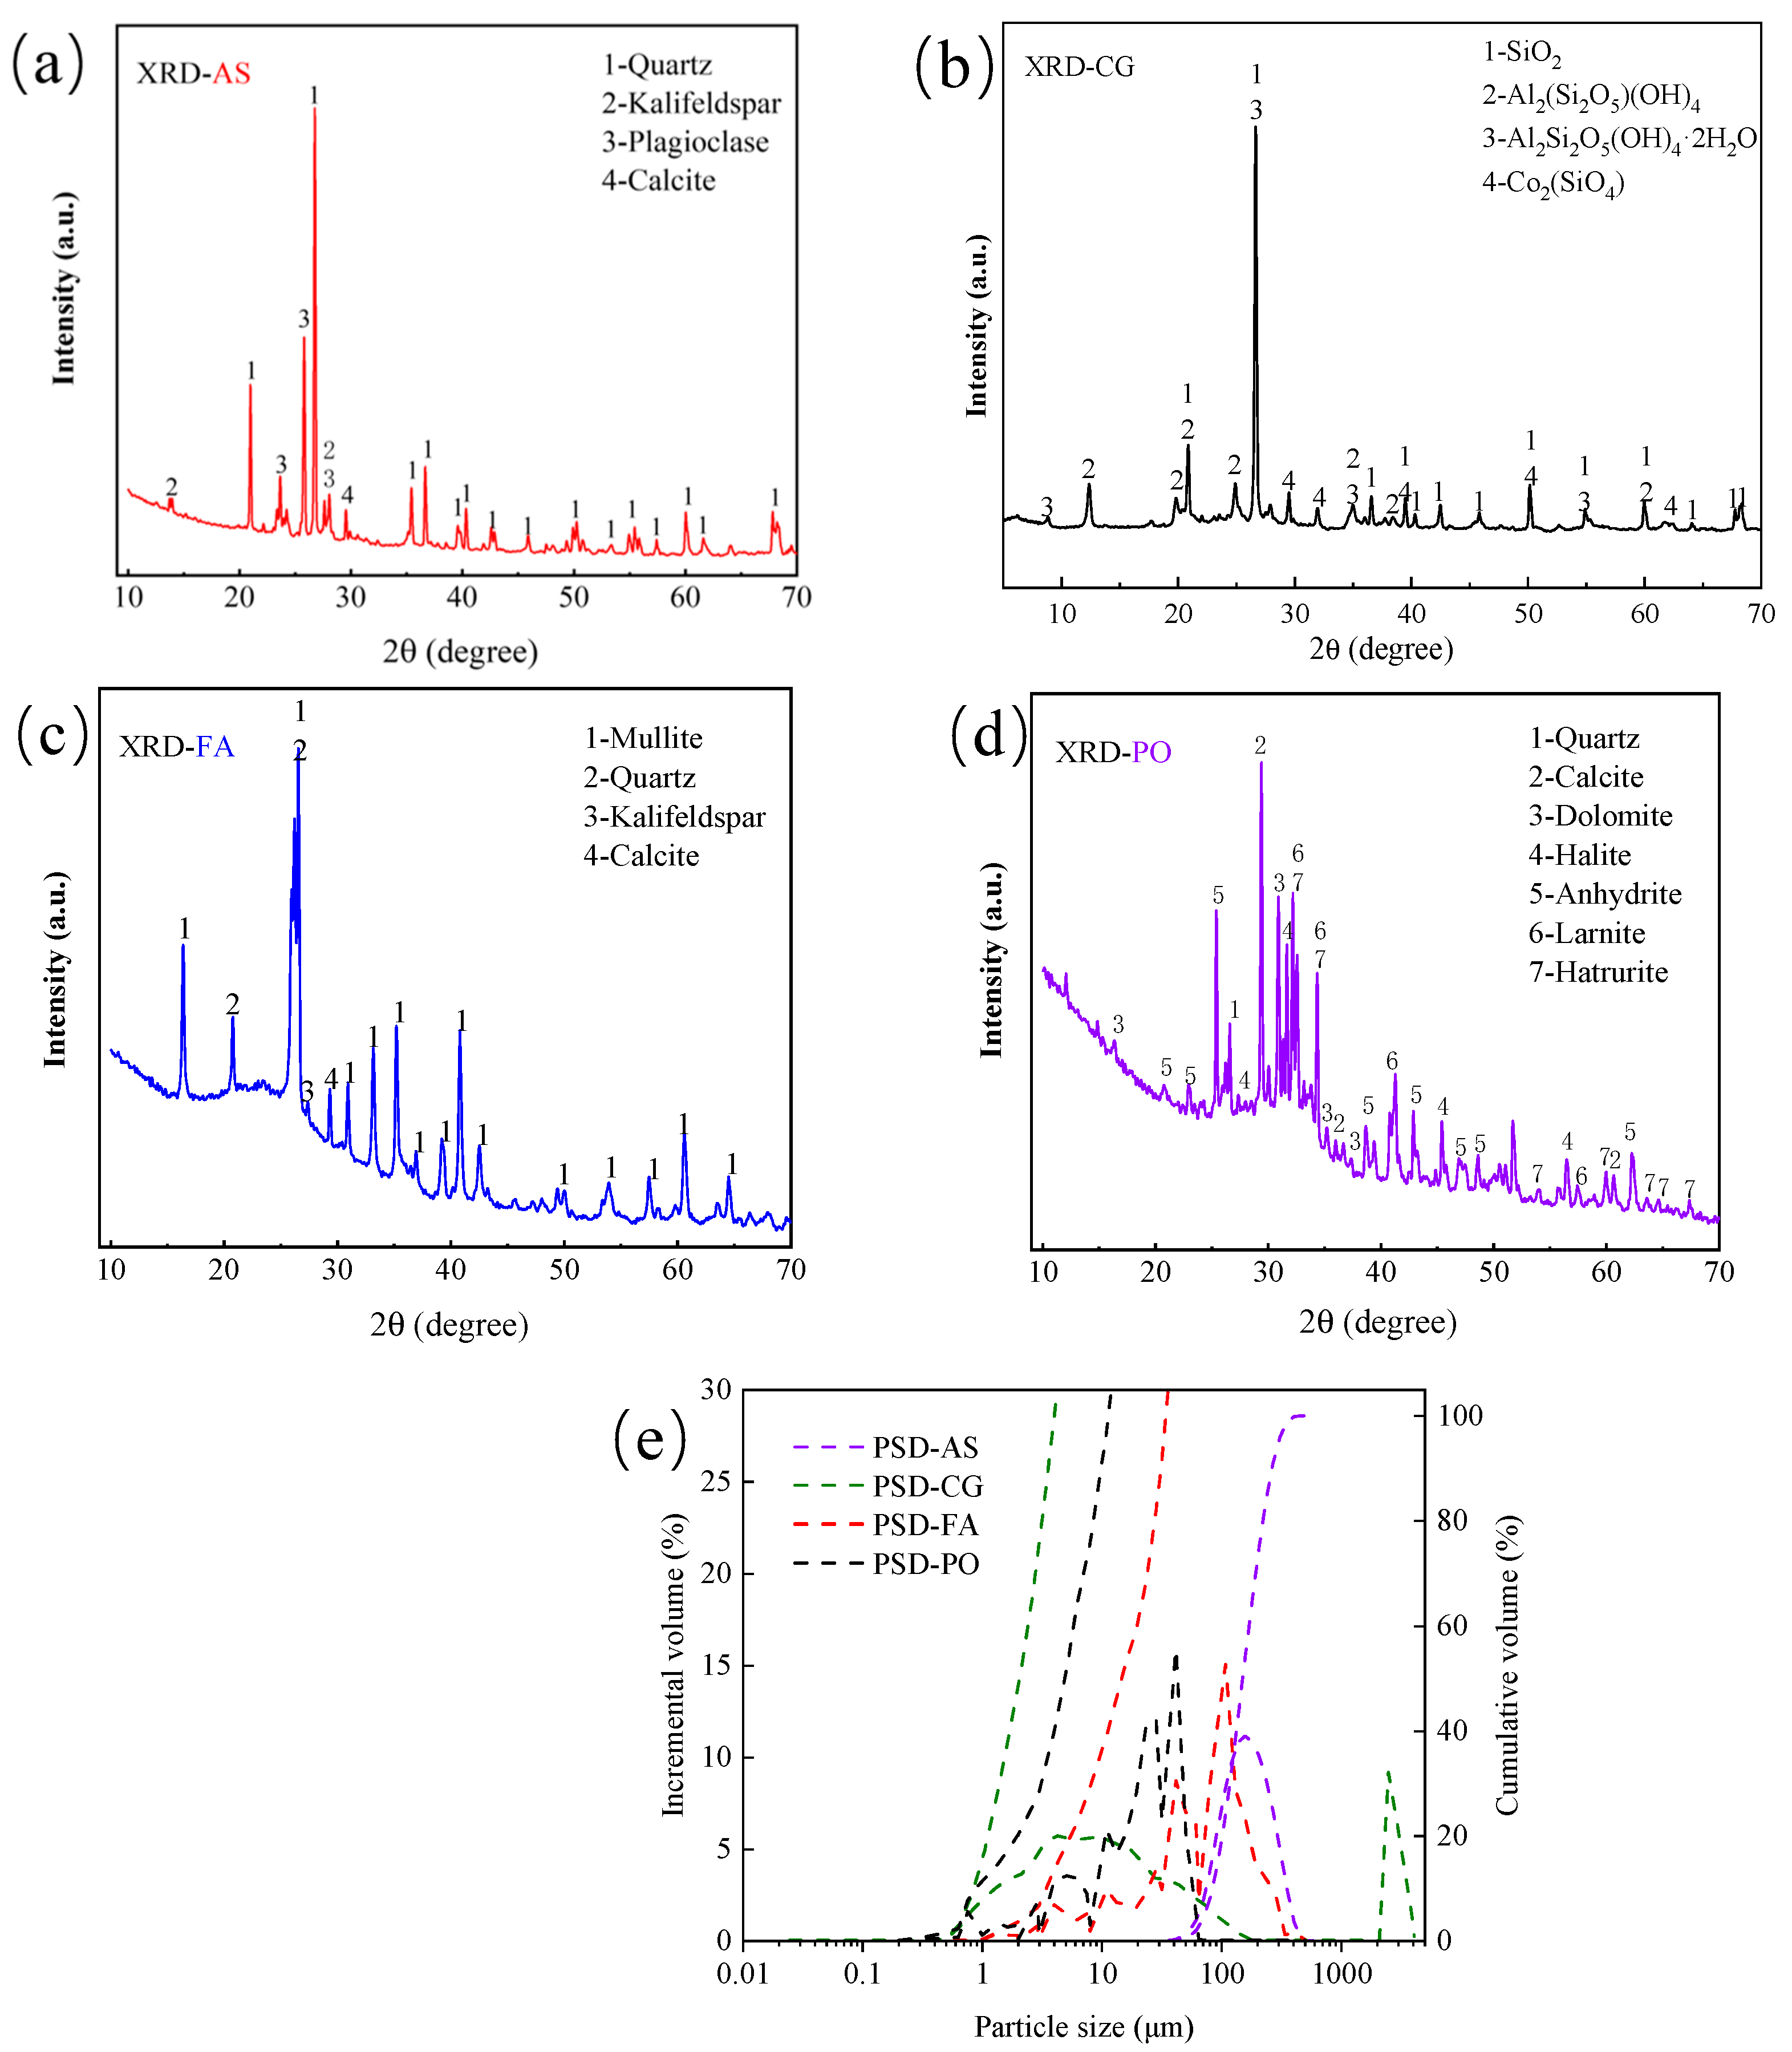
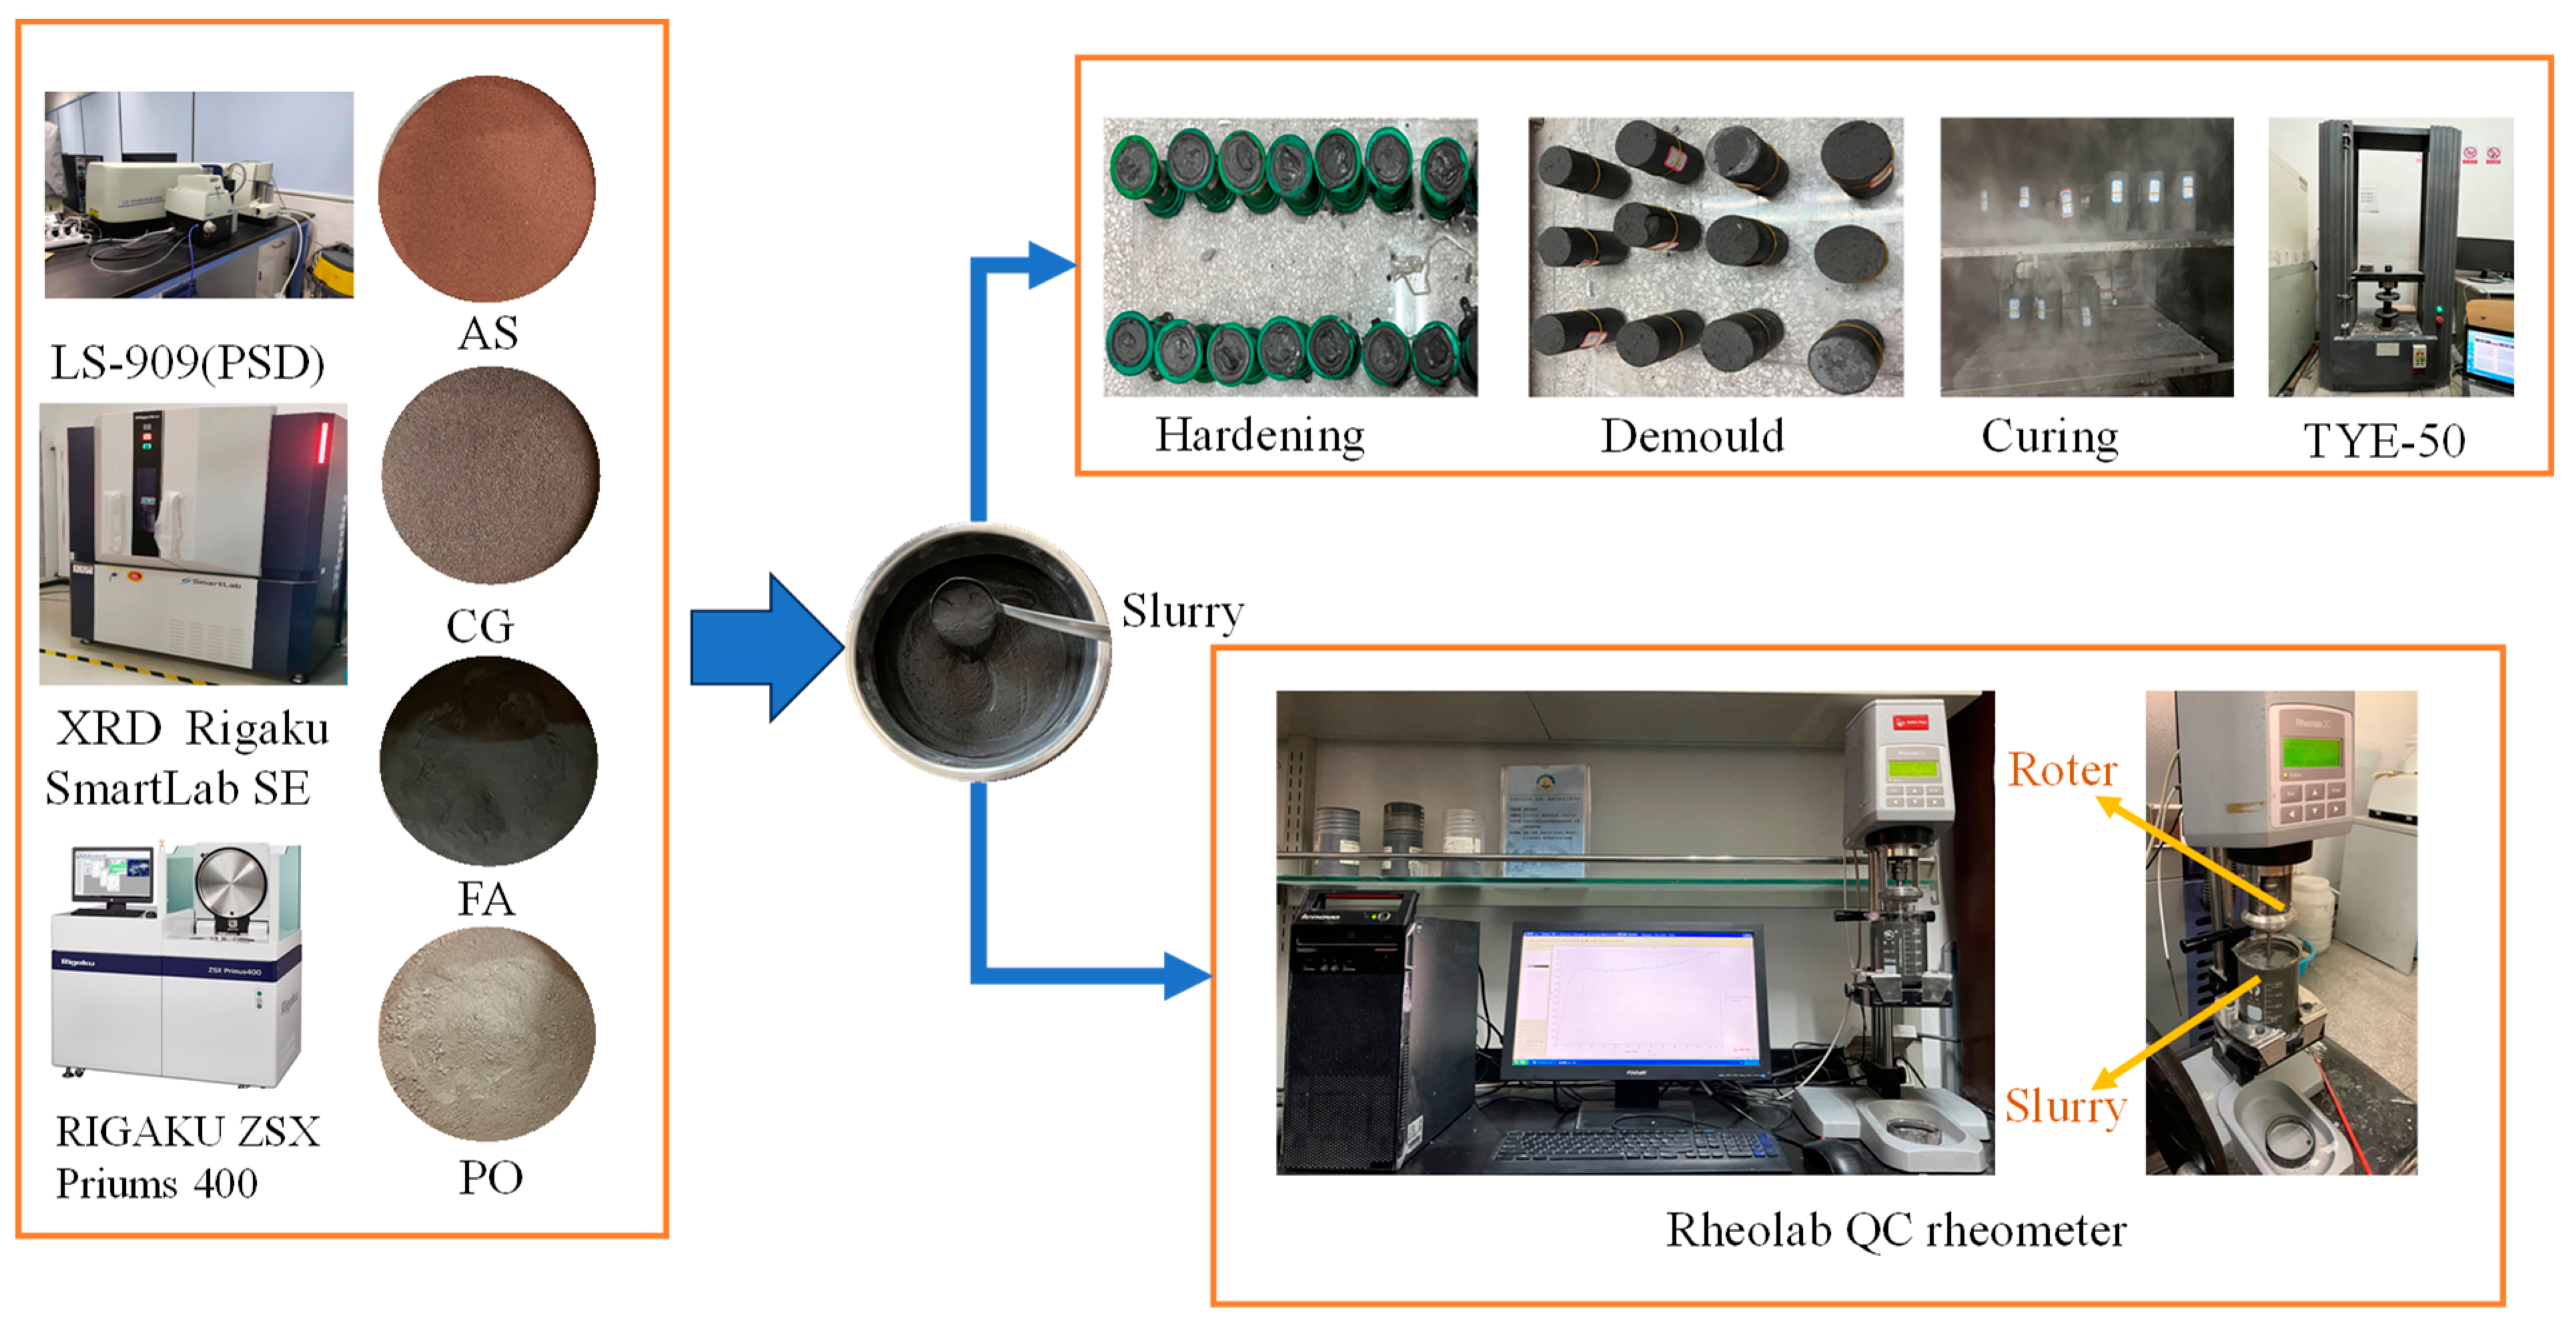
2.1. Materials and Characterization

The CACFB preparation included AS (Figure 1), CG, FA, PO and water. AS and CG samples were collected from near the Shiyaodian coal mine in Shenmu, Yulin, Shaanxi, China. FA samples were collected from the Shenmu Guohua Power Plant in Yulin, Shaanxi, China. The PO was ordinary Portland cement 425# (P.O. 42.5). Before the preparation of the backfill sample blocks, the fundamental properties (e.g., particle size distribution (PSD), chemical composition and mineral composition) of the raw backfill materials were tested.
To analyze the chemical and mineral compositions and PSD of AS, CG, FA and PO, an X-ray diffraction (XRD) spectrometer (Rigaku SmartLab, Nagano, Japan), X-ray fluorescence (XRF) spectrometer (RIGAKU ZSX Priums 400, Nagano, Japan) and laser diffraction particle size analyzer (LS-909, Zhuhai, China) were used. The analysis results of the chemical composition (using X-ray fluorescence), mineral composition (by X-ray diffraction) and PSD results are summarized in Table 1 and shown in Figure 2. The maximum particle size of the AS was 458.09 μm and ranged from 36.1 to 401.6 μm, accounting for 99.88%. The maximum particle size of the CG was 4100 μm and ranged from 0.517 to 4100 μm, accounting for 99.79%. The particle size of the PO ranged from 0.24 to 65 μm, with a maximum of 192.6 μm. The particle size of the FA ranged from 0.92 to 413.14 μm and the maximum was 500 μm.

2.2. Sample Preparation

To guarantee the homogeneity of the CACFB materials, a mixer was first used to mix the AS, CG, FA and PO for 5 min to form a well-mixed mixture. Then, weighed pure water was poured into the mixer, and the mixed dry material and water were again mixed thoroughly for 5 min. (1) To prepare for the rheological test, the mixing of the homogeneous slurry was moved to a 500 mL beaker. Then, the beaker was placed in a rheometer static seat; the rotation of the buckle was fixed. The rotor was placed in the upper two-thirds of the beaker. The rheometer was started and records were kept to ensure the reliability of the data. It was necessary to undertake 3 groups of consecutive tests and the data of the curve that represented a reasonable rheological curve were selected. (2) To prepare for the UCS test, after mixing, the slurry was poured into a 50 mm × 100 mm cylindrical specimen pre-coated with a mold release agent. After demolding, the specimens continued curing in the curing box, and after curing to the required age, the average of the three values was taken for each test to ensure the reliability of the data and the test process; the results are shown in Figure 3.

2.3. Experimental Design

Experiment 1 tested the UCS of the material, and experiment 2 tested the rheological properties of the material. Its experimental design program is shown in Table 2 and Table 3. The material of the coal gangue was crushed to less than 4 mm, and the amount of coal gangue was 8% of the total weight of the slurry.

2.4. Methods

2.4.1. Response Surface Methodology (RSM)

The purpose of experiment 1 was to analyze the influences of PO content (X1), FA content (X2) and concentration (X3) effects on the UCS of the CACFB. Accordingly, these three internal factors were considered as response surface parameters. The UCS at 3 d, 7 d and 28 d were considered response surface indexes. Thirteen experimental groups (labeled #1–#13) were designed using an RSM–BBD (Box–Behnken design). The value ranges of the PO content, FA content, and concentration were 8 wt%–12 wt%, 16 wt%–20 wt% and 77 wt%–81 wt%, respectively. The version of the Design Expert software used was Design-Expert 12.

2.4.2. Orthogonal Design

The purpose of experiment 2 was to analyze the influences of PO content (X1), FA content (X2) and concentration (X3) effects on the rheological properties of the CACFB. Accordingly, these three internal factors were considered independent variable parameters. The yield stress and viscosity coefficient of the slurry were considered dependent variable parameters. Twenty-five experimental groups (labeled #1–#25) were designed using an orthogonal design. The value ranges of the PO content, FA content, and concentration were 9 wt%–11 wt%, 16.5 wt%–18.5 wt% and 77 wt%–81 wt%, respectively.

2.4.3. Uniaxial Compressive Strength Tests

The compressive strength measurements were conducted according to the Chinese standard JGJ/T 70-2009, and a computer-controlled mechanical press (TYE-50) was used for the uniaxial compressive strength measurements. The normal loading capacity of this press was 50 kN and the displacement rate during the test was 0.5 mm/min.

2.4.4. Rheological Properties Test

The rheological properties of the CACFB slurry were measured using a Rheolab QC rheometer and R/S-type four-blade rotor (Anton paar RheolabQC, Germany). The rate control was used in the shear-testing process; in the test procedure, the shear rate was increased linearly from 0 s−1 to 120 s−1 at a constant rate over a test time of 120 s. First, the rheological test was conducted for the evenly stirred fresh slurry. The rheological test results were fitted using rheological constitutive equations to determine the yield stress and viscosity coefficient.

3. Results and Analysis

3.1. Analysis of the UCS

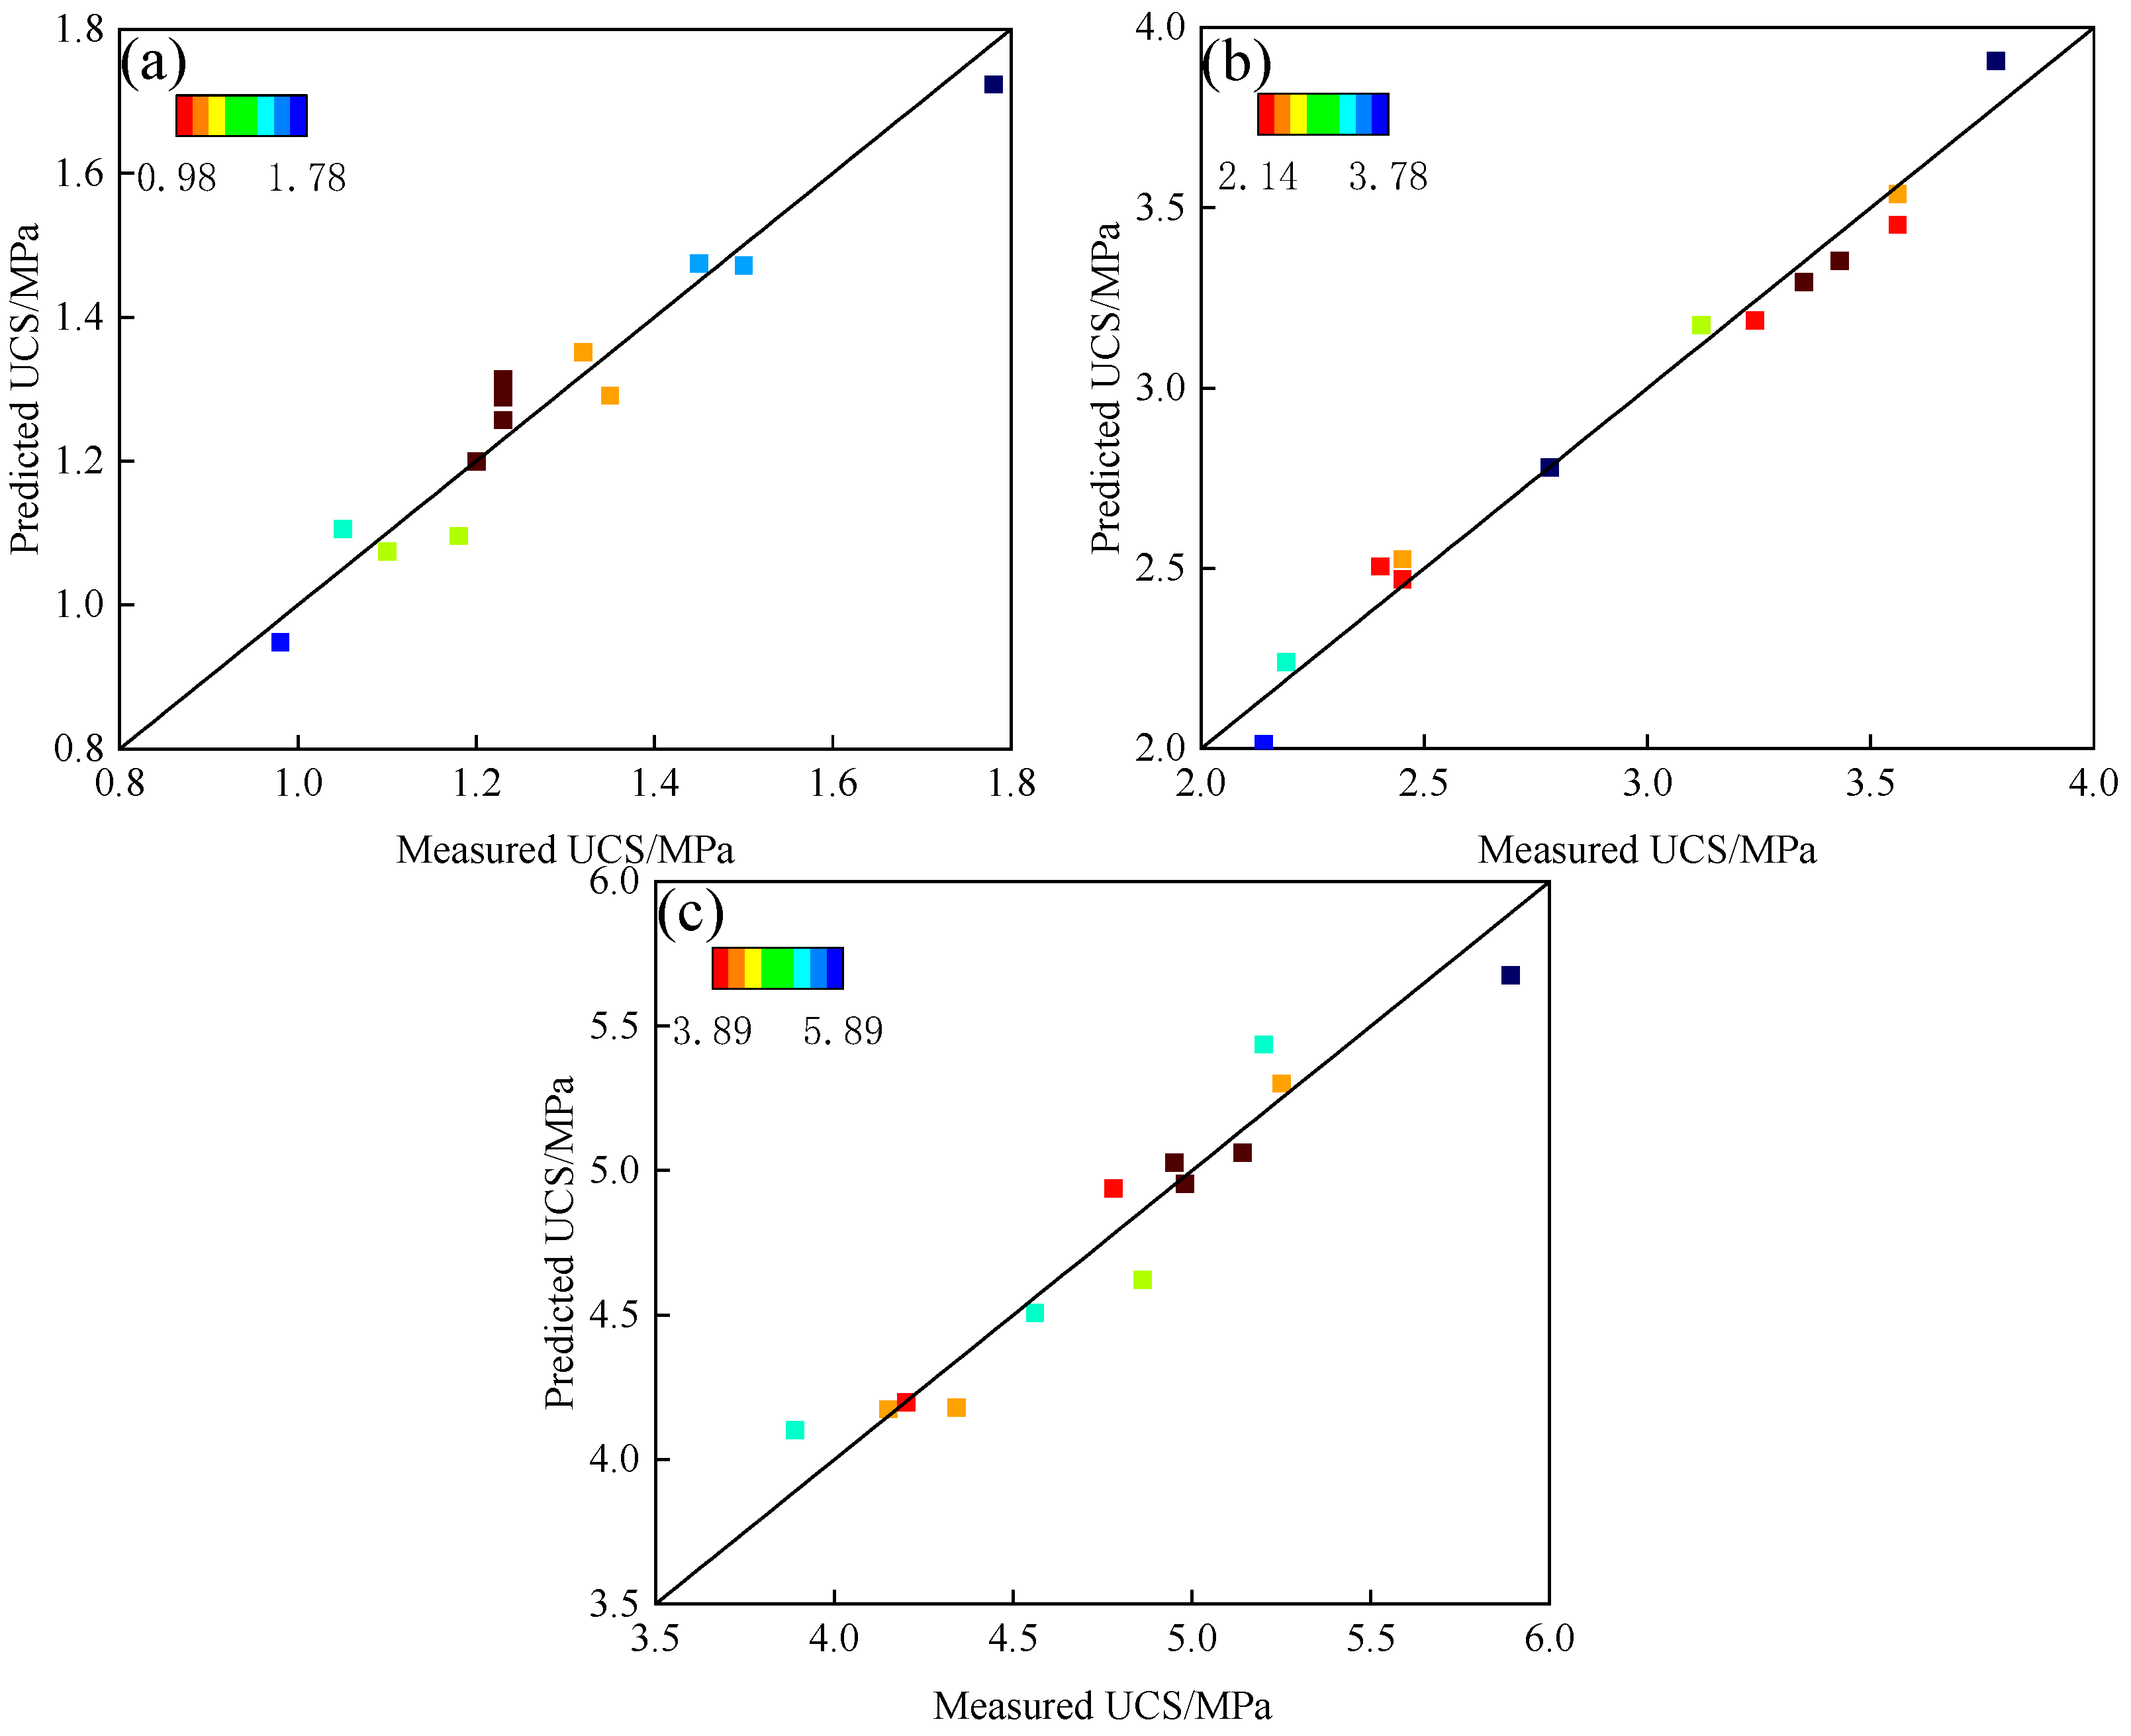
3.1.1. Validation of Analysis of Variance Models

A total of 13 test groups were designed for the experiment using the BBD method, and the RSM-BBD results are shown in Table 4. The analysis of variance (ANOVA) and model verification were conducted for the RSM–BBD test results listed in Table 4, and the analysis results are summarized in Table 5.
The UCSs at 3 d, 7 d and 28 d of the CACFB are denoted as Y1, Y2 and Y3, respectively, and the UCSs predicted using the response surface analysis are denoted as Y1’, Y2’ and Y3’, respectively.
In order to evaluate the accuracy of the response surface regression results, Design-Expert software was used to analyze the ANOVA of the compressive strength of the filling block for 3 d, 7 d and 28 d. The results are shown in Table 5. Scatter plots of the measured values of the compressive strength test results of the filling block for 3 d, 7 d and 28 d and the predicted values of the model were plotted as the horizontal and vertical coordinates, respectively, for the comparisons, and the results are shown in Figure 4.
From the ANOVA results shown in Table 5, the F-value of the regression model of the UCS of the filler at three ages was greater than F0.95 (3, 9) = 3.86; the P-value was less than 10−4; and the three models had goodness-of-fit values of 0.9420, 0.9807 and 0.9412, respectively, which indicates that the regression effect of each model was significant. As shown in Table 5 and Figure 4, the relative errors between the predicted and measured values were within ±10%, and the scatter points of the predicted and measured values were located near Y = X, which indicates that the fitting models of the UCS of the filling body at the three ages had a good fit and could be used to analyze and predict the test results.
As can be seen from Table 5, the UCS was not only affected by a single factor but also by two-factor interactions. For the 3 d UCS, the effects of the PO mass fraction X1, solids mass fraction X3, and the interaction of PO and solids mass fractions X1X3 were significant; the non-significant two-factor interactions were all related to the FA mass fraction X2, indicating that the FA had a small effect on the 3 d strength. For the 7 d strength, the effects of the PO mass fraction X1, solids mass fraction X3, PO–FA mass fraction interaction X1X2 and PO–solids mass fraction interaction X1X3 were significant. For the UCS at 28 d, the PO mass fraction X1 and solids mass fraction X3 had significant effects.
From the analysis of the above significant factors, the PO mass fraction and solid mass fraction were always the most significant factors that affected the UCS of the filler at all ages, and the FA mass fraction had a general effect on the UCS.

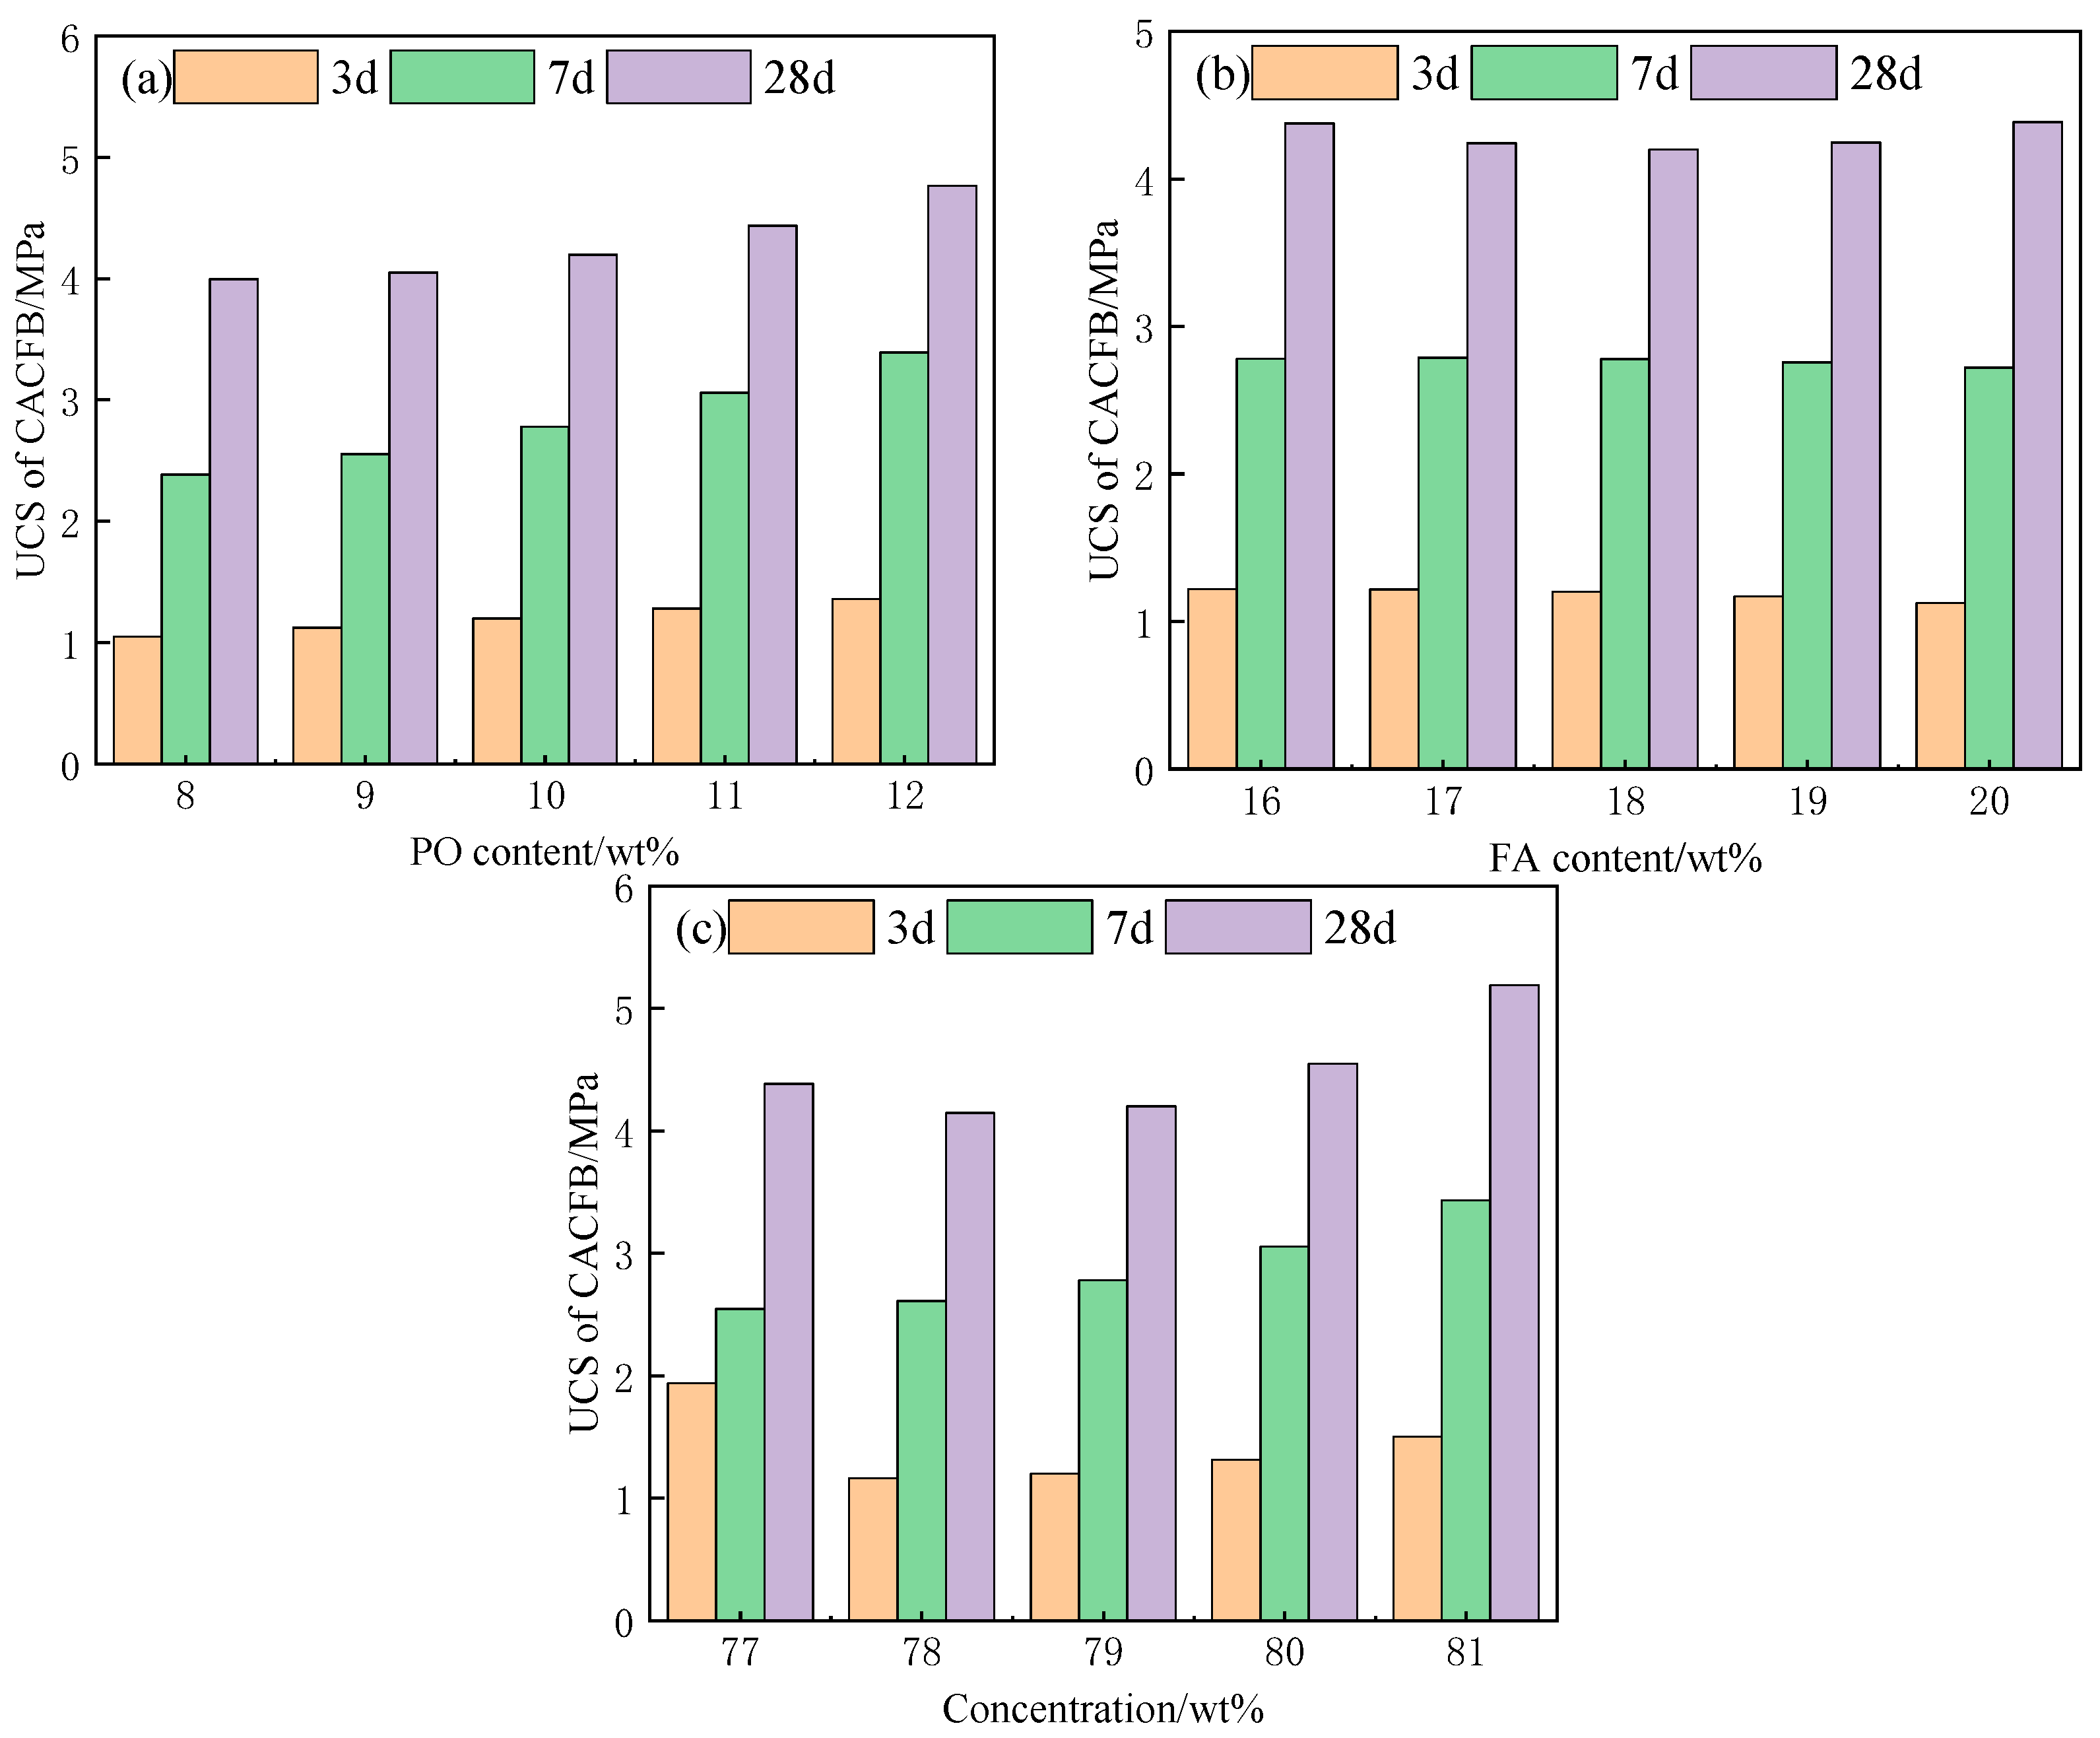
3.1.2. Influence of the Single Factors on the UCS

The advantage of the response surface methodology is that the results of the response index can be accurately predicted for any change value within the range of variation of each factor. In view of this, each factor could be taken as five change values within its range of variation to analyze the effect of a single factor, i.e., PO mass fraction X1, FA mass fraction X2 or solids mass fraction X3, on the UCS, as shown in Figure 5. Taking X2 = 18% and X3 = 79%, the effect of the PO mass fraction X1 on the UCS is shown in Figure 5a; taking X1 = 10% and X3 = 79%, the effect of the FA mass fraction X2 on the UCS is shown in Figure 5b; taking X1 = 10% and X2 = 18%, the effect of solid mass fraction X3 on the UCS is shown in Figure 5c.
As can be seen in Figure 5a, the UCS of the filled body increased with the increase in the PO mass fraction and the age of curing, and the PO had a significant effect on the UCS throughout the age of curing. PO is the fundamental source of hydration products. After the hydration reaction between PO and water, it mainly generates calcium silicate (C-S-H), calcium hydroxide (C-H) and calcium alumina (AFt). The hydration products, on the one hand, cover and wrap the coal gangue particles, and, on the other hand, fill up the pore space inside the filling body; along with the increase in the mass fraction of PO and hydration, the aggregate particles and the hydration products are connected to form a floc network, and thus, the UCS of the filling body is significantly affected throughout the maintenance age. Aggregate particles and hydration products overlap with each other to form a floc network, thus increasing the UCS.
From Figure 5b, the FA mass fraction had a weak effect on the UCS in the early stage (3~7 d) and had a significant effect on the UCS in the later stage (28 d). The effect of FA on the UCS depends on its micro-collector effect and volcanic ash activity; with the increase in FA, FA acts as a micro-collector particle to fill the coal gangue voids, which increases the UCS of the filling body. By continuing to increase the mass fraction of FA, the micro-collector particles become too large, and the fine particles of the filling body are “oversaturated”, destroying the best gradation state such that the UCS of the filling body is reduced. In the late stage (28 d), the volcanic ash effect of FA generates hydration products. The aggregate has a bonding effect; with an FA mass fraction of more than 18%, the volcanic ash effect and the effect of micro-collected particles acted together such that the UCS of the filling body became smaller than that of the early filling body.

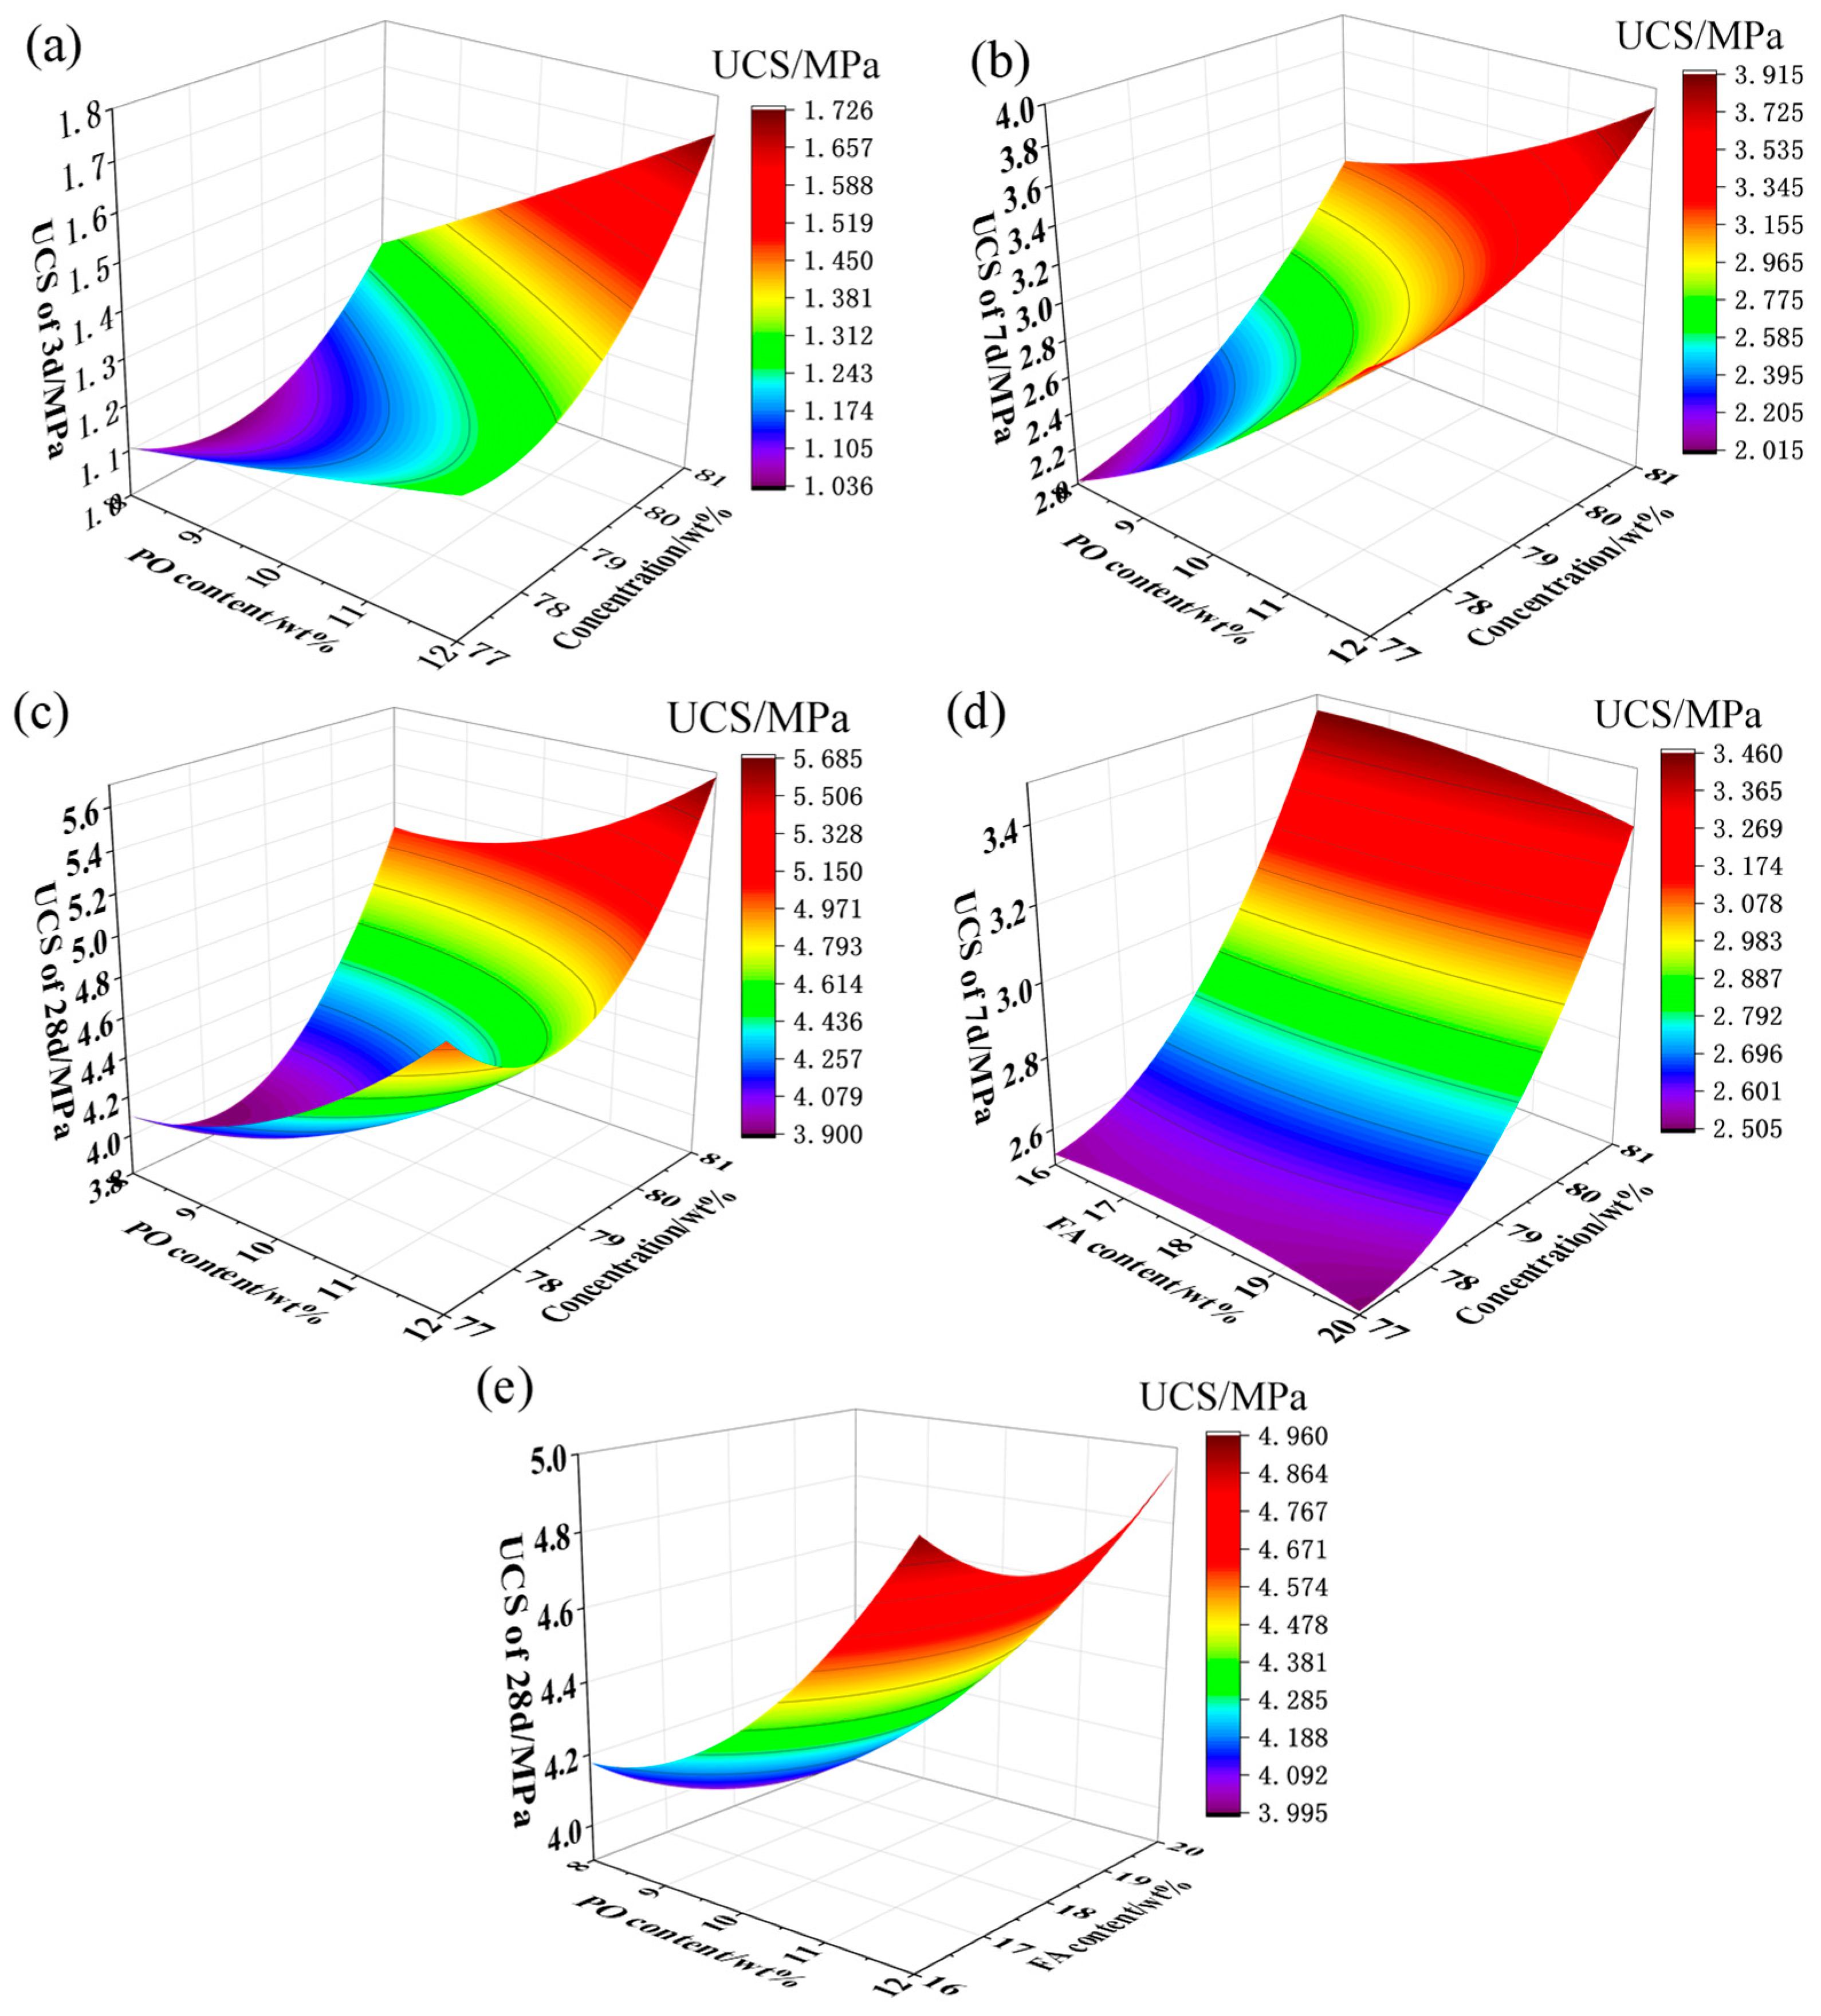
3.1.3. Influence of the RSM Interaction Terms on the UCS

From Figure 6a–c, the 3, 7 and 28 d UCSs of the CACFB increased with the increase in both the PO mass fraction and solid mass fraction. When the PO mass fractions were 8% and 12%, the 3 d UCSs of the CACFB increased by 0.182 and 0.432 MPa, the 7 d UCSs increased by 1.162 and 0.713 MPa, and the 28 d UCSs increased by 0.96 and 0.65 MPa, respectively. When the mass fractions of solids were 77% and 81%, the 3 d UCSs of CACFB increased by 0.185 and 0.435 MPa, the 7 d UCSs increased by 1.282 and 0.732 MPa, and the 28 d UCSs increased by 0.925 and 0.615 MPa, respectively. It can be seen from the above data that for the 3 d UCS of the CACFB, the influence of the PO mass fraction X1 was smaller than that of the solids mass fraction; for the 28 d UCS of the CACFB, the influence of the solids mass fraction X3 was smaller than that of the PO mass fraction X1, while the influences of the PO and solids mass fractions on the 7 d UCS were similar, which is in line with the results in Table 4. The effects of the PO or solids mass fraction on the 3 d UCS of CACFB increased gradually with the increase in the other factor, and the enhancement effect on the 7 d and 28 d UCSs decreased gradually with the increase of the other factor.
In the early stage of hydration (3 d), due to the increase in the mass fraction of solids, the internal water content of the CACFB decreased. When the water content decreases, PO particles cannot be in adequate contact with water molecules within a relatively short period, resulting in the hydration process being slowed down; with the decrease in the internal pore space of CACFB, the UCS will still be increased, but due to the slow increase in the UCS and hydration process, the increase in the mass fraction of PO is slowed down such that the enhancement of PO and the mass fraction of solids with the increase in the other factor is weakened.
In the middle and late stages of hydration (7 and 28 d), due to the long hydration time, the PO particles can fully generate hydration products with water molecules, the amount of hydration products increases and the hydration products are dominated by C-S-H, which is the main hydration product that enhances the solid material UCS. After the increase in the mass fraction, the contact effect between particles inside the filling body is better, and the mutual contact between the hydration products and particles is denser. The interaction of the hydration products contact and inter-particle pore reduction enhances the UCS of the filling body; therefore, in the middle and late stages of hydration, the mass fraction of PO and solids promotes each other’s enhancement.
As shown in Figure 6d, the 7 d UCS of the filled body increased with the increase in the mass fraction of solids, as well as increased and then decreased with the increase in the mass fraction of FA. When the mass fractions of FA were 16% and 20%, the 7 d UCS of the filled body increased by 0.928 and 0.848 MPa, respectively, when the mass fraction of solids increased from 77% to 81%; when the mass fractions of solids were 77% and 81%, the 7 d UCS of the filled body increased and then decreased when the mass fraction of the FA increased from 16% to 20% and reached the maximum value of the UCS when the mass fraction of solids reached 18%; the 7 d UCS after adding FA increased first and then decreased. The maximum UCS was reached at 17%~18%, and the maximum UCS was reached after the addition of FA, with increases of 0.02 and 0.001 MPa compared with the initial UCS, respectively. It can be seen from the above data that the effect of the FA or solid mass fraction on the UCS was gradually weakened with the increase in the other factor.
As shown in Figure 6e, the 28 d UCS of the filled body increased with the increase in the PO mass fraction, as well as increased and then decreased with the increase in the FA mass fraction. When the mass fractions of FA were 16% and 20%, the 28 d UCSs of the filled body increased by 0.765 and 0.775 MPa, respectively, during the process of increasing the mass fraction of PO from 8% to 12%; when the mass fractions of PO were 8% and 12%, the 28 d UCS of the filled body increased and then decreased when the mass fraction of FA was increased from 16% to 20% and the maximum value of the UCS was reached when the mass fraction of PO was increased from 17% to 18%; the maximum value of UCS after adding FA was reached when the mass fraction of PO was increased from 16% to 20%. The maximum UCS was reached at 18%, and the maximum UCS was increased by 0.005 and 0.015 MPa compared with the initial UCS after the addition of FA at 16% and 20%, respectively. It can be seen from the interaction of the two effects on the UCS that the effect of the mass fraction of PO or FA on the UCS was gradually weakened with the increase in the content of the other factor.
According to the RSM-BBD model, the software calculated the optimal proportions as follows: the mass fractions of PO, FA and solids were 8.09%, 16.58% and 79.74%, respectively, and the simulation numerical calculations results show that the UCSs at 3 d, 7 d and 28 d were 1.137 MPa, 2.554 MPa and 4.328 MPa, respectively. We preliminarily determined that the reasonable proportions of CACFB were 9%–11% for the PO dosing, 16.5%–18.5% for the FA dosing and 77%–78% for the mass fraction of solids. Given that in the pre-experiment, as the mass fraction of the CACFB increased, the slurry showed the flow characteristics of paste, the slurry was optimized with reference to the UCS and rheological behavior. The mass fraction of the optimized CACFB was finally determined to be 77%–78%, which is in line with the reasonable interval range of high-concentration cemented filling material.

3.2. Analysis of the Rheological Parameters

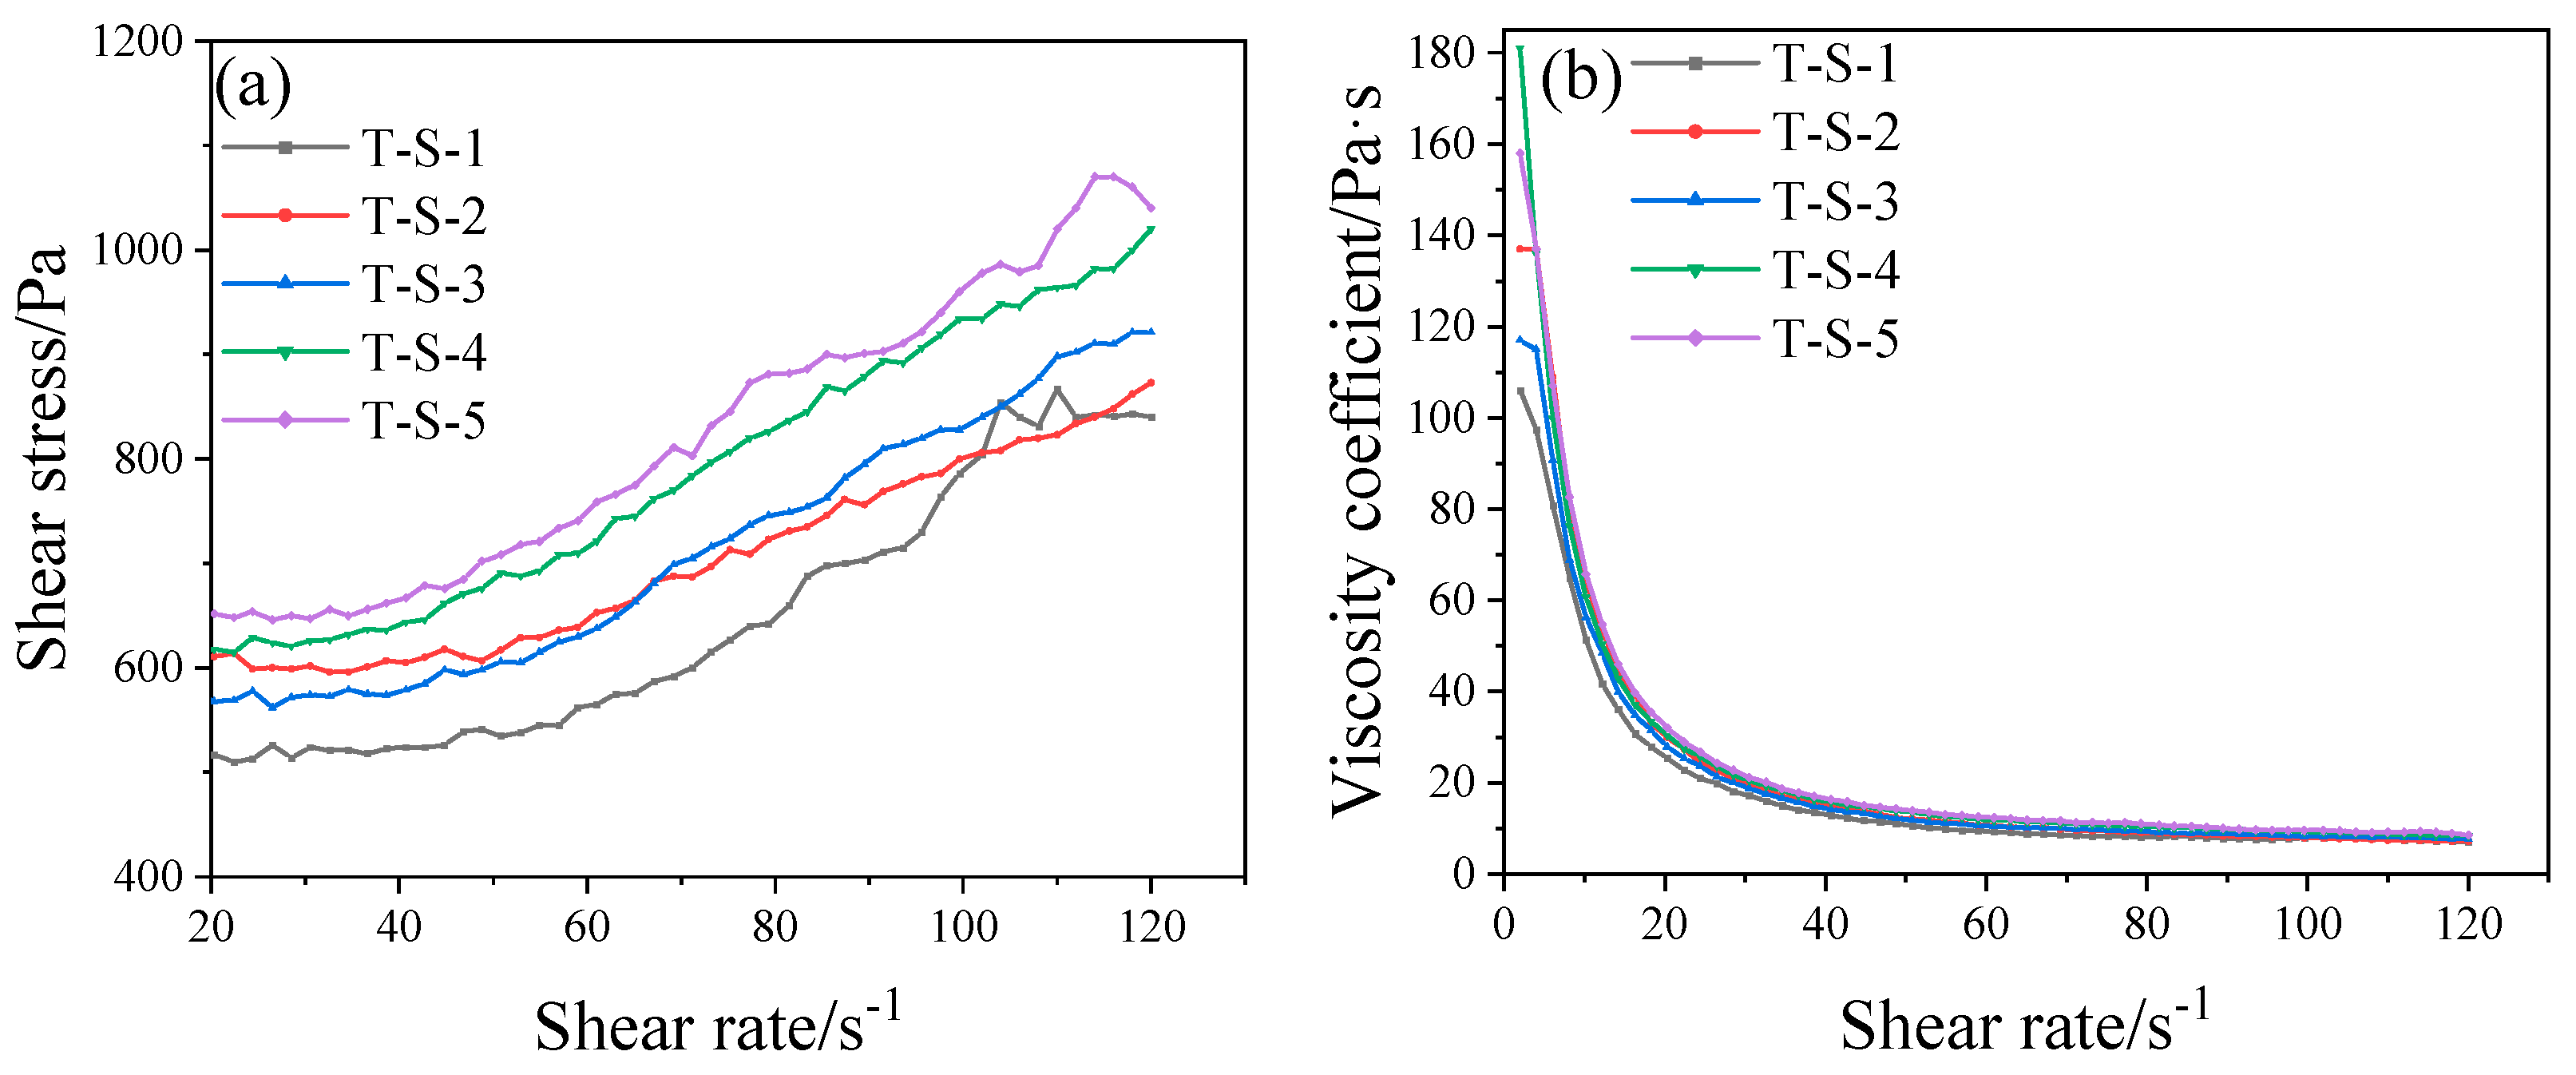
3.2.1. Rheological Parameter Test Results

As shown in Figure 7a,b, the five test groups T-S-1, T-S-2, T-S-3, T-S-4 and T-S-5 corresponded to the five items A1B1C1, A2B2C2, A3B3C3, A4B4C4 and A5B5C5, respectively, and it was found that the shear stress vs. shear rate graphs of the five test groups show that the CACFB belonged to a typical Bingham body. The definition of a Bingham body is that the shear stress of the slurry with respect to the increase in the shear rate shows a linear increase in the trend. From Figure 7a, the slurry homogeneity was better, indicating that the proportions of the CACFB were scientifically reasonable, in which the proportion ratio of the coal gangue and aeolian sand was 16%:84%. Five groups of tests of the viscosity coefficient and shear rate gave results in line with the characteristics of a Bingham body. With the growth of the shear rate, the viscosity coefficient of the slurry likewise decreased. The initial stage of the confirmation of the CACFB ratio was reasonable. In order to simplify the image processing, the slurry rheological parameter test results of all 25 groups are shown in Table 6.

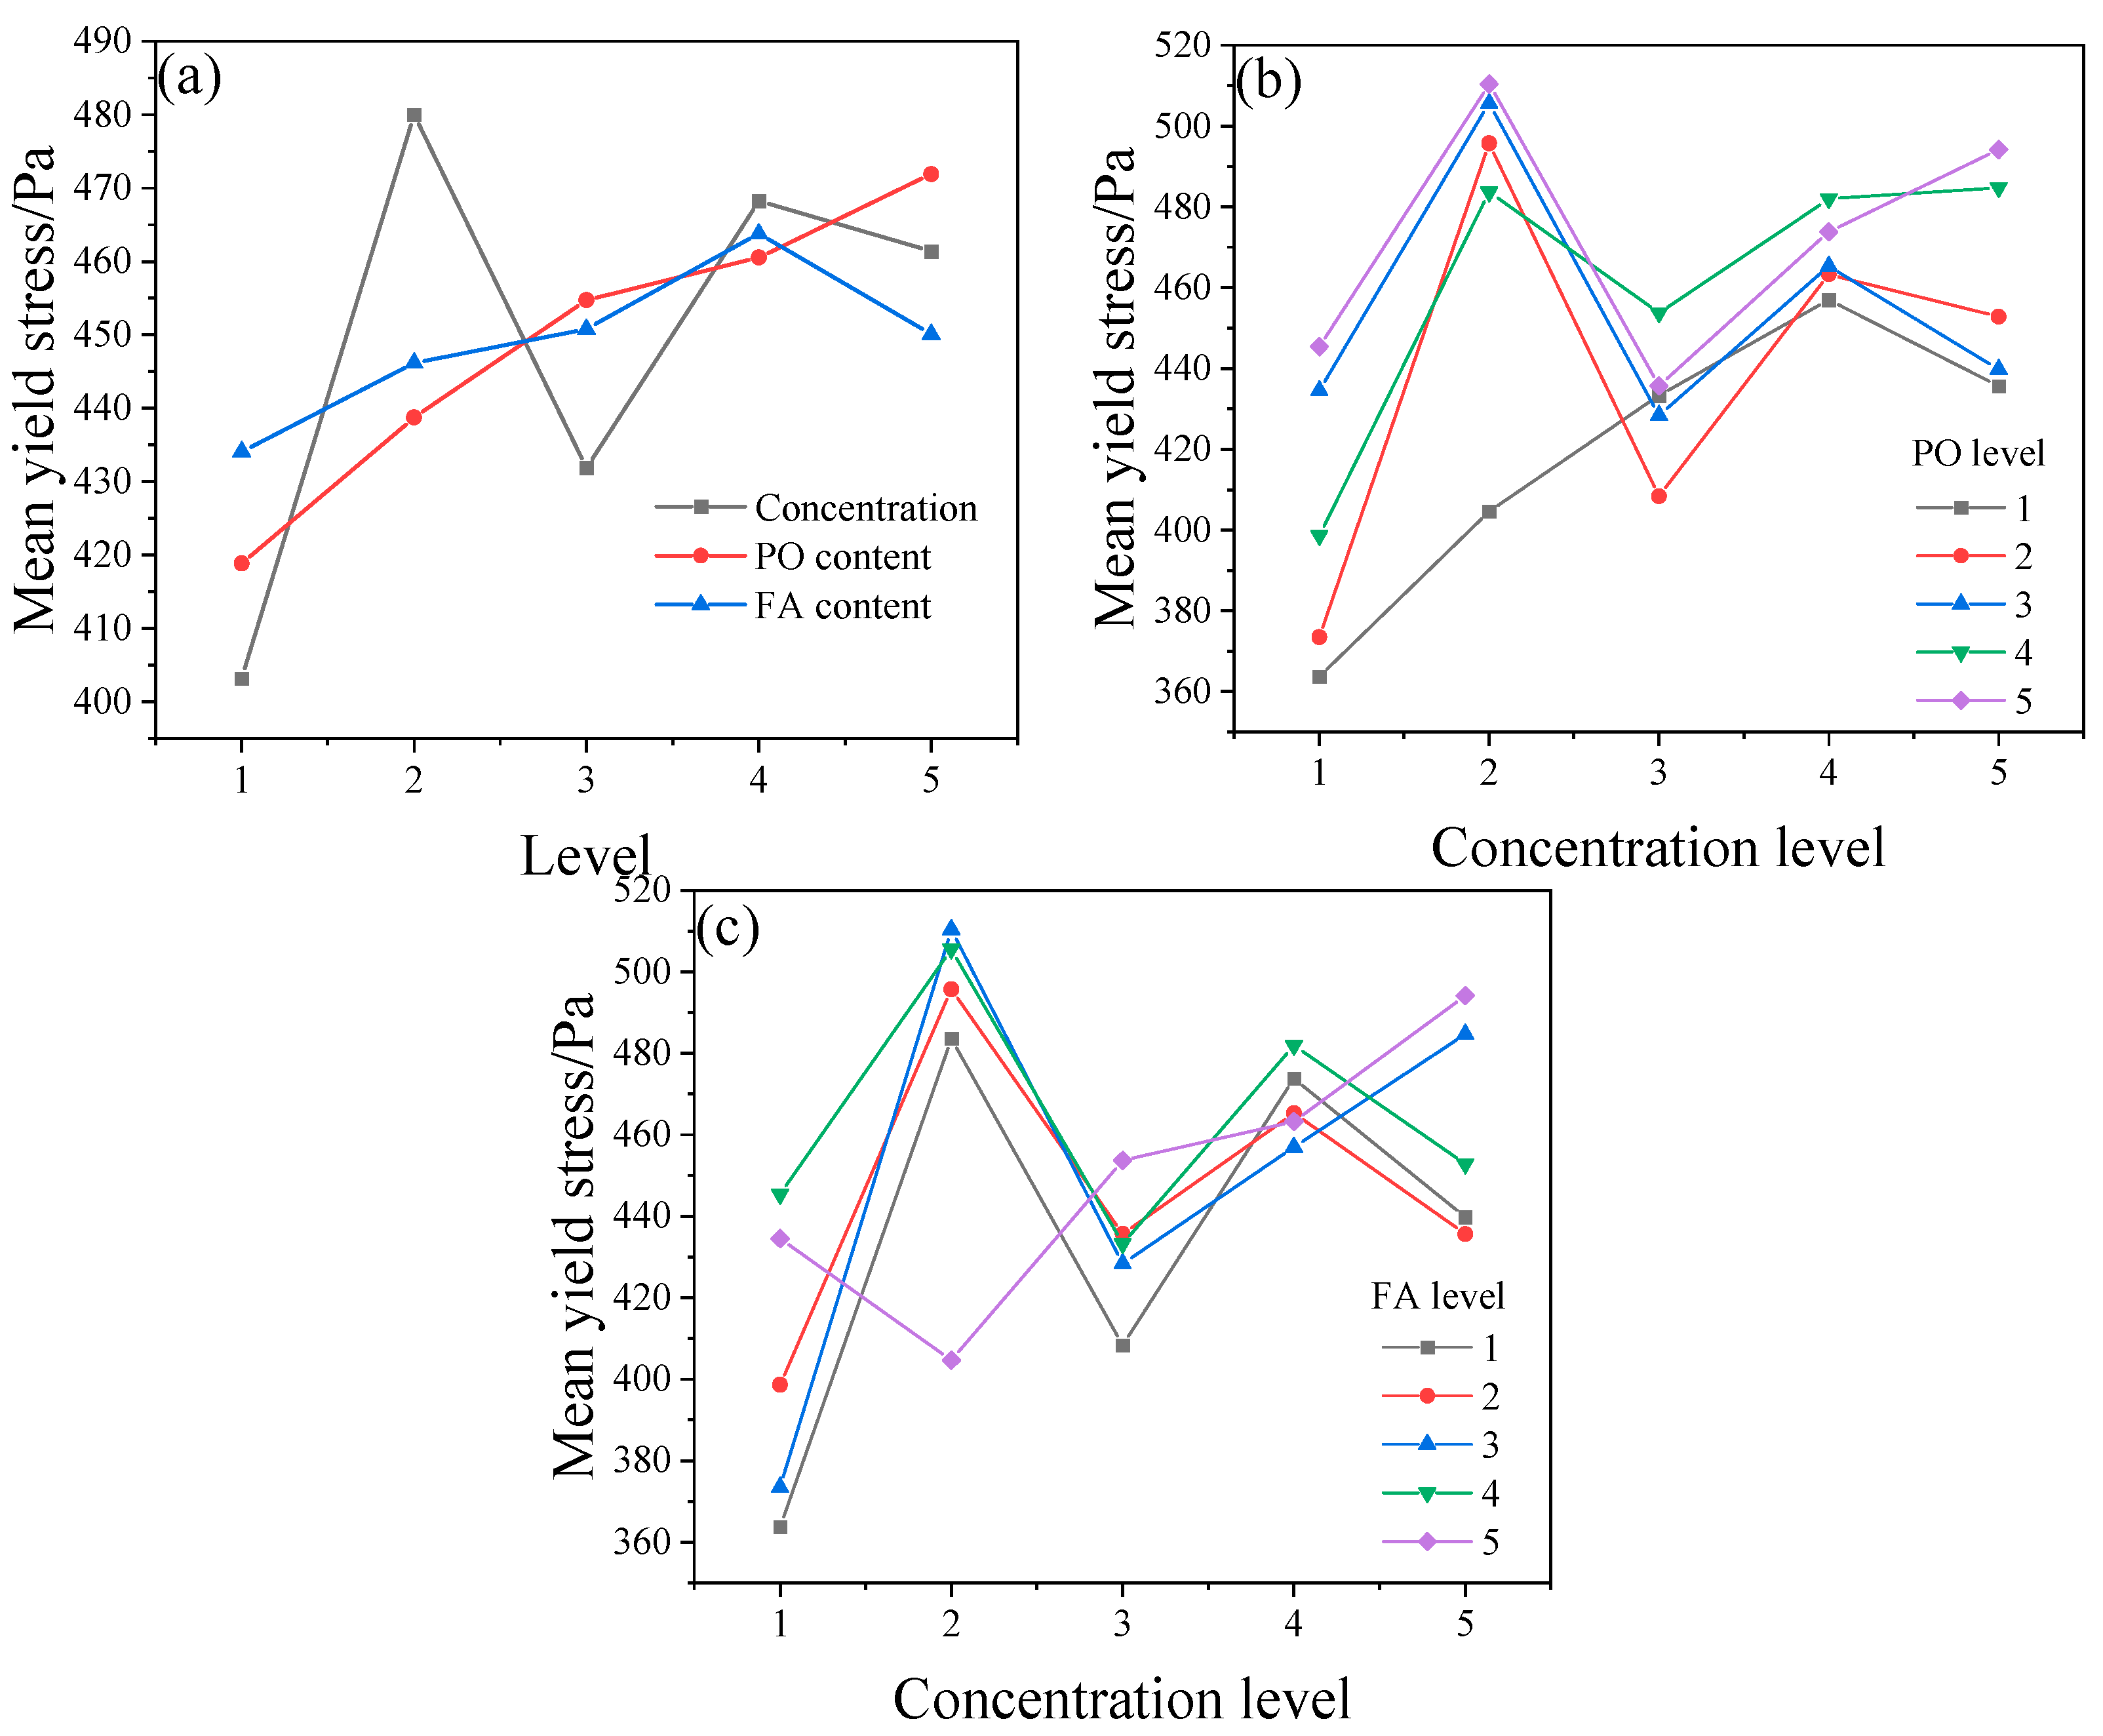
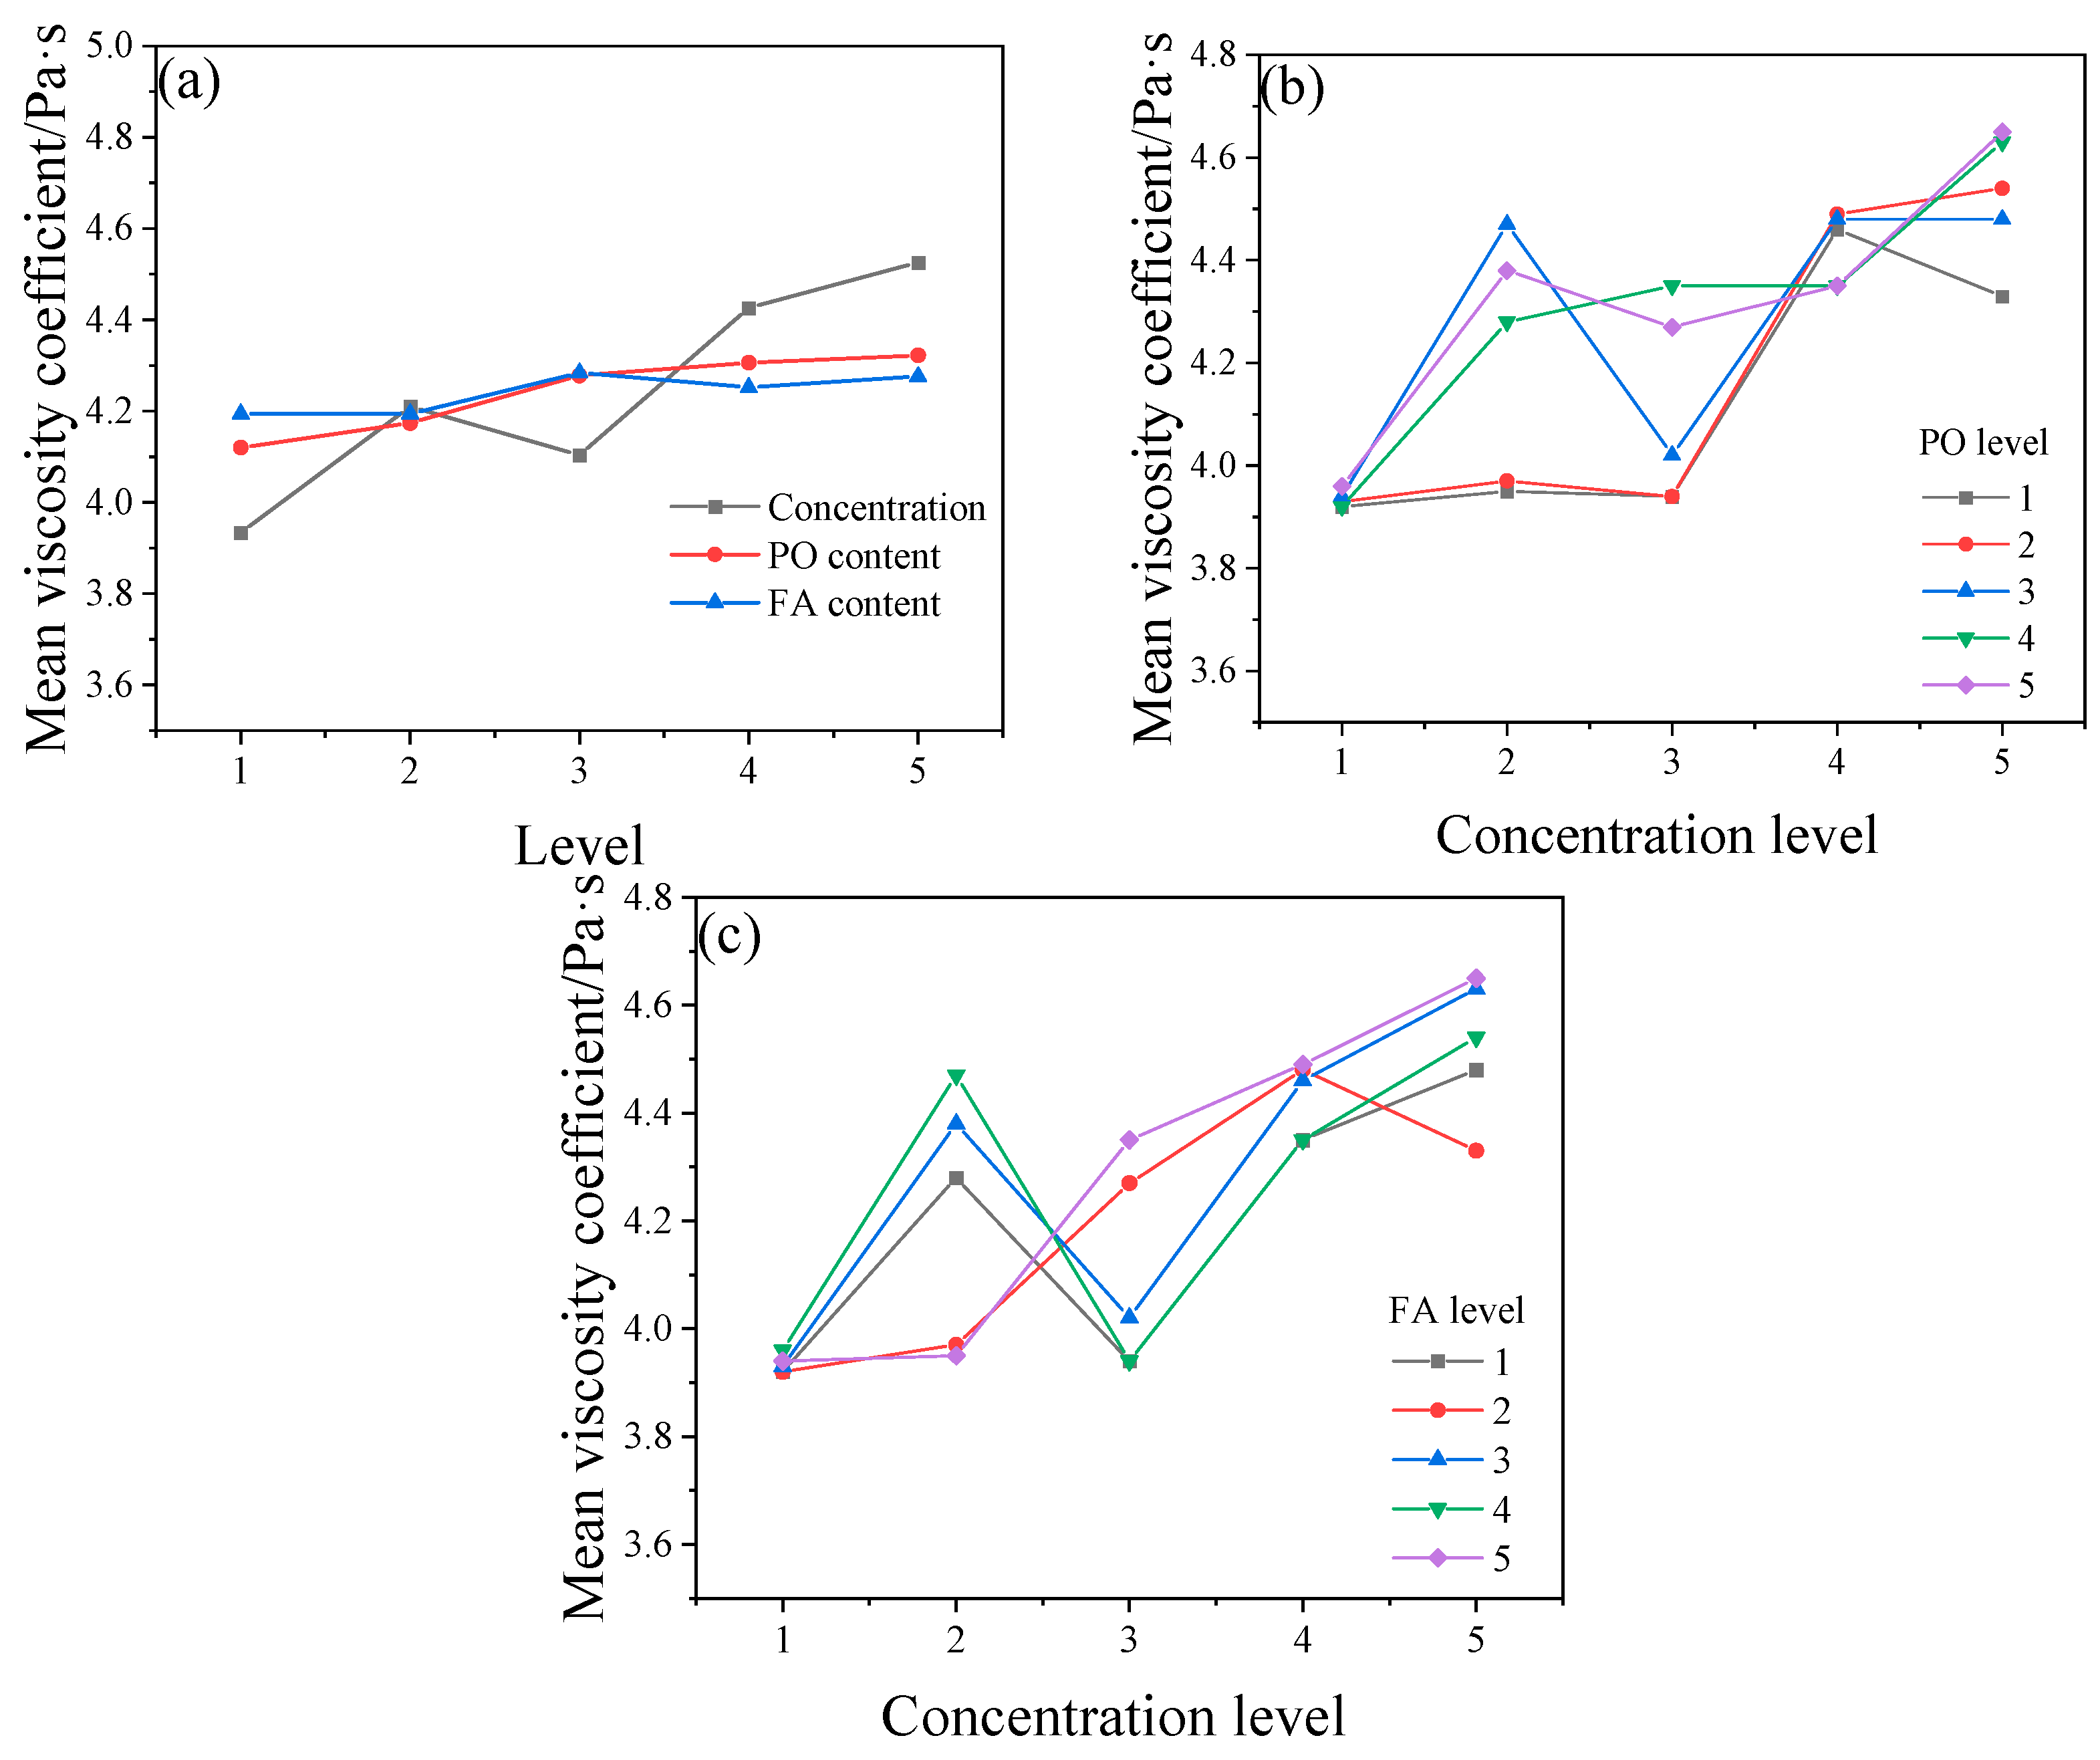
3.2.2. Characteristic Primary and Secondary Factor Analysis of Variance

The test results show that there was a primary and secondary relationship between the three factors that affected the rheological properties of the slurry. Among them, the main influencing factor had a significant effect on the test values, and the levels of the main factor corresponded to significant differences in the values of the experimental results. This was not the case for the corresponding secondary factor, which had a small difference in the test values due to the change in the level value, and did not cause a significant difference in the test values when the level of influence of the factor was changed.
The relationship between the primary and secondary factors can be judged using the value of the extreme variance R. The more the primary factor corresponds to the larger value of R, the larger the extreme variance. Conversely, the smaller the R value corresponding to the secondary factors, the smaller the extreme variance. The results of the calculation of the R value of the extreme difference are shown in Table 7.
As can be seen from Table 7, under the aspect of yield stress, the extreme R values of the three factors of concentration, PO and FA were 76.832, 53.046 and 29.726, respectively, and from the magnitudes of the values, we found that the primary and secondary relationships of the three factors of concentration, PO and FA were concentration > PO > FA; there was an obvious primary and secondary relationship between the concentration and yield stress, there was a relatively obvious primary and secondary relationship between the corresponding PO and yield stress of the slurry, and it was obvious that there was a general primary and secondary relationship between FA and yield stress of the slurry. There was a relatively obvious primary–secondary relationship between the yield stress and the corresponding PO on the yield stress of the slurry, and it was obvious that there was a general primary–secondary relationship between the dosage of FA and yield stress of the slurry. Under the aspect of viscosity coefficient, the R values of the extreme deviation of the three factors of concentration, PO and FA were 0.592, 0.202 and 0.09, respectively, and it was found from the magnitudes of the values that the primary–secondary relationships between the three factors of concentration, PO and FA were as follows: concentration > PO > FA. There was a significant primary–secondary relationship between the concentration and the viscosity coefficient. PO dosage had a relatively obvious primary–secondary relationship with the viscosity coefficient of the slurry, and the FA did not have an obvious primary–secondary relationship with the viscosity coefficient of the slurry.

3.2.3. Analysis of Variance and Significance of Rheological Properties

ANOVA and significance tests were utilized to determine whether the three factors of slurry concentration, PO and FA had significant effects on the rheology of the slurry. In terms of the yield stress, the test results are shown in Table 8.
From Table 8 below, three-factor ANOVA was utilized to study the relationship between concentration, PO and FA on the yield stress. It can be seen that the concentration showed significance (F = 9.413, p = 0.001 < 0.05), which indicates the main effect existed and the concentration produced a differential relationship on the yield stress; the PO presented significance (F = 4.137, p = 0.025 < 0.05), indicating that the main effect existed and the PO had a differential relationship on the yield stress; the FA did not show significance (F = 1.116, p = 0.394 > 0.05), indicating that the FA did not produce a differential relationship on the yield stress.
From Table 9 below, three-factor ANOVA was utilized to study the relationship between concentration, PO and FA and the viscosity coefficient. It can be seen that concentration showed significance (F = 12.801, p = 0.000 < 0.05), which indicates that the main effect existed and the concentration produced a differential relationship on the viscosity coefficient; the PO did not present significance (F = 1.745, p = 0.205 > 0.05), indicating that PO did not produce a differential relationship on the viscosity coefficient; the FA did not show significance (F = 0.424, p = 0.788 > 0.05), indicating that the FA did not produce a differential relationship on the viscosity coefficient.

3.2.4. Determination of the Optimal Mixing Ratio of Coal Gangue and Aeolian Sand Slurry

Through the yield stress of the three factors shown in Figure 8, it was learned that the concentration’s effect was relatively large compared with the PO and FA factors. Considering from level 1 to level 5, it was found that the impact of level 3 tended to be the largest. With the increase in the concentration, the yield stress increased, and when comparing the PO and FA, the third levels of PO and FA were more significant than the other levels. For the yield stress in the concentration and PO mean value comparison chart, it was found that when the PO factor was at level 3, the yield stress of the slurry was in a relatively stable state; for the yield stress in the concentration and FA mean value comparison chart, it was found that when the FA was at level 3, the yield stress of the slurry was in a stable state, and thus, the slurry was in a relatively good condition. The same reasoning is shown in Figure 9.
Combined with the above analysis, the optimal ratios for the CACFB are given in Table 10.

4. Conclusions

  • With the increase in the FA content, the UCS of the CACFB decreased first and then increased, destroying the reasonable proportions of the material and leading to the reduction in the material’s UCS, and with the growth in time, the volcanic ash effect of the FA led to the increase in the UCS of the material.
  • The UCS of the filled body increased with the increase in the PO content and the curing age, and the PO had a significant effect on the UCS throughout the curing age.
  • It can be seen from the interaction of the two effects on the UCS that the effect of the mass fraction of PO or FA on the UCS was gradually weakened with the increase in the content of the other factor.
  • The primary and secondary relationships of the three factors of concentration, PO and FA were concentration > PO > FA; there was an obvious primary and secondary relationship between concentration and yield stress.
  • The reasonable proportions of CACFB should ensure suitable UCS and rheological properties of the material. Through theoretical and experimental research, the final reasonable proportions were as follows: the concentration of slurry and the contents of AS, CG, FA and PO were 77.5%, 42%, 8%, 17.5% and 10%, respectively. This produced UCSs of the CACFB at 3 d, 7 d and 28 d of 1.2 MPa, 2.5 MPa and 4.3 MPa, respectively; the yield stress of the CACFB was 495 Pa, and the viscosity coefficient was 3.97 Pa·s. These reasonable proportions of the CACFB can meet the strength index and flow properties of material industrial experiments.

Author Contributions

Conceptualization, Z.Z.; data curation, Z.Z. and B.Y.; funding acquisition, B.Y. and Z.Z.; investigation, C.G. and F.Y.; methodology, B.Y. and Z.Z.; project administration, Z.Z., H.L. and C.G.; resources, B.Y., Z.Z. and F.Y.; supervision, C.G. and F.Y.; validation, C.G. and F.Y.; visualization, Z.Z.; writing—original draft, Z.Z.; writing—review and editing, Z.Z. All authors have read and agreed to the published version of the manuscript.

Funding

This research received no external funding.

Data Availability Statement

Data are contained within the article.

Conflicts of Interest

The authors declare no conflict of interest.

References

  1. Zhou, Y.; Yin, S.; Zhao, K.; Wang, L.; Liu, L. Understanding the Static Rate Dependence of Early Fracture Behavior of Cemented Paste Backfill Using Digital Image Correlation and Acoustic Emission Techniques. Eng. Fract. Mech. 2023, 283, 109209. [Google Scholar] [CrossRef]
  2. Zhu, M.; Xie, G.; Liu, L.; Wang, R.; Ruan, S.; Yang, P.; Fang, Z. Strengthening Mechanism of Granulated Blast-Furnace Slag on the Uniaxial Compressive Strength of Modified Magnesium Slag-Based Cemented Backfilling Material. Process Saf. Environ. Prot. 2023, 174, 722–733. [Google Scholar] [CrossRef]
  3. Benkirane, O.; Haruna, S.; Fall, M. Strength and Microstructure of Cemented Paste Backfill Modified with Nano-Silica Particles and Cured under Non-Isothermal Conditions. Powder Technol. 2023, 419, 118311. [Google Scholar] [CrossRef]
  4. Wang, S.; Yang, R.; Li, Y.; Xu, B.; Lu, B. Single-Factor Analysis and Interaction Terms on the Mechanical and Microscopic Properties of Cemented Aeolian Sand Backfill. Int. J. Miner. Metall. Mater. 2023, 30, 1584–1595. [Google Scholar] [CrossRef]
  5. Wang, S.; Li, Y.; Yang, R.; Xu, B.; Lu, B. Rheological Behavior with Time Dependence and Fresh Slurry Liquidity of Cemented Aeolian Sand Backfill Based on Response Surface Method. Constr. Build. Mater. 2023, 371, 130768. [Google Scholar] [CrossRef]
  6. Ruan, S.; Liu, L.; Xie, L.; Shao, C.; Sun, W.; Hou, D.; He, J. Mechanical Properties and Leaching Behavior of Modified Magnesium Slag Cemented Aeolian Sand Paste Backfill Materials. Constr. Build. Mater. 2023, 387, 131641. [Google Scholar] [CrossRef]
  7. Sivakugan, N.; Veenstra, R.; Naguleswaran, N. Underground Mine Backfilling in Australia Using Paste Fills and Hydraulic Fills. Int. J. Geosynth. Ground Eng. 2015, 1, 18. [Google Scholar] [CrossRef]
  8. Bian, Z.; Dong, J.; Lei, S.; Leng, H.; Mu, S.; Wang, H. The Impact of Disposal and Treatment of Coal Mining Wastes on Environment and Farmland. Environ. Geol. 2009, 58, 625–634. [Google Scholar] [CrossRef]
  9. Li, M.; Zhang, J.; Li, A.; Zhou, N. Reutilisation of Coal Gangue and Fly Ash as Underground Backfill Materials for Surface Subsidence Control. J. Clean. Prod. 2020, 254, 120113. [Google Scholar] [CrossRef]
  10. Zha, J.; Guo, G.; Feng, W.; Wang, Q. Mining Subsidence Control by Solid Backfilling under Buildings. Trans. Nonferrous Met. Soc. China 2011, 21, s670–s674. [Google Scholar] [CrossRef]
  11. Hou, J.; Guo, Z.; Liu, W.; Zhang, Y. Mechanical Properties and Meso-Structure Response of Cemented Gangue-Fly Ash Backfill with Cracks under Seepage-Stress Coupling. Constr. Build. Mater. 2020, 250, 118863. [Google Scholar] [CrossRef]
  12. Pacewska, B.; Blonkowski, G.; Wilińska, I. Investigations of the Influence of Different Fly Ashes on Cement Hydration. J. Therm. Anal. Calorim. 2006, 86, 179–186. [Google Scholar] [CrossRef]
  13. Zhou, N.; Zhang, J.; Ouyang, S.; Deng, X.; Dong, C.; Du, E. Feasibility Study and Performance Optimization of Sand-Based Cemented Paste Backfill Materials. J. Clean. Prod. 2020, 259, 120798. [Google Scholar] [CrossRef]
  14. Sun, Q.; Zhang, J.; Zhou, N. Early-Age Strength of Aeolian Sand-Based Cemented Backfilling Materials: Experimental Results. Arab. J. Sci. Eng. 2018, 43, 1697–1708. [Google Scholar] [CrossRef]
  15. Ferrari, L.; Kaufmann, J.; Winnefeld, F.; Plank, J. Impact of Particle Size on Interaction Forces between Ettringite and Dispersing Comb-Polymers in Various Electrolyte Solutions. J. Colloid Interface Sci. 2014, 419, 17–24. [Google Scholar] [CrossRef]
  16. Dweck, J.; Buchler, P.M.; Coelho, A.C.V.; Cartledge, F.K. Hydration of a Portland Cement Blended with Calcium Carbonate. Thermochim. Acta 2000, 346, 105–113. [Google Scholar] [CrossRef]
  17. Sivakugan, N.; Rankine, R.M.; Rankine, K.J.; Rankine, K.S. Geotechnical Considerations in Mine Backfilling in Australia. J. Clean. Prod. 2006, 14, 1168–1175. [Google Scholar] [CrossRef]
  18. Mehdipour, I.; Khayat, K.H. Elucidating How Particle Packing Controls Rheology and Strength Development of Dense Cementitious Suspensions. Cem. Concr. Compos. 2019, 104, 103413. [Google Scholar] [CrossRef]
  19. Saleh, S.; Mahmood, A.H.; Hamed, E.; Zhao, X.-L. The Mechanical, Transport and Chloride Binding Characteristics of Ultra-High-Performance Concrete Utilising Seawater, Sea Sand and SCMs. Constr. Build. Mater. 2023, 372, 130815. [Google Scholar] [CrossRef]
  20. Kongar-Syuryun, C.; Aleksakhin, A.; Khayrutdinov, A.; Tyulyaeva, Y. Research of Rheological Characteristics of the Mixture as a Way to Create a New Backfill Material with Specified Characteristics. Mater. Today Proc. 2021, 38, 2052–2054. [Google Scholar] [CrossRef]
  21. Adigamov, A.; Rybak, J.; Golovin, K.; Kopylov, A. Mechanization of Stowing Mix Transportation, Increasing Its Efficiency and Quality of the Created Mass. Transp. Res. Procedia 2021, 57, 9–16. [Google Scholar] [CrossRef]
  22. Rybak, J.; Kongar-Syuryun, C.; Tyulyaeva, Y.; Khayrutdinov, A.M. Creation of Backfill Materials Based on Industrial Waste. Minerals 2021, 11, 739. [Google Scholar] [CrossRef]
  23. Koohestani, B.; Koubaa, A.; Belem, T.; Bussière, B.; Bouzahzah, H. Experimental Investigation of Mechanical and Microstructural Properties of Cemented Paste Backfill Containing Maple-Wood Filler. Constr. Build. Mater. 2016, 121, 222–228. [Google Scholar] [CrossRef]
  24. Liu, G.; Li, L.; Yao, M.; Landry, D.; Malek, F.; Yang, X.; Guo, L. An Investigation of the Uniaxial Compressive Strength of a Cemented Hydraulic Backfill Made of Alluvial Sand. Minerals 2017, 7, 4. [Google Scholar] [CrossRef]
  25. Xin, J.; Liu, L.; Xu, L.; Wang, J.; Yang, P.; Qu, H. A Preliminary Study of Aeolian Sand-Cement-Modified Gasification Slag-Paste Backfill: Fluidity, Microstructure, and Leaching Risks. Sci. Total Environ. 2022, 830, 154766. [Google Scholar] [CrossRef]
  26. Kesimal, A.; Yilmaz, E.; Ercikdi, B.; Alp, I.; Deveci, H. Effect of Properties of Tailings and Binder on the Short-and Long-Term Strength and Stability of Cemented Paste Backfill. Mater. Lett. 2005, 59, 3703–3709. [Google Scholar] [CrossRef]
  27. Koohestani, B.; Belem, T.; Koubaa, A.; Bussière, B. Experimental Investigation into the Compressive Strength Development of Cemented Paste Backfill Containing Nano-Silica. Cem. Concr. Compos. 2016, 72, 180–189. [Google Scholar] [CrossRef]
  28. Cao, S.; Song, W.; Yilmaz, E. Influence of Structural Factors on Uniaxial Compressive Strength of Cemented Tailings Backfill. Constr. Build. Mater. 2018, 174, 190–201. [Google Scholar] [CrossRef]
  29. Hu, J.; Zhao, F.; Kuang, Y.; Yang, D.; Zheng, M.; Zhao, L. Microscopic Characteristics of the Action of an Air Entraining Agent on Cemented Paste Backfill Pores. Alex. Eng. J. 2020, 59, 1583–1593. [Google Scholar] [CrossRef]
  30. Haiqiang, J.; Fall, M.; Cui, L. Yield Stress of Cemented Paste Backfill in Sub-Zero Environments: Experimental Results. Miner. Eng. 2016, 92, 141–150. [Google Scholar] [CrossRef]
  31. Şahmaran, M.; Christianto, H.A.; Yaman, İ.Ö. The Effect of Chemical Admixtures and Mineral Additives on the Properties of Self-Compacting Mortars. Cem. Concr. Compos. 2006, 28, 432–440. [Google Scholar] [CrossRef]
  32. Yahia, A.; Tanimura, M.; Shimoyama, Y. Rheological Properties of Highly Flowable Mortar Containing Limestone Filler-Effect of Powder Content and W/C Ratio. Cem. Concr. Res. 2005, 35, 532–539. [Google Scholar] [CrossRef]
  33. Park, C.K.; Noh, M.H.; Park, T.H. Rheological Properties of Cementitious Materials Containing Mineral Admixtures. Cem. Concr. Res. 2005, 35, 842–849. [Google Scholar] [CrossRef]
  34. Nikbin, M.I.; Rahimi, R.S.; Allahyari, H.; Fallah, F. Feasibility Study of Waste Poly Ethylene Terephthalate (PET) Particles as Aggregate Replacement for Acid Erosion of Sustainable Structural Normal and Lightweight Concrete. J. Clean. Prod. 2016, 126, 108–117. [Google Scholar] [CrossRef]
  35. Wang, L.; Yang, H.Q.; Zhou, S.H.; Chen, E.; Tang, S.W. Hydration, Mechanical Property and C-S-H Structure of Early-Strength Low-Heat Cement-Based Materials. Mater. Lett. 2018, 217, 151–154. [Google Scholar] [CrossRef]
  36. Ohshima, H. Electrical Conductivity of a Concentrated Suspension of Spherical Colloidal Particles. J. Colloid Interface Sci. 1999, 212, 443–448. [Google Scholar] [CrossRef]
  37. Hu, J.; Wang, K. Effect of Coarse Aggregate Characteristics on Concrete Rheology. Constr. Build. Mater. 2011, 25, 1196–1204. [Google Scholar] [CrossRef]
  38. Wu, D.; Fall, M.; Cai, S.J. Coupling Temperature, Cement Hydration and Rheological Behaviour of Fresh Cemented Paste Backfill. Miner. Eng. 2013, 42, 76–87. [Google Scholar] [CrossRef]
  39. Wu, A.; Wang, Y.; Wang, H.; Yin, S.; Miao, X. Coupled Effects of Cement Type and Water Quality on the Properties of Cemented Paste Backfill. Int. J. Miner. Process. 2015, 143, 65–71. [Google Scholar] [CrossRef]
  40. Duan, G.; Huang, G.; Li, A.; Zhu, Y.; Gong, Y. A Study of Supermolecular Polarization of Comb-like Polycarboxylate Admixtures Synthesized with Polyoxyethylene Macromolecules. J. Mol. Liq. 2012, 174, 129–134. [Google Scholar] [CrossRef]
  41. Liddel, P.V.; Boger, D.V. Yield Stress Measurements with the Vane. J. Non-Newton. Fluid Mech. 1996, 63, 235–261. [Google Scholar] [CrossRef]
  42. Dzuy, N.Q.; Boger, D.V. Yield Stress Measurement for Concentrated Suspensions. J. Rheol. 1983, 27, 321–349. [Google Scholar] [CrossRef]
  43. Panchal, S.; Deb, D.; Sreenivas, T. Variability in Rheology of Cemented Paste Backfill with Hydration Age, Binder and Superplasticizer Dosages. Adv. Powder Technol. 2018, 29, 2211–2220. [Google Scholar] [CrossRef]
  44. Wu, D.; Yang, B.; Liu, Y. Transportability and Pressure Drop of Fresh Cemented Coal Gangue-Fly Ash Backfill (CGFB) Slurry in Pipe Loop. Powder Technol. 2015, 284, 218–224. [Google Scholar] [CrossRef]
  45. Wu, D.; Hou, Y.; Deng, T.; Chen, Y.; Zhao, X. Thermal, Hydraulic and Mechanical Performances of Cemented Coal Gangue-Fly Ash Backfill. Int. J. Miner. Process. 2017, 162, 12–18. [Google Scholar] [CrossRef]
  46. Vance, K.; Sant, G.; Neithalath, N. The Rheology of Cementitious Suspensions: A Closer Look at Experimental Parameters and Property Determination Using Common Rheological Models. Cem. Concr. Compos. 2015, 59, 38–48. [Google Scholar] [CrossRef]
  47. Yang, W.; Yu, G.; Tan, S.K.; Wang, H. Rheological Properties of Dense Natural Cohesive Sediments Subject to Shear Loadings. Int. J. Sediment Res. 2014, 29, 454–470. [Google Scholar] [CrossRef]
Figure 1. Aeolian sand of the Shiyaodian coal mine.
Minerals 13 01436 g001
Figure 2. XRD spectra results of the raw materials: (a) AS, (b) CG, (c) FA and (d) PO and (e) PSD results.
Minerals 13 01436 g002
Figure 3. Experimental flowchart.
Minerals 13 01436 g003
Figure 4. Comparison of predicted and measured UCS values at (a) 3 d, (b) 7 d and (c) 28 d.
Minerals 13 01436 g004
Figure 5. Effect of single factor on strength of filling body: (a) PO mass fraction, (b) FA mass fraction and (c) solid mass fraction.
Minerals 13 01436 g005
Figure 6. Influence pattern of factor interactions on the UCS of the filling body: (a) PO vs. Concentration in UCS of 3 d, (b) PO vs. Concentration in UCS of 7 d, (c) PO vs. Concentration in UCS of 28 d, (d) FA vs. Concentration in UCS of 7 d and (e) PO vs. FA in UCS of 28 d.
Minerals 13 01436 g006
Figure 7. Plots of rheological parameters tested: (a) shear stress vs. shear rate and (b) viscosity coefficient vs. shear rate.
Minerals 13 01436 g007
Figure 8. Comparison of yield stress versus several factors: (a) comparison of mean values of three factors, (b) comparison of mean values of concentration and PO, and (c) comparison of mean values of concentration and FA.
Minerals 13 01436 g008
Figure 9. Comparison of viscosity coefficient versus several factors: (a) comparison of mean values of three factors, (b) comparison of mean values of concentration and PO, and (c) comparison of mean values of concentration and FA.
Minerals 13 01436 g009
Table 1. Chemical compositions of AS, CG, FA and PO.
XRFSiO2CaOAl2O3Fe2O3MgOSO3K2OTiO2Others
AS wt%64.278.5312.955.852.34-2.641.202.22
CG wt%62.063.1122.238.01--2.950.990.65
FA wt%48.1017.1719.787.621.402.402.050.980.5
PO wt%20.1762.786.063.853.492.310.580.300.46
Table 2. RSM-BBD design scheme.
RunPO Mass Fraction X1%FA Mass Fraction X2%Mass Fraction of Solids X3%
#1101677
#2121877
#3102081
#481679
#5122079
#6121679
#781881
#882079
#981877
#10121881
#11101681
#12102077
#13101879
Table 3. Orthogonal design scheme.
RunABCPilot Program ABCRunABCPilot Program ABC
#1111A1B1C1#13333A3B3C3
#2123A1B2C3#14345A3B4C5
#3135A1B3C5#15352A3B5C2
#4142A1B4C2#16413A4B1C3
#5154A1B5C4#17425A4B2C5
#6215A2B1C5#18432A4B3C2
#7222A2B2C2#19444A4B4C4
#8234A2B3C4#20451A4B5C1
#9241A2B4C1#21512A5B1C2
#10253A2B5C3#22524A5B2C4
#11314A3B1C4#23531A5B3C1
#12321A3B2C1#24543A5B4C3
#25555A5B5C5
Note: A—concentration, B—PO content and C—FA content were the three independent variable factors in the orthogonal test, which varied from 77% to 78% with a variation interval of 0.25% for slurry concentration, from 9% to 11% with a variation interval of 0.5% for PO content and from 16.5% to 18.5% with a variation interval of 0.5% for FA content.
Table 4. The UCS and design results of RSM–BBD.
Run3 d UCS/MPa7 d UCS/MPa28 d UCS/MPa
Y1Y1′Relative
Error/%
Y2Y2′Relative
Error/%
Y3Y3′Relative
Error/%
#11.231.262.442.452.533.274.864.62−4.94
#21.351.29−4.443.353.29−1.794.955.031.62
#31.51.47−2.003.433.35−2.335.25.444.62
#41.181.10−6.782.192.242.284.154.170.48
#51.231.316.503.243.19−1.544.984.95−0.60
#61.321.352.273.563.54−0.564.784.943.35
#71.231.294.883.123.171.605.145.06−1.56
#80.980.9488−3.182.452.470.824.344.18−3.69
#91.051.115.712.142.01−6.073.894.105.40
#101.781.72−3.373.783.913.445.895.68−3.57
#111.451.482.073.563.45−3.095.255.300.95
#121.11.08−1.822.42.514.584.564.51−1.10
#131.21.200.002.782.780.004.24.200.00
Table 5. ANOVA results for the UCS regression model and respective model terms.
SourceSum of SquaresMean SquaredF-Valuep-Value
Y1Y2Y3Y1Y2Y3Y1Y2Y3Y1Y2Y3
Model0.51904.024.370.05770.44650.485712.6239.6012.450.00150.00010.0016
X10.19222.031.190.19222.031.1942.08180.0530.390.00030.00010.0009
X20.01710.00720.00020.01710.00720.00023.750.63860.00510.09420.45050.9449
X30.18911.581.300.18911.581.3041.40139.7233.220.00040.00010.0007
X1X20.00300.08410.00000.00300.08410.00000.66227.460.00060.44260.02930.9805
X1X30.01560.07560.02400.01560.07560.02403.426.710.61580.10680.03600.4583
X2X30.00810.00160.01560.00810.00160.01561.770.14190.40050.22470.71760.5469
X120.00010.04980.13830.00010.04980.13830.02304.423.550.88360.07370.1017
X220.00320.00350.13830.00320.00350.13830.69710.30873.550.43130.59580.1017
X320.09160.18351.450.09160.18351.4520.0516.2737.090.00290.00500.0005
Adjustted R2, R1 = 0.9420, R2 = 0.9807, R3 = 0.9412
Note: (1) F is the parameter used to test the significance of the regression model, with the significance level α = 0.05 as the test standard. F0.95 (3, 9) is the standard of comparison of F when α takes the value of 0.05, the number of independent variables is 3 and the number of degrees of freedom is 9. If F > F0.95 (3, 9) = 3.86, the regression equation is significant, and the larger the value of F, the greater the degree of impact of the factor on the indicator. (2) p is the value of the regression equation to reject the original hypothesis; when p < α (=0.05), it means that the regression coefficient is significant.
Table 6. Rheological parameters of CACFB slurry.
RunGroupYield StressViscosity
Coefficient
nRunGroupYield StressViscosity
Coefficient
n
#1A1B1C1363.773.921#13A3B3C3428.384.021
#2A1B2C3373.483.931#14A3B4C5453.734.351
#3A1B3C5434.543.941#15A3B5C2435.674.271
#4A1B4C2398.653.921#16A4B1C3456.934.461
#5A1B5C4445.393.961#17A4B2C5463.274.491
#6A2B1C5404.633.951#18A4B3C2465.324.481
#7A2B2C2495.723.971#19A4B4C4481.944.351
#8A2B3C4505.634.471#20A4B5C1473.844.351
#9A2B4C1483.654.281#21A5B1C2435.624.331
#10A2B5C3510.364.381#22A5B2C4452.784.541
#11A3B1C4433.263.941#23A5B3C1439.744.481
#12A3B2C1408.373.941#24A5B4C3484.734.631
#25A5B5C5494.184.651
Table 7. Calculation results of extreme variance for each factor.
FactorYield Stress τ0 (Pa)
Mean Value of the Same Level Test for Each Factor
Viscosity Coefficient η (Pa·s)
Mean Value of the Same Level Test for Each Factor
LevelABCABC
1403.166418.842434.0743.9344.124.194
2479.998438.724446.1964.214.1744.194
3431.882454.722450.7764.1044.2784.284
4468.26460.54463.84.4264.3064.252
5461.41471.888450.074.5264.3224.276
Polarization R76.83253.04629.7260.5920.2020.09
Table 8. Results of the three-factor ANOVA on yield stress.
SourceSum of SquaresdfMean SquaredF-Valuep-Value
Intercept5,038,749.92115,038,749.9219780.6010.000 **
Concentration19,397.98544849.4969.4130.001 **
Cement8524.29242131.0734.1370.025 *
Fly ash2299.9064574.9771.1160.394
Residual6182.13512515.178
Note: R2 = 0.830, * p < 0.05, ** p < 0.01.
Table 9. Results of the three-factor ANOVA on viscosity coefficient.
SourceSum of SquaresdfMean SquaredF-Valuep-Value
Intercept449.4401449.44020,061.3000.000 **
Concentration1.14740.28712.8010.000 **
Cement0.15640.0391.7450.205
Fly ash0.03840.0100.4240.788
Residual0.269120.022
Note: R2 = 0.833, * p < 0.05, ** p < 0.01.
Table 10. Optimal ratios of high-concentration cemented filling materials of coal gangue and aeolian sand.
ComponentsConcentrationPOFly AshCoal GangueAeolian Sand
wt%77.51017.5842
Disclaimer/Publisher’s Note: The statements, opinions and data contained in all publications are solely those of the individual author(s) and contributor(s) and not of MDPI and/or the editor(s). MDPI and/or the editor(s) disclaim responsibility for any injury to people or property resulting from any ideas, methods, instructions or products referred to in the content.

