Article

Vesicles and Reservoirs of Basic Lava Flows in the Laoheishan and Huoshaoshan Volcanoes, NE China

1
College of Earth Sciences, Jilin University, Changchun 130061, China
2
Key Laboratory of Mineral Resources Evaluation in Northeast Asia, Ministry of Natural Resources, Changchun 130061, China
3
Tianjin Branch of CNOOC (China) Limited, Tianjin 300450, China
4
College of Applied Technology, Jilin University, Changchun 130022, China
*
Authors to whom correspondence should be addressed.
Minerals 2023, 13(11), 1434; https://doi.org/10.3390/min13111434
Submission received: 30 September 2023 / Revised: 14 October 2023 / Accepted: 10 November 2023 / Published: 12 November 2023

Abstract

:
As an important part of the lava flow reservoir, vesicles affect reservoir performance to some extent. To explore the distribution, origins and importance of vesicles in different facies belts of basic lava flows. In this study, we selected representative field outcrops and samples from different facies belts of the Laoheishan and Huoshaoshan lava flows in the Wudalianchi volcanics, Heilongjiang Province, identified and examined vesicles, measured their porosity and permeability, and analyzed their surface porosity. Three facies belts of vesicle shape, size, quantity, arrangement, origin, and connectivity between vesicles and fractures were identified. The results showed that the vesicles in the crater–near-crater belt were ellipsoidal and spherical, with many vesicles. The vesicles in the proximal belt were dominated by many ellipsoids with a uniform distribution. The vesicles in the distal belt were dominated by spherical and ellipsoidal vesicles, with a few tubular vesicles and a small number of vesicles. The findings suggest that the crater-near-crater belt and proximal belt have the best reservoir performance, whereas the distal belt has the worst.

1. Introduction

In recent years, many volcanic hydrocarbon reservoirs have been discovered in petroliferous basins such as Songliao and Junggar in China, Neuquén in Argentina, and Bamer in India [1,2,3,4]. Lava reservoirs account for approximately 60%. Lava flows rich in vesicles can also form good oil and gas reservoirs, and the top vesicles zone can even develop highly productive oil and gas reservoirs [5,6,7]. In lava reservoirs, vesicle development affects the reservoir performance of volcanic rocks and controls the reservoir quality [8,9,10]. Therefore, vesicles have received considerable attention, particularly focusing on their zonation [11,12,13], their origin [14,15,16,17], main controlling factors [18,19], filling [20] and shape [21,22,23,24], with a range of results. However, to date, there has been relatively little research on lava reservoirs, including the relationship between vesicles and the facies belt, the assessment of the vertical zonation of vesicles, and the original connectivity of vesicles.
To explore the vertical and lateral variations of vesicles in lava flows, the Quaternary Laoheishan and Huoshaoshan of Wudalianchi, which are similar to the alkaline basalts commonly found in fault basins, were selected as research examples. Research was conducted on different facies belts with vesicle shape, distribution, arrangement, quantity, size, and connectivity to fractures. This study is of theoretical importance in examining the degassing of lava flows and the mechanism of vesicle growth, which is of practical value in oil and gas exploration and provides a reference for hydrocarbon exploration in basic lava flow reservoirs.

2. Geological Setting

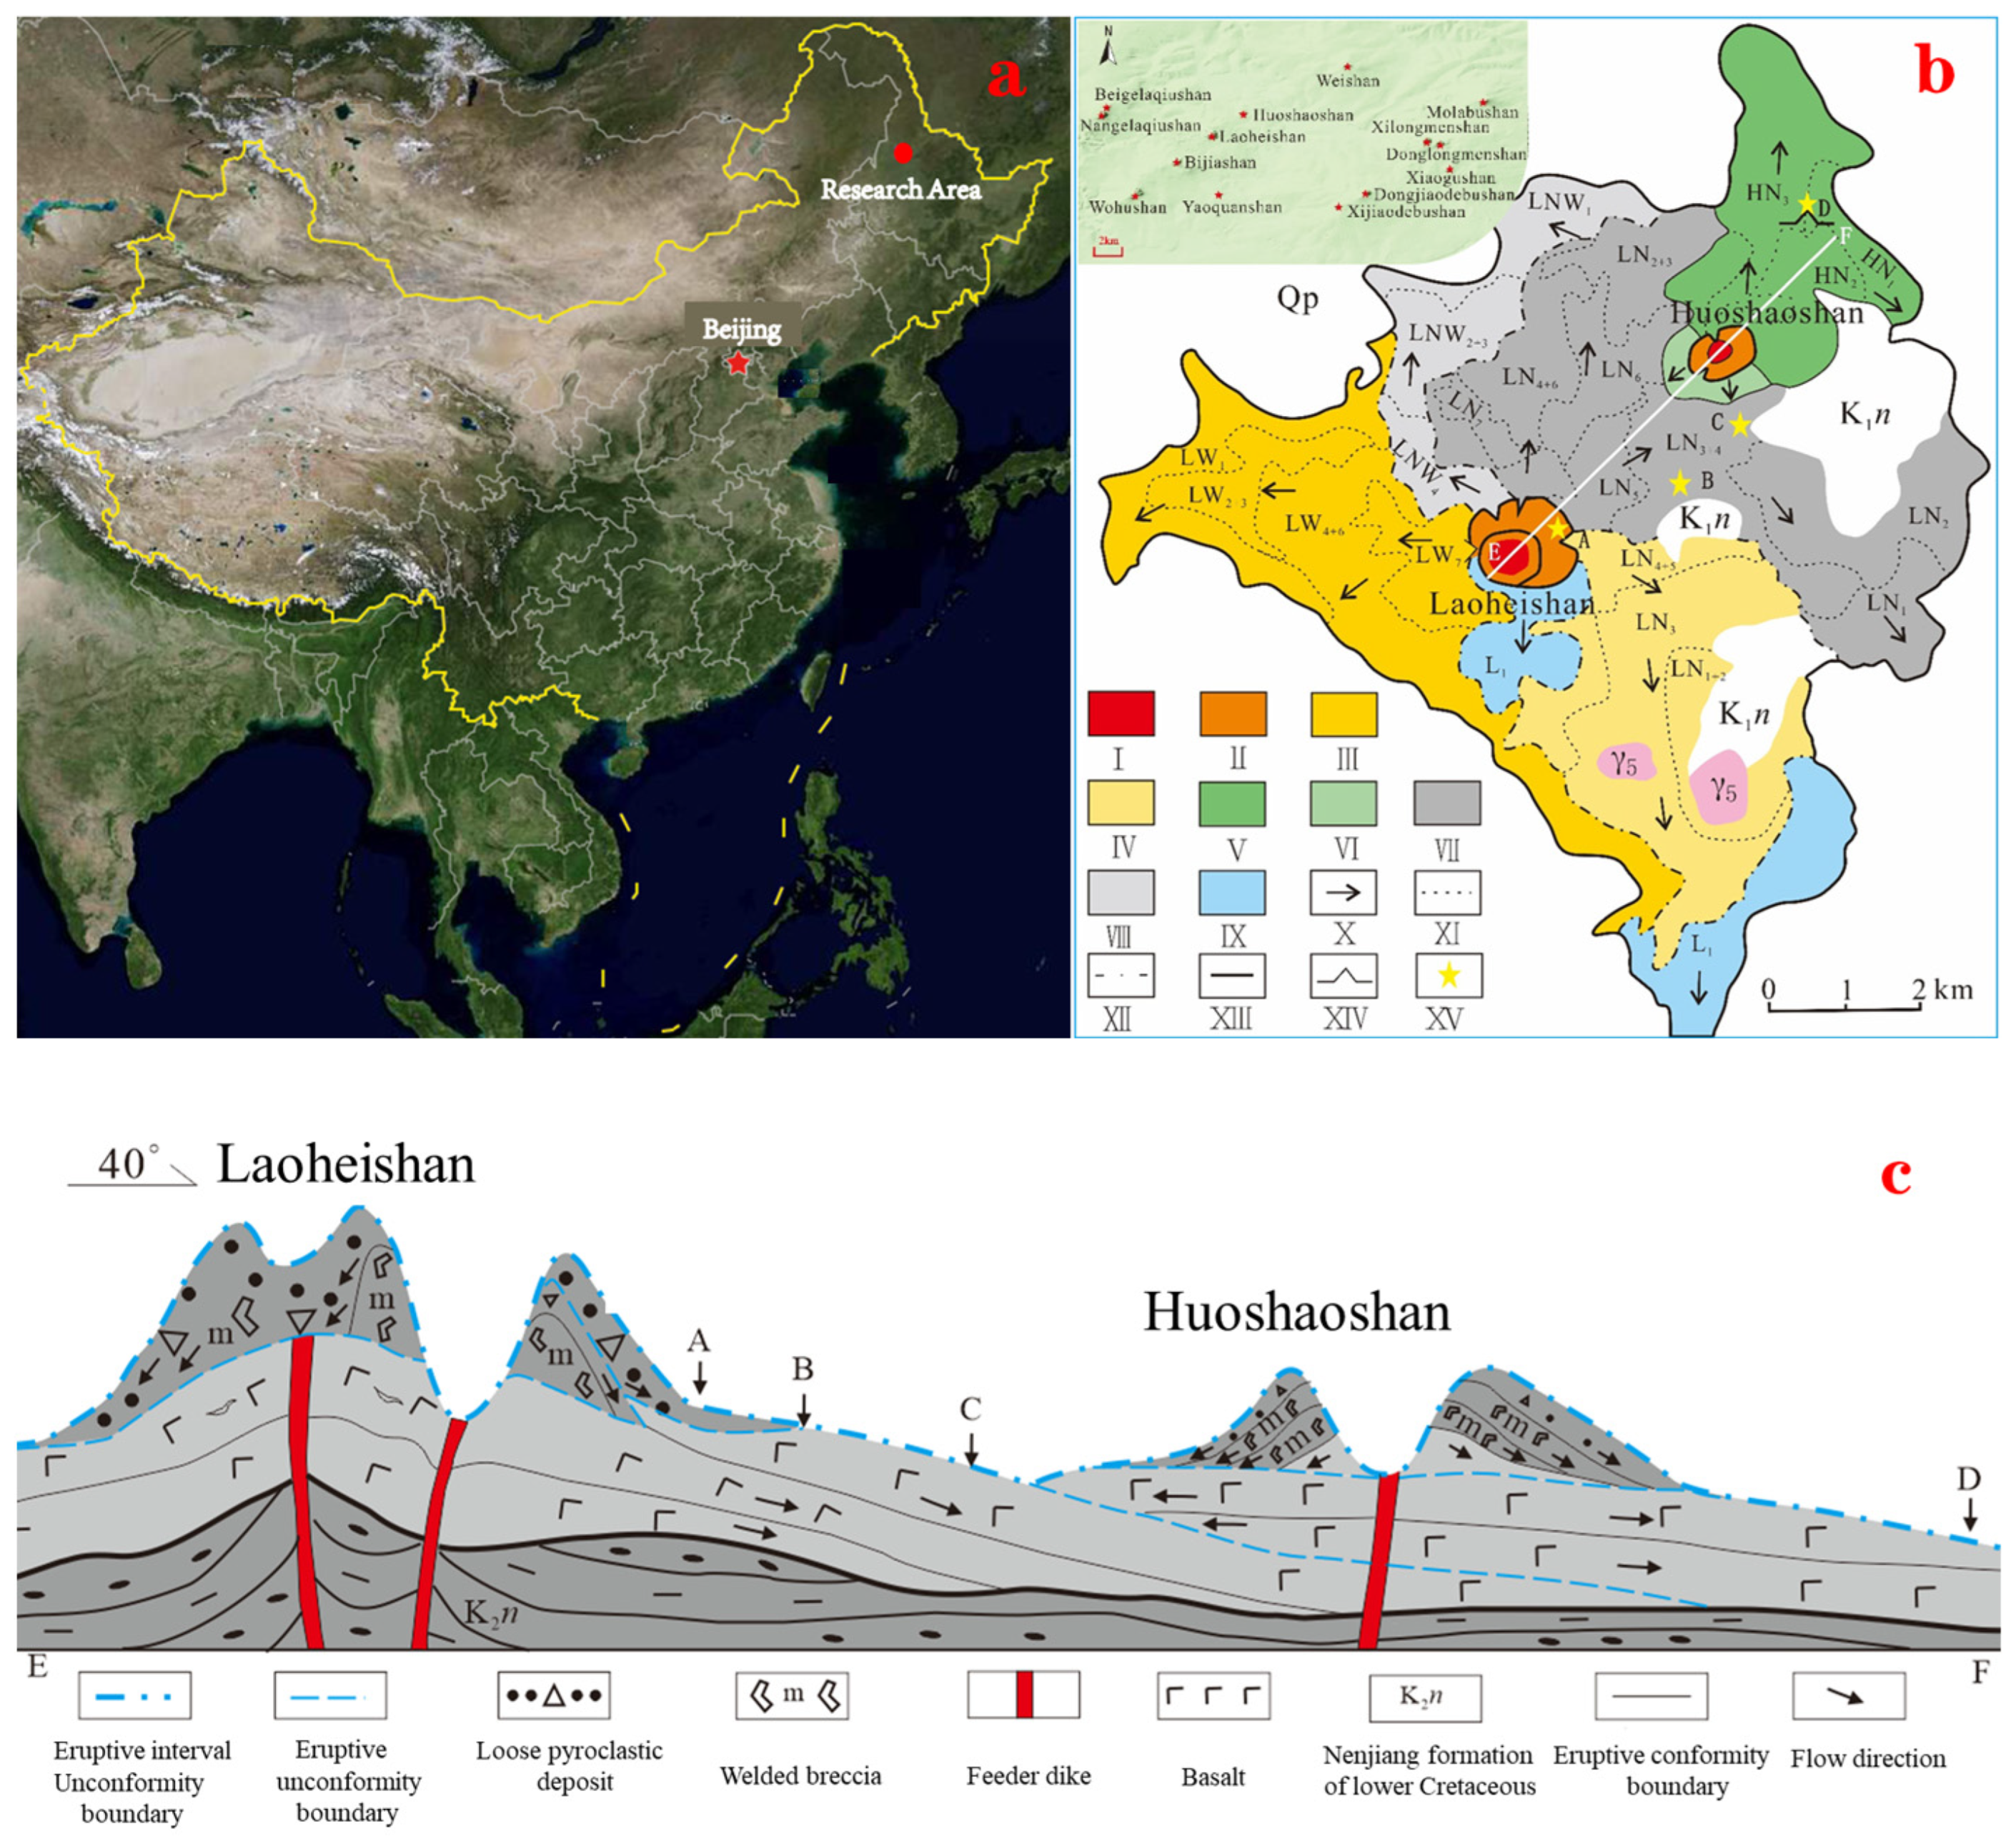
The Wudalianchi Volcanic Group is located in Wudalianchi City, Heilongjiang Province, China (Figure 1a). It is composed of 14 volcanoes (Figure 1b) with an area of approximately 800 km2, formed during the Quaternary, and can be divided into three periods: that is, the Middle Pleistocene Jiaodebu eruption, the late Pleistocene Wudalianchi eruption, and the Holocene Laoheishan eruption. The main research objects of this study are the Laoheishan and Huoshaoshan volcanoes, which were the highest and youngest volcanoes formed 303 years ago during an eruption. The surrounding lava flow platform flows for approximately 10 km and covers an area of 65 km2 (Figure 1c). The Laoheishan volcano erupted in five stages, with a lava flow area of 57.2 km2 and a lava flow volume of 1.144 km3. The eruption of the Huoshaoshan volcano occurred in three stages, with a lava flow area of 8.2 km2 and a lava flow volume of 0.123 km3. The eruptive products of Laoheishan and Huoshaoshan have the same composition, and potassium-rich alkaline basalt is dominant [25,26]. The molten lava originated from the basic potassium magma formed in the upper mantle, pulsated into the upper volcanic molten lava chamber, and mixed with the molten lava, which had differentiated and evolved to a certain extent before entering the molten lava chamber, resulting in rich magnesium and poor iron in the lava flow minerals [27]. The lower strata of Laoheishan and Huoshaoshan are black-grey pahoehoe basalts, followed by grey-purple and purplish-red basaltic volcanic agglomerates, volcanic breccia, and small amounts of fine-grained scoria (Figure 1c) [28]. In this study, an outcrop in the northeast of Laoheishan was selected (Figure 1c). The lava flow surface at different positions shows prominent pahoehoe and “a” flow. The distribution of the lithology and vesicles in the outcrop shows prominent zonation [29], making it an ideal area for studying lava flow vesicles.
Figure 1. Regional geological and topographic maps of basaltic lava flows in Wudalianchi Quaternary Laoheishan and Huoshaoshan (after [25,30]). (a) Geographical location of the study area; (b) Geological characteristics of the study area; (c) Outcrop characteristics of the study area. ★A/B/C/D study outcrop and sampling point location; I—crater; II—caldera; III—lava flow from the Laoheishan western breached crater(1–7 unit); IV—lava flow from the Laoheishan eastern breached crater(1–6 unit); V—lava flow from the Huoshaoshan northern breached crater(1–3 unit); VI—lava flow from the Huoshaoshan southern breached crater; VII—lava flow from the Laoheishan northern breached crater(1–7 unit); VIII—lava flow from the Laoheishan north-western breached crater(1–4 unit); IX—Laoheishan lava flow formed in early episode; X—lava flow direction; XI—boundary of lava unit; XII—boundary line of lava flows from the different breached craters; XIII—geological boundary line; XIV—hornito; XV—sampling point location; K1n—Cretaceous Nenjiang Formation; γ5—Yanshan stage granites.
Minerals 13 01434 g001

3. Materials and Methods

To analyze the reservoir performance of lava flows, this study analyzed the vesicle surface porosity of lava flow field outcrops and tested the porosity and permeability of rock samples.

3.1. Study on Surface Porosity and Vesicle Characteristics

In this study, we selected four field outcrops and nine samples from three facies belts around Laoheishan and Huoshaoshan to study the vesicles and surface porosity. To identify the vesicles of the outcrop and sample, 24 images of vesicles were drawn using CorelDRAW, and the vesicles were filled with colors that were easy for the instrument to distinguish (Figure 2). Thereafter, the 24 sample sketches were identified using the CIAS image analyzer, which classifies the apparent diameter of the vesicle using three methods: (1) the ellipse measurement method, where an ellipse with the same tilt direction and variable size was used to simulate the diameter and area of the vesicle. This method is accurate and rapid when automatic diameter recognition is difficult. (2) For the long-short diameter measurement method, the long or short diameter of the vesicle is measured to simplify the measurement process, and the long and short diameters of the vesicle are equal. (3) In the polygon measurement method, a polygon with variable side numbers and side lengths was used to fit the shape of the vesicle. Based on the proportion of different vesicle shapes, the chosen measurement method was more suitable for the actual research. According to the μm value classification method, the largest Feret diameter was used to identify the vesicle in the image. To improve the recognition accuracy, an RGB color space segmentation method was selected during the recognition process, and the instrument recognized the distribution range of different vesicle apparent diameters and the size of the surface porosity in the image. Therefore, there are differences in the apparent vesicle diameter and surface porosity at different sampling points or in different positions of the same outcrop. Samples of different facies belts were scanned using computed tomography (CT), and a three-dimensional vesicle network model was established to analyze the shape of vesicles, the proportion of vesicles with different sizes to the number of vesicles, and the volume of vesicles. JmicroVision was used to extract the vesicle shape parameters: the vesicle area, circumference, and long-short axis, from the image and distinguish the vesicle shape (Table 1).
Table 1. Two-dimensional descriptive parameter formula of vesicle shape.
DefinitionFormulaDescription
Elongation
[31]
ε = a b a + b a is semi-long axis and b is semi-short axis. 0 represent circular objects and 1 extremely elongated ones
Roundness
[32]
C = P 2 A A is vesicle area and p is perimeter.
The value range is [4π,+∞].The smaller coefficient, the closer it is to circle
Revised Blaschke Coefficient [33]Cb = 2 π A P A is vesicle area and p is perimeter.
The value range is [0, 1]. The larger coefficient, the closer it is to the circle
Regularity
[34,35]
SF = 4 π A P 2 A is vesicle area and p is perimeter.
Perfect circle has SF = 1, more complex shapes have SF tending towards 0.

3.2. Porosity and Permeability Test

Porosity and permeability tests were performed at the Petrophysical Test Center of Jilin University. The 27 core samples taken from different facies belts were tested using an AP608, an overburden porosity and permeability measurement instrument produced by the CoreTest Company in the United States. The system used an electronically controlled fluid injection pump to regulate the overburden pressure. Porosity and pore volume were measured using Boyle’s law [36]. porosity = pore volume/core volume, i.e., (core volume − grain volume)/core volume.
The permeability was determined using unsteady pulse attenuation technology; that is, the pressure difference and flow rate were measured after a fluid flowed through the rock sample. The pressure difference was obtained by measuring the inlet and outlet pressures with a pressure meter. The fluid flow was measured using calibrated vent holes. The absolute permeabilities of the rock samples were calculated using Darcy’s law.

4. Vesicle Distribution

In this study, a volcanic facies belt model was established based on vesicle-rich basaltic lava flow in Laoheishan and Huoshaoshan. Centered around the crater, according to the distance from the crater, lithology, facies, and attitude of stratum, the lava flow could be divided into three facies belts: the crater-near crater belt, the proximal belt, and the distal belt. The distance between the three facies belts outcrops and the crater is 0.57 km, 2.1 km and 3.5 km, respectively. Given the similarity in the distribution of facies in different stages of lava flows, one-stage lava flows can reflect the control of the overflow stacking of multi-stage lava flows on the spatial distribution of vesicles. Combined with the existing data, the characteristics of the lava flow vesicles were analyzed to explore the reservoir performance of lava flows.

4.1. Crater-Near Crater Belt

4.1.1. Vesicle Shape

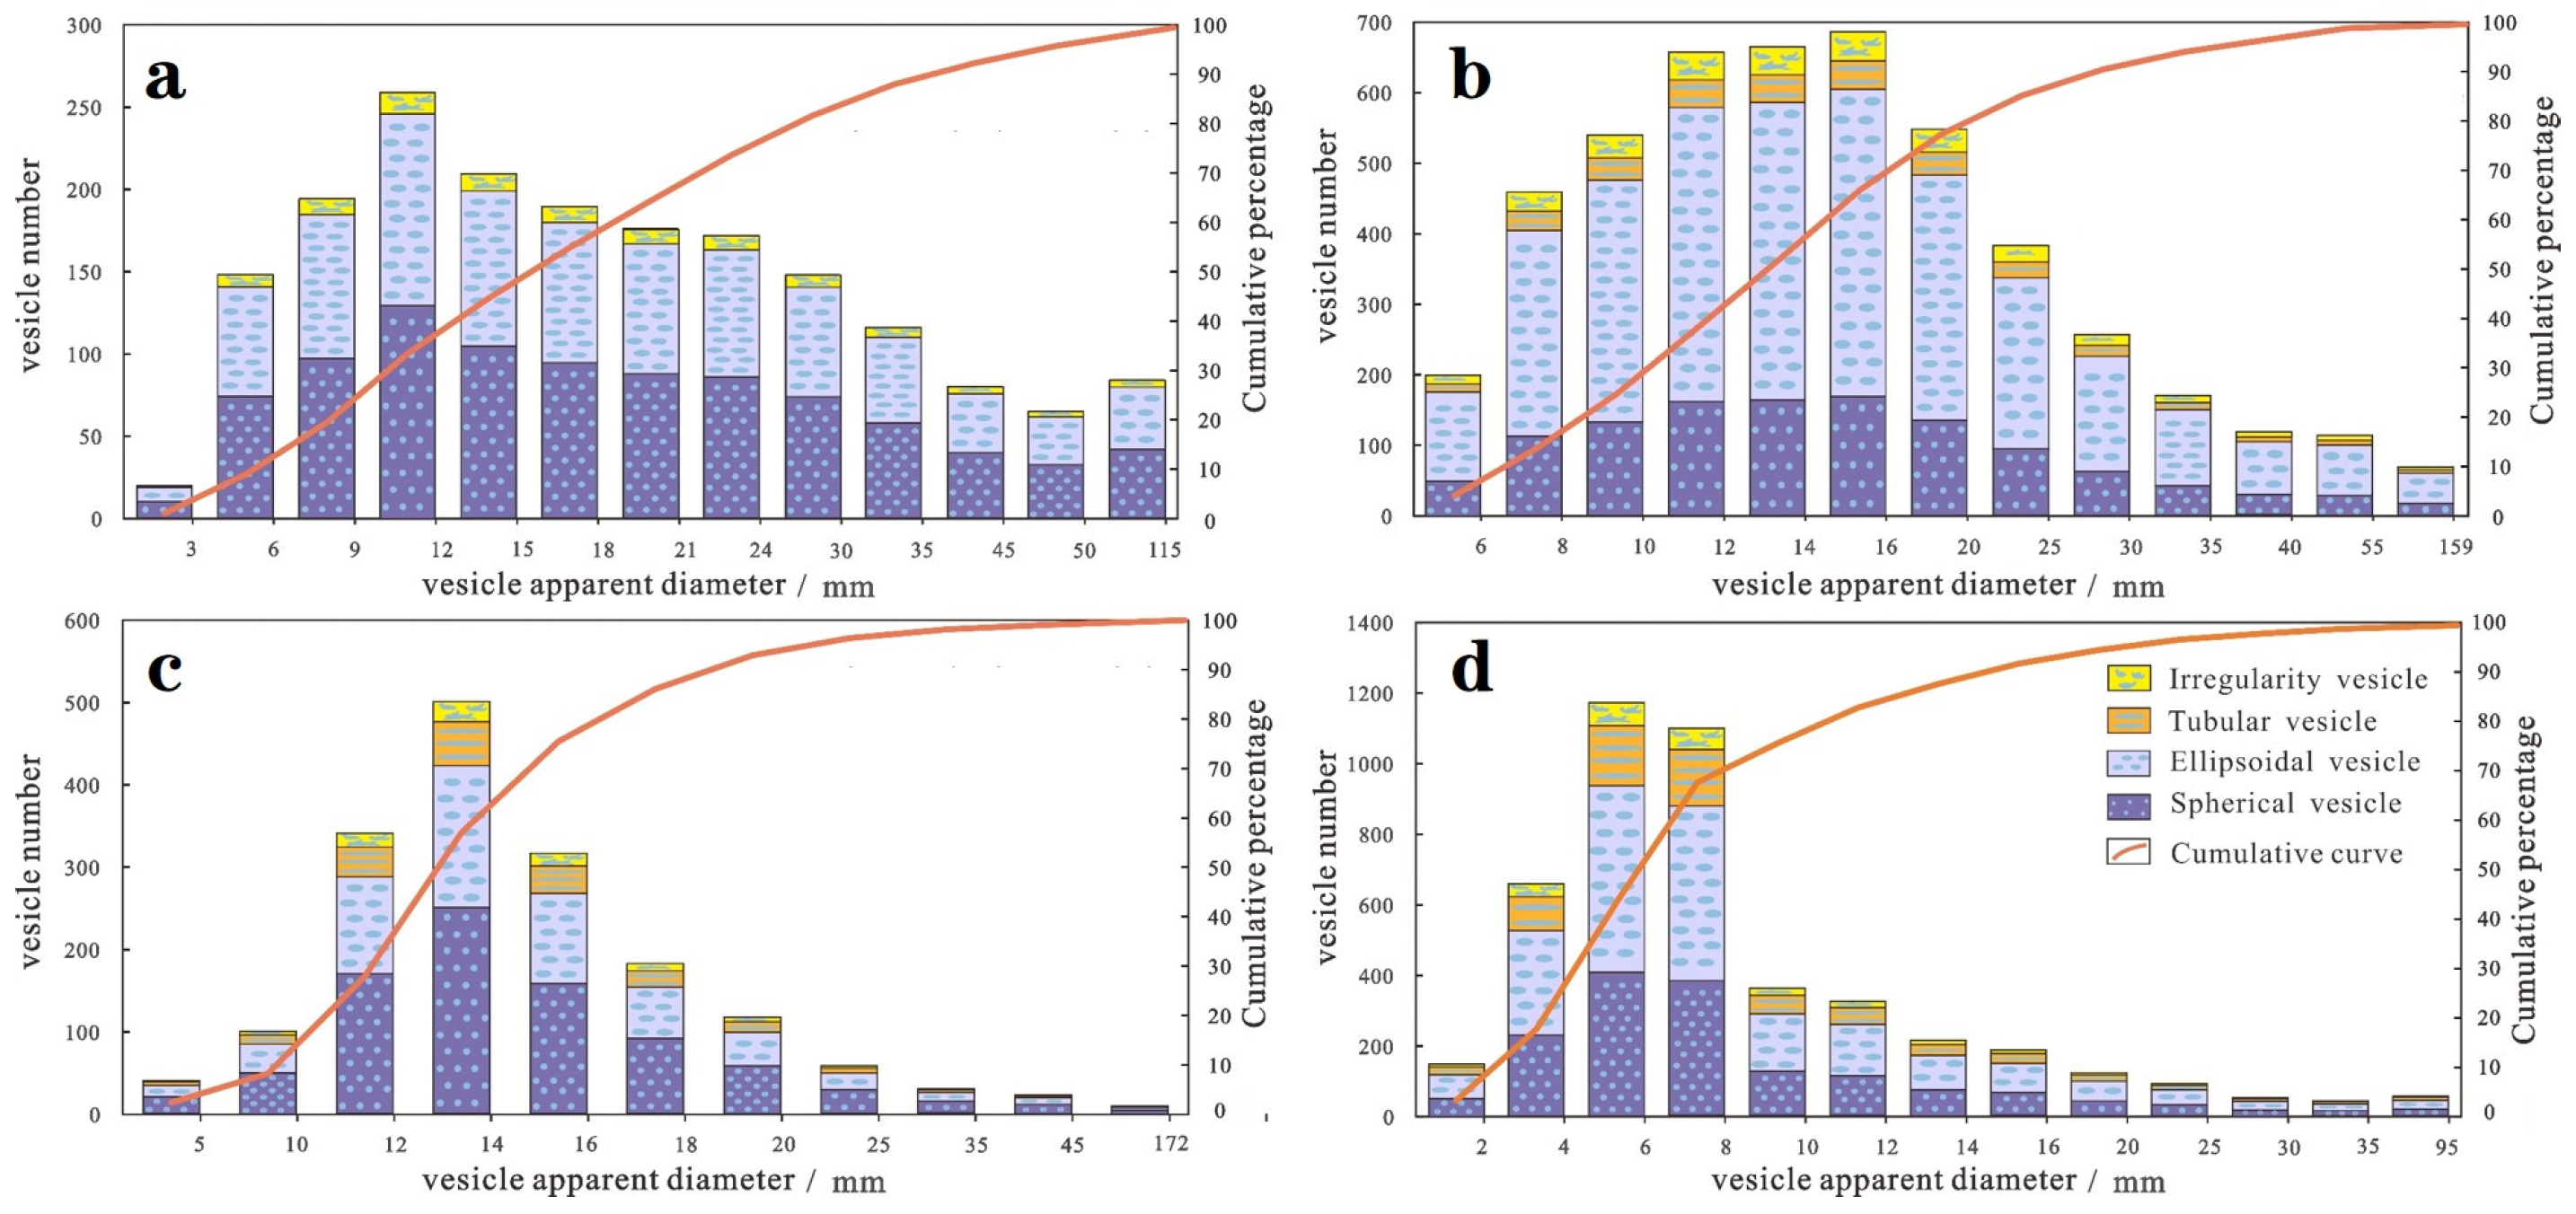
The crater-near crater belt was selected in a field outcrop of the northeast-breached crater of the Laoheishan Volcano (Figure 1b(A)). The vesicles in this belt can be divided into spherical, ellipsoidal, and irregular shapes. The vesicles in the top zone of the lava flow are dominated by spherical and nearly spherical vesicles with relatively regular shapes. The inner walls of single vesicles are generally smooth. When two or more vesicles are connected, the inner wall is jagged, and the shape is irregular and cloud-like. In the top vesicle zone, the geometric mean of elongation ε = 0.195, the geometric mean of regularity SF = 0.7, the geometric mean of Blaschke coefficient Cb = 0.84, and the geometric mean of roundness C = 17.8. The basal vesicle zone of the lava flow is spherical and ellipsoidal, with large apparent diameters. Some of the basal vesicle zones of the lava flows were filled with mud or calcium. The geometric mean value of the vesicle elongation ε = 0.19, some of the vesicle elongation ε > 0.5. The geometric mean of regularity SF = 0.75, the geometric mean of Blaschke coefficient Cb = 0.87, and the geometric mean of roundness C = 16.5. The apparent diameter of vesicles ranged from 1.80–114 mm, concentrated in the range of 10–20 mm (Figure 3a), in which vesicles with an apparent diameter >50 mm accounted for 4.54%, 20–50 mm accounted for 41.95%, 10–20 mm accounted for 34.13%, and <10 mm accounted for 19.38%. Considering the apparent diameter of a single vesicle, it is considered that the apparent diameter of the vesicle at the basal zone is larger than that at the top of the lava flow.

4.1.2. Vesicle Arrangement

According to the shape and distribution of the vesicles, the primary vesicles of lava flows can be divided into ellipsoidal with directional elongation and spherical with a discrete distribution. The vesicle arrangements of the crater belts are diverse. The vesicles at the basal zone of the lava flow were ellipsoidally elongated along the direction of the lava flow under the double action of the tension-torsion stress and buoyancy. Vesicles are densely distributed, and vesicle connections or fusions are common. The massive core zone of the lava flow is dominated by small, spherical vesicles with discrete distributions without direction. The top vesicle zone is dominated by discrete, spherical, and near-spherical vesicles.

4.1.3. Vesicles Quantity

The number of vesicles depends on the volatile content and difficulty of volatilization in the lava and affects the size of the reservoir space of the lava flow. In the crater-near-crater belt, approximately 2000 vesicles were identified from five images of a lava flow outcrop. Significant differences were found in the proportions of vesicles of different shapes in the facies belt. Overall, spheroidal vesicles dominated, accounting for approximately 50%; ellipsoidal vesicles accounted for approximately 45%; and irregular vesicles accounted for approximately 5% (Figure 3a). The image of a certain area (25 cm × 25 cm) in the outcrop of this facies belt shows approximately 400 vesicles in the top zone with an apparent diameter of 8–20 mm and approximately 320 vesicles in the basal zone with an apparent diameter of 20–50 mm. The number of vesicles in the basal zone of the lava flow was greater than that in the top zone.

4.1.4. Surface Porosity

The pore structure of reservoir rocks, which are the most important pore structures in volcanic rocks, is of considerable importance for the exploration of the internal structure of hydrocarbon reservoirs and the exploration and development of hydrocarbons. Therefore, the surface porosity of the lava flow unit indicated the pore structure division of the reservoir. Five vesicle images were identified to obtain the vesicle surface porosity from basal to top in the crater–near-crater belt outcrops: 35.14%, 33.14%, 40.9%, 25%, 22.75%, and 31.39%. The overall surface porosity of this facies belt was higher, and the basal vesicle zone of the lava flow was higher than that of the top vesicle zone.

4.2. Proximal Belt

4.2.1. Vesicle Shape

The proximal belt selected was the field outcrop of the northern breached crater of the Laoheishan Volcano (Figure 1b(B)), which has a pahoehoe surface. The vesicle shape in this facies belt was relatively simple and dominated by ellipsoidal vesicles, with a few irregular and tubular vesicles formed by the elongation of spherical and ellipsoidal vesicles at the top of the facies belt. At the top vesicle zone elongation ε = 0.4 and some of the vesicle elongation ε > 0.7. The apparent diameter of vesicle ranged from 3.0 to 158 mm, concentrated in the range of 11.8–16.7 mm (Figure 3b), in which vesicle with apparent diameter >50 mm accounted for 2.49%, 20–50 mm accounted for 20.44%, 10–20 mm accounted for 63.73%, and <10 mm accounted for 13.3%. The vesicles with larger apparent diameters are concentrated at the top zone of the lava flow. The regularity of the vesicle shape in the proximal belt is lower than that in the crater-near-crater belt.

4.2.2. Vesicle Arrangement

The arrangement of vesicles in the proximal belt is relatively simple. The vesicles are dominated by elongated ellipsoidal shapes along the direction of the lava flow, and most of the vesicles are at an angle between 15° and 45° from the horizontal plane. At the top zone of the lava flow, owing to the difference in flow velocity caused by magma condensation, the change in flow direction makes the arrangement direction of vesicles at the top zone appear irregular. The long axis of some vesicles is vertically distributed along the flow direction, and spherical vesicles are distributed in each position of the outcrop.

4.2.3. Vesicles Quantity

In the proximal belt, approximately 4800 vesicles were identified from five images of a lava flow outcrop. The number of vesicles in the proximal belt was slightly higher than that in the crater-near-crater belts. Overall, ellipsoidal vesicles are dominant, accounting for approximately 65%. Spherical vesicles accounted for approximately 25% and irregular and tubular vesicles accounted for approximately 5% (Figure 3b). The number of vesicles in the equal-area images was approximately equal, indicating that the distribution of vesicles in the proximal belt was relatively extensive and uniform.

4.2.4. Surface Porosity

The vesicle surface porosities from top to base in the proximal belt outcrop were 27.05%, 19.56%, 25.7%, 16.74%, and 15.85%, respectively, with an average surface porosity of 20.98%. The top zone surface porosity was relatively high, and the contribution value of the surface porosity compared with the proximal belt was lower than that of the crater-near-crater belt (31.39%).

4.3. Distal Belt

4.3.1. Vesicle Shape

The distal belt was selected as a field outcrop of the northern breached crater of the Laoheishan Volcano (Figure. 1b(C)). At the farthest end of the lava flow, the distal lava flow often has the characteristics of “a” lava surface in field geology. In this facies belt, except for a small number of vesicles that were further stretched into large thin tubules of 1–5 cm after migration, the remainder were dominated by small spherical and ellipsoidal vesicles. Vesicle elongation is relatively low ε = 0.16, vesicle shape regularity is generally higher SF = 0.8, Blaschke coefficient is large Cb = 0.9. The apparent diameter of vesicles is concentrated in the range of 10–15 mm, and the maximum apparent diameter of vesicles was 172 mm (Figure 3c), in which vesicles with an apparent diameter >50 mm accounted for 3%, 20–50 mm accounted for 6.88%, 10–20 mm accounted for 81.89%, and <10 mm accounted for 8.23%. The vesicle distribution in the facies belt was more uniform.

4.3.2. Vesicle Arrangement

The main characteristic of vesicles in the distal belt is the presence of many tubular vesicles that are approximately parallel to the direction of the lava flow and are elongated at a low angle. In the massive core zone of the lava flow, there are scattered small spherical vesicles and a few ellipsoidal vesicles arranged in parallel at a high angle of >60°.

4.3.3. Vesicles Quantity

In the distal belt, approximately 1700 vesicles were identified from five images of a lava flow outcrop. Given the evaporation of volatiles and the gradual condensation of magma with migration distance, the number of vesicles in the distal belt is substantially less than that in the other two facies belts, and the vesicles gather at the top zone of the lava flow. The proportion of vesicles with different shapes also varied significantly, with small spherical vesicles accounting for approximately 50%, ellipsoidal vesicles for 35%, tubular vesicles for 10%, and irregular vesicles for the remaining 5% (Figure 3c).

4.3.4. Surface Porosity

By identifying the vesicle images depicted, the vesicle surface porosity from top to basal in the distal belt outcrop were 8.29%, 7.71%, and 4.86%, respectively, and the average surface porosity was 6.95%. The contribution value of the surface porosity in this facies belt is significantly lower than that in the crater-near-crater belt and the proximal belt because the low-density volatiles forming vesicles spill out in large quantities during lava flow, resulting in a decrease in surface porosity.

4.3.5. Hornito

Hornito is a representative product formed in the distal belt of a lava flow and is distributed near water. The formation mechanism is that lava flows through aquifers or wet areas, and a large amount of gas is rapidly generated at the base of the lava flow. Driven by the gas, the internal volume of the consolidated lava flow under the surface shell expands rapidly, and the internal pressure increases. The liquid lava flow breaks through the weak zone of the consolidated surface or spits out along the fracture channel, and the spilled “lava cake” is stacked on the surface in layers until the internal pressure is insufficient to provide the spillage power [37]. When the internal gas generation is less, the pressure is less. The lava is only stacked in a few layers on the surface. At this time, the height is relatively small, and the outflow center “horn” is relatively large, called the eruption hole or the eruption dish. When there is more gas generated in the interior and the pressure is high, the lava is stacked in dozens or dozens of layers on the surface to form a tall hornito (tower). The middle of the hornito preserves the gas channel of the hollow structure.
The formation conditions of hornito in the Huoshaoshan distal belt differ from those in other areas. The lava flow in this facies belt breaks through the semi-consolidated surface and breaks it into slag blocks at the base and front of the lava flow. It then presents a “caterpillar” flow form. This mode is not conducive to direct contact between the lava and water and is more manifested as the lava uses its high temperature property to bake and heat water-rich sediments to form water vapor [38].
In this study, the hornito was located in the distal belt of the northern breached crater of the Huoshaoshan volcano (Figure 1a). Approximately 4500 vesicles were identified in four hornito images. The majority of vesicles were ellipsoidal on the flow surface of each layer and elongated along the flow direction from the center to the edge of the “drop shape.” The stacked marginal band vesicles have different shapes; most appear as discrete spheres and ellipsoids, and the arrangement direction is not directional. Although hornito is the product of a distant facies belt, the number of vesicles is substantially greater than that in the distal belt, which is because of its formation mechanism and environment. The apparent diameter of vesicles <10 mm accounted for 75.6%, the apparent diameter >10 mm accounted for 24.4%, and it was concentrated in the range of 4–10 mm. The maximum apparent diameter of the vesicle was 95 mm (Figure 3d). The vesicle surface porosities obtained from analysis of the four images were 15.93%, 16.46%, 18.6%, and 17.75%, respectively, and the average surface porosity was 17.19%, which was higher than that of the distal belt.

4.4. Vesicle Characteristics Based on CT Scan Images

To explore the shape, size, and connectivity of the vesicles inside lava flows, a CT scan was performed on lava flow samples from Laoheishan in the field. Compared with conventional pore research, this method can provide three-dimensional visualization of rock microstructures under the condition that the sample has not been destroyed and truly shows the internal structure of the rock. This method can be used to examine the size, spatial distribution, and connectivity of rock vesicles.
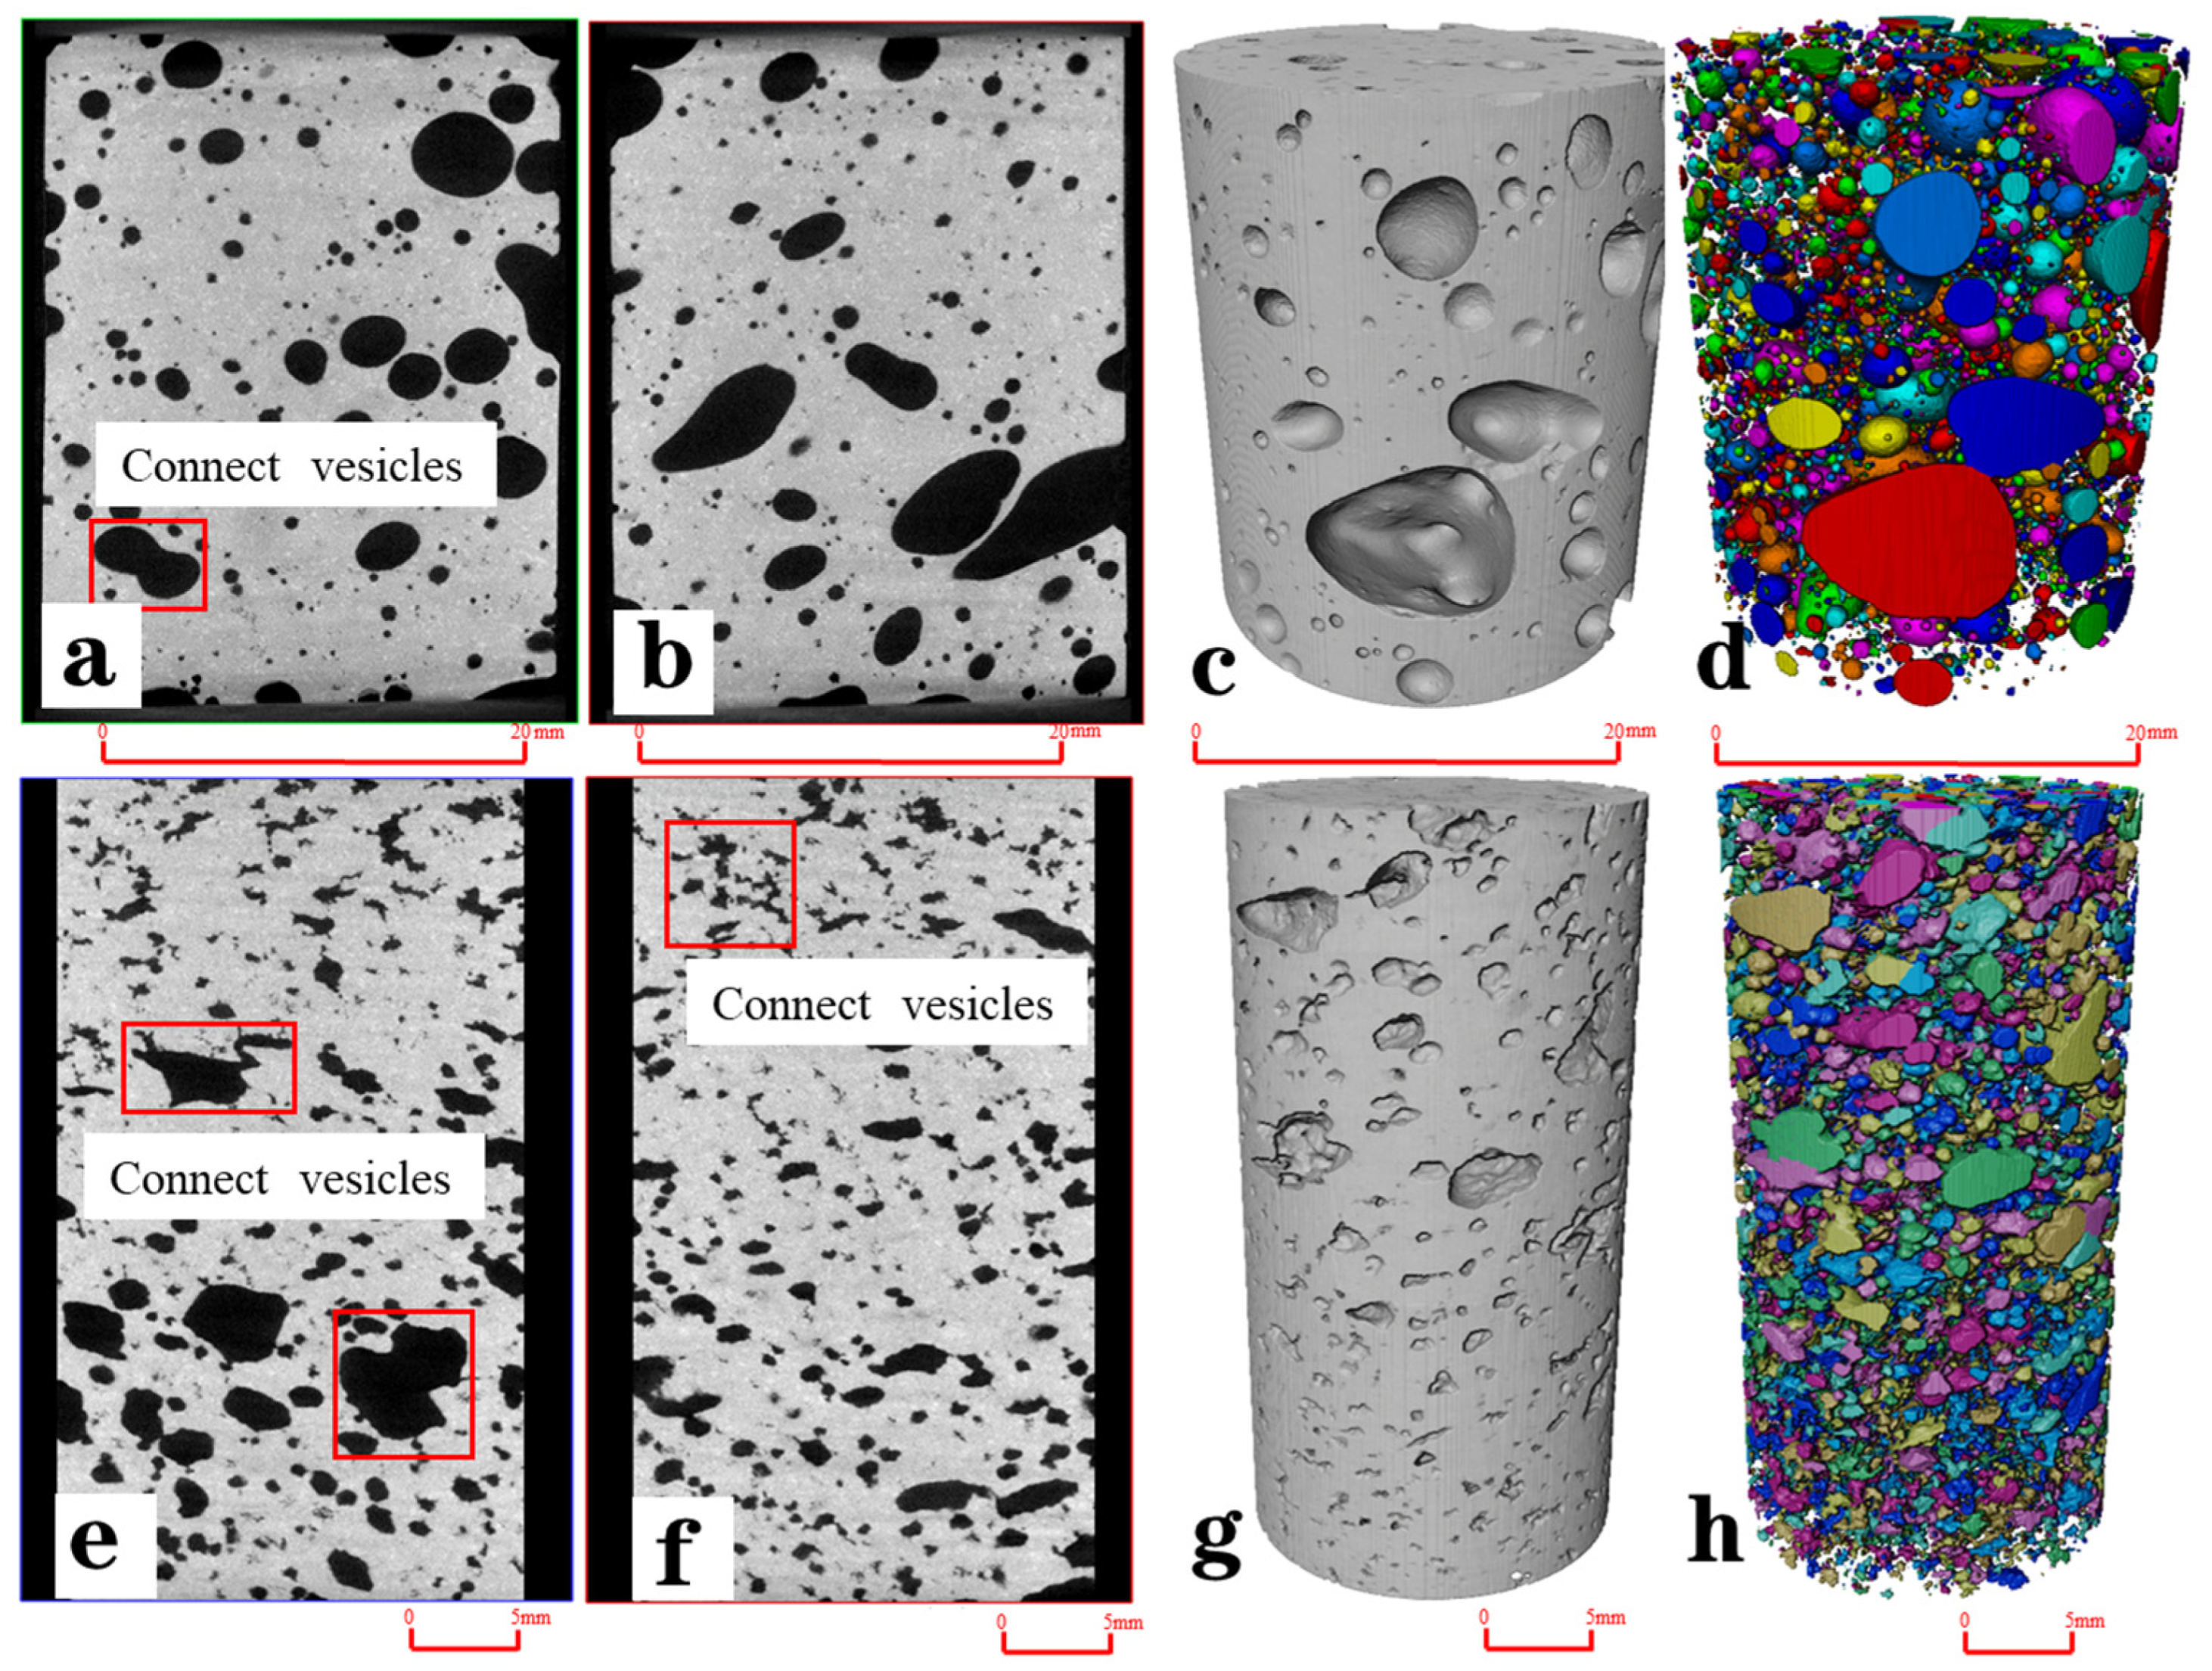
The shapes of the vesicles in the CT images are consistent with the actual descriptions. The crater-near-crater belt was dominated by spherical and ellipsoidal shapes, and most vesicles were isolated with weak connectivity (Figure 4a,b). The proximal belt is dominated by ellipsoids. Most vesicles are in independent states, and the connectivity between them is not strong (Figure 4e,f). The vesicles were extracted from the 3D pore network model. Each vesicle was separated independently and rendered with different colors so that each vesicle has its own independent color (Figure 4d,h). Different colors represent different vesicles, and adjacent vesicles are represented by different colors so that the vesicles can be matched and extracted for research and assessment. Owing to differences in the research methods, the size of the vesicles identified by CT scanning is quite different from that depicted on the lava flow outcrop. The radius of the main vesicle in the crater-near crater belt is 0.1–0.2 mm, the maximum equivalent radius of the vesicle is 3.98 mm (Figure 5a), the porosity of the vesicle model is 20.21%, and the radius of the main vesicle that contributes the most to the porosity is 1–4 mm (Figure 5b). The radius of the main vesicle in the proximal belt was 0.01–0.04 mm and 0.1–0.4 mm, the maximum equivalent radius of the vesicle is 3.82 mm (Figure 5c), and the porosity of the vesicle model is 21.37%. The radius of the main vesicle that contributed the most to porosity was 1–2 mm, followed by 3.5–4 mm (Figure 5d).

4.5. Porosity and Permeability

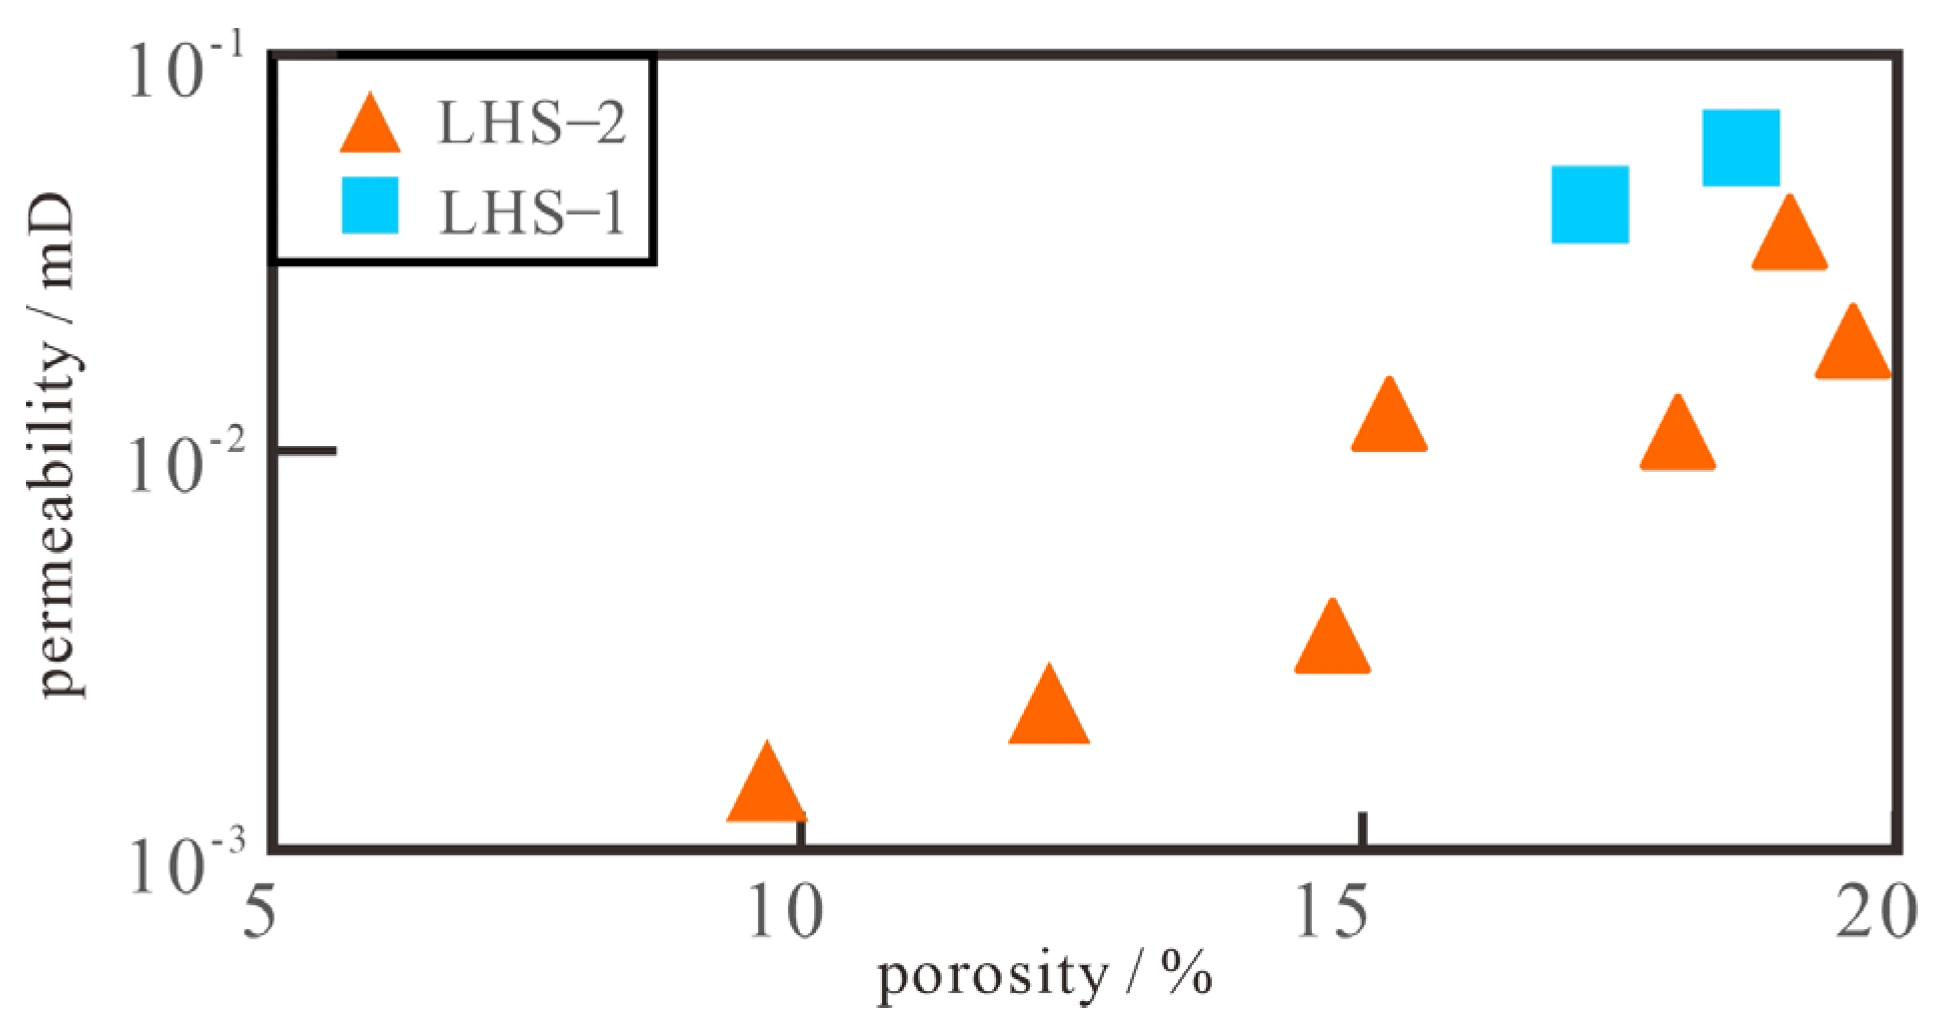
Statistical data has shown that the vesicle content in a volcanic rock reservoir is proportional to the rock porosity. Volcanic rock reservoirs can be evaluated based on vesicle development [25]. Based on the analysis of the porosity and permeability data of the nine samples collected, it was concluded that the rock samples of the crater–near-crater belt have a high porosity (17.7%–19.5%), with a mean porosity of 16.6% and permeability of 0.04 mD. Compared with the crater-near-crater belt, the rock sample porosity in the proximal belt was lower (9.8%–20%), the geometric mean value of porosity was 15.5%, the permeability was lower than that in the crater-near-crater belt (0.001–0.032 mD), and the geometric mean value of permeability was 0.006 mD (Figure 6). The porosity and permeability data are positively correlated with the vesicle and fracture development of lava flows. The crater-near crater belt has a high porosity and high permeability, but the porosity and permeability of the proximal belt are relatively low.

4.6. Vesicle Surface Pororsity

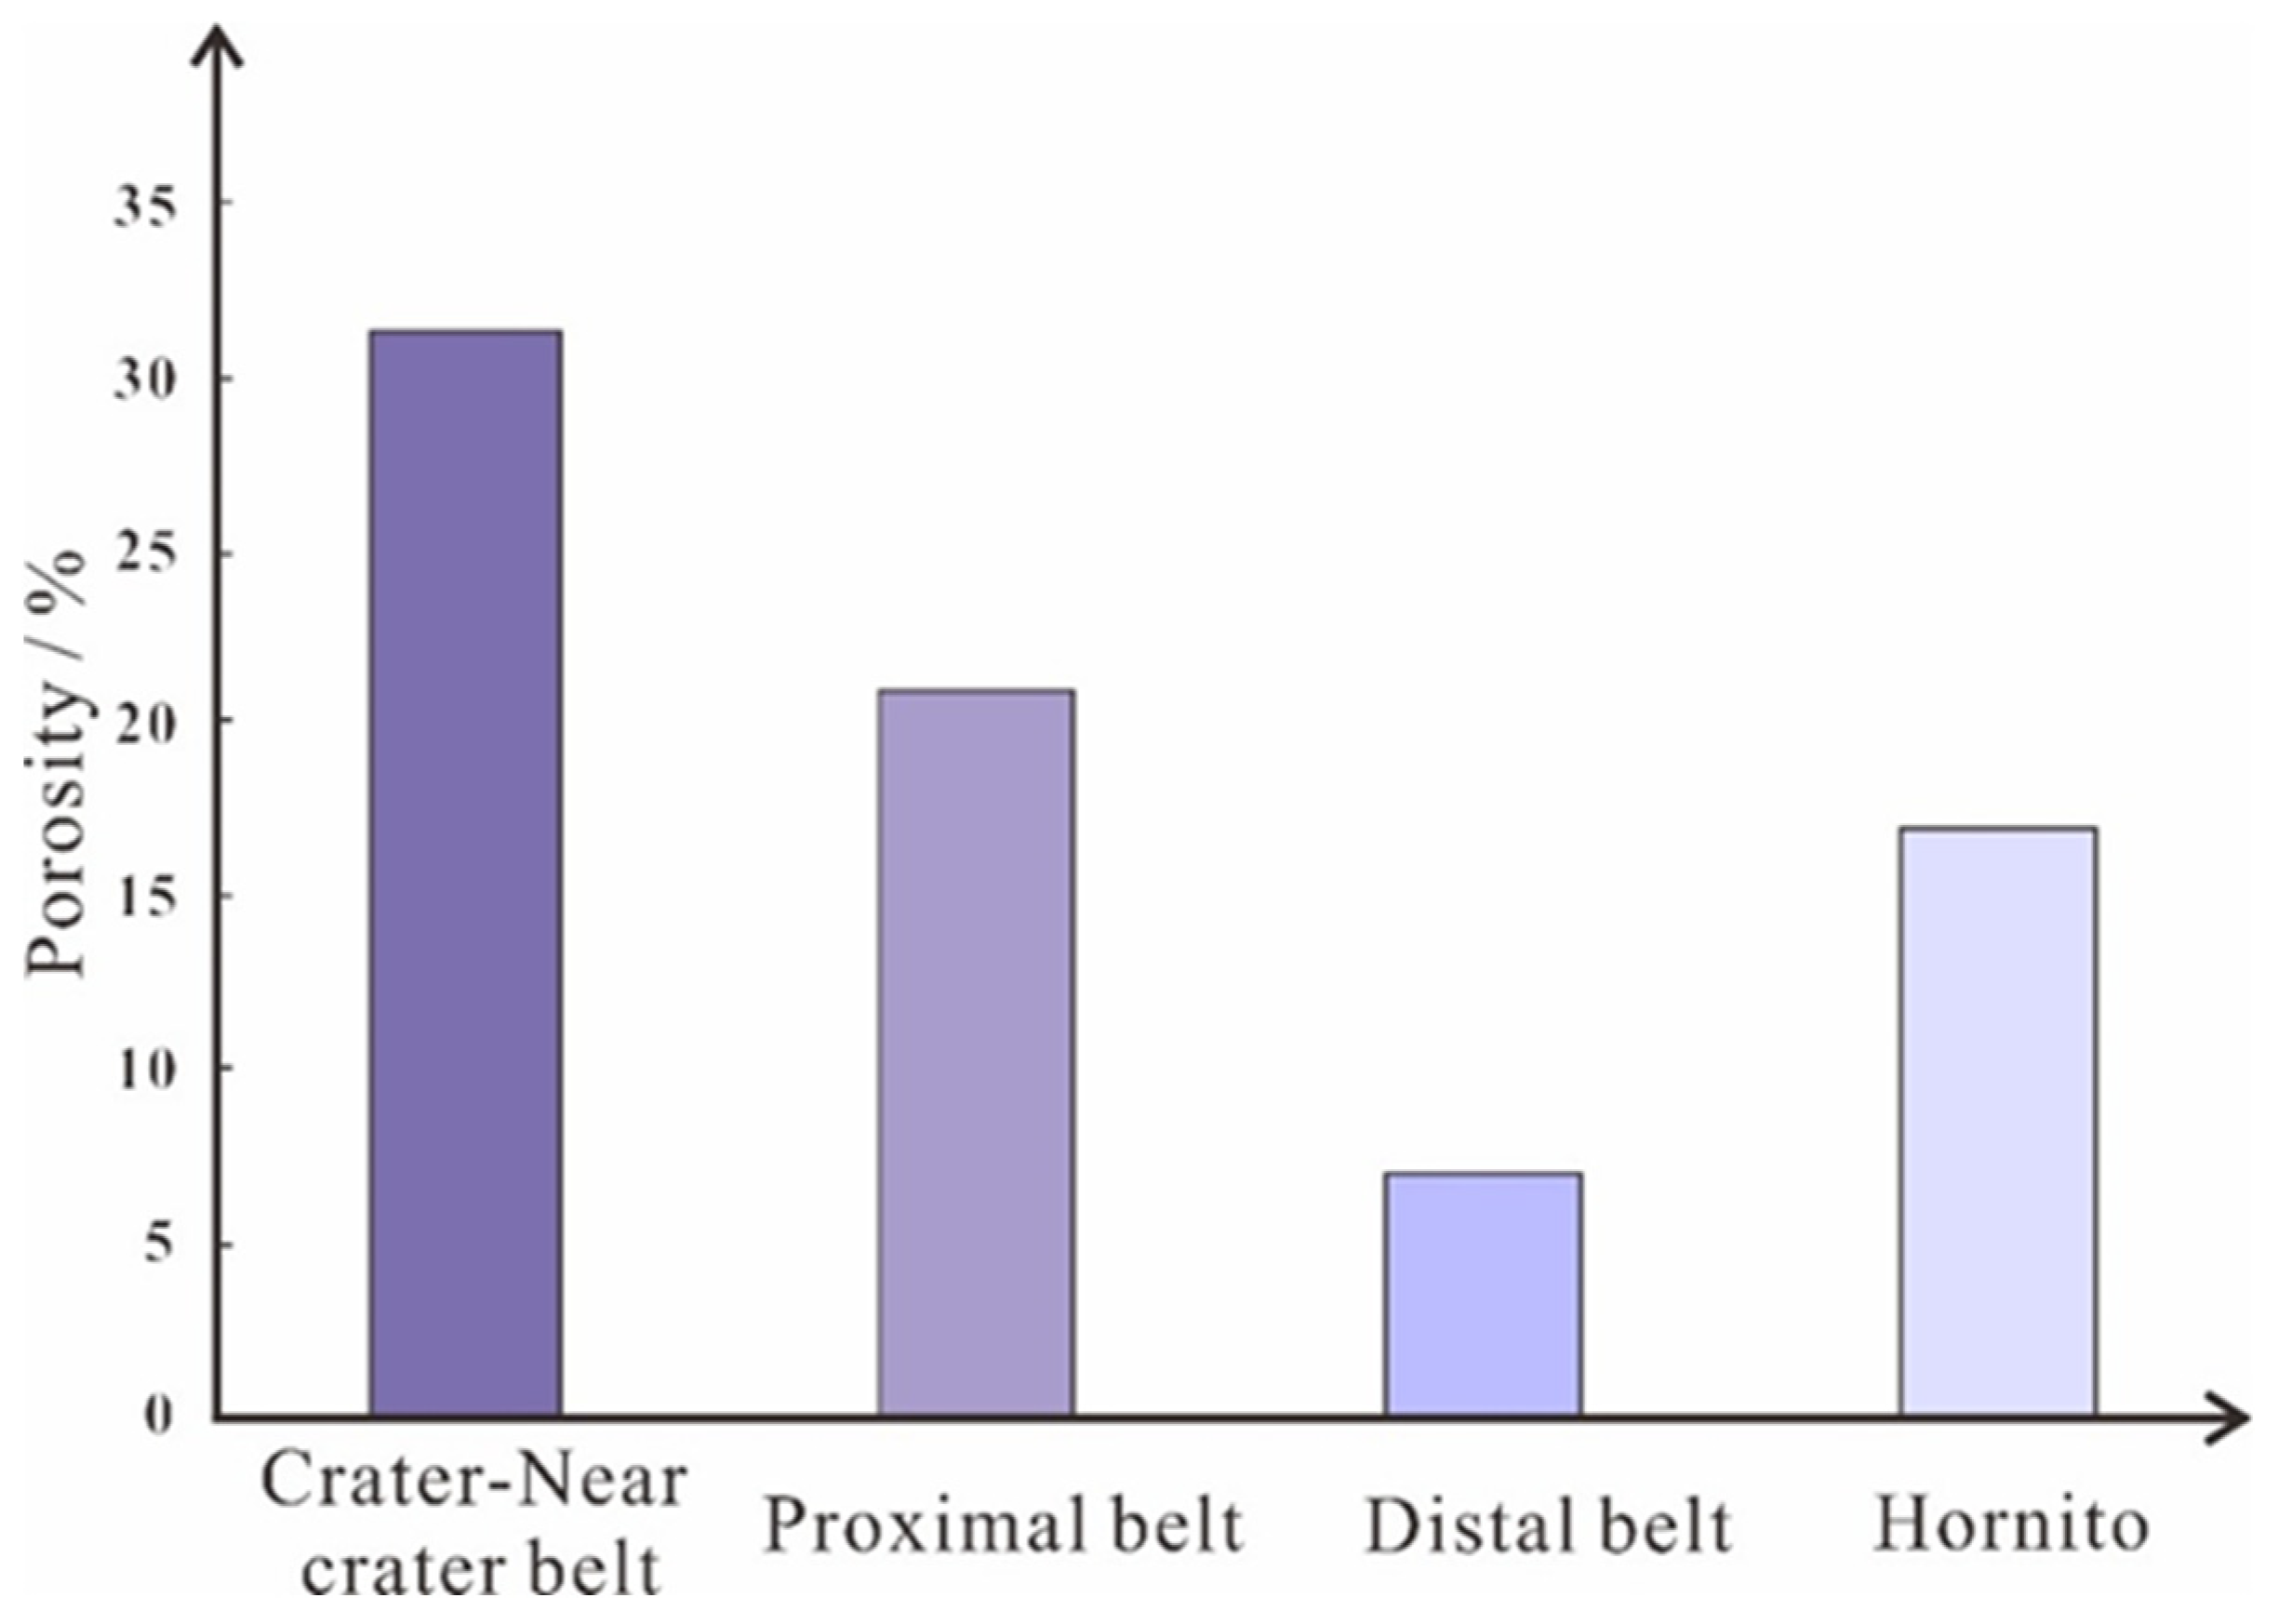
Vesicles are key indicators of volcanic reservoir characteristics. Based on the recognition and analysis of 16 images from four outcrops in three facies belts of lava flows, it was found that the surface porosity of the lava flows was highest in the crater-near-crater belt, exceeding 30%. With an increase in flow distance, the surface porosity gradually decreased to 20.98% in the proximal belt and 6.95% in the distal belt (Figure 7). Owing to the specific formation conditions and mechanisms of hornito, its surface porosity is higher than that of the distal belt and is similar to that of the proximal belt.

5. Discussion

5.1. Relationship between Lava Flow Distance and Vesicles

Identification and analysis of the vesicles in the three facies belts of the lava flow showed that the shape of the vesicles was closely related to the distance of the lava flow. The main factor in the vesicle shape change is that the velocity difference of the lava flow at different positions causes the vesicle to elongate or deform. Therefore, there may be randomness in the study of vesicle shape, quantity, and size at different positions. It is also a limitation in the research process. By summarizing the size, regularity, and quantity of vesicles in the three facies belts, the relationship between the vesicles and the flow distance was analyzed.
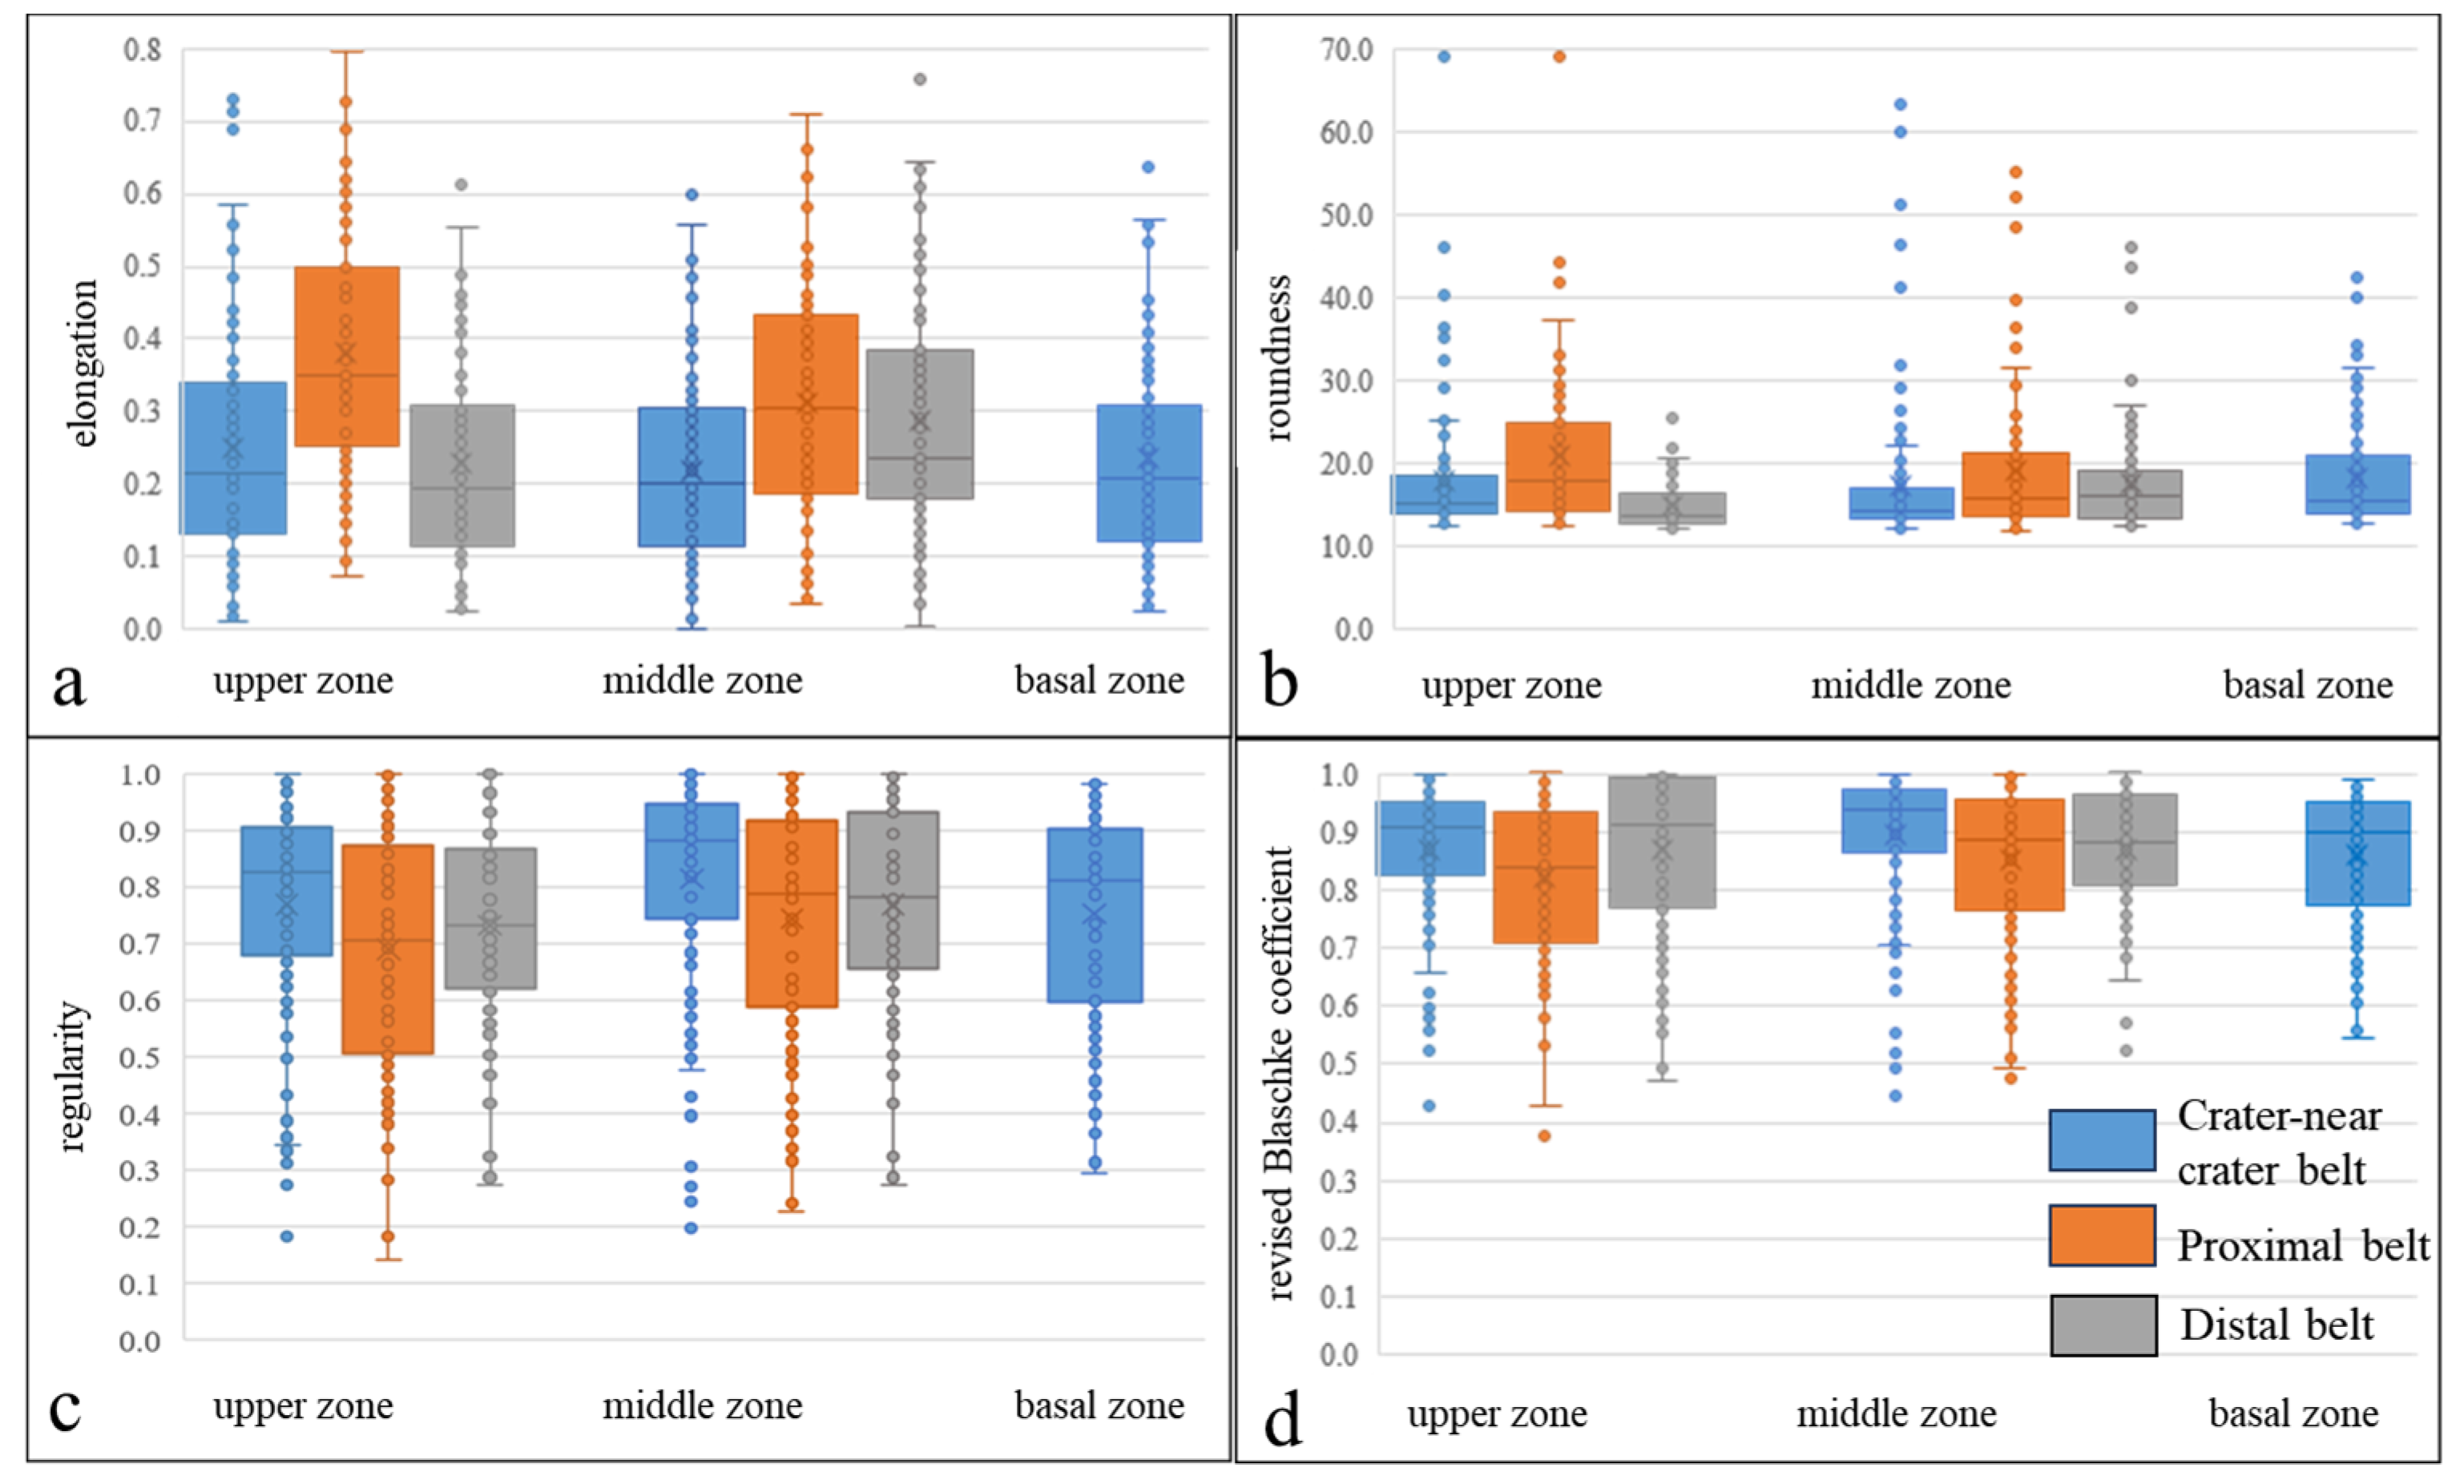
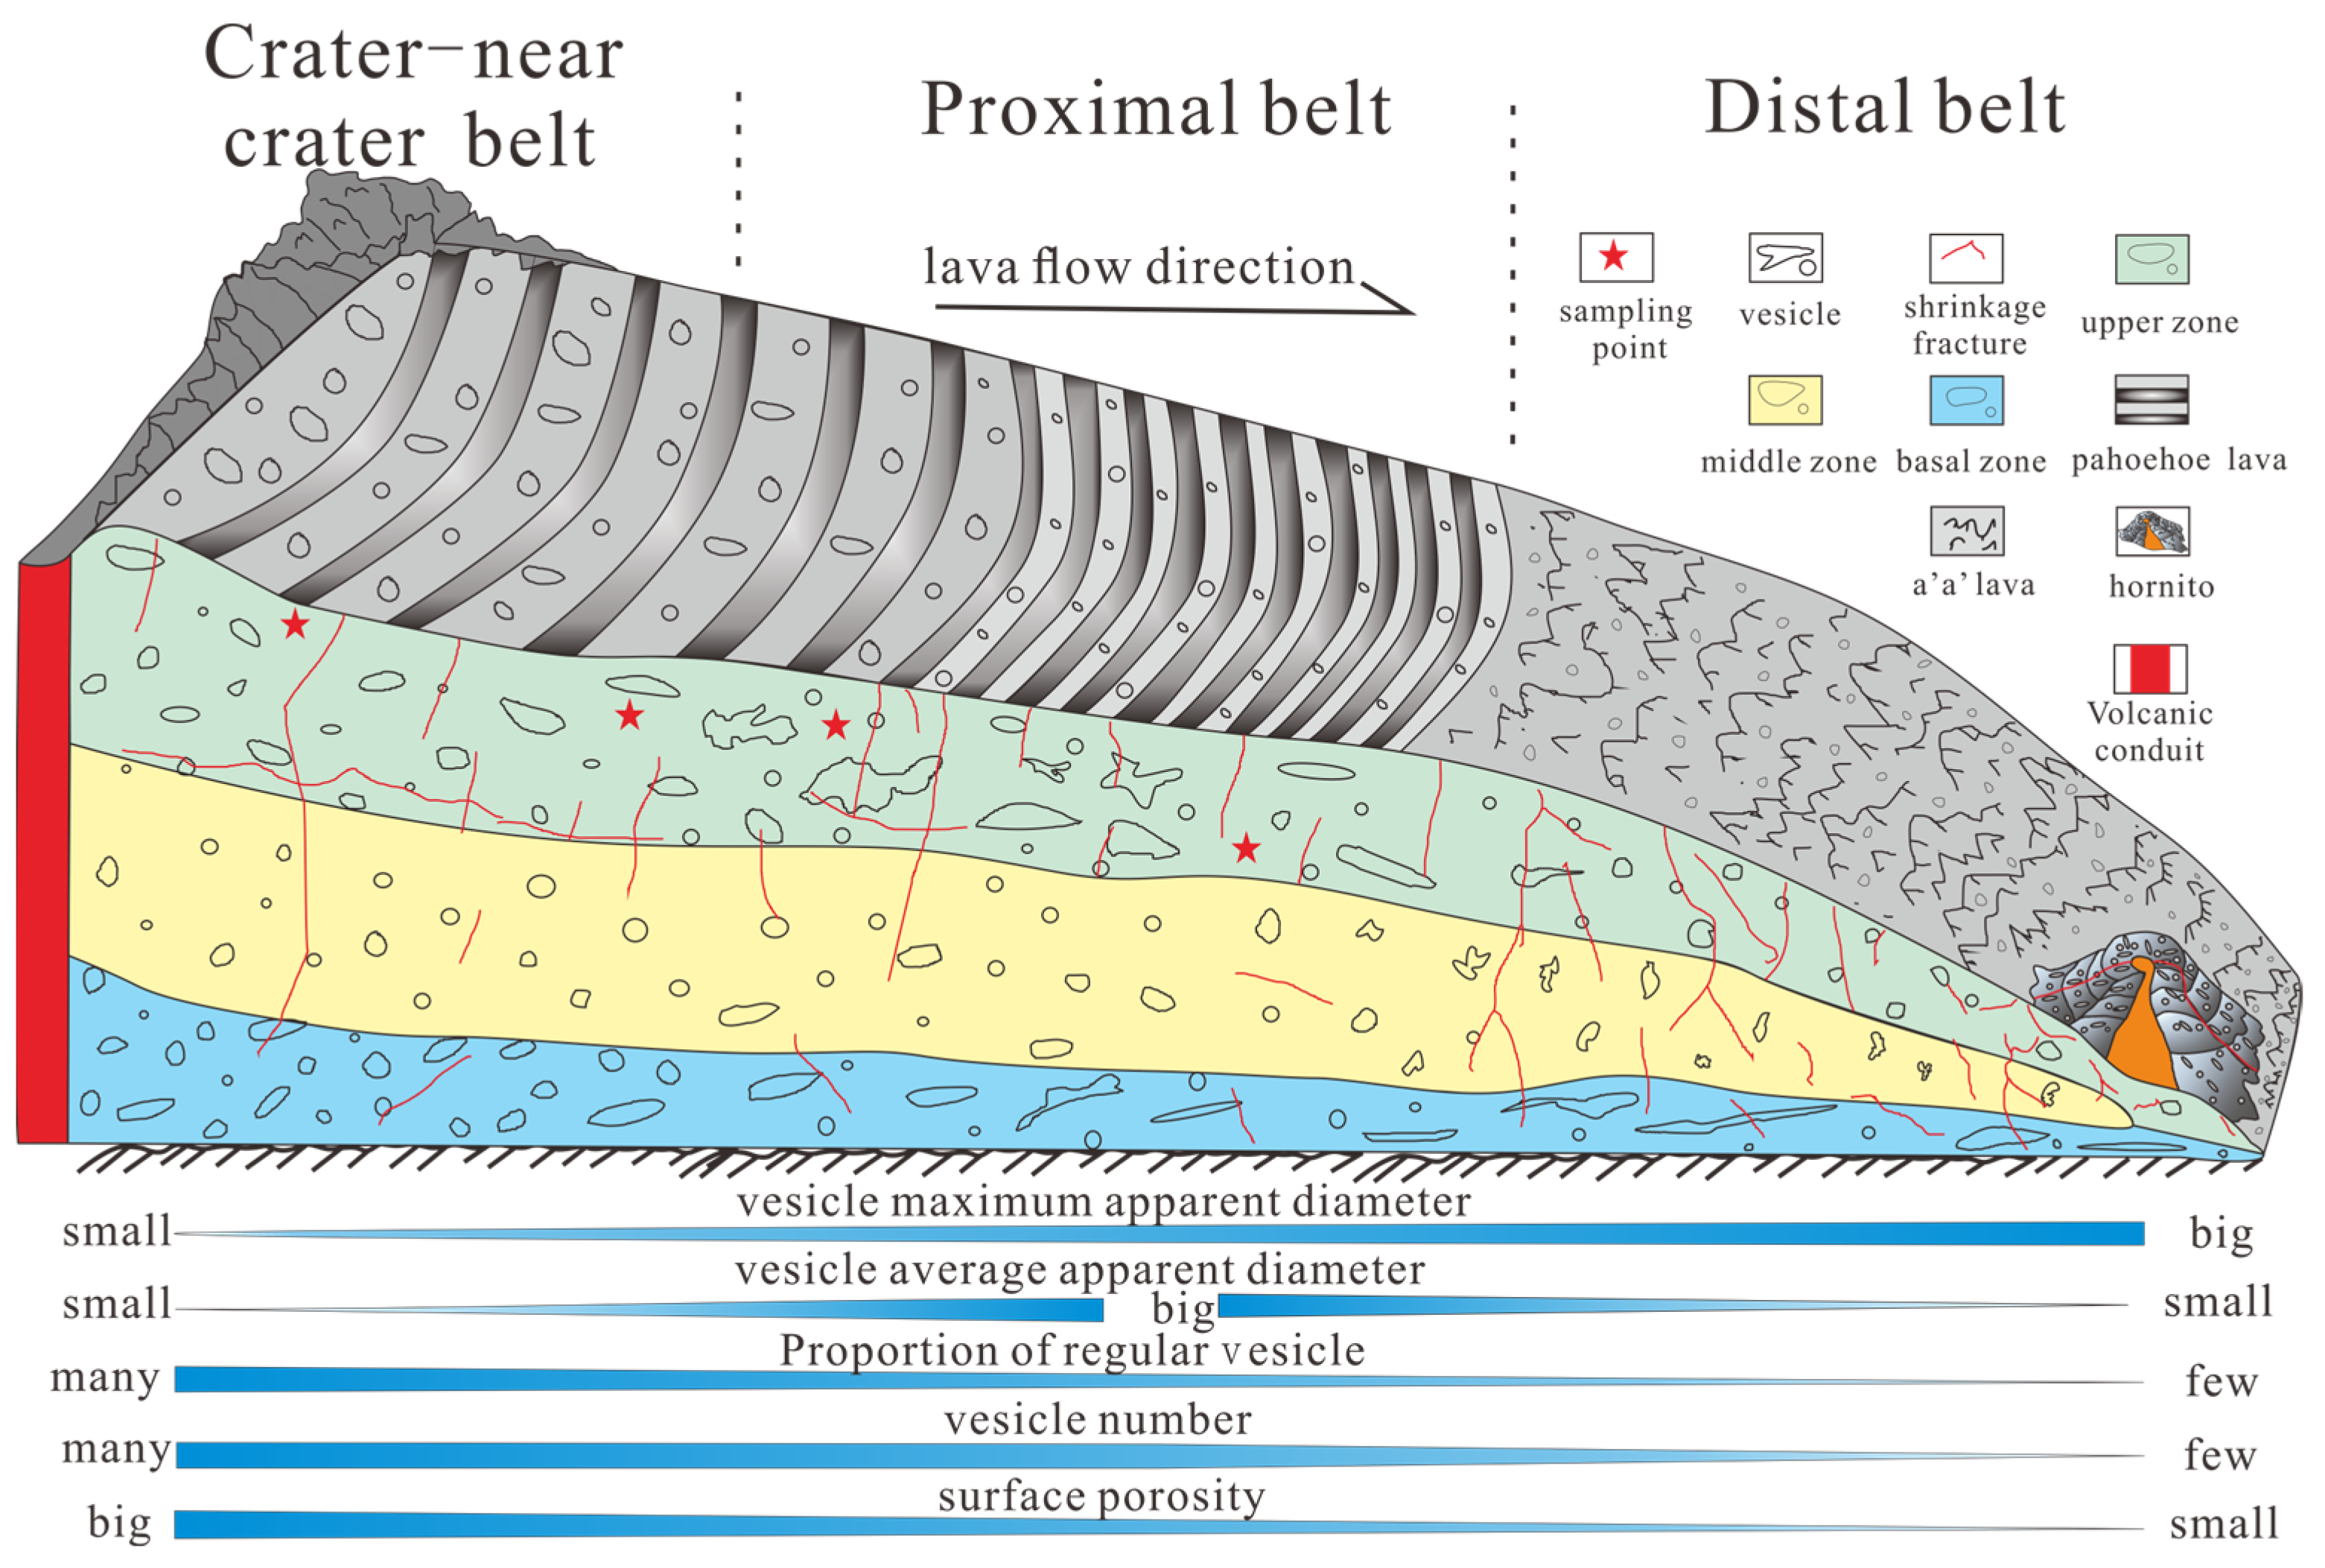
With an increase in the flow distance, the shape of the vesicle varied from spherical to ellipsoidal to tubular. In the crater-near-crater belt, vesicles are ellipsoidal and spherical, with a medium apparent diameter, low elongation, and high regularity (Figure 8a,c). In the proximal belt, the number of ellipsoidal vesicles increased significantly, and some of the spherical vesicles elongated into ellipsoidal shapes, whereas the ellipsoidal vesicles further elongated into tubules. The appearance of the tubular vesicles made them more diverse in the proximal belt. The apparent diameter of the vesicles was large, the overall elongation was large, and the roundness was high (Figure 8a,b). The average apparent diameter of the vesicles was larger than that of the crater near the crater belt (Figure 9). In the distal belt of the lava flow, the vesicles are small spheroids with high irregularity (Figure 8c). The apparent diameter of the vesicle was small, and it had the largest apparent diameter among all the facies belts. However, the hornito has vesicle characteristics different from those of the distal belt, and the vesicles are generally small. The average apparent diameter of the vesicles gradually increased, first increasing and then decreasing. The average apparent diameter of the vesicles in the proximal belt was the largest, whereas the largest apparent diameter of the vesicles was observed in the distal belt. With an increase in the flow distance, the irregular proportion of vesicles gradually increased, and the vesicle surface porosity and number gradually decreased (Figure 9). The origin of the vesicles in the crater near the crater belt is because of the magma hydrothermal outflow to the surface, modified primary vesicles, and new vesicles formed by the movement of the gas bubbles. These are free and accumulate in the interior towards the surface with a pressure drop. Most of the vesicles in the distal belt were formed by gas bubbles that accumulated in the early stage and formed when the magma flowed through the underlying surrounding rock. The water in it evaporated at high temperatures to form gas bubbles, whose shape changed with the flow of the magma. The flow distance of magma, cooling rate, light density of volatiles, and connections between vesicles may be the reasons for the shape change of the vesicles. The volatile content decreased with the eruption time [39,40]. The reduction of volatiles will make the stomata gradually smaller. As the lava flows, the temperature at the top and basal of the lava flow gradually decreases and the viscosity becomes larger, resulting in a difference in velocity between the surface and the interior and generating tensile stress. The vesicles produce deformation at the flow edge and appear ellipsoidal or tubular along the flow direction. Elongated ellipsoidal and tubular vesicles were derived from early-stage volatiles and were elongated gradually by lava flow stress after distant migration, whereas discrete small spherical vesicles may be formed by late volatiles. The vesicles at the edge of the lava flow exhibited different sizes and shapes. As the flow distance increases, the lava flows change from a pahoehoe surface shape to an “a” surface shape (Figure 10). The volatiles inside the lava flow gradually decreased, dissolved more slowly, and fewer vesicles were observed. The reduction in vesicle number, to a certain extent, leads to a decrease in surface porosity, but it is not applicable to areas with large apparent vesicle diameters.

5.2. Connectivity between Shrinkage Fractures and Vesicles

A single vesicle cannot form an effective reservoir space, which needs to be connected through channels. Fractures are indispensable reference factors for evaluating the reservoir performance of volcanic rocks. For volcanic reservoirs, it is impossible for an effective reservoir to form without fracture communication [41]. The degree of fracture development directly affects reservoir connectivity. In the study of volcanic rock reservoir connectivity, in addition to the connectivity between vesicles, the connectivity between vesicles and fractures was more evident. Fractures are not only a suitable reservoir space but also an important seepage channel. Therefore, the more developed the fractures, the stronger the general connectivity. As influential factors in reservoirs, fractures are more important than vesicles. Volcanic fractures are divided into five types. The primary fractures can be divided into shrinkage fractures and explosive fractures. The shrinkage fractures are mainly distributed in lava flows, and the explosion fractures are mainly distributed in pyroclastic rocks. Secondary fractures include tectonic fractures, weathered fractures and dissolution fractures. Tectonic fractures are developed in various lithologies; the weathered fractures are mainly distributed at the top part of the weathered crust and the dissolution fractures are mainly distributed in the areas communicating with the fluid channels [2]. Most fractures in the study area are primary shrinkage fractures. Researchers have divided shrinkage fractures into six categories: quench, columnar, platy, suture-like, macrotortoise shell, and microtortoise shell joints. The fractures in different facies belts have different degrees of development. However, most of them develop in the top zone of the lava flow and extend downward. In the crater-near-crater belt, fractures run longitudinally through the lava flow outcrop. According to the classification, most shrinkage fractures in the study area are macrotortoise and microtortoise shell joints. In the case of a relatively single lithology and tectonic activity, fracture development is influenced by the volcanic mechanism facies in the diagenesis process. The rocks in the crater-near-crater belt and proximal belt are brittle and often form dense massive deposits, and the fractures formed are longer and wider. However, the rocks in the proximal belt are brittle, with many fractures, but are relatively poor in development [42].
Some researchers have studied the degree of fracture development in different types of volcanic rocks, among which the fracture of overflow facies andesite is the most developed, followed by explosive facies volcanic breccia and overflow facies basalt, accounting for only 19% of all fractures [43]. In this study, crisscross fractures developed in the basic lava flow of Laoheishan, which are shrinkage fractures whose formation mechanism can be explained by the temperature model [44]. During the cooling process of the rising and surface flows, the molten lava is cooled by contact with the relatively low-temperature surrounding rock, air, and water. As the molten lava is cooled during the solidification stage, it is quenched and quickly condensed, and the volume contraction decreases, resulting in fractures formed by tensile stress. The following factors are taken into account when analyzing fracture types: (1) the lava flow in Laoheishan was formed only 300 years ago, and there is almost no strong tectonic movement in the area; (2) most of the fractures exist at the top zone of the lava flow and extend downward, with irregular fracture surfaces and condensation shrinkage fracture characteristics; and (3) explore the characteristics and genesis of lava flow fractures in Laoheishan [45,46].
There are 11 fractures in the crater–near-crater belt, of which nine are longitudinal and two are transverse. The longitudinal fractures all occur at a high angle of almost vertical elevation. The fractures are concentrated in the middle and upper zones of the lava flow. The fracture width is 0.2–3.2 cm, the fracture spacing is 14–28 cm, the apparent length is between 8.4–74.2 cm, the surface density is 18.91 m/m2, and the linear density is 4.1 strip/m. The fracture surface density in the top zone is 36.74 m/m2, and the linear density is 7.5 strip/m. Some fractures were deflected in the vesicle zone, and some were filled with mud in the basal vesicle zone. An image of the top vesicle zone was selected to analyze the influence of fractures on vesicle connectivity in the outcrop view (Figure 11a). The total number of vesicles in the image area was 406, and the number of connected vesicles was 63, accounting for 15.5% of the total. The proportion of connected vesicles was approximately 5.95%, accounting for 19% of the total surface porosity. The angle between the fractures and the directionally arranged vesicles was concentrated between 30° and 60°. Some researchers have found that the angle between fractures and directionally arranged vesicles presents a greater connectivity effect within 30°–60°, and the connectivity is highest when the angle is 45° [47].
There were 18 fractures in the proximal belt outcrop, 16 of which were longitudinal and two were transverse, and they also existed at high angles. The fracture width is 0.1–1.9 cm, the fracture spacing is 14–30 cm, the apparent length is between 2.1–91.6 cm, the surface density is 25.19 m/m2, and the linear density is 12.7 strip/m. The fracture surface density in the top zone was 48.29 m/m2, and the linear density was 18.2 strip/m. The top zone develops cavernous dissolution vesicles, and fractures can be seen connecting vesicles with larger apparent diameters. An image of the top vesicle zone was selected to analyze the influence of fractures on vesicle connectivity in the outcrop view (Figure 11b). The total number of vesicles was 705, and three fractures developed in the imaging area; there were 97 connected vesicles, accounting for 13.8%. The surface porosity of the connected vesicles was approximately 8.59%, accounting for 40.9% of total surface porosity. The angle between the directional vesicles and high-angle fractures was approximately 60°, and that between the near-horizontal fractures was less than 30°.
There were 28 fractures in the distal belt outcrop, most of which existed at a high angle, and only five short transverse fractures, which were extremely irregular in distribution. The fracture width was less than 1.6 cm, the fracture spacing was about 10 cm, the apparent length was between 7.1–57 cm, the surface density was 43.28 m/m2, and the linear density was 6.7 strip/m. We selected an image of the top vesicle zone to analyze the influence of fractures on vesicle connectivity in the outcrop view (Figure 11c). There were 649 vesicles, 5 fractures developed in the imaging area, and 64 connected vesicles (9.9%). The surface porosity of the connected vesicles is approximately 1.26%, accounting for 4.7% of the total surface porosity. The intersection angle between the fractures and vesicles was wide, and the connectivity was the worst among the three facies belts.
The fracture distribution in hornito is affected by genetic mechanisms and the forming environment. Due to the condensation of the “lava cake” from the inner molten lava spilling over the surface and forming the closed structure. The high-temperature expansion of the cooling shrinkage core of the shell constrained the deformation and generated temperature stress, while the maximum principal tensile stress trace was distributed in a ring [48]. Under the action of temperature stress, the “lava cake” forms fractures. The fractures were distributed radially on the plane and approximately equidistant from each other. The minimum fracture width was 0.7 mm, the maximum fracture width was 6 mm, and the apparent length was 14–30 cm. The fracture tip is dominated by type “a” fractures without passivation. This indicated that the fracture depth h generated by the hornito is less than the thickness of the watch case [49]. The low fracture density and large fracture spacing indicated that the cooling rate of hornito was relatively slow [48].

6. Conclusions

In crater-near crater belts, vesicles are dominated by ellipsoidal and spherical structures with many vesicles. The proximal belt was dominated by ellipsoidal structures, with the largest number of vesicles, a uniform distribution, and a large average apparent diameter. There was a certain number of tubular vesicles in the distal belt. The number of vesicles was the lowest, and the average apparent diameter of the vesicles was relatively small. The apparent diameter of the hornito vesicles was the smallest. However, the number of vesicles was similar to that of the proximal belt lava flow. The connectivity between the fractures and vesicles in the proximal belt was the best, and the ratio of effective connected vesicle surface porosity was the highest. The fracture development of the distal belt was the best; however, the connectivity was poor, and the effective vesicle surface porosity was the lowest. The farther away from the crater, the smaller the vesicle surface porosity and the more irregular the vesicle. The top vesicle zone of the lava flow had the largest number of fractures and vesicles among all the facies belts. Considering the number, size, distribution, surface porosity, fracture development, connectivity, and porosity-permeability tests, it was concluded that the reservoir performance of the basic lava flows is the greatest in the crater-near-crater belt and the proximal belt, whereas it was the worst in the distal belt. The top zone of the lava flow was more suitable for hydrocarbon accumulation than the base zone. Therefore, the proximal zone should be considered more in the process of volcanic oil and gas exploration and development.

Author Contributions

Conceptualization, H.T. and G.L.; methodology, J.B.; software, H.W.; validation, H.T., Z.T. and J.H.; formal analysis, G.L.; investigation, G.L.; resources, Z.T.; data curation, L.Y. and Q.W.; writing—original draft preparation, G.L.; writing—review and editing, H.T.; visualization, G.L.; supervision, J.H.; project administration, H.T.; funding acquisition, H.T. All authors have read and agreed to the published version of the manuscript.

Funding

This research was funded by the National Key R&D Program of China (grant No. 2019YFC0605402) and the National Natural Science Foundation of China (grant No. 41790453).

Data Availability Statement

The data presented in this study are available on request from the corresponding author. The data are not publicly available due to privacy.

Acknowledgments

Thanks to the anonymous reviewers took the time to read this article and put forward their valuable comments.

Conflicts of Interest

The authors declare no conflict of interest.

References

  1. Sruoga, P.; Rubinstein, N. Processes Controlling Porosity and Permeability in Volcanic Reservoirs from the Austral and Neuquén Basins, Argentina. AAPG Bull. 2007, 91, 115–129. [Google Scholar] [CrossRef]
  2. Tang, H.F.; Tian, Z.W.; Gao, Y.F.; Dai, X.J. Review of volcanic reservoir geology in China. Earth Sci. Rev. 2022, 232, 104158. [Google Scholar] [CrossRef]
  3. Dai, J.J.; Luo, J.L.; He, X.Y.; Ma, S.W.; Wang, C.; Xu, X.L. Oil and gas resevoir characteristics and petrogenetic evolution of the Carboniferous volcanic lava in Xiquan area, Junggar Basin. Geol. China 2020, 47, 742–754. [Google Scholar]
  4. Millett, J.M.; Jerram, D.A.; Planke, S. Volcanic facies architecture of early bimodal volcanism of the NW Deccan Traps: Volcanic reservoirs of the Raageshwari Deep Gas Field, Barmer Basin, India. Basin Res. 2021, 33, 3348–3377. [Google Scholar] [CrossRef]
  5. Wang, Z.X.; Zhao, C.L.; Liu, M.H. Volcanic lithofacies and their petrophysical properties in abei oilfeld. J. China Univ. Pet. Ed. Nat. Sci. 1991, 3, 15–21. [Google Scholar]
  6. Couves, C.R.; Roberts, S.; Racey, A.; Troth, I.; Best, A. Use of X-RAY computed tomography to quantify the petrophysical properties of volcanic rocks: A case study from tenerife, Canary Islands. J. Pet. Geol. 2016, 39, 79–94. [Google Scholar] [CrossRef]
  7. Yi, J.; Sun, F.Y.; Wang, P.J.; Shan, X.L. Vesicle distribution in acidic lava flow units in the rift basins of NE China: Implications for petroleum reservoir exploration. Geol. J. 2017, 52, 609–623. [Google Scholar] [CrossRef]
  8. Zhao, W.Z.; Zou, C.N.; Li, J.Z.; Feng, Z.Q.; Zhang, G.Y.; Hu, S.Y.; Kuang, L.C.; Zhang, Y. Comparative study on volcanic hydrocarbon accumulations in western and eastern China and its significance. Pet. Explor. Dev. 2009, 36, 1–11. [Google Scholar]
  9. Huang, Y.L.; Wang, P.J.; Shu, P.; Zhang, Y.L. Characteristics and formation mechanism of the Cretaceous intermediateand mafic volcanic reservoirs in Songliao Basin, NE China. Acta Pet. Sin. 2010, 26, 82–92. [Google Scholar]
  10. Xu, H.; Yulong, H.; Xingzhou, L.; Qiang, G. Logging response of vesicle zonation and reservoir significance of Paleogene basalts in Liaohe depression. World Geol. 2022, 41, 559–567. [Google Scholar]
  11. Aubele, J.C.; Crumpler, L.S.; Elston, W.E. Vesicle zonation and vertical structure of basalt flows. J. Volcanol. Geotherm. Res. 1988, 35, 349–374. [Google Scholar] [CrossRef]
  12. Sahagian, D.; Proussevitch, A.; Carlson, W. Analysis of vesicular basalts and lava emplacement processes for application as a paleobarometer/paleoaltimeter: A reply. J Geol. 2003, 111, 502–504. [Google Scholar] [CrossRef]
  13. Yi, J.; Wang, P.J.; Gao, Y.F.; Yao, R.S.; Zhao, R.L.; Chen, C.Y. Vesicle distribution in basalt lava flow units in the Mesozoic rift basins of northeast China and its application in gas reservoir prediction. Can. J. Earth Sci. 2016, 53, 59–70. [Google Scholar] [CrossRef]
  14. Rust, A.C.; Manga, M.; Cashman, K.V. Determining flow type, shear rate and shear stress in magmas from bubble shapes and orientations. J. Volcanol. Geotherm. Res. 2003, 122, 111–132. [Google Scholar] [CrossRef]
  15. Shea, T.; Houghton, B.F.; Gurioli, L.; Cashman, K.V.; Hammer, J.E.; Hobden, B.J. Textural studies of vesicles in volcanic rocks: An integrated methodology. J. Volcanol. Geotherm. Res. 2009, 190, 271–289. [Google Scholar] [CrossRef]
  16. Farquharson, J.I.; Heap, M.J.; Varley, N.R.; Baud, P.; Reuschlé, T. Permeability and porosity relationships of edifice-forming andesites: A combined field and laboratory study. J. Volcanol. Geotherm. Res. 2015, 297, 52–68. [Google Scholar] [CrossRef]
  17. Peng, N.; Zhu, X.Y.; Liu, Y.S.; Nie, B.F.; Li, S. Complexity and dynamics of vesicle shapes of pumices formed in the three Tianchi volcano eruptions. Earth Sci. Front. 2019, 26, 271–280. [Google Scholar]
  18. Zhang, Y.Z.; Wang, D.Y.; He, S.L. Control Factors of the Volcanic Reservoir in South Xingcheng Area, Daqing. Geoscience 2009, 23, 724–730. [Google Scholar]
  19. Zheng, M.; Li, J.Z.; Wang, L.W.; Zhang, Q.C.; Wu, X.Z.; Yan, W.P.; Wang, Y. Reservoir space characteristics andevolution of the volcanic rocks in Yingcheng Formation of Changling fault depression, Songliao Basin. Acta Pet. Sin. 2010, 26, 135–141. [Google Scholar]
  20. Nan, Y.; Liu, Y.Q.; Zhou, D.W.; Zhou, N.C.; Jiao, X.; Zhou, P. Characteristics and origin of amygdale and crack fillers involcanic rock of Late Carboniferous in Santanghu basin, Xinjiang. Acla Pet. Sin. 2016, 32, 1901–1913. [Google Scholar]
  21. Xie, Q.B.; Han, D.X.; Zhu, X.M.; Zhu, Y.X. Reservoir space feature and evolution of the volcanic rocks in the Santanghu basin. Petrol. Explor. Dev. 2002, 29, 84–86+111. [Google Scholar]
  22. Shina, H.; Lindquistb, W.B.; Sahagianc, D.L.; Songd, S.R. Analysis of the vesicular structure of basalts. Comput. Geosci. 2005, 31, 473–487. [Google Scholar] [CrossRef]
  23. Bing, B. The Discussion of Volcanic Reservoir Characteristics and Formation Mechanism in the Southern Songliao Basin, NE China; Jilin University: Changchun, China, 2013. [Google Scholar]
  24. Tang, H.F.; Zhao, P.J.; Gao, Y.F.; Wang, P.J.; Qi, Y.N. Spatio-Temporal Attributes of Volcano Stratigraphy and lts Lithostratigraphic Units in a Basin. J. Jilin Univ. Earth Sci. Ed. 2017, 47, 949–973. [Google Scholar]
  25. Bai, Z.D.; Sun, S.P.; Li, J.Z. Cone Structure and Eruption Process of Modern Volcanoesin the Wudalianchi Area, Heilongjiang Province. Geol. Rev. 1999, 45, 369–377. [Google Scholar]
  26. Chen, H.Z.; Yang, J.S.; Wang, L.M.; Li, T.X.; Ou Yang, Z.G.; Zhang, L.C. Volcanic eruption fetures of Laoheishan and Huoshaoshan in Wudalianchi. World Geol. 2009, 28, 291–296. [Google Scholar]
  27. Xia, L.Q. On the evolution of volcanic magma from Wudalianchi, China. Acta Petrol. Sin. 1990, 1, 13–29+97. [Google Scholar]
  28. Liu, X. The Study on Fallout Tephra Deposits in the Laoheishan Volcano. Acta Sediment. Sin. 1997, 15, 72–77. [Google Scholar]
  29. Zeng, P.S.; Qiu, S.F.; Li, R.Z.; Liu, S.W.; Wang, S.A.; Zhao, J.J. Sequences Division of Quaternary Volcanic Rocks in Wudalianchi and Its Tectonic and Ecological Significances. Acta Geosci. Sin. 2021, 42, 785–802. [Google Scholar]
  30. Tang, H.F.; Cryton, P.; Gao, Y.F.; Huang, Y.L.; Bian, W.H. Types and Characteristics of Volcanostratigraphic Boundaries and Their Oil-Gas Reservoir Significance. Acta Geol. Sin. 2015, 89, 163–174. [Google Scholar]
  31. Mongrain, J.; Larsen, J.F.; King, P.L. Rapid water exsolution, degassing, and bubble collapse observed experimentally in K-phonolite melts. J. Volcanol. Geotherm. Res. 2008, 173, 178–184. [Google Scholar] [CrossRef]
  32. Yang, J. Analysis of shape factor of rockfill material. Yangtze River 2015, 46, 65–68. [Google Scholar]
  33. Tu, X.B.; Wang, S.J. Particle shape descriptor in digital image analysis. J. Geotech. Eng. 2004, 26, 659–662. [Google Scholar]
  34. Orsi, G.; Gallo, G.; Heiken, G.; Wohletz, K.; Yu, E.; Bonani, G. A comprehensive study of pumice formation and dispersal: The Cretaio Tephra of Ischia (Italy). J. Volcanol. Geotherm. Res. 1992, 53, 329–354. [Google Scholar] [CrossRef]
  35. Cashman, V.K.; Mangan, T.M. Physical aspects of magmatic degassing; II, Constraints on vesiculation processes from textural studies of eruptive products. GeoScienceWorld 1994, 30, 447–478. [Google Scholar]
  36. Zhang, L.H.; Pan, B.Z.; Shan, G.Y. Experimental study on rock porosity permeability under overlying conditions. Petrophys. Unconv. Oil Gas Explor. Devel. Proc. 2014, 35–38. [Google Scholar]
  37. Ren, J.Z. Flowing charactrristic of volcanic lava flow in Wudaliangchi volcanic group and dynamic process forming them. J. Dis. Prev. Reduct. 1995, 282, 46–53. [Google Scholar]
  38. Gao, W.Y.; Li, J.H.; Mao, X.; Zhang, T.R. Discussion on genetic mechanism of hornits in Wudalianchi volcanic field. Acta Pet. Sin. 2010, 26, 309–317. [Google Scholar]
  39. Burnham, C.W.; Jahns, R.H. A method for determining the solubility of water in silicate melts. Am. J. Sci. 1962, 260, 721–745. [Google Scholar] [CrossRef]
  40. Wallace, P.J.; Anderson, A.T.; Davis, A.M. Gradients in H2O, CO2, and exsolved gas in a large-volume silicic magma system: Interpreting the record preserved in melt inclusions from the Bishop Tuff. J. Geophys. Res. 1999, 104, 20097–20122. [Google Scholar] [CrossRef]
  41. Wang, P.J.; Feng, Z.Q. Volcanic Rocks in Petroliferous Basins; Science Press: Beijing, China, 2008. [Google Scholar]
  42. Liu, G.P.; Zeng, L.B.; Lei, M.S.; Zu, K.W.; Wang, F.; Liu, Q.; Li, W.F. Fracture development characteristics and main controlling factors of the volcanic reservoir in Xujiaweizi fault depression. Geol. China 2016, 43, 329–337. [Google Scholar]
  43. Zhou, X.; Shu, P.; Yu, S.Q.; Yu, X. Reservoir characteristics and integrated evaluation of volcanic rock in member 1, Yingcheng Formation, Xushen 9 block, Songliao Basin. Nat. Gas Geosci. 2018, 29, 62–72. [Google Scholar]
  44. Kattenhorn, S.A.; Schaefer, C.J. Thermal-Mechanical Modeling of Cooling History and Fracture Development in Inflationary Basalt Lava Flows. J. Volcanol. Geotherm. Res. 2008, 170, 181–197. [Google Scholar] [CrossRef]
  45. Qin, H.P. Characteristics of Tension Fissures and Their Genetic Analyses on the Western Lava Flows of Laoheishan Volcano, Wudalianchi; Capital Normal University: Beijing, China, 2009. [Google Scholar]
  46. Mao, X.; Li, J.H.; Gao, W.Y.; Zhang, T.R. Vent Distribution of Wudalianchi Volcanoes Heilongjiang Province, China, and Its Relation to Faults. Geol. J. China Univ. 2010, 16, 226–235. [Google Scholar]
  47. Guo, T.C.; Tang, H.F.; Wang, H.F. Reservoir distribution pattern of the hypabyssal intrusive rocks: A case study from the Miocene hypabyssal dykes of Lyttelton volcano, New Zealand. Acta Geol. Sin. 2021, 95, 3885–3898. [Google Scholar]
  48. Ma, Z.J.; Zhang, Z.J.; Zhan, T.; Yang, Y.; Xu, J.M.; Li, L.H.; Li, E. Formation of surface crack of hornito at Wudalianchi volcano, Heilongjiang Province, China. J. Eng. Geol. 2019, 27, 294–301. [Google Scholar]
  49. Lawn, B. Fracture of Brittle Solids; Cambridge University Press: London, UK, 1975. [Google Scholar]
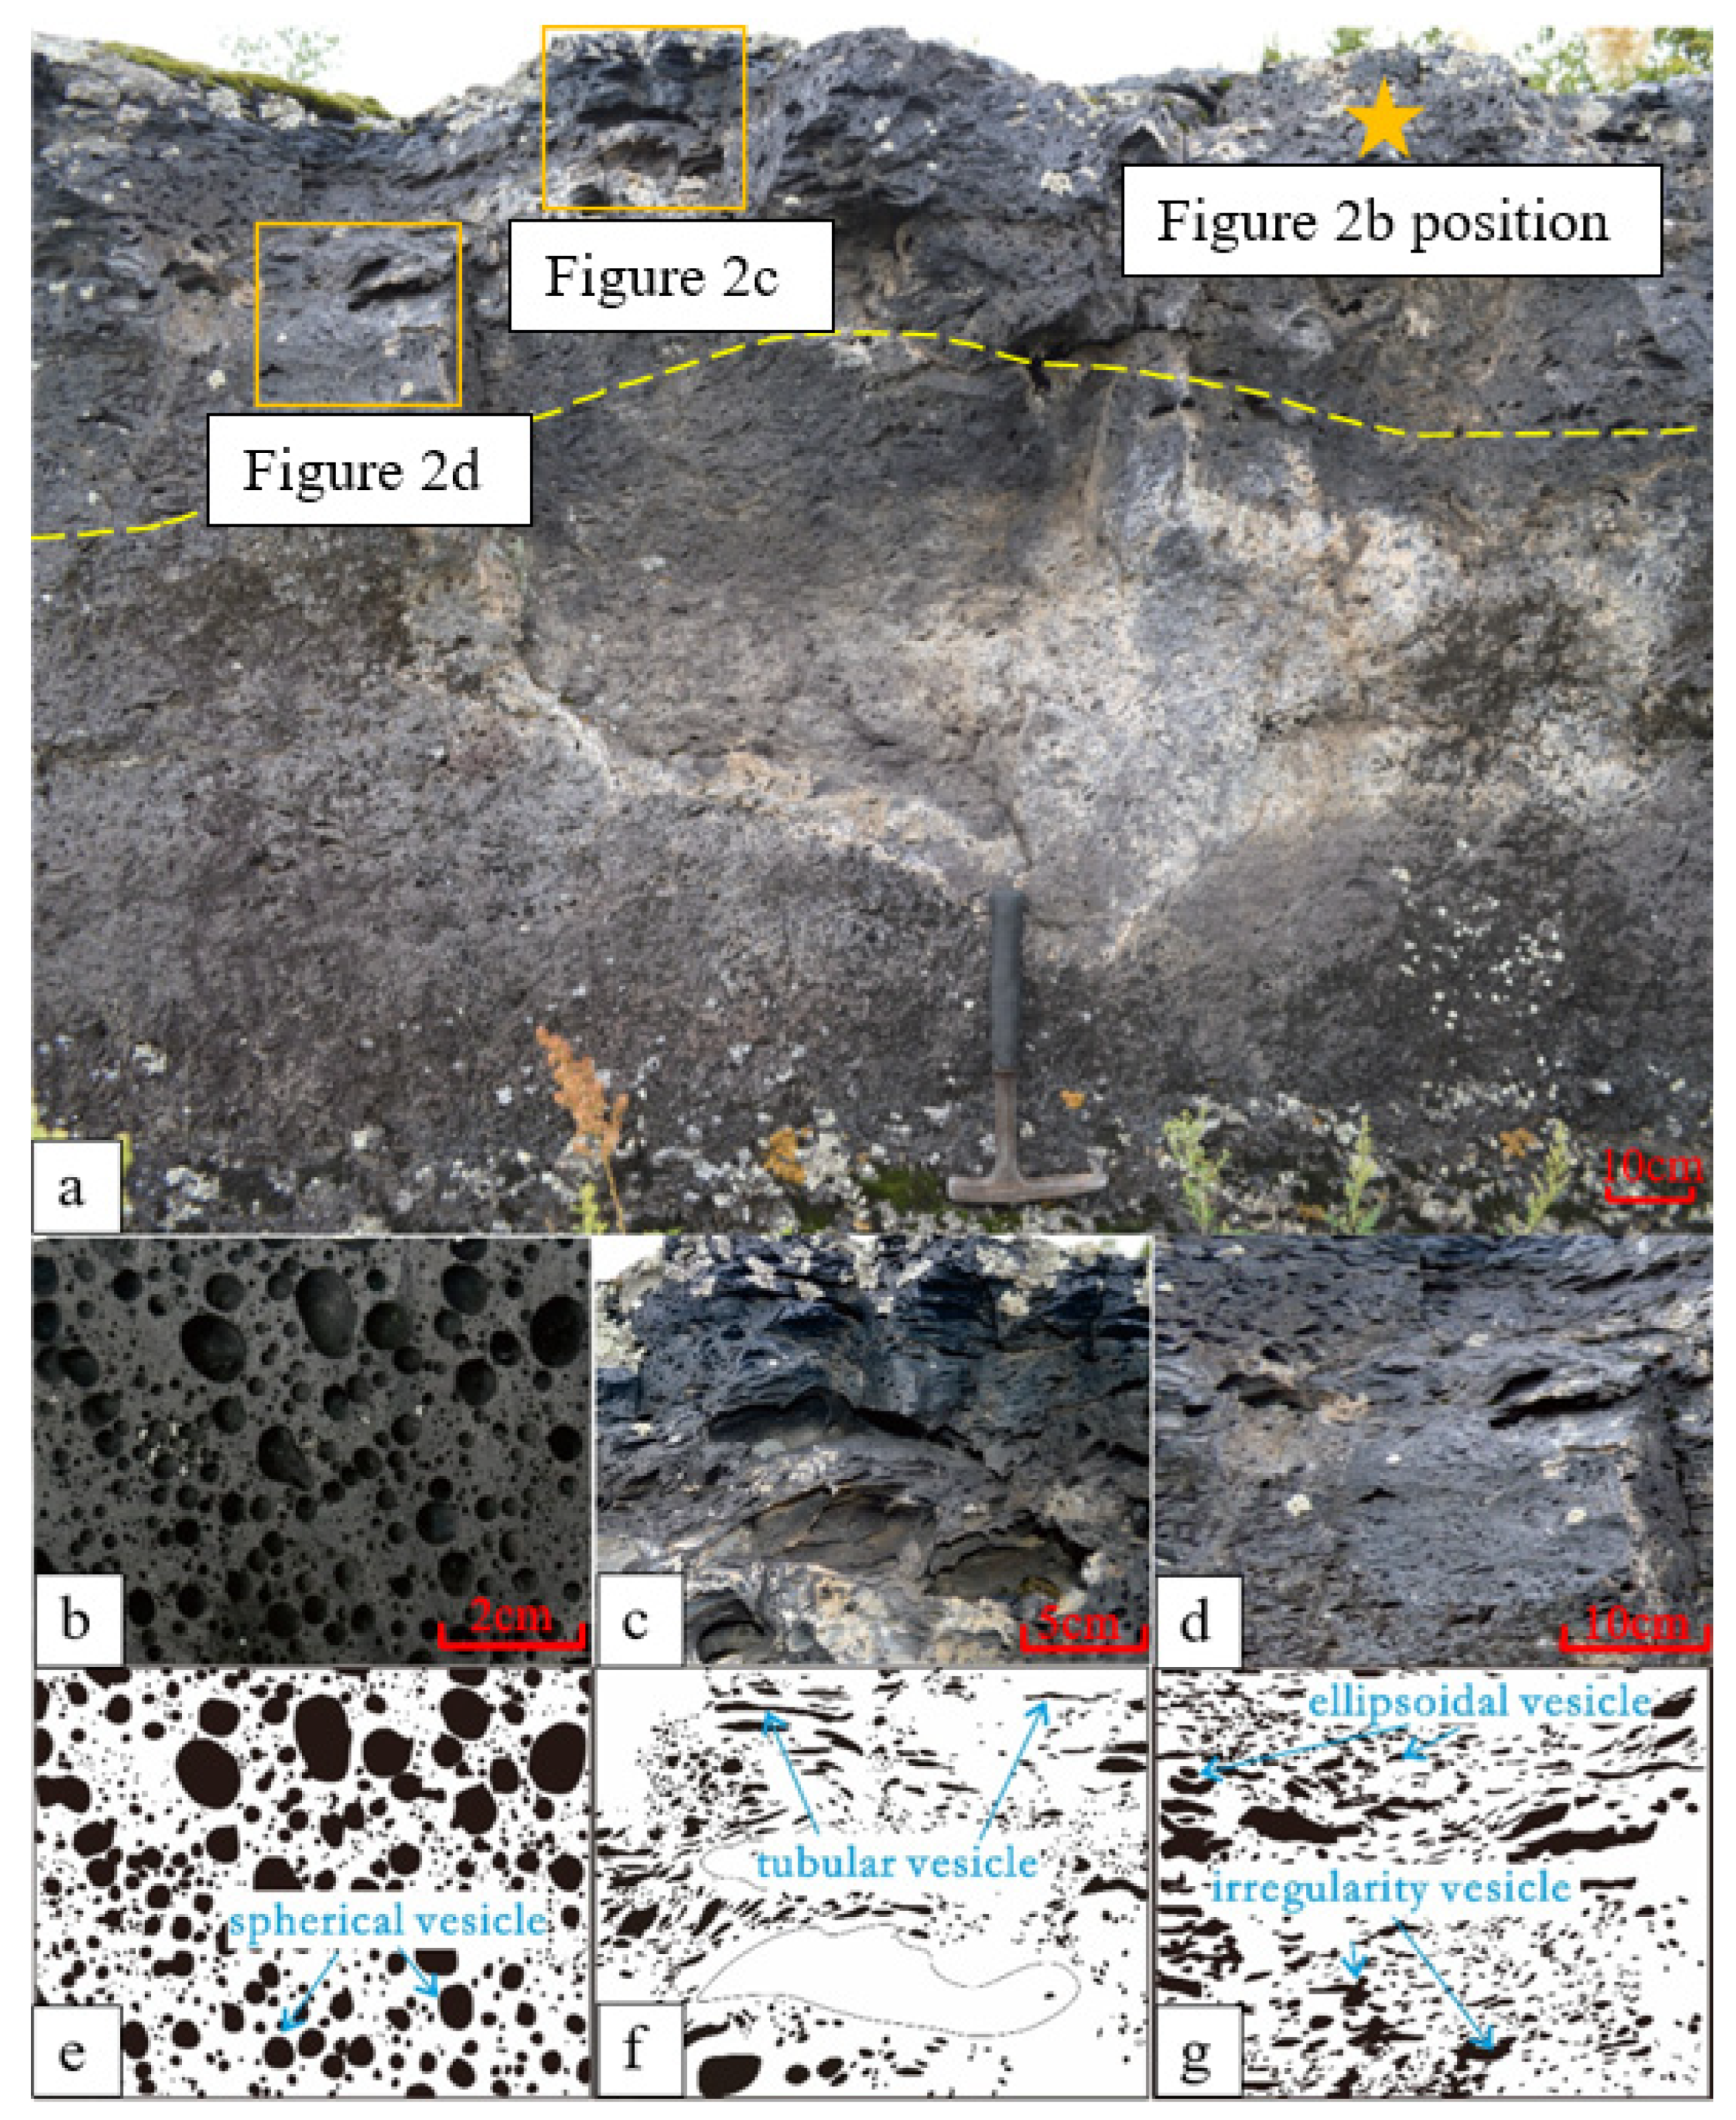
Figure 2. The vesicle image and the image identified by CIAS image analyzer of Wudalianchi Quaternary Laoheishan lava flow outcrop. (a) Proximal belt outcrop; (b) spherical vesicles outcrop; (c) tubular vesicles outcrop; (d) ellipsoidal and irregularity vesicles outcrop; (e) sketch of spherical vesicles, surface porosity 30.46%; (f) sketch of tubular vesicles, surface porosity 35.9%; (g) sketch of ellipsoidal and irregularity vesicles, surface porosity 25.7%.
Minerals 13 01434 g002
Figure 3. Vesicle apparent diameter distribution in different facies belts of Wudalianchi Quaternary Laoheishan. (a) Vesicles apparent diameter distribution in crater-near crater belt; (b) vesicles apparent diameter distribution in proximal belt; (c) vesicles apparent diameter distribution in distal belt; (d) vesicles apparent diameter distribution in hornito.
Minerals 13 01434 g003
Figure 4. CT scan images of samples with different facies belts from the Wudalianchi Quaternary Laoheishan. (a) Rock XZ slice of crater-near crater belt; (b) rock YZ slice of crater-near crater belt; (c) crater-near crater belt rock 3D model; (d) crater-near crater belt vesicle model; (e) rock XZ slice of proximal belt; (f) rock YZ slice of proximal belt; (g) proximal belt rock 3D model; (h) proximal belt vesicle model.
Minerals 13 01434 g004
Figure 5. Vesicle number and volume proportion of different facies belts from the Wudalianchi Quaternary Laoheishan. (a) Statistics of the number proportion of vesicles of different sizes in the crater-near crater belt; (b) statistics of vesicle volume proportion of different particle sizes in crater-near crater belt; (c) statistics of the number proportion of vesicles of different sizes in the proximal belt; (d) statistics of vesicle volume proportion of different particle sizes in proximal belt.
Minerals 13 01434 g005
Figure 6. Relationship between porosity and permeability in different facies belts of the Wudalianchi Quaternary Laoheishan.
Minerals 13 01434 g006
Figure 7. Vesicles average surface porosity distribution in different facies belts of Wudalianchi Quaternary Laoheishan.
Minerals 13 01434 g007
Figure 8. Vesicles shape distribution in different facies belts of the Wudalianchi Quaternary Laoheishan lava flow. (a) elongation; (b) roundness; (c) regularity; (d) revised Blaschke coefficient.
Minerals 13 01434 g008
Figure 9. Relationship between flow distance and vesicles of the Wudalianchi Quaternary Laoheishan lava flow. (a) The relationship between the average apparent diameter and the regular proportion of vesicles and the flow distance; (b) the relationship between the surface porosity and quantity of vesicles and the flow distance.
Minerals 13 01434 g009
Figure 10. Lava flow vesicles and facies belts relationship model of the Wudalianchi Quaternary Laoheishan.
Minerals 13 01434 g010
Figure 11. Vesicle fracture connectivity in different facies belts of Wudalianchi Quaternary Laoheishan. (a) crater-near crater belt outcrop; (b) proximal belt outcrop; (c) distal belt outcrop; (d) vesicle-fracture connectivity in crater-near crater belt; (e) vesicle-fracture connectivity in proximal belt; (f) vesicle-fracture connectivity in distal belt.
Minerals 13 01434 g011
Disclaimer/Publisher’s Note: The statements, opinions and data contained in all publications are solely those of the individual author(s) and contributor(s) and not of MDPI and/or the editor(s). MDPI and/or the editor(s) disclaim responsibility for any injury to people or property resulting from any ideas, methods, instructions or products referred to in the content.