Abstract
The microscopic pore throat structure of shale reservoir rocks directly affects the reservoir seepage capacity. The occurrence and flow channels of shale gas are mainly micron–nanometer pore throats. Therefore, to clarify the microstructural characteristics and influencing factors of the deep organic-rich shales, a study is conducted on the marine shale from the Upper Silurian to Lower Ordovician Wufeng–Longmaxi Formation in the southern Sichuan Basin. Petrographic lithofacies division is carried out in combination with petro-mineralogical characteristics, and a high-resolution scanning electron microscope, low-temperature nitrogen and low-temperature carbon dioxide adsorption, and micron-computed tomography are used to characterize the mineral composition and pore structure qualitatively and quantitatively, upon which the influencing factors of the microstructure are further analyzed. The results show that with the increase in burial depth, the total organic carbon content and siliceous mineral content decrease in the Wufeng formation to Long-11 subsection deep shale, while clay mineral content increases, which corresponds to the change in sedimentary environment from anoxic to oxidizing environment. Unexpectedly, the total pore volume of deep shale does not decrease with the increase in burial depth but increases first and then decreases. Using total organic carbon (TOC), siliceous mineral content showed a good correlation with total pore volume and specific surface area, with correlation coefficients greater than 0.7, confirming the predominant role of these two factors in controlling the pore structure of deep shales. This is mainly because the Longmaxi shale is already in the late diagenetic stage, and organic matter pores are generated in large quantities. Clay minerals have a negative correlation with the total pore volume of shale, and the correlation coefficient is 0.7591. It could be that clay minerals are much more flexible and are easily deformed to block the pores under compaction. In addition, the longitudinal heterogeneity of the deep shale reservoir structure in southern Sichuan is also controlled by the thermal effect of the Emei mantle plume on hydrocarbon generation of organic matter and the development of natural microfractures promoted by multistage tectonic movement. Overall, the complex microstructure in the deep shales of the Longmaxi Formation in the southern Sichuan Basin is jointly controlled by multiple effects, and the results of this research provide strong support for the benefit development of deep shale gas in southern Sichuan Basin.
1. Introduction
As a clean fossil energy resource, the large-scale exploration and development of shale gas contribute to the transformation of the world’s energy consumption structure and the implementation of the “carbon peaking and carbon neutrality” “strategic goals”, which plays an important role in the adjustment and optimization of the energy structure [1,2,3,4,5]. Sichuan Basin is rich in shale gas resources and is currently a major exploration and development area in China, where shale gas from the Lower Silurian Longmaxi Formation in the southern Sichuan Basin has been explored and developed on a large scale [6]. In previous research, many scholars have studied the shales of the Longmaxi Formation in the southern Sichuan Basin at a macroscopic level [7,8,9,10]. With the increase in shale gas exploration and development, the important role of shale microstructure characteristics for shale gas enrichment and seepage is gradually being recognized [11,12,13].
A large number of domestic and foreign scholars are currently using high-precision and high-resolution experimental techniques to characterize and analyze the microscopic characteristics and the main controlling factors of pore development in the shale reservoirs from the southern Sichuan Basin [14,15,16,17,18]. The quantitative characterization of shale pore structure by low-temperature gas adsorption experiment (N2 and CO2), high-pressure mercury injection porosimetry (HMIP), and nuclear magnetic resonance (NMR) methods shows that the marine shale in the southern Sichuan Basin is dominated by micropores smaller than 2 nm and mesoporous pores between 2 and 50 nm. On the other hand, optical microscopy, field emission scanning electron microscopy (FE-SEM), and micron- and nano-computed tomography scanning directly show that organic pores, intergranular pores, intragranular pores, and microfractures are the main pore types in marine shale from a two-dimensional or three-dimensional perspective and that organic pores in organic-rich shales are connected to each other, which promotes the connectivity of reservoir space [16]. In addition, the pore fractal characteristics and their geological significance are also discussed extensively [16,17,18]. Previous studies demonstrate that traditional techniques such as gas adsorption and SEM are still important and effective means to characterize the microstructure of shale reservoirs, but relatively little previous work has been carried out to explore the factors affecting the microstructure [14,15,16,17,18].
The pore volume and pore structure of shale gas reservoirs are the bridge to establish the relationship between the conventional parameters such as mineral composition, organic matter content, organic matter maturity, and gas storage performance. Through this bridge, it is possible to establish a theoretical model to evaluate the gas storage performance using these conventional parameters so as to better analyze the formation mechanism and enrichment law of shale gas [19]. Therefore, in this paper, the shale from the first subsection of the Long-11 section (Long-11) is studied. X-ray diffraction (XRD) data and regional geological background are used for dividing lithofacies and analyzing mineral composition characteristics. The pore structure characteristics are qualitatively investigated by SEM and are quantitatively characterized by a combined application of low-temperature nitrogen adsorption, low-temperature carbon dioxide adsorption (LCA), and micron CT experiments. The controlling factors of the microstructures in shale are analyzed by combining the depositional environment, tectonic activity, hydrocarbon evolution history, and mineral composition in order to better evaluate and develop China’s shale gas resources.
2. Regional Geological Background
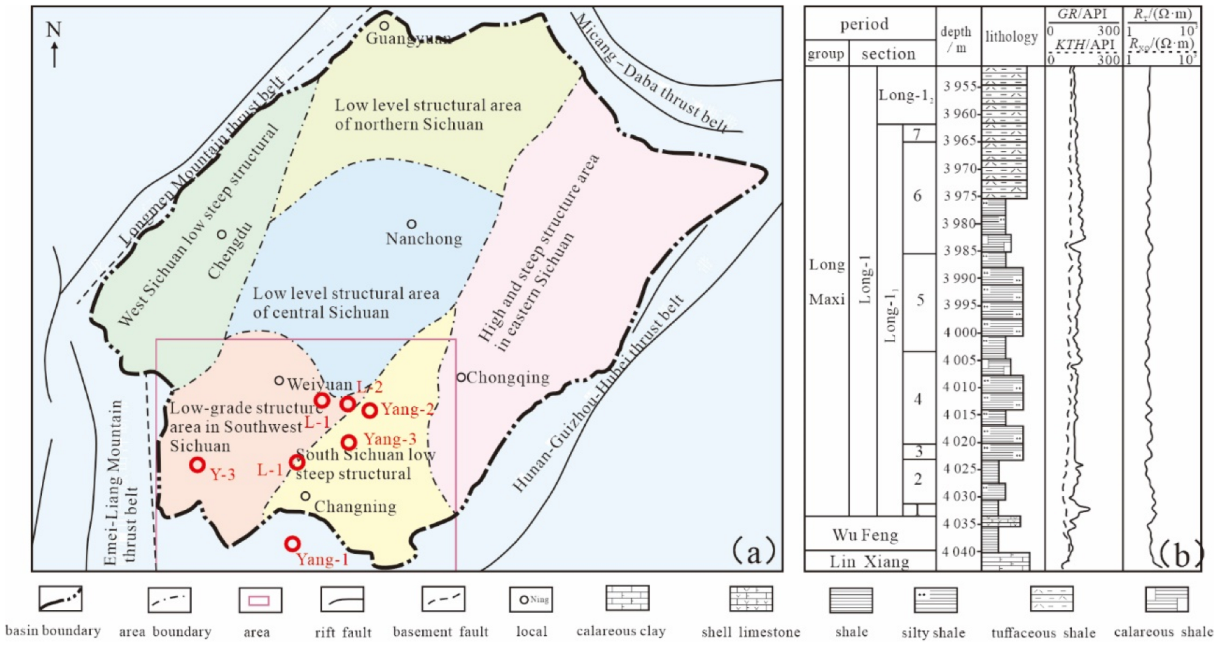
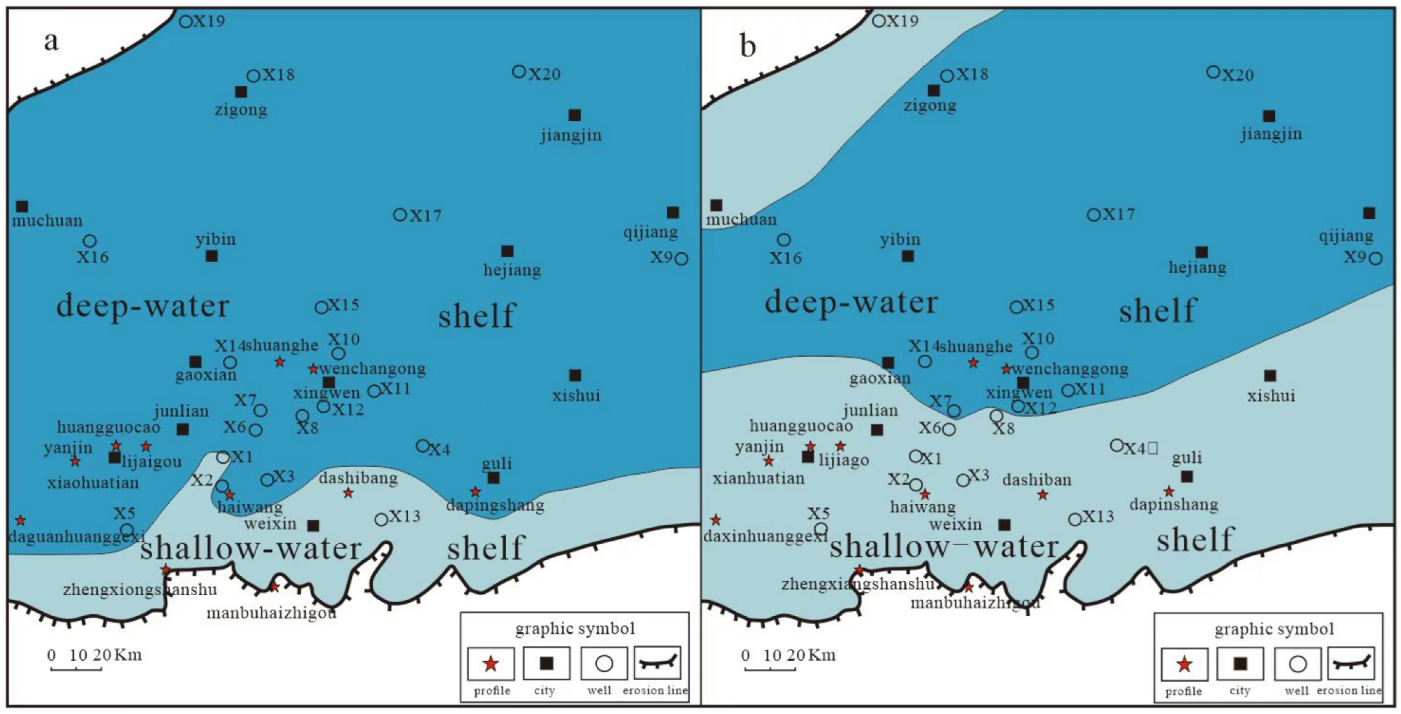
The study area in the southern Sichuan Basin is located in the low steep fold zone and low gentle tectonic zone of the Huayingshan fold belt (Figure 1a). Because of the influence of tectonic movements during the Caledonian, Hercynian, Indosinian, Yanshanian, and Himalayan periods, a more complex tectonic pattern is now present in the southern Sichuan Basin [20,21]. The Silurian strata also suffered different degrees of denudation, and strong tectonic extrusion also affected the sediment thickness of the Longmaxi Formation shales [21].
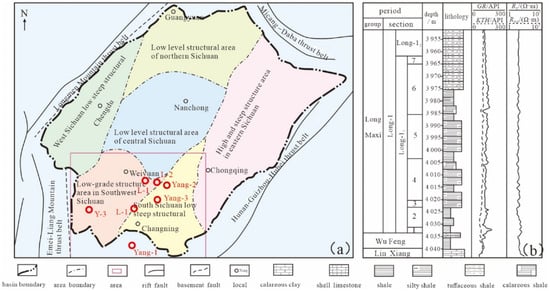
Figure 1.
(a) Tectonic location map and (b) stratigraphic diagram of the study area [22].
The deposition of the Wufeng–Longmaxi Formation successively underwent multiple phases of sedimentary and tectonic evolutionary cycles, forming a sequence in which the sedimentary water body becomes shallower upward as a whole with rocks becoming coarser in grain size and lighter in color, developing large sets of black and gray-black shales and dark-gray siltstone [1,23]. The Longmaxi Formation Long-1 section was subdivided into Long-11 and Long-12 subsections on the basis of lithology, logging curves, and other characteristics (Figure 1b). Among them, the sedimentary center in the southern Sichuan Basin is located in the Luzhou–Yibin area, which is an argillaceous semi-deep-water to deep-water shelf sedimentary environment.
3. Sampling and Methodology
3.1. Samples
A total of 60 core samples from the wells L-1, L-2, L-3, Yang-1, Yang-2, Yang-3, and Y-3 in the southern Sichuan Basin were collected for this work. These samples were buried at a depth of more than 3500 m, from the Upper Ordovician Wufeng formation to the Lower Silurian Long-11 sub-section. Fourteen samples from wells L-2 were used for analysis of mineral composition, pore structure, and organic geochemical characteristics, and the remaining samples came from wells Y-3, Yang-1, Yang-2, Yang-3, L-1, and L-3. They are used to support the evidence for the longitudinal variation of the lithofacies from the Wufeng formation to the Long-11 sub-section deep shale. The samples are representative with respect to the deep shale gas reservoir in the southern Sichuan Basin.
3.2. Experimental Approaches
3.2.1. Organic Geochemistry and Mineral Composition
The total organic carbon (TOC) contents were determined with a LECO CS-230 carbon analyzer after removing the carbonates with hydrochloric acid (1:9 HCl: water) at 60 ± 5 °C. X-ray diffraction (XRD) was conducted for the whole rock analysis by using the Bruker D8 DISCOVER diffractometer with tube pressure 40 KV, pipe flow 200 μA, Cu target, diffraction width DS = SS = 1°, RS = 0.3 mm, scanning speed 2.000 (d·min−1), and scanning range 10°~80°.
3.2.2. Field Emission-Scanning Electron Microscopy (FE-SEM)
Images of the pores were produced by FE-SEM with an FEI Quanta 200 F microscope, an accelerating voltage of 20 keV, and a working distance of 8–9 mm.
3.2.3. Low-Pressure Gas Adsorption
Five shale samples were taken from sixty shale samples for N2 and CO2 adsorption experiments conducted via a Quantachrome auto-sorb-iq3. Prior to analysis, the shale samples were crushed into particles of 60–80 mesh size (180–250 μm), dried in an oven at 60 °C for 24 h, and then degassed at high vacuum (<10 mm Hg) for 12 h. For nitrogen adsorption, the temperature of the sample chamber was set at −196 °C (77 K) to obtain adsorption and desorption analysis data. The analytical temperature used for CO2 adsorption was set at 0 °C, which provides the necessary kinetic energy for CO2 molecules to enter micropores.
3.2.4. High-Pressure Mercury Injection Porosimetry
As a technique widely used to analyze the pore size distribution of porous materials, HMIP can be used to characterize macropores (>50 nm). In this study, micromeritics Auto Pore IV 9520 was used to select 7 samples for high-pressure mercury injection experiments. After drying and vacuuming, the prepared samples were placed in the sample chamber. Then mercury was injected into the dilatometer, and the pressure level was gradually increased to the atmospheric pressure.
4. Results
4.1. Mineralogical and Petrological Characteristics
4.1.1. Mineral Composition
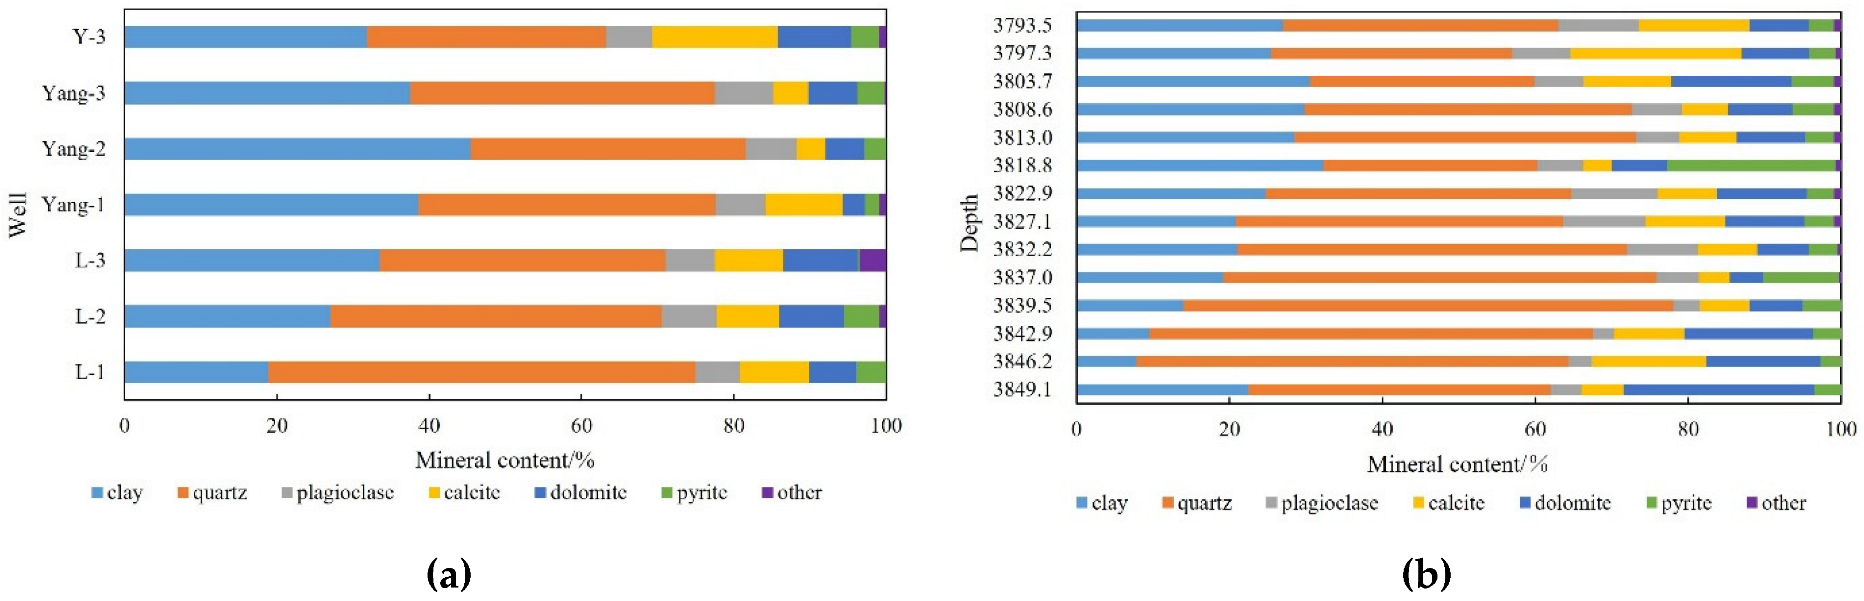
XRD analysis of shale samples from well L-2 (Figure 2a) and other seven wells (Figure 2b) in the Long-11 sub-section in the southern Sichuan Basin indicates that the mineral composition of the shales in the study area is diverse, mainly quartz, followed by clay minerals, and also including carbonate minerals such as feldspar, calcite, and dolomite, and heavy minerals such as pyrite. The quartz content ranges from 31.29% to 56.08%, with an average of 41%. The clay mineral content ranges from 18.88% to 45.4%, with an average of 33.25%. The feldspar content ranges from 5.78% to 7.64%, with an average of 6.56%, and the carbonate mineral content ranges from 8.91% to 26.07%, with an average of 15.46%.
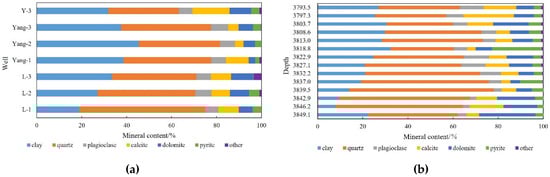
Figure 2.
(a) Longitudinal distribution of mineral content in well L-2. (b) Mineral composition of Longmaxi Formation shales in the southern Sichuan Basin.
4.1.2. Lithofacies Division
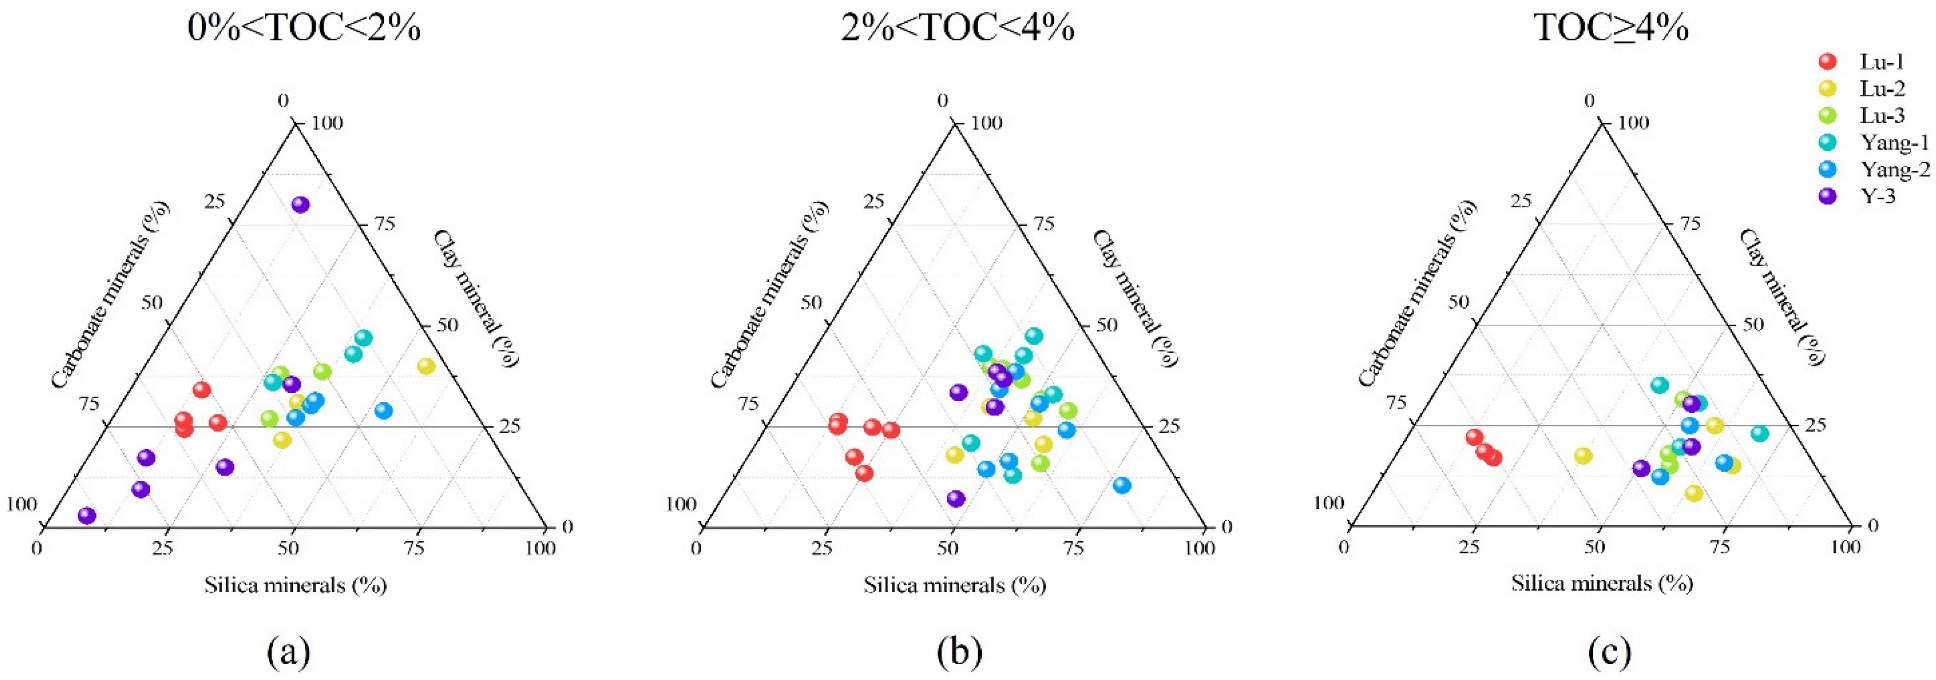
Dividing lithofacies is of great importance for analyzing depositional environments. Currently, mineral composition, organic matter abundance, matrix composition, and sedimentary tectonics are used to divide different lithofacies [24], among which the three-terminal division scheme based on the siliceous, argillaceous, and carbonate composition content of shale reservoirs is the most popular. In this paper, this three-terminal scheme and TOC content are combined to divide lithofacies, and a four-terminal lithofacies division map of the Long-11 shales is plotted (Figure 3). It shows that the shales with low organic matter content (0% < TOC < 2%) are mainly concentrated in two lithofacies: mixed shales and calcareous shale (Figure 3a). The shales of medium organic matter content (2% ≤ TOC < 4%) are mainly mixed shale, calcareous shale, and siliceous shale (Figure 3b). The shales with high organic matter content (TOC ≥ 4%) are mainly siliceous shales (Figure 3c).
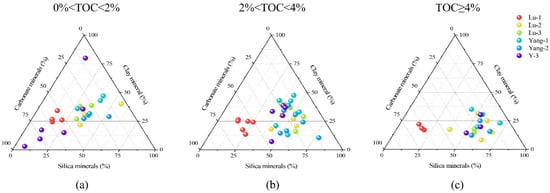
Figure 3.
Four-terminal map for dividing lithofacies of the Long-11 shales. (a) Low organic matter content (0% < TOC < 2%). (b) Medium organic matter content (2% < TOC < 4%). (c) High organic content (TOC ≥ 4%).
4.2. Pore Types
A large number of micro and nanoscale pores, which act as the main storage space, have been found in shale gas reservoirs. Because of the diverse pore types and complex genesis, many schemes for classifying pore types in shales have been proposed by both domestic and foreign scholars [3,25,26]. In this paper, the pores in the shales from the study area are classified into organic matter pores, inorganic matter pores, and microfractures by SEM observation of the shales in wells L-2 and Yang-2. The inorganic matter pores are further classified into intergranular pores and intragranular pores.
4.2.1. Organic Matter Pores
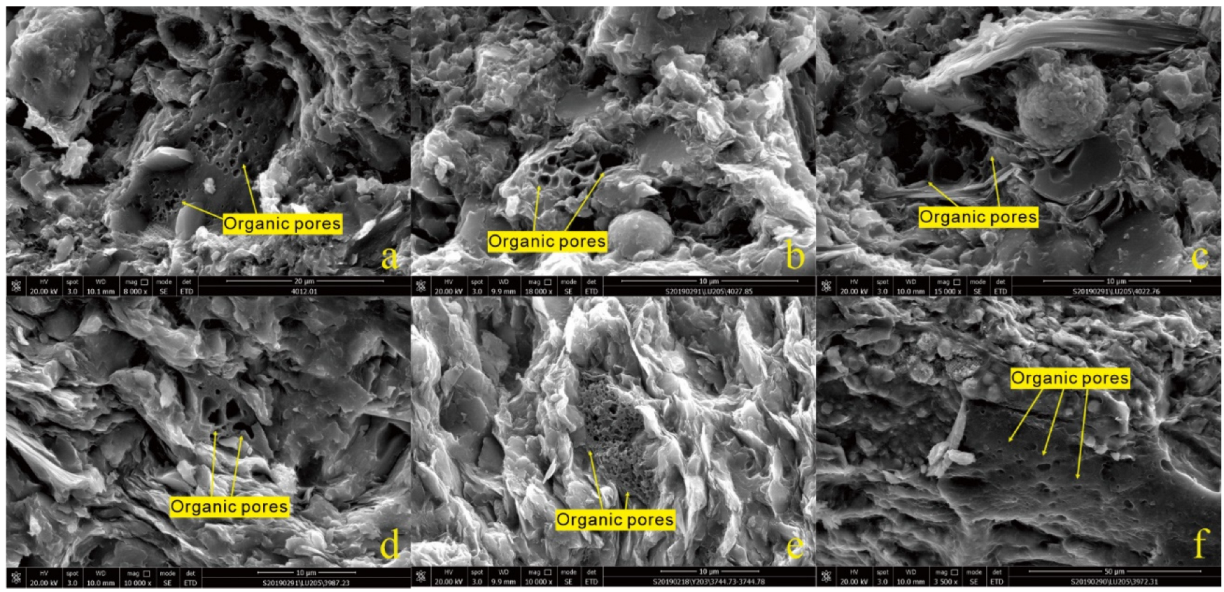
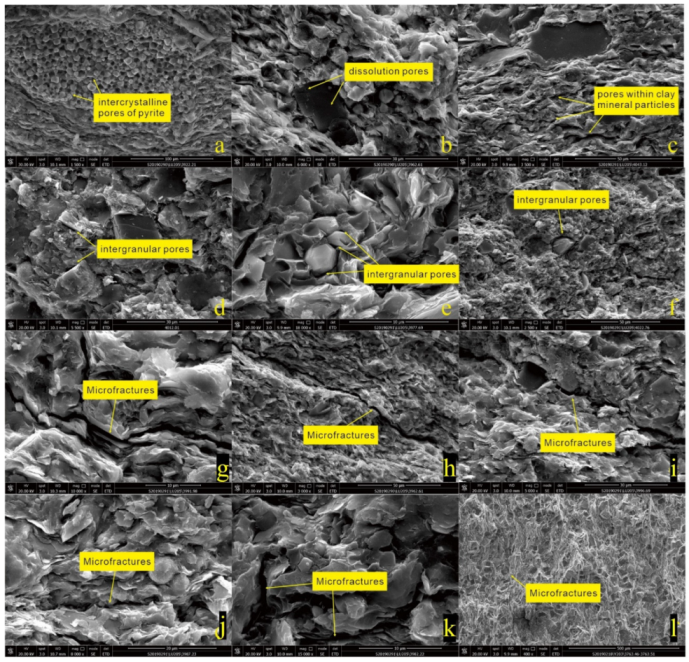
Organic matter pores were mainly within or around organic matter particles during the hydrocarbon generation process, and they were the main storage space for shale gas [25]. The shapes are mostly spherical and elliptical (Figure 4a,b), with nanoscale and several micron pores dominating. Irregular-shaped organic matter pores can be observed in some areas (Figure 4c,d), which may have been caused by the influence of compaction during the compaction process or by external factors such as tectonic activity and sedimentary activity. Pores are densely distributed in a honeycomb pattern in organic matter particles with a high degree of thermal maturity (Figure 4e,f).
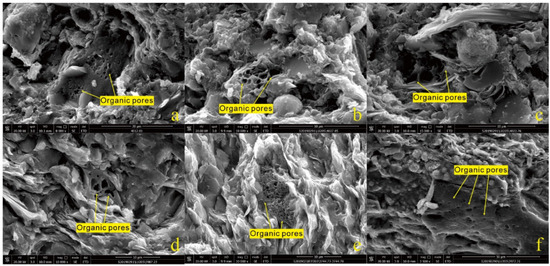
Figure 4.
Organic matter pores of Longmaxi Formation shales in the southern Sichuan Basin revealed by scanning electron microscope: (a,b) spherical and elliptical pore shapes; (c,d) irregular organic matter pores; (e,f) honeycomb dense pores.
4.2.2. Inorganic Matter Pores
The inorganic matter pores consist of intergranular pores and intragranular pores. The intergranular pores are mainly secondary pores formed within mineral particles or crystals, including intercrystalline pores of pyrite, dissolution pores of feldspar and carbonate components, and pores within clay mineral particles, usually with irregular shapes. Intercrystal pores are prone to generate during the formation of pyrite framboids (Figure 5a), and unstable minerals such as feldspar and carbonate components are susceptible to dissolution with organic acids during burial to form dissolution pores (Figure 5b). Dissolution pores are usually small in size and poorly connected, suggesting they contribute less to shale gas storage. The conversion of clay minerals during diagenesis forms interlayer pores within the clay minerals (Figure 5c), which are usually slit like, with large pores and good connectivity, providing good channels for shale gas storage and seepage. Intergranular pores are mainly developed between fragmented particles of brittle minerals such as quartz and feldspar, between single crystals of pyrite, at the contact between mineral particles and clay minerals or organic matter, etc. (Figure 5d–f). The pore shape is usually irregular, and the pore size is small.
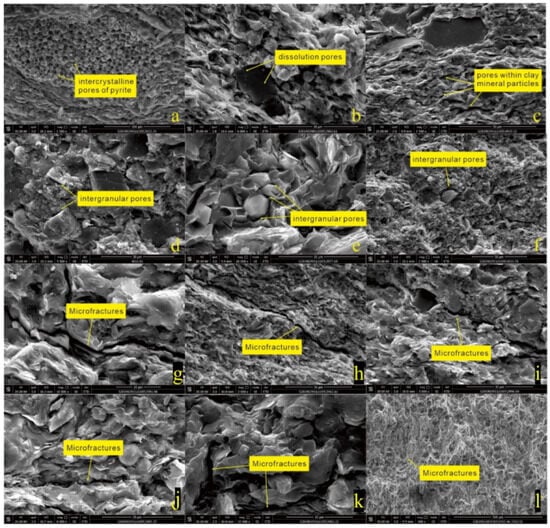
Figure 5.
Scanning electron microscope images showing the inorganic pores and microfractures in the Longmaxi Formation shale of the southern Sichuan Basin ((a) pyrite intergranular pores; (b) quartz dissolution pores; (c) clay mineral interlayer pores; (d) quartz intergranular pores; (e) pyrite intergranular pores; (f) intergranular pores; (g–l) microfractures).
4.2.3. Microfractures
The microfracture genesis includes organic matter hydrocarbon generation and pressurization, diagenesis, and tectonics. It is mainly distributed around the rigid mineral grains (Figure 5i,l) and clay mineral interlayer contraction joints (Figure 5g,h,j,k), mostly flat and worm like, etc. The degree of fracture opening and extension length vary, and the extension direction is consistent with the edge of mineral grains and clay mineral lamellae direction. Microfractures are interconnected and can effectively communicate with other types of pores to form a fracture network, which plays a positive role in improving the seepage capacity of shale reservoirs [27].
4.3. Pore Size Distribution
On the basis of the physical adsorption properties and the capillary condensation theory, the International Union of Pure and Applied Chemistry (IUPAC) proposed a pore size classification scheme in which the pores of porous substances are classified into micropores (pore size less than 2 nm), mesopores (pore size between 2 nm and 50 nm), and macropores (pore size greater than 50 nm) [28]. The nitrogen adsorption method can obtain statistical information and overall characteristics of the microstructure when characterizing the pore structure [29]. Liquid nitrogen adsorption (LNA) experiment is used to determine pore parameters such as pore volume, specific surface area, and pore size distribution of mesopores and macropores, and the pore size distribution of the sample is calculated using the Barret–Joyner–Halenda model [30]. Since CO2 gas can enter tiny pores as small as 0.35 nm, LCA experiments can be used to calculate the pore size distribution of micropores using the non-deterministic density functional theory of density functional theory (DFT) [31]. HMIP analysis is a commonly used method to determine the pore throat distribution of reservoirs [32,33]. However, mercury does not easily enter the nanoscale pores in shales, and the high pressure can cause artificial fractures, which affects the measurement results [33]. For these reasons, HMI is mainly used to analyze the pore size distribution in the macropore range [32]. Considering the range of accuracy of all the above methods, this paper uses a combination of LNA, LCA, and HMIP to realize a full pore-size characterization of the Long-11 shales in the southern Sichuan Basin.
4.3.1. Pore Structure from LNA
In this study, LNA is carried out on the Long-11 shale samples from well L-2 to evaluate the pores. The nitrogen adsorption–desorption curves of the shale samples from this well differed slightly in morphology but showed an inverse “S” shape overall, indicating that it included three processes: monolayer adsorption, multilayer adsorption, and capillary condensation [34,35] (Figure 6). At low relative pressure (0 < p/p 0 < 0.4), the adsorption volume rose slowly, the adsorption isotherm curve was slightly convex upward, and the whole adsorption process gradually converted from monolayer adsorption to multilayer adsorption. At medium to high relative pressures (0.3 < p/p 0 < 0.8), the nitrogen adsorption volume started to become significantly larger at a certain relative pressure, and a hysteresis loop appeared, at which time it completely entered the multimolecular layer adsorption stage. After that, the increased rate of nitrogen adsorption volume slowed down with increasing relative pressure. At high relative pressure (0.8 < p/p 0 < 1), the nitrogen adsorption increased rapidly, the curve showed a downward concave feature, and adsorption saturation did not occur, indicating that a certain amount of mesopores or macropores had developed in the Long-11 hale samples from well L-2, which resulted in capillary condensation of nitrogen on the shale surface. According to the hysteresis loop classification criteria proposed by the International Union of Pure and Applied Chemistry (IUPAC), the hysteresis loops of the five Long-11 shale samples are close to the H3 type and individually share the characteristics of an H4 type [36]. All five samples have hysteresis loops, indicating that the pores of the Long-11 shale in the southern Sichuan Basin are open, dominated by ink bottle pores, wedge-shaped pores, parallel-plate pores with four opening sides, and fracture-shaped pores [37]. These pores are well connected, providing good seepage channels for shale gas. The opening degree of the pores is associated with the rising rate of the adsorption curve. The faster it rises, the greater the openness of the pores. In the vertical direction, the openness of the pores in the five samples decreases from deep to shallow.
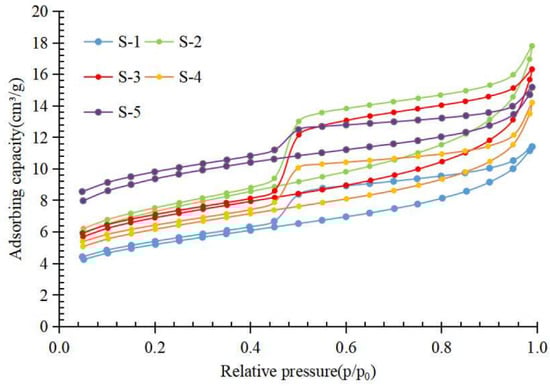
Figure 6.
Nitrogen adsorption–desorption curve of the Wufeng Formation and Long-11 shale from well L-2.
The average pore size of the Long-11 shale samples in the study area ranged from 3.057 nm to 3.412 nm, with an average of 3.269 nm. With the increase in depth, the pore volume and specific surface area both increased and then decreased (Table 1). Figure 7 shows the variation of pore volume with pore diameter. The pore volume’s rate of change increased as the pore diameter decreased, with no obvious peak. The rate of change varies significantly in the range of 3 nm to 30 nm, indicating that pores of this size range contributed most of the pore volume.

Table 1.
Specific surface area and pore volume of samples measured by N2 adsorption.

Figure 7.
Nitrogen adsorption pore volume’s rate of change distribution in the Wufeng Formation and Long-11 shale from well L-2 by BJH.
4.3.2. Pore Structure from LCA
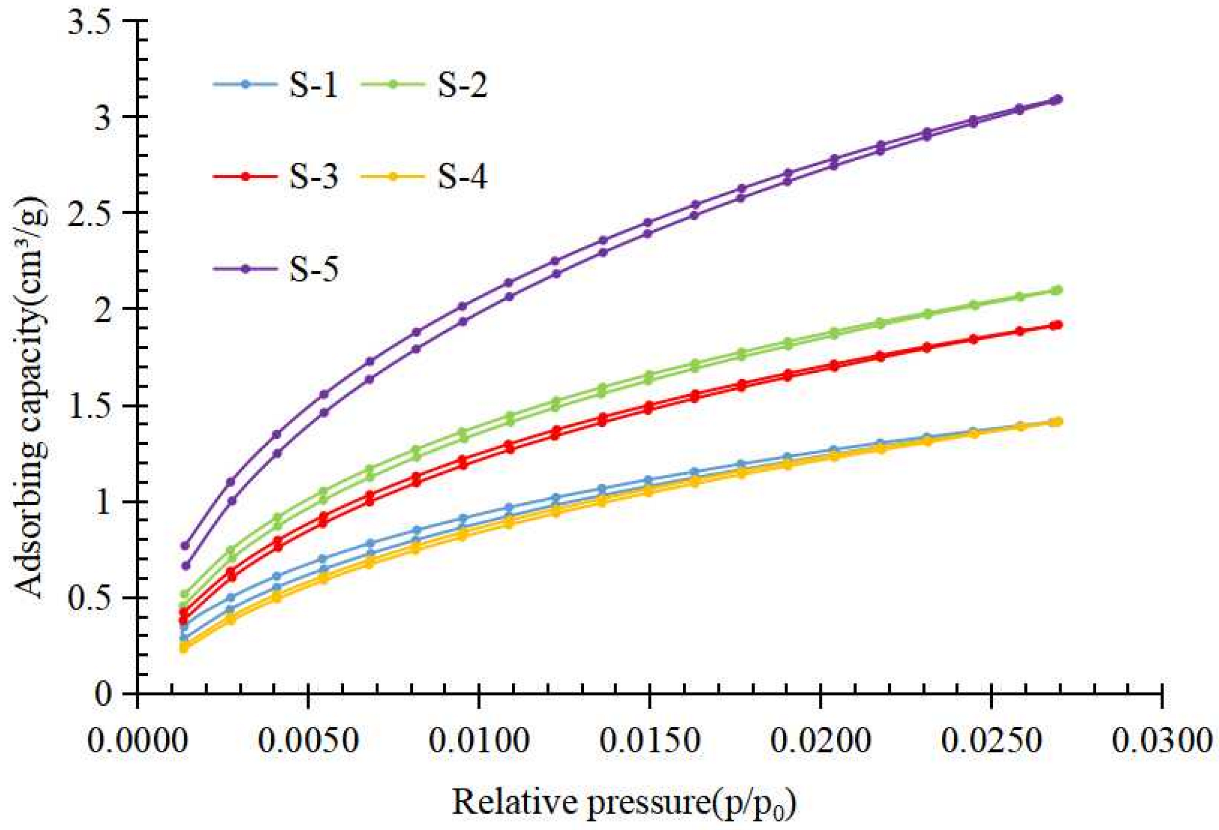
The isothermal adsorption curves of CO2 in the Long-11 shale samples mainly show microporous adsorption, and the adsorption volume is generally lower and does not reach the fully saturated stage (Figure 8). The CO2 adsorption curve rises rapidly in the low-pressure section and gradually becomes gentle in the medium-pressure and high-pressure sections, with an overall upward convex curve pattern. According to the classification by Brunauer et al. (1940) [33] of adsorption isotherms, the adsorption curve of each sample is close to the type I adsorption isotherm, reflecting the filling process of micropores in shale, and the saturation adsorption value is equal to the filling volume of micropores. The difference in the maximum adsorption volume at the highest pressure of different samples indicates that there are some differences in the development of micropore volume in shale samples of the Long-11 sub-section.

Figure 8.
CO2 adsorption–desorption curve of Wufeng Formation and Long-11 shale from well L-2.
With pore size varying, the pore volume’s rate of change showed a multipeak feature (Figure 9), indicating the complexity of micropores. The pore volume’s change rate varies from fluctuating sharply to leveling off with pore size increases, indicating the peak of the pore size lies between 0.45 nm and 0.62 nm.
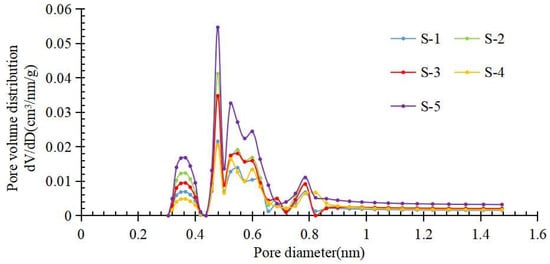
Figure 9.
CO2 adsorption pore volume’s rate of change distribution of the Wufeng Formation and Long-11 shale from well L-2.
Since the CO2 saturation vapor pressure was not reached in the experiment, the adsorption volume could not be used to calculate the micropore volume. The DFT model is applied to investigate the micropore structure and the results of micropore analysis obtained by the DFT model of CO2 adsorption. CO2 adsorption experiments recorded pore sizes ranging from 0.305 nm to 1.475 nm. The pore volume of the five samples showed a similar change pattern to the specific surface area; that is, the pore volume first increased and then decreased with the increase in depth (Table 2).
Table 2.
Specific surface area and pore volume measured by CO2 adsorption.
4.3.3. Pore Structure from HMI
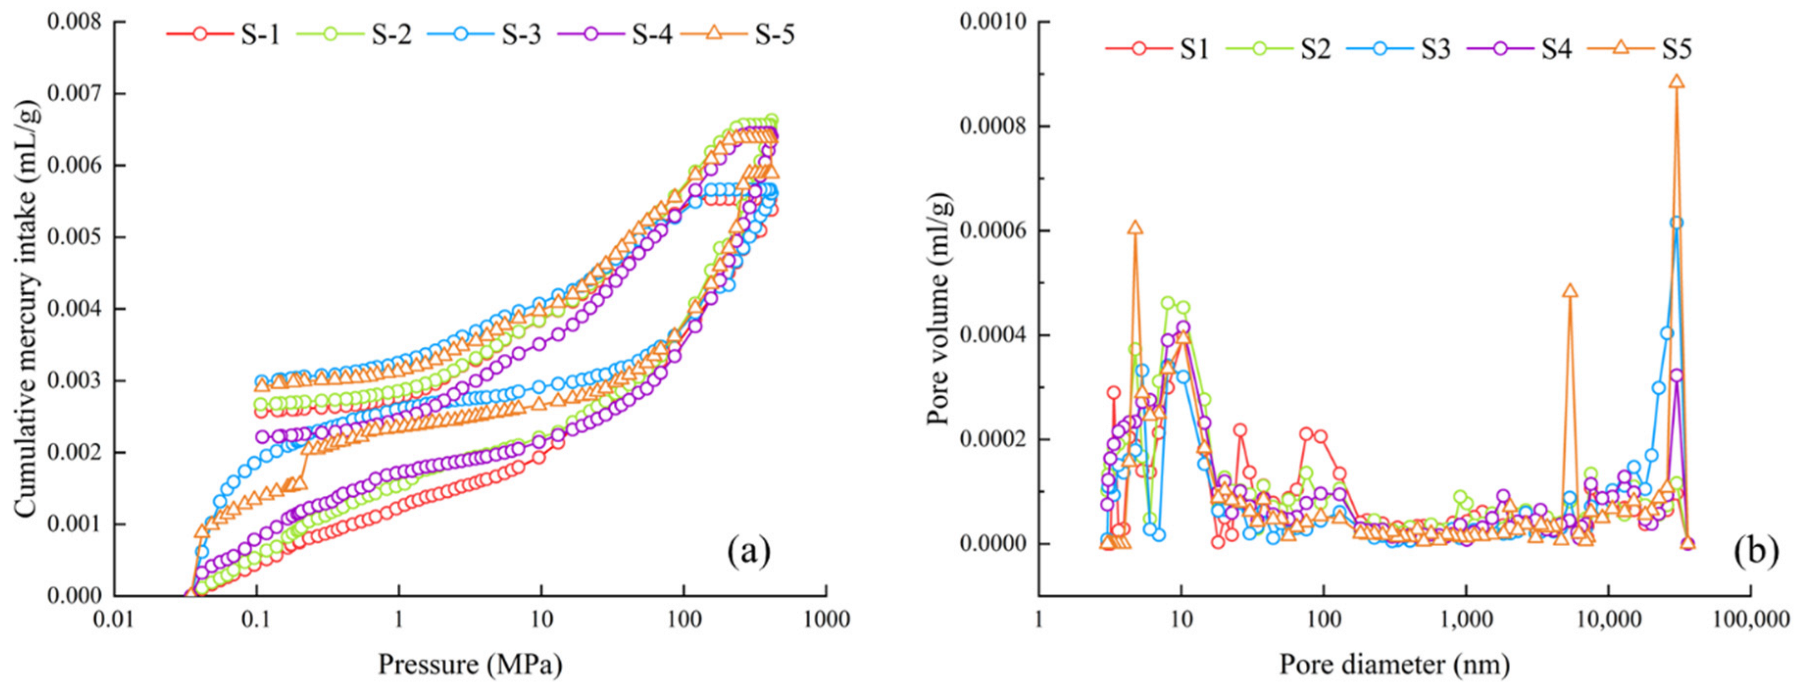
The HMI experiment is commonly used to quantify pores with diameters greater than 50 nm. The mercury intrusion curve of the shale sample can be divided into three stages [38] (Figure 10a). At the initial stage, a large amount of mercury was injected at a higher rate. Then, the rate slowed down when the mercury injection pressure reached 1 MPa. When the mercury injection pressure was greater than 50 MPa, it entered the high-pressure rapid-injection stage. The mercury injection–ejection curves did not overlap, and nearly 50% of the mercury injected was still stored in the pore space of the shale after ejection, indicating the existence of ink-bottle pore space in the shale. The pore size distribution curve is characterized by a multipeak distribution, and the pore size peaks are mainly concentrated in 3~200 nm and 10 μm, indicating the shales have a large number of macropores (Figure 10b). HMI experiments recorded average pore sizes ranging from 10.30 to 15.46 nm, with an average value of 13.106 nm. The porosity ranged from 1.441% to 1.733%, with an average of 1.549% (Table 3). In addition, the pore volume and specific surface area of macropores have no obvious regularity in the longitudinal direction.
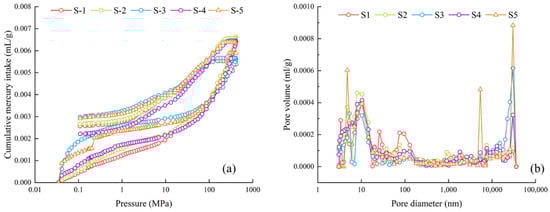
Figure 10.
Mercury intrusion curve (a) and pore size distribution (b) of the Wufeng Formation and Long-11 shale from L-2.
Table 3.
Pore structure parameters measured by high-pressure mercury intrusion.
4.3.4. Pore Connectivity
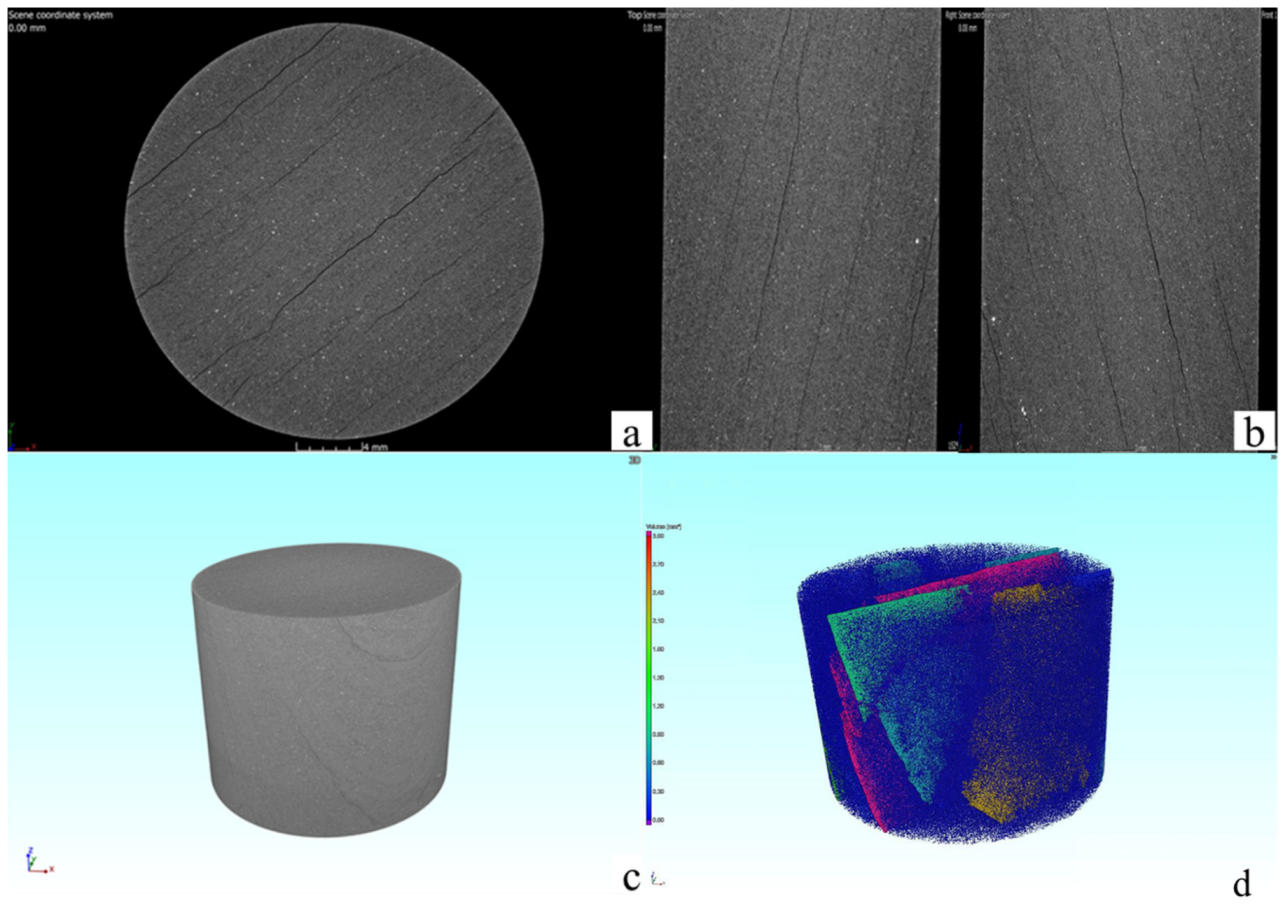
On the basis of the difference in component density, it is shown as different gray levels in the CT image, in which the shale with pores and fractures has the lowest density, and the line in the image is black. Through the two-dimensional slice diagram, we can see multiple fractures that are approximately parallel to the bedding. The pore cracks are extracted by software, as shown in Figure 11d. There are many pores in the shale; the blue part shows a large number of isolated pores, and the other colors show a large number of connected pores and cracks. As the color of the pore markers gradually becomes pink, the connected domain of the pores gradually increases, and the connected range becomes wider.
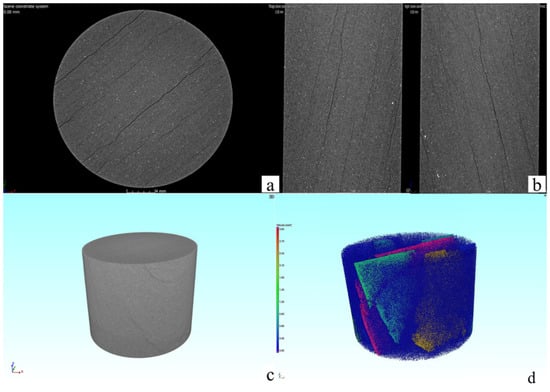
Figure 11.
CT images of Longmaxi Formation shale samples in Ning 213 well: (a,b) two-dimensional slice image; (c) three-dimensional reconstruction; (d) pore three-dimensional structure diagram).
5. Discussion
5.1. Depositional Controls on the Mineral Composition
During the deposition of the Wufeng Formation–Longmaxi Formation, the southern Sichuan Basin was generally in a semienclosed–enclosed bay environment [38,39]. Because of the control of the sea level changing cycle, the sedimentary environment experienced an evolution from deep-water shelf to semi-deep-water shelf to shallow-water shelf when the Wufeng Formation and Longmaxi Formation were deposited [40].
By synthesizing previous research results, Wang et al. (2015) divided the Longmaxi Formation in the southern Sichuan Basin into two third-order sequences, SSQ1 and SSQ2 [41]. During the transgressive systems tract of the SSQ1 sequence, the sea level began to rise, and the water body deepened. Meanwhile, because of the influence of tectonic movements, the southern Sichuan Basin was surrounded by the Chuanzhong paleo-uplift, Qianzhong paleo-uplift, and Xuefeng paleo-uplift. An anaerobic environment formed upon a still and euxinic water condition in a deep-water shelf background, depositing organic-rich black shale. By the time of the high systems tract, the sea level dropped, the supply of material sources changed, and mudstones and sandy mudstones began to be deposited (Figure 12a).

Figure 12.
Sedimentary environment during the Longmaxi Formation depositing [40]: (a) SSQ1 sequence; (b) SSQ2 sequence.
During the transgressive systems tract of the SSQ1 sequence, global warming, glacial melting, and sea level rise led to an anaerobic–anoxic environment in a deep-water shelf sedimentary environment. The flourishment of siliceous organisms such as radiolarians and sponge spicules during this period resulted in the formation of organic-rich shales with high siliceous content [41,42], which also corresponds to siliceous shale rich in siliceous minerals and siliceous shale with TOC content higher than 4%. During the early high systems tract of the SSQ2 sequence, the sea level began to drop, and the depositional environment changed to an anoxic–oxic environment, dominated by a semi-deep-water shelf environment with increased sandy and carbonate content. The sea level continued to drop in the late high systems tract of the SSQ2 sequence, and the depositional environment changed to an oxidizing environment, which was not conducive to the production of high paleoproductivity organisms. Stronger bioturbation was observed, indicating the environment changed to shallow-water shelf deposition dominated by light gray argillaceous shale [41,42] (Figure 12b).
In this study, the conversion in the depositional environment also corresponds to the gradual change in shale lithofacies from siliceous shale to mixed shale to calcareous shale as the TOC content decreases, as described earlier, and also corresponds to the trend of increasing quartz mineral content with increasing burial depth (Figure 2a).
5.2. The Main Factors Controlling the Shale Pore Structure
5.2.1. Abundance of Organic Matter
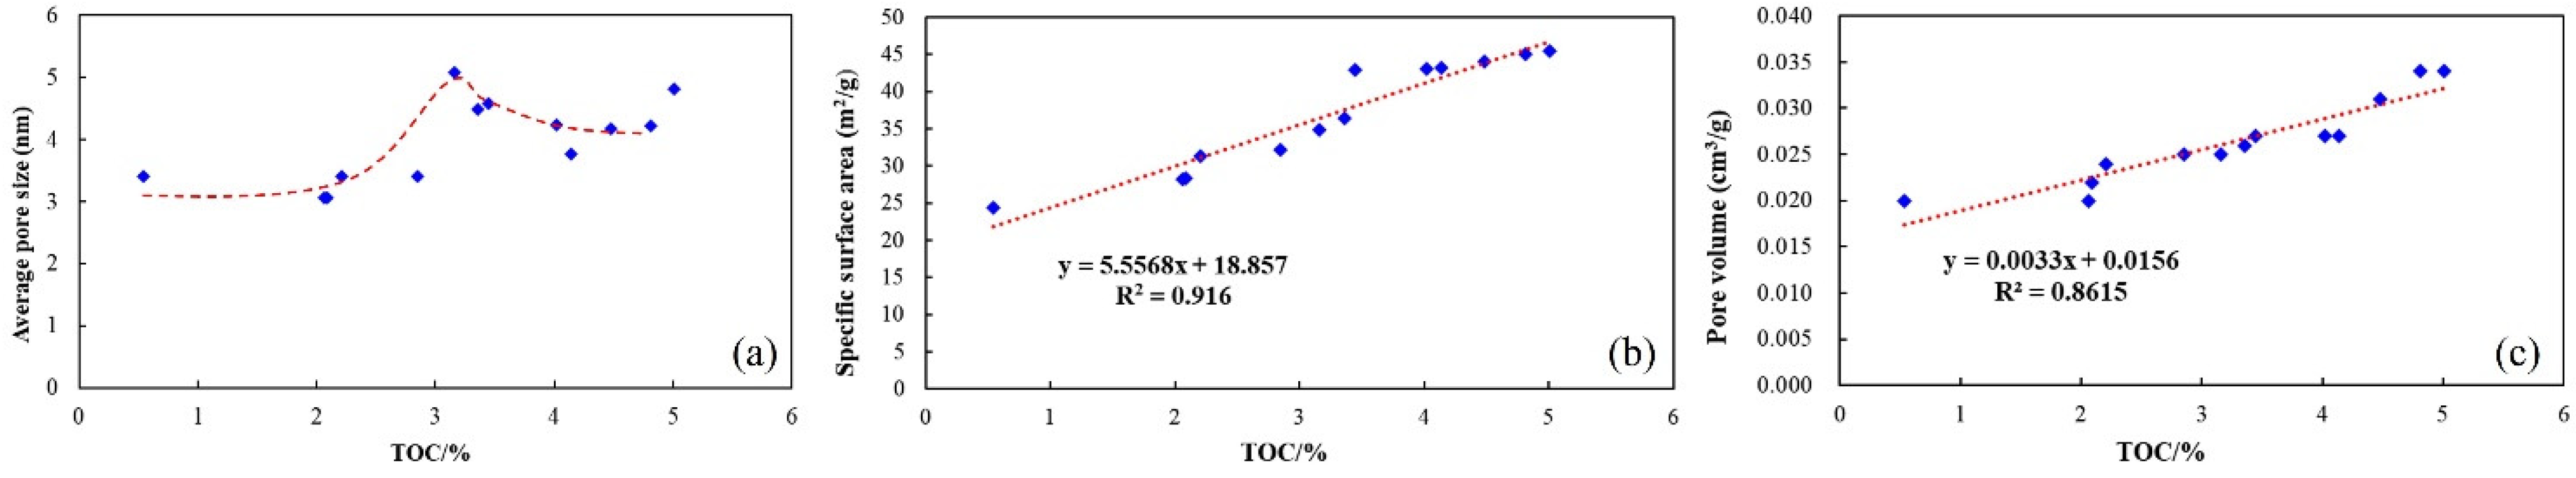
There are many influencing factors controlling the development of pore structure in shale reservoirs, among which rock material composition is closely related to the degree of pore development in shale [43]. TOC content is one of the main factors affecting the pore structure of the shale. The pore structure parameters of Longmaxi Formation shale were obtained by LNA; the analysis of the relationship between these parameters and TOC showed (Figure 13) that the average aperture was positively correlated with TOC within a certain range but showed an opposite trend when TOC was higher than 3% (Figure 13a). The specific surface area was positively correlated with TOC with a correlation coefficient of 0.916 (Figure 13b), and the total pore volume was positively correlated with TOC with a correlation coefficient of 0.8615 (Figure 13c), indicating that the degree of pore development in the shale is strongly associated with TOC. As the TOC content increased, the number of pores increased, leading to an increase in specific surface area and total pore volume. When the TOC > 3%, the average pore size gradually decreases with increasing TOC, indicating that the maturation process of organic matter in shale leads to a large increase in the number of micropores during hydrocarbon generation and expulsion and that the organic matter pores are smaller than inorganic matter pores.
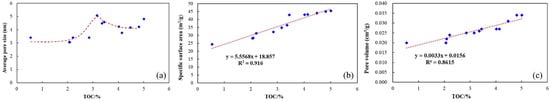
Figure 13.
Relationship between pore structure parameters and total organic carbon: (a) the relationship between average pore size and total organic carbon; (b) the relationship between specific surface area and total organic carbon; (c) the relationship between total pore volume and total organic carbon.
5.2.2. Mineral Composition and Content
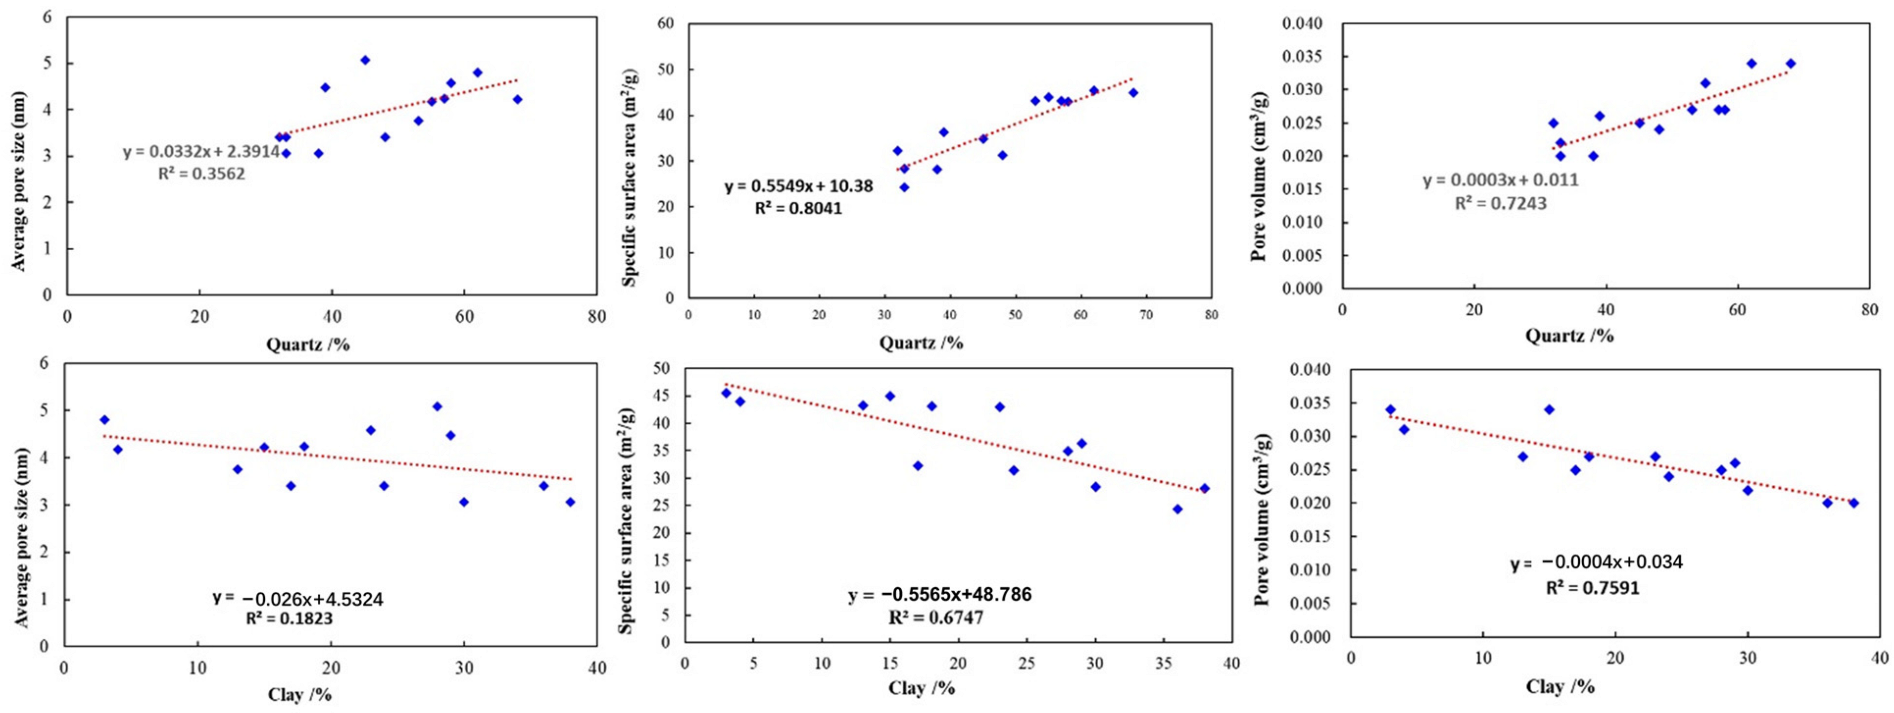
In addition to the TOC content, the pore structure of the Longmaxi shale is also influenced by the mineral composition. Quartz and clay are the main minerals in the shales in the study area, so their relationships with pore structure are our focus. Figure 14 demonstrates that the average pore size has a weak positive correlation with quartz, with a correlation coefficient of 0.3562. The specific surface area and total pore volume of shale show a good positive correlation with quartz, and the correlation coefficients are 0.8041 and 0.7243, respectively, indicating that quartz content plays a positive role in the development of pore space. It is believed that brittle minerals such as quartz can protect pores from compacting by resisting pressure during the evolution of diagenesis, which is conducive to the preservation of some intergranular pores [44]. The specific surface area and the total pore volume are negatively correlated with clay minerals with correlation coefficients of 0.6747 and 0.7591, respectively. Clay minerals are much more flexible and are easily deformed to block the pores under compaction. Moreover, the shales with high clay mineral content have a low content of brittle minerals such as quartz, which inhibits the development of pores and leads to a smaller specific surface area and total pore volume.
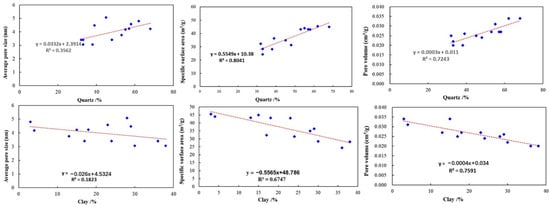
Figure 14.
Relationship between pore structure parameters and mineral composition.
5.2.3. Evolution of Hydrocarbon Generation and Diagenesis
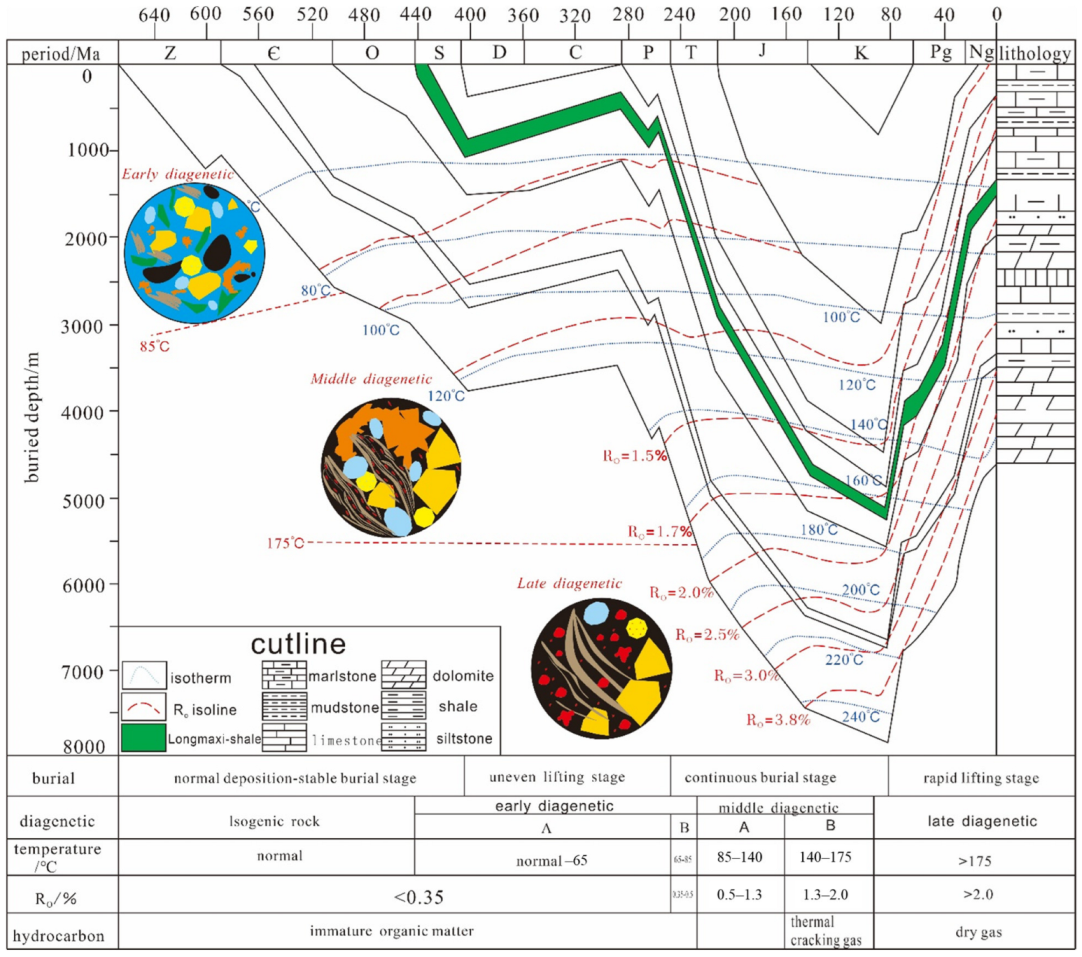
During the burial, the shale formation mainly undergoes thermal evolution of organic matter and diagenesis of inorganic matter, both of which interact with each other and synergistically control the formation of storage space in the Longmaxi shale. The Longmaxi shale has undergone a long and complex hydrocarbon generation and diagenetic evolution and is already in the late diagenetic stage [45] (Figure 15).
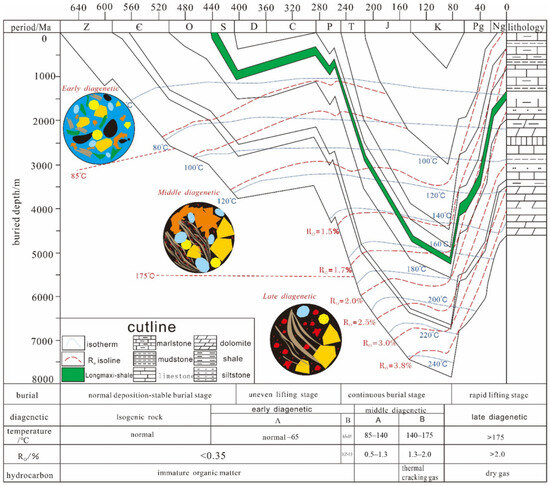
Figure 15.
Evolution of hydrocarbon generation and diagenesis of the Longmaxi shale in the southern Sichuan Basin [40].
In the early diagenetic stage A, the organic matter is immature, with low paleotemperature (less than 65 °C) and low thermal evolution stage (Ro < 0.35%). In this stage, organic matter pores are not developed, and quartz of biogenesis is formed in large quantities. Mechanical compaction makes the sediment weakly consolidated, and the intergranular pores rapidly reduced. In the early diagenetic stage B, organic matter is in the semi-mature stage, with a paleotemperature range of 65~85 °C and a Ro range of 0.35~0.5%. Smectite begins to transform into mixed layers of illite/smectite under higher temperatures, forming interlayer pores. At the same time, the primary pore space is reduced by the influence of compaction, but the total porosity remains the same. At this stage, authigenic quartz is also continuously generated. In the late period, the diagenetic environment gradually changes to a weakly acidic environment, and some dissolution pores start to generate [46].
In the middle diagenetic stage A, the organic matter enters the oil window, with a paleotemperature range of 85~140 °C and the Ro range of 0.5~1.3%. At this stage, the thermal degradation of kerogen generates liquid hydrocarbons and a small number of gaseous hydrocarbons, and the liquid hydrocarbons undergo short-range transport to occupy adjacent inter- and intragranular pores. A large number of expelled organic acids leads to the dissolution of unstable minerals such as feldspar. Clay minerals transform to illite smectite and illite, and cementation of silicate minerals occurs. In the middle diagenetic stage B, the organic matter enters a high maturity stage with a paleotemperature range of 140 °C to 175 °C and a Ro between 1.3% and 2.0%. Wet gas is generated by kerogen degradation and liquid hydrocarbon cracking, and organic matter pores form. In this stage, clay minerals are mainly illite–smectite and illite, which contribute to the formation of organic matter–clay mineral compounds and organic matter macropores.
In the late diagenetic stage, the organic matter enters the overmature stage with paleotemperature above 175 °C and Ro above 2.0%. Liquid and gaseous hydrocarbons are cracked to produce dry gas, organic matter pores are generated in large quantities, and clay minerals are dominated by illite and illite–smectite.
5.3. Effect of Critical Regional Geological Events on Shale Microstructure
5.3.1. Regional Thermal Event
The Permian Emeishan basaltic eruption is an important tectonothermal event on the western margin of the Yangtze plate [47]. The basaltic eruption in Emeishan is a result of the strongly active period of Emei rifting and an inevitable product of the Emei mantle column activity. Continuous activity of mantle columns causes large-scale continuous crustal uplift, thus forming a dome-like uplift on the geomorphology. Strong denudation occurs on the top of the uplift and weakens toward the edge, which, in turn, controls the regional sedimentary environment and lithofacies [47]. The temperature of the mantle involved in the basaltic action of Emeishan was 1550 °C, and this high-temperature background in the Paleozoic played an important role in the thermal evolution of hydrocarbon source rocks in the Sichuan Basin. The thermal action of the mantle column provided a heat source for the transformation of Paleozoic hydrocarbon source rocks, which is conducive to promoting the strong transformation of organic matter [48].
5.3.2. Effect of Tectonic Event
Natural microfractures are formed by the combined effect of multiple phases of tectonic movements in each geological historical period. Their development and direction are controlled by the tectonic stress field in different periods [49]. The Longmaxi Formation in the southern Sichuan Basin has experienced three major tectonic events since its deposition. In the middle of the Yanshan tectonic movement, the eastern section of the Daloushan developed reverse strike-slip faults due to the extrusion of the main stress field in the near east–west direction, which is controlled by the southeast–northwest-oriented extrusive stress field of the Xuefeng intra land orogenic system [50]. During the late Yanshan tectonic movement and early Himalayan tectonic movement, the Indian Ocean plate collided and closed with the Eurasian plate to the north, resulting in the formation of tectonic compression from northwest to southeast direction in the southern Sichuan Basin, and the near-northeast compression-fold deformation event in Luzhou area and Changning area [51]. In the middle of the Himalayan movement, the tectonic forces extended into the basin because of the collision of the Indian and Eurasian plates, producing northeast–southwest-oriented tectonic compression. The early near-east–west-trending folds in the western part of the Sichuan Basin were also superimposed by the near-north–south-trending fold deformation. During the late Himalayan movement, northeast–southwest-oriented compression and deformation occurred in the western part of southern Sichuan to form the northwest-trending tectonics, and they were superimposed on the northeast-trending tectonics formed in the previous [50].
6. Conclusions
(1) Felsic minerals, carbonate minerals, and clay minerals are the main inorganic matter components in the deep-buried Long-11 shales from the southern Sichuan Basin, with quartz content increasing with burial depth. During the deposition of the Wufeng Formation and Longmaxi Formation, the sedimentary environment evolved from a deep-water shelf to a semi-deep-water shelf to a shallow-water shelf. As the TOC content decreased, the shale lithofacies gradually changed from siliceous shale to mixed shale to calcareous shale;
(2) Organic matter pores, inorganic matter pores, and microfractures are commonly developed in the Long-11 shales of the study area. It mainly includes pores of ink-bottle, wedge-like, and slit-like morphology, with good connectivity, which provides a good seepage channel for shale gas. The mesopores of 3~30 nm are the main contributors to the total pore volume;
(3) TOC content and quartz content were positively correlated with pore-specific surface area and total pore volume. Clay mineral content was weakly positively correlated with specific surface area and negatively correlated with total pore volume. The development of microfractures was affected by multistage tectonic movements, and its development period and direction were related to the tectonic stress of each period. At the same time, the thermal effect of the Emeishan mantle plume provided a heat source for the conversion of the Ro value of the source rocks in the Sichuan Basin, which was conducive to promoting the strong conversion of organic matter.
Author Contributions
Conceptualization, Y.L. (Yong Liu); writing—original draft, H.Y. and S.Z.; writing —review and editing B.L.; data processing S.Z.; funding acquisition, B.L.; supervision, Y.L. (Yong Liu); resources, M.Z., J.Z., Y.L. (Yongyang Liu), G.W., M.Y. and L.C. All authors have read and agreed to the published version of the manuscript.
Funding
This research is supported by PetroChina’s Major Science and Technology Project, “Research and Test of Key Technologies for Effective Exploitation of Deep Shale Gas” (NO. 2019F-31).
Data Availability Statement
Not applicable.
Conflicts of Interest
The authors declare that the research was conducted in the absence of any commercial or financial relationships that could be construed as a potential conflict of interest. The data presented in this study are available on request from the corresponding author. The data are not publicly available due to confidentiality agreements related to the project supporting this study.
References
- Zou, C.N.; Zhu, R.K.; Chen, Z.Q.; Ogg, J.G.; Wu, S.T.; Dong, D.Z.; Qiu, Z.; Wang, Y.M.; Wang, L.; Lin, S.H.; et al. Organic-matter-rich shales of China. Earth-Sci. Rev. 2019, 189, 51–78. [Google Scholar] [CrossRef]
- Liu, J.; Yao, Y.B.; Elsworth, D.; Liu, D.M.; Cai, Y.D.; Dong, L. Vertical Heterogeneity of the Shale Reservoir in the Lower Silurian Longmaxi Formation: Analogy between the Southeastern and Northeastern Sichuan Basin, SW China. Minerals 2017, 7, 151. [Google Scholar] [CrossRef]
- Li, H.; Tang, H.; Zheng, M. Micropore Structural Heterogeneity of Siliceous Shale Reservoir of the Longmaxi Formation in the Southern Sichuan Basin, China. Minerals 2019, 9, 548. [Google Scholar] [CrossRef]
- Curtis, J.B. Fractured shale-gas systems. AAPG Bull. 2002, 86, 1921–1938. [Google Scholar]
- Mahanta, B.; Tripathy, A.; Vishal, V.; Singh, T.; Ranjith, P. Effects of strain rate on fracture toughness and energy release rate of gas shales. Eng. Geol. 2017, 218, 39–49. [Google Scholar] [CrossRef]
- Shi, Z.; Zhao, S.; Zhou, T.; Ding, L.; Sun, S.; Cheng, F. Mineralogy and Geochemistry of the Upper Ordovician and Lower Silurian Wufeng-Longmaxi Shale on the Yangtze Platform, South China: Implications for Provenance Analysis and Shale Gas Sweet-Spot Interval. Minerals 2022, 12, 1190. [Google Scholar] [CrossRef]
- Yan, C.; Jin, Z.; Zhao, J.; Du, W.; Liu, Q. Influence of sedimentary environment on organic matter enrichment in shale: A case study of the Wufeng and Longmaxi Formations of the Sichuan Basin, China. Mar. Pet. Geol. 2018, 92, 880–894. [Google Scholar] [CrossRef]
- Chen, L.; Wang, G.; Yang, Y.; Jing, C.; Chen, M.; Tan, X. Geochemical Characteristics of Bentonite and Its Influence on Shale Reservoir Quality in Wufeng–Longmaxi Formation, South Sichuan Basin, China. Energy Fuel 2019, 33, 12366–12373. [Google Scholar] [CrossRef]
- Shu, Y.; Lu, Y.; Chen, L.; Wang, C.; Zhang, B. Factors influencing shale gas accumulation in the lower Silurian Longmaxi formation between the north and South Jiaoshiba area, Southeast Sichuan Basin, China. Mar. Pet. Geol. 2020, 111, 905–917. [Google Scholar] [CrossRef]
- Qiu, Z.; Zou, C.N. Controlling factors on the formation and distribution of “sweet-spot areas” of marine gas shales in South China and a preliminary discussion on unconventional petroleum sedimentology. J. Asian Earth Sci. 2020, 194, 103989. [Google Scholar] [CrossRef]
- Zhang, X.; Wu, C.; He, J.; Ren, Z.; Zhou, T. The Controlling Effects of Compositions on Nanopore Structure of Over-Mature Shale from the Longtan Formation in the Laochang Area, Eastern Yunnan, China. Minerals 2019, 9, 403. [Google Scholar] [CrossRef]
- Ma, K.; Zhang, B.; Wen, S.; Lin, X.; Wang, Y.; Yang, K. Quantitative Characterization and Controlling Factors of Shallow Shale Reservoir in Taiyang Anticline, Zhaotong Area, China. Minerals 2022, 12, 998. [Google Scholar] [CrossRef]
- Xu, L.; Zhang, J.; Ding, J.; Liu, T.; Shi, G.; Li, X.; Dang, W.; Cheng, Y.; Guo, R. Pore Structure and Fractal Characteristics of Different Shale Lithofacies in the Dalong Formation in the Western Area of the Lower Yangtze Platform. Minerals 2020, 10, 72. [Google Scholar] [CrossRef]
- Shangbin, C.; Yanming, Z.; Hongyan, W.; Honglin, L.; Wei, W.; Junhua, F. Structure characteristics and accumulation significance of nanopores in Longmaxi shale gas reservoir in the southern Sichuan Basin. J. China Coal Soc. 2012, 37, 438–444. [Google Scholar] [CrossRef]
- Xusheng, G.; Yuping, L.; Ruobing, L.; Wang, Q. Characteristics and controlling factors of micropore structures of the Longmaxi Shale in the Jiaoshiba area, Sichuan Basin. Nat. Gas Ind. B 2014, 1, 165–171. [Google Scholar]
- Wang, X.; Jiang, Z.; Jiang, S.; Chang, J.; Zhu, L.; Li, X.; Li, J. Full-Scale Pore Structure and Fractal Dimension of the Longmaxi Shale from the Southern Sichuan Basin: Investigations Using FE-SEM, Gas Adsorption and Mercury Intrusion Porosimetry. Minerals 2019, 9, 543. [Google Scholar] [CrossRef]
- Zhou, S.W.; Xue, H.Q.; Ning, Y.; Guo, W.; Zhang, Q. Experimental study of supercritical methane adsorption in Longmaxi shale: Insights into the density of adsorbed methane. Fuel 2018, 211, 140–148. [Google Scholar] [CrossRef]
- Yang, F.; Ning, Z.F.; Wang, Q.; Zhang, R.; Krooss, B.M. Pore structure characteristics of lower Silurian shales in the southern Sichuan Basin, China: Insights to pore development and gas storage mechanism. Int. J. Coal Geol. 2016, 156, 12–24. [Google Scholar] [CrossRef]
- Wu, J.; Yu, B.; Zhang, J.; Li, Y. Pore characteristics and controlling factors in the organic-rich shale of the Lower Silurian Longmaxi Formation revealed by samples from a well in southeastern Chongqing. Earth Sci. Front. 2013, 20, 260–269. [Google Scholar]
- Shangbin, C.; Yanming, Z.; Si, C.; Yufu, H.; Changqing, F.; Junhua, F. Hydrocarbon generation and shale gas accumulation in the Longmaxi Formation, Southern Sichuan Basin, China. Mar. Pet. Geol. 2017, 86, 248–258. [Google Scholar] [CrossRef]
- Nie, H.; Li, P.; Dang, W.; Ding, J.; Sun, C.; Liu, M.; Wang, J.; Du, W.; Zhang, P.; Li, D.; et al. Enrichment characteristics and exploration directions of deep shale gas of Ordovician–Silurian in the Sichuan Basin and its surrounding areas, China. Pet. Explor. Dev. 2022, 49, 744–757. [Google Scholar] [CrossRef]
- Wang, S.; Man, L.; Wang, S.; Wu, L.; Zhu, Y.; Li, Y.; He, Y. Lithofacies types, reservoir characteristics and silica origin of marine shales: A case study of the Wufeng formation–Longmaxi Formation in the Luzhou area, southern Sichuan Basin. Nat. Gas Ind. B 2022, 9, 394–410. [Google Scholar] [CrossRef]
- Melchin, M.J.; Mitchell, C.E.; Holmden, C.; Štorch, P. Environmental changes in the Late Ordovician-early Silurian: Review and new insights from black shales and nitrogen isotopes. Geol. Soc. Am. Bull. 2013, 125, 1635–1670. [Google Scholar] [CrossRef]
- Lazar, O.R.; Bohacs, K.M.; Macquaker, J.H.; Schieber, J.; Demko, T.M. Capturing key attributes of fine-grained sedimentary rocks in outcrops, cores, and thin sections: Nomenclature and description guidelines. J. Sediment. Res. 2015, 85, 230–246. [Google Scholar] [CrossRef]
- Loucks, R.G.; Reed, R.M.; Ruppel, S.C.; Hammes, U. Spectrum of pore types and networks in mudrocks and a descriptive classification for matrix-related mudrock pores. AAPG Bull. 2012, 96, 1071–1098. [Google Scholar] [CrossRef]
- Liu, J.; Yao, Y.; Liu, D.; Pan, Z.; Cai, Y. Comparison of Three Key Marine Shale Reservoirs in the Southeastern Margin of the Sichuan Basin, SW China. Minerals 2017, 7, 179. [Google Scholar] [CrossRef]
- Rouquerol, J.; Avnir, D.; Fairbridge, C.; Everett, D.; Haynes, J.; Pernicone, N.; Ramsay, J.; Sing, K.; Unger, K. Physical chemistry division commission on colloid and surface chemistry, subcommittee on characterization of porous solids: Recommendations for the characterization of porous solids. Pure Appl. Chem. 1994, 66, 1739–1758. [Google Scholar] [CrossRef]
- Labani, M.M.; Rezaee, R.; Saeedi, A.; Hinai, A.A. Evaluation of pore size spectrum of gas shale reservoirs using low pressure nitrogen adsorption, gas expansion and mercury porosimetry: A case study from the Perth and Canning Basins, Western Australia. J. Pet. Sci. Eng. 2013, 112, 7–16. [Google Scholar] [CrossRef]
- Han, Y.; Kwak, D.; Choi, S.Q.; Shin, C.; Lee, Y.; Kim, H. Pore Structure Characterization of Shale Using Gas Physisorption: Effect of Chemical Compositions. Minerals 2017, 7, 66. [Google Scholar] [CrossRef]
- Do, D.; Do, H. Pore characterization of carbonaceous materials by DFT and GCMC simulations: A review. Adsorpt. Sci. Technol. 2003, 21, 389–423. [Google Scholar] [CrossRef]
- Liu, J.-Y.; Qiu, Z.; Huang, W.-A.; Luo, Y.; Song, D. Nano-pore structure characterization of shales using gas adsorption and mercury intrusion techniques. J. Chem. Pharm. Res. 2014, 6, 850–857. [Google Scholar]
- Bustin, R.M.; Bustin, A.M.; Cui, X.; Ross, D.; Pathi, V.M. Impact of shale properties on pore structure and storage characteristics. In SPE Shale Gas Production Conference; SPE: Richardson, TX, USA, 2008; SPE-119892-MS. [Google Scholar]
- Brunauer, S.; Deming, L.S.; Deming, W.E.; Teller, E. On a theory of the van der Waals adsorption of gases. J. Am. Chem. Soc. 1940, 62, 1723–1732. [Google Scholar] [CrossRef]
- Kuila, U.; Prasad, M. Specific surface area and pore-size distribution in clays and shales. Geophys. Prospect. 2013, 61, 341–362. [Google Scholar] [CrossRef]
- Groen, J.C.; Peffer, L.A.; Pérez-Ramírez, J. Pore size determination in modified micro-and mesoporous materials. Pitfalls and limitations in gas adsorption data analysis. Micropor. Mesopor. Mater. 2003, 60, 1–17. [Google Scholar] [CrossRef]
- Li, T.; Tian, H.; Chen, J.; Cheng, L. Application of low pressure gas adsorption to the characterization of pore size distribution of shales: An example from Southeastern Chongqing area, China. J. Nat. Gas Geosci. 2016, 1, 221–230. [Google Scholar] [CrossRef]
- Burgess, C.G.; Everett, D.H.; Nuttall, S. Adsorption hysteresis in porous materials. Pure Appl. Chem. 1989, 61, 1845–1852. [Google Scholar] [CrossRef]
- Ding, C.; He, J.; Wu, H.; Zhang, X. Nanometer Pore Structure Characterization of Taiyuan Formation Shale in the Lin-Xing Area Based on Nitrogen Adsorption Experiments. Minerals 2021, 11, 298. [Google Scholar] [CrossRef]
- Liu, K.; Ostadhassan, M.; Sun, L.; Zou, J.; Yuan, Y.; Gentzis, T.; Zhang, Y.; Carvajal-Ortiz, H.; Rezaee, R. A comprehensive pore structure study of the Bakken Shale with SANS, N2 adsorption and mercury intrusion. Fuel 2019, 245, 274–285. [Google Scholar] [CrossRef]
- Caineng, Z.; Dazhong, D.; Yuman, W.; Xinjing, L.; Huang, J.; Shufang, W.; Quanzhong, G.; Zhang, C.; Hongyan, W.; Honglin, L. Shale gas in China: Characteristics, challenges and prospects (I). Pet. Explor. Dev. 2015, 42, 753–767. [Google Scholar]
- Wang, K. Enrichment characteristics of deep shale gas in tectonically complex regions of the southeastern sichuan basin, China. J. Nat. Gas Geosci. 2023, 8, 187–200. [Google Scholar] [CrossRef]
- Wang, Y.; Dong, D.; Li, X.; Huang, J.; Wang, S.; Wu, W. Stratigraphic sequence and sedimentary characteristics of Lower Silurian Longmaxi Formation in Sichuan Basin and its peripheral areas. Nat. Gas Ind. B 2015, 2, 222–232. [Google Scholar] [CrossRef]
- Tang, X.; Jiang, S.; Jiang, Z.; Li, Z.; He, Z.; Long, S.; Zhu, D. Heterogeneity of Paleozoic Wufeng-Longmaxi formation shale and its effects on the shale gas accumulation in the Upper Yangtze Region, China. Fuel 2019, 239, 387–402. [Google Scholar] [CrossRef]
- Liu, Z.C.; Li, H.J.; Zhang, X.X.; Fang, K.; Luo, P.; Zhu, H.H. Distribution and evolution of sedimentary facies of the Lower Silurian Longmaxi Formation in southern Sichuan and northern Guizhou area. Sediment. Geol. Tethyan Geol. 2021, 41, 436–445. [Google Scholar]
- Wang, Y.; Liu, L.; Zheng, S.; Luo, Z.; Sheng, Y.; Wang, X. Full-scale pore structure and its controlling factors of the Wufeng-Longmaxi shale, southern Sichuan Basin, China: Implications for pore evolution of highly overmature marine shale. J. Nat. Gas Sci. Eng. 2019, 67, 134–146. [Google Scholar] [CrossRef]
- Kong, L.; Wan, M.; Yan, Y.; Zou, C.; Liu, W.; Tian, C.; Yi, L.; Zhang, J. Reservoir diagenesis research of Silurian Longmaxi Formation in Sichuan Basin, China. J. Nat. Gas Geosci. 2016, 1, 203–211. [Google Scholar] [CrossRef]
- He, B.; Xu, Y.; Xiao, L.; Wang, K.; Sha, S. Generation and spatial distribution of the Emeishan large igneous province: New evidence from stratigraphic records. Acta Geol. Sin. Chin. Ed. 2003, 77, 194–202. [Google Scholar]
- Li, Y.; Li, M.; Zhang, J.; Pang, Q.; Zou, C.; Shu, H.; Wang, G. Influence of the Emeishan basalt eruption on shale gas enrichment: A case study of shale from Wufeng-Longmaxi formations in northern Yunnan and Guizhou provinces. Fuel 2020, 282, 118835. [Google Scholar] [CrossRef]
- Yang, W.; Wang, Y.; Du, W.; Song, Y.; Jiang, Z.; Wang, Q.; Xu, L.; Zhao, F.; Chen, Y.; Shi, F.; et al. Behavior of organic matter-hosted pores within shale gas reservoirs in response to differential tectonic deformation: Potential mechanisms and innovative conceptual models. J. Nat. Gas Sci. Eng. 2022, 102, 104571. [Google Scholar] [CrossRef]
- Liang, X.; Xu, J.; Wang, Y.; Fang, X.; Zhao, L.; Wu, Y.; Deng, B. The shale gas enrichment factors of Longmaxi Formation under gradient basin-mountain boundary in South Sichuan Basin: Tectono-depositional differentiation and discrepant evolution. Chin. J. Geol. 2021, 56, 60–81. [Google Scholar]
- Wu, J.F.; Zhao, S.X.; Fan, C.H.; Xia, Z.Q.; Zhang, C.L.; Cao, L.Y. Fracture characteristics of the Longmaxi Formation shale and its relationship with gas-bearing properties in Changning area, southern Sichuan. Acta Pet. Sin. 2021, 42, 428–446. [Google Scholar]


Disclaimer/Publisher’s Note: The statements, opinions and data contained in all publications are solely those of the individual author(s) and contributor(s) and not of MDPI and/or the editor(s). MDPI and/or the editor(s) disclaim responsibility for any injury to people or property resulting from any ideas, methods, instructions or products referred to in the content. |
© 2023 by the authors. Licensee MDPI, Basel, Switzerland. This article is an open access article distributed under the terms and conditions of the Creative Commons Attribution (CC BY) license (https://creativecommons.org/licenses/by/4.0/).