Abstract
In this work, authigenic microbial mineral formation in groundwater near the uranium sludge storage at SC Chepetsky Mechanical Plant (ChMP) (Glazov, Russia) was analysed in field and laboratory experiments using thermodynamic modelling when the microbial community was activated by a mixture of acetate, glucose and whey. It was found that the mineral basis of the barrier consisted of aggregated soil particles with freshly deposited phases of carbonate and sulphide minerals of different degrees of crystallinity. An important factor in the formation of calcium phases is microbial denitrification, which is accompanied by an increase in pH values of the medium. The main factors of uranium immobilisation in the biogeochemical barrier were revealed, including its reduction to insoluble forms of uranium dioxide, adsorption on ferrous and sulphide-ferrous minerals, as well as the formation of phosphate phases through the addition of phosphorus-containing whey and co-precipitation or co-crystallisation in calcite phases.
1. Introduction
Low-active radioactive waste (LRW) disposal in open storage pools at uranium ore production and processing facilities is currently considered unsafe, as evidenced by more than 50 years of experience in the use of such storage facilities in Russia [1,2] and worldwide [2,3,4]. Since the middle of the 20th century, uranium-bearing sludge has been stored in the presence of a high levels of carbonate, nitrate, sulfate calcium and ferruginous mineral phases [1,2]. One of the important problems remaining after the conservation of such repositories is the complex contamination of underground aquifers of water-soluble waste components (nitrates, ammonium, sulphates, carbonates, uranium and heavy metals, such as iron) [5,6,7,8] due to violation of the integrity of engineering safety barriers. This leads to the uncontrolled migration of pollutants and creates risks of polluting different water supply sources. An important problem with complex groundwater contamination is the increased risks of migration of highly toxic components, primarily uranyl ions, against the background of significant concentrations of nitrate, sulphate and carbonate ions [9,10,11,12,13].
One way to prevent the migration of components in groundwater is the creation of impermeable barriers of the “wall-in-soil” type. However, implementing this method is a complex and expensive process. Moreover, its effectiveness depends on the hydrodynamic and geological parameters of the formation [14,15]. Reactive barriers are the most effective and least resource-consuming solution [16]. One variant of reactive barriers is microbiological, which involves injecting inexpensive soluble substrates to activate the indigenous microbial community [17,18,19]. The latter is most effective for the removal of nitrogen compounds, as well as uranium, organic contaminants and other elements. This technology is well established and has been actively used worldwide for several decades at nuclear fuel cycle facilities [20,21,22,23,24,25,26]. As a result of microbial activity, significant changes in environmental conditions can occur, leading to changes in the solubility and migration properties of microcomponents. The biogenic formation of authigenic minerals forms a kind of biogeochemical barrier in the aquifer, preventing the migration of soluble components and the removal of nitrogen-containing compounds in gaseous forms.
The addition of different components, such as phosphate or iron, to injected solutions may result in the formation of a complex mineral biogeochemical barrier for uranium and other metals [27,28]. Authigenic mineral formation is a rather effective way to reduce the amount of polluting elements in groundwater by their precipitation and subsequent crystallisation [20,29,30]. One of the important microbial processes for barrier formation is sulphate reduction, which ensures the formation of sulphide iron and manganese phases (troillite, pyrite, pyrrhotite and mackinawite) [31,32,33,34], which have reducing and sorption capacity for uranium and other metals [35,36]. Another process contributing to the formation of authigenic phases is the microbial reduction of iron, which contributes to the dissolution of a number of minerals (hematite, etc.) and the formation of new mineral phases of reduced iron (siderite or iron oxides) [37,38,39]. The microbial or abiotic oxidation of reduced iron leads to the formation of iron oxide hydroxide phases, which have a high immobilisation capacity for uranium [40]. Another of the important processes is the formation of carbonate phases of iron, calcium and manganese magnesium formed by carbon dioxide formation during microbial respiration [41,42,43]. It is important to note that the processes of biogenic mineral formation primarily take place in anaerobic conditions, and their intensification requires the preliminary removal of oxygen and nitrate ions due to the oxidation of organic substances.
In this paper, we evaluated biogenic mineral formation during microbial community activation by sugar and acetate using the uranium ore processing and uranium fuel preparation enterprise SC Chepetsky Mechanical Plant ChMP (Glazov, Russia) (http://www.chmz.net/en/) as an example in laboratory and field experiments. Previously, we analysed the microbial diversity of several groundwater samples with different levels of pollution. It was found that groundwater contains a physiologically diverse microbial community dominated by nitrogen cycle microorganisms, including denitrifying, nitrifying and anammox bacteria [44,45]. In the samples with high levels of ammonium, nitrate and sulfate pollution, bacteria of the genera Rhizobiaceae, Moraxellaceae, Oxalobacteraceae, Corynebacteriaceae, Xanthomonadaceae, Rhodobacteraceae, Alcaligenaceae and Pseudomonadaceae, capable of reducing nitrate, were found. Additionally, sulfate-reducing bacteria of the genus Desulfovibrionaceae were also found.
It is important to note that significant microbial diversity is observed in samples with extremely high nitrogen load, containing up to 500 mg/L ammonium and 10,000 mg/L nitrate ions. Thus, there are prerequisites for the use of the nitrogen bioremediation method for groundwater in zones with different levels of anthropogenic pollution. It was also found that the microbial community in groundwater can remain active at temperatures up to 8–10 °C and facilitate nitrogen removal during its growth in the form of biofilms on the surface of rocks that are characteristic of the aquifer.
2. Materials and Methods
2.1. Materials
This research was carried out using water and soil samples taken from wells in the upper aquifer in the area of the SC Chepetsky Mechanical Plant tailings, collected from a depth of 14 m. The samples were taken in sterile 1.5 L plastic bottles without a gas phase. The samples were hermetically sealed and stored at a temperature of +4 °C in a refrigerator. A description of the samples is given in Section 3.1. The pH, Eh and conductometry values were determined at the time of sampling. After each sample was collected, sequential filtration of the samples was carried out using syringe filter attachments and cellulose acetate membranes with pore sizes of 2.4, 1.2, 0.45, 0.22, 0.1 and 0.05 μm.
2.2. Laboratory Experiment
The biogenic transformation of soil samples was carried out by incubating 2.5 g of the sample in hermetically sealed 50 mL vials with groundwater samples as the liquid phase with the addition of 2.5 g/L (in equal proportions by weight) of sugar, sodium acetate and milk whey (Agroprommilksbyt Ltd., Utyatinka, Novgorod region, Russia) (100,000 mg/mL COD) for 90 days. The samples were taken in a nitrogen atmosphere on days 10, 20, 30, 40, 60 and 90 for liquid phase analysis.
All experiments were conducted in triplicate. All the chemicals used were of high purity grades from Sigma Aldrich (Darmstadt, Germany).
2.3. Field Experiment
For the field experiment, 10 m3 of pre-selected formation water with sugar and acetate additives at concentrations similar to the laboratory experiment was injected into the formation water. Sampling was carried out after 3 months. Sterile vials were used, and filtration was carried out using syringe filter attachments and cellulose acetate membranes with pore sizes of 2.4, 1.2, 0.45, 0.22, 0.1 and 0.05 μm. In the filtrate, the content of the main macrocomponents and uranium was determined. The composition of the precipitate on the filters was evaluated using scanning electron microscopy.
2.4. Methods of Analysis
An X-ray diffraction (XRD) analysis was carried out using a Panalytical Aeris (Malvern, United Kingdom, https://www.malvernpanalytical.com/en) powder X-ray diffractometer with a Cu Kα anode at 40 kV and 15 mA at the Shared Use Center, Institute of Physical Chemistry and Electrochemistry, Russian Academy of Sciences. For the XRD analysis, after drying, the samples were ground in a corundum mortar to a powder state. The sample was taken from 2° to 65° 2θ in 0.002 increments and a ¼ rad slit. The obtained results were interpreted using the HighScore Plus program (https://www.malvernpanalytical.com/en/products/category/software/x-ray-diffraction-software/highscore-with-plus-option) with the PDF2 database (https://www.icdd.com/pdf-2/). The total amount of clay fraction was estimated using the Rietveld method in an air-dried sample ground in a corundum mortar to a powder state. Montmorillonite, illite and kaolinite in the clay fraction were identified by their characteristic peaks (according to the Clay Mineral Identification Flow Diagram, https://pubs.usgs.gov/of/2001/of01-041/htmldocs/flow/index.htm) in oriented samples.
Scanning electron microscopy (SEM) was carried out using a TESCAN MIRA3 scanning electron microscope (Brno, Czechia, https://www.tescan.com/) from the Joint Use Center, Vernadsky Institute of Geochemistry and Analytical Chemistry, Russian Academy of Sciences. Before conducting scanning electron microscopy and the XRD analysis, the samples were removed from the liquid medium and dried at room temperature in a nitrogen glove box to a constant temperature. For the SEM analysis, the samples were placed on an aluminum holder using electrically conductive tape, and vacuum carbon deposition was performed using Q150T E Plus (https://www.quorumtech.com/q150t-turbo-pumped-sputter-coatercarbon-coater/), with a vacuum of 4−3 Pa and a current of 50 A. The samples were taken in two modes: SE and BSE, both at a voltage of 20 kV and a current of 50 A.
The concentrations of the elements in the water samples were analyzed immediately after sample collection and filtration through a 0.45 µm glass filter using Inductively Coupled Plasma Mass Spectrometry (ICP-MS) X Series2 (Thermo Fisher Scientific, Waltham, MA, USA https://www.fishersci.com/shop/products/icap-6500duoview-icp-oes-spect/NC1982295) and Inductively Coupled Plasma-Atomic Emission Spectroscopy (ICP-AES) iCAP6500 (Thermo Fisher Scientific, Waltham, MA, USA https://www.fishersci.com/shop/products/icap-6500duoview-icp-oes-spect/NC1982295).
The anion and cation concentrations were measured using a capillary gel electrophoresis system (Capel-105M, LUMEX Instruments, Sact-Peterburg, Russia https://www.lumexinstruments.com/catalog/capillary-electrophoresis/capel-105m.php).
Determination of the Eh and pH values was carried out using an ANION-4100 pH meter/ionomer (Novosibirsk, Russia, http://www.anion.nsk.su/) with an electrode combination vs Ag/AgCl electrode.
Geochemical thermodynamic modelling was estimated using PhreeqC 2.18 software (Reston, Virginia, USA) [46]. The saturation indices (SI) were determined as follows:
where IAP is the product of the activities of the corresponding ions and Ks is the equilibrium constant.
SI = logIAP − logKs,
If SI > 0, the formation of the investigated phase was predicted. The thermodynamic database llnl.dat was used for modelling.
3. Results
3.1. Description of Water and Soil Samples
Table 1 shows the composition of the sample that was used in the laboratory experiment. The well from which the sample was taken was used for the field experiment. High concentrations of nitrate ions (reaching almost 10 g/L) were found in the sample, indicating the high oxidising potential of the medium. In addition, high levels of ammonium, nitrite and sulphate ions were noted. The technogenic impact of the storage facility also lead to an increase in the levels of calcium, chlorine, molybdenum and uranium. There was a deficiency of phosphorus and organic carbon, both of which are necessary for the intensive biological processes of denitrification and sulphate reduction. The high levels of nitrite ions may indicate the possibility of anammox processes, which contribute to the removal of ammonium ions. The total iron in the samples (5.8 mg/L) may contribute to the microbial processes of mineral formation due to the activity of lithotrophic iron-reducing and iron-oxidising bacteria.

Table 1.
a. Parameters and concentrations of the main components in groundwater samples, mg/L; b. Concentration of trace elements in groundwater samples, mg/L.
Table 2 shows the elemental composition of the rock. The studied rock was a sandy loam with the following mineral composition: quartz—73%–78%, plagioclases—2%–5% and potassium feldspars—7%–10%. The clay fraction comprised up to 10%–15%, with montmorillonite being the predominant phase. The content of iron was 1.8 wt%, which indicates the presence of various forms of iron available for microbial processes and the possibility of their microbial transformation. The content of illite and kaolinite was less than 2%–3%. Sulphur content below the detection limit of the instrument indicates predominantly oxide or carbonate forms of iron. The presence of magnesium was most likely due to the presence of the Ca-Mg form of montmorillonite in the mineral composition. Ti and Mn were found in the sample in insignificant quantities, which could be present both as impurities and in the form of separate mineral phases (e.g., in the form of rutile and ilmenite).
Table 2.
Elemental composition of soil, mass%.
3.2. Laboratory Modelling Results
3.2.1. Changes in Solution Composition
Table 3 shows the data regarding changes in the values of Eh and basic anions in the water sample in the laboratory experiment after the addition of sugar and acetate. It is important to note that the Eh values over the course of the experiment, after 30 days, moved to the anaerobic region due to active nitrate reduction and the consumption of residual oxygen. By 40 days, their values became optimal for anaerobic sulfate-reduction processes. The concentration of nitrate ions decreased after 10 days of the experiment, and by 90 days, reached the value of 12 mg/L, which is lower than the values of maximum permissible concentration (MPC) for drinking water (45 mg/L for Russian Federation). The pH values increased to 8.2 after 40 days due to the denitrification process. It is important to note that, in the solution during the initial 40 days, there was an increase in the concentration of iron due to its anaerobic dissolution, and in the period of 60–90 days, the concentration of iron decreased due to its precipitation in the form of sulphide phases during the process of sulphate reduction. In the first 20 days of the experiment, we observed a significant increase in the concentration of hydrocarbonates in the medium due to the microbial oxidation of organic substances, but by 30 days, the concentration of hydrocarbonates began to decrease due to the formation of carbonate phases.
Table 3.
pH, Eh values (mV) and concentrations of major cations (mg/L) in the groundwater samples during the laboratory experiment.
3.2.2. Changes in Sandy Loam Composition
Based on the XRD data, no significant changes in the sample composition could be recorded. The elemental composition of the rock before and after microbial processes is shown in Figure 1. The decrease in Si and Al indicates the destruction of aluminosilicates. The comparatively lower change in aluminium content was probably due to the higher stability of Si in colloidal form in solution. This may also be evidenced by the decreases in Na and K concentration. The significant increase in Ca content may be a consequence of this process and may be due to the precipitation of Ca in the form of biogenic calcite, whereas the increase in Mg may indicate the formation of biogenic dolomite due to CO2 release during microbial respiration. The loss of iron in the sample can be attributed to the activity of iron-reducing bacteria in establishing reducing conditions. The increase of sulphur may be related to the formation of ferruginous-sulphide phases due to the microbial reduction of sulphate.
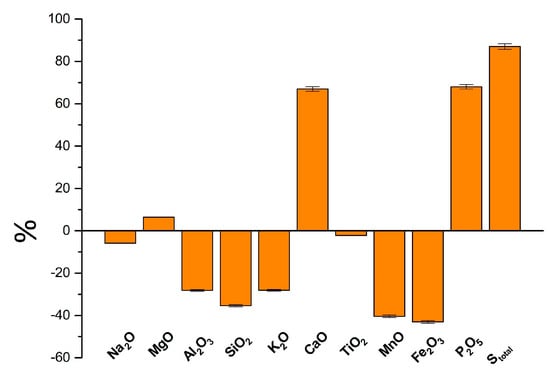
Figure 1.
Changes in elemental composition of the sandy loam sample after microbial transformation, % of initial content.
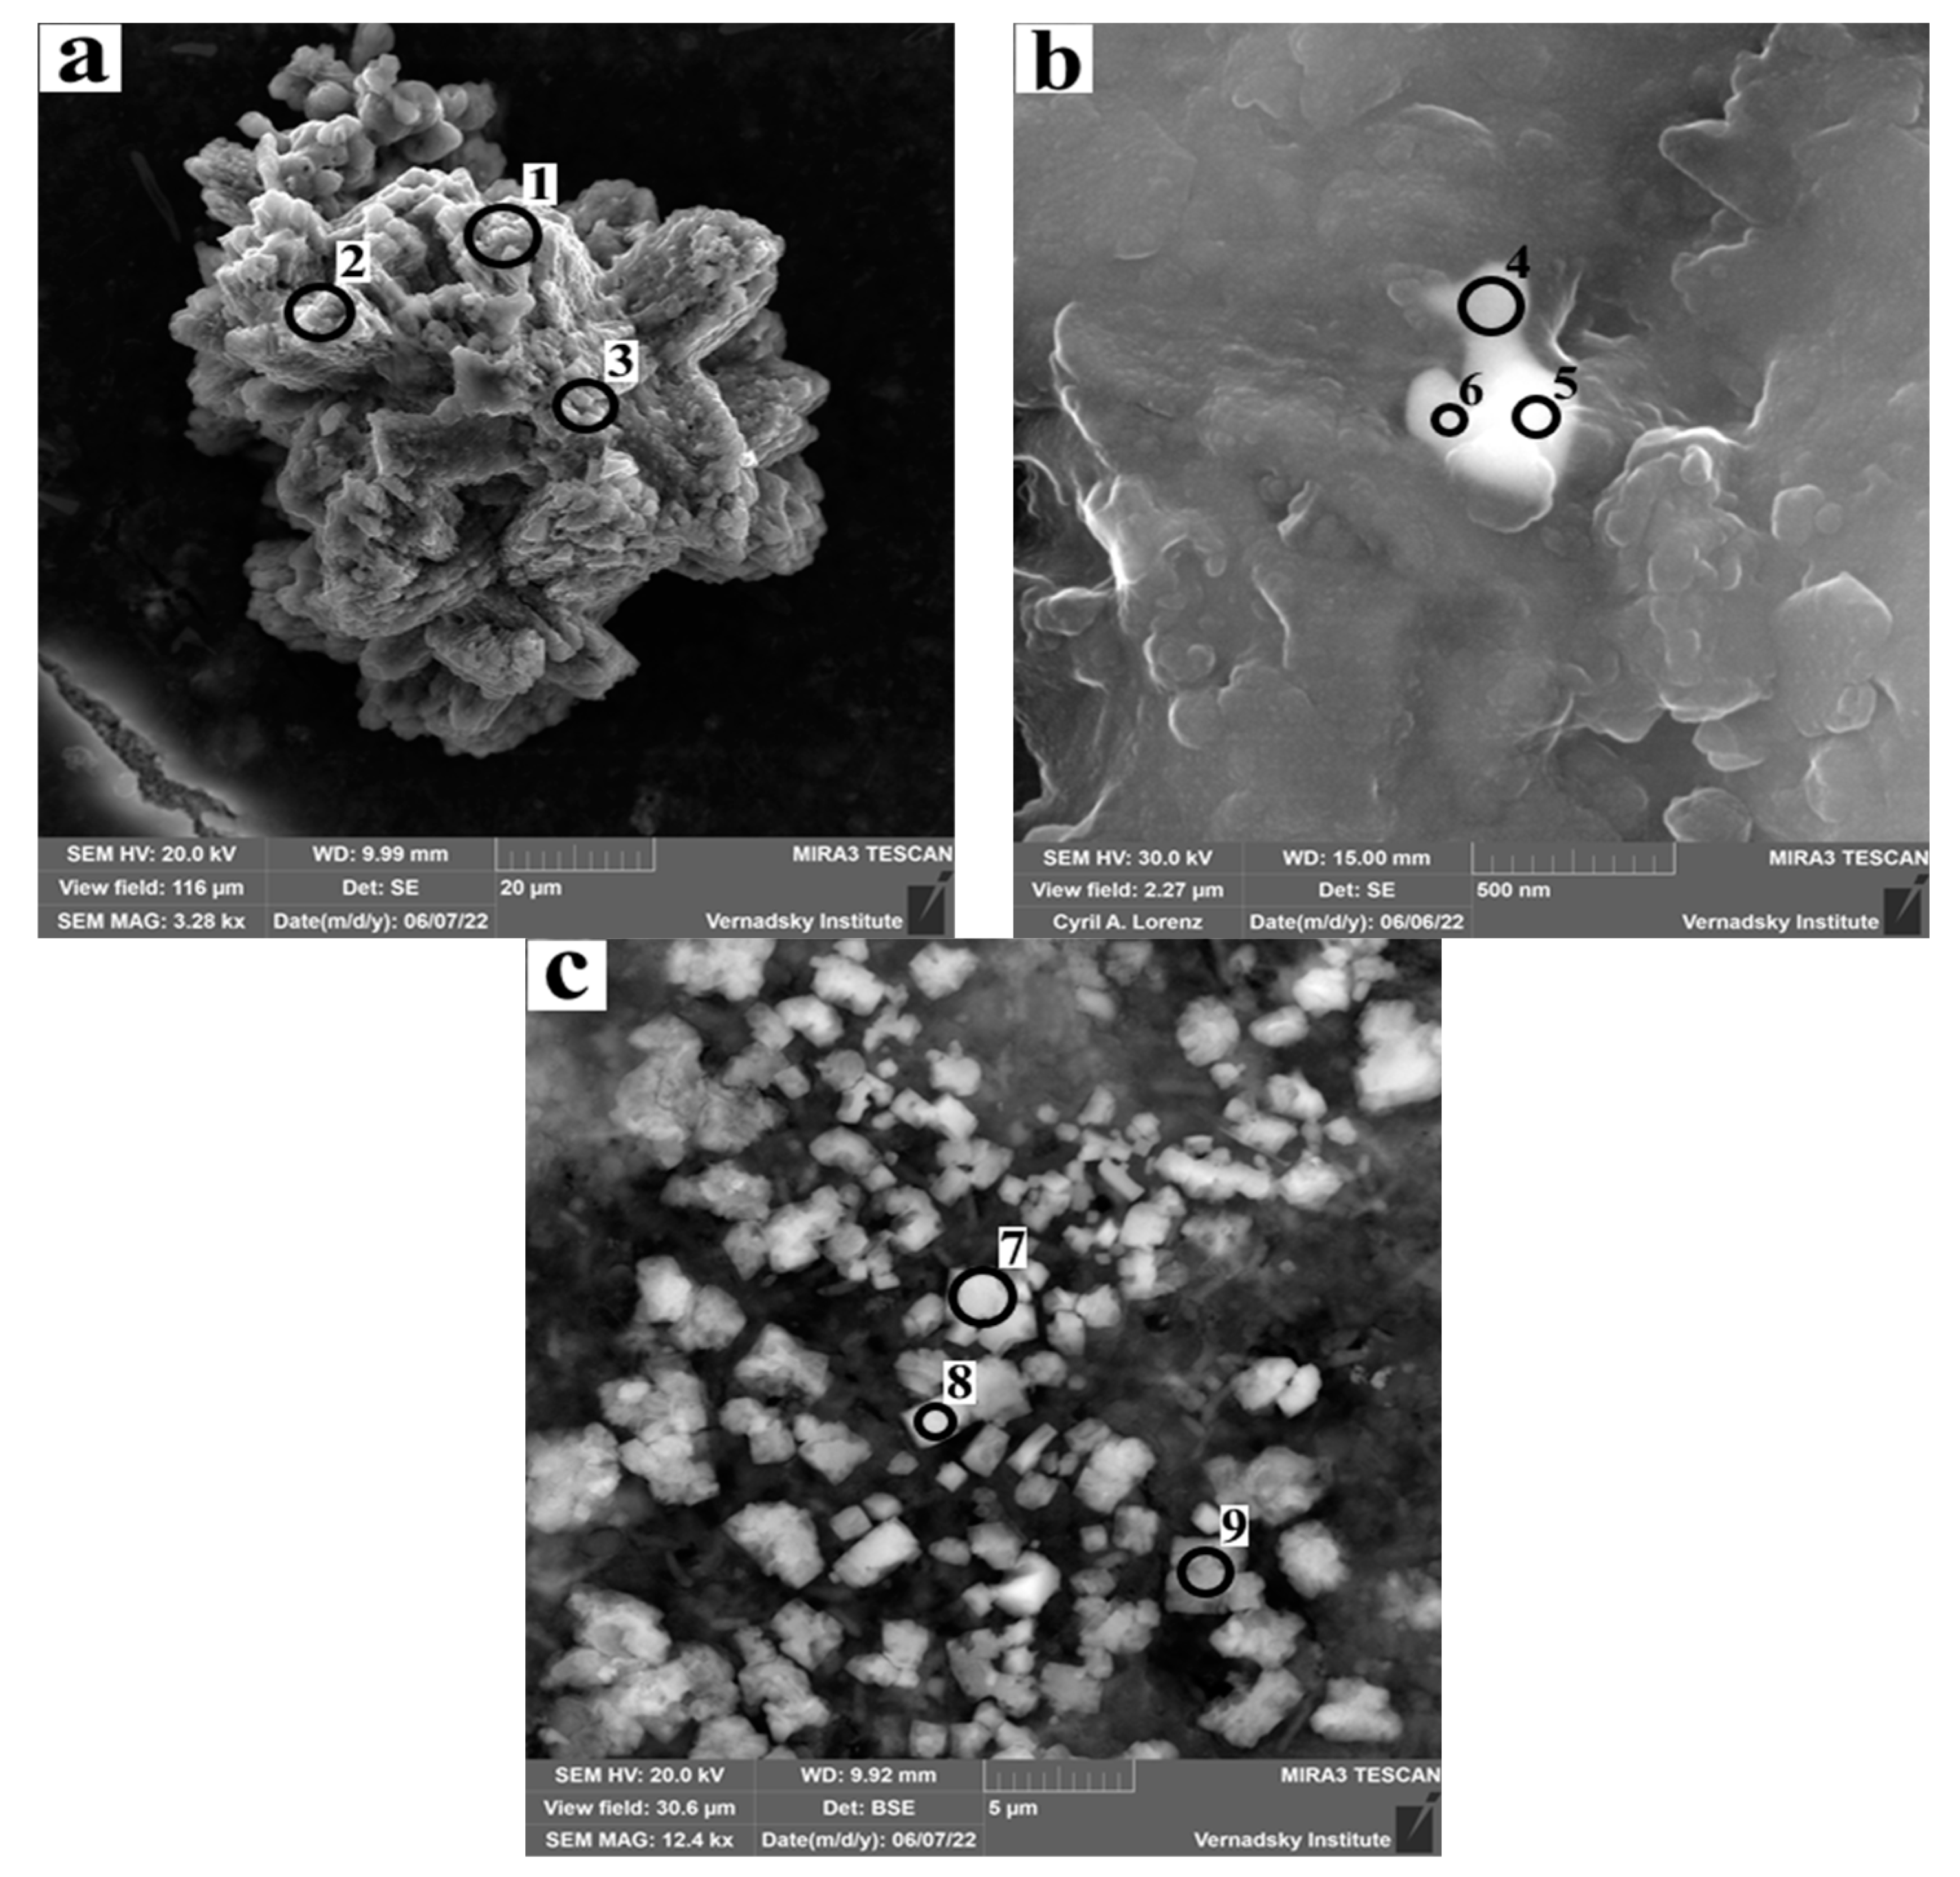
The data regarding changes in the elemental composition of the sandy loam sample generally agreed with the data obtained using X-ray microanalysis (Figure 2, Table 4). Increased calcium and iron content was observed in all samples. The main mineral changes in the sample after microbial transformation are summarised as follows:


Figure 2.
(a–e) Microphotographs of grunt sample after 90 days of microbial activation in the laboratory experiment. The elemental analysis data of the points marked by circles are provided in Table 4.
Table 4.
Elemental composition of points shown in Figure 2 obtained using X-ray microanalysis (normalisation by oxygen at 100%), presented as oxides wt.% (error 0.05%).
- Iron accumulation was observed in almost all analysed spectra in phases containing calcium, sulphur and phosphorous.
- Formation of iron sulphide phases, as a general accumulation of iron and sulphur in Figure 3 (points 7, 8) and Figure 4 (point 12), as well as in the form of separate crystalline phases in Figure 5 (points 14, 15, 16).
 Figure 3. Water sample on day 90 after organic injection in the field experiment.
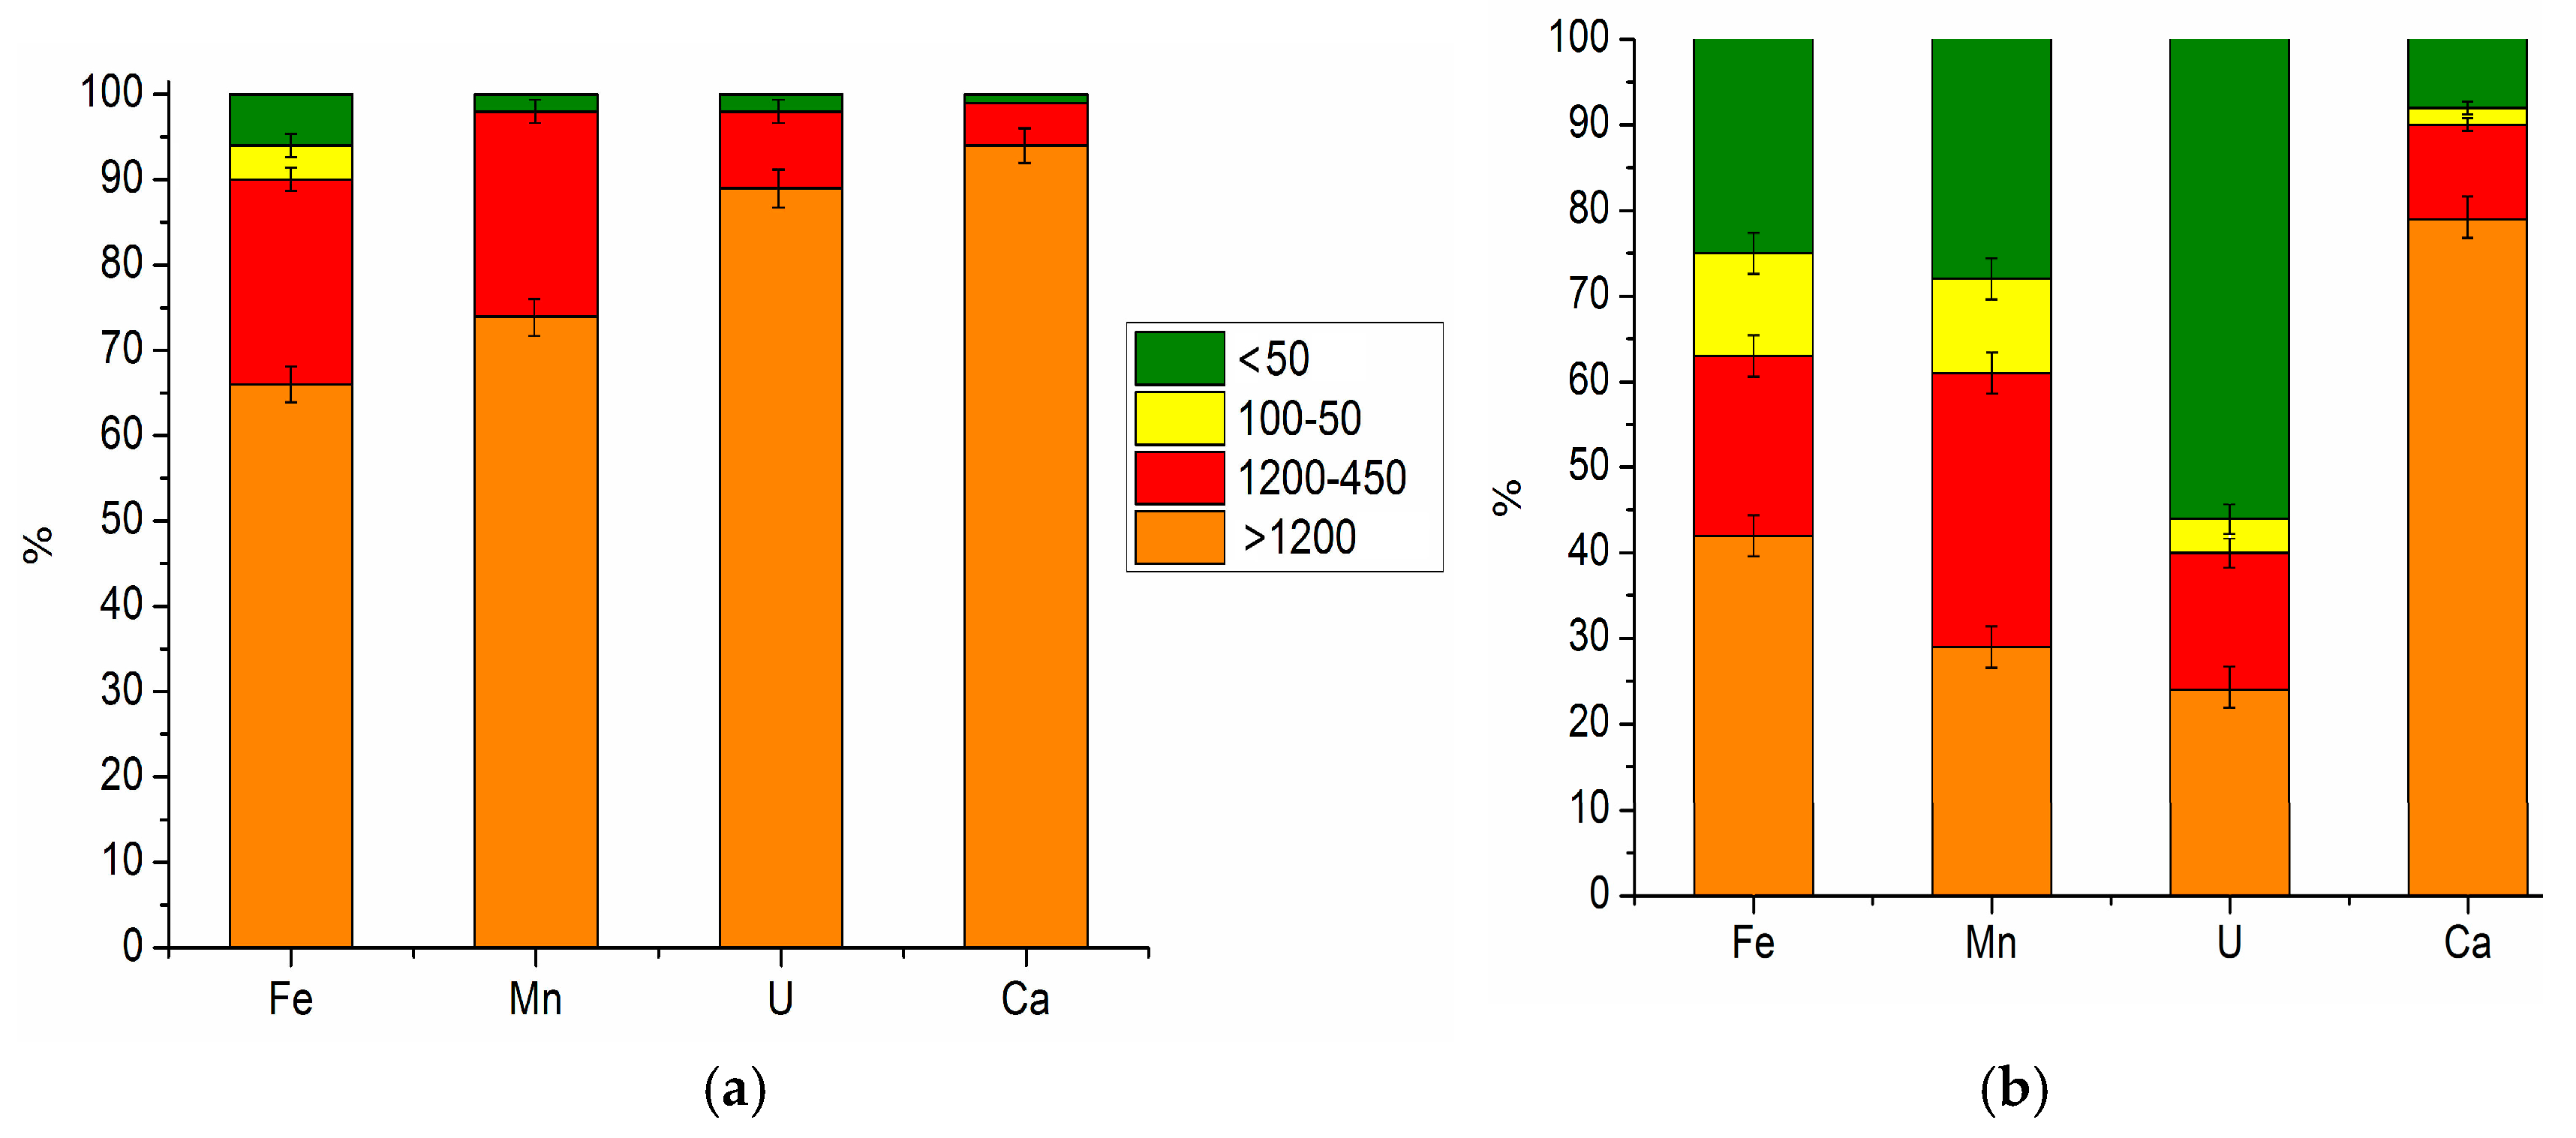
 Figure 4. Normalized distribution of Fe, Mn, U and Ca in filtrates, % before (a) and after (b) microbial processes.
 - Uranium accumulation was observed predominantly in calcium phases, but uranium was also detected in the iron sulphide phase.
- Accumulation of manganese mainly in calcium phases.
Furthermore, due to the microbial process, the mineral particles aggregated into macroparticles bound by the polysaccharide matrix of microbial biofilms. For example, in Figure 4, the aggregation of clays and calcium phosphate (point 10) was observed, and in microphotographs 1 and 2, the aggregation of potassium feldspars (point 2) and clays (point 1) was observed.
3.3. Field Experiment
3.3.1. Changes in Water Parameters
As a result of the field experiment, a significant change in the concentrations of liquid phase components occurred over 3 months (Table 5). Within 10 days, the redox potential value moved to the anaerobic region and reached −196 mV by 90 days. The level of nitrate ions decreased to 4.3 mg/L by 90 days, and the sulphate ion concentration decreased from an initial value of 1392 mg/L to 549 mg/L due to their recovery. After 3 months, the collected samples acquired dark colouration (Figure 3), which is characteristic of iron sulphides. The formation of hydrocarbonates was intensive up to 30 days and reached 492 mg/L. By 90 days, there was a decrease in hydrocarbonate concentration to 351 mg/L due to the formation of carbonate phases. The pH values rose to 8.4 after 90 days due to the denitrification process.
Table 5.
Changes in groundwater parameters after injection of organic matter.
3.3.2. Uranium Distribution in the Water Samples
The cascade filtration of groundwater samples carried out at the site of profiling allowed for the estimation of the main forms of uranium in the leachate (Figure 4) and on the surface of the filters (Figure 5).

Figure 5.
Electron micrographs of filter surfaces with pores of 1200 nm in diameter after water sample filtration (field experiment) with carbonate (a), uranium (b) and sulphide (c) phases. The elemental analysis data of the points marked by circles 1–9 are provided in Table 6.
Table 6.
Composition of phases on the filter (normalisation by oxygen at 100%), presented as oxides wt.% (error 0.05%).
Figure 5.
Electron micrographs of filter surfaces with pores of 1200 nm in diameter after water sample filtration (field experiment) with carbonate (a), uranium (b) and sulphide (c) phases. The elemental analysis data of the points marked by circles 1–9 are provided in Table 6.
In the groundwater sample before microbial activation under oxidising conditions, about 25% of iron and manganese, 55% of uranium and about 10% of Ca were in dissolved or fine-colloidal form. About 40% of Fe, 30% of Mn and 80% of Ca were in the form of coarse particles larger than 1200 nm. After microbial activation, aggregation of the particles was observed, resulting in a decrease in the dissolved or fine-colloidal phase of all elements. Thus, the iron content in this fraction was about 5%, Mn and U were no more than 2% and almost all the Ca moved to the large fraction.
3.3.3. Filter Surface Mineral Phase Description
Minor uranium content could be detected only on the surface of the filter, with a pore size of 1200 nm, by X-ray dispersion analysis. Aluminosilicate particles, iron, some calcium and titanium were present on the surface of the filters with smaller pore sizes. Since the maximum content of calcium, iron and other elements was on the filter with the largest pore size, focus was directed towards the mineral phases on its surface. When its surface was analysed using scanning electron microscopy with X-ray microanalysis, a number of mineral phases of biogenic origin were detected:
- Carbonate phases. Figure 5a shows the biogenic calcium carbonate phase (point 1, 2 and 3).
- Sulphide phases. Phases of biogenic iron sulphide were found in the form of crystallites of rather regular shape (Figure 5c). On the basis of the ratio of sulphur and iron, it is possible to assume that this phase was pyrite (point 7, 8 and 9).
- Uranium phases. In Figure 5b, biogenic phases with uranium (point 4, 5 and 6) are shown.
- The addition of phosphorus-containing whey resulted in the formation of phosphate phases (Figure 5a).
4. Discussion
Therefore, in both field and laboratory experiments, it was determined that the activation of microorganisms by soluble organic substrates mainly results in the formation of carbonate and sulphide mineral phases with different degrees of crystallinity. It is important to note that the addition of milk whey is an important factor for the purification of groundwater because it is a source of the most deficient element (phosphorus). Groundwater also contains calcium, a number of vitamins and the trace elements necessary for the development of microflora. The successful experience of bioremediation using whey has been described in previous research [26,47,48]. The high degree of calcium accumulation in the samples indicates the formation of calcites, which begin to form due to the formation of carbonates during the microbial oxidation of organic matter and due to alkalization of the medium during denitrification [49,50]. During the next stage, after the reduction of the redox potential of the medium, formation of less highly crystalline iron sulphide mineral phases occurs. At the same time, calcite phases are well formed and can serve as centers of crystallization for sulphide phases [51] and promote the accumulation of other elements, such as iron, uranium and manganese [52,53].
Thus, initially high concentrations of nitrates can promote more active mineral formation by maintaining the pH values of the medium within the slightly alkaline range through their microbial consumption. Earlier, we described the process of the formation of strontium and calcium carbonate phases during organotrophic denitrification [54]. This supports the same conclusion about the importance of the process of alkalinization in the reduction of nitrate. In earlier research [44,45], we found organotrophic denitrifying bacteria belonging to the genera Pseudomonas, Arthrobacter and others in groundwater in the sludge storage areas at the ChMP. It is also important to note the role of microbial biofilm in element accumulation and further mineral formation, which is formed on rocks after several days of microorganism development [55,56]. In the presence of microbial biofilms, the formation of calcite usually occurs more actively [57]. As shown in different studies, organotrophic bacteria of the genus Pseudomonas are able to actively produce a polysaccharide matrix [58,59,60], which leads to the increased adsorption of iron, calcium, manganese and uranium onto mineral phases and facilitates their further crystallization [61].
The evolution of mineral formation processes during microbial activation can be presented as follows: at the first stage, there is formation of a polysaccharide matrix, which promotes the accumulation of most metals due to chelation by various organic groups; further, with the oxidation of organic matter, there carbonates accumulate, which gradually form calcite when there is excess calcium (or dolomite with the presence of magnesium in the medium) due to the alkalization of the medium during denitrification. Afterwards, when the redox potential decreases, a cycle of anaerobic processes of sulphate and iron reduction is initiated, favouring the formation of ferruginous and jade-sulphide phases, which are formed in the polysaccharide matrix, against the background of well-formed calcite phases. The reducing conditions also favor the recovery of uranium in the form of U (IV) oxide phases [62]. It is important to note that, with low iron content in the aqueous phase, the formation of sulfide phases occurs, probably due to its reductive dissolution from mineral phases, primarily from clay phases [63].
The possibility of the formation of different mineral phases in the media after microbial activation was calculated using thermodynamic modelling using PREEQC software with the llnl database (Table 7). If SI > 0, the formation of the phase was predicted.
Table 7.
Saturation indices (SI) of different mineral phases before (1) and after (2) microbial processes (PREEQC modeling with the llnl database https://github.com/LLNL/EQ3_6).
Thus, after the microbial removal of nitrate and the reduction of the redox potential in the solutions, the majority of uranium precipitates in the form of a mixture of oxides, such as UO2, and oxides with complex stoichiometry or uraninite particles. According to calculations, microbial processes resulted in the formation of new phases of carbonate (siderite type) and sulphide (pyrite pyrrhotite troilite mackinawite) phases of iron and calcium carbonate. The formation of biogenic ferruginous phases in groundwater is also noted in previous research [64,65,66], where their importance in reducing uranium migration was emphasised [67,68].
The addition of milk whey can lead to the formation of phosphate phases of hydroxyapatite, vitlockite, vivianite and mixed uranium–calcium phosphate otenite [69].
It is important to note that, in the process of formation, the aggregation of suspended particles and soil biogenic mineral phase particles occurs [70,71], which may contribute to the slowing of mass transfer in the aquifer and the establishment of more stable conditions for the formation of a biogeochemical mineral barrier, regardless of the rate of groundwater movement. Previously, we observed the biogenic aggregation of large ferric, calcium and uranium particles in aquifers during bioremediation, which mitigates the risk of colloidal and pseudocolloidal uranium transport in groundwater [70].
5. Conclusions
In conclusion, through field and laboratory experiments, as well as thermodynamic modelling, it was established that the activation of microorganisms with a mixture of sugar, acetate and whey in groundwater leads to the formation of a biogeochemical barrier that promotes nitrate removal and uranium immobilization. The mineral basis of the barrier consists of aggregated soil particles with freshly deposited phases of carbonate and sulphide minerals with different degrees of crystallinity. An important factor in the formation of calcium phases is microbial denitrification, which is accompanied by an increase in the pH values of the medium. In the specific example described in this paper, the nitrate ion content reached 9.8 g/l, and its removal contributed to an increase in pH values up to 8.4, which is optimal for the formation of calcite [71]. When nitrate ion concentrations are lower, the effect of carbonate formation may not be observed. Important factors in the immobilization of uranium within the biogeochemical barrier include its reduction, which occurs as the redox potential decreases, resulting in the formation of insoluble forms of uranium dioxide. Additionally, uranium can be adsorbed onto ferruginous and sulphide-iron minerals. Moreover, the addition of phosphorus-containing whey can lead to the formation of phosphate phases, and uranium my undergo co-precipitation or co-crystallization in calcite phases. The formation of a biogeochemical barrier in groundwater also contributes to reducing the risk of the migration of colloidal and pseudocolloidal forms of uranium due to the aggregation of suspended uranium and ferruginous clay particles.
Author Contributions
Conceptualization, A.S.; methodology, A.S.; validation, A.S. and G.A.; formal analysis, G.A.; investigation, A.S. and G.A.; data curation, A.S.; writing—original draft preparation, A.S. and G.A.; writing—review and editing, A.S. and G.A.; visualization, G.A.; supervision, A.S.; project administration, A.S.; funding acquisition, A.S. All authors have read and agreed to the published version of the manuscript.
Funding
This work was supported by state assignments from The Ministry of Science and Higher Education of the Russian Federation (#AAAA-A16-11611091001) and utilised equipment from the Core Facilities Center of IPCE RAS (CKP FMI IPCE RAS).
Data Availability Statement
Not applicable.
Conflicts of Interest
The authors declare no conflict of interest.
References
- Gaskova, O.L.; Boguslavsky, A.E.; Shemelina, O.V. Uranium release from contaminated sludge materials and uptake by subsurface sediments: Experimental study and thermodynamic modeling. Appl. Geochem. 2015, 55, 152–159. [Google Scholar] [CrossRef]
- Glinsky, M.; Vetrov, V.; Abramov, A.; Chertkov, L. Impact of Nuclear Enterprises on the Subsoil. In Subsoil Monitoring at Nuclear Industry Enterprises: Foundations and Case Studies; Springer International Publishing: New York, NY, USA, 2021. [Google Scholar] [CrossRef]
- Liu, B.; Peng, T.; Sun, H.; Yue, H. Release behavior of uranium in uranium mill tailings under environmental conditions. J. Environ. Radioact. 2017, 171, 160–168. [Google Scholar] [CrossRef] [PubMed]
- Harries, J.; Levins, D.; Ring, B.; Zuk, W. Management of waste from uranium mining and milling in Australia. Nucl. Eng. Des. 1997, 176, 15–21. [Google Scholar] [CrossRef]
- Boguslavsky, A.; Shvartseva, O.; Popova, N.; Safonov, A. Biogeochemical In Situ Barriers in the Aquifers near Uranium Sludge Storages. Water 2023, 15, 3020. [Google Scholar] [CrossRef]
- Al-Hashimi, O.; Hashim, K.; Loffill, E.; Čebašek, T.M.; Nakouti, I.; Faisal, A.A.H.; Al-Ansari, N. A Comprehensive Review for Groundwater Contamination and Remediation: Occurrence, Migration and Adsorption Modelling. Molecules 2021, 26, 5913. [Google Scholar] [CrossRef]
- Zachara, J.M.; Long, P.E.; Bargar, J.; Davis, J.A.; Fox, P.; Fredrickson, J.K.; Freshley, M.D.; Konopka, A.E.; Liu, C.; McKinley, J.P.; et al. Persistence of uranium groundwater plumes: Contrasting mechanisms at two DOE sites in the groundwater–river interaction zone. J. Contam. Hydrol. 2013, 147, 45–72. [Google Scholar] [CrossRef]
- Safonov, A.V.; Boguslavsky, A.E.; Gaskova, O.L.; Boldyrev, K.A.; Shvartseva, O.S.; Khvashchevskaya, A.A.; Popova, N.M. Biogeochemical Modelling of Uranium Immobilization and Aquifer Remediation Strategies Near NCCP Sludge Storage Facilities. Appl. Sci. 2021, 11, 2875. [Google Scholar] [CrossRef]
- Finneran, K.T.; Housewright, M.E.; Lovley, D.R. Multiple influences of nitrate on uranium solubility during bioremediation of uranium-contaminated subsurface sediments. Environ. Microbiol. 2002, 4, 510–516. [Google Scholar] [CrossRef]
- Westrop, J.P.; Yadav, P.; Nolan, P.; Campbell, K.M.; Singh, R.; Bone, S.E.; Chan, A.H.; Kohtz, A.J.; Pan, D.; Healy, O.; et al. Nitrate-Stimulated Release of Naturally Occurring Sedimentary Uranium. Environ. Sci. Technol. 2023, 57, 4354–4366. [Google Scholar] [CrossRef]
- Malov, A. Estimation of uranium migration parameters in sandstone aquifers. J. Environ. Radioact. 2016, 153, 61–67. [Google Scholar] [CrossRef]
- Nolan, P.; Bone, S.E.; Campbell, K.M.; Pan, D.; Healy, O.M.; Stange, M.; Bargar, J.R.; Weber, K.A. Uranium(VI) attenuation in a carbonate-bearing oxic alluvial aquifer. J. Hazard. Mater. 2021, 412, 125089. [Google Scholar] [CrossRef] [PubMed]
- Hennig, T.; Kühn, M. Potential Uranium Migration within the Geochemical Gradient of the Opalinus Clay System at the Mont Terri. Minerals 2021, 11, 1087. [Google Scholar] [CrossRef]
- Dinis, M.d.L.; Fiúza, A. Mitigation of Uranium Mining Impacts—A Review on Groundwater Remediation Technologies. Geosciences 2021, 11, 250. [Google Scholar] [CrossRef]
- Malkovsky, V.I.; Miroshnikov, A.Y.; Yudintsev, S.V. Remediation of old subsurface repositories of radioactive waste, Russia: Efficiency analysis. Environ. Earth Sci. 2020, 79, 37. [Google Scholar] [CrossRef]
- Mays, D.C.; Scheibe, T.D. Groundwater Contamination, Subsurface Processes, and Remediation Methods: Overview of the Special Issue of Water on Groundwater Contamination and Remediation. Water 2018, 10, 1708. [Google Scholar] [CrossRef]
- Gavrilescu, M.; Pavel, L.V.; Cretescu, I. Characterization and remediation of soils contaminated with uranium. J. Hazard. Mater. 2009, 163, 475–510. [Google Scholar] [CrossRef]
- Putilina, V.S.; Yuganova, T.I. The Role of Microbiological Processes in the Formation of Geochemical Barriers and Redox Zones under Conditions of Contamination of Soils and Aquifers with Metals Near MSW Disposal Sites. Water Resour. 2022, 49 (Suppl. S2), 83–93. [Google Scholar] [CrossRef]
- Van Nostrand, J.D.; Wu, L.; Wu, W.-M.; Huang, Z.; Gentry, T.J.; Deng, Y.; Carley, J.; Carroll, S.; He, Z.; Gu, B.; et al. Dynamics of Microbial Community Composition and Function during In Situ Bioremediation of a Uranium-Contaminated Aquifer. Appl. Environ. Microbiol. 2011, 77, 3860–3869. [Google Scholar] [CrossRef]
- Xu, M.; Wu, W.-M.; Wu, L.; He, Z.; Van Nostrand, J.D.; Deng, Y.; Luo, J.; Carley, J.; Ginder-Vogel, M.; Gentry, T.J.; et al. Responses of microbial community functional structures to pilot-scale uranium in situ bioremediation. ISME J. 2010, 4, 1060–1070. [Google Scholar] [CrossRef]
- Williams, K.H.; Bargar, J.R.; Lloyd, J.R.; Lovley, D.R. Bioremediation of uranium-contaminated groundwater: A systems approach to subsurface biogeochemistry. Curr. Opin. Biotechnol. 2013, 24, 489–497. [Google Scholar] [CrossRef]
- Wufuer, R.; Duo, J.; Li, W.; Fan, J.; Pan, X. Bioremediation of Uranium- and Nitrate-Contaminated Groundwater after the In Situ Leach Mining of Uranium. Water 2021, 13, 3188. [Google Scholar] [CrossRef]
- Wu, W.-M.; Carley, J.; Fienen, M.; Mehlhorn, T.; Lowe, K.; Nyman, J.; Luo, J.; Gentile, M.E.; Rajan, R.; Wagner, D.; et al. Pilot-Scale in Situ Bioremediation of Uranium in a Highly Contaminated Aquifer. Conditioning of a Treatment Zone. Environ. Sci. Technol. 2006, 40, 3978–3985. [Google Scholar] [CrossRef] [PubMed]
- Alessi, D.S.; Lezama-Pacheco, J.S.; Janot, N.; Suvorova, E.I.; Cerrato, J.M.; Giammar, D.E.; Davis, J.A.; Fox, P.M.; Williams, K.H.; Long, P.E.; et al. Speciation and Reactivity of Uranium Products Formed during in Situ Bioremediation in a Shallow Alluvial Aquifer. Environ. Sci. Technol. 2014, 48, 12842–12850. [Google Scholar] [CrossRef]
- Holmes, D.E.; Orelana, R.; Giloteaux, L.; Wang, L.-Y.; Shrestha, P.; Williams, K.; Lovley, D.R.; Rotaru, A.-E. Potential for Methanosarcina to Contribute to Uranium Reduction during Acetate-Promoted Groundwater Bioremediation. Microb. Ecol. 2018, 76, 660–667. [Google Scholar] [CrossRef]
- Safonov, A.V.; Babich, T.L.; Sokolova, D.S.; Grouzdev, D.S.; Tourova, T.P.; Poltaraus, A.B.; Zakharova, E.V.; Merkel, A.Y.; Novikov, A.P.; Nazina, T.N. Microbial Community and in situ Bioremediation of Groundwater by Nitrate Removal in the Zone of a Radioactive Waste Surface Repository. Front. Microbiol. 2018, 9, 1985. [Google Scholar] [CrossRef] [PubMed]
- Newsome, L.; Morris, K.; Lloyd, J.R. The biogeochemistry and bioremediation of uranium and other priority radionuclides. Chem. Geol. 2014, 363, 164–184. [Google Scholar] [CrossRef]
- Braunschweig, J.; Bosch, J.; Meckenstock, R.U. Iron oxide nanoparticles in geomicrobiology: From biogeochemistry to bioremediation. New Biotechnol. 2013, 30, 793–802. [Google Scholar] [CrossRef]
- Campbell, K.M.; Gallegos, T.J.; Landa, E.R. Biogeochemical aspects of uranium mineralization, mining, milling, and remediation. Appl. Geochem. 2015, 57, 206–235. [Google Scholar] [CrossRef]
- Höhener, P.; Ponsin, V. In situ vadose zone bioremediation. Curr. Opin. Biotechnol. 2014, 27, 1–7. [Google Scholar] [CrossRef]
- Paradis, C.J.; Jagadamma, S.; Watson, D.B.; McKay, L.D.; Hazen, T.C.; Park, M.; Istok, J.D. In situ mobility of uranium in the presence of nitrate following sulfate-reducing conditions. J. Contam. Hydrol. 2016, 187, 55–64. [Google Scholar] [CrossRef]
- Loreggian, L.; Sorwat, J.; Byrne, J.M.; Kappler, A.; Bernier-Latmani, R. Role of Iron Sulfide Phases in the Stability of Noncrystalline Tetravalent Uranium in Sediments. Environ. Sci. Technol. 2020, 54, 4840–4846. [Google Scholar] [CrossRef] [PubMed]
- Mehta, V.S.; Maillot, F.; Wang, Z.; Catalano, J.G.; Giammar, D.E. Effect of Reaction Pathway on the Extent and Mechanism of Uranium(VI) Immobilization with Calcium and Phosphate. Environ. Sci. Technol. 2016, 50, 3128–3136. [Google Scholar] [CrossRef] [PubMed]
- Lee, S.Y.; Baik, M.H.; Cho, H.-R.; Jung, E.C.; Jeong, J.T.; Choi, J.W.; Lee, Y.B.; Lee, Y.J. Abiotic reduction of uranium by mackinawite (FeS) biogenerated under sulfate-reducing condition. J. Radioanal. Nucl. Chem. 2013, 296, 1311–1319. [Google Scholar] [CrossRef]
- Sreedevi, P.; Suresh, K.; Jiang, G. Bacterial bioremediation of heavy metals in wastewater: A review of processes and applications. J. Water Process. Eng. 2022, 48, 102884. [Google Scholar] [CrossRef]
- Troyer, L.D.; Tang, Y.; Borch, T. Simultaneous Reduction of Arsenic(V) and Uranium(VI) by Mackinawite: Role of Uranyl Arsenate Precipitate Formation. Environ. Sci. Technol. 2014, 48, 14326–14334. [Google Scholar] [CrossRef] [PubMed]
- Wu, L.; Beard, B.L.; Roden, E.E.; Johnson, C.M. Influence of pH and dissolved Si on Fe isotope fractionation during dissimilatory microbial reduction of hematite. Geochim. et Cosmochim. Acta 2009, 73, 5584–5599. [Google Scholar] [CrossRef]
- Fru, E.C.; Piccinelli, P.; Fortin, D. Insights into the Global Microbial Community Structure Associated with Iron Oxyhydroxide Minerals Deposited in the Aerobic Biogeosphere. Geomicrobiol. J. 2012, 29, 587–610. [Google Scholar] [CrossRef]
- Myasnikov, I.; Artemiev, G.; Lavrinovich, E.; Kazinskaya, I.; Novikov, A.; Safonov, A. Simple and Complex Substrates (Sugar, Acetate and Milk Whey) for In Situ Bioremediation of Groundwater with Nitrate and Actinide Contamination. Hydrology 2023, 10, 175. [Google Scholar] [CrossRef]
- Yusan, S.; Erenturk, S. Sorption behaviors of uranium (VI) ions on α-FeOOH. Desalination 2011, 269, 58–66. [Google Scholar] [CrossRef]
- Gadd, G.M. Metals, minerals and microbes: Geomicrobiology and bioremediation. Microbiology 2010, 156, 609–643. [Google Scholar] [CrossRef]
- Safonov, A.; Popova, N.; Boldyrev, K.; Lavrinovich, E.; Boeva, N.; Artemiev, G.; Kuzovkina, E.; Emelyanov, A.; Myasnikov, I.; Zakharova, E.; et al. The microbial impact on U, Pu, Np, and Am immobilization on aquifer sandy rocks, collected at the deep LRW injection site. J. Geochem. Explor. 2022, 240, 107052. [Google Scholar] [CrossRef]
- Blanchet, C.L.; Kasten, S.; Vidal, L.; Poulton, S.W.; Ganeshram, R.; Thouveny, N. Influence of diagenesis on the stable isotopic composition of biogenic carbonates from the Gulf of Tehuantepec oxygen minimum zone. Geochem. Geophys. Geosystems 2012, 13. [Google Scholar] [CrossRef]
- Botchkova, E.; Vishnyakova, A.; Popova, N.; Sukhacheva, M.; Kolganova, T.; Litti, Y.; Safonov, A. Characterization of Enrichment Cultures of Anammox, Nitrifying and Denitrifying Bacteria Obtained from a Cold, Heavily Nitrogen-Polluted Aquifer. Biology 2023, 12, 221. [Google Scholar] [CrossRef] [PubMed]
- Nalivaiko, K.A.; Skripchenko, S.Y.; Titova, S.M.; Semenishchev, V.S. Radioactive wastes from near-surface storage facility of uranium conversion production. J. Radioanal. Nucl. Chem. 2023. [Google Scholar] [CrossRef]
- Parkhurst, D.L.; Appelo, C.A.J. User’s guide to PHREEQC (Version 2): A computer program for speciation, batch-reaction, one-dimensional transport, and inverse geochemical calculations. Water Resour. Investig. Rep. 1999, 99, 312. [Google Scholar] [CrossRef]
- Margalef-Marti, R.; Carrey, R.; Soler, A.; Otero, N. Evaluating the potential use of a dairy industry residue to induce denitrification in polluted water bodies: A flow-through experiment. J. Environ. Manag. 2019, 245, 86–94. [Google Scholar] [CrossRef]
- Němeček, J.; Steinová, J.; Špánek, R.; Pluhař, T.; Pokorný, P.; Najmanová, P.; Knytl, V.; Černík, M. Thermally enhanced in situ bioremediation of groundwater contaminated with chlorinated solvents–A field test. Sci. Total. Environ. 2018, 622, 743–755. [Google Scholar] [CrossRef] [PubMed]
- Li, W.; Shan, X.-Y.; Wang, Z.-Y.; Lin, X.-Y.; Li, C.-X.; Cai, C.-Y.; Abbas, G.; Zhang, M.; Shen, L.-D.; Hu, Z.-Q.; et al. Effect of self-alkalization on nitrite accumulation in a high-rate denitrification system: Performance, microflora and enzymatic activities. Water Res. 2016, 88, 758–765. [Google Scholar] [CrossRef]
- Brenzinger, K.; Dörsch, P.; Braker, G. pH-driven shifts in overall and transcriptionally active denitrifiers control gaseous product stoichiometry in growth experiments with extracted bacteria from soil. Front. Microbiol. 2015, 6, 961. [Google Scholar] [CrossRef]
- Krivonogov, S.; Maltsev, A.; Zelenina, D.; Safonov, A. Microbial Diversity and Authigenic Mineral Formation of Modern Bottom Sediments in the Littoral Zone of Lake Issyk-Kul, Kyrgyz Republic (Central Asia). Biology 2023, 12, 642. [Google Scholar] [CrossRef]
- Mohapatra, A.K.; Sujathan, S.; Ekamparam, A.S.S.; Singh, A. The Role of Manganese Carbonate Precipitation in Controlling Fluoride and Uranium Mobilization in Groundwater. ACS Earth Space Chem. 2021, 5, 2700–2714. [Google Scholar] [CrossRef]
- Zhao, Z.; Song, X.; Wang, W.; Xiao, Y.; Gong, Z.; Wang, Y.; Zhao, Y.; Chen, Y.; Mei, M. Influences of iron and calcium carbonate on wastewater treatment performances of algae based reactors. Bioresour. Technol. 2016, 216, 1–11. [Google Scholar] [CrossRef] [PubMed]
- Boldyrev, K.; Kapyrin, I.; Safonov, A.; Karaseva, Y.; Blinov, P.; Tyupina, E.; Zakharova, E. Strontium transport modeling in high-concentrated nitrate solution in DEEP liquid radioactive waste repository. J. Contam. Hydrol. 2023, 256, 104172. [Google Scholar] [CrossRef]
- Florea, L.; Noe-Stinson, C.; Brewer, J.; Fowler, R.; Kearns, B.J.; Greco, A. Iron oxide and calcite associated with Leptothrix sp. biofilms within an estavelle in the upper Floridan aquifer. Int. J. Speleol. 2011, 40, 205–219. [Google Scholar] [CrossRef]
- Marsili, E.; Beyenal, H.; Di Palma, L.; Merli, C.; Dohnalkova, A.; James, E.A.; Lewandowski, Z. Uranium Immobilization by Sulfate-Reducing Biofilms Grown on Hematite, Dolomite, And Calcite. Environ. Sci. Technol. 2007, 41, 8349–8354. [Google Scholar] [CrossRef] [PubMed]
- Safonov, A.V.; Perepelov, A.V.; Babich, T.L.; Popova, N.M.; Grouzdev, D.S.; Filatov, A.V.; Shashkov, A.S.; Demina, L.I.; Nazina, T.N. Structure and gene cluster of the O-polysaccharide from Pseudomonas veronii A-6-5 and its uranium bonding. Int. J. Biol. Macromol. 2020, 165, 2197–2204. [Google Scholar] [CrossRef] [PubMed]
- Mann, E.E.; Wozniak, D.J. Pseudomonas biofilm matrix composition and niche biology. FEMS Microbiol. Rev. 2012, 36, 893–916. [Google Scholar] [CrossRef]
- Kazy, S.K.; Sar, P.; D’Souza, S.F. Studies on Uranium Removal by the Extracellular Polysaccharide of a Pseudomonas aeruginosa Strain. Bioremediat. J. 2008, 12, 47–57. [Google Scholar] [CrossRef]
- Hunter, R.C.; Hitchcock, A.P.; Dynes, J.J.; Obst, M.; Beveridge, T.J. Mapping the Speciation of Iron in Pseudomonas aeruginosa Biofilms Using Scanning Transmission X-ray Microscopy. Environ. Sci. Technol. 2008, 42, 8766–8772. [Google Scholar] [CrossRef]
- Oppenheimer-Shaanan, Y.; Sibony-Nevo, O.; Bloom-Ackermann, Z.; Suissa, R.; Steinberg, N.; Kartvelishvily, E.; Brumfeld, V.; Kolodkin-Gal, I. Spatio-temporal assembly of functional mineral scaffolds within microbial biofilms. NPJ Biofilms Microbiomes 2016, 2, 15031. [Google Scholar] [CrossRef]
- Campbell, K.; Kukkadapu, R.; Qafoku, N.; Peacock, A.; Lesher, E.; Williams, K.; Bargar, J.; Wilkins, M.; Figueroa, L.; Ranville, J.; et al. Geochemical, mineralogical and microbiological characteristics of sediment from a naturally reduced zone in a uranium-contaminated aquifer. Appl. Geochem. 2012, 27, 1499–1511. [Google Scholar] [CrossRef]
- Mueller, B. Experimental Interactions Between Clay Minerals and Bacteria: A Review. Pedosphere 2015, 25, 799–810. [Google Scholar] [CrossRef]
- Zelenina, D.; Kuzmenkova, N.; Sobolev, D.; Boldyrev, K.; Namsaraev, Z.; Artemiev, G.; Samylina, O.; Popova, N.; Safonov, A. Biogeochemical Factors of Cs, Sr, U, Pu Immobilization in Bottom Sediments of the Upa River, Located in the Zone of Chernobyl Accident. Biology 2022, 12, 10. [Google Scholar] [CrossRef] [PubMed]
- Safonov, A.V.; Andryushchenko, N.D.; Ivanov, P.V.; Boldyrev, K.A.; Babich, T.L.; German, K.E.; Zakharova, E.V. Biogenic Factors of Radionuclide Immobilization on Sandy Rocks of Upper Aquifers. Radiochemistry 2019, 61, 99–108. [Google Scholar] [CrossRef]
- Popova, N.; Artemiev, G.; Zinicovscaia, I.; Yushin, N.; Demina, L.; Boldyrev, K.; Sobolev, D.; Safonov, A. Biogeochemical Permeable Barrier Based on Zeolite and Expanded Clay for Immobilization of Metals in Groundwater. Hydrology 2023, 10, 4. [Google Scholar] [CrossRef]
- Zhao, L.; Cai, C.; Jin, R.; Li, J.; Li, H.; Wei, J.; Guo, H.; Zhang, B. Mineralogical and geochemical evidence for biogenic and petroleum-related uranium mineralization in the Qianjiadian deposit, NE China. Ore Geol. Rev. 2018, 101, 273–292. [Google Scholar] [CrossRef]
- Safonov, A.V.; Boguslavsky, A.E.; Boldyrev, K.A.; Gaskova, O.L.; Naimushina, O.S.; Popova, N.M. Geochemical Modeling of the Uranium Behavior in Groundwater near the Sludge Storages during Bioremediation. Geochem. Int. 2021, 59, 56–65. [Google Scholar] [CrossRef]
- Boguslavsky, A.; Gaskova, O.; Naymushina, O.; Popova, N.; Safonov, A. Environmental monitoring of low-level radioactive waste disposal in electrochemical plant facilities in Zelenogorsk, Russia. Appl. Geochem. 2020, 119, 104598. [Google Scholar] [CrossRef]
- Safonov, A.; Lavrinovich, E.; Emel’yanov, A.; Boldyrev, K.; Kuryakov, V.; Rodygina, N.; Zakharova, E.; Novikov, A. Risk of colloidal and pseudo-colloidal transport of actinides in nitrate contaminated groundwater near a radioactive waste repository after bioremediation. Sci. Rep. 2022, 12, 4557. [Google Scholar] [CrossRef]
- Zhang, R.; Ali, A.; Su, J.; Liu, J.; Wang, Z.; Li, J.; Liu, Y. Synergistic removal of fluoride, calcium, and nitrate in a biofilm reactor based on anaerobic microbially induced calcium precipitation. J. Hazard. Mater. 2022, 428, 128102. [Google Scholar] [CrossRef]


Disclaimer/Publisher’s Note: The statements, opinions and data contained in all publications are solely those of the individual author(s) and contributor(s) and not of MDPI and/or the editor(s). MDPI and/or the editor(s) disclaim responsibility for any injury to people or property resulting from any ideas, methods, instructions or products referred to in the content. |
© 2023 by the authors. Licensee MDPI, Basel, Switzerland. This article is an open access article distributed under the terms and conditions of the Creative Commons Attribution (CC BY) license (https://creativecommons.org/licenses/by/4.0/).