Article

Evaluation of Heavy Metal Presence in Agricultural Samples of Lactuca sativa and Trifolium alexandrinum Using Picosecond Laser-Induced Breakdown Spectroscopy and Flame Atomic Absorption Spectroscopy in Banha and Giza Governorates, Egypt

1
Department of Physics, Faculty of Women for Arts, Science, and Education, Ain Shams University, Cairo 11566, Egypt
2
National Institute of Laser Enhanced Sciences (NILES), Cairo University, Giza 12613, Egypt
3
Department of Botany, Faculty of Women for Arts, Science, and Education, Ain Shams University, Cairo 11566, Egypt
4
Ultrafast Picosecond Laser Lab, Physics Department, Faculty of Science, Cairo University, Giza 12613, Egypt
5
Egypt Nanotechnology Center (EGNC), Faculty of Nanotechnology for Postgraduate Studies, Cairo University, Sheikh Zayed 41516, Egypt
*
Author to whom correspondence should be addressed.
Minerals 2023, 13(10), 1300; https://doi.org/10.3390/min13101300
Submission received: 14 August 2023 / Revised: 3 October 2023 / Accepted: 5 October 2023 / Published: 8 October 2023

Abstract

:
This pioneering study utilizes Flame Atomic Absorption Spectroscopy (FAAS) and Picosecond Laser-Induced Breakdown Spectroscopy (Ps-LIBS) to quantify heavy metal contents in samples of Lactuca sativa L. and Trifolium alexandrinum L. collected from Banha and Giza, Egypt for the first time. In order to enhance the performance of Ps-LIBS, laser parameters were carefully optimized. Expressly, laser energy was set to 100 ± 5% J/cm², pulse duration was calibrated to 170 picoseconds, and 1064 nm Nd: YAG pulses were employed. This optimization facilitated the creation of linear LIBS calibration curves, a crucial element in ensuring precise elemental quantification and bolstering the overall analytical reliability. The assessment of pollution indices revealed concerningly high levels of copper, nickel, and cadmium consistently across all study sites. Lactuca sativa L. and Trifolium alexandrinum L. also demonstrated multiple metals’ bioaccumulation factors (>1), further underscoring the potential health risks associated with copper, nickel, and cadmium contents. Given these findings, it is imperative to recommend constructing a dedicated wastewater treatment facility to address Al Mansouria village’s environmental challenges in the Giza governorate.

1. Introduction

The increasing challenges posed by population growth and industrial activities are leading to elevated levels of environmental contamination. Such contamination frequently includes trace elements in soil and water, some can be beneficial for biological systems, while others can be hazardous [1,2,3]. Specifically, heavy metal contamination arises from diverse sources such as industrial effluents, metal-based insecticides and fertilizers, and contaminated irrigation water [4]. These factors collectively contribute to a worrying surge in heavy metal contamination, particularly in soil and environmental matrices, as a direct result of rampant industrialization, urbanization, and the escalated use of irrigation water [5,6,7].
Analytical techniques like FAAS and Ps-LIBS have been instrumental in quantifying and characterizing these heavy metal contaminants. FAAS specializes in detecting the contents of heavy and trace elements by analyzing the radiation absorption of specific elements [8,9]. FAAS, in particular, has been instrumental in assessing the presence of toxic metals such as copper, manganese, and cadmium in various vegetable samples, including cabbage, mallow, and turnip, as well as their corresponding soils. For example, a study conducted in Qaliubia, Egypt, employed FAAS to measure varying Cu, Mn, and Cd contents in these vegetables and soils, providing critical data on PI values for these metals [10]. Flame Atomic Absorption Spectrometry (FAAS) has played a pivotal role in the evaluation of the presence of toxic trace elements, notably copper (Cu) and cadmium (Cd), in diverse environmental samples [8,9]. In a research investigation conducted at a location situated in northern Egypt, FAAS was employed as the analytical technique of choice to quantify the diverse content levels of Cu and Cd within agricultural samples. The analytical approach provided crucial data regarding PI values associated with trace metals, which can potentially raise health-related concerns [7,8,9].
Ps-LIBS, offers a range of applications in optical coherence tomography, advanced optical communications, and ultrashort pulse control. This technique employs a picosecond laser that minimizes heat-affected zones and expedites material vaporization through efficient electron–phonon interactions [11,12].
The choice of Trifolium alexandrinum and Lactuca sativa as test subjects is deliberate and significant. Trifolium alexandrinum, commonly known as Egyptian clover, is a key forage crop, and Lactuca sativa, or lettuce, is widely consumed as a leafy vegetable. Both are integral to human and animal diets and often serve as bioindicators for environmental health [13]. Their widespread cultivation and consumption make them pivotal in studies focusing on trace metal accumulation and its subsequent impact on human and animal health [14].
LIBS is an analytical technique primarily used for the qualitative and semi-quantitative analysis of the elemental composition of a sample [15,16]. LIBS operates through a high-energy laser pulse to ablate a minute portion of a sample, producing a plasma. Indeed, it is imperative to underscore that preceding phases involving the determination of elemental contents, employing established methodologies such as FAAS, as shown in the above sections, are of utmost significance in establishing LIBS calibration curves [17]. Establishing LIBS calibration curves is essential for converting spectral intensity into accurate elemental contents and mitigating inherent variations due to sample matrices, laser energy, and measurement conditions [18]. This comprehensive reference underscores the critical role of calibration in LIBS analysis. Calibration ensures precise quantification, enhancing the reliability of LIBS analysis across industries such as materials science, environmental monitoring, and archaeology [19,20,21].
During the last decade, LIBS has been deployed for a variety of applications. For instance, Naeem et al. used a 532 nm Nd: YAG pulsed laser to delve into the properties of copper plasma [22], while Walid Tawfik et al. employed LIBS to assess contamination by heavy elements in environmental samples under ambient air conditions [23,24,25,26].
Laser-induced breakdown spectroscopy is a powerful technique for detecting trace heavy elements in environmental samples. Tawfik et al. (2015) demonstrated the utility of LIBS in monitoring inorganic elements in challenging environmental conditions [27]. Farooq et al. (2013) further explored the plasma characteristics of samples, contributing to a deeper understanding of LIBS analysis [28].
Moreover, Tawfik and colleagues (2015) extended the application of LIBS to trace heavy metal analysis in various environmental matrices, showcasing its versatility and sensitivity in environmental monitoring [29]. These studies collectively highlight LIBS as a valuable tool for rapid and non-invasive detection of trace heavy elements, aiding in environmental assessment and analysis.
In this context, the current study employs FAAS and Ps-LIBS to assess the contents of trace heavy metals, such as zinc, manganese, copper, nickel, cadmium, lead, and chromium, in agricultural samples from Trifolium alexandrinum and Lactuca sativa plants as well as in their associated soils. The ultimate goal is to comprehensively analyze heavy metal contamination in critical agricultural plants, thereby aiding in developing guidelines for environmental remediation and public health policy.

2. Material and Methods

2.1. Samples Collection

This research selected five sites across two critical governorates in Egypt to analyze the contents of heavy metals in soil and the roots and shoots of local plant life. Within the Banha governorate, three sites were examined: Kafr Al-Arab village (30.4078° N, 31.2253° E), irrigated with groundwater; Sindenhour village (30.4757° N, 31.5024° E), irrigated by a Nile River tributary; Mit Asem village (30.4246° N, 31.1782° E), irrigated directly from the El-Felfla canal. Two additional sites were located in the Giza governorate: Al Mansouria village (30.1375° N, 31.0712° E), irrigated with sewage water, and Nikla (30.9112° N, 30.7583° E), irrigated by the Nile River, Rasheed Branch (27.5833° N, 31.5667° E). Soil samples were collected from each site, extending to a 0–30 cm depth. Geographical data for these sites are presented in Figure 1.

2.2. Samples Preparation

The soil samples were brought to the laboratory in plastic bags shortly after collection, air-dried, and then packed in paper bags ready for chemical analysis. The plant samples were collected (Trifollium alexandrinum and Lactuca sativa). The shoots and roots of each plant were taken from each site, washed with deionized water, left to air-dry, and then oven-dried at 70   ° C for three days [30]. One gram of each sample was taken and placed in the digestion tube of the Kieldahl apparatus. Seven milliliters of nitric acid and one milliliter of perchloric acid were added to each sample for digestion for three hours, then diluted with one hundred milliliters of distilled water [31]. The metal contents were determined using a filament atomic absorption spectrometer system model Thermo Solaar S4 (Thermo Fisher Scientific, Waltham, MA, USA) [32]. The samples (soil and plants) were grounded into powders utilizing a mortar and pestle for Ps-LIBS measurements. A 0.2 mm nylon sieve was used to sift the ground-up samples to produce homogenous sample powder. In this investigation, pellets of the produced sample powder with a 1 cm diameter and 3 mm thickness were formed using a hydraulic press at 15 tons of pressure for 15 min without adding any binders [11].

2.3. Theoretical Background

2.3.1. Pollution Index (PI)

The calculation of the (PI) is given as:
P I =   C c C r
where C c and C r represent the estimated heavy metal content and its permissible content in soil and were used to determine the extent of each heavy metal’s soil contamination [33].

2.3.2. Bioaccumulation Factor (BF) and Translocation Factor (TF)

A plant’s suitability for phytoremediation can be determined using the bioaccumulation and translocation factors. These factors will enable phytoremediation technology, which depends on the possibility of heavy metal bioaccumulation and plant exclusion to clean up regions contaminated by heavy metals [34,35]. According to Fitz and Wenzel, the bioaccumulation factor (BF) of the heavy metals in various plant species was estimated by dividing the amount of metal in the root by the amount in the soil as follows [36]:
B F = M e t a l   l e v e l   i n   t h e   r o o t   ( mg   kg 1 ) M e t a l   l e v e l   i n   t h e   s o i l   ( mg   kg 1 )  
Using the translocation factor (TF) proposed by some scientists [37,38], the translocation factors of Zn, Mn, Cu, Ni, Cd, Pb, and Cr from shoot to root were evaluated in the current study.
F = M e t a l   l e v e l   i n   t h e   s h o o t   ( mg   kg 1 ) M e t a l   l e v e l   i n   t h e   r o o t   ( mg   kg 1 )  

2.4. Statistical Analysis

The Statistical Package for the Social Sciences (SPSS) for Windows Release 20.0 was used to conduct the statistical analysis between the amounts of major and trace heavy metals ((Mg, K, Fe), (Zn, Mn, Cu, Ni, Cd, Pb, Cr)) in the collected samples at various sites. For the examined parameters, means and standard deviations were determined. One-way analysis of variance (ANOVA 1) was used to treat differences between study sites statistically, and the Tukey test was used to compare means (SPSS) [39].

2.5. Instrumentations and Sample Analysis

2.5.1. FAAS System

FAAS measurements are typically performed using an air–acetylene flame. Flame composition and oxidant choice depend on the analyzed elements and the desired flame temperature. The parameter conditions of the instrument are shown in Table 1. The standard solutions used to calibrate the FAAS were obtained from Scharlau Chemie SA (Barcelona, Spain) [40], with a content of 1000 μ g / m L and purity 99.99% for each of the studied elements. These standard solutions were diluted with bi-distilled water to give different contents ranging from 0.25 to 8 μ g / m L for the different elements.
In the present work, precision is determined as the relative standard deviation (RSD %) with values for different working FAAS conditions for each studied element in Table 1.

2.5.2. LIBS System

The experimental setup of the used Ps-LIBS system has already been demonstrated in detail elsewhere by our group [41]. The brief description is given as the following: the laser system used in the experiment is an ultrafast high-power picosecond Nd: YAG Q-switched laser (Standa LTD, Vilnius, Lithuania) with a wavelength of 1064 nm, a pulse duration of 170 ps, and a repetition rate of 5 Hz. The laser is controlled by Sophi nXt software, and the laser Q-switch delay times range from 400 to 3200 ns. The laser pulses have an energy of 100 ± 4% mJ and are focused onto the samples’ pellets using a plano-convex quartz lens with a 150 mm focal length. The spot size is approximately 0.8 ± 0.1 mm. The energy of the laser pulses is measured using a high-accuracy laser power meter (model 11 Maestro, Standa Ltd., Vilnius, Lithuania).
The plasma plume emission was detected utilizing a high-accuracy picometer spectrometer (ARYELLE 200) that operates in the UV to Vis wavelength range (192–750 nm) with a spectral resolution of 13.8–37.5 pm and a spectral resolving power of 75,000–150,000 [41]. The dispersed spectra from the ARYELLE 200 are then captured and recorded by an adjustable amplification gain (1000), gate (2 μs), and delay times intensified charge-coupled detector ICCD (Andor, Belfast, UK).

3. Results

3.1. Major and Trace Heavy Metals Content in Lactuca sativa (Lettuce) and Trifollium alexandrinum (Clover) parts (Roots, Shoots) and Their Associated Soil

This study focuses on the most probable trace heavy elements in agricultural samples, Zn, Mn, Cu, Ni, Cd, Pb, and Cr, rather than the major elements such as Mg, K, and Fe, which are essential in the studied samples of trace heavy elements [42]. Table 2, Table 3 and Table 4 show the contents of heavy metals measured by the FAAS of soil, roots, and shoots of the lettuce and clover plants resulting from irrigation with different water resources in the lettuce and clover-associated soils, roots, and shoots, respectively. In the statistical analysis, the symbols a, b, c, d, and e indicate that the values with different superscript letters in a column are significantly different (p < 0.05). This result means there was a significant variation between the values obtained by the Tukey test.

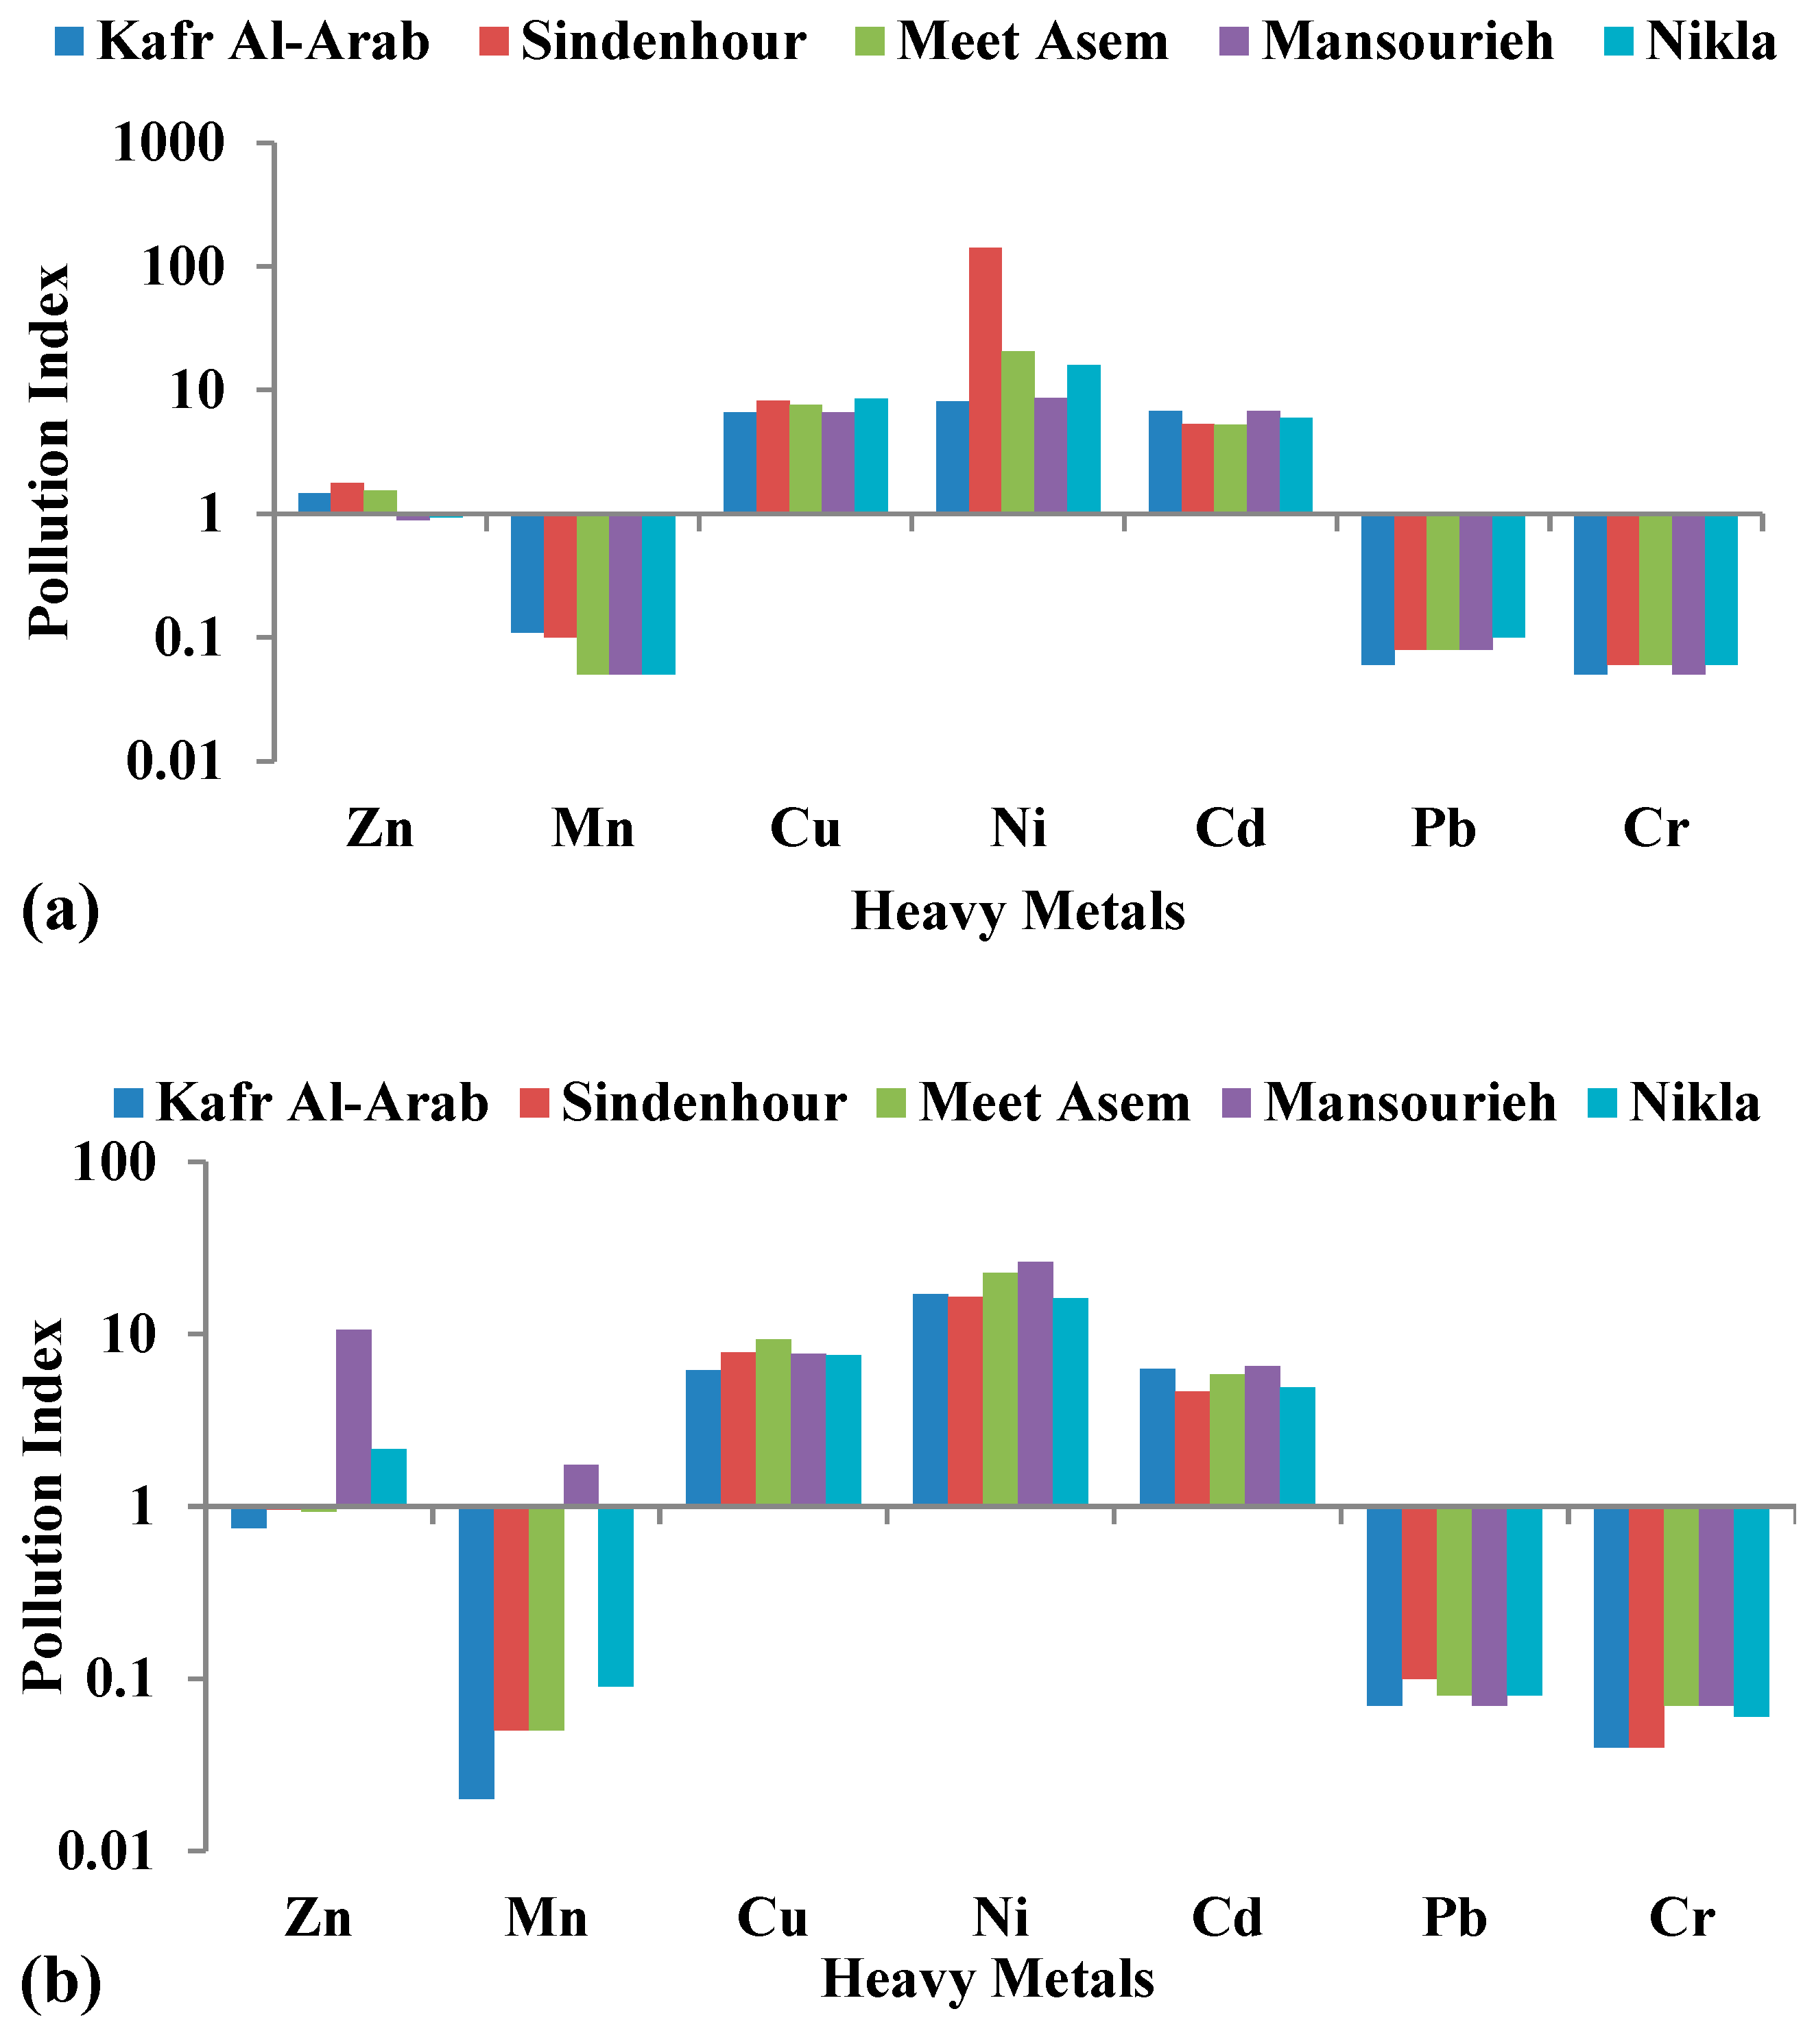
3.2. Pollution Index (PI) of the Soils

Table 5 lists the exact values of permissible contents in soils and plants for those elements according to Cal/EPA [43] for soil and FAO/WHO [44] for vegetables. At the same time, Figure 2a represents a histogram of the PI values of Zn, Mn, Cu, Ni, Cd, Pb, and Cr for Lactuca sativa in the five sites. The mean value of Cu, Ni, and Cd for L. sativa soils is higher than one by one order or two orders of magnitude in all sites, while that for Mn, Pb, and Cr is very far away from one by one order of magnitude in all sites. In Al Mansouria and Nikla, the PI of Zn is less than one, whereas it is significantly higher than one in Kafr Al-Arab, Sindenhour, and Mit Asem. Figure 2b also shows a histogram of the PI values of the same elements for Trifollium alexandrinum in the same sites. The average values of Pb and Cr pollution indices for T. alexandrinum soils are less than one by one and two orders of magnitude at all sites, but those for Cu, Ni, and Cd are higher than one by one order of magnitude. In Kafr Al-Arab, Sindenhour, and Mit Asem, manganese’s PI is more significant than one in Al Mansouria but less than one by two orders of magnitude in Kafr Al-Arab, Sindenhour, Mit Asem, and Nikla. In Al Mansouria and Nikla, the PI of Zn is larger than one, whereas it is less than one in Kafr Al-Arab, Sindenhour, and Mit Asem.

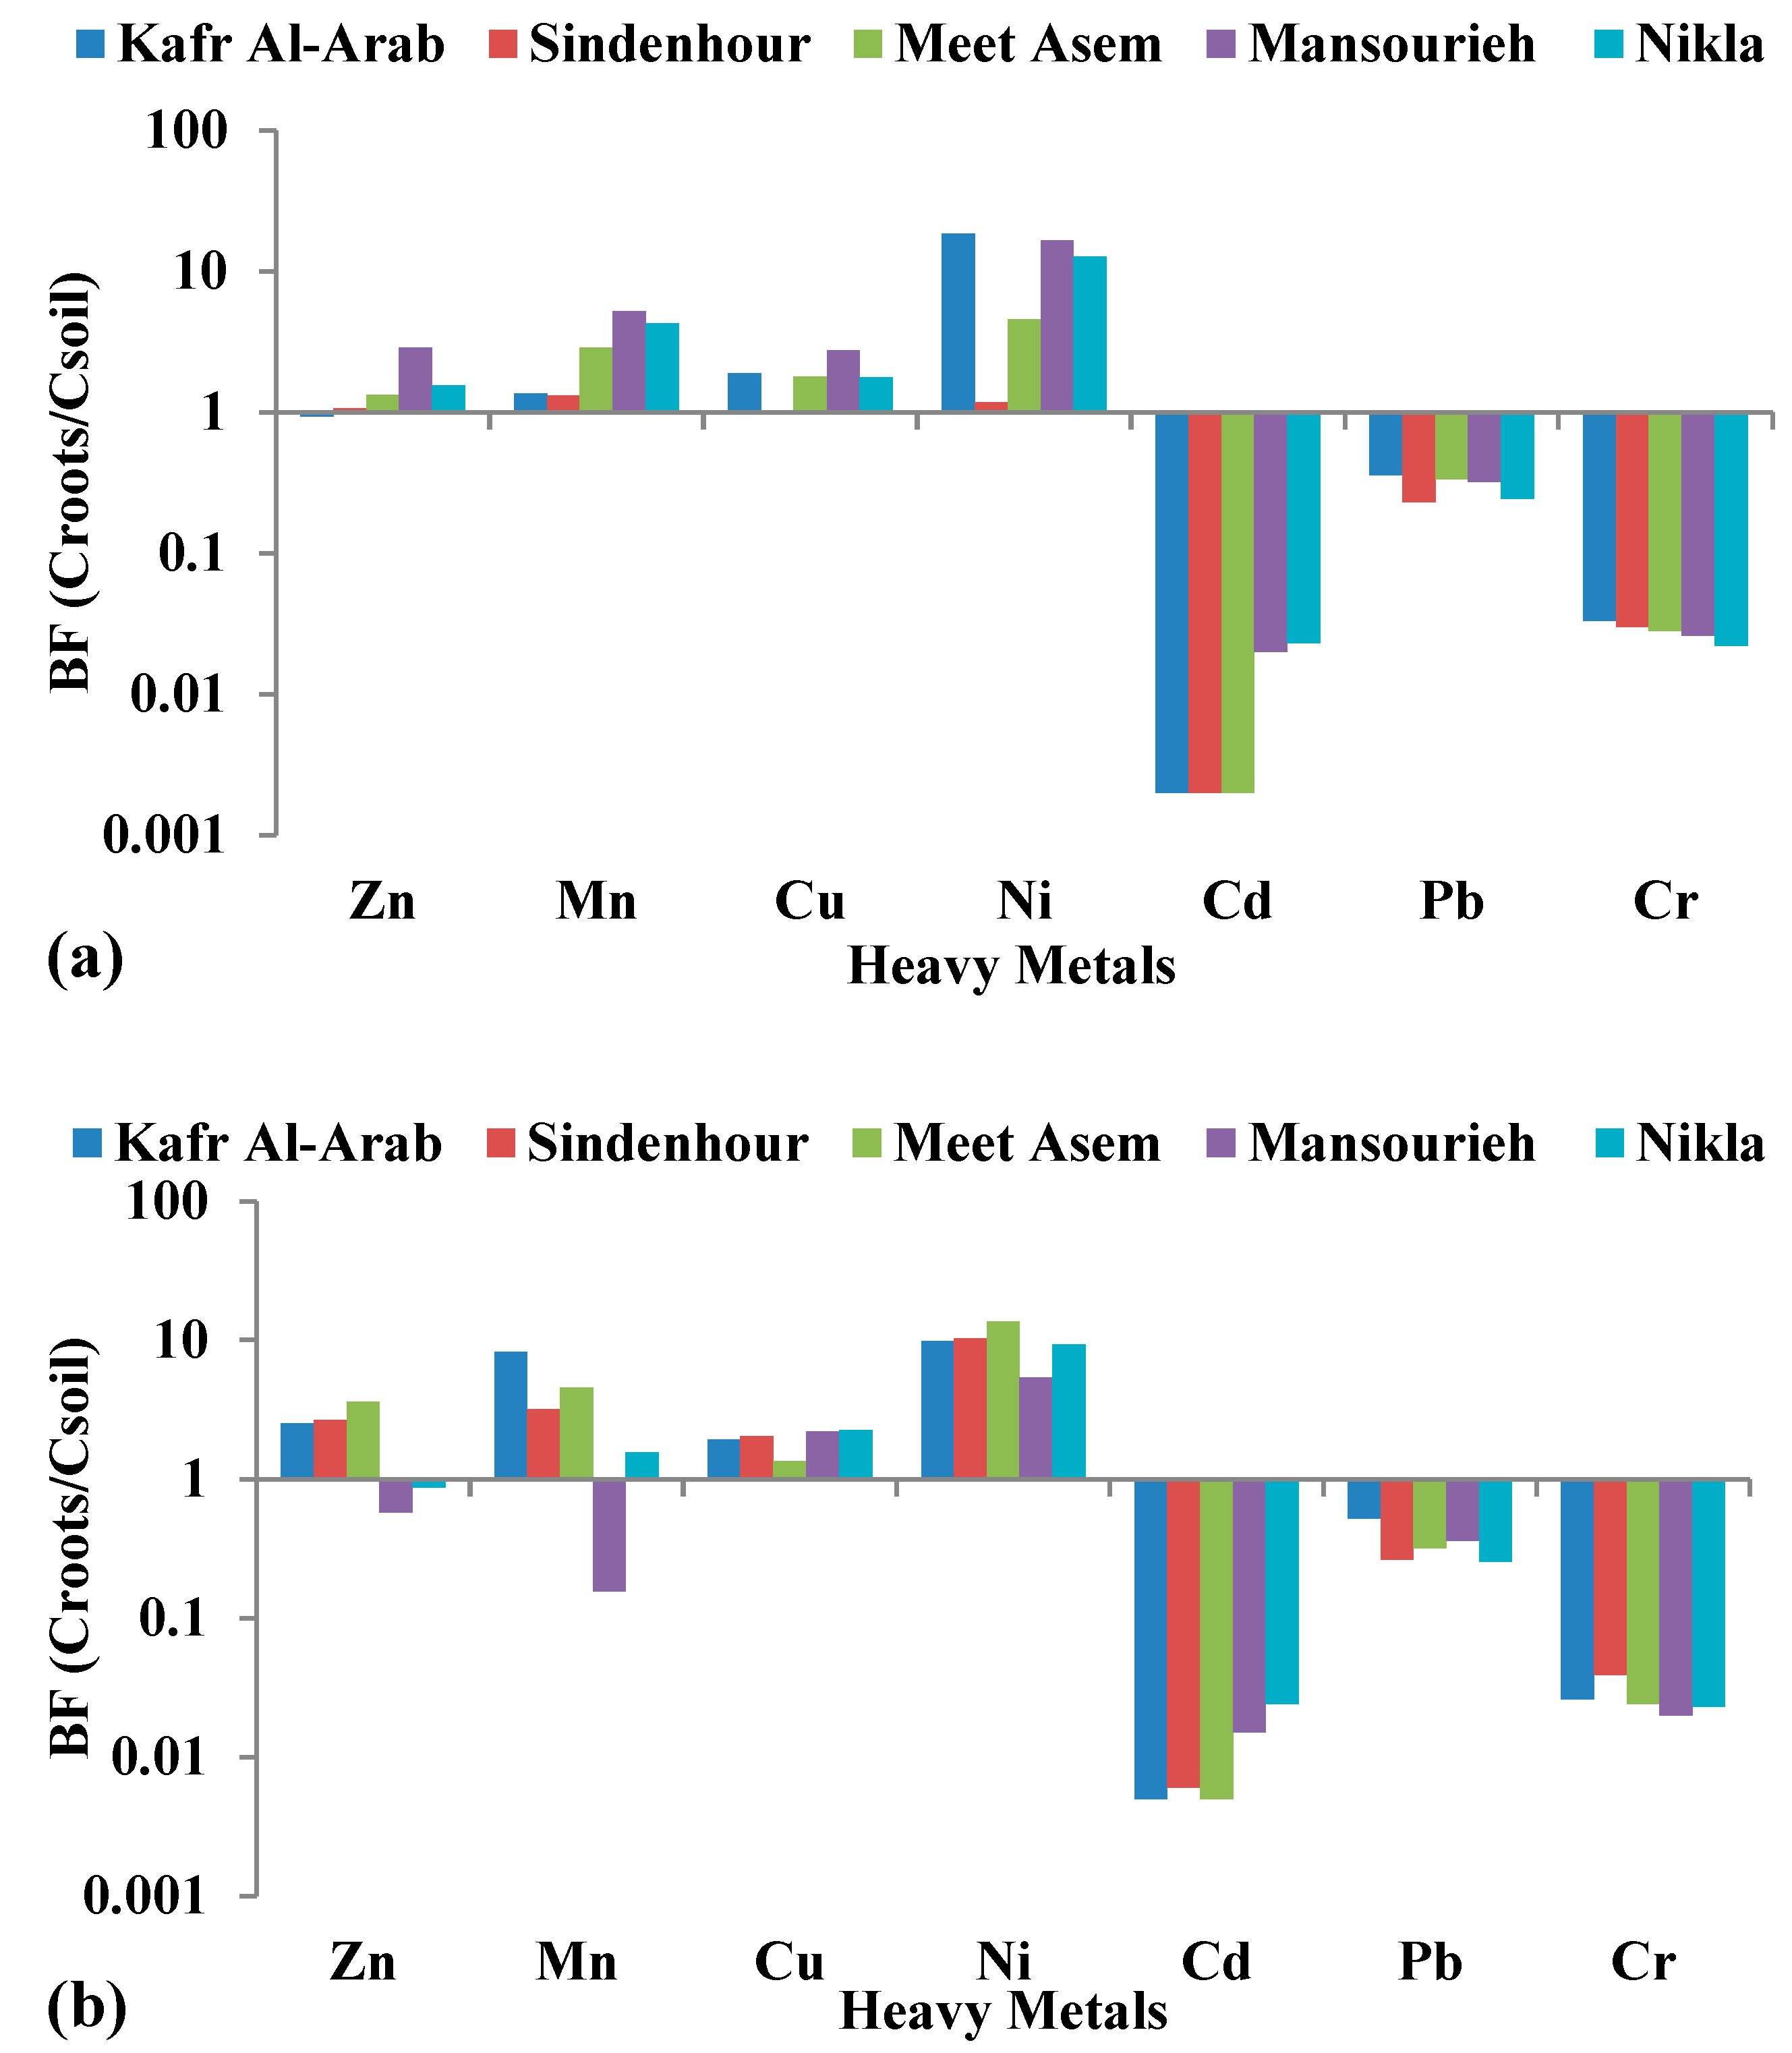
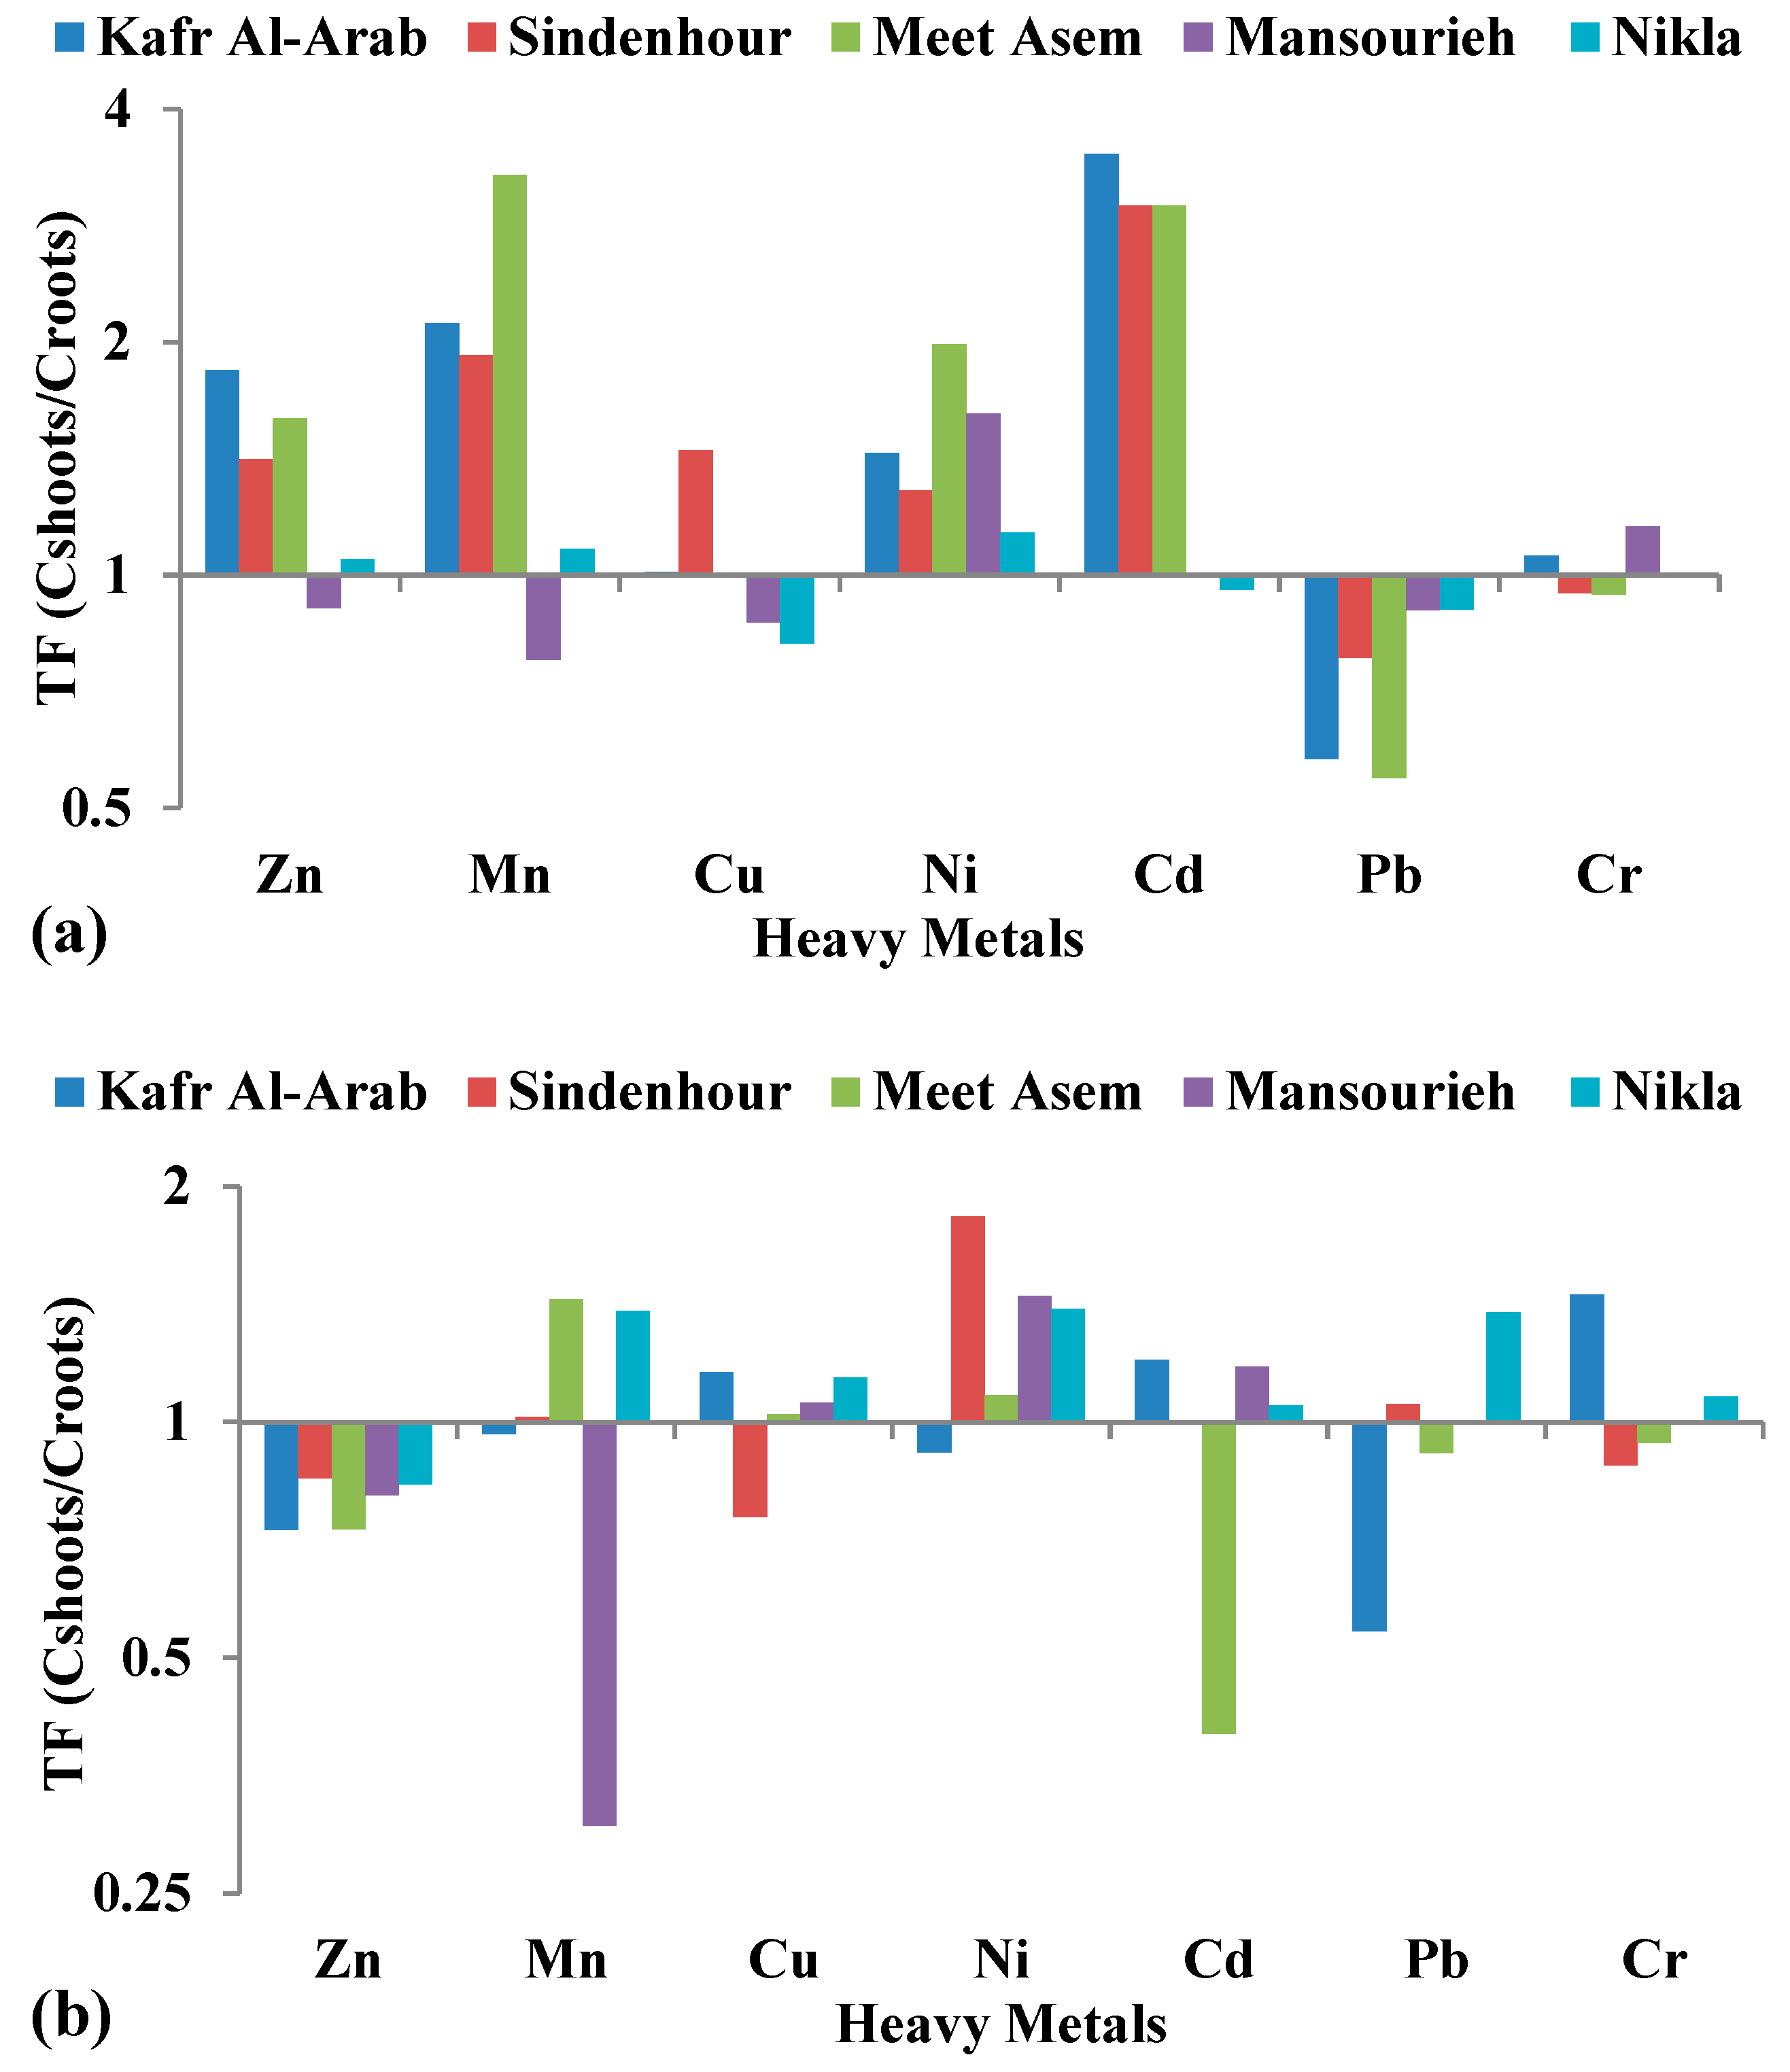
3.3. Bioaccumulation and Translocation Factors of Metals by Plants

Figure 3a shows that lettuce plants have a high potential to accumulate Zn, Mn, Ni, and Cu in all areas where their BF is more significant than one. However, at all sites, the Cd, Pb, and Cr BF are less than one. Figure 3b shows that clover plants irrigated with various water sources have a high potential to accumulate Cu and Ni in all sites, Zn in Kafr Al-Arab, Sindenhour, and Mit Asem, and Mn in Kafr Al-Arab, Sindenhour, Mit Asem, and Nikla. The figure also shows that these sites have different potentials for Zn accumulation. However, the BF of Cd, Pb, and Cr are all lower than one, as are the BFs of Zn in Al Mansouria and Nikla, and Mn in Al Mansouria only.
In Kafr Al-Arab, Sindenhour, Mit Asem, and Nikla, the translocation factor (TF) of Zn and Mn from roots to shoots was more significant than one, according to Figure 4a. Additionally, there was a transfer of Cu and Cd in Kafr Al-Arab, Sindenhour, and Mit Asem; Ni in all locations; and Cr in Kafr Al-Arab, Al Mansouria, and Nikla. Figure 4b shows that Sindenhour, Mit Asem, and Nikla have a translocation factor (TF) of Mn from roots to shoots that are more than one. Also, the TF is more than one for Cu in Kafr Al-Arab, Mit Asem, Al Mansouria, and Nikla; Ni in Sindenhour, Mit Asem, Al Mansouria, and Nikla; Cd in Kafr Al-Arab, Sindenhour, Al Mansouria, and Nikla; Pb in Sindehour, Al Mansouria, and Nikla; Cr in Kafr Al-Arab, Al Mansouria, and Nikla.

3.4. Ps-LIBS Spectrum Studies

In the current study, by intruding the ultrafast laser into LIBS, the present Ps-LIBS, as a qualitative and semi-quantitative compositional analysis developed method for the ambient samples, was carried out using the optical emission spectrum of the generated plasma emission [45]. The high-resolution Ps-LIBS emission spectra of the plant parts (roots, branches, and accompanying soil) are shown in Figure 5. This study was focused only on the emission lines for the studied heavy elements (Zn, Mn, Cu, Ni, Cd, Pb, and Cr), so the spectral region from 210–390 nm is selected because it gathers the essential characteristic emission lines with high resolution for these elements as shown in Figure 5. These spectral lines have been recognized with the help of the NIST database [46], as shown in Table 6.

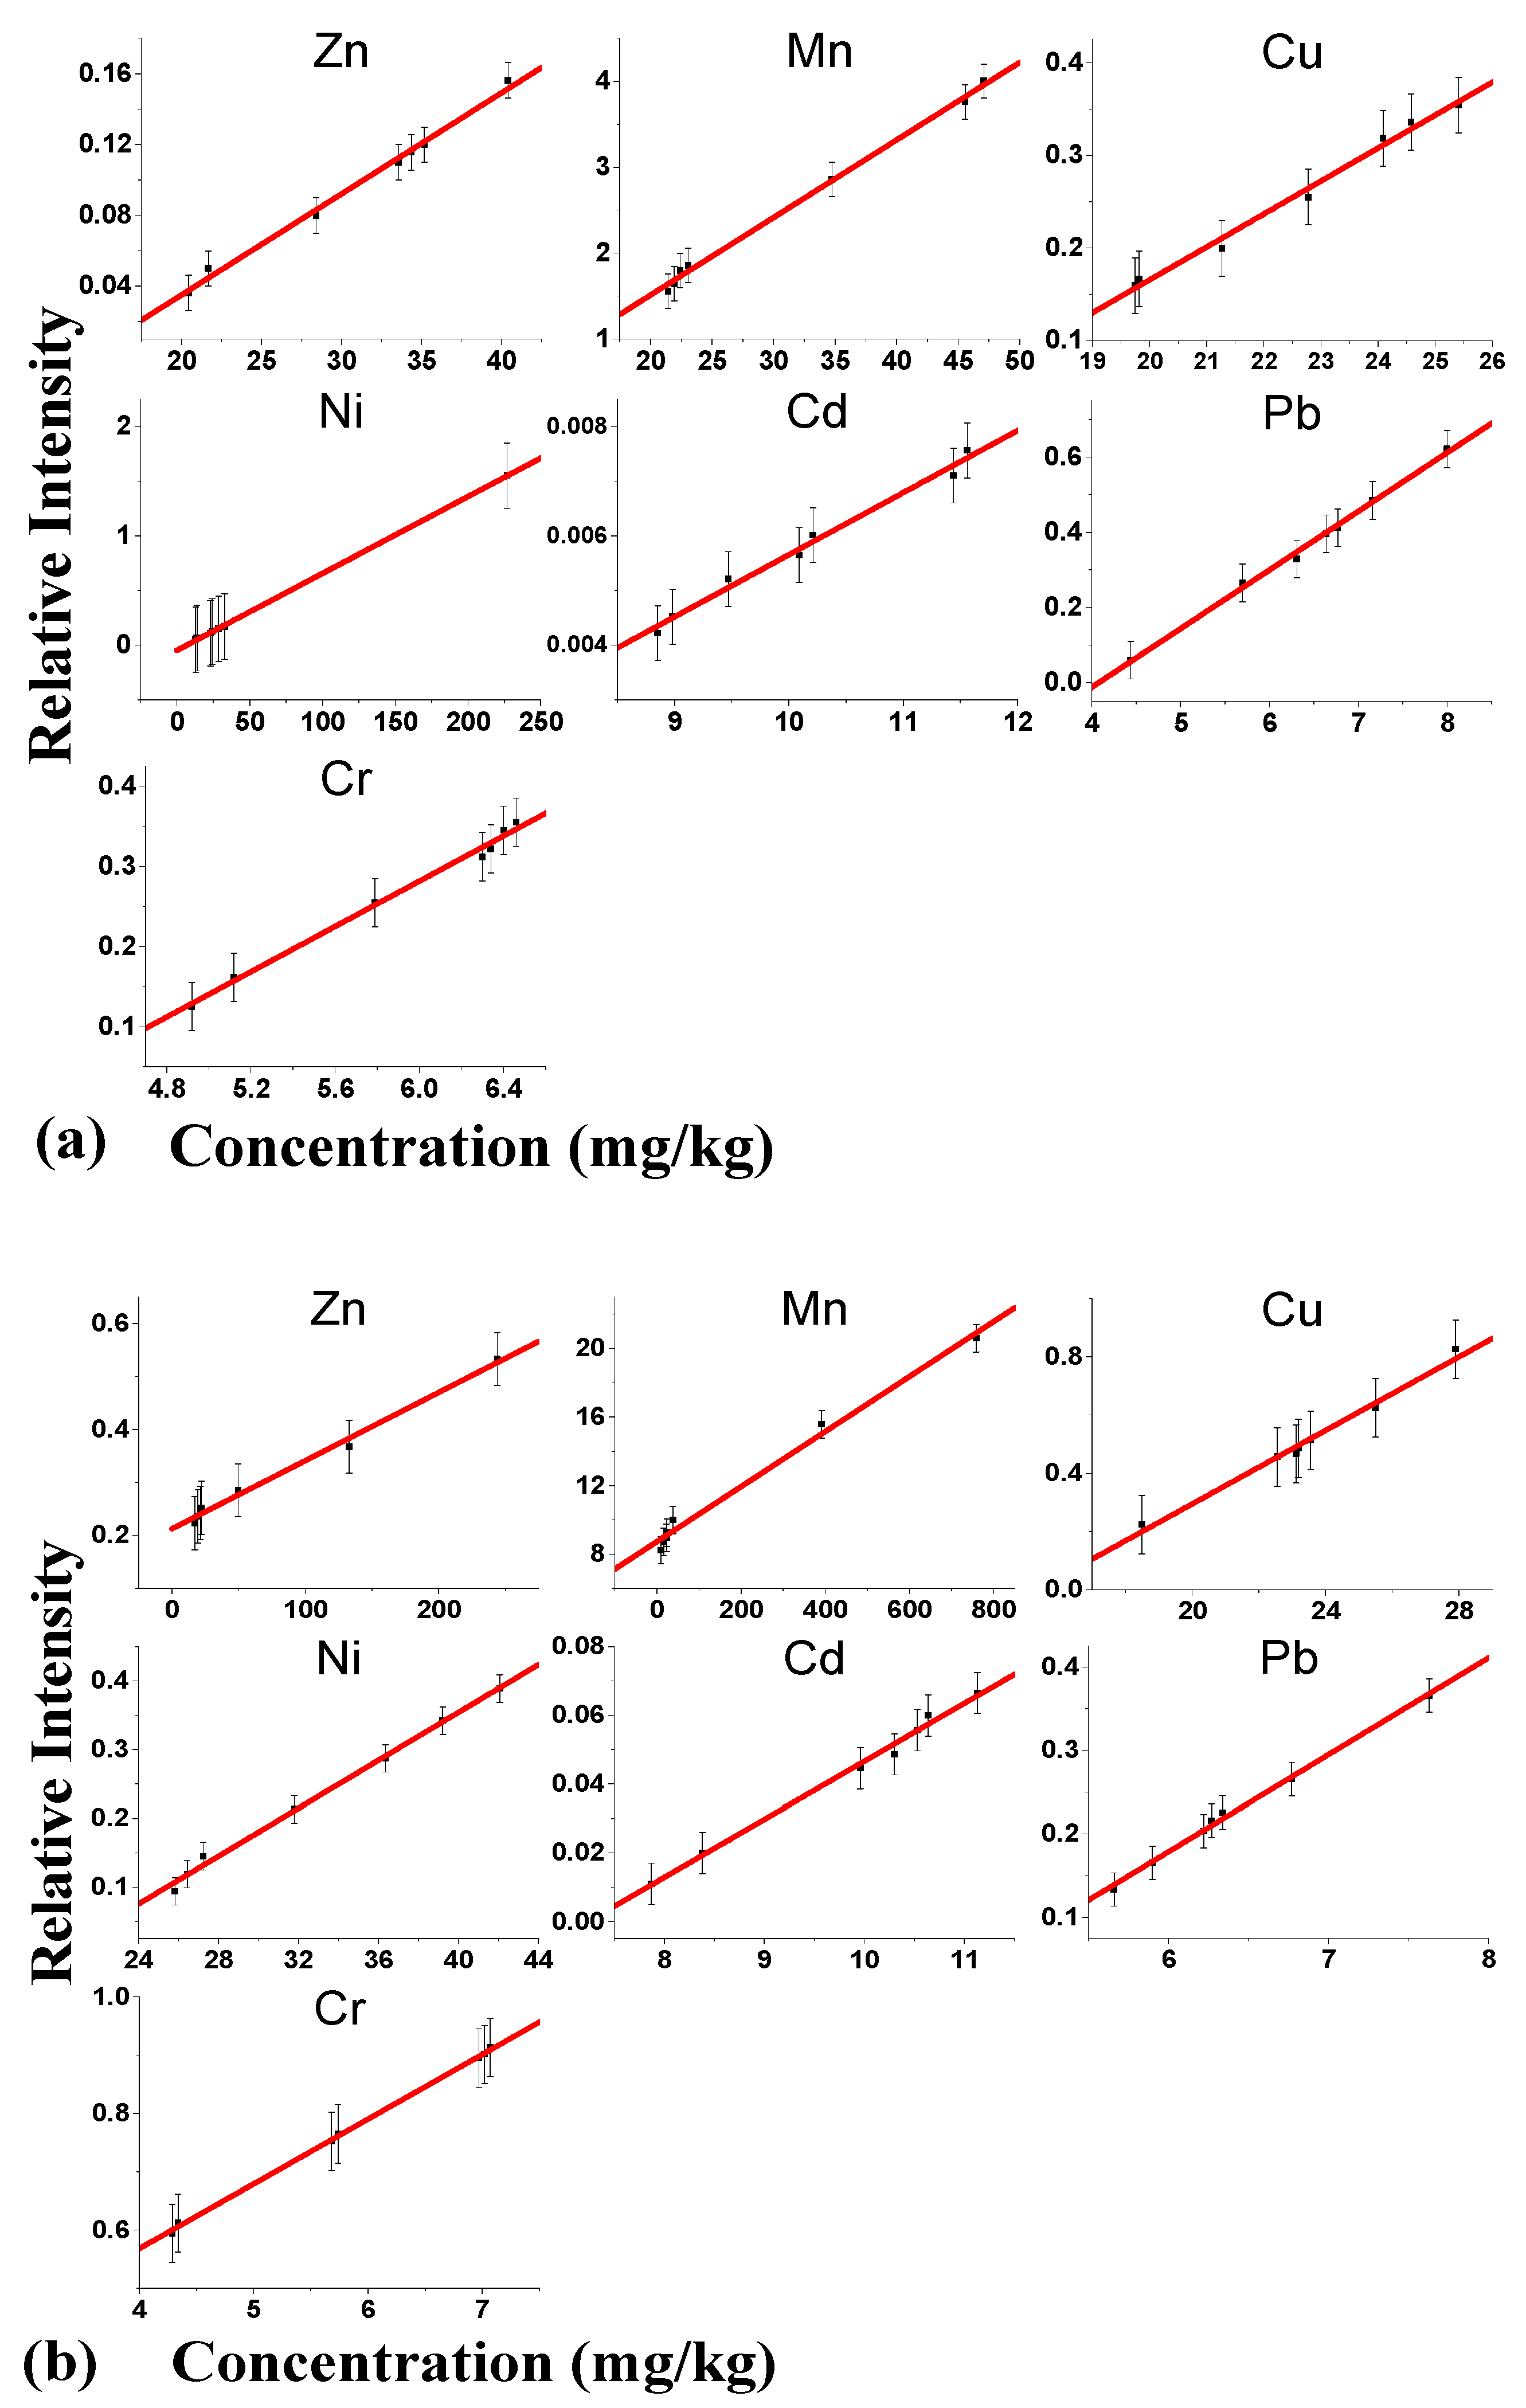
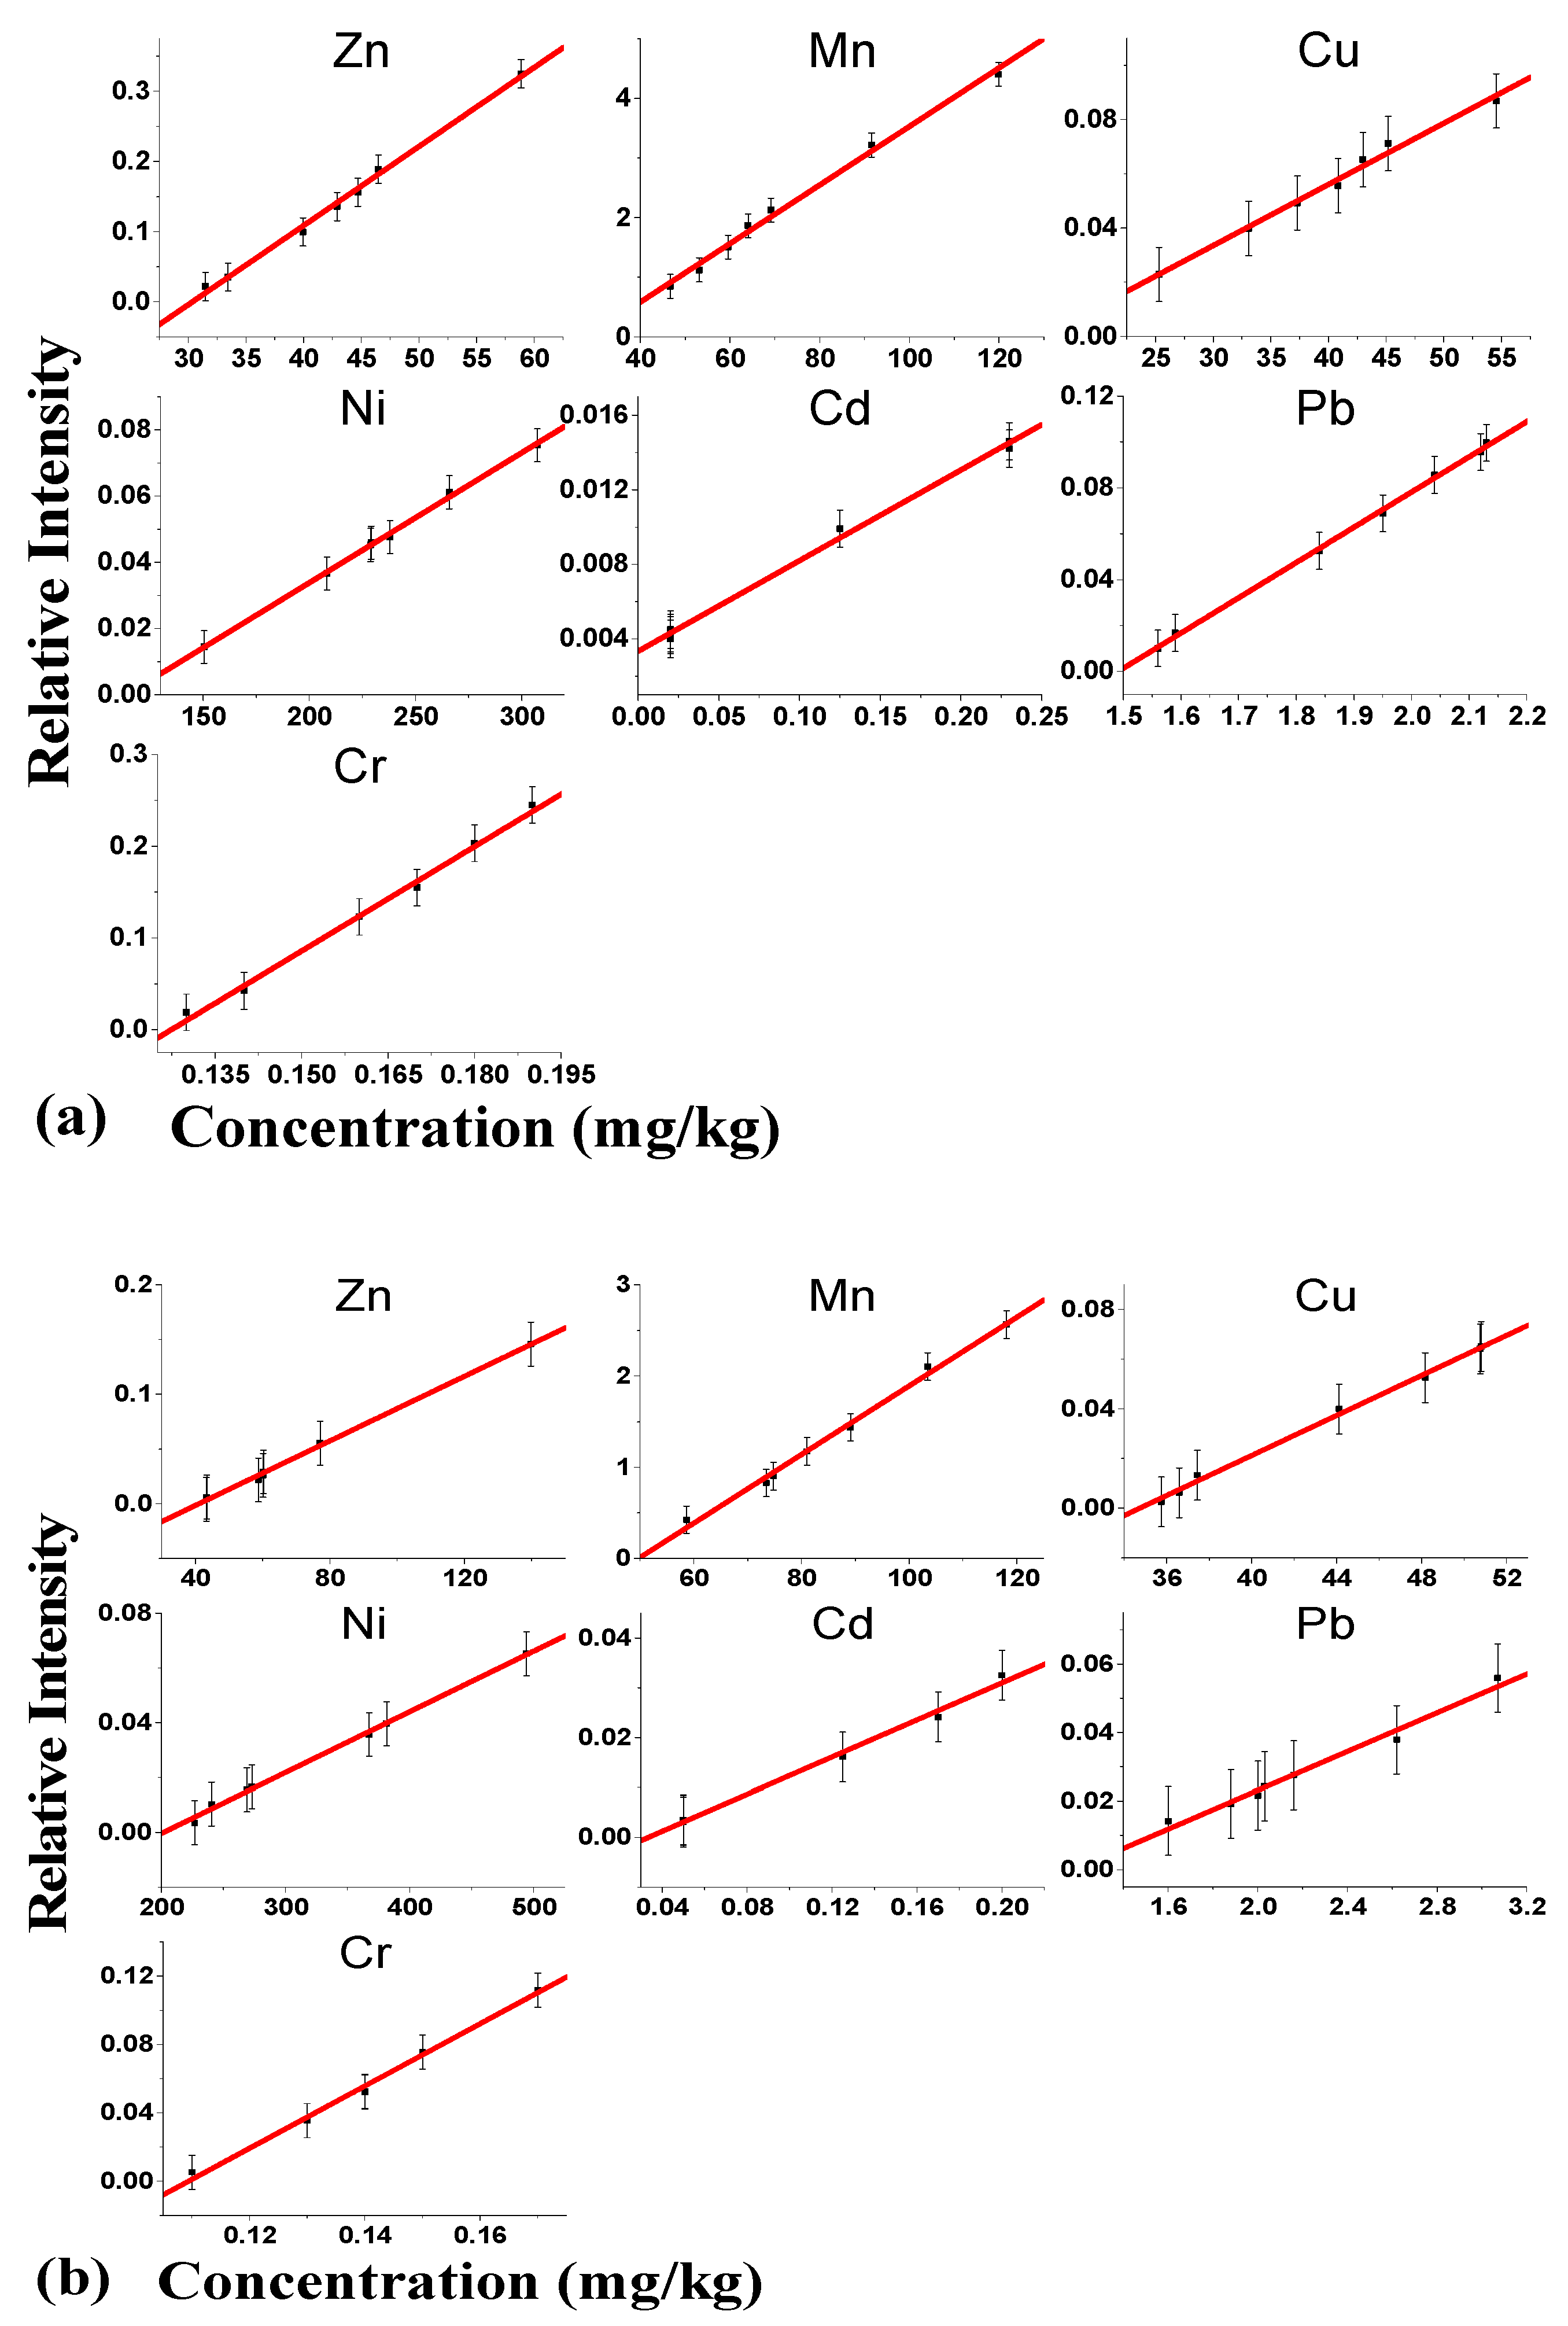
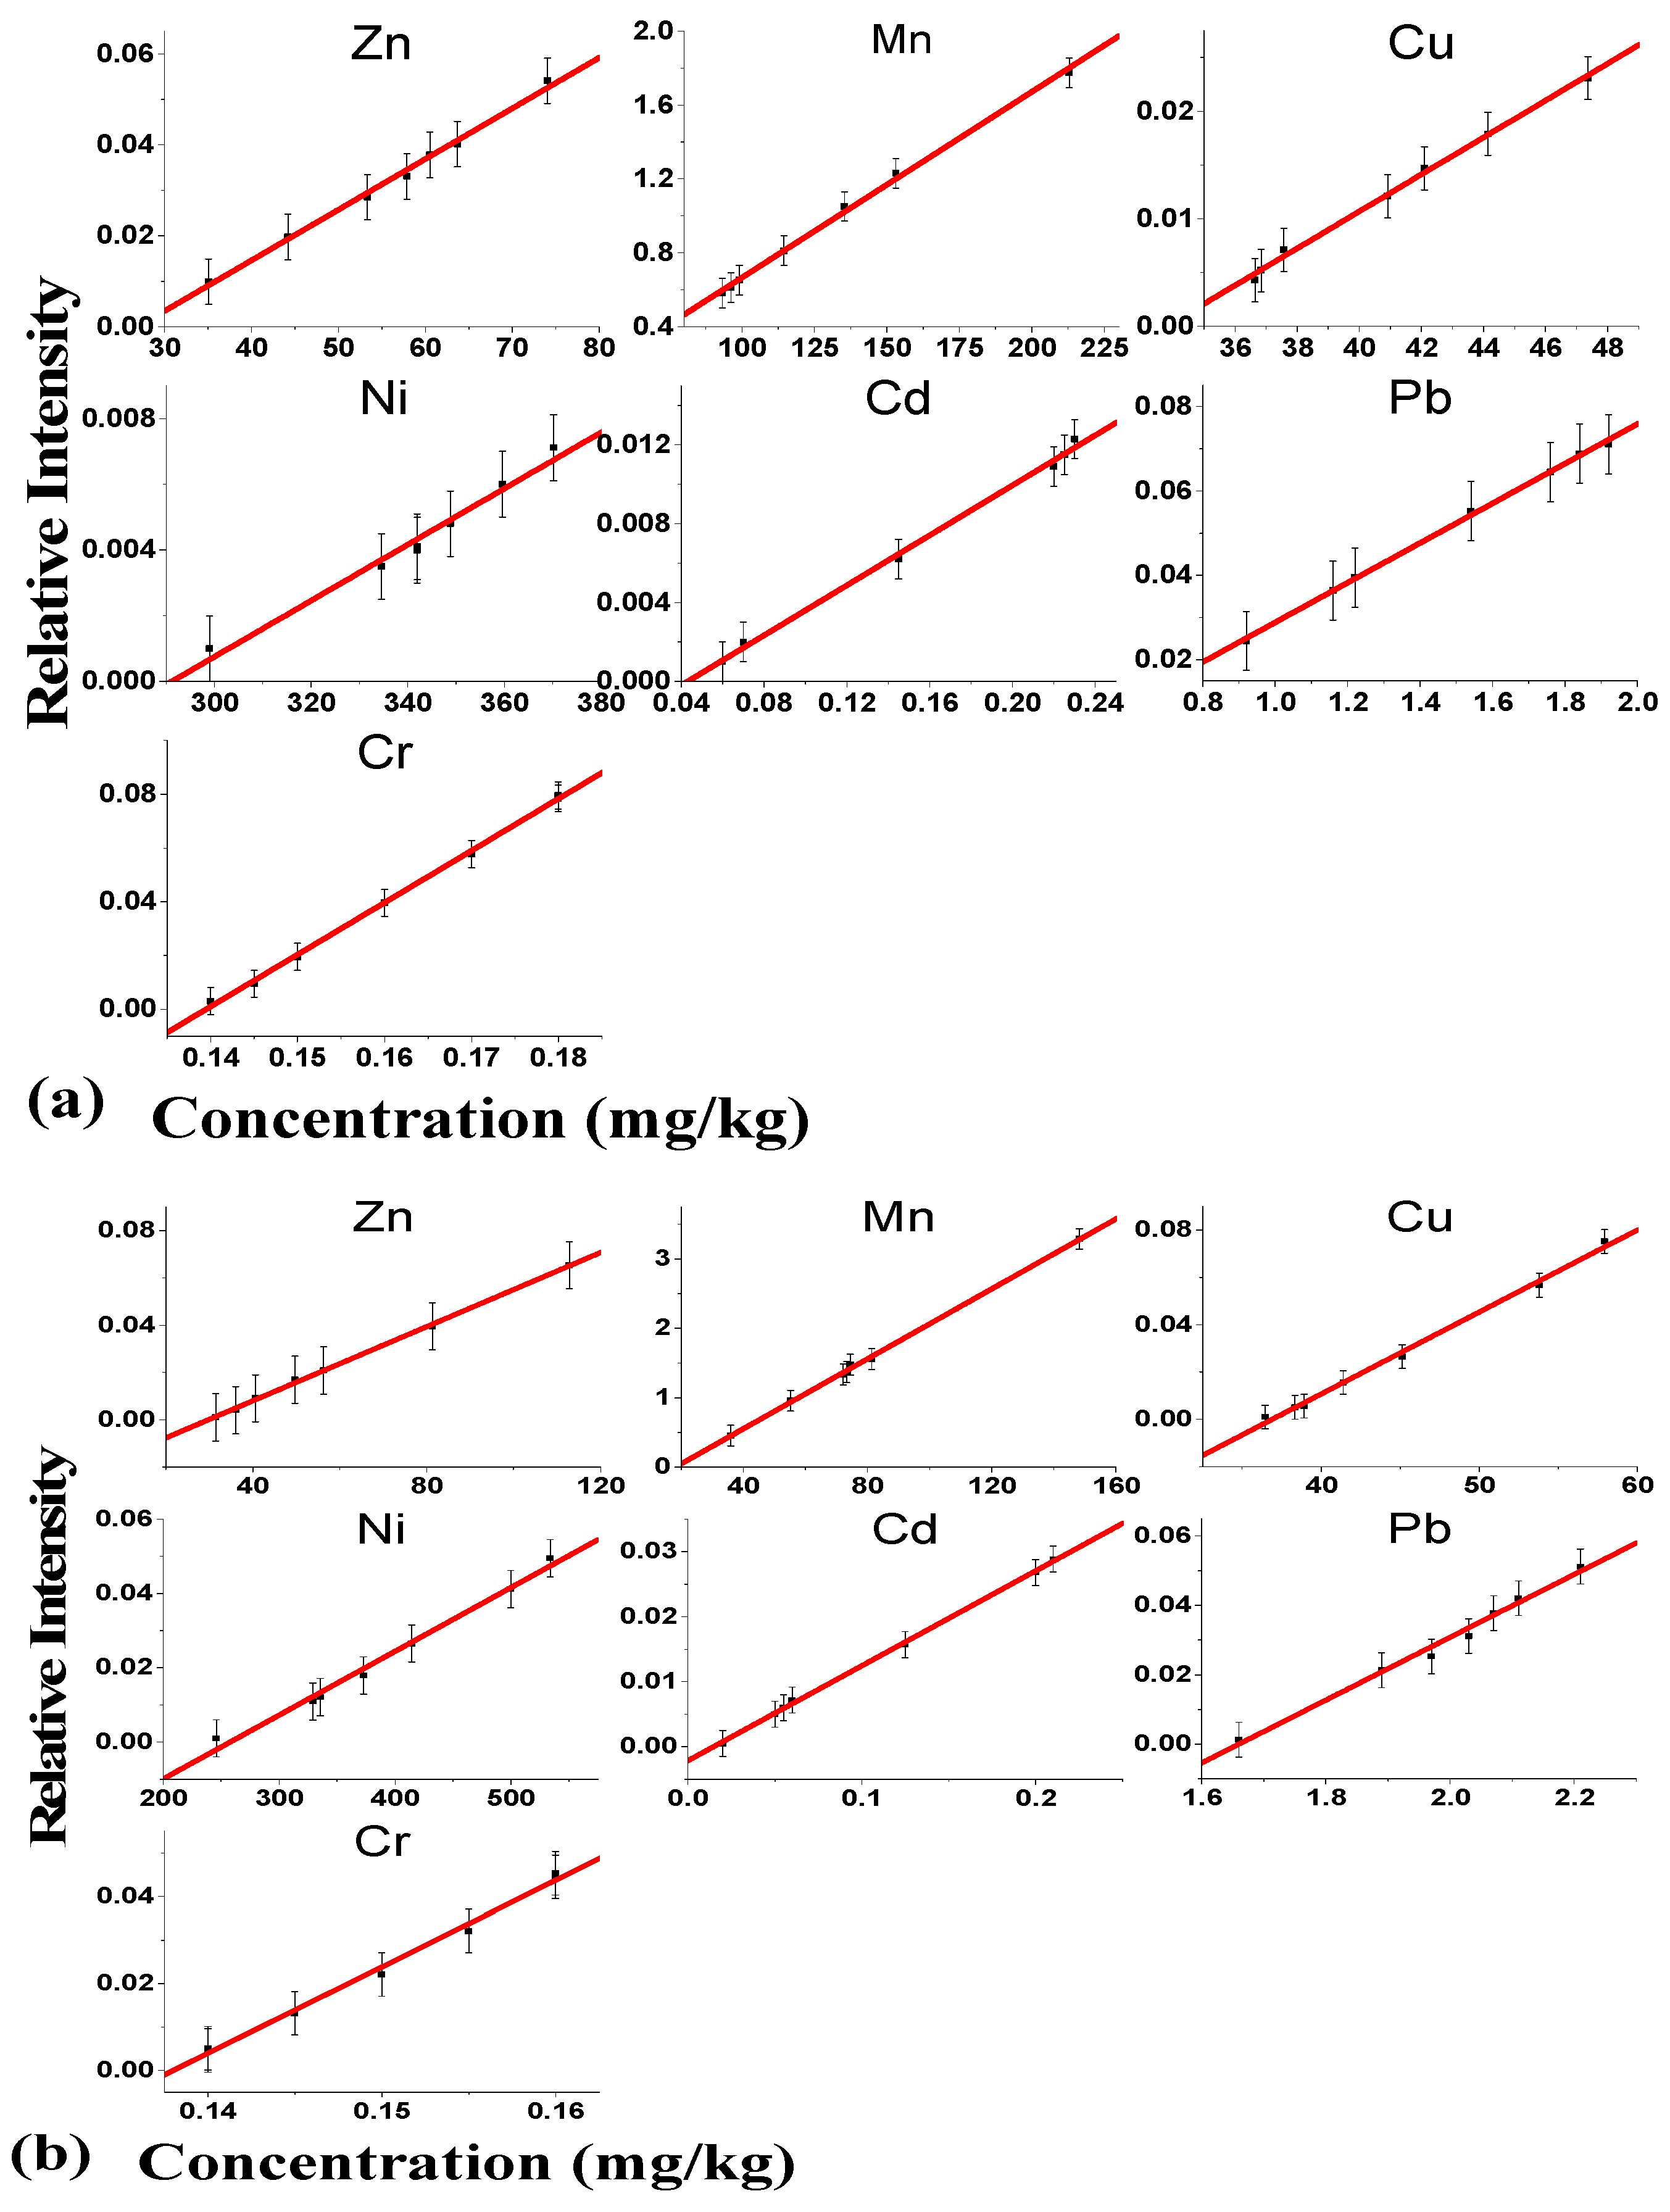
3.5. Content Calibration Studies

The calibration curves between the contents measured by FAAS and the Ps-LIBS signal intensity for the chosen spectral lines for the plant-associated soil and the plant sample parts (root and shoots) are shown in Figure 6, Figure 7 and Figure 8, respectively. Table 7, Table 8 and Table 9 show the examined metals’ fitting equation and standard error for the plant-associated soil and the plant sample parts (root and shoots), respectively.

4. Discussion

4.1. Heavy Metals Content in Lactuca sativa (Lettuce) and Trifollium alexandrinum (Clover) Parts (Roots and Shoots) and Their Associated Soil

The observed results from Table 2 indicate that for the soils associated with both types of plants, major elements (Mg, K, and Fe) were in the range of the permissible levels according to FAO/WHO [47]. For Zn, the measured values showed a high content (240 mg/kg) in site four for clover only, but on average, the mean values for Zn in both lettuce and clover soils varied between 15 mg/kg and about 40 mg/kg in the other sites. For Mn, the high content values were found in site four for clover, while the average mean values for Mn varied between 9 mg/kg and about 47 mg/kg for both plants’ soils in the other sites. We did not find a recognizable change in Cu abundance for both plants’ soils; the mean values vary between 18 mg/kg and 25 mg/kg in all sites for both plants’ soils. For Ni, unexpectedly high contents have been found in site two for lettuce, while the mean values varied between 12 mg/kg and 42 mg/kg for both soils in all other sites. There are no elevated values for Cd; the mean values varied between 7 mg/kg and 12 mg/kg for both plant soils in all sites. Also, elevated values were not found for both plants’ soils for Pb, while the average mean values varied between 4 mg/kg and 8 mg/kg in all sites. Similar behavior was found for Cr for both plants’ soils in the five sites, with mean values varying between 4 mg/kg and 7 mg/kg. This study shows that the soil in site four showed high contamination with most of these heavy elements. Site four is Al Mansouria village irrigated with sewage water, which may explain the high contents, especially for zinc and manganese.
The results in Table 3 indicate that major elements (Mg, K, and Fe) fall within permissible levels by FAO/WHO [44]. Clover showed high Zn (135 mg/kg), while average Zn in lettuce and clover roots ranged from 31 mg/kg to 77 mg/kg. Both clover (108 mg/kg) and lettuce (119 mg/kg) had the highest Mn contents at site four, while typical mean Mn values ranged from 58 mg/kg to around 103 mg/kg for roots in other sites.
Cu contents in the roots of both plants ranged from 25 mg/kg to 54 mg/kg across all sites, with no distinct changes. Ni was elevated in site three for clover and site five for lettuce; mean values in other locations ranged from 150 mg/kg to 273 mg/kg for both plants’ roots. Cd showed no high values, with mean values from 0.02 mg/kg to 0.23 mg/kg across sites. Pb measurements were not high; its mean values ranged from 1.5 mg/kg to 3 mg/kg. For Cr, levels in the roots of both plants ranged from 0.11 mg/kg to 0.19 mg/kg across sites.
Root samples revealed that site four (Al Mansouria village) had notable contamination, particularly zinc and manganese. Site five (Nikla village) had elevated nickel in clover roots, and site three (Mit Asem village) had elevated nickel in lettuce roots. Contamination sources in these sites may be linked to irrigation water contamination, high contents of fertilizers, and industry emissions [48].
Table 4 data reveal major elements (Mg, K, Fe) fall within FAO/WHO permissible levels [44]. Clover showed high Zn (112 mg/kg) at site four, while Zn in lettuce and clover shoots ranged from 31 mg/kg to 74 mg/kg at other sites. The highest Mn contents were at site three, clover (148 mg/kg), and lettuce (212 mg/kg); average Mn ranged from 36 mg/kg to 135 mg/kg in other sites. Cu contributions ranged from 36 mg/kg to 57 mg/kg in all sites for both plants’ shoots. Ni contents peaked at sites two and three (500 mg/kg and 534 mg/kg) for clover; other sites had 246 mg/kg to 370 mg/kg for shoots. Cd had no high values; mean Cd ranged from 0.05 mg/kg to 0.23 mg/kg. Pb contents ranged from 0.92 mg/kg to 2.21 mg/kg. Cr showed similar behavior across sites (0.14 mg/kg to 0.18 mg/kg).
This study’s shoot research highlights significant heavy metal contamination at site three, Mit Asem village, irrigated by the Nile from the Felfla canal. Plant metal contents vary due to soil, water, nutrition, permissibility, selectivity, and absorption capabilities [49]. Major and trace heavy elements content across the five sites (S1: Kafr Al-Arab, S2: Sindenhour, S3: Mit Asem, S4: Al Mansouria, S5: Nikla) are displayed in Table 2, Table 3 and Table 4, utilizing statistical analysis (ANOVA 1) [50]. Notably, the contents of heavy metals vary significantly in the lettuce and clover-associated soils’, roots, and shoots of lettuce and clover among different locations.

4.2. Pollution Index (PI) of the Soils

As shown in Table 5 and Figure 2, the proposed reasons for such high pollution indices may be the continuous irrigation of the investigated sites with contaminated water. The contaminated water may be polluted wastewater, sewage water, and industrial wastewater, as found during the current investigations in these sites, which may result in a high accumulation of heavy elements. The observed results agree with previous studies where the total heavy metal contents in soils were increased by contaminated water irrigation [51].
The current study revealed that the PI of Zn at the studied sites for both plants’ soils averaged 0.75 in Kafr Al-Arab and 10.61 in Al Mansouria. By calculating the PI on the previous results, we can conclude that the average value of PI in the agricultural soils along the highway between Damietta and Cairo in the Nile Delta, Egypt, was about 0.4 to 3.41 [52]. The more recent results demonstrated that the expected PI for Zn is consistent with the findings of the current investigation. In the current study, the PI of Mn in both plants’ soils in all sites ranged from 0.02 in Kafr Al-Arab to 1.74 in Al Mansouria, which was nearly in agreement with the PI obtained by El-Bady and Metwally [52]. For Cu, the average values of PI for both plants’ soils in all sites were about 6.16 in Kafr Al-Arab and 9.3 in Mit Asem, which was lower than those obtained by Mohamed S.M. EL-Bady [53]. Nickel’s PI in the investigated soils was found between 8.08 in Kafr Al-Arab and 141.84 in Sindenhour, which was in the range of the PI reported by Osman et al. [54], which was nearly 45.94. The PI of Cd for both plants’ soils in all sites was about 4.63 in Sindenhour and 6.8 in Kafr Al-Arab, while that of Pb at all sites was about 0.06 in Kafr Al-Arab and 0.1 in Sindenhour and Nikla. These results were higher than those found by El-Bady [53], which were predicted in the range of 0.06 to 0.59 for Cd, but lower than those predicted for Pb in the range of 1.58 to 3.49. The mean PI values for both plants’ soils in all sites of Cr were in the range of 0.04 in Kafr Al-Arab and Sindenhour to 0.07 in Mit Asem and Al Mansouria, which were lower than those found by Osman et al. [54], which were assumed to be about 1.07.
Zinc contents are rising unnaturally due to anthropogenic additions. Most Zn is added during industrial activities, such as mining, coal and waste combustion, and steel processing [55,56,57]. Elevated Mn content in the soil may primarily result from burning wastes, oil, and the metallurgical industry [58]. High contamination of the soil environment with Cu is strongly correlated with car traffic intensity [59]. Examples of such pesticides are copper-containing fungicidal sprays such as Bordeaux mixture (copper sulfate) and copper oxychloride [60]. The primary sources of Ni contamination in the soil are metal plating industries, the combustion of fossil fuels, and nickel mining and electroplating [61]. Applying agricultural inputs such as fertilizers, pesticides, and biosolids (sewage sludge), the disposal of industrial wastes, or the deposition of atmospheric contaminants increases the total content of Cd in soils [62]. The lower values of Cr suggest less traffic in this sampling area compared to larger cities with heavy traffic. The soil type affected Cr accumulation in the soil [63].
The most recent findings showed that most of the sites’ studied soil samples were contaminated with Zn, Cu, Ni, and Cd at higher levels than those permitted by Cal/EPA [43].

4.3. Bioaccumulation and Translocation Factors of Metals by Plants

Figure 3 and Figure 4 show that vegetables absorb heavy metals from contaminated soil, air, and water, especially leafy vegetables, which accumulate higher amounts of heavy metals in their leaves [64,65,66].
The bioaccumulation factor (BF) of metals in the plant roots and their translocation factor (TF) to the shoot were used to demonstrate the potential of the plant as a metal bio-accumulator in the phytoremediation process [67]. The investigated metals (Zn, Mn, Cu, and Ni) for L. sativa were accumulated in roots with BF > 1 in all sites, whereas for T. alexandrinum, (Zn) was accumulated in Kafr Al-Arab, Sindenour, and Mit Asem, and (Mn) was accumulated in Kafr Al-Arab, Sindenour, Mit Asem, and Nikla. The hyper-accumulation of certain metals varies with the examined plant species, as is evident from these results, which are consistent with those of other researchers [68,69]. The BF of the investigated metals for L. sativa fell in the order Ni > Mn > Cu > Zn > Pb > Cr > Cd, and that of T. alexandrinum was Ni > Mn > Cu > Zn > Pb > Cr > Cd. In the present study, most of the investigated heavy metals in the two plants had TF > 1 in all sites, as previously found by Zoufan et al. [70]. Like rootstalk and fruit vegetables, leafy vegetables had relatively higher TF of heavy metals, suggesting that leafy vegetables have higher transportation rates than other vegetable types [71]. TF and BC values > 1 can be considered hyper-accumulators for the respective metals [68,69,72,73]. Lactuca sativa had BF and TF > 1 for Zn, Mn, Cu, and Ni, while those of T. alexandrinum were > 1 for Cu and Ni. For the soils associated with T. alexandrinum, the locations Kafr Al-Arab, Sindenhour, Mit Asem, and Nikla are suitable for Zn and Mn accumulation and unsuitable in Al Mansouria. The latter result is consistent with Sabir et al. [74]. However, the two plants can be considered an excluder for Cd, Pb, and Cr, where they have BF and TF < 1.

4.4. Ps-LIBS Spectrum Studies

The observations of Figure 5 and Table 6 indicate that the appearance of the Ps-LIBS element spectral lines proved the presence of the metal in the sample matrix [41,75].
The observed results show characteristic emission lines for the studied elements as follows: two lines (324.75 nm and 327.39 nm) for Cu and only one line for Pb (283.31 nm) was detected. Also, two lines (279.48 nm and 280.11 nm) for Mn, as well as the lines (236.47 nm, 234.55 nm, 228.8 nm, and 213.85 nm) for Cr, Ni, Cd, and Zn, respectively, were analyzed. The signal intensities of the elemental characteristic spectral lines depend on the content of the element in the sample matrix [76].

4.5. Content Calibration Studies

As mentioned in Section 3.4, calibration curves within LIBS are pivotal for generating reliable quantitative analyses [77]. Fundamental tools, such as spectral line or peak intensity, are plotted against known element contents [78]. Through calibration, the accuracy and precision of measurements are markedly enhanced, establishing a correlation between spectral signals and actual element contents [79,80,81]. Knowledge of the dynamic range of the LIBS system aids in deciding potential sample dilution or content adjustments. Calibration elucidates linear or polynomial-logarithmic content-intensity relationships. Regular calibrations compensate for system drift caused by laser degradation, detector aging, or environmental shifts. Generating calibration curves for diverse matrices enhances cross-matrix analysis, highlighting plasma condition disparities [81]. In the current work, the analysis of Figure 6, Figure 7 and Figure 8 and Table 7, Table 8 and Table 9 indicate that the association between a rise in the metal content as determined by FAAS and a linear increase in the Ps-LIBS signal for the wavelength of the various metals in both plants’ soils, shoots, and roots shows a high correlation coefficient of 0.975 ± 0.05. A rise in the metal content in the target ablated volume causes an increase in the absorbed laser pulse energy due to an increase in the ablated mass. This performance, in turn, causes an increase in the Ps-LIBS signal intensity due to an increase in the target plasma electron temperature and density [82,83,84,85].

4.6. Factors Influencing Heavy Metal Content

The presence of high levels of heavy metals such as copper, nickel, and cadmium in soil and their bioaccumulation in Lactuca sativa and Trifolium alexandrinum is mentioned in the above sections to be related to different water irrigation sources which may be contaminated. However, different factors, including contaminated water irrigation concerns, may also be attributed to various factors. These potential factors can be discussed as follows:

4.6.1. Contaminated Water Irrigation

Utilizing contaminated water for irrigation is another prominent factor influencing heavy metal content in soil and plants. Water contaminated with heavy metals, either from industrial effluents, sewage, or natural deposits, can lead to the accumulation of these toxic elements in the soil. Consequently, plants irrigated with such water absorb and accumulate heavy metals, impacting their growth quality, and these heavy metals potentially enter the food chain [86].

4.6.2. Environmental Conditions

Heavy metals in the environment often stem from industrial processes and wastewater disposal, with both natural and anthropogenic activities contributing to the contamination of ecosystems [87].

4.6.3. Soil Characteristics

The chemical and physical properties of soil, such as pH, texture, and composition, are pivotal in heavy metals’ retention, mobility, and bioavailability [88].

4.6.4. Plant Species Attributes

Different plant species exhibit varied capacities for the bioaccumulation and translocation of heavy metals, influencing the potential health risks associated with these metals [89].

4.6.5. Climatic Influences

Weather patterns, including rainfall and temperature, can impact heavy metals’ distribution and concentration levels in soil and plants [90].

4.6.6. Human Activities

Activities such as agricultural practices involving chemical use and urban expansion significantly contribute to increasing soil heavy metal levels [91].
The above discourse represents a preliminary overview of the potential factors influencing heavy metal content in soil and plants. A more detailed, exhaustive, and nuanced discussion and analysis, incorporating a more comprehensive range of variables and contextual factors, may be undertaken in future research endeavors to deepen our understanding and develop targeted mitigation strategies.
Given the discerned elevated contamination levels evident in the sites under the current study, it is prudent to institute an adequate contamination remediation facility within areas exhibiting substantial contamination to ameliorate prevailing public health apprehensions.

5. Conclusions

This study employed FAAS and Ps-LIBS as advanced analytical techniques to assess heavy metal contents in lettuce and clover and their associated soil samples from some sites in Egypt. Both plant species exhibited high bioaccumulation factors for multiple metals, notably copper, nickel, and cadmium. These contents exceeded permissible safety limits, posing significant health risks. The results revealed elevated copper, nickel, and cadmium pollution indices across all sites. These findings underscore the urgent need for wastewater treatment solutions, particularly in identified high-risk areas. The study emphasizes the efficacy of the developed spectroscopic method in identifying contamination in the studied sites. Based on the results, it is advisable to establish an efficient contamination treatment facility in high content regions to address public health concerns.

Author Contributions

Conceptualization: W.T.; Sample collection: N.F. and A.K.; methodology FAAS: N.F., S.H. and W.M.; methodology LIBS, software, validation, formal analysis, resources and investigation: M.F., W.T. and N.F.; writing—original draft preparation: M.F., W.T., A.K. and N.F.; writing—review and editing: M.F., W.T. and N.F. All authors have read and agreed to the published version of the manuscript.

Funding

This research received no external funding.

Data Availability Statement

The datasets used and/or analyzed during the current study are available from the corresponding author upon reasonable request.

Conflicts of Interest

The authors declare no conflict of interest.

References

  1. Song, B.; Zeng, G.; Gong, J.; Liang, J.; Xu, P.; Liu, Z.; Zhang, Y.; Zhang, C.; Cheng, M.; Liu, Y.; et al. Evaluation Methods for Assessing Effectiveness of in Situ Remediation of Soil and Sediment Contaminated with Organic Pollutants and Heavy Metals. Environ. Int. 2017, 105, 43–55. [Google Scholar]
  2. Yohannes, H.; Elias, E. Contamination of Rivers and Water Reservoirs in and Around Addis Ababa City and Actions to Combat It. Environ. Pollut. Clim. Chang. 2017, 1, 116. [Google Scholar] [CrossRef]
  3. Proshad, R.; Kormoker, T.; Mursheed, N.; Monirul Islam, M.; Bhuyan, M.I.; Sazedul Islam, M.; Mithu, T.N. Heavy Metal Toxicity in Agricultural Soil Due to Rapid Industrialization in Bangladesh: A Review. Int. J. Adv. Geosci. 2018, 6, 83. [Google Scholar] [CrossRef]
  4. Ahmed, A.; Sara Taha, A.; Sundas, R.Q.; Man-Qun, W. Heavy Metals and Pesticides Toxicity in Agricultural Soil and Plants: Ecological Risks and Human Health Implications. Toxics 2021, 9, 42. [Google Scholar]
  5. Ding, Y.; Xia, G.; Ji, H.; Xiong, X. Accurate Quantitative Determination of Heavy Metals in Oily Soil by Laser Induced Breakdown Spectroscopy (LIBS) Combined with Interval Partial Least Squares (IPLS). Anal. Methods 2019, 11, 3657–3664. [Google Scholar] [CrossRef]
  6. Tadesse, M.; Tsegaye, D.; Girma, G. Assessment of the Level of Some Physico-Chemical Parameters and Heavy Metals of Rebu River in Oromia Region, Ethiopia. MOJ Biol. Med. 2018, 3, 99–118. [Google Scholar] [CrossRef]
  7. Shobha, N.; Kalshetty, B.M. Assessment of Heavy Metals in Green Vegetables and Cereals Collected from Jamkhandi Local Market, Bagalkot, India. Rasayan J. Chem. 2017, 10, 124–135. [Google Scholar] [CrossRef]
  8. Kilicel, F.; Karapinar, H.S.; Uğuz, A. Determination of Some Heavy Metal Concentrations of Sage Tea with FAAS. Int J Second Metab 2017, 4, 391–399. [Google Scholar] [CrossRef]
  9. Tsanuo, K.M. Determination of lead, cadmium and nickel in henna leaves and cosmetic henna products within lamu county, kenya. Ph.D. Thesis, Kenyatta University, Nairobi, Kenya, 2018. [Google Scholar]
  10. Fayek, N.; Tawfik, W.; Khalafallah, A.; Hamed, S.; Mousa, W. Spectroscopic Study of Cu, Mn, Cd as Heavy Metals in Agricultural Samples. IOP Conf. Ser. Mater. Sci. Eng. 2021, 1171, 012001. [Google Scholar] [CrossRef]
  11. Mankoula, A.F.; Tawfik, W.; Gagnon, J.E.; Fryer, B.J.; El-Mekawy, F.; Shaheen, M.E. Assessment of Heavy Metals Content in the Agricultural Soils of Kafr El-Zayat Egypt Using Laser Ablation Inductively Coupled Plasma Mass Spectrometry and Inductively Coupled Plasma Optical Emission Spectroscopy. Egypt. J. Chem. 2021, 64, 1167–1177. [Google Scholar] [CrossRef]
  12. Seddon, E.A.; Poole, M.W. The Origins and Development of Free-Electron Lasers in the UK. Notes Rec. R. Soc. J. Hist. Sci. 2023, 1–49. [Google Scholar] [CrossRef]
  13. Khelif, L.; Bellout, Y.; Djebbar, R.; Abrous-Belbachir, O. Efficacy of Avena sativa L. and Trifolium alexandrinum L. Test System for Detecting the Genotoxic and Phytotoxic Potential of Water Pollution. Appl. Ecol. Environ. Res. 2016, 14, 325–342. [Google Scholar] [CrossRef]
  14. Tsioubri, M.; Gasparatos, D.; Economou-Eliopoulos, M. Selenium Uptake by Lettuce (Lactuca sativa L.) and Berseem (Trifolium alexandrinum L.) as Affected by the Application of Sodium Selenate, Soil Acidity and Organic Matter Content. Plants 2020, 9, 605. [Google Scholar] [CrossRef] [PubMed]
  15. Cremers, D.A.; Radziemski, L.J. Handbook of Laser-Induced Breakdown Spectroscopy; John Wiley & Sons: Hoboken, NJ, USA, 2013. [Google Scholar]
  16. Harmon, R.S.; Senesi, G.S. Laser-Induced Breakdown Spectroscopy—A Geochemical Tool for the 21st Century. Appl. Geochem. 2021, 128, 104929. [Google Scholar] [CrossRef]
  17. Zettner, A. Principles and applications of atomic absorption spectroscopy. Adv. Clin. Chem. 1964, 7, 1–62. [Google Scholar] [PubMed]
  18. Anabitarte, F.; Cobo, A.; Lopez-Higuera, J.M. Laser-Induced Breakdown Spectroscopy: Fundamentals, Applications, and Challenges. ISRN Spectrosc. 2012, 2012, 285240. [Google Scholar] [CrossRef]
  19. Tawfik, W. Recent Advances in the Investigation of Textiles Using Laser-Induced Breakdown Spectroscopy (LIBS). Preserv. Restor. Tech. Anc. Egypt. Text. 2022, 143–163. [Google Scholar] [CrossRef]
  20. Wang, Z.; Afgan, M.S.; Gu, W.; Song, Y.; Wang, Y.; Hou, Z.; Song, W.; Li, Z. Recent Advances in Laser-Induced Breakdown Spectroscopy Quantification: From Fundamental Understanding to Data Processing. Trends Anal. Chem. 2021, 143, 116385. [Google Scholar] [CrossRef]
  21. Ahmed, H.E.; Al-Zahrani, A.A. Preservation and Restoration Techniques for Ancient Egyptian Textiles; IGI Global: London, UK, 2023; p. 272. [Google Scholar]
  22. Naeem, M.A.; Iqbal, M.; Amin, N.; Musadiq, M.; Jamil, Y.; Cecil, F. Measurement of Electron Density and Temperature of Laser-Induced Copper Plasma. Asian J. Chem. 2013, 25, 2192–2198. [Google Scholar] [CrossRef]
  23. Farooq, W.A.; Rasool, K.G.; Tawfik, W.; Aldawood, A.S. Application of Laser Induced Breakdown Spectroscopy in Early Detection of Red Palm Weevil: (Rhynchophorus ferrugineus) Infestation in Date Palm. Plasma Sci. Technol. 2015, 17, 948–952. [Google Scholar] [CrossRef]
  24. Soliman, M.; Tawfik, W.; Harith, M. Quantitative Elemental Analysis of Agricultural Drainage Water Using Laser Induced Breakdown Spectroscopy. In Proceedings of the First Cairo Conference on Plasma Physics and Applications: CCPPA 2003, Cairo, Egypt, 11–15 October 2003; Volume 34, pp. 240–243. [Google Scholar]
  25. Sawaf, S.; Tawfik, W. Analysis of Heavy Elements in Water with High Sensitivity Using Laser Induced Breakdown Spectroscopy. Optoelectron. Adv. Mater. Rapid Commun. 2014, 8, 414–417. [Google Scholar]
  26. Tawfik, W.; Sawaf, S. Approaching the Ppb Detection Limits for Copper in Water Using Laser Induced Breakdown Spectroscopy. In Proceedings of the SPIE Sensing Technology + Applications, Baltimore, MD, USA, 5–9 May 2014; p. 9101. [Google Scholar]
  27. Tawfik, W.; Farooq, W.; Al-Mutairi, F.; Alahmed, Z. Monitoring of Inorganic Elements in Desert Soil Using Laser-Induced Breakdown Spectroscopy. Lasers Eng. 2015, 32, 129–140. [Google Scholar]
  28. Farooq, W.A.; Tawfik, W.; Al-Mutairi, F.N.; Alahmed, Z.A. Qualitative Analysis and Plasma Characteristics of Soil from a Desert Area Using LIBS Technique. J. Opt. Soc. Korea 2013, 17, 548–558. [Google Scholar] [CrossRef]
  29. Tawfik, W.; Bousiakou, L.G.; Qindeel, R.; Farooq, W.A.; Alonizan, N.H.; Fatani, A.J. Trace Analysis of Heavy Metals in Groundwater Samples Using Laser Induced Breakdown Spectroscopy (LIBS). Optoelectron. Adv. Mater. Rapid Commun. 2015, 9, 185–192. [Google Scholar]
  30. Xu, Y.; Yamaji, N.; Shen, R.; Ma, J.F. Sorghum Roots Are Inefficient in Uptake of EDTA-Chelated Lead. Ann. Bot. 2007, 99, 869–875. [Google Scholar] [CrossRef]
  31. Allan, J.; Mitchell, T.; Harborne, N.; Bohm, L.; Crane-Robinson, C. Roles of H1 Domains in Determining Higher Order Chromatin Structure and H1 Location. J. Mol. Biol. 1986, 187, 591–601. [Google Scholar] [CrossRef]
  32. Scientific, T.F. Thermo Solaar S4; Thermo Fisher Scientific: Waltham, MA. USA, 2023. [Google Scholar]
  33. Liu, W.H.; Zhao, J.Z.; Ouyang, Z.Y.; Söderlund, L.; Liu, G.H. Impacts of Sewage Irrigation on Heavy Metal Distribution and Contamination in Beijing, China. Environ. Int. 2005, 31, 805–812. [Google Scholar] [CrossRef]
  34. Schnoor, J.L. Phytoremediation of Soil and Groundwater; Technol. Eval. Rep. TE-02-01; Ground-Water Remediation Technologies Analysis Center (GWRTAC): Pittsburgh, PA, USA, 2002. [Google Scholar]
  35. Baker, A.J.; Walker, P.L. Ecophysiology of Metal Uptake by Tolerant Plants. In Heavy Metal Tolerance in Plants: Evolutionary Aspects; CRC Press: Boca Raton, USA, 1990; pp. 155–177. [Google Scholar]
  36. Fitz, W.J.; Wenzel, W.W. Arsenic Transformations in the Soil-Rhizosphere-Plant System: Fundamentals and Potential Application to Phytoremediation. J. Biotechnol. 2002, 99, 259–278. [Google Scholar] [CrossRef]
  37. Baker, A.J.; Brooks, R. Terrestrial Higher Plants Which Hyperaccumulate Metallic Elements. A Review of Their Distribution, Ecology and Phytochemistry. Bio. Recover. 1989, 1, 81–126. [Google Scholar]
  38. Al-Salman, I.M.; Abdul-Aziz, M. Lead Bio-Accumulation in Baghdad City-Iraq. Jordan J. Appl. Sci. 2002, 4, 6–11. [Google Scholar]
  39. Kaba, P.; Shushi, S.; Gyimah, E.; Husein, M.; Abomohra, A. Multivariate Analysis of Heavy Metals and Human Health Risk Implications Associated with Fish Consumption from the Yangtze River in Zhenjiang City, China. Water 2023, 15, 1999. [Google Scholar] [CrossRef]
  40. Walker, S.; Stevenson, B.; Peterson, J.; Donati, G.; Jones, B. Determining Micro- and Macro-Elements by Flame Atomic Absorption Determining Micro- and Macro Metals by Flame Atomic Absorption Spectrometry. Chem. Educator 2016, 21, 264–272. [Google Scholar]
  41. Fikry, M.; Tawfik, W.; Omar, M.M. Spectroscopic Determination of the Stark Broadening Parameters of Al (I) 305.007 Nm in Atmospheric Air Using Picosecond Time-Resolved LIPS. J. Mol. Struct. 2023, 1276, 134796. [Google Scholar] [CrossRef]
  42. Elliethy, M.; Ragab, A.A.; Bedair, R.; Khafagi, O.M. Assessment of Nutrients and Heavy Metals Content in Soil and Some Vegetables Cultivated in Agricultural Land around El-Khashab Canal (Helwan-El Saff Area). Int. J. Theor. Appl. Res. 2022, 1, 27–37. [Google Scholar] [CrossRef]
  43. California EPA. California Environmental Protection Agency, State Water Resources Control Board. Total Maximum Daily Load Program: Background and Information; California Environmental Protection Agency: Sacramento, CA, USA, 2010. [Google Scholar]
  44. Food Agriculture Organization; World Health Organization. Protein and Amino Acid Requirements in Human Nutrition: Report of a Joint FAO/WHO/UNU Expert Consultation; World Health Organization: Geneva, Switzerland, 2007; Available online: https://iris.who.int/bitstream/handle/10665/43411/WHO?sequence=1 (accessed on 8 March 2023).
  45. Fikry, M.; Tawfik, W.; Omar, M. Controlling the Plasma Electron Number Density of Copper Metal Using NIR Picosecond Laser-Induced Plasma Spectroscopy. Opt. Appl. 2021, 51, 365–374. [Google Scholar] [CrossRef]
  46. Kramida, A.; Yu, R.; Reader, J. Team 2013 NIST Atomic Spectra Database; Version 5-4; National Institute of Standards and Technology: Gaithersburg, MD, USA, 2019. [Google Scholar]
  47. Joint FAO/WHO Expert Committee on Food Additives; World Health Organization. Safety Evaluation of Certain Mycotoxins in Food; World Health Organization: Geneva, Switzerland, 2004. [Google Scholar]
  48. Hussein, M.; Ali, M.; Abbas, M.; Bassouny, M. Effects of Industrialization Processes in Giza Factories (Egypt) on Soil and Water Quality in Adjacent Territories. Egypt J. Soil Sci. 2022, 62, 253–2661. [Google Scholar] [CrossRef]
  49. Ahmad, J.U.; Goni, M.A. Heavy Metal Contamination in Water, Soil, and Vegetables of the Industrial Areas in Dhaka, Bangladesh. Environ. Monit. Assess. 2010, 166, 347–357. [Google Scholar] [CrossRef] [PubMed]
  50. Heiberger, R.M.; Holland, B.; Heiberger, R.M.; Holland, B. One-Way Analysis of Variance. In Statistical Analysis and Data Display; Springer: New York, NY, USA, 2015; pp. 167–197. [Google Scholar] [CrossRef]
  51. Mahmoud, E.; Ghoneim, M.A. Effect of Polluted Water on Soil and Plant Contamination by Heavy Metals in El-Mahla El-Kobra, Egypt. Solid Earth 2016, 7, 703–711. [Google Scholar] [CrossRef]
  52. El-Bady, M.S.M.; Metwally, H.I. A Study of Heavy Metals Contamination in the Agricultural Soils along the Highway between Damietta and Cairo in the Nile Delta, Egypt. Middle East. J. Appl. Sci. 2019, 9, 125–133. [Google Scholar]
  53. El-Bady, M. Road Dust Pollution by Heavy Metals along the Sides of Expressway between Benha and Cairo, Southern of Nile Delta, Egypt. Geochem. J. 2014, 4, 177–191. [Google Scholar]
  54. Osman, R.; Melegy, A.; Dawood, Y.; Gad, A. Distribution of Some Potentially Toxic Heavy Metals in the Soil of Shoubra El Kheima, Egypt. Egypt. J. Chem. 2021, 64, 1965–1980. [Google Scholar] [CrossRef]
  55. Wuana, R.A.; Okieimen, F.E. Heavy Metals in Contaminated Soils: A Review of Sources, Chemistry, Risks and Best Available Strategies for Remediation. ISRN Ecol. 2011, 2011, 402647. [Google Scholar] [CrossRef]
  56. Su, R.; Xie, T.; Yao, H.; Chen, Y.; Wang, H.; Dai, X.; Wang, Y.; Shi, L.; Luo, Y. Lead Responses and Tolerance Mechanisms of Koelreuteria Paniculata: A Newly Potential Plant for Sustainable Phytoremediation of Pb-Contaminated Soil. Int. J. Environ. Res. Public Health 2022, 19, 14968. [Google Scholar] [CrossRef] [PubMed]
  57. Su, R.; Ou, Q.; Wang, H.; Dai, X.; Chen, Y.; Luo, Y.; Yao, H.; Ouyang, D.; Li, Z.; Wang, Z. Organic–Inorganic Composite Modifiers Enhance Restoration Potential of Nerium oleander L. to Lead–Zinc Tailing: Application of Phytoremediation. Environ. Sci. Pollut. Res. 2023, 30, 56569–56579. [Google Scholar] [CrossRef]
  58. Łukasiewicz, S. The Physical Structure of the Land, Organic Substances Content, and the Chemical Composition of Soil Comprising the Subsoil of 21 Urban Greenery Locations in the Territory of Poznań. Part IV. Content of Microelements: Cl, Fe, Mn, Zn, Cu, B and Na. Physiogr. Res. 2012, 63, 49–75. [Google Scholar]
  59. Foti, L.; Dubs, F.; Gignoux, J.; Lata, J.C.; Lerch, T.Z.; Mathieu, J.; Nold, F.; Nunan, N.; Raynaud, X.; Abbadie, L.; et al. Trace Element Concentrations along a Gradient of Urban Pressure in Forest and Lawn Soils of the Paris Region (France). Sci. Total Environ. 2017, 598, 938–948. [Google Scholar] [CrossRef]
  60. Fahrenfeld, N.L.; Arbuckle-Keil, G.; Naderi Beni, N.; Bartelt-Hunt, S.L.; De Villiers, S.; Prata, J.C.; da Costa, J.P.J.P.; Lopes, I.; Duarte, A.C.; Rocha-Santos, T.; et al. Study of Marine Debris around a Tourist City in East China: Implication for Waste Management. Sci. Total Environ. 2019, 161, 278–289. [Google Scholar]
  61. Khodadoust, A.P.; Reddy, K.R.; Maturi, K. Removal of Nickel and Phenanthrene from Kaolin Soil Using Different Extractants. Environ. Eng. Sci. 2004, 21, 691–704. [Google Scholar] [CrossRef]
  62. Rashid, A.; Schutte, B.J.; Ulery, A.; Deyholos, M.K.; Sanogo, S.; Lehnhoff, E.A.; Beck, L. Heavy Metal Contamination in Agricultural Soil: Environmental Pollutants Affecting Crop Health. Agronomy 2023, 13, 1521. [Google Scholar]
  63. Ahmad, T.; Ahmad, K.; Khan, Z.I.; Munir, Z.; Khalofah, A.; Al-Qthanin, R.N.; Alsubeie, M.S.; Alamri, S.; Hashem, M.; Farooq, S.; et al. Chromium Accumulation in Soil, Water and Forage Samples in Automobile Emission Area. Saudi J. Biol. Sci. 2021, 28, 3517–3522. [Google Scholar] [CrossRef]
  64. Alfaro, M.R.; Ugarte, O.M.; Lima, L.H.V.; Silva, J.R.; da Silva, F.B.V.; da Silva Lins, S.A.; do Nascimento, C.W.A. Risk Assessment of Heavy Metals in Soils and Edible Parts of Vegetables Grown on Sites Contaminated by an Abandoned Steel Plant in Havana. Environ. Geochem. Health 2022, 44, 43–56. [Google Scholar] [CrossRef] [PubMed]
  65. Yaashikaa, P.R.; Kumar, P.S.; Jeevanantham, S.; Saravanan, R. A Review on Bioremediation Approach for Heavy Metal Detoxification and Accumulation in Plants. Environ. Pollut. 2022, 301, 119035. [Google Scholar] [CrossRef] [PubMed]
  66. Yu, H.; Chen, F.; Ma, J.; Khan, Z.I.; Hussain, M.I.; Javaid, I.; Ahmad, K.; Nazar, S.; Akhtar, S.; Ejaz, A.; et al. Comparative Evaluation of Groundwater, Wastewater and Canal Water for Irrigation on Toxic Metal Accumulation in Soil and Vegetable: Pollution Load and Health Risk Assessment. Agric. Water Manag. 2022, 264, 107515. [Google Scholar] [CrossRef]
  67. Eltaher, G.T.; Ahmed, D.A.; El-Beheiry, M.; Sharaf El-Din, A. Biomass Estimation and Heavy Metal Accumulation by Pluchea Dioscoridis (L.) DC. in the Middle Nile Delta, (Egypt): Perspectives for Phytoremediation. S. Afr. J. Bot. 2019, 127, 153–166. [Google Scholar] [CrossRef]
  68. Kumar, P.; Dipti; Kumar, S.; Singh, R.P. Severe Contamination of Carcinogenic Heavy Metals and Metalloid in Agroecosystems and Their Associated Health Risk Assessment. Environ. Pollut. 2022, 301, 118953. [Google Scholar] [CrossRef] [PubMed]
  69. Teng, Y.; Li, Z.; Yu, A.; Guan, W.; Wang, Z.; Yu, H.; Zou, L. Phytoremediation of Cadmium-Contaminated Soils by Solanum nigrum L. Enhanced with Biodegradable Chelating Agents. Environ. Sci. Pollut. Res. 2022, 29, 56750–56759. [Google Scholar] [CrossRef]
  70. Zoufan, P.; Jalali, R.; Karimiafshar, A.; Motamedi, H. Assessment of Heavy Metal Accumulation and Antibacterial Activity of Some Medicinal Herbs Grown in an Industrial Area of Steel Production, Ahvaz. Iran. J. Pharm. Sci. 2017, 13, 73–86. [Google Scholar]
  71. Hu, W.; Huang, B.; Tian, K.; Holm, P.E.; Zhang, Y. Heavy Metals in Intensive Greenhouse Vegetable Production Systems along Yellow Sea of China: Levels, Transfer and Health Risk. Chemosphere 2017, 167, 82–90. [Google Scholar] [CrossRef]
  72. Chandra, R.; Kumar, V. Phytoextraction of Heavy Metals by Potential Native Plants and Their Microscopic Observation of Root Growing on Stabilised Distillery Sludge as a Prospective Tool for in Situ Phytoremediation of Industrial Waste. Environ. Sci. Pollut. Res. 2017, 24, 2605–2619. [Google Scholar] [CrossRef]
  73. Ali, J.; Khan, S.; Khan, A.; Waqas, M.; Nasir, M.J. Contamination of Soil with Potentially Toxic Metals and Their Bioaccumulation in Wheat and Associated Health Risk. Environ. Monit. Assess. 2020, 192, 3746. [Google Scholar] [CrossRef]
  74. Sabir, M.; Baltrėnaitė-Gedienė, E.; Ditta, A.; Ullah, H.; Kanwal, A.; Ullah, S.; Faraj, T.K. Bioaccumulation of Heavy Metals in a Soil–Plant System from an Open Dumpsite and the Associated Health Risks through Multiple Routes. Sustainability 2022, 14, 13223. [Google Scholar] [CrossRef]
  75. Fikry, M.; Alhijry, I.A.; Aboulfotouh, A.M.; El Sherbini, A.M. Feasibility of Using Boltzmann Plots to Evaluate the Stark Broadening Parameters of Cu(I) Lines. Appl. Spectrosc. 2021, 75, 1288–1295. [Google Scholar] [CrossRef] [PubMed]
  76. Elsayed, K.; Tawfik, W.; Khater, E.M.A.; Kayed, S.T.; Fikry, M. Fast Determination of Phosphorus Concentration in Phosphogypsum Waste Using Calibration-Free LIBS in Air and Helium. Opt. Quantum Electron. 2022, 54, 96. [Google Scholar] [CrossRef]
  77. Hahn, D.W.; Omenetto, N. Laser-Induced Breakdown Spectroscopy (LIBS), Part II: Review of Instrumental and Methodological Approaches to Material Analysis and Applications to Different Fields. Appl. Spectrosc. 2012, 66, 347–419. [Google Scholar] [CrossRef]
  78. Aragón, C.; Aguilera, J.A. Characterization of Laser Induced Plasmas by Optical Emission Spectroscopy: A Review of Experiments and Methods. Spectrochim. Acta Part. B At. Spectrosc. 2008, 63, 893–916. [Google Scholar] [CrossRef]
  79. Ziku, M. Digital Cultural Heritage and Linked Data: Semantically-Informed Conceptualisations and Practices with a Focus on Intangible Cultural Heritage. Lib. Q. J. Assoc. Eur. Res. Libr. 2020, 30, 1–16. [Google Scholar] [CrossRef]
  80. Hahn, D.W.; Omenetto, N. Laser-Induced Breakdown Spectroscopy (LIBS), Part I: Review of Basic Diagnostics and Plasmaparticle Interactions: Still-Challenging Issues within the Analytical Plasma Community. Appl. Spectrosc. 2010, 64, 335–366. [Google Scholar] [CrossRef]
  81. Musazzi, S.; Perini, U. Laser-Induced Breakdown Spectroscopy Theory and Applications; Springer: Berlin/Heidelberg, Germany, 2014; ISBN 9783642450846. [Google Scholar]
  82. Galbács, G. A Critical Review of Recent Progress in Analytical Laser-Induced Breakdown Spectroscopy. Anal. Bioanal. Chem. 2015, 407, 7537–7562. [Google Scholar]
  83. Fikry, M.; Tawfik, W.; Omar, M.M. Investigation on the Effects of Laser Parameters on the Plasma Profile of Copper Using Picosecond Laser Induced Plasma Spectroscopy. Opt. Quantum Electron. 2020, 52, 249. [Google Scholar] [CrossRef]
  84. Fikry, M.; Tawfik, W.; Omar, M. Measurement of the Electron Temperature in a Metallic Copper Using Ultrafast Laser-Induced Breakdown Spectroscopy. J. Russ. Laser Res. 2020, 41, 484–490. [Google Scholar] [CrossRef]
  85. Qi, H.; Lai, H. Micromachining of Metals and Thermal Barrier Coatings Using a 532 Nm Nanosecond Fiber Laser. Phys. Procedia 2012, 39, 603–612. [Google Scholar] [CrossRef]
  86. Singh, R.; Gautam, N.; Mishra, A.; Gupta, R. Heavy Metals and Living Systems: An Overview. Indian J. Pharmacol. 2011, 43, 246–253. [Google Scholar] [CrossRef] [PubMed]
  87. Ali, H.; Khan, E.; Anwar, M. Chemosphere Phytoremediation of Heavy Metals—Concepts and Applications. Chemosphere 2013, 91, 869–881. [Google Scholar] [CrossRef] [PubMed]
  88. Bradl, H.B. Adsorption of Heavy Metal Ions on Soils and Soils Constituents. J. Colloid Interface Sci. 2004, 277, 1–18. [Google Scholar] [CrossRef] [PubMed]
  89. McGrath, S.P.; Zhao, F.J. Phytoextraction of Metals and Metalloids from Contaminated Soils. Curr. Opin. Biotechnol. 2003, 14, 277–282. [Google Scholar] [CrossRef]
  90. Tchounwou, P.B.; Yedjou, C.G.; Patlolla, A.K.; Sutton, D.J. Heavy Metal Toxicity and the Environment. Mol. Clin. Environ. Toxicol. 2012, 101, 133–164. [Google Scholar]
  91. Alloway, B.J. Sources of Heavy Metals and Metalloids in Soils. In Heavy Metals in Soils: Trace Metals and Metalloids in Soils and Their Bioavailability; Springer: Dordrecht, The Netherlands, 2013; pp. 11–50. [Google Scholar]
Figure 1. The studied sites where the samples were collected.
Minerals 13 01300 g001
Figure 2. The pollution index (PI) of the studied heavy metals in the soils associated with (a) lettuce and (b) clover in all studied sites.
Minerals 13 01300 g002
Figure 3. Bioaccumulation factor (BF) of heavy metals in (a) lettuce and (b) clover plants irrigated with different water resources in different sites using the FAAS technique.
Minerals 13 01300 g003
Figure 4. Translocation factor (TF) of heavy metals in (a) lettuce and (b) clover plants irrigated with different water resources in different sites using FAAS technique.
Minerals 13 01300 g004
Figure 5. Ps-LIBS emission spectra using NIR laser 1064 nm at pulse energies of 100 mJ of the plant parts (roots and shoots) and their associated soil (a) lettuce and (b) clover.
Minerals 13 01300 g005
Figure 6. Calibration curves between the Ps-LIBS relative intensity and the studied trace heavy metals content in the associated soil for (a) lettuce and (b) clover in all studied sites.
Minerals 13 01300 g006
Figure 7. Calibration curves between the Ps-LIBS relative intensity and the content of the studied trace heavy metals in the roots of (a) lettuce and (b) clover in all studied sites.
Minerals 13 01300 g007
Figure 8. Calibration curves between the Ps-LIBS relative intensity and the content of the studied trace heavy metals in the shoots of (a) lettuce and (b) clover in all studied sites.
Minerals 13 01300 g008
Table 1. Operating conditions for elements and the values of precision measured by FAAS.
ElementWavelength (nm)Lamp Current (mA)Fuel Flow (L/min)Band Pass (nm)Flame TypeRSD %
Mg285.241.10.5Air/acetylene0.2
K766.581.20.5Air/acetylene2.41
Fe248.3150.90.2Air/acetylene1.2
Zn213.9101.10.5Air/acetylene0.2
Mn279.5121.10.2Air/acetylene0.4
Cu324.851.00.5Air/acetylene3.1
Ni232.0150.90.2Air/acetylene2.3
Cd228.881.20.5Air/acetylene3.58
Pb217.0101.10.5Air/acetylene2.94
Cr357.9124.20.5Nitrous oxide/acetylene1.94
Table 2. Major and trace heavy metals content in the lettuce and clover-associated soils irrigated with different water resources using the FAAS technique.
Major and Trace Heavy MetalsLettuce (mg/kg)Clover (mg/kg)
S1S2S3S4S5S1S2S3S4S5
Major elementsMg182.3 ± 5.91 a183.6 ± 2.83 a204 ± 30.9 a199.3 ± 13.9 a180.2 ± 6.77 a197.1 ± 2.22 a200.4 ± 4.8 a205 ± 0.00 a196.4 ± 20.1 a192 ± 10.9 a
K12,050 ± 831 a6441 ± 208 cd9976 ± 121 b5713 ± 311 d7396 ± 82 c12,819 ± 477 a6025 ± 623 c9349 ± 623 b4778 ± 207 c5402 ± 415 c
Fe829 ± 13.4 d981 ± 44.1 c2373 ± 37.5 a2031 ± 110.5 b640 ± 0.75 e37.80 ± 1.65 c24.04 ± 0.34 c26.05 ± 3.54 c3832 ± 96 a879 ± 30.5 b
Trace heavy metalsZn33.58 ± 1.21 b40.42 ± 3.49 a35.18 ± 1.31 b20.46 ± 0.79 c21.69 ± 1.32 c17.15 ± 3.45 c22.15 ± 0.16 c21.49 ± 1.71 c244 ± 15.3 a49.69 ± 1.68 b
Mn47.09 ± 2.03 a45.58 ± 1.10 a22.41 ± 1.81 b23.05 ± 0.02 b21.45 ± 0.63 b9.07 ± 0.10 d23.21 ± 0.04 c22.66 ± 0.13 c758 ± 9.23 a37.77 ± 1.75 b
Cu19.75 ± 1.05 c24.58 ± 0.30 a22.78 ± 2.15 ab19.82 ± 0.49 bc25.41 ± 0.57 a18.49 ± 0.92 c23.55 ± 0.73 b27.90 ± 1.92 a23.11 ± 1.17 b22.55 ± 2.16 b
Ni12.92 ± 0.86 c226 ± 12.92 a33.04 ± 0.57 b13.84 ± 0.43 c24.21 ± 1.69 bc27.25 ± 3.45 bc26.45 ± 5.29 c36.35 ± 2.77 ab42.07 ± 3.44 a25.83 ± 2.09 c
Cd11.56 ± 1.23 a8.98 ± 0.86 b8.85 ± 0.38 b11.44 ± 0.37 a10.09 ± 0.25 ab10.64 ± 1.05 a7.87 ± 0.00 c9.96 ± 0.37 ab11.13 ± 0.68 a8.38 ± 0.23 bc
Pb4.44 ± 0.24 c6.77 ± 0.12 b6.31 ± 0.16 b6.64 ± 0.25 b8.00 ± 0.86 a5.90 ± 0.49 bc7.63 ± 0.00 a6.77 ± 0.37 ab5.66 ± 0.00 c6.27 ± 0.37 bc
Cr5.12 ± 0.73 ab6.30 ± 0.30 a6.46 ± 0.20 a4.92 ± 0.65 b6.34 ± 0.43 a4.29 ± 0.32 c4.34 ± 0.00 c7.07 ± 0.27 a6.97 ± 0.36 a5.74 ± 0.24 b
The symbols a, b, c, and d indicate that the values with different superscript letters in a column are significantly different (p < 0.05).
Table 3. Major and trace heavy metals content in the roots of lettuce and clover irrigated with different resources of water using the FAAS technique.
Major and Trace Heavy MetalsLettuce (mg/kg)Clover (mg/kg)
S1S2S3S4S5S1S2S3S4S5
Major elementsMg298 ± 9.6 b291 ± 1.1 b286 ± 4.2 b336 ± 19.2 a327 ± 3.5 a351 ± 18 a336 ± 4.8 a337 ± 5.1 a353 ± 8.5 a324 ± 12.2 a
K2239 ± 0.45 a2251 ± 0.40 a2248 ± 1.00 a2064 ± 83.1 a2174 ± 430 a2246 ± 1.7 a2244 ± 7.1 a2247 ± 3.2 a2292 ± 187 a1898 ± 83.2 b
Fe480 ± 7.2 a421 ± 41.9 b485 ± 10.5 a419 ± 19.7 b349 ± 5.9 c1122 ± 22.2 b551 ± 21.6 c517 ± 20.9 c1872 ± 4.9 a429 ± 12.6 d
Trace heavy metalsZn31.49 ± 0.79 c42.92 ± 0.67 b46.47 ± 0.39 b58.85 ± 3.95 a33.45 ± 1.56 c43.27 ± 0.39 d58.72 ± 0.20 c77.08 ± 2.03 b139.8 ± 7.90 a43.39 ± 2.65 d
Mn64.00 ± 0.96 c59.55 ± 2.94 c64.68 ± 1.40 c119.9 ± 4.74 a91.57 ± 0.72 b74.79 ± 1.51 c73.48 ± 2.88 c103.4 ± 4.18 b118.1 ± 1.77 a58.64 ± 3.65 d
Cu37.27 ± 2.01 c25.28 ± 0.30 d40.82 ± 0.20 bc54.53 ± 1.31 a45.16 ± 2.75 b35.75 ± 0.99 b48.17 ± 1.85 a37.44 ± 1.26 b50.76 ± 0.99 a50.80 ± 1.15 a
Ni238 ± 10 b266 ± 22 ab150.5 ± 24.5 c229 ± 1.6 b307 ± 31.7 a269 ± 49 b273 ± 29 b494 ± 14 a226 ± 14.3 b240 ± 16.6 b
Cd0.02 ± 0.00 b0.02 ± 0.00 b0.02 ± 0.00 b0.23 ± 0.02 a0.23 ± 0.03 a0.05 ± 0.01 b0.05 ± 0.01 b0.05 ± 0.01 b0.17 ± 0.02 a0.20 ± 0.00 a
Pb1.59 ± 0.03 bc1.56 ± 0.12 c2.12 ± 0.08 a2.13 ± 0.14 a1.95 ± 0.25 ab3.07 ± 0.17 a2.00 ± 0.13 bc2.16 ± 0.29 b2.03 ± 0.04 bc1.60 ± 0.17 c
Cr0.17 ± 0.01 b0.19 ± 0.01 a0.18 ± 0.00 ab0.13 ± 0.00 c0.14 ± 0.01 c0.11 ± 0.00 c0.17 ± 0.01 a0.17 ± 0.00 a0.14 ± 0.00 b0.13 ± 0.01 b
The symbols a, b, c, and d indicate that the values with different superscript letters in a column are significantly different (p < 0.05).
Table 4. Major and trace heavy metals content in the shoots of lettuce and clover irrigated with different resources of water using the FAAS technique.
Major and Trace Heavy MetalsLettuce (mg/kg)Clover (mg/kg)
S1S2S3S4S5S1S2S3S4S5
Major elementsMg300 ± 15.9 c310 ± 3 c313 ± 1.5 c383 ± 6.2 a343 ± 0.00 b339 ± 5.4 b324 ± 27 b312 ± 0.00 b410 ± 0.00 a309 ± 4.4 b
K2247 ± 5.9 a2244 ± 6.7 a2246 ± 4.1 a1731 ± 166.3 b2209 ± 145.5 a2247 ± 5.5 a2241 ± 1.9 a2242 ± 0.15 a2002 ± 62.3 b2345 ± 84.4 a
Fe548 ± 13.7 c545 ± 17.1 c1430 ± 16.1 a300 ± 7.5 d816 ± 14.2 b529 ± 26.6 c559 ± 0.15 c2106 ± 3.8 b453 ± 2.5 c2259 ± 88.6 a
Trace heavy metalsZn57.88 ± 1.64 bc60.54 ± 3.78 b74.06 ± 0.46 a53.34 ± 1.47 c35.07 ± 0.68 d31.49 ± 1.67 d49.75 ± 11.6 bc56.29 ± 0.41 b112.8 ± 6.5 a36.12 ± 0.13 cd
Mn135.3 ± 0.29 b114.4 ± 1.87 c212 ± 2.6 a93.18 ± 2.85 d99.03 ± 6.93 d72.22 ± 1.87 b74.54 ± 0.02 b148.2 ± 8.1 a36.01 ± 0.90 c81.35 ± 5.34 b
Cu37.57 ± 1.91 b36.64 ± 2.30 b40.91 ± 1.53 b47.36 ± 1.20 a36.84 ± 1.71 b41.39 ± 0.85 b36.45 ± 1.97 c38.33 ± 2.11 bc53.79 ± 1.84 a57.91 ± 0.94 a
Ni342 ± 28 ab342 ± 10 ab299 ± 17 b370 ± 16 a348 ± 9.4 a246 ± 18 c500 ± 52 a534 ± 30 a329 ± 16.4 bc335 ± 35.7 b
Cd0.07 ± 0.00 b0.06 ± 0.00 b0.06 ± 0.00 b0.23 ± 0.01 a0.22 ± 0.03 a0.06 ± 0.00 b0.05 ± 0.01 b0.02 ± 0.00 c0.20 ± 0.01 a0.21 ± 0.01 a
Pb0.92 ± 0.00 b1.22 ± 0.04 b1.16 ± 0.02 b1.92 ± 0.34 a1.76 ± 0.21 a1.66 ± 0.10 b2.11 ± 0.19 a1.97 ± 0.09 ab2.03 ± 0.11 a2.21 ± 0.15 a
Cr0.18 ± 0.01 ab0.18 ± 0.01 a0.17 ± 0.01 ab0.15 ± 0.01 bc0.14 ± 0.01 c0.16 ± 0.01 ab0.15 ± 0.00 abc0.16 ± 0.01 a0.14 ± 0.01 bc0.14 ± 0.01 c
The symbols a, b, c, and d indicate that the values with different superscript letters in a column are significantly different (p < 0.05).
Table 5. Permissible content in agricultural systems (soil and plant), according to the World Health Organization (WHO) and the Food and Agriculture Organization (FAO).
Heavy MetalsPermissible Levels in Soil (mg/kg)Permissible Levels in a Plant (mg/kg)
Zn23 [43]60 [44]
Mn437 [43]100 [44]
Cu3 [43]2 [44]
Ni1.6 [43]0.5 [44]
Cd1.7 [43]0.5 [44]
Pb80 [43]2 [44]
Cr100 [43]1 [44]
Table 6. The heavy metals’ spectral selected wavelengths [46].
Heavy MetalsSelected Wavelengths
λ (nm)Transition Configuration
Zn213.853d104s2 → 3d104s4p(1P°)
Mn279.483d54s2 → 3d5(6S)4s4p(1P°)
280.113d54s2 → 3d5(6S)4s4p(1P°)
Cu324.753d104s → 3d104p
327.393d104s → 3d104p
Ni234.553d8(3F)4s2 → 3d8(1D)4s4p(3P°)
Cd228.84d105s2 → 4d105s5p
Pb283.316s26p2 → 6s26p7s
Cr236.473d5(6S)4s → 3d5(6S)5p
Table 7. The standard error of the calibration curves experimental fitting equation between the Ps-LIBS relative intensity and the studied trace heavy metals content in the lettuce and clover-associated soils.
MetalsStandard errorFitting Equation
LettuceCloverLettuceClover
Zn±0.01%±0.05% I Z e = 5.7 × 10 3 C Z n 0.08 I Z e = 1 × 10 3 C Z n + 0.21
Mn±0.02%±0.80% I M n = 0.09 C M n 0.29 I M n = 0.016 C M n + 8.73
Cu±0.03%±0.10% I C u = 0.04 C C u 0.54 I C u = 0.06 C C u 0.97
Ni±0.03%±0.02% I N i = 7 × 10 3 C N i 0.05 I N i = 0.017 C N i 0.34
Cd±0.001%±0.006% I C d = 1 × 10 3 C C d 0.006 I C d = 0.017 C C d 0.12
Pb±0.05%±0.02% I P b = 0.16 C P b 0.64 I P b = 0.12 C P b 0.52
Cr±0.03%±0.05% I C r = 0.14 C C r 0.57 I C r = 0.11 C C r + 0.12
Table 8. The standard error of the calibration curves experimental fitting equation between the Ps-LIBS relative intensity and the content of the studied trace heavy metals in the roots of lettuce and clover.
MetalsStandard errorFitting Equation
LettuceCloverLettuceClover
Zn±0.02%±0.02% I Z e = 0.011 C Z n 0.34 I Z e = 1 × 10 3 C Z n 0.06
Mn±0.20%±0.15% I M n = 0.049 C M n 1.38 I M n = 0.038 C M n 1.87
Cu±0.01%±0.01% I C u = 2 × 10 3 C C u 0.034 I C u = 4 × 10 3 C C u 0.14
Ni±0.005%±0.008% I N i = 4 × 10 4 C N i 0.045 I N i = 2 × 10 4 C N i 0.04
Cd±0.001%±0.005% I C d = 0.049 C C d + 0.003 I C d = 0.19 C C d 0.006
Pb±0.008%±0.01% I P b = 0.15 C P b 0.23 I P b = 0.028 C P b 0.03
Cr±0.02%±0.01% I C r = 3.79 C C r 0.48 I C r = 1.82 C C r 0.2
Table 9. The standard error of the calibration curves experimental fitting equation between the Ps-LIBS relative intensity and the content of the studied trace heavy metals in the shoots of lettuce and clover.
MetalsStandard ErrorFitting Equation
LettuceCloverLettuceClover
Zn±0.005%±0.01% I Z e = 1 × 10 3 C Z n 0.03 I Z e = 8 × 10 4 C Z n 0.02
Mn±0.08%±0.15% I M n = 0.01 C M n 0.34 I M n = 0.025 C M n 0.46
Cu±0.002%±0.005% I C u = 2 × 10 3 C C u 0.06 I C u = 3 × 10 3 C C u 0.13
Ni±0.001%±0.005% I N i = 9 × 10 5 C N i 0.02 I N i = 2 × 10 4 C N i 0.04
Cd±0.001%±0.002% I C d = 0.063 C C d 0.003 I C d = 0.15 C C d 0.002
Pb±0.007%±0.005% I P b = 0.047 C P b 0.018 I P b = 0.09 C P b 0.15
Cr±0.005%±0.005% I C r = 1.93 C C r 0.27 I C r = 1.99 C C r 0.27
Disclaimer/Publisher’s Note: The statements, opinions and data contained in all publications are solely those of the individual author(s) and contributor(s) and not of MDPI and/or the editor(s). MDPI and/or the editor(s) disclaim responsibility for any injury to people or property resulting from any ideas, methods, instructions or products referred to in the content.

