Article

Preparation of Bimetallic Au-Pd/MWCNTs Electrode for Detection of Dopamine

1
School of Environmental Science and Safety Engineering, Tianjin University of Technology, Tianjin 300384, China
2
Department of Anesthesia, Hualien Tzu-Chi Hospital, Hualien 97002, Taiwan
3
Department of Applied Chemistry, Providence University, Taichung 43301, Taiwan
*
Authors to whom correspondence should be addressed.
Minerals 2022, 12(9), 1145; https://doi.org/10.3390/min12091145
Submission received: 15 July 2022 / Revised: 1 September 2022 / Accepted: 8 September 2022 / Published: 10 September 2022

Abstract

:
In this study, functionalized bimetallic Au-Pd on multi-walled carbon nanotubes (AuPd/MWCNT) are prepared and their application as electrochemical sensor materials for dopamine detection is explored. Furthermore, the as-prepared composite materials are identified using X-ray diffraction (XRD), scanning electron microscope (SEM), transmission electron microscope (TEM), and X-ray photoelectron spectrometer (XPS). In addition, the experimental results show that AuPd/MWCNT displayed excellent sensing properties to dopamine. Especially, 1% Pd-5% Au/MWCNT showed a wide detection range (0.98–200 μM) and a low detection limit of 0.058 μM for dopamine. The sensor also displayed properties such as repeatability, reproducibility, and stability, which can be ascribed to the large specific surface area and the synergistic effect of the bimetallic nanoparticles. Therefore, the prepared functionalized multi-walled carbon nanotubes have good application prospects in the field of dopamine detection.

1. Introduction

As is known to all, dopamine (2-(3,4-dihydroxyphenyl) ethylamine, DA) is an organic compound from phenethylamine and catecholamine families, functions as a key neurotransmitter in the central sympathetic nervous system, which control the physiological and behavior conditions including sleep, movement, emotions, creativity, cognition, lust, learning, memory, and appetite [1,2]. According to current medical research, abnormal levels of dopamine in human body can cause serious diseases, such as Parkinson’s disease, Huntington’s disease, schizophrenia, autism, attention deficit hyperactivity disorder, depression, hypertension, acute anxiety, and neuroblastoma [3,4]. Hence, it is extremely important to develop a reliable, convenient, simple, and rapid method to monitor the level of dopamine in the body for diagnosis and treatment of pertinent diseases in medicine and health care.
At present, a multitude of different techniques have been successfully employed for the determination of DA, for example, high-performance liquid chromatography, fluorescence spectrophotometry, colorimetry, chemiluminescence analysis, capillary electrophoresis, mass-spectroscopy, surface-enhanced Raman scattering spectroscopy, electrochemical method, molecularly imprinted, photoelectrochemical analysis, and enzyme linkage [5,6,7,8,9,10,11,12,13,14,15].
Among the detection methods, the electrochemical method has captured more and more attentions from many researchers owing to its several advantages such as low cost of manufacturing, simplicity of operation, reliability and accuracy of detection, room-temperature operation, high sensitivity, real-time online monitoring, and rapid detection [16]. For the above-mentioned reasons, various electrochemical sensors based on different materials (e.g., metal oxide nanoparticles, metal oxide-based nanomaterials, polymeric films and carbon-based materials) have been used for the determination of DA [17,18,19,20]. However, there are still areas for improvement such as ease of fabrication, remarkable sensitivity (especially in extremely low concentration range), and favorable selectivity.
In the present work, a simple, accurate, cost-effective, and convenient electrochemical sensor based on AuPd/MWCNT has been fabricated for simultaneously detecting DA. The prepared sensor displayed extremely low detection limit, good stability, satisfying selectivity, wide linear range, and excellent reproducibility. Moreover, the possible mechanism of sensing has been hypothesized and discussed.

2. Materials and Methods

2.1. Chemicals and Reagent

Potassium chloride, potassium phosphate monobasic, and potassium phosphate monobasic were purchased from Vetec (Taoyuan, Taiwan). Sodium hydroxide UniRegion was bought from Bio-Tech (Taoyuan, Taiwan). L(+)-Ascorbic acid was obtained from Acros Organics. Potassium ferricyanide was purchased from Aencore (Melbourne, Australia). Graphene oxide was obtained from Legend Star International Co., Ltd. (New Taipei City, Taiwan). Hydrogen tetrachloroaurate (III) trihydrate and melamine were purchased from Alfa Aesar (Ward Hill, MA, USA). Trisodium citrate dehydrate was purchased from Showa Chemical Industry Co., Ltd. (Tokyo, Japan). Starch and phosphoric acid were bought from J.T. Baker (Phillipsburg, NJ, USA). Palladium chloride was procured from Johnson Matthey (London, UK).
Sodium nitrate and sodium chloride were obtained from Merck Company (Rahway, NJ, USA). Multi-wall carbon nanotube and uric acid were purchased from Sigma-Aldrich Co., Ltd. (Burlington, MA, USA) The reagents used in the experiment were analytically pure and were used without further purification. In addition, laboratory-grade deionized water (Millpore, Milli-Q Water Purification System, Burlington, MA, USA) was used throughout the experiment.

2.2. Electrochemical Sensors Preparation

Sensing material synthesis: A facile method has been introduced for the fabrication of electrochemical sensors and the fabrication process is as follows. Hydrogen tetrachloroaurate (III) trihydrate and sodium nitrate were added to deionized water under constant stirring for 1 h, and then multi-wall carbon nanotube was added to the above solution under stirring for 24 h. Subsequently, the resultant precipitate was collected by centrifugation, washed with deionized water several times, and dried at 45 °C for 24 h in an oven to obtain Au/MWCNT. Starch, multi-wall carbon nanotube, and palladium chloride were added in deionized water under vigorous stirring for 1 h, and then the resulting Pd/MWCNT was purified by centrifugation, washed with deionized water three times, and dried at 45 °C until completely dry. Multi-wall carbon nanotube was impregnated with aqueous solution of trisodium citrate dehydrate, palladium chloride, and hydrogen tetrachloroaurate (III) trihydrate. After stirring for 1.5 h, the obtained precipitate was collected by centrifugation and purified by repetitive deionized water rinsing. Then, the product was dried at 45 °C overnight to obtain a black powder (denoted as AuPd/MWCNT). The synthesis of the sensing material is shown in Figure 1A(a).
Sensing electrode preparation: Prior to use, the surface of the bare electrode (glass carbon electrode, GCE) was polished with alumina powder and wool, and then bare GCE was ultrasonically cleaned with ethanol and deionized water for 10 min. Subsequently, the as-prepared sensing material was drip-coated on the surface of freshly prepared GCE and dried in an oven at 60 °C overnight to obtain modified GCE. The synthesis of the sensing material is presented in Figure 1A(b).

2.3. Characterization Apparatus

The crystal structures of the as-obtained samples are investigated by X-ray diffraction (XRD) using a SHIMADZU XRD-6000 diffractometer with Cu Kα1 radiation (λ = 1.5404 Å) operating at 35 kV and 35 mA, and the diffraction data are recorded in the 2θ range of 10–80° with a scanning rate of 2°/min. The average crystallite sizes of the as-obtained samples are determined by using the Debye–Scherrer equation, D = κλ/βcosθ, where κ is 0.9, λ is the wavelength, θ is the Bragg angle, and β is the full width at half maximum intensity of the XRD peaks. The microstructure and morphology of the as-prepared samples are studied using JEM-2010 (JEOL, Akishima City, Japan, 200 kV) transmission electron microscope and JEOL JSM-7500F field emission scanning electron microscope (FESEM, JSM-6500F, Tokyo, Japan, 15 kV). Energy dispersive X-ray spectroscopy (EDS) is used for elemental analysis of the as-synthesized samples. The elemental composition of the as-obtained samples is evaluated by means of an X-ray photoelectron spectroscopy (XPS, ULVAC-PHI PHI-5000, Tokyo, Japan) with an Al Ka X-ray source. The evolution of the electric conductivity transport process in the electrochemical cell is investigated using the electrochemical impedance spectroscopy (EIS), and the measurement using an electrochemical analyzer (Won A Tech/ZIVE LAB). Electrochemical impedance spectroscopy (EIS) is used to measure the resistance value of the electrode to analyze the electrode performance after material modification. In this research, 1 mM K3Fe(CN)6 solution prepared with 0.1 M KCl was used as the electrolyte solution, a sine wave with an amplitude of 10 mV was applied to the working electrode in the frequency range from 0.1 to 107 Hz.

2.4. Electrode Preparation and Electrochemical Measurements

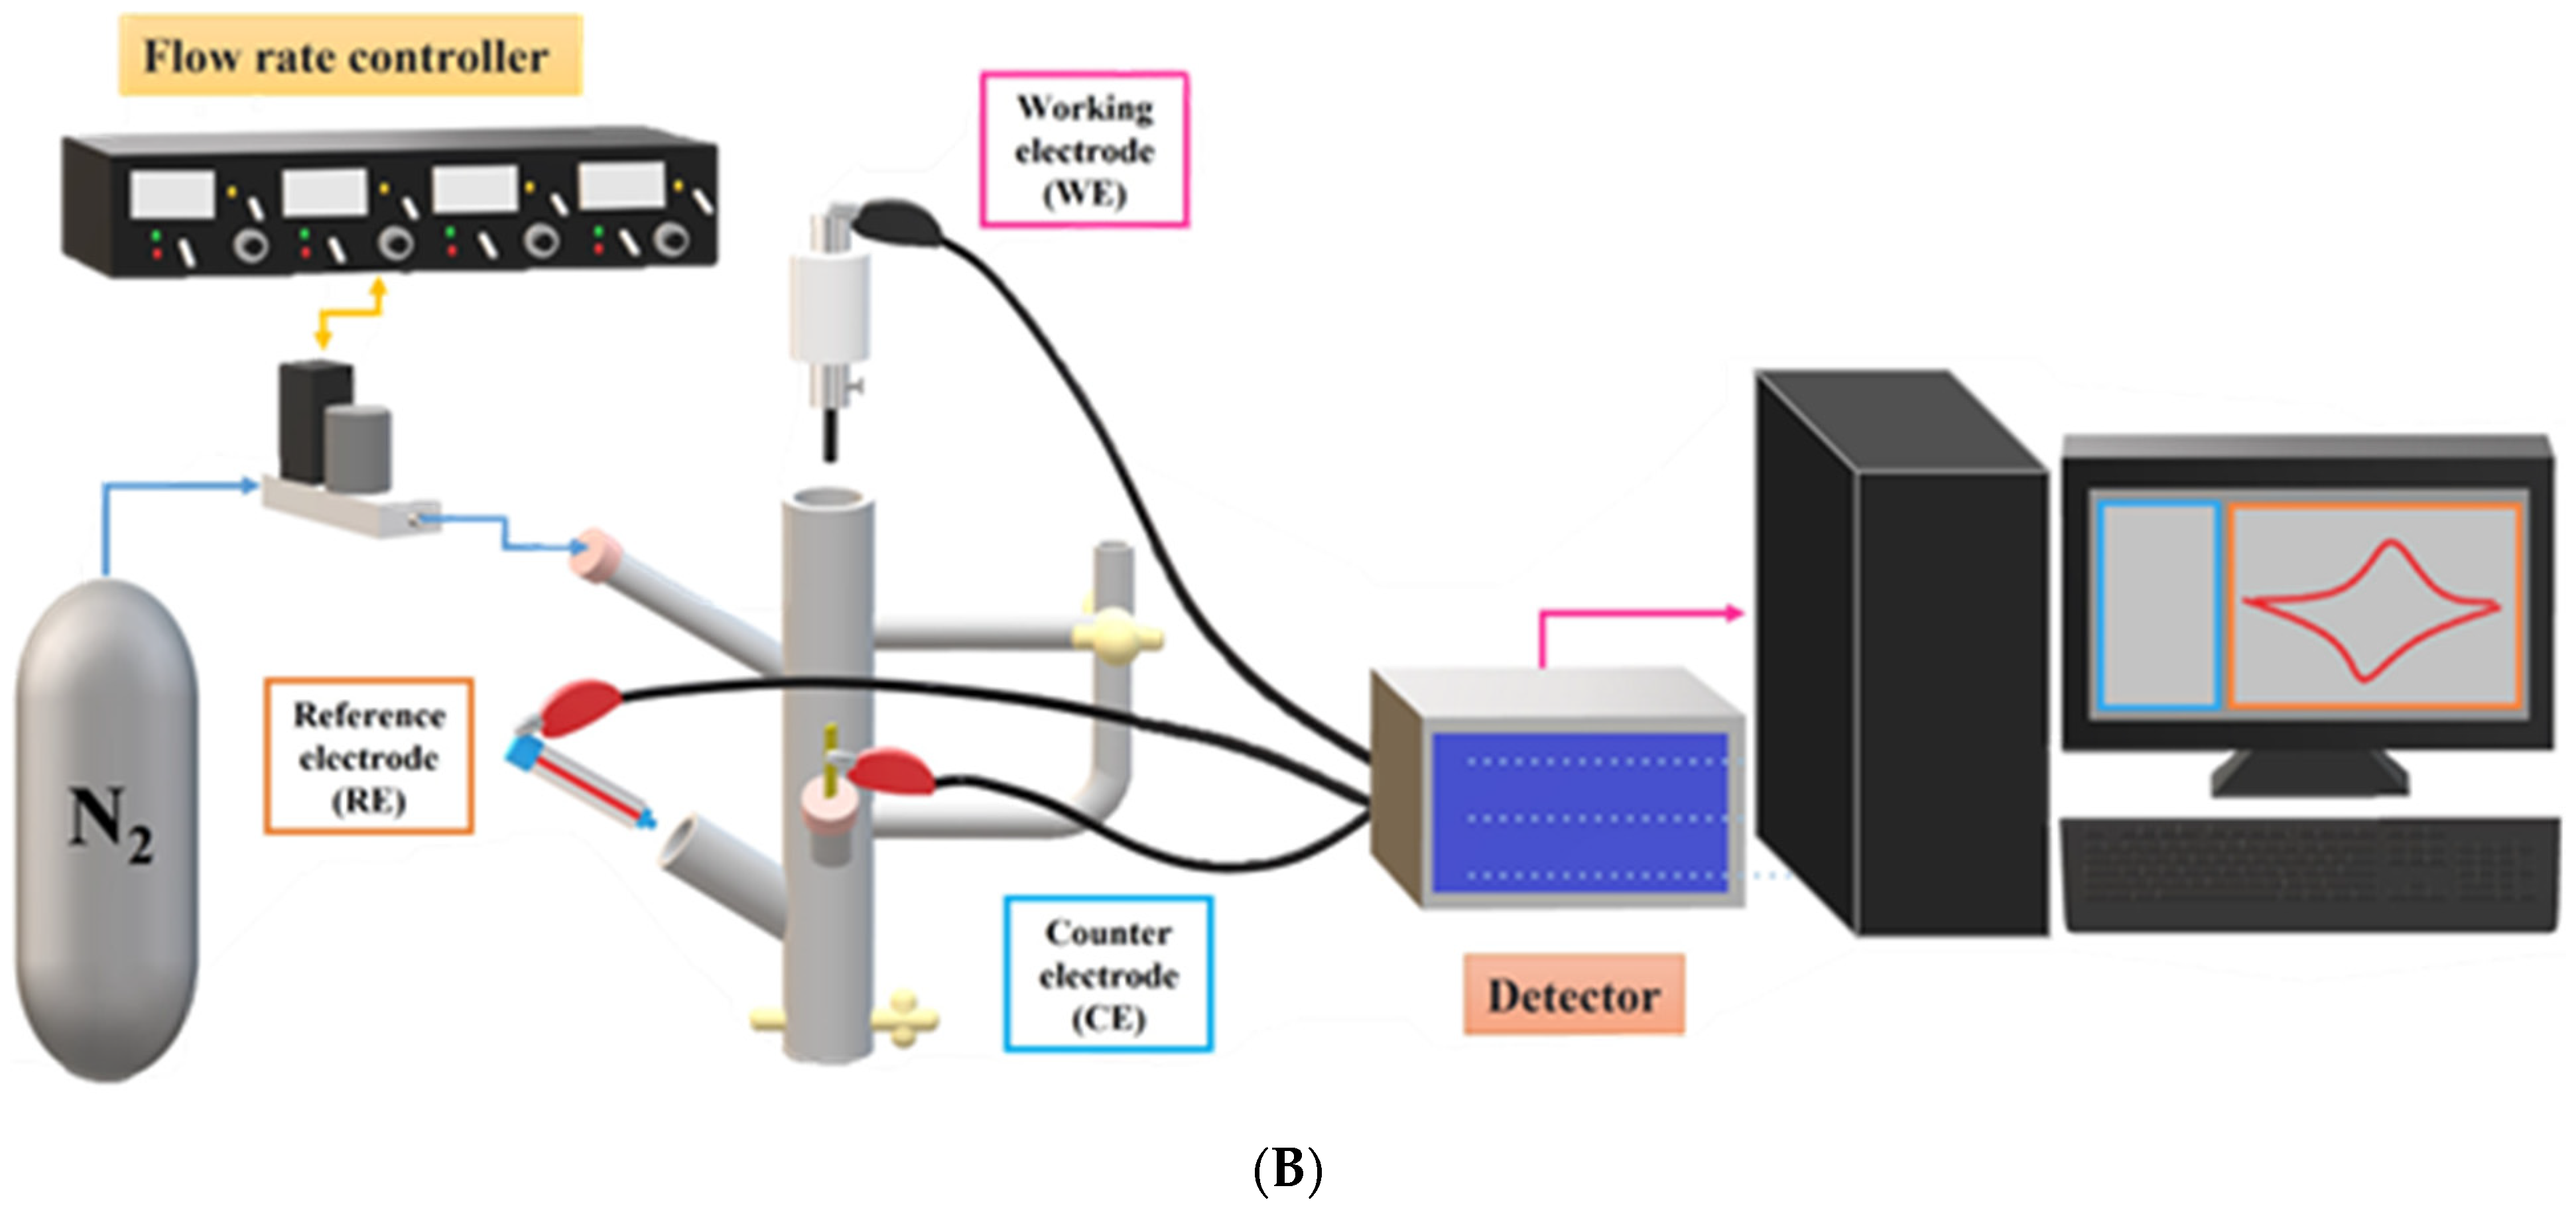
As shown in Figure 1B, the electrochemical sensing system includes a working electrode (modified GCE), a counter electrode, and a reference electrode. For the preparation of electrolyte solution (DA solution), a certain amount of dopamine hydrochloride was dissolved in phosphate buffer saline (PBS, Na2HPO4, KH2PO4, NaCl, and KCl). All electrochemical measurements were carried out on a ZIVE SP1 compact type electrochemical workstation (Won A Tech/ZIVE LAB) under N2 atmosphere. The scanning range was from −1.0 to 1.0 V with a rate of 0.05 Vs−1 detected by cyclic voltammetry (CV) and differential pulse voltammetry (DPV) method. The detection limit (DL) is measured by DL = (3 × SD)/m, SD presents the standard deviation of blank sample signal and m is the slope of the response versus DA concentration curve.

3. Results

3.1. Sensing Material Characterization by XRD, SEM, TEM and XPS

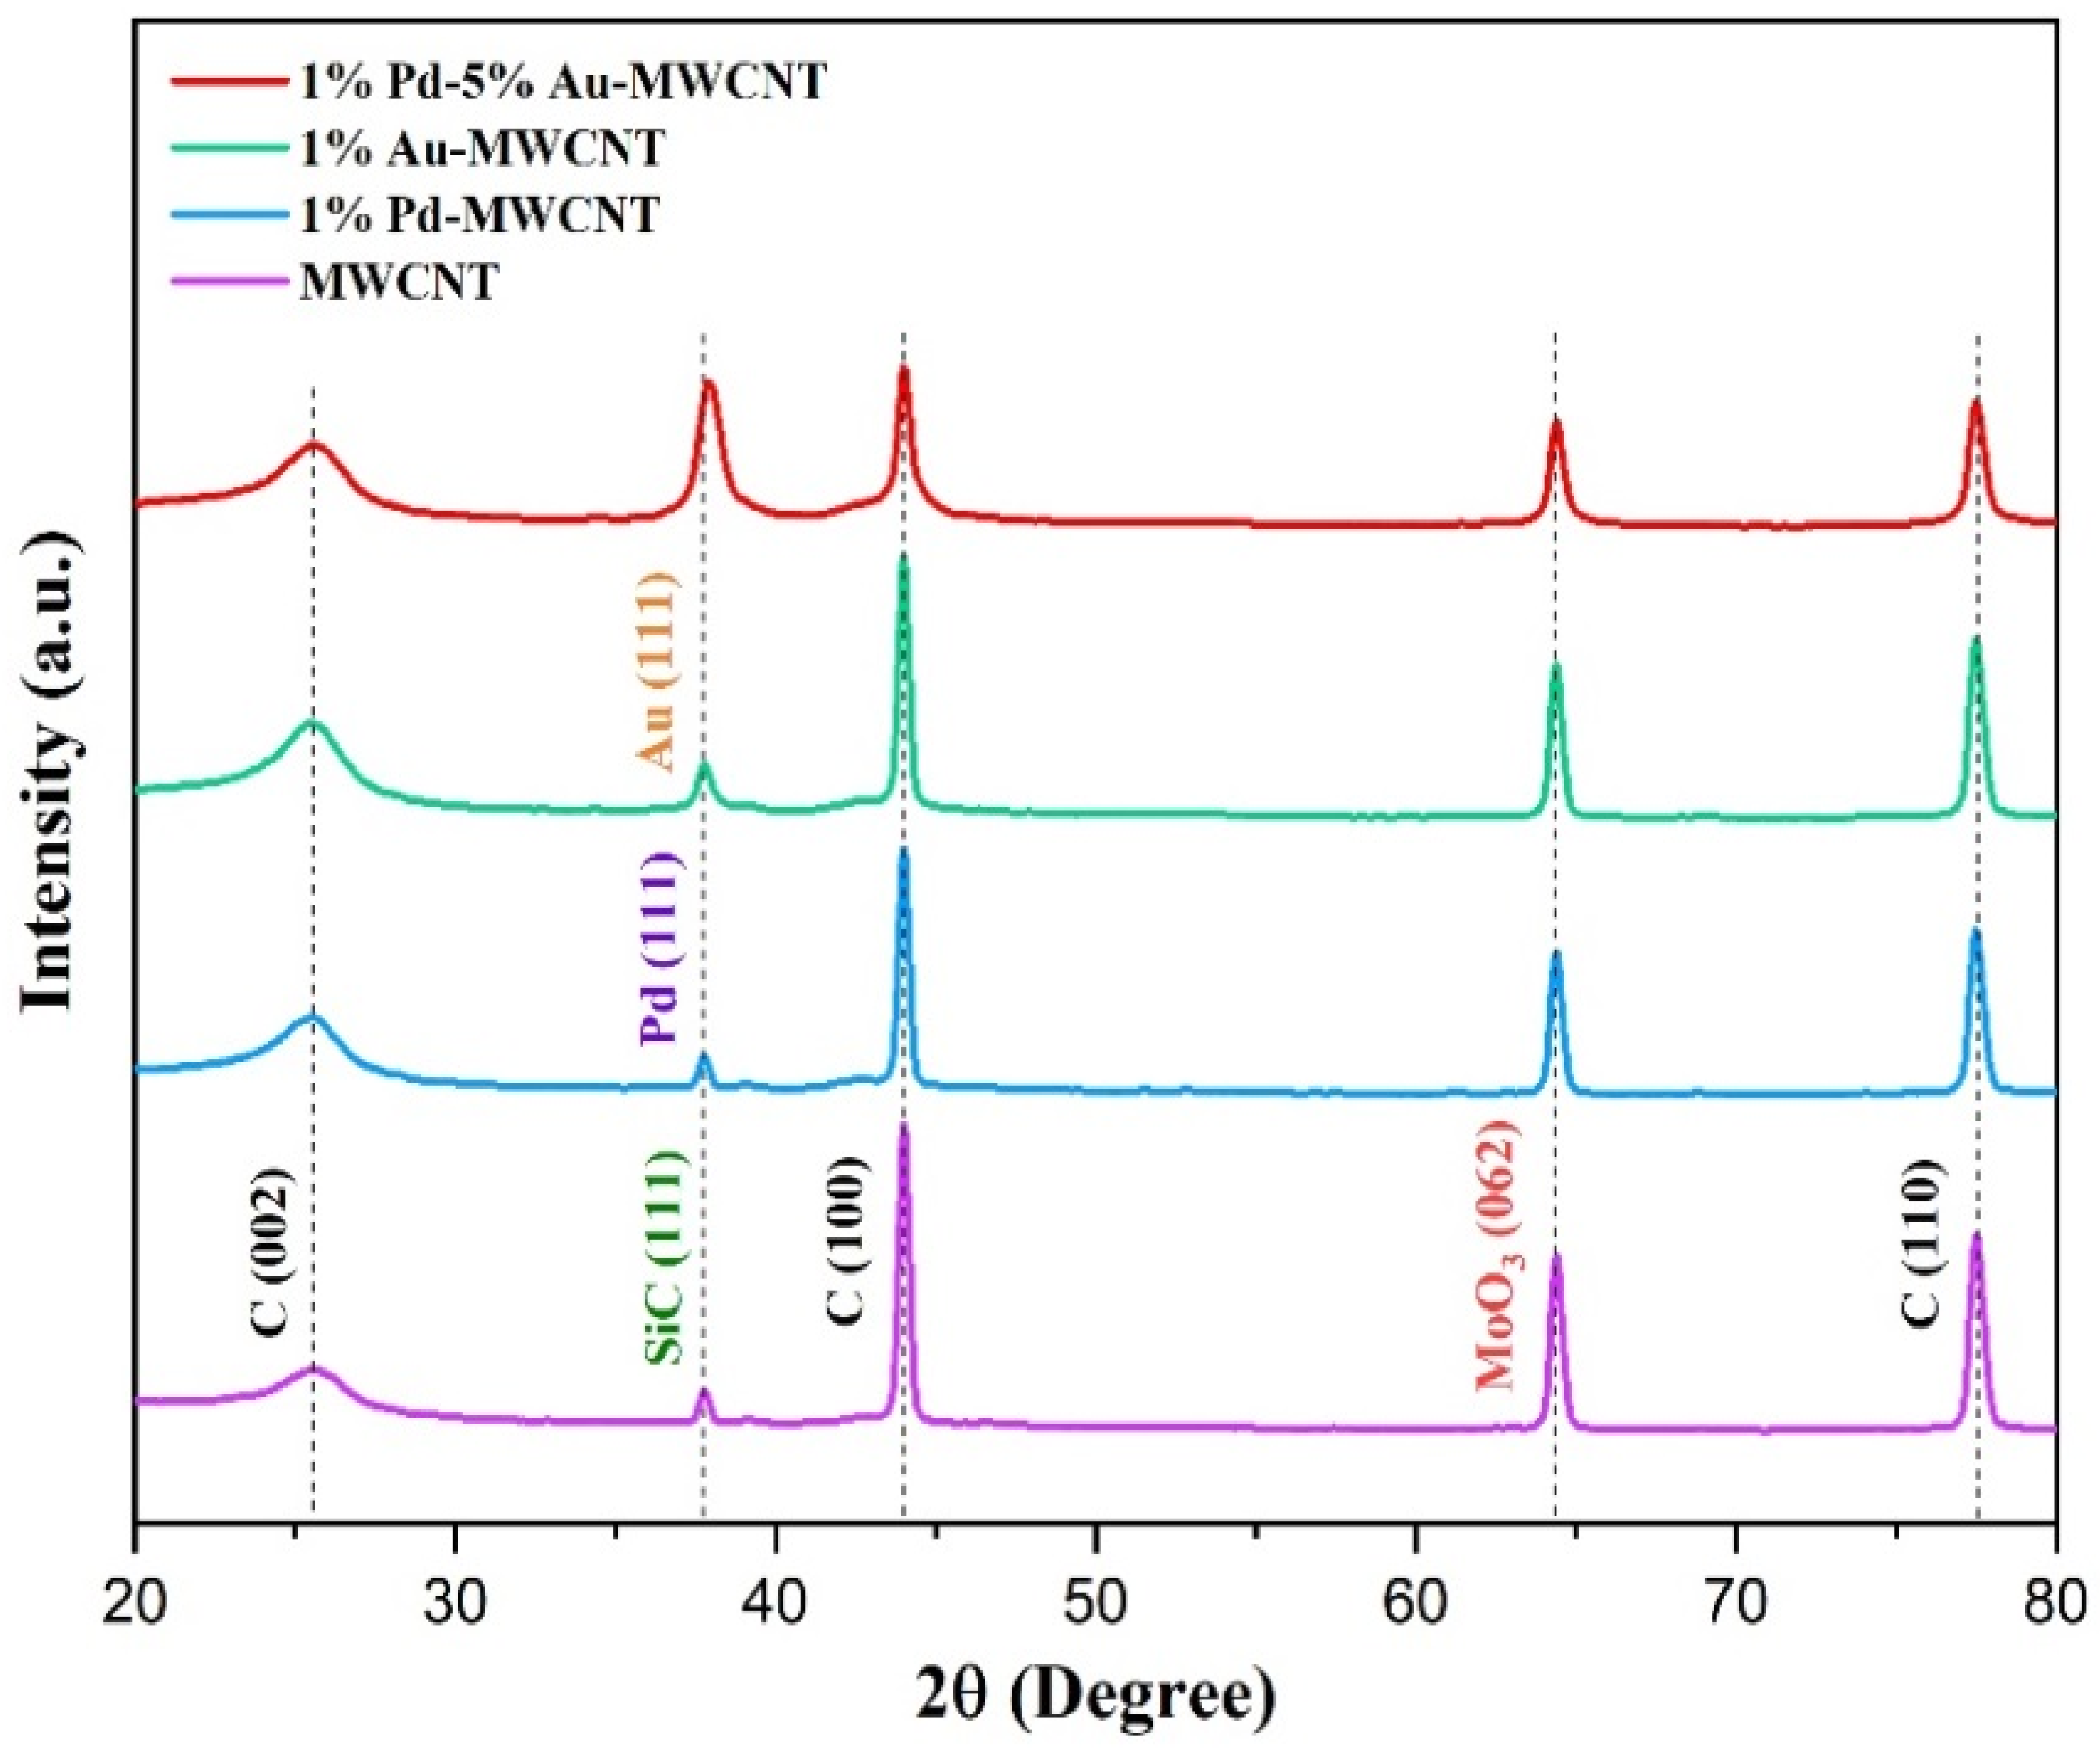
The XRD analysis was performed to study the crystalline structures of the as-prepared samples, the XRD patterns of the MWCNT, Au/MWCNT, Pd/MWCNT, and AuPd/MWCNT, as shown in Figure 2. MWCNT exhibited three diffraction peaks located at 25.6°, 44.0°, and 77.5°, which indexed to (002), (100), and (110) of typical graphite [21]. In addition, from the XRD pattern of pure MWCNT, it can be observed that several other distinct diffraction peaks at 42.8°, 43.5°, 44.8° could be ascribed to the (111) lattice plane of SiC and the (062) lattice plane of MoO3, respectively [22]. Au/MWCNT presented four diffraction peaks, ascribed to (111), (200), (220), and (311) of the face central cubic (fcc) structure of monometallic Au. Pd/MWCNT displayed four diffraction peaks, assigned to (111), (200), (220), and (311) of the fcc structure of monometallic Pd [23]. The XRD patterns of AuPd/MWCNT showed a big peak at 37.9°, which suggest that AuPd bimetallic nanoparticles were decorated on the surface of MWCNT [24]. By using Scherer’s formula, the calculated average crystalline sizes of Au/MWCNT, Pd/MWCNT, and AuPd/MWCNT were found to be approximately 13.0 nm, 14.6 nm, and 12.4 nm, respectively.
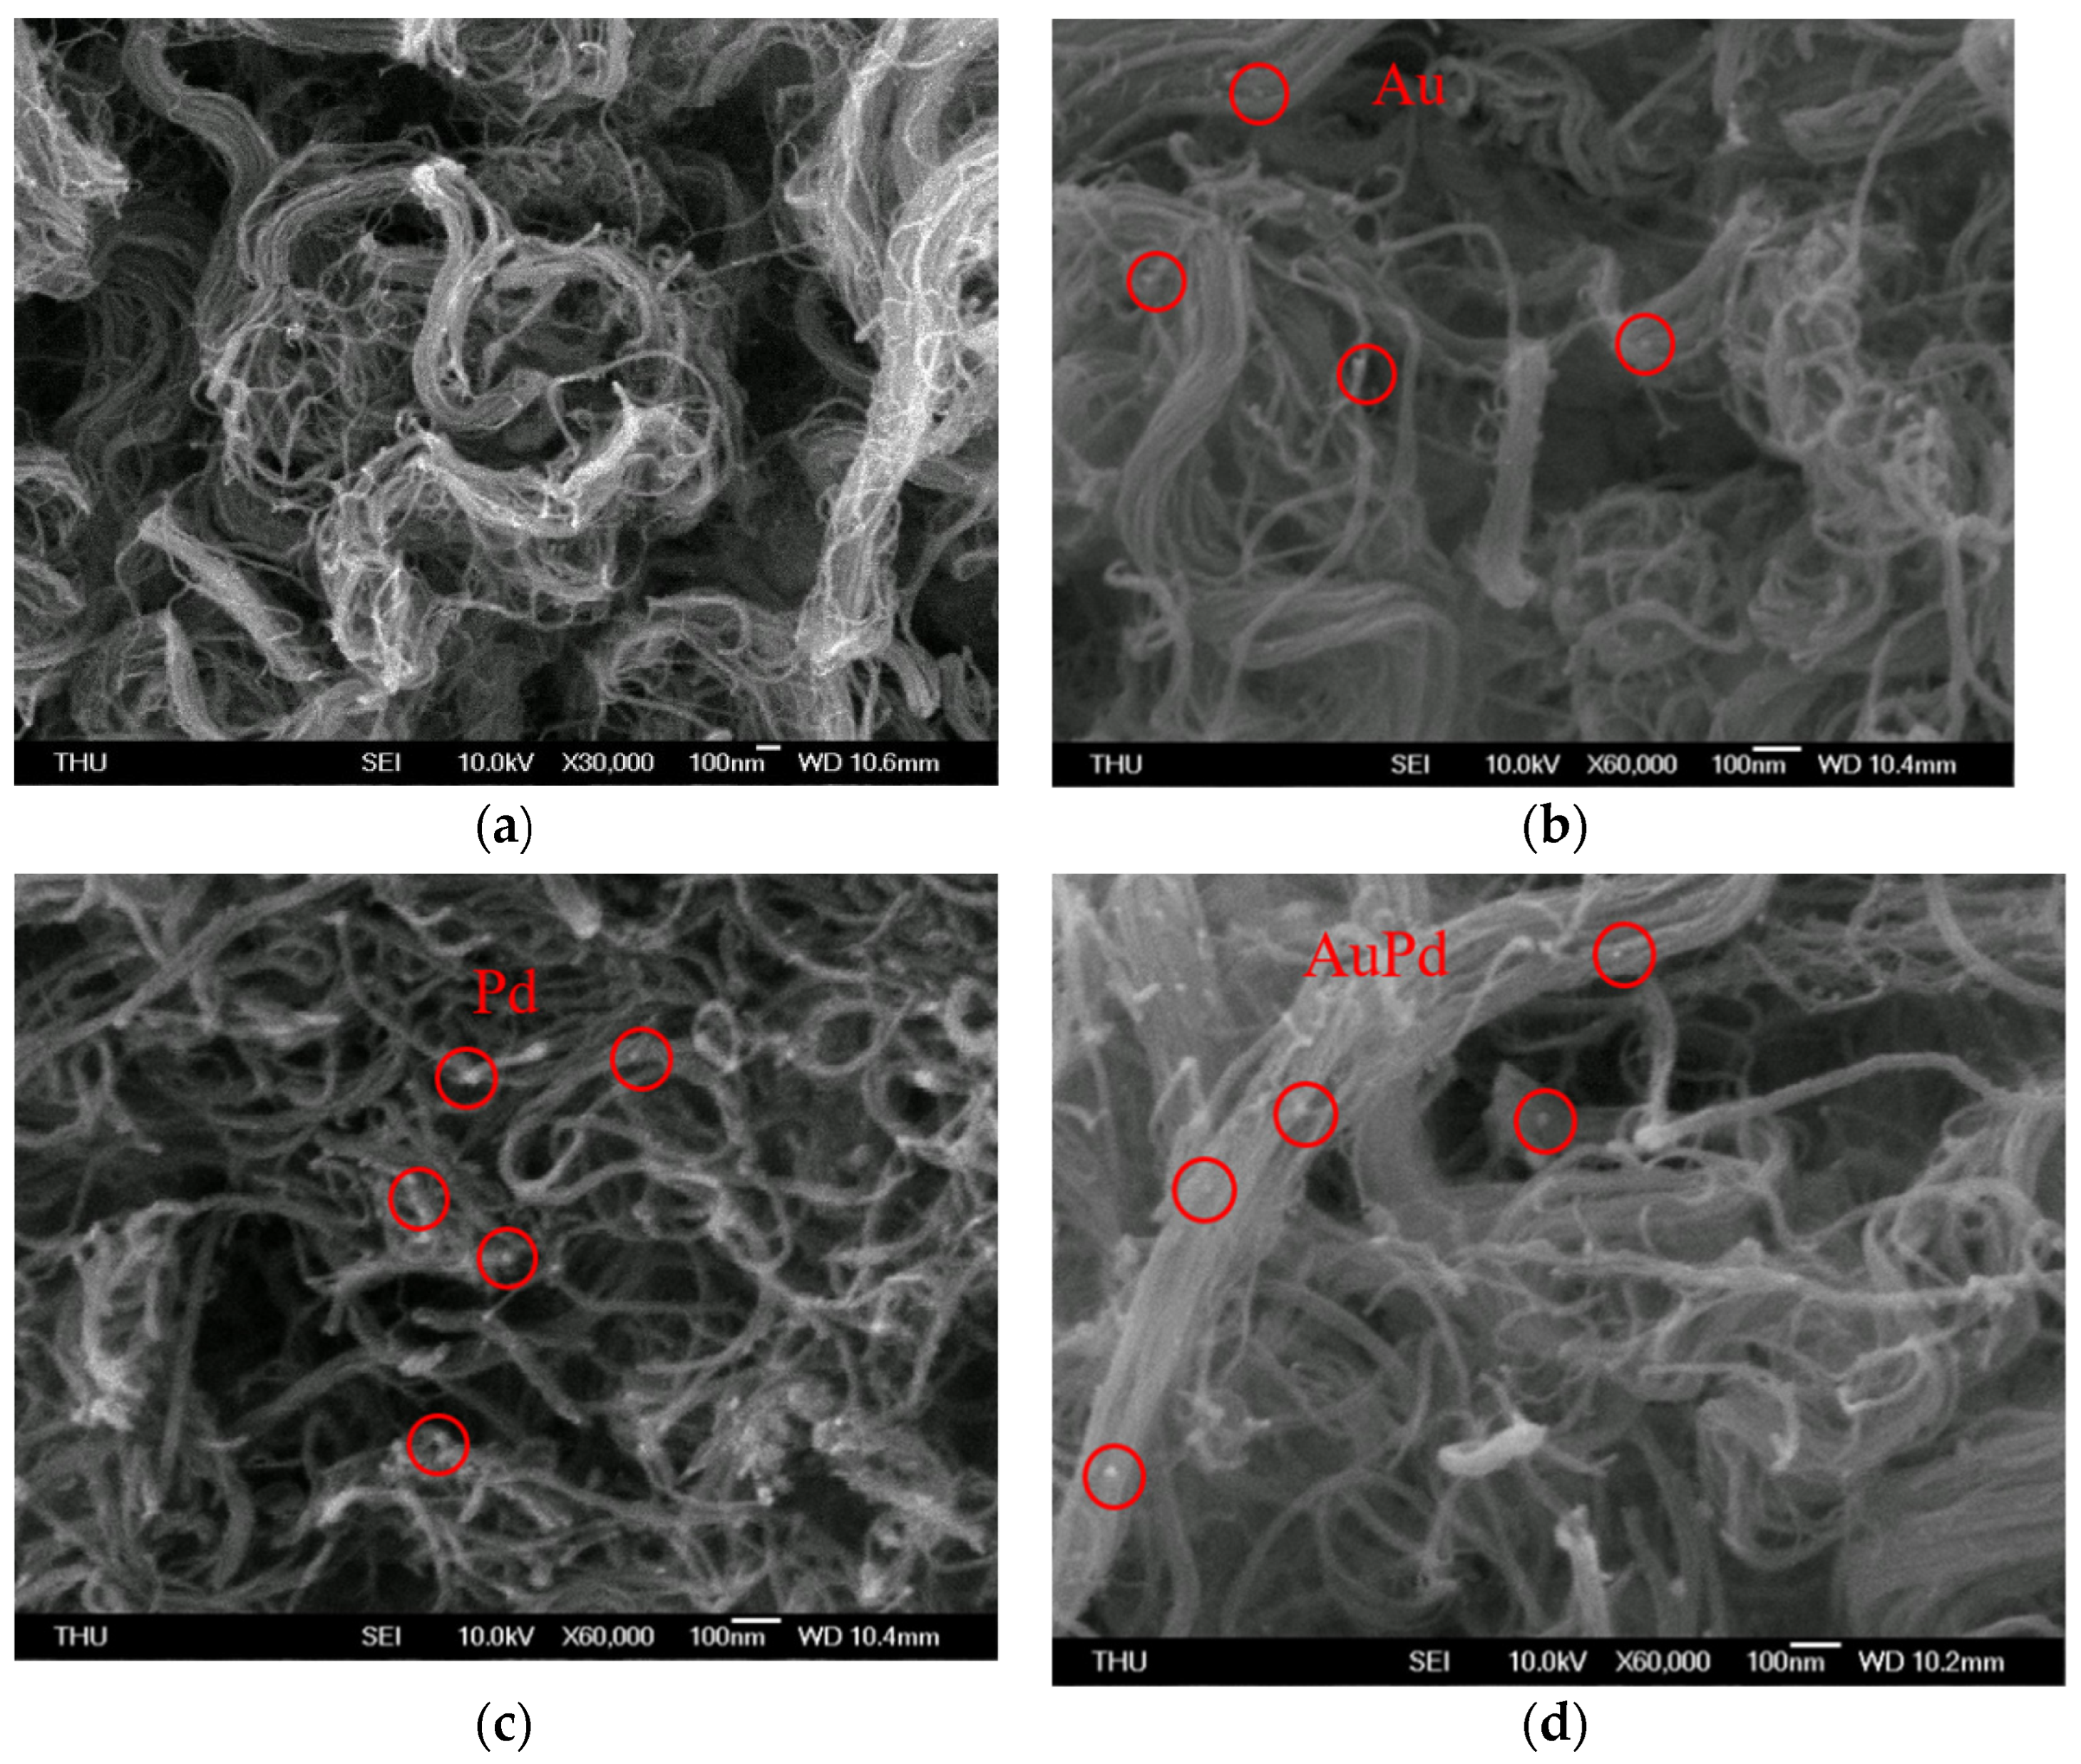
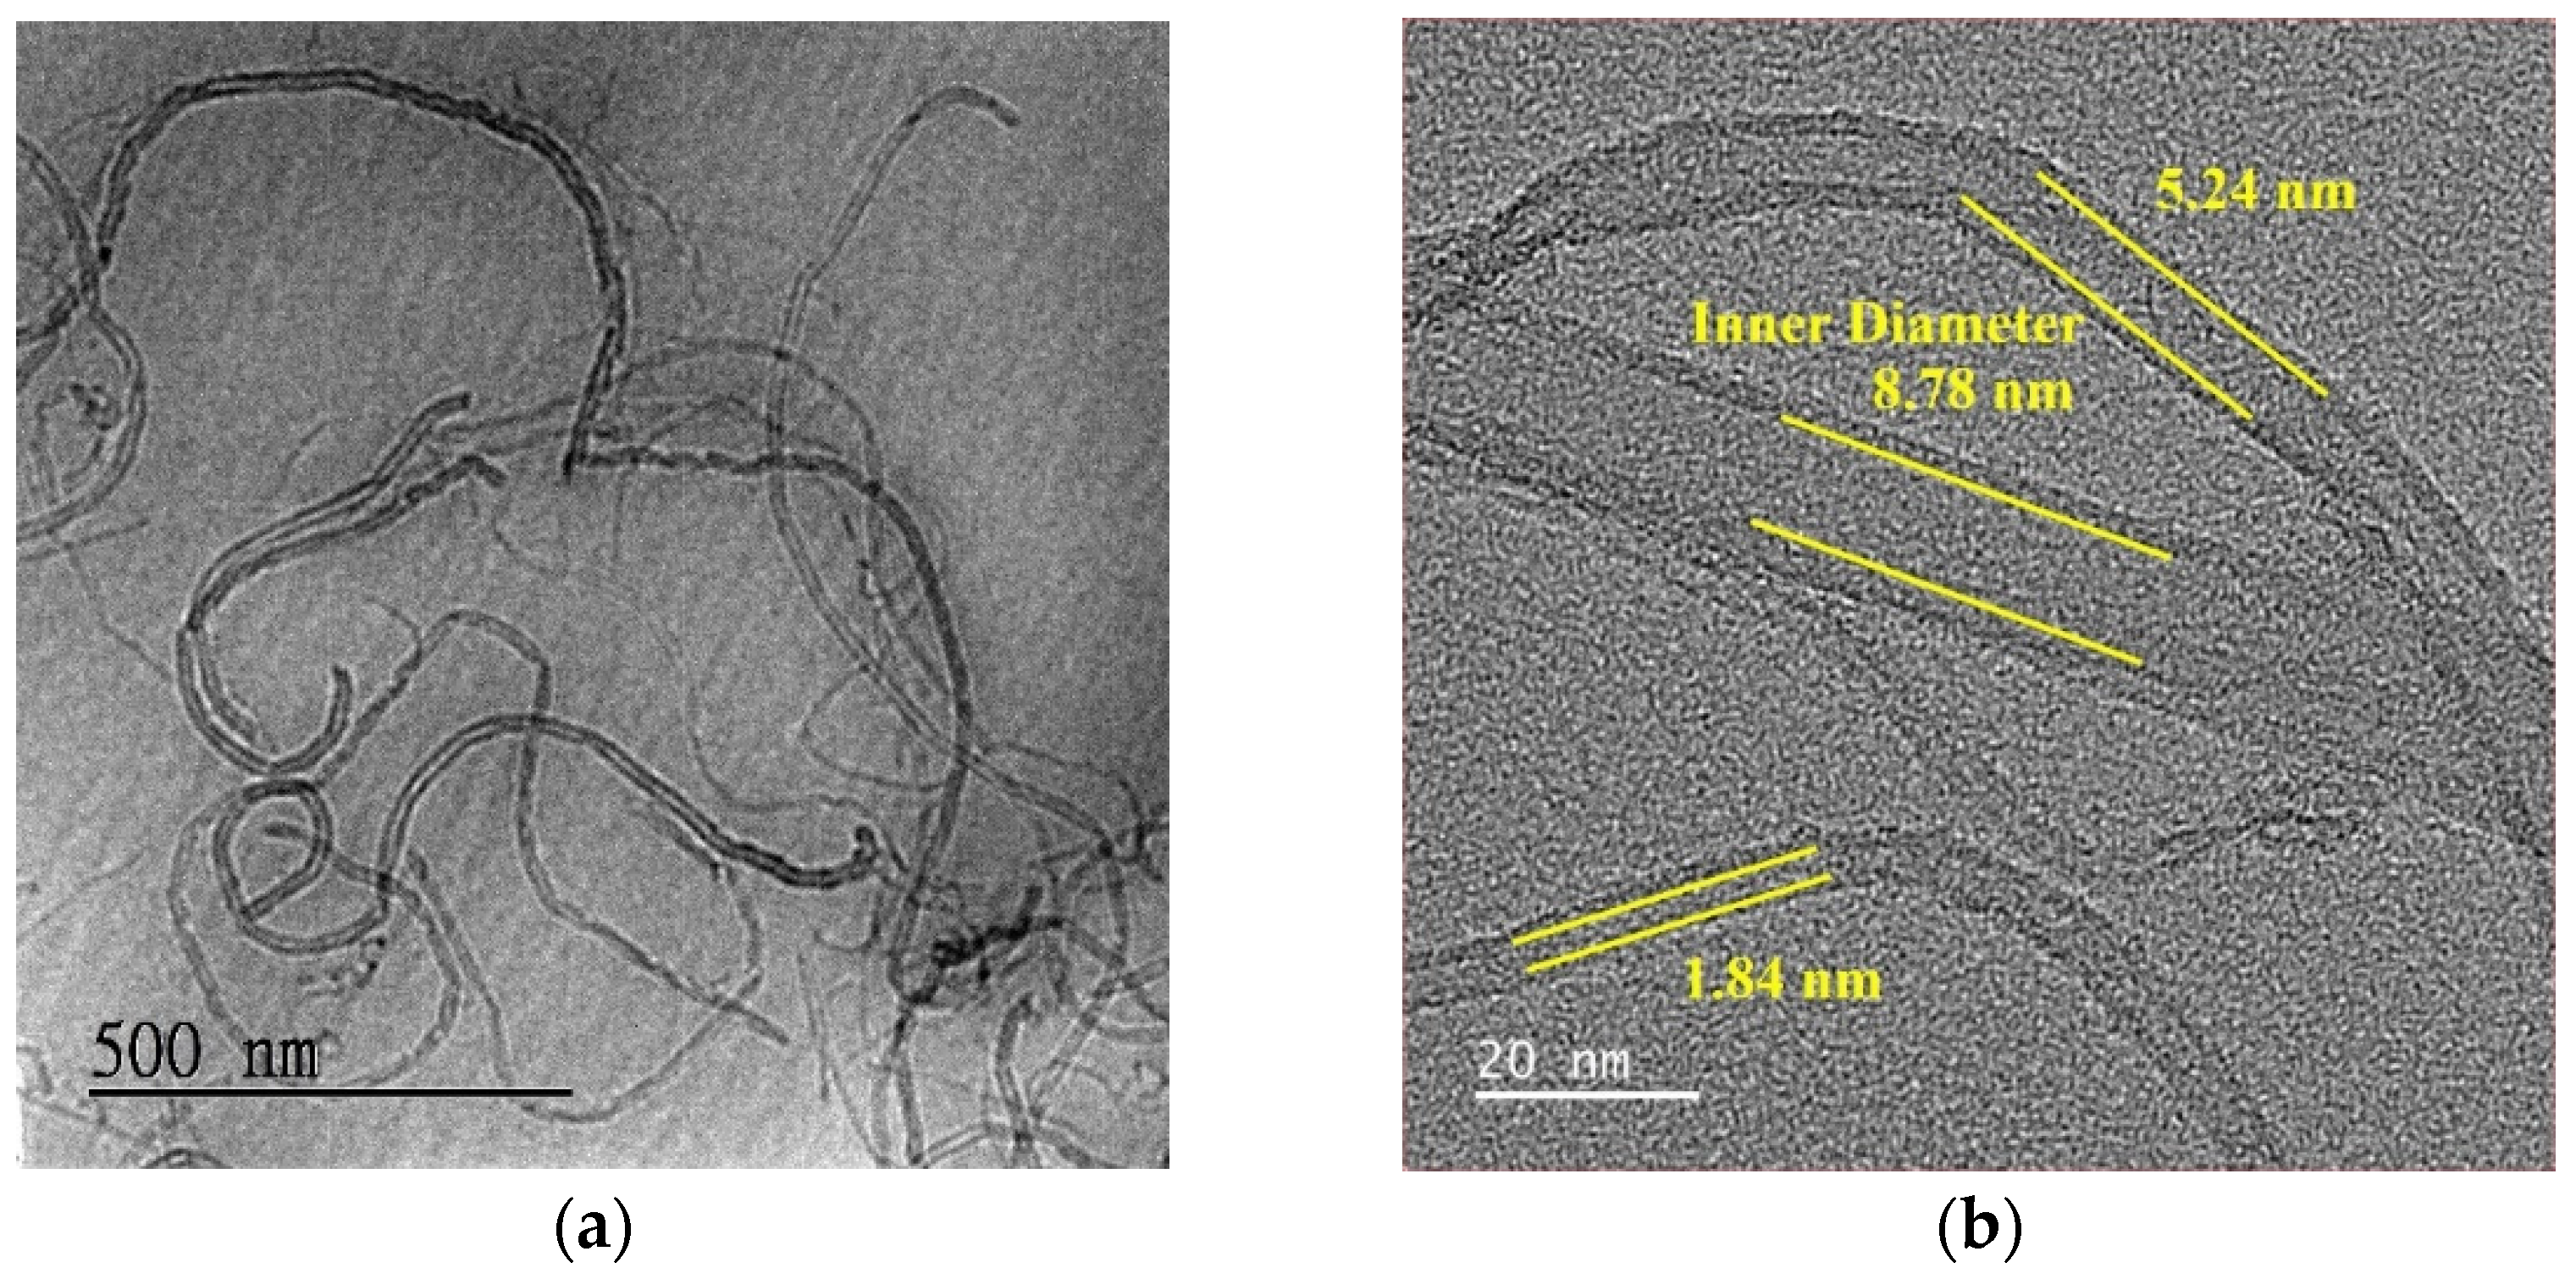
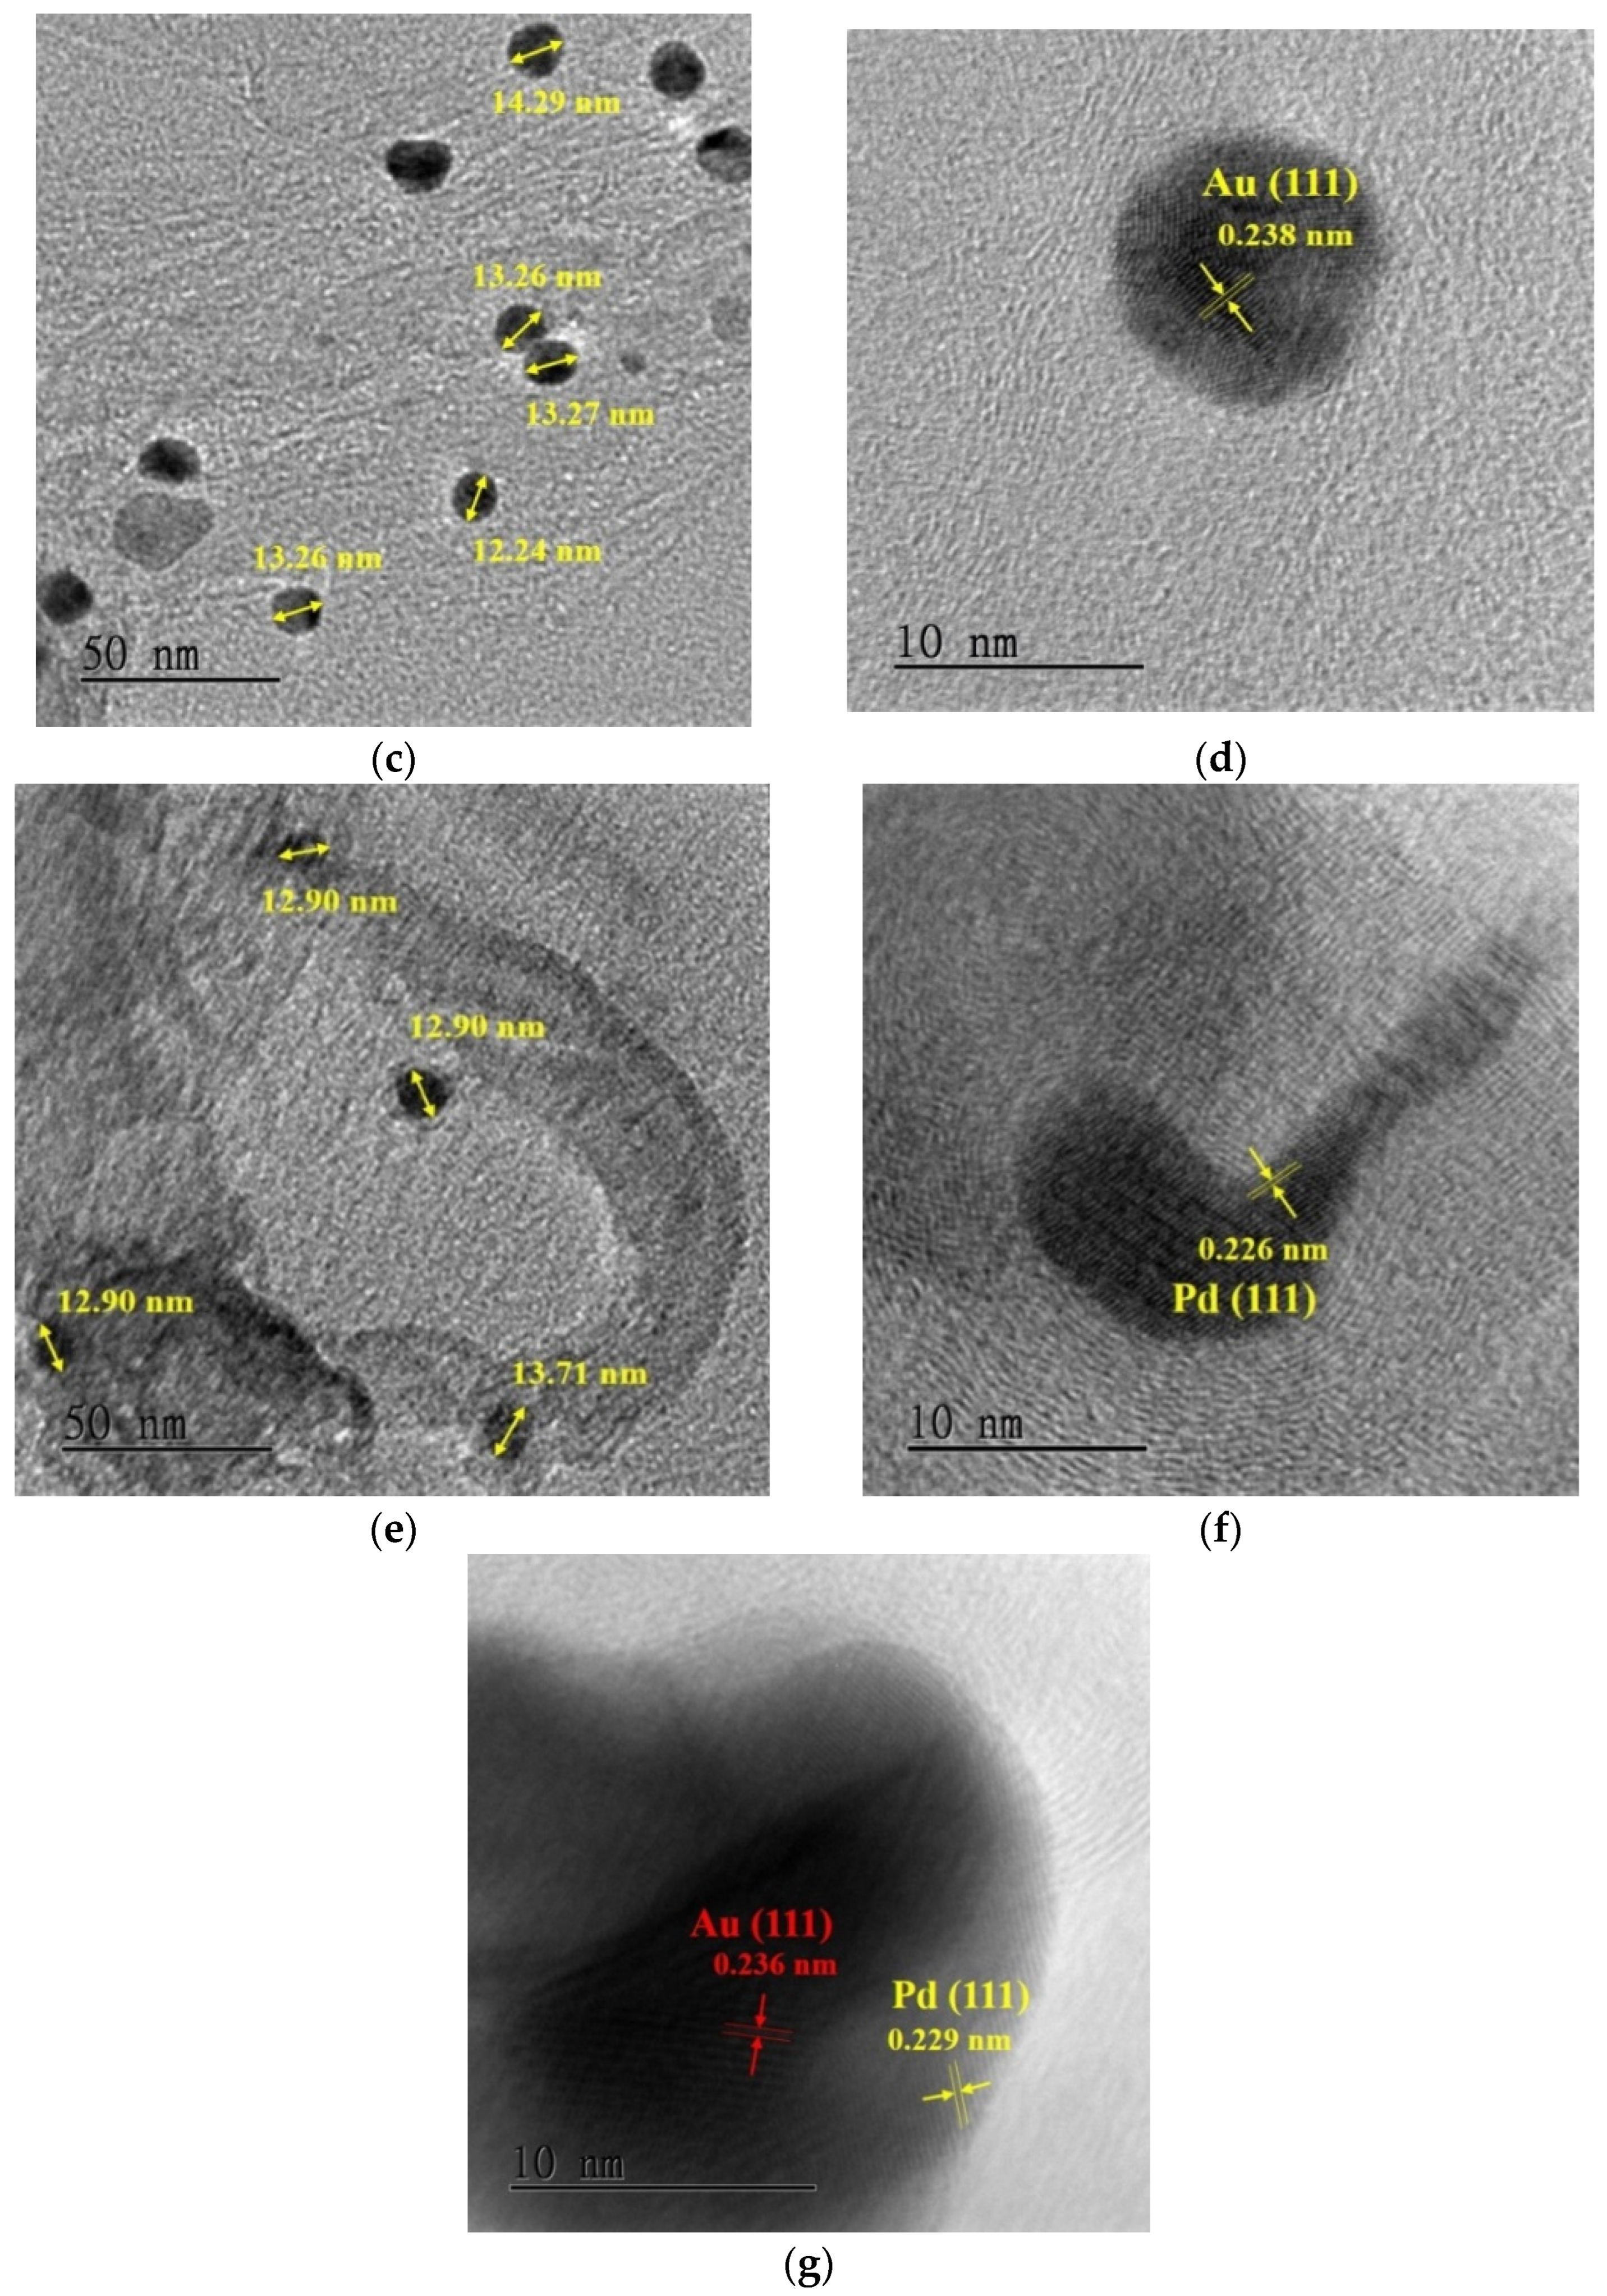
In order to investigate the surface morphologies of MWCNT, Au/MWCNT, Pd/MWCNT, and AuPd/MWCNT, FE-SEM analysis was carried out. As illustrated in Figure 3a, it can be seen that MWCNT possesses a hexagonal cylindrical structure. MWCNT were decorated with Au nanoparticles and with Pd nanoparticles, respectively (Figure 3b,c). From Figure 3d, it can be observed that Au nanoparticles and Pd nanoparticles were dispersedly deposited on the MWCNT surface. The nanostructure of as-obtained samples have been characterized by using TEM, and the results indicated that MWCNT has a hollow cylindrical shape with an internal diameter of 1.84–8.78 nm (Figure 4a,b). Au NPs with an average particle size of about 13.26 nm were successfully doped into MWCNT, as shown in Figure 4c. From Figure 4d, it can be seen that the calculated d-spacing of 0.238 nm can be ascribed to the (111) plane of Au [25]. As displayed in Figure 4e, Pd NPs (the average diameter was approximately 13.10 nm) were deposited on the surface of MWCNT. As shown in Figure 4f, the measured lattice spacing of 0.226 nm corresponded to the (111) facet of Pd [25]. It can be observed that Au and Pd NPs were anchored on the MWCNT surface, suggesting that AuPd/MWCNT was successfully fabricated (Figure 4g).
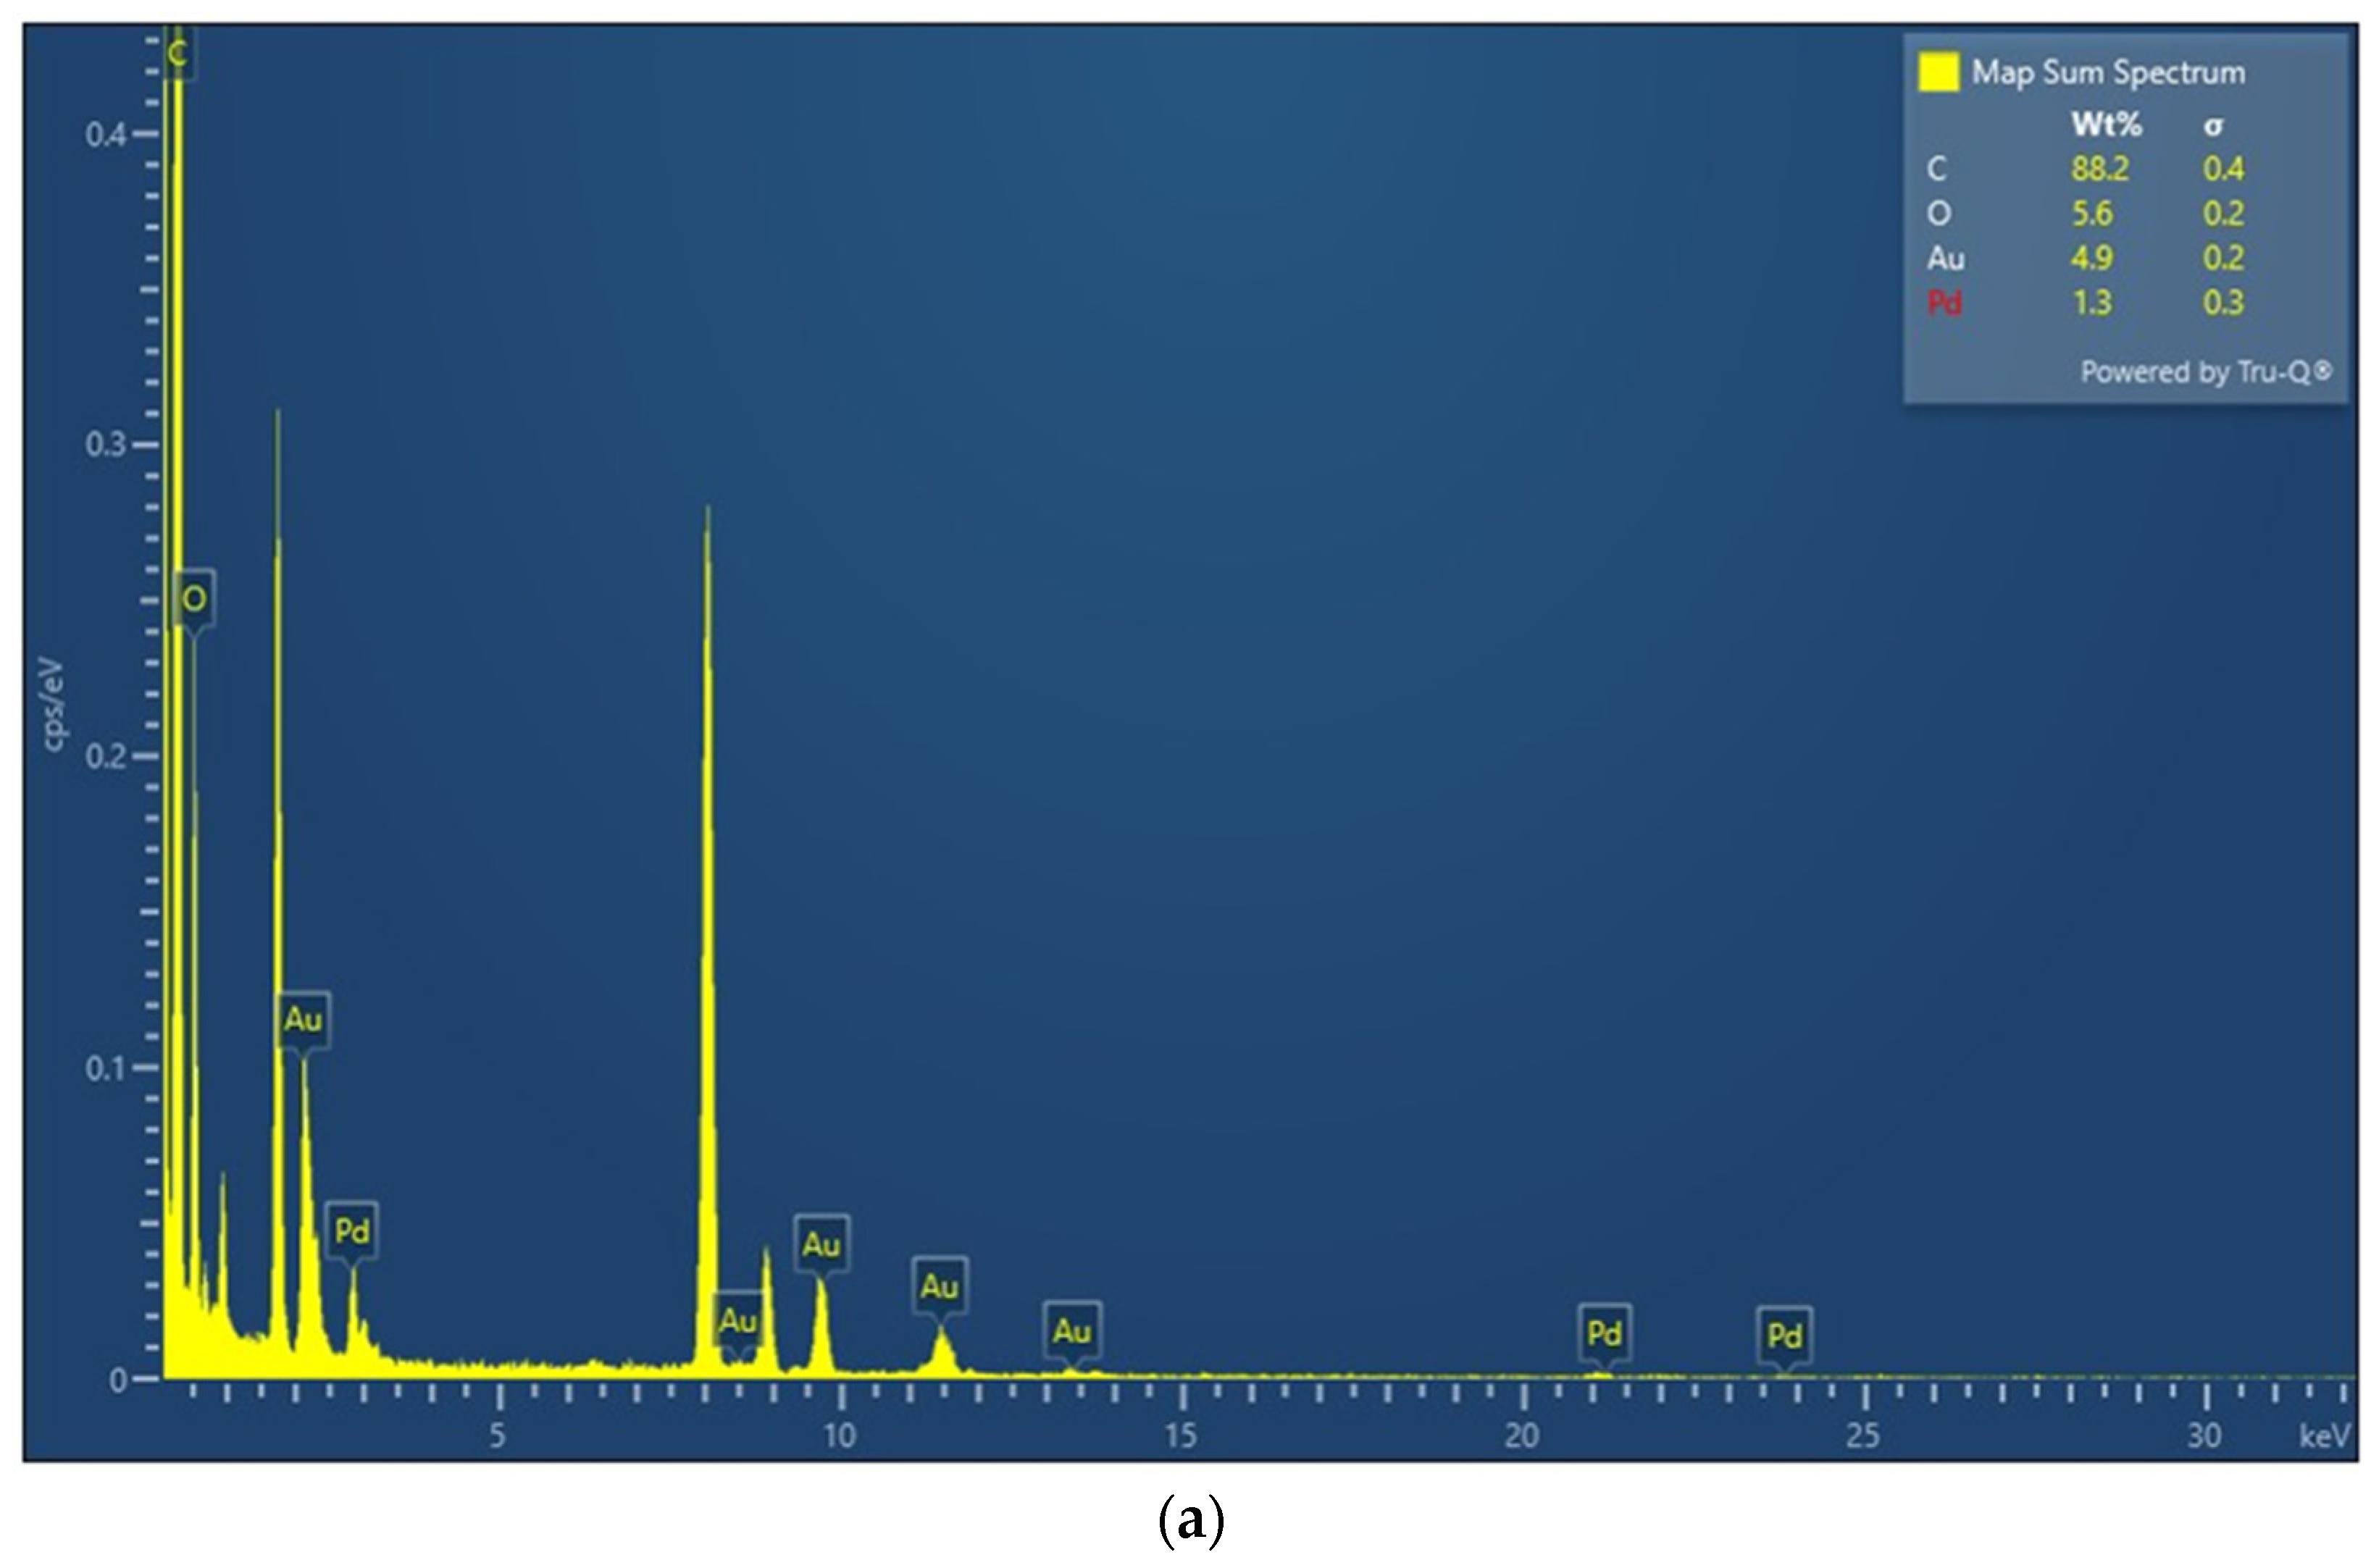
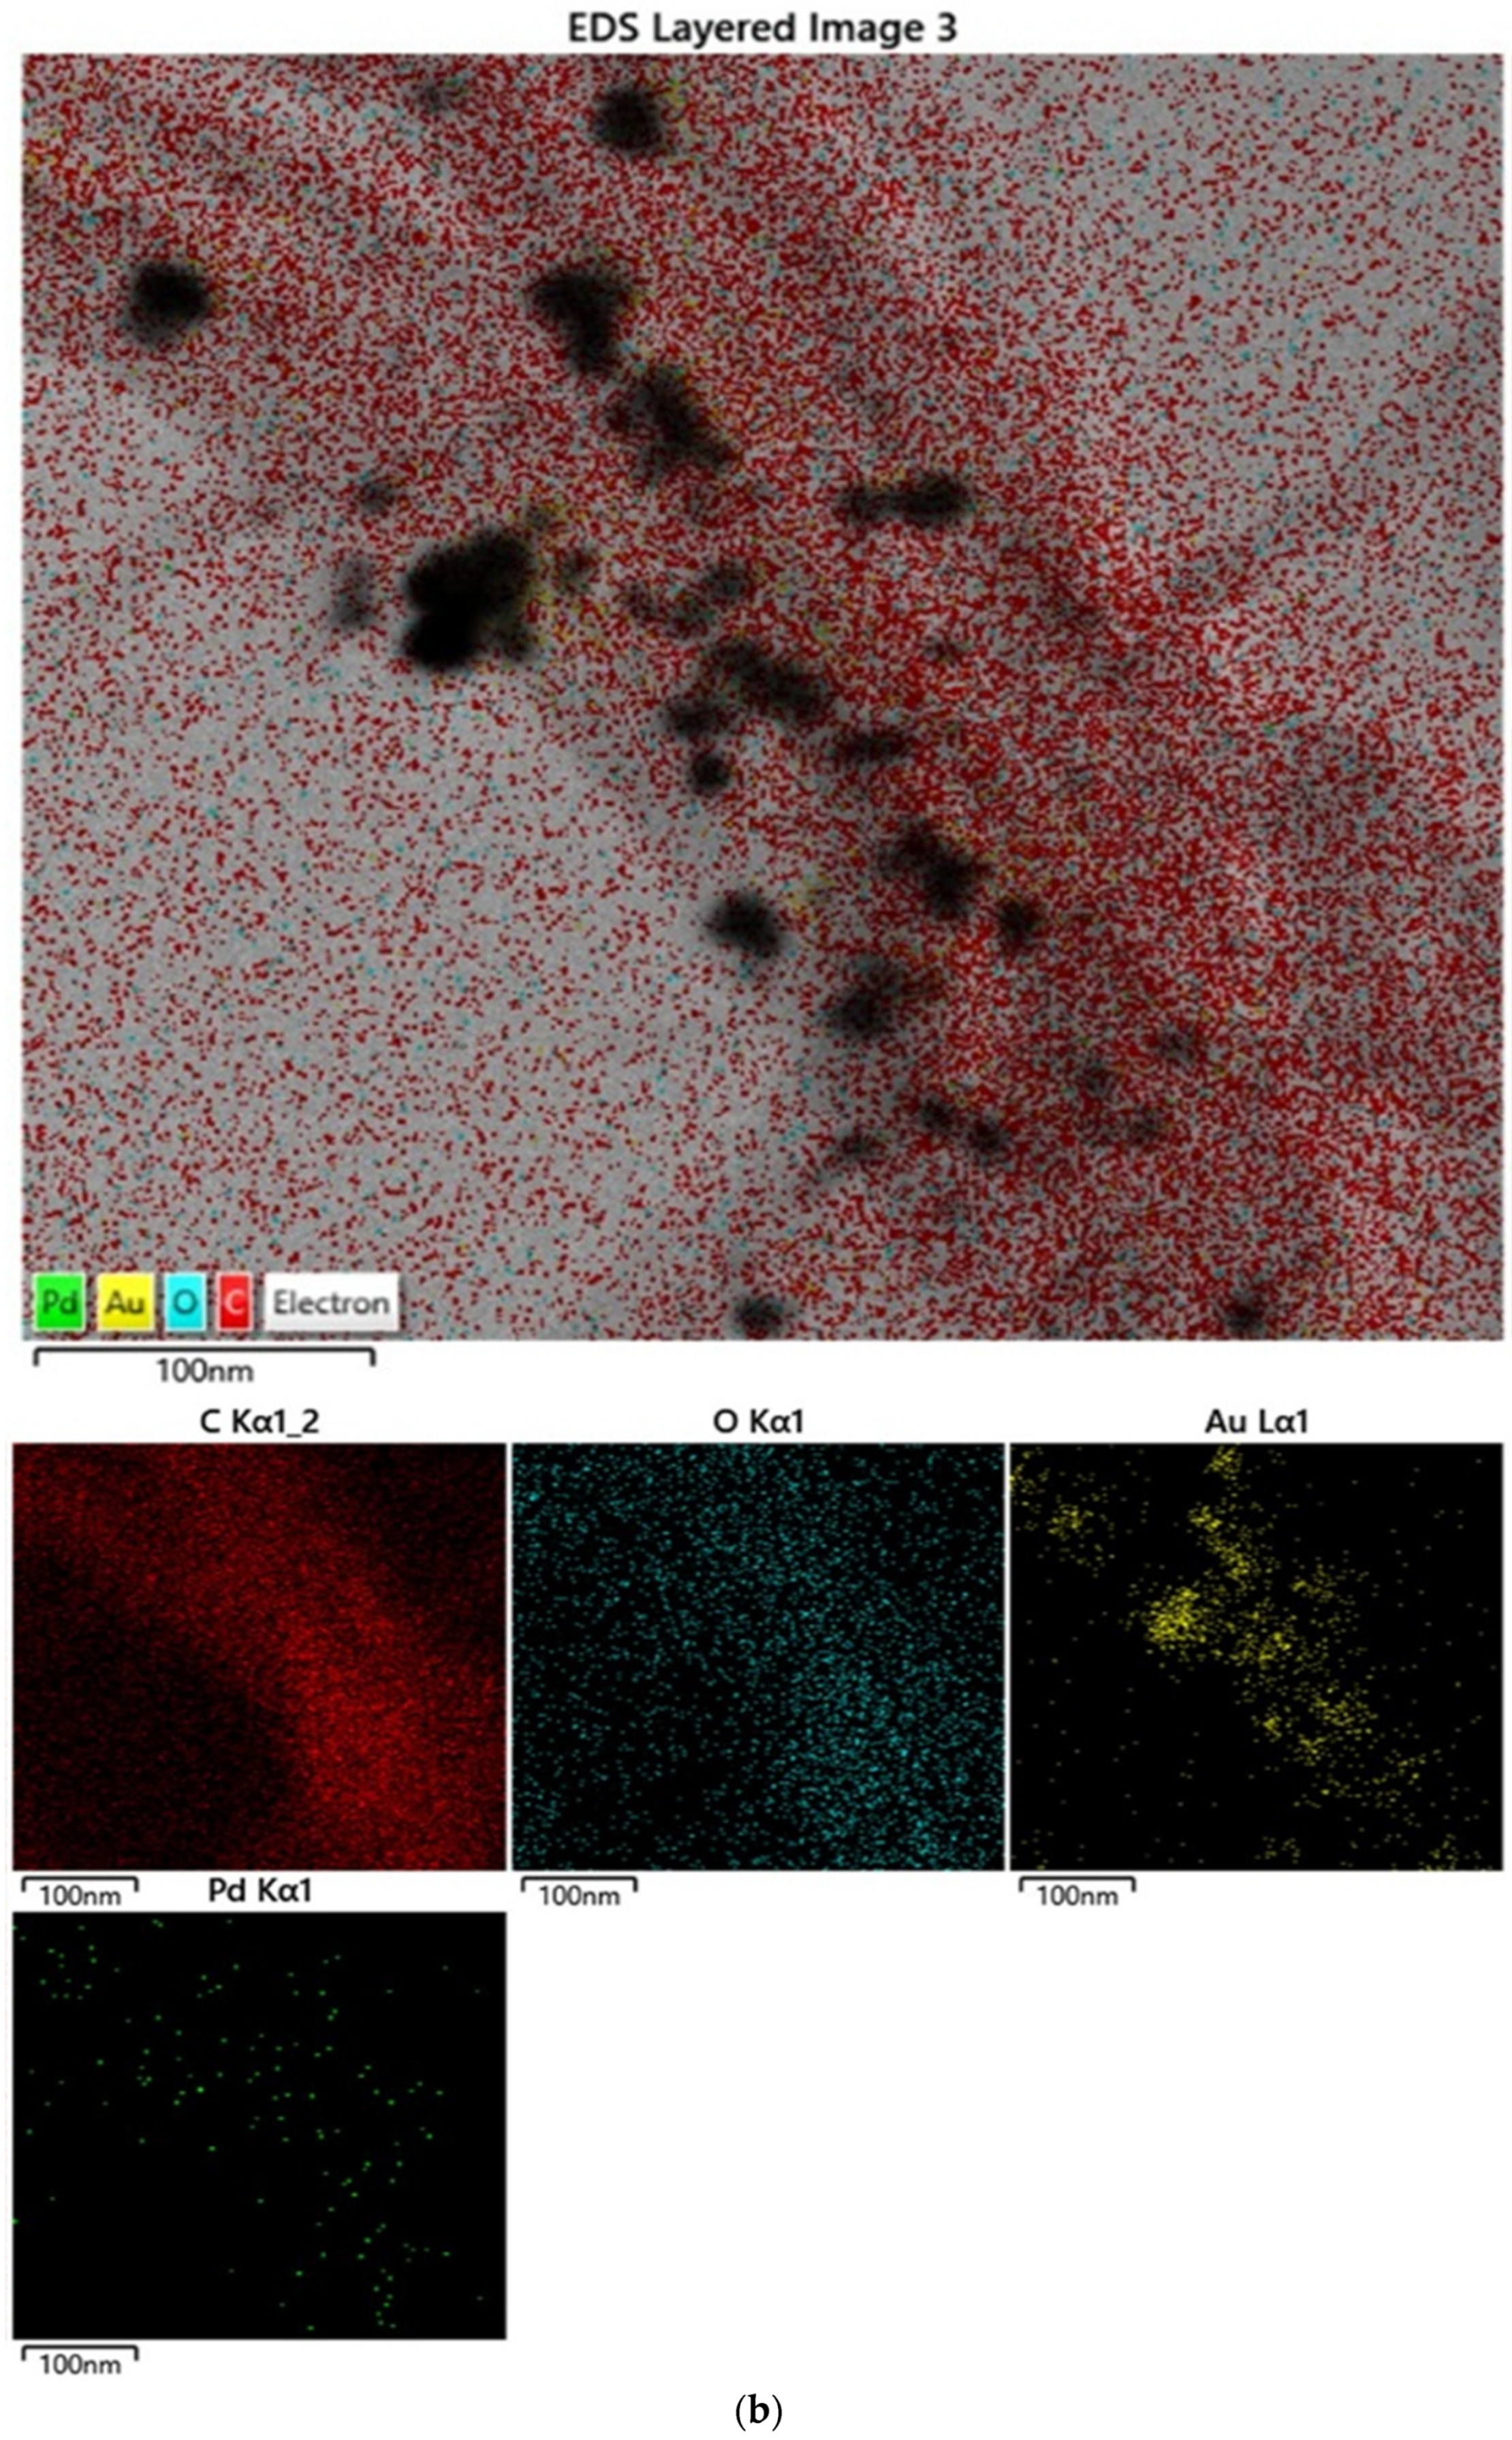
To study the element distribution and composition of as-prepared AuPd/MWCNT, energy-dispersive X-ray spectroscopy (EDS) was employed. As illustrated in Figure 5a, the EDS spectrum of AuPd/MWCNT confirmed the existence of Au, O, C, and Pd elements, indicating that AuPd/MWCNT was synthesized successfully. In addition, the element mapping patterns (Figure 5b) exhibited that Au and Pd elements were uniformly dispersed in MWCNT, revealing that Au and Pd species were attached to the surface of MWCNT.
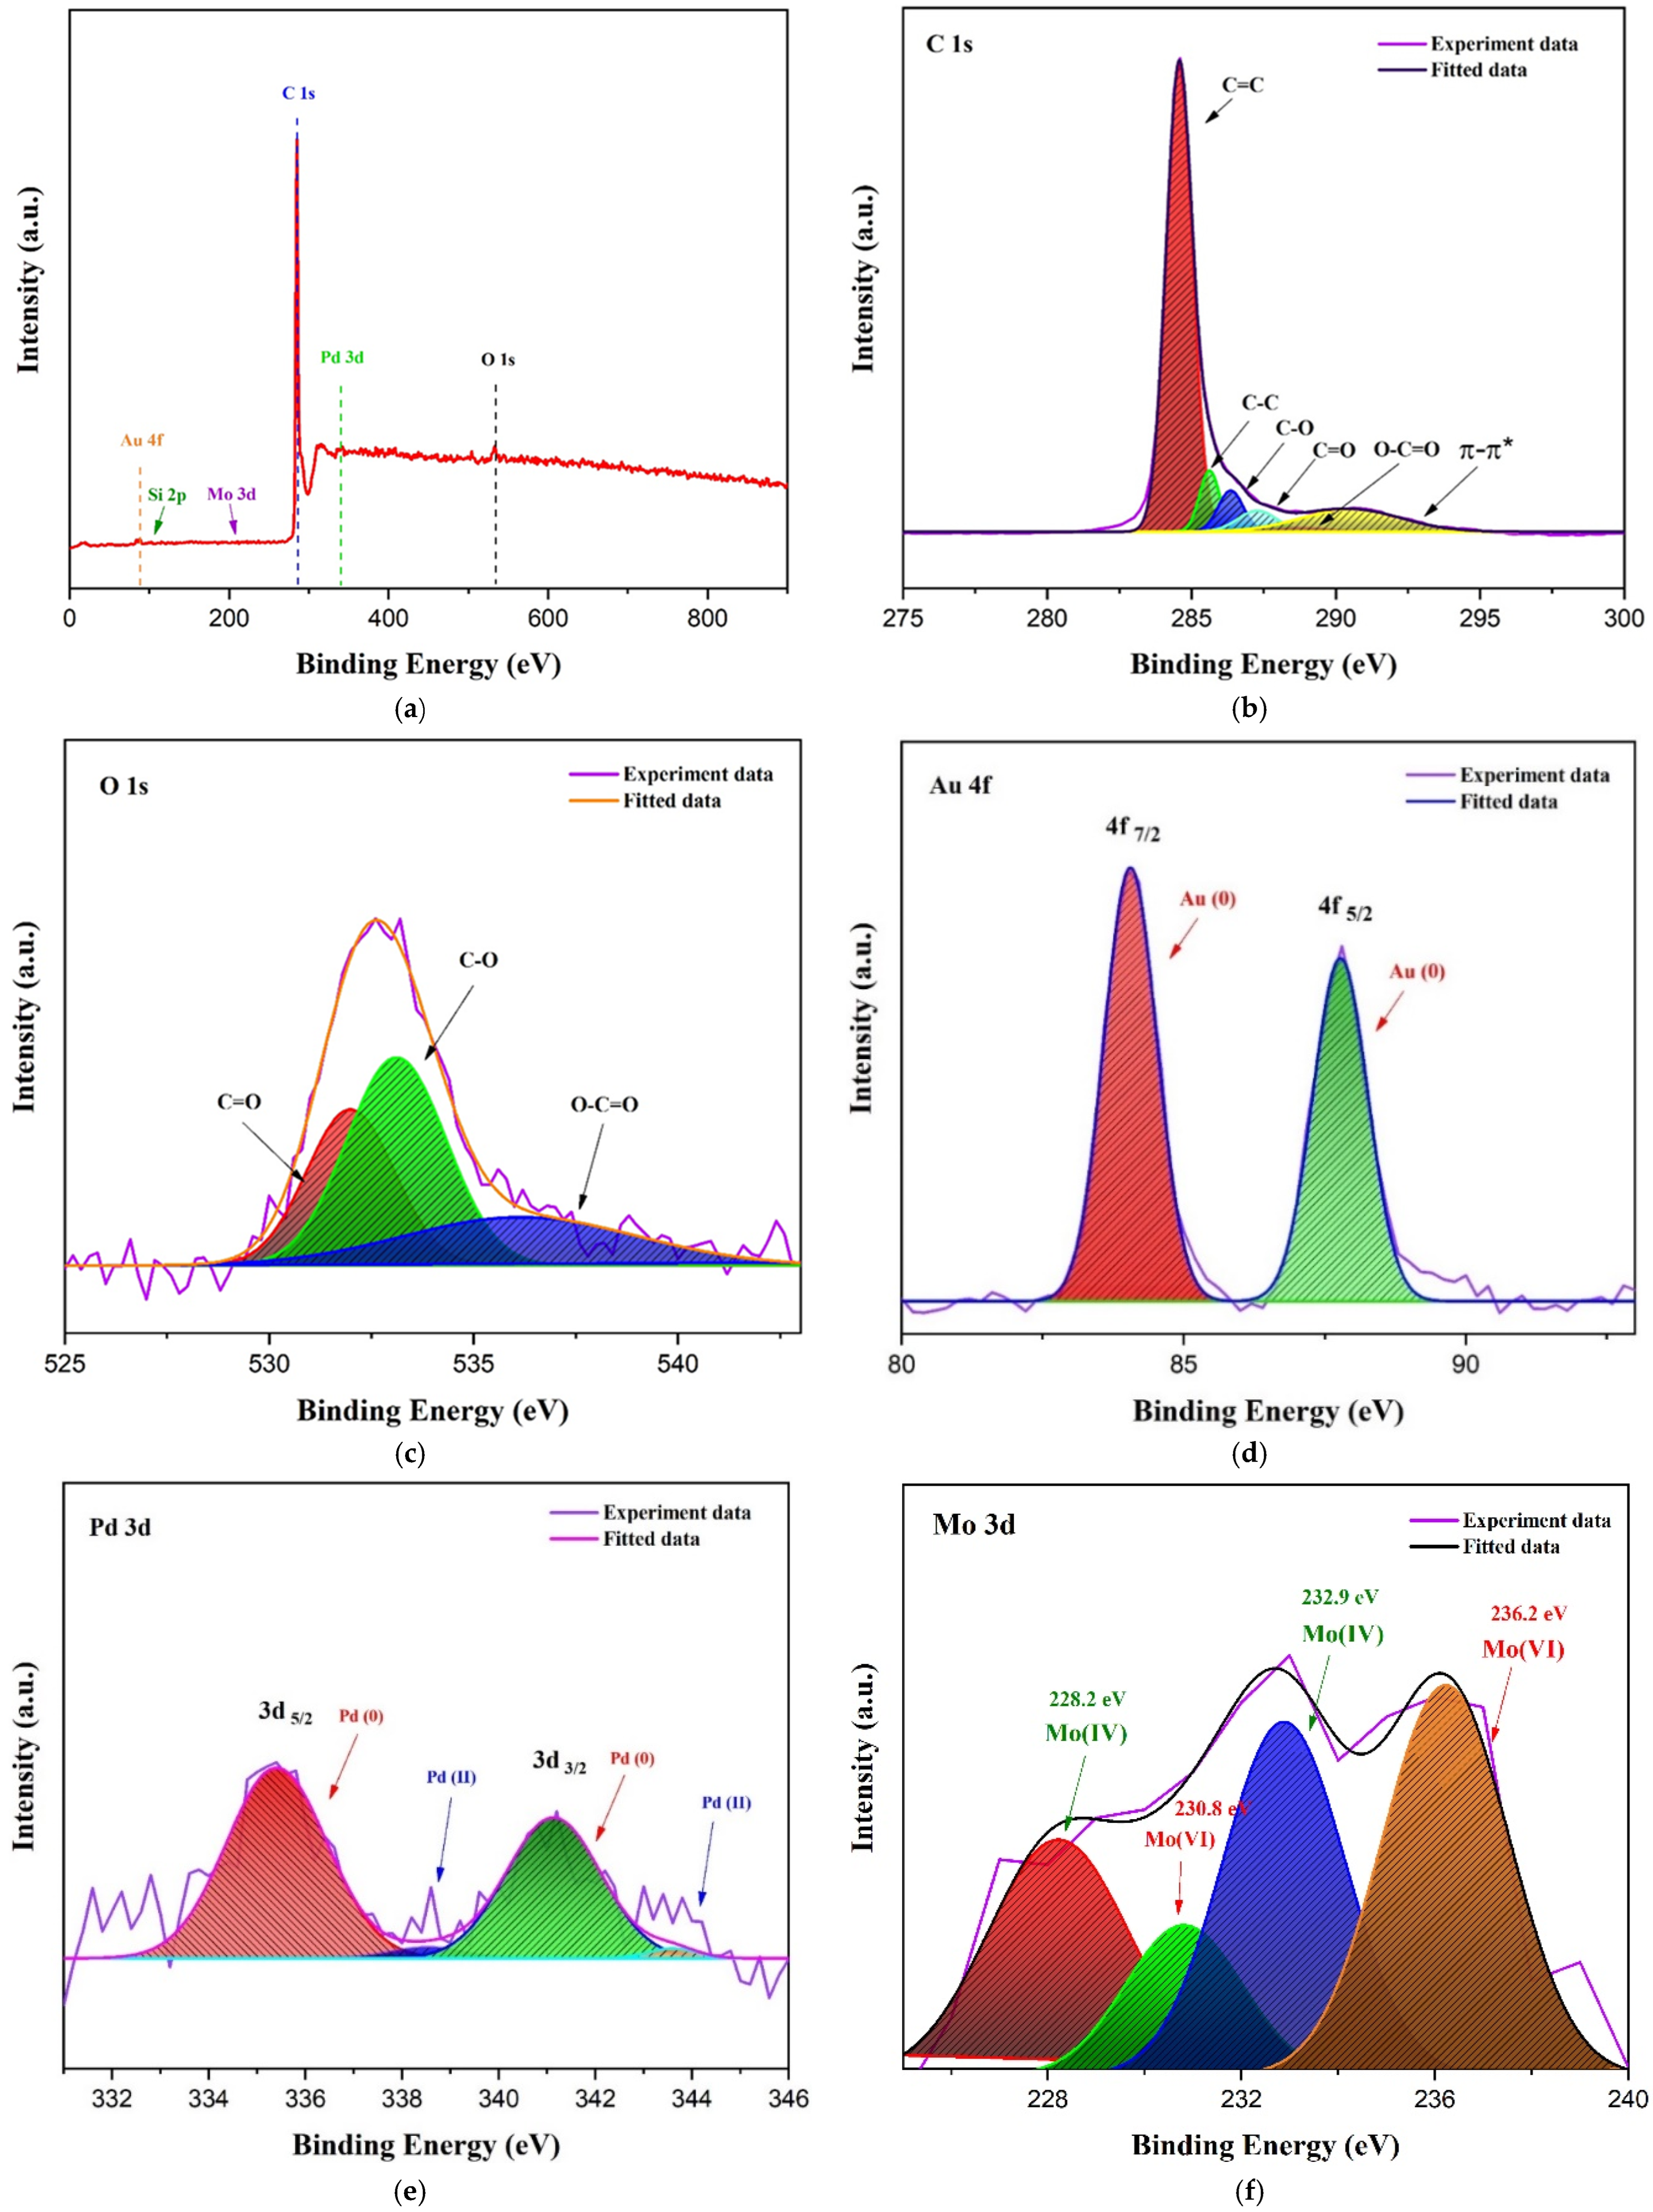
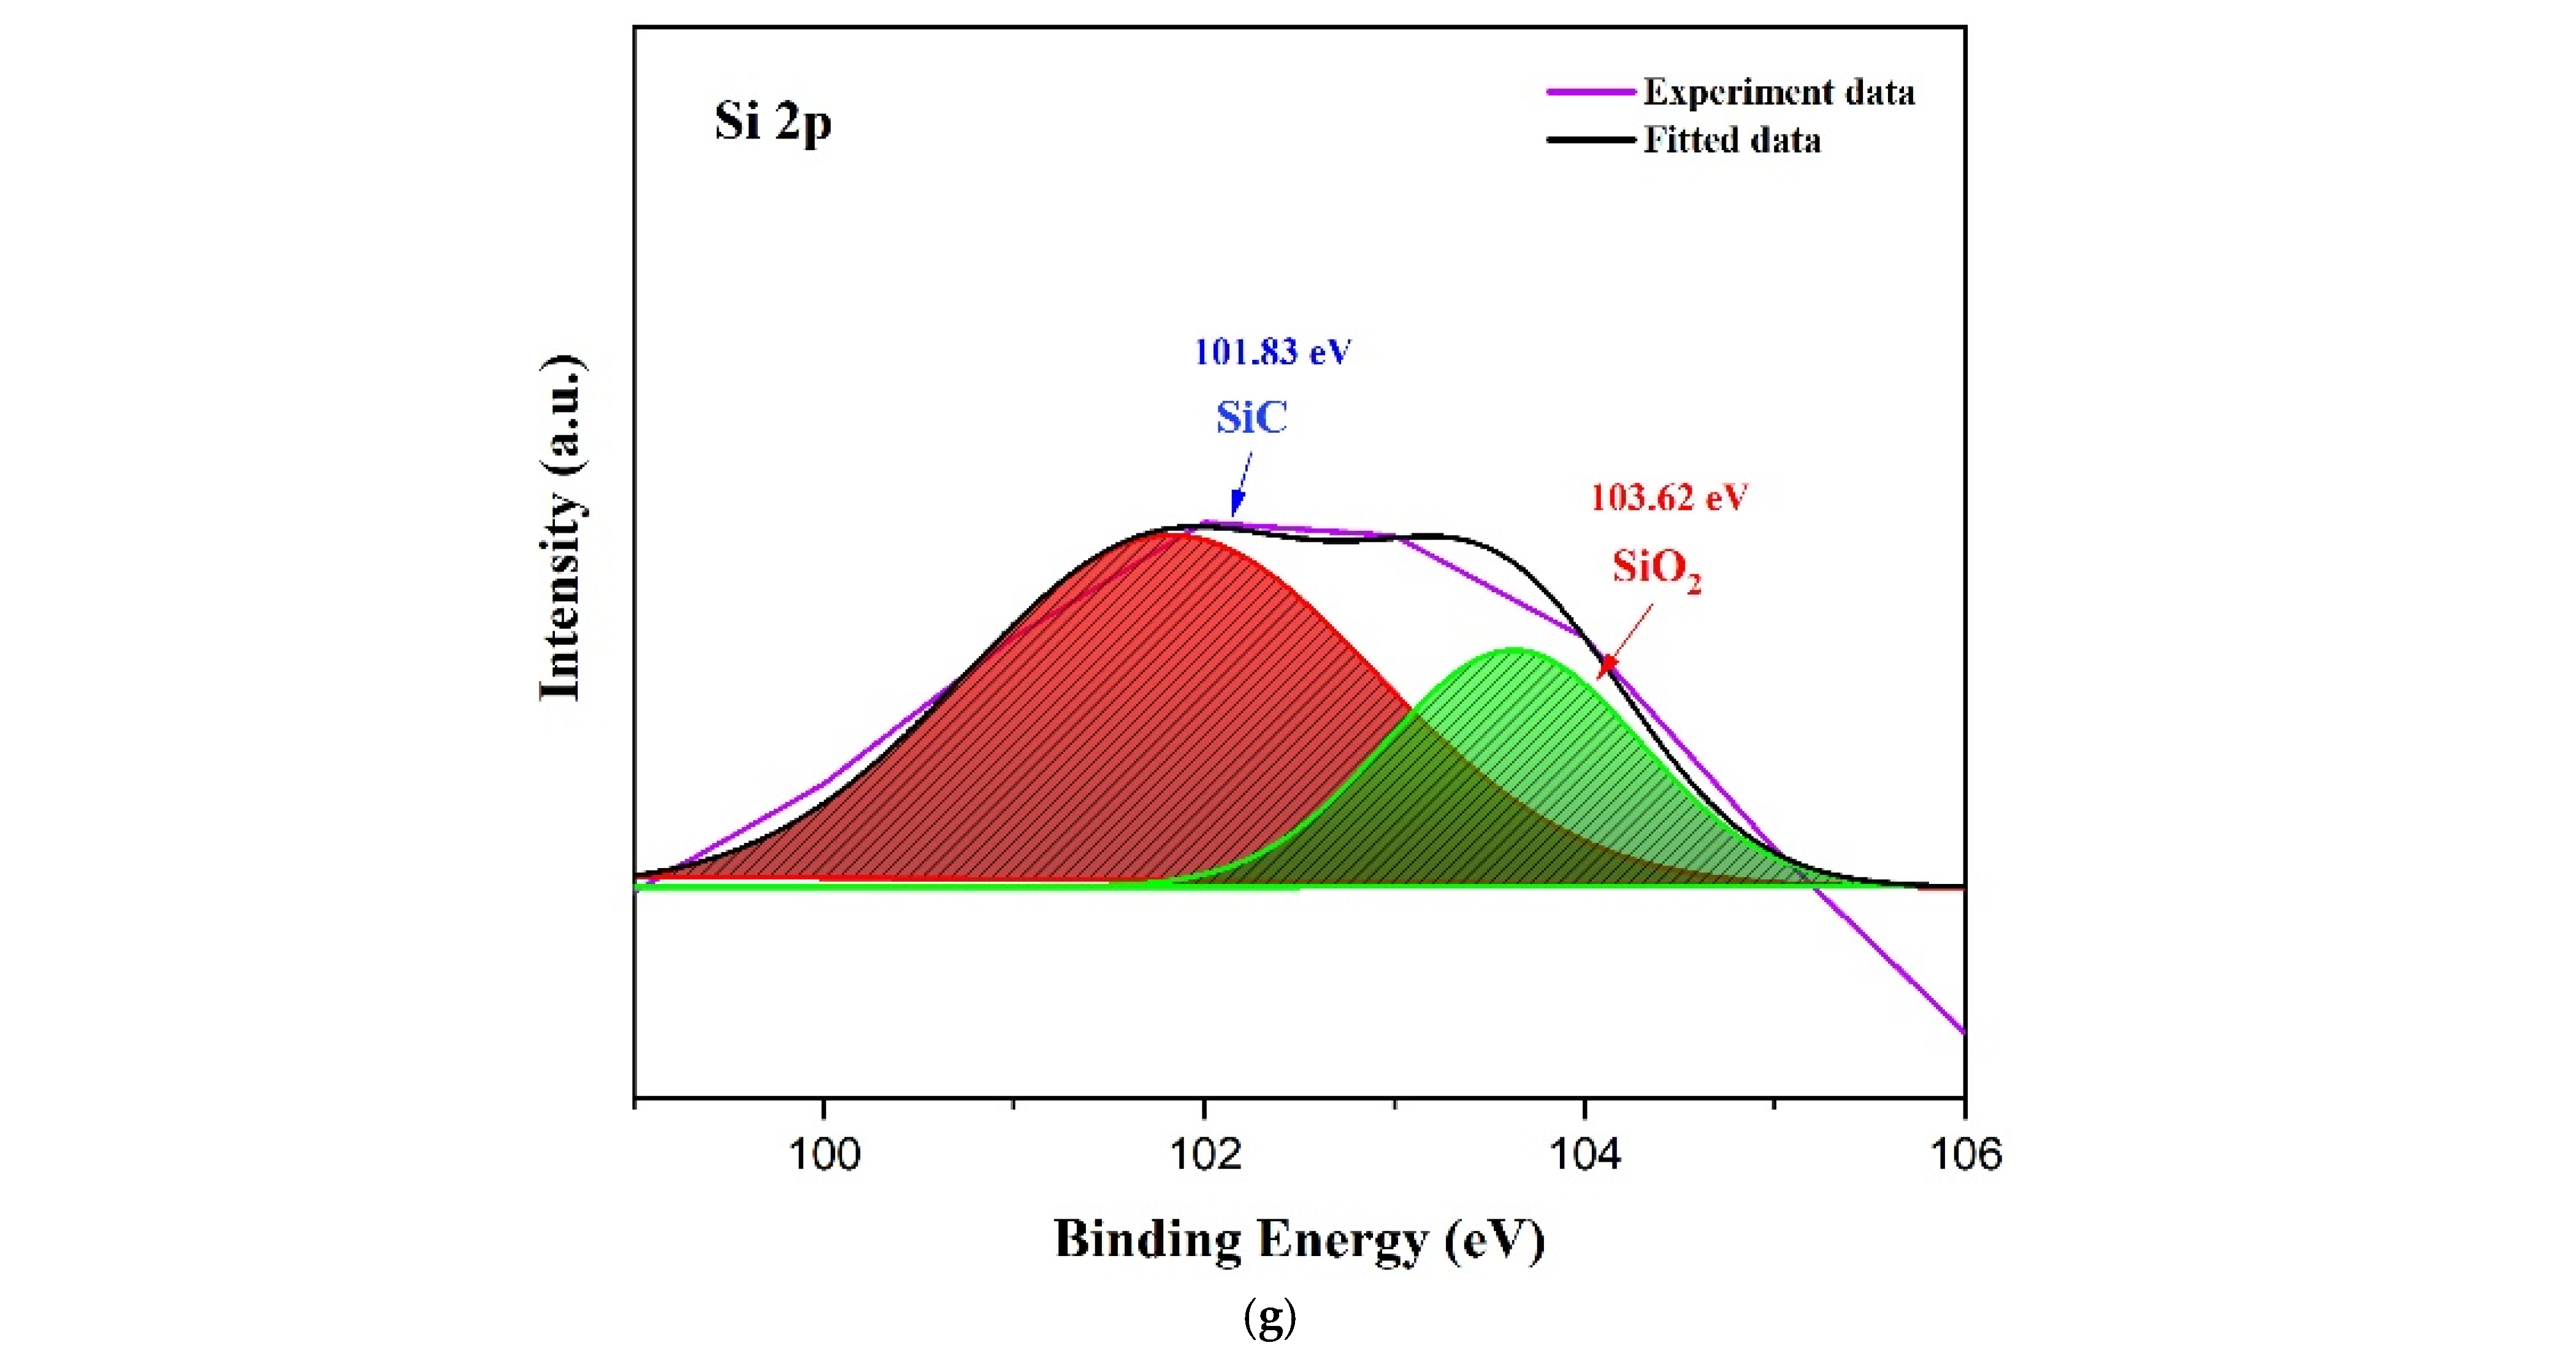
X-ray photoelectron spectroscopy (XPS) was employed to investigate the elemental composition and chemical states of AuPd/MWCNT, and high-resolution spectra of AuPd/MWCNT (Figure 6a) verified the presence of C, O, Mo, Si, Au, and Pd atoms in the AuPd/MWCNT, which were in good agreement with the XRD result. It is worth noting that the intensities of the Si and Mo XPS peaks were weak, which is due to the low concentration of Si and Mo elements in the AuPd/MWCNT. From Figure 6b, six obvious peaks located at 284.6, 285.6, 286.4, 287.3, 288.8, and 290.5 eV were observed in the XPS spectrum of C 1s, corresponding to C=C, C-C, C-O, C=O, O-C=O and π–π* groups, respectively [26]. The XPS spectrum of O 1s (Figure 6c) had three distinct peaks at 532.0, 553.1, and 536.2 eV, corresponding to C-O, C=O, and O-C=O groups, respectively. As shown in Figure 6d, the peaks can be detected at 84.1 eV(Au 4f7/2) and 87.8 eV(4f5/2) in Au 4f spectrum, suggesting the formation of metallic Au (0) in the AuPd/MWCNT. From Figure 6e, it can be seen that the peaks of Pd 3d5/2 at 335.4 eV and 341.1 eV revealed the existence of the metallic Pd0. Mo can be deconvoluted into four peaks at 228.2, 230.8, 232.9, and 236.2 eV, attributing to MoIV 3d5/2, MoVI 3d5/2, MoIV 3d3/2, and MoVI 3d3/2, respectively, as illustrated in Figure 6f [27]. The Si 2p XPS spectrum revealed that two obvious peaks located at 101.83 and 103.62 eV (Figure 6g), which could be due to the presence of SiC and SiO2 bonds [28].

3.2. Sensing Properties

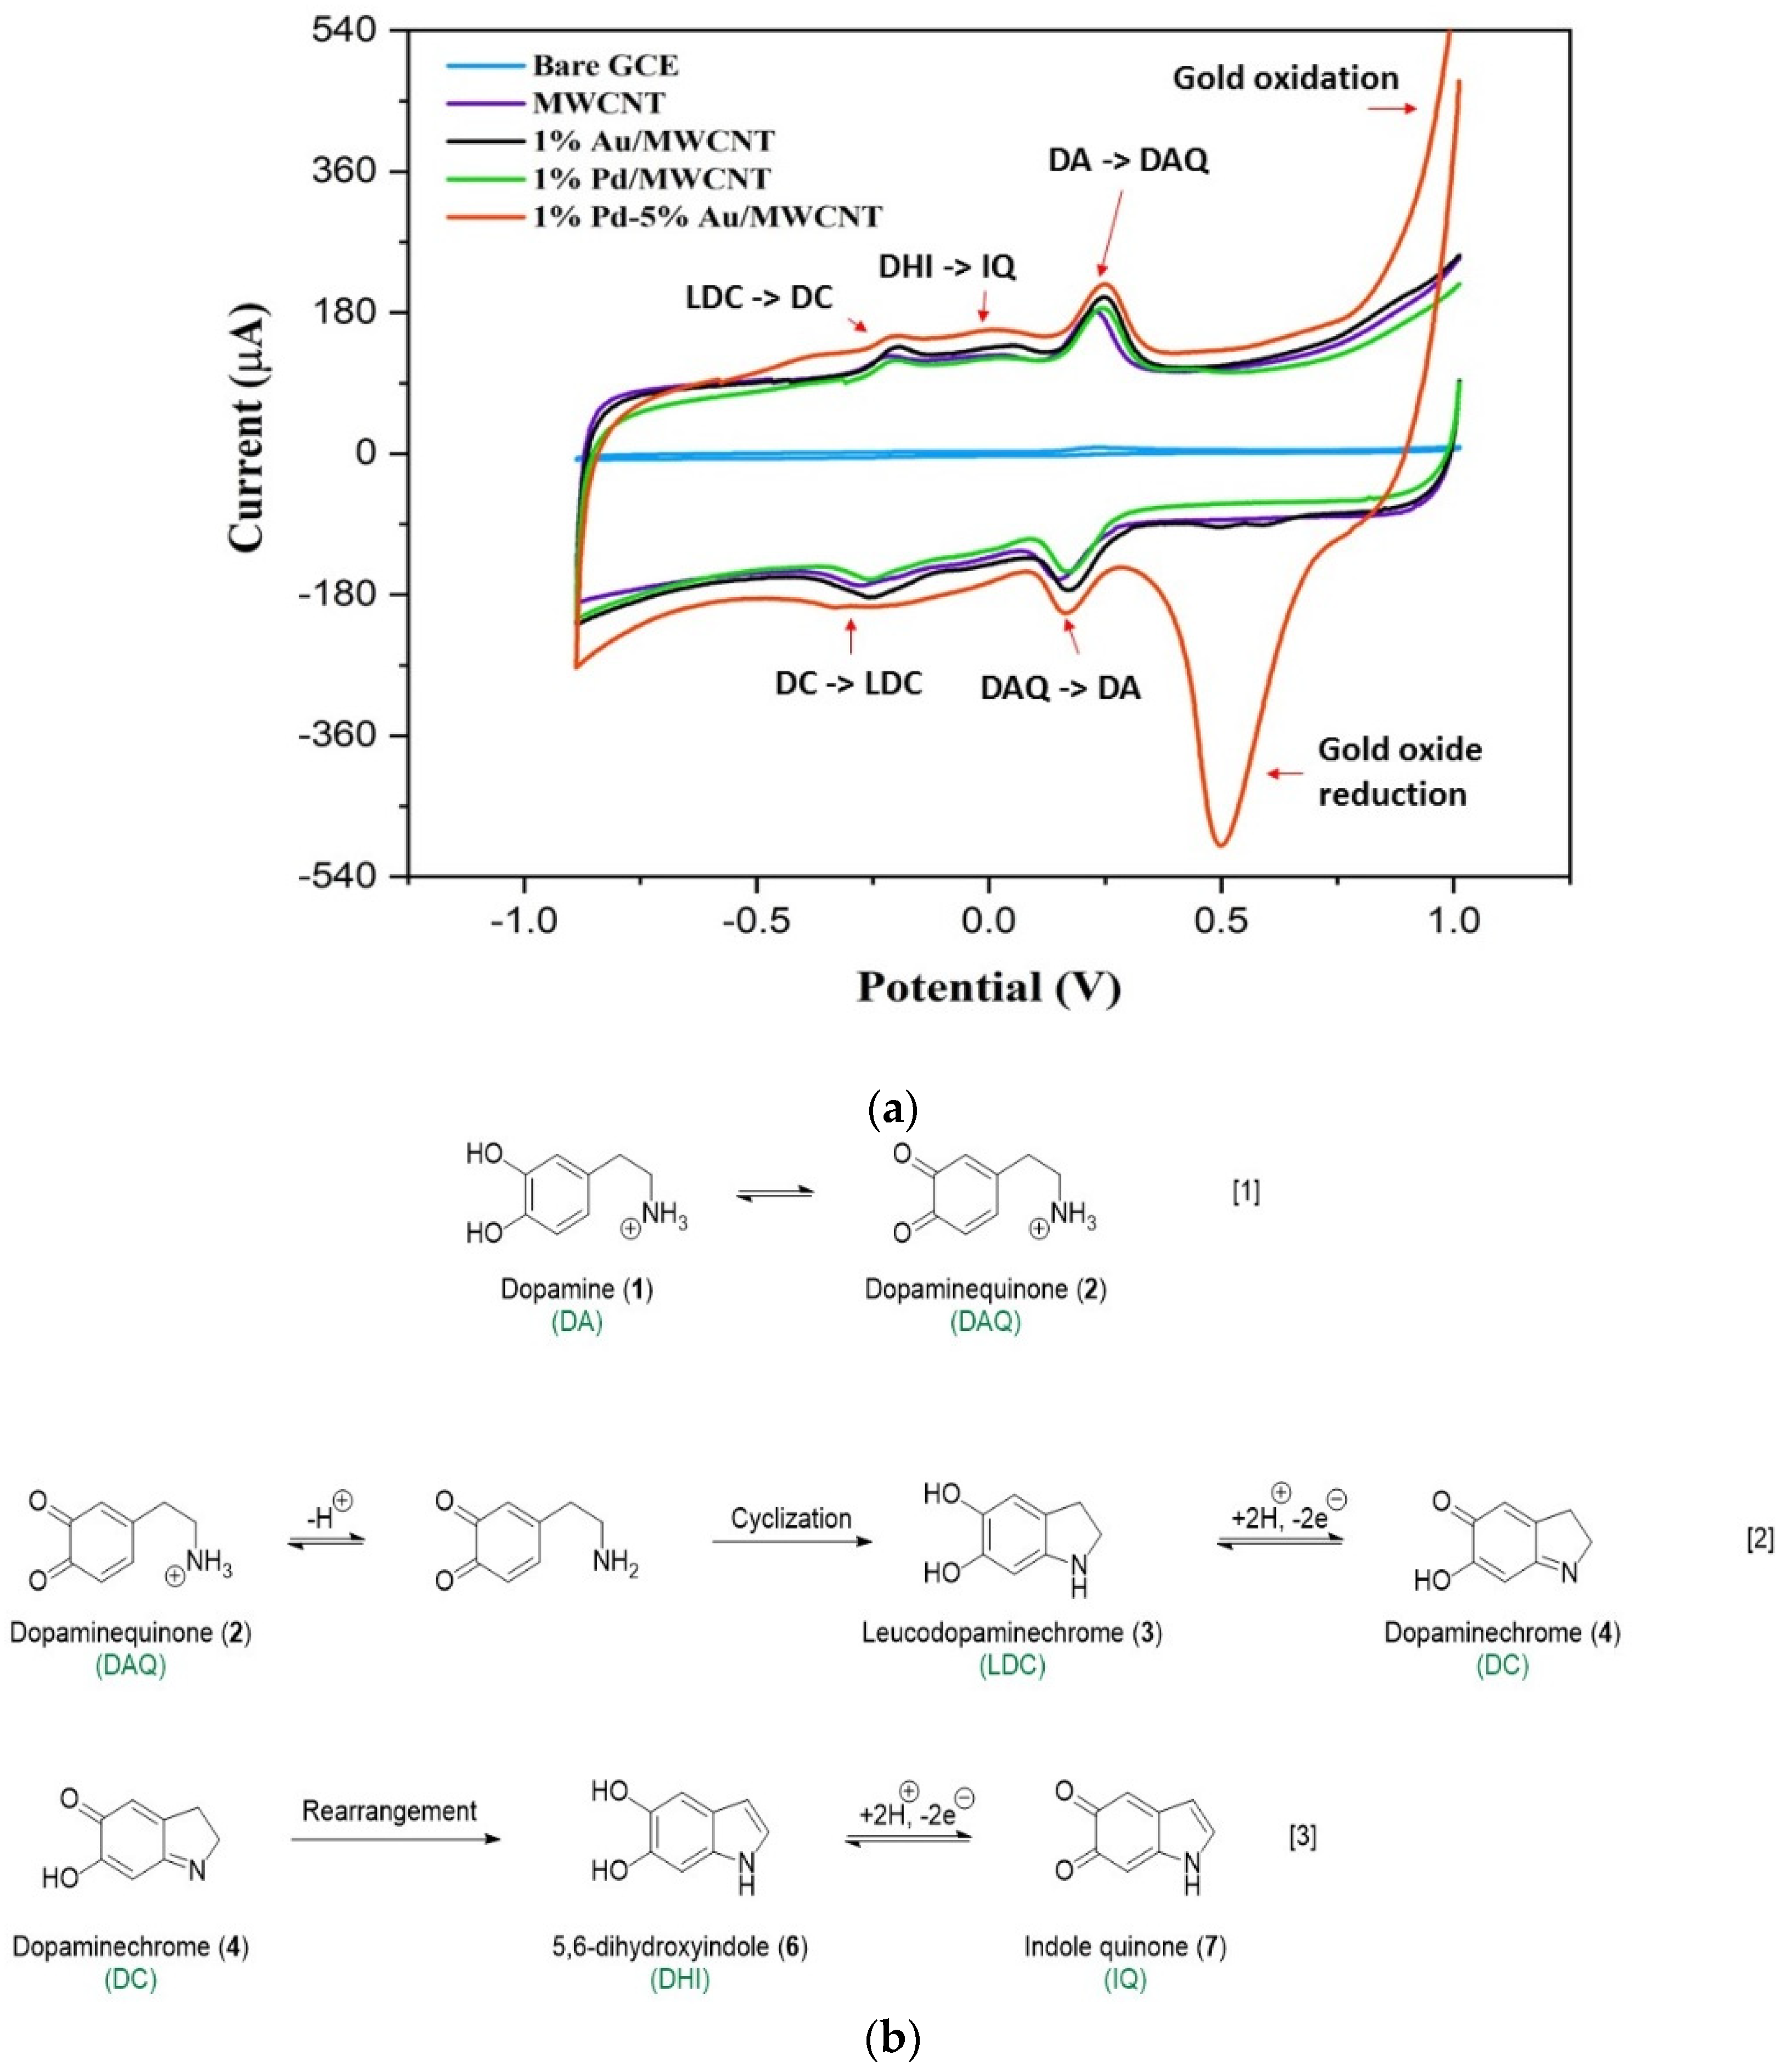
In order to examine the electrochemical properties of different electrodes, cyclic voltammetry (CV) measurements were carried out in Figure 7a,b. The bare electrode (glass carbon electrode, GCE) showed very low CV current signal and near straight line curve. The oxidation and reduction mechanisms of dopamine and relative compounds were sorted out from the CV curves in Figure 7a,b. In Figure 7a,b, the peak of the oxidation reaction from DA to dopaminequinone (DAQ) appeared at a potential of about 0.24 V and for reduction from DAQ to DA at a potential of about 0.20 V (Equation (1) in Figure 7b) [29,30]. Another oxidation reaction from leucodopaminechrome (LDC) to DC occurred at a potential of −0.2 V and reduction reaction from DC to LDC at a potential of −0.25 V (Equation (2) in Figure 7b). LDC is cyclization from DAQ (Equation (2) in Figure 7b) [30]. The 5,6-dihydroxyindole (DHI) was followed by DC rearrangement (Equation (3) in Figure 7b). A further reaction resulting in an oxidation peak from DHI to indole quinone (IQ) is at a potential of about −0.1 V (Equation (3) in Figure 7b) [30]. Gold oxidation reaction is located at 1.0 V, and gold oxide reduction occurs at 0.5 V.
Figure 7 shows the redox reaction peaks (at about 0.2 V) of dopamine and dopamine-o-quinone on the sensing material of MWCNT, 1%Au/MWCNT, 1% Pd/MWCNT, and 1% Au-5% Pd/MWCNT [29,30]. The promotion of currents was revealed on the sensing material MWCNT, 1%Au/MWCNT, 1%Pd/MWCNT, and 1% Pd-5% Au/MWCNT. As displayed in Figure 7, it can be observed that 1% Pd-5% Au/MWCNT exhibited a well-defined pair of redox peaks with the highest peak current under the 200 μM DA concentration. The prominent electrochemical performance of 1% Pd-5% Au/MWCNT could be ascribed to the synergistic effect of highly electroactive bimetallic Au-Pd NPs and MWCNT with good electrical conductivity.
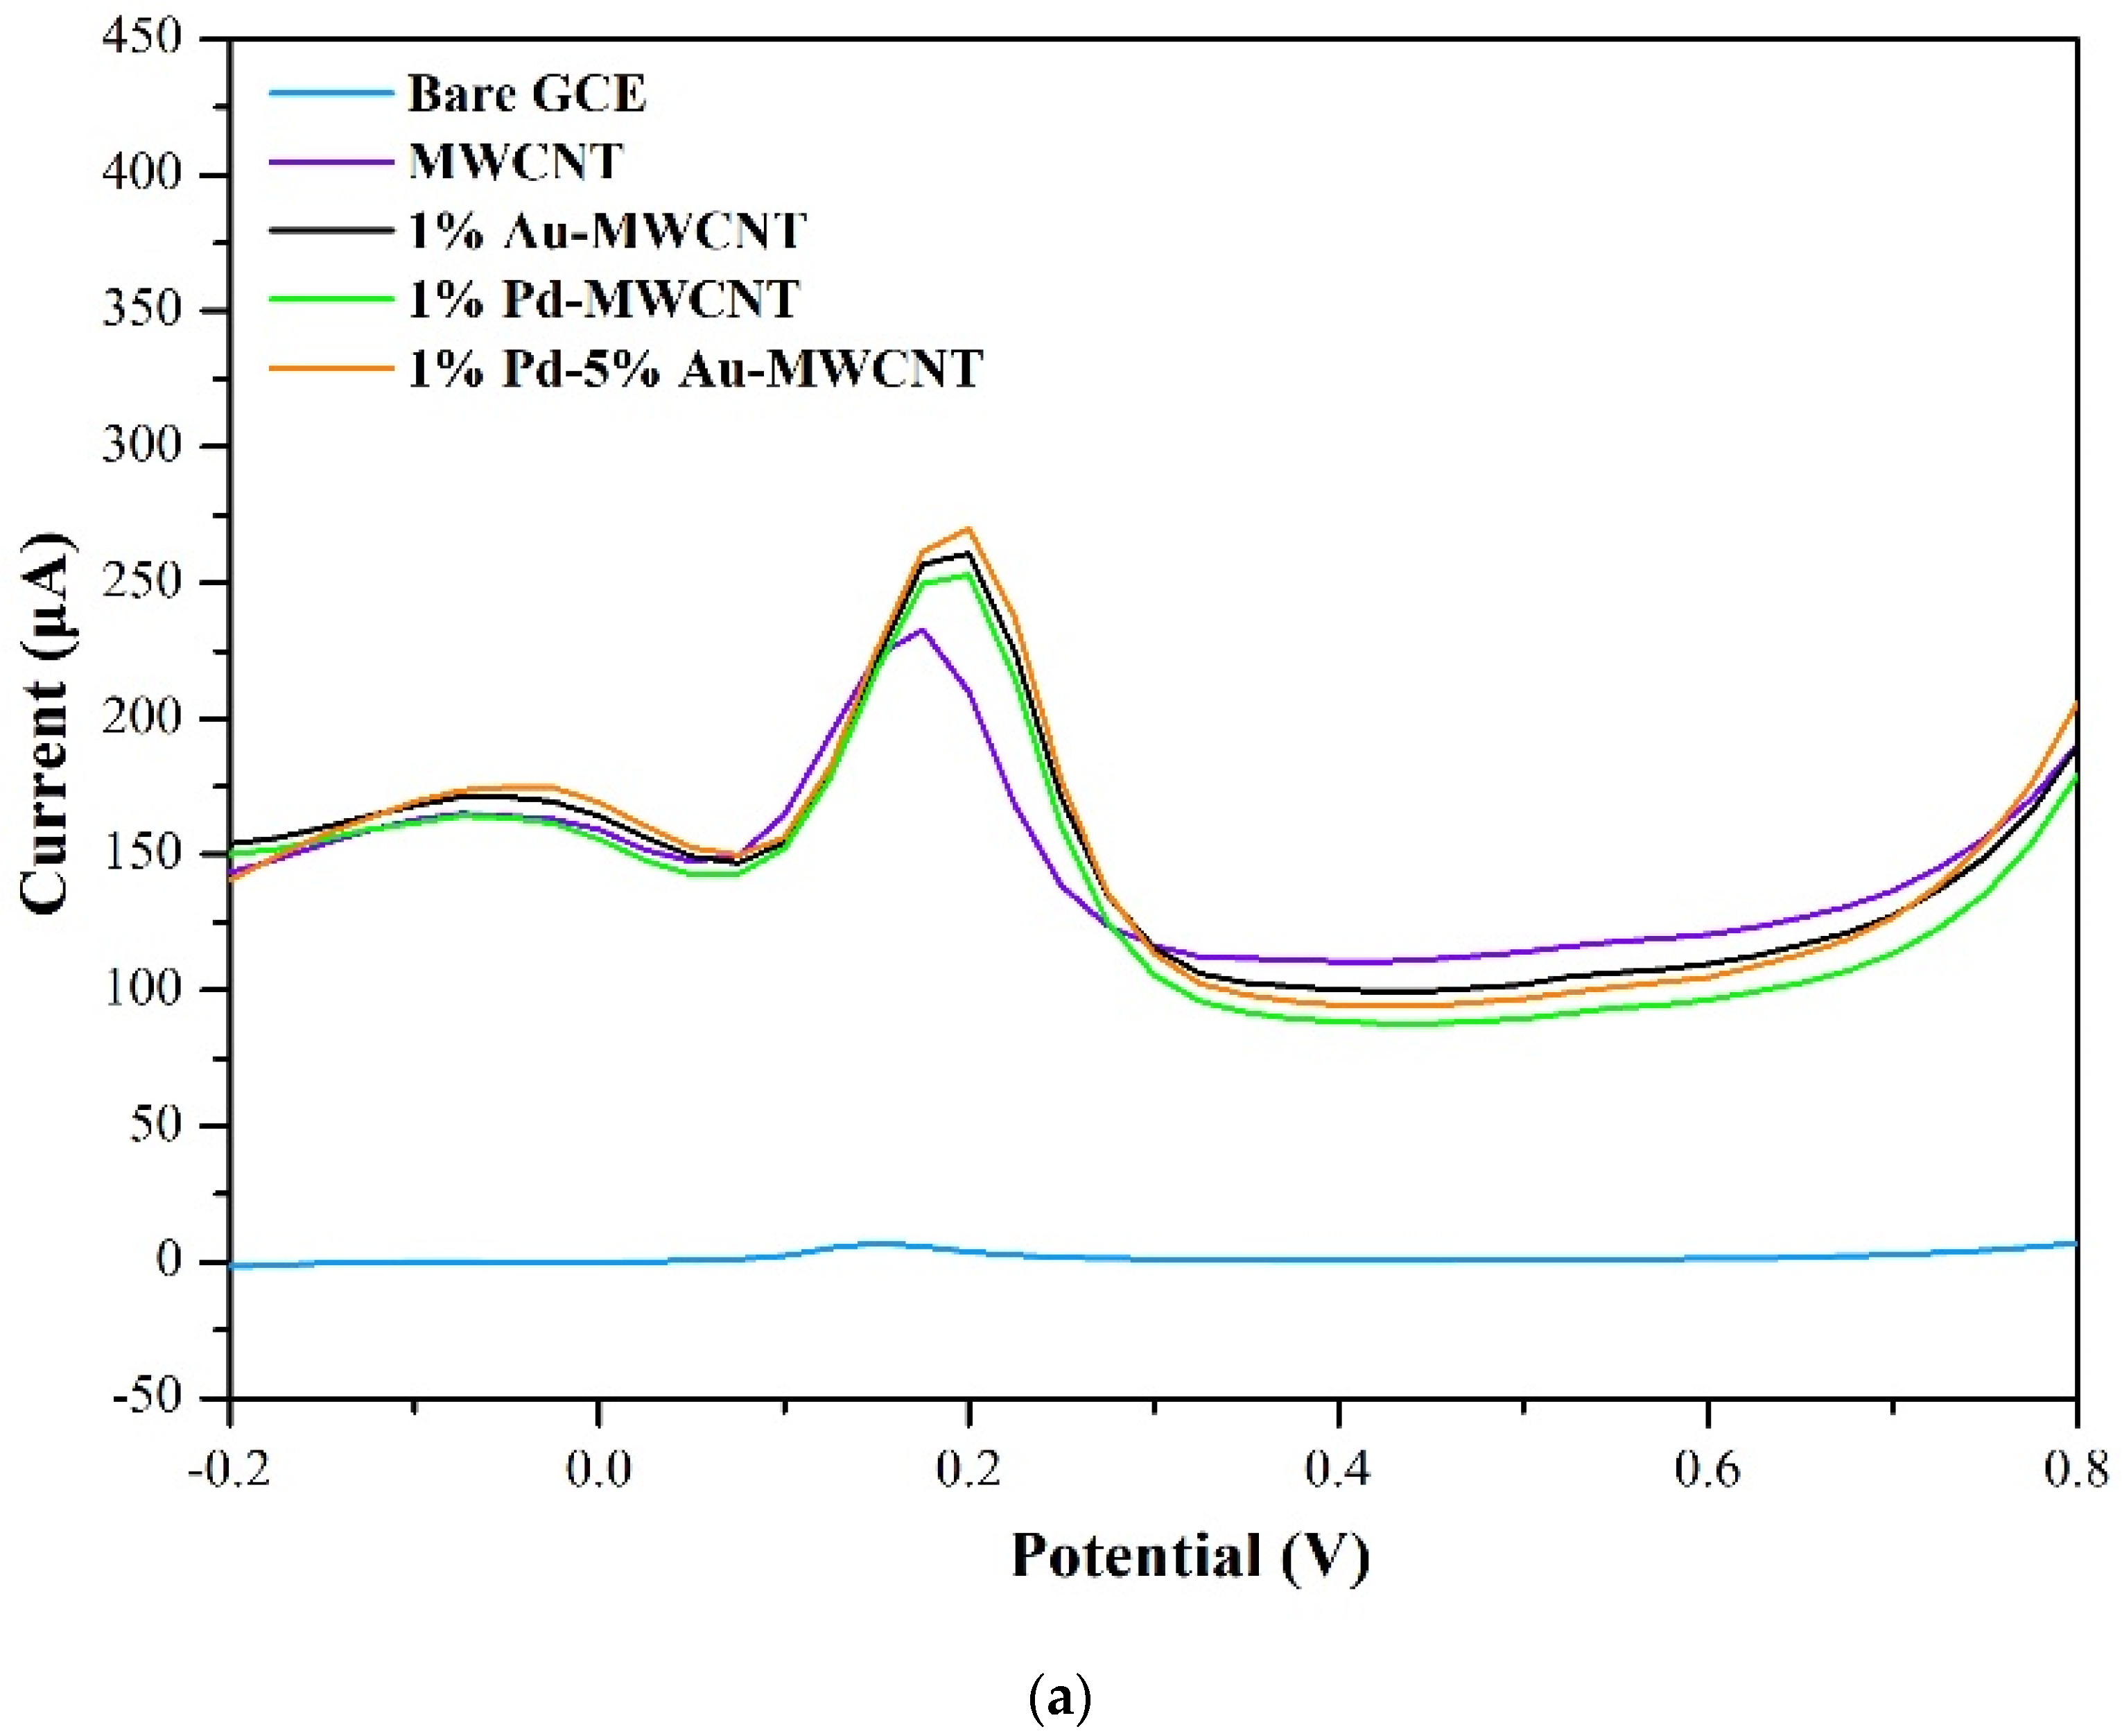
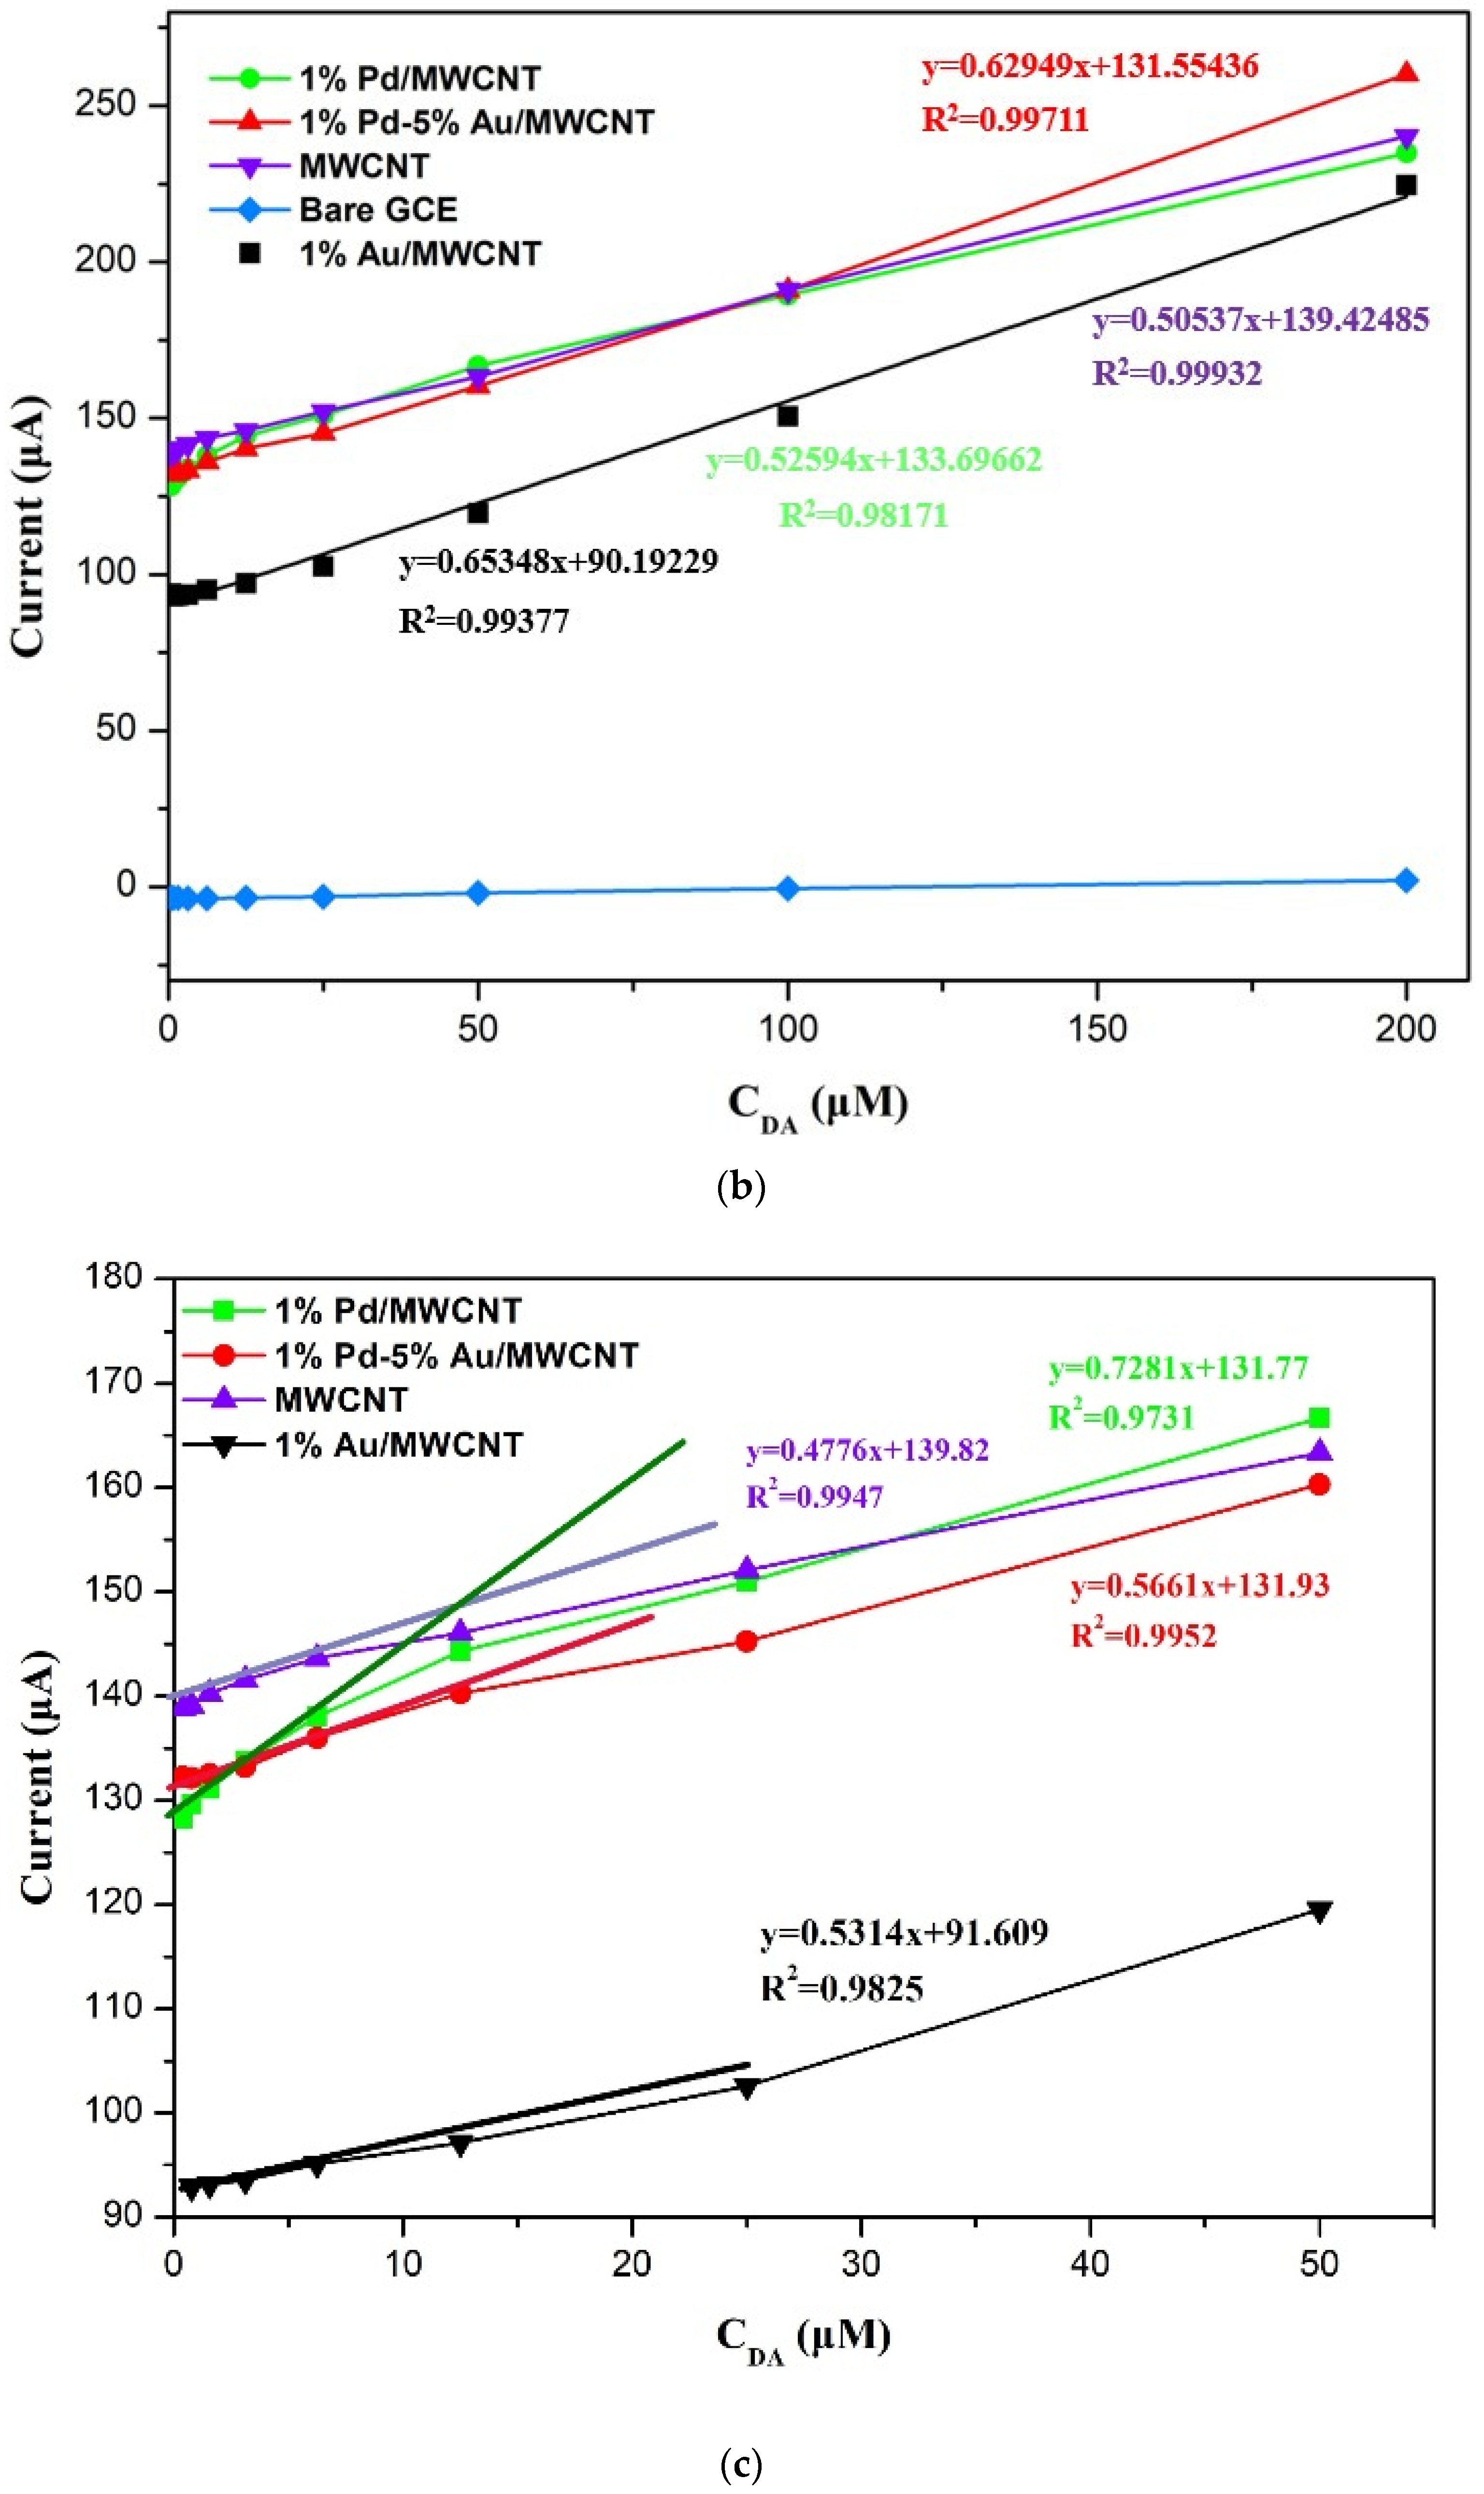
To further investigate the electrochemical performances of various kinds sensing material electrodes, the current of detection DA at about 0.2 V is analyzed in Figure 8a [29,30]. The bare GCE electrode showed very low DPV current signal and near straight line curve. Notably, 1% Pd-5% Au/MWCNT possessed the highest DPV current among various kinds of sensing electrodes in Figure 8a. The calibration curves between the peak current and concentration of dopamine were studied by DPV method. From Figure 8b, it can be found that all the electrodes exhibited peak current change, which is proportional to the increasing concentration of dopamine. It revealed the DPV currents within the detection concentration range of 0.098–200 μM. In Table 1, for the LOD calculation of DA concentration, linear ranges from 0.098 μM to 6.8 μM of 1% Pd/MWCNT and 1% Pd-5% Au/MWCNT are 0.045 μM and 0.058 μM, respectively, Figure 8c. In Table 1, the electrochemical detection of DA of various sensing electrodes is summarized. PtNi bimetallic nanoparticle-loaded MoS2 nanosheets (PtNi@MoS2) are prepared by a co-reduction method for the DPV detection of DA concentration, and the linear detection range is from 0.5–150 μM and the detection limit is obtained as 0.1 μM [31]. The electrochemical sensor of platinum nanochains-multi-walled carbon nanotubes-graphene nanoparticles composite (PtNCs-MWCNTs-GNPs) electrode was used for the determination of dopamine [32]. It shows that the DA concentration range is from 0.5 to 150 μM and the detection limit is 0.5 μM [32]. Pd-Au-P composites were supported on poly(diallyldimethylammonium chloride)-functionalized reduced graphene oxide (Pd-Au-P/PDDA/RGO) for DA detection [33]. Using DPV method, the Pd-AuP/PDDA/RGO sensor has a detection limit of 0.7 μM with linear range of 3.5 to 125 μM [33]. Silver-gold nanoparticles on CNT (Ag-Au/CNT) electrode show high response to dopamine, it is within 1 to 173 μM range under detection limit of 0.052 μM [34]. Pd3Pt1/PDDA-RGO nanomaterials were synthesized for DPV detection with detection limit of 0.04 μM and linear range of 4 to 200 μM [35]. It is fabricated with reduced graphene oxide-supported Au@Pd (Au@Pd-RGO) for DA detection, and DA shows a concentration range from 0.01 to 100 μM with detection limit of 0.024 μM. Notably, it can be obviously concluded from Table 1 that the as-prepared 1% Pd-5% Au/MWCNT exhibited the larger linear range and lowest limit of detection compared with previously published works [31,32,33,34,35,36].
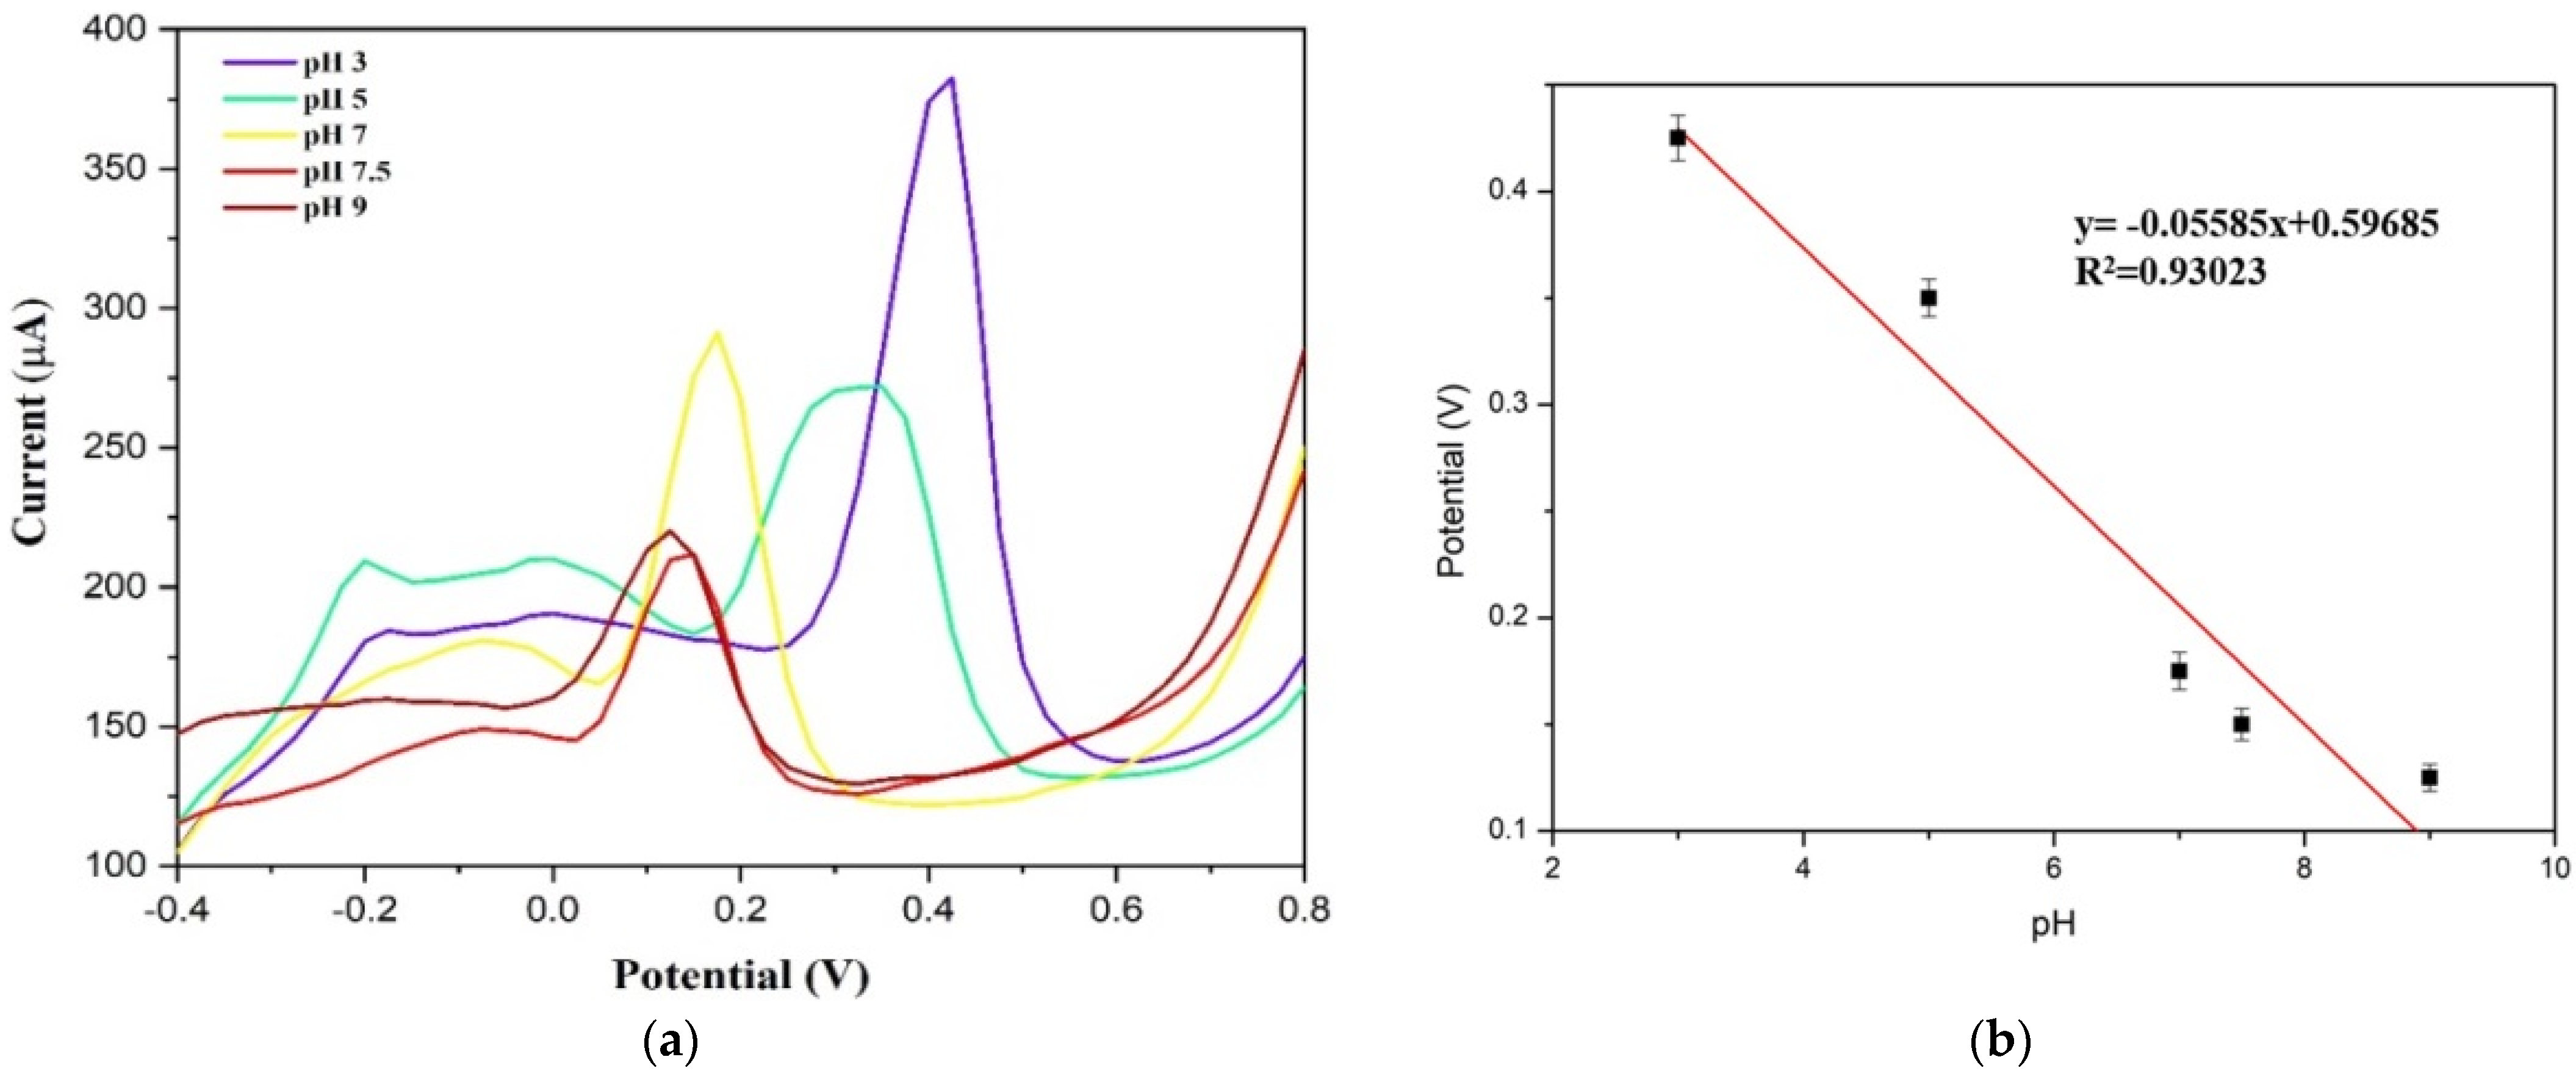
The effect of different pH values on the DPV current response of DA over 1% Pd-5% Au/MWCNT was investigated, as displayed in Figure 9a. It can be found that the anodic peak current of DA increased with the increase in pH value and then decreased after reaching the optimum pH value (7.0). In addition, in Figure 9b, the DPV oxidation peak potentials of DA exhibited a linear relationship with pH values, and the slope (−0.0558 V/pH) of the corresponding linear regression line came near the theoretically expected Nernstian value (−0.059 V/pH), suggesting that the electron transfer reactions are accompanied by an equal number of protons [32].
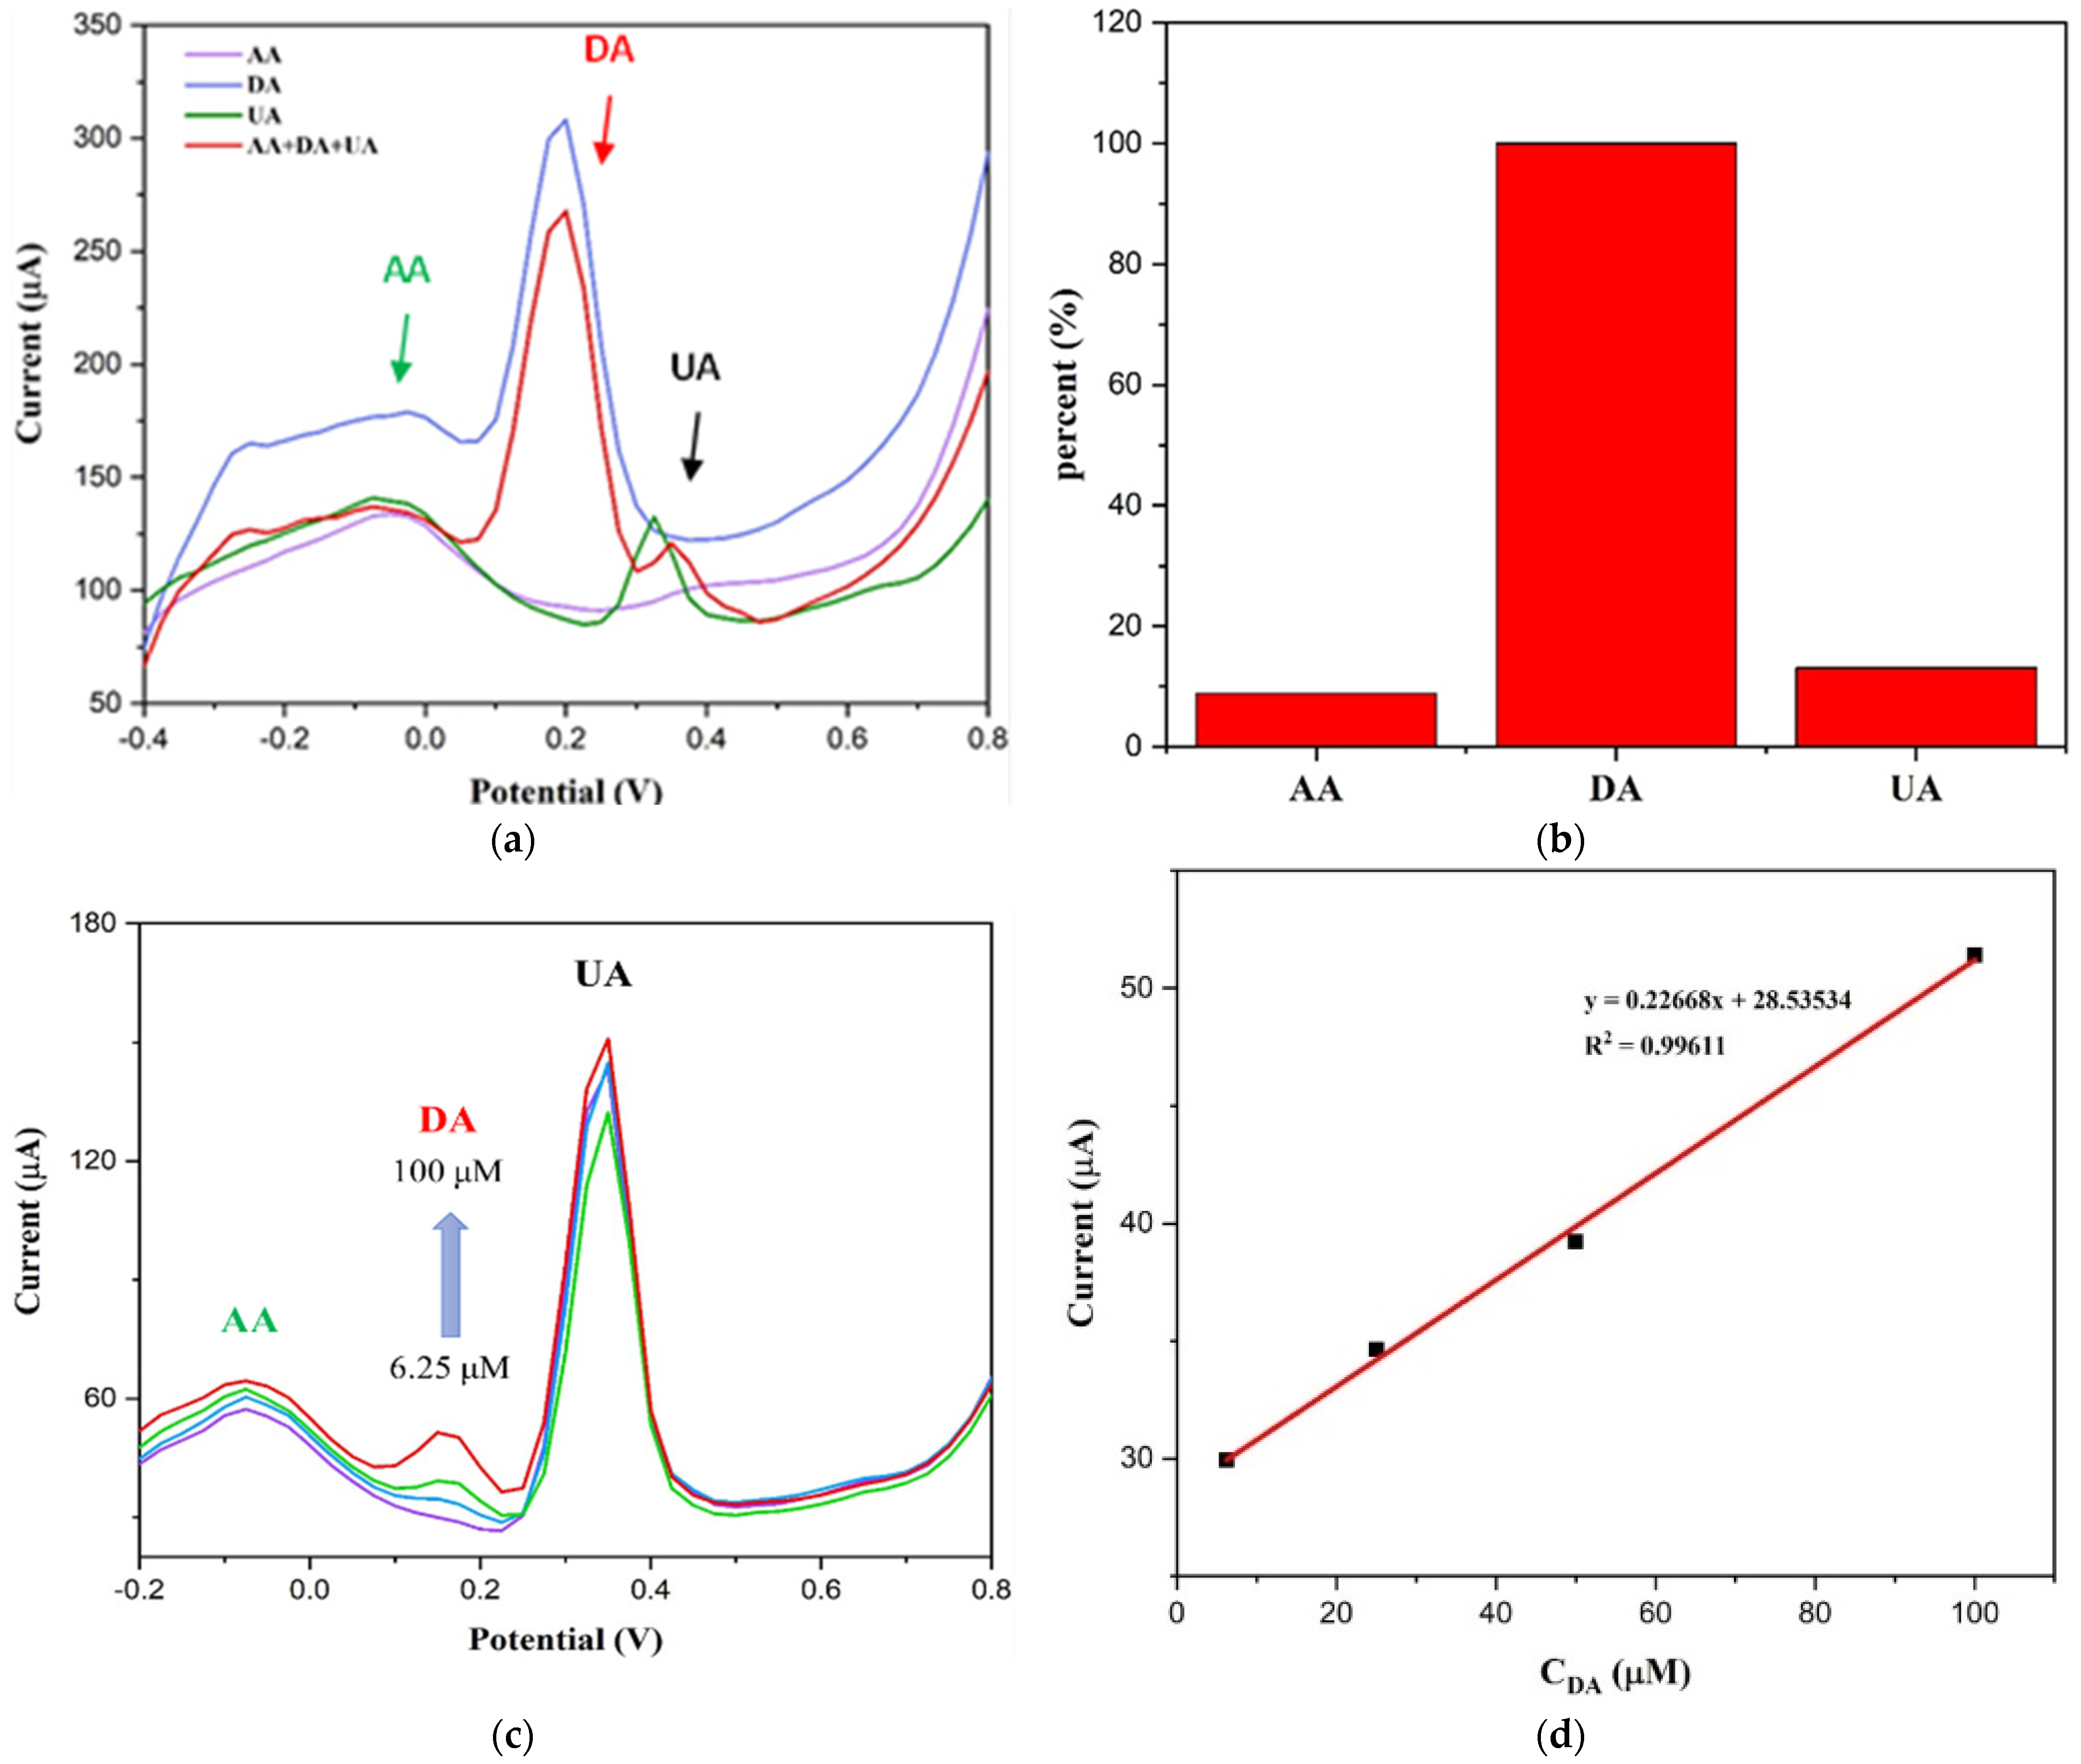
To the best of our knowledge, ascorbic acid (AA), uric acid (UA), and dopamine (DA) usually coexist together in physiological samples, and AA and UA have similar oxidation potential to DA [29]. Thus, it is necessary to evaluate the selectivity of the as-prepared 1% Pd-5% Au/MWCNT for DA in the presence of AA and UA. From Figure 10a, it can be observed that the electrochemical signals exhibited well separated oxidation peak potentials for the simultaneous determination of 200 μM DA, 200 μM AA, and 200 μM UA. In addition, the 1% Pd-5% Au/MWCNT exhibited a remarkably higher response sensitivity toward DA, as shown in Figure 10b. It indicates that 1% Pd-5% Au/MWCNT had good anti-interference ability. The DPV diagrams of different concentrations of DA, under 400 μM AA and 1000 μM UA are presented. Standard addition of the DA concentration from 6.25 μM to 100 μM under 400 μM AA and 1000 μM UA is shown in Figure 10c. Since the concentration of AA and UA in the human body is higher than that of DA (the concentration of AA in body fluids is 100–1000 μM, while the concentration of UA in blood and urine is 100–1000 μM), we want to know whether AA and UA will interfere with the detection of dopamine at high concentrations. In Figure 10c, it is under 400 μM AA and 1000 μM UA and different concentrations of DA showed that with the increase of DA concentration, the peak current also increased significantly, and the peak potentials of AA and UA were at −0.075 V and 0.35 V, respectively. In Figure 10d, it is the plot of DA concentration and DPV peak current. It can be seen that in the case of high concentrations of AA and UA, DA has a good linearity (R2 = 0.99611) in the range from 6.25 to 100 μM. It is promising for real field application.
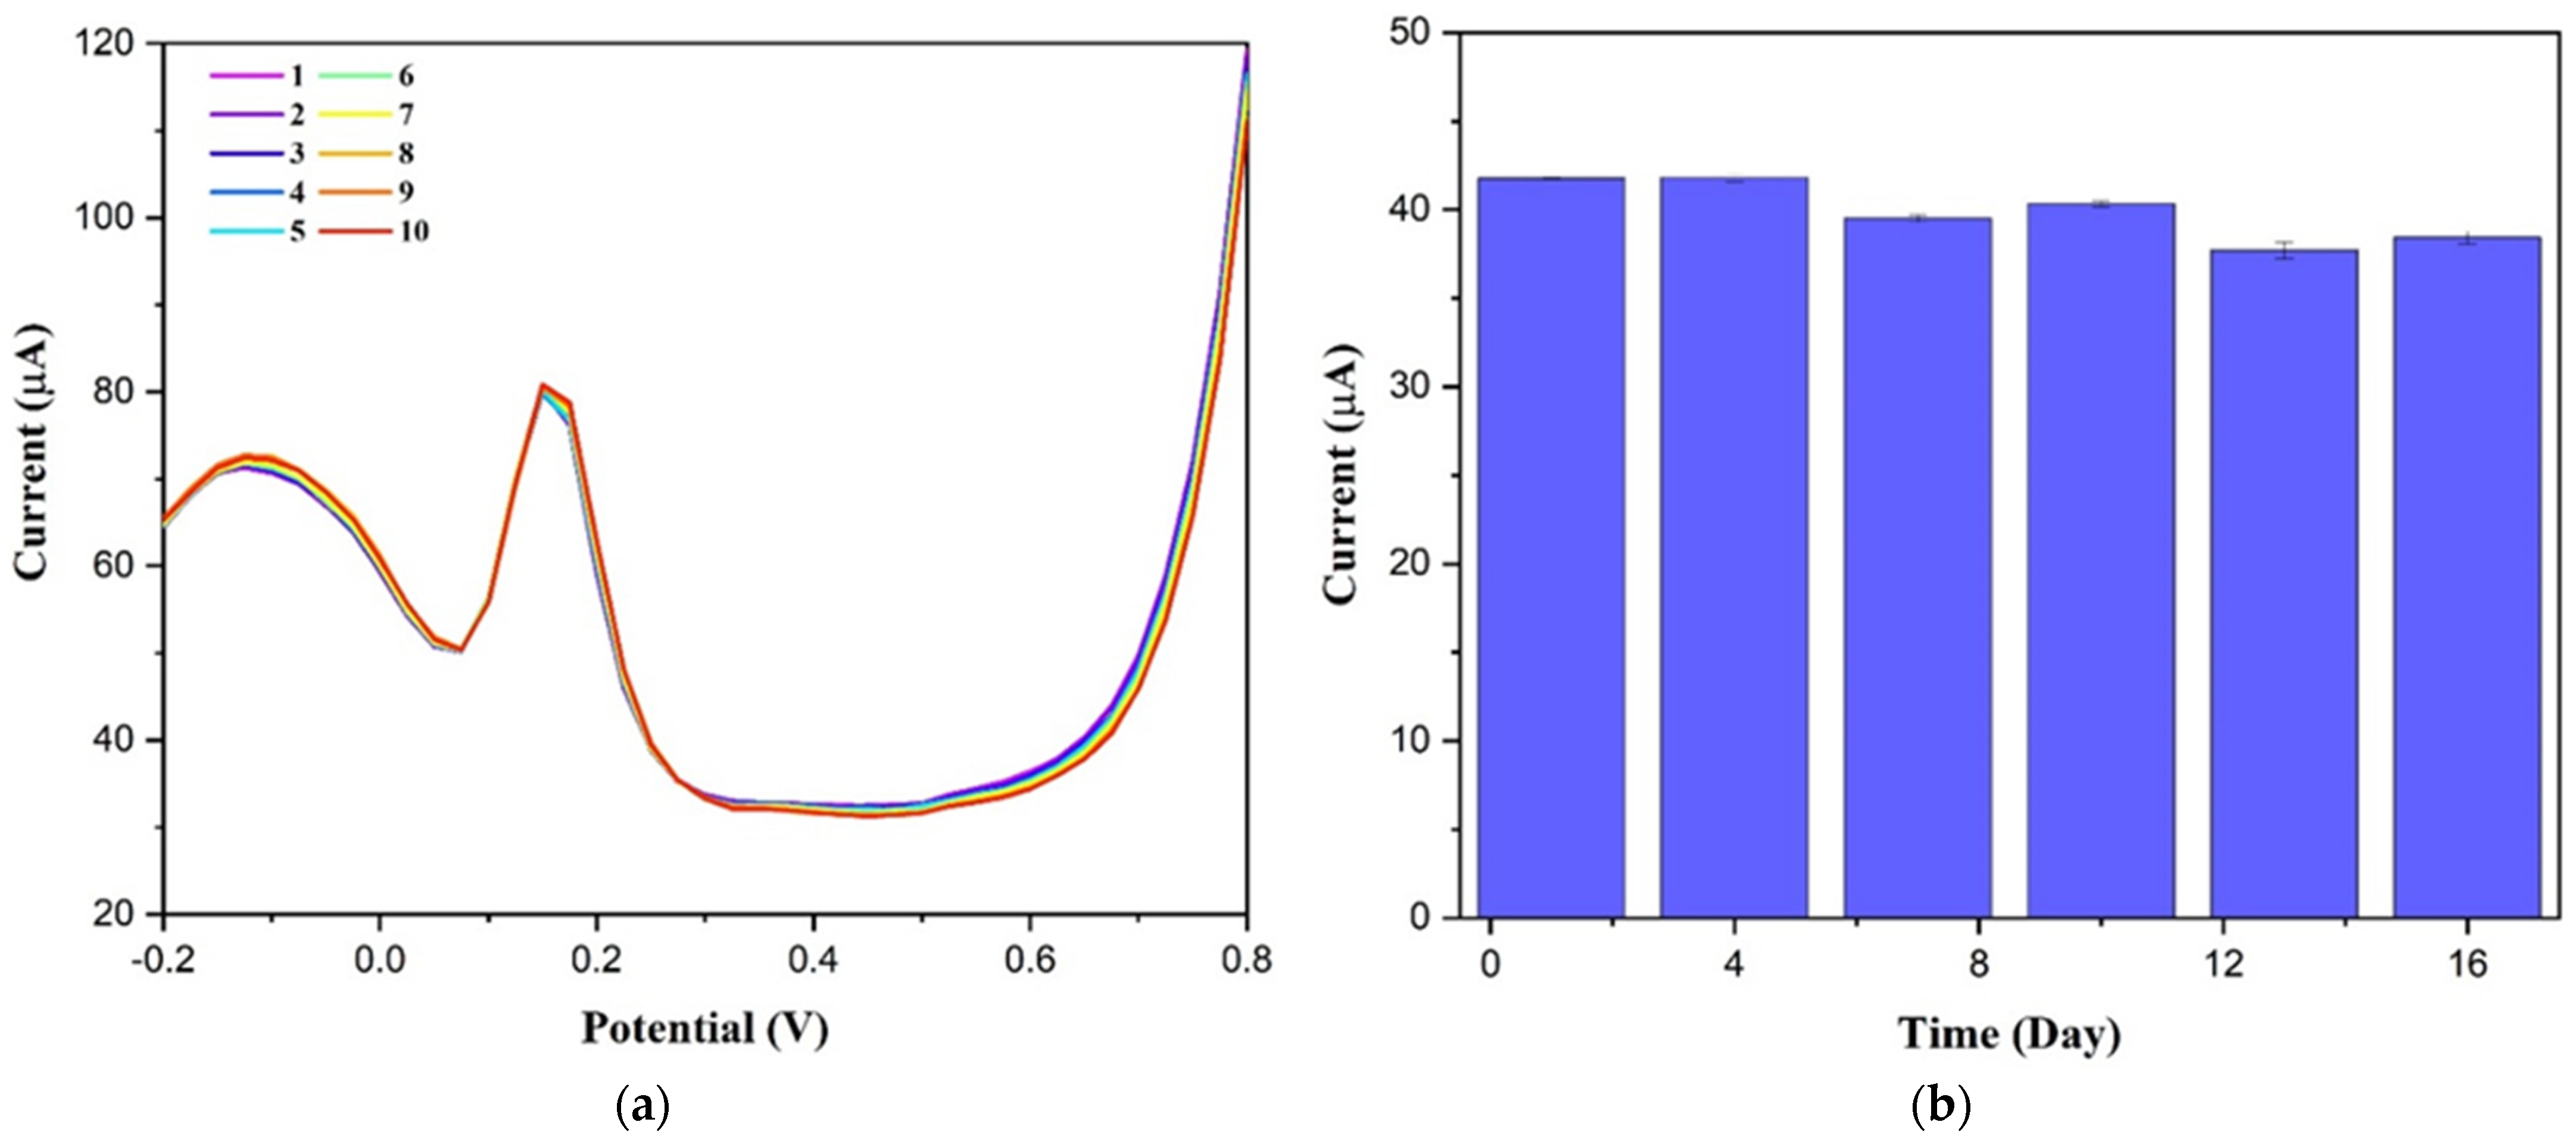
Under optimized experimental conditions, the stability and reproducibility of the 1% Pd-5% Au/MWCNT were evaluated. As illustrated in Figure 11a, it can be found that the 1% Pd-5% Au/MWCNT was measured continually with total ten experiments, and the relative standard deviation (RSD) was 0.41%, revealing satisfactory reproducibility. Furthermore, the peak current value of DA preserved 93% of the original response value after 16 days, suggesting that the 1% Pd-5% Au/MWCNT possessed good long-term stability (Figure 11b).

3.3. Sensing Mechanism

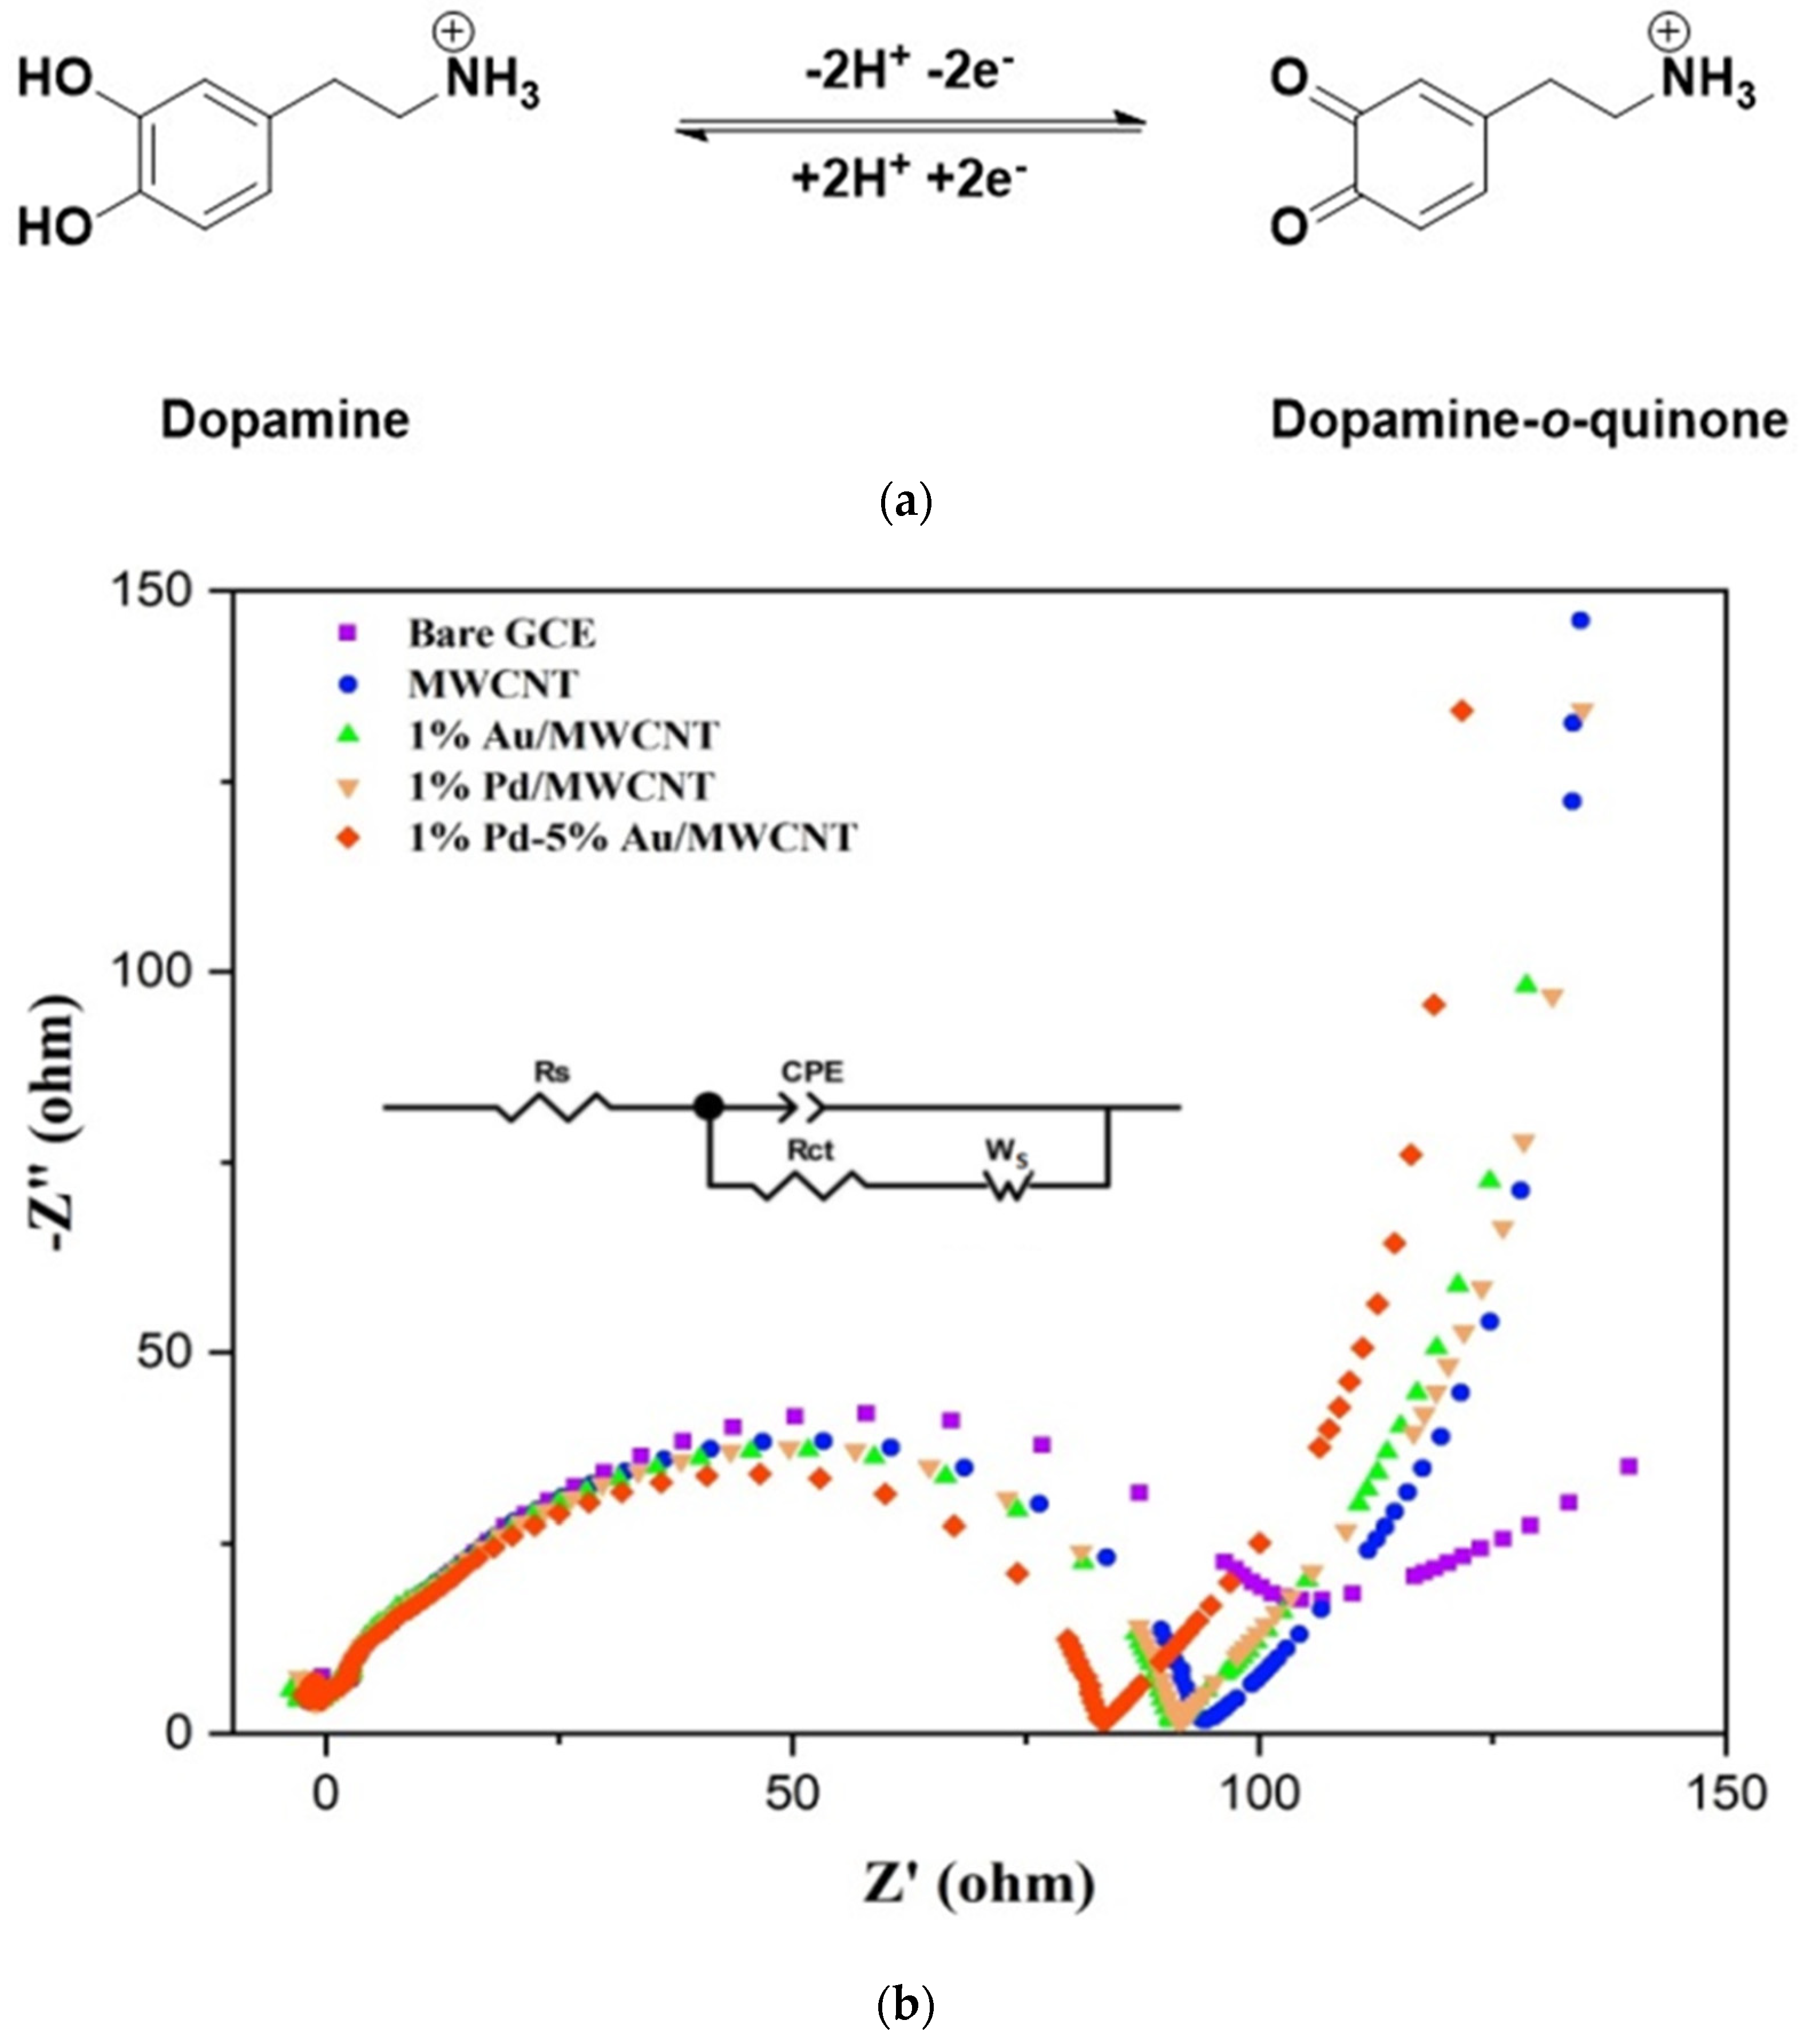
The possible electrochemical sensing mechanism was proposed and discussed, as presented in Figure 12a [30]. In Figure 12a, it revealed the redox reactions of dopamine and dopamine-o-quinone on the photocatalyst [30]. Briefly, the dopamine molecules were adsorbed on the surface of 1% Pd-5% Au/MWCNT to oxidize and release the electrons, which flowed through the electrical circuit and generated the electrochemical signal. In addition, the synergist effect from AuPd nanoparticles and MWCNTs would efficiently increase specific surface areas to capture the dopamine molecules and provide more active sites to accelerate the rate of electron transfer, which enhanced electrochemical response.
To further identify the synergist effect, electrochemical impedance spectroscopy (EIS) was employed to investigate the electrochemical behavior of different electrodes. The diameter of the semicircle in the high frequency region was measured to calculate charge transfer resistance (Rct), then the results of the EIS is show in a Nyquist plot in Figure 12b, and the simulated element value of the equivalence circuits of different sensing electrodes is shown in Table 2 (error of the equivalence circuits < 8%). The equivalent circuit in Figure 12b is divided into ohmic resistance (Rs), charge transfer resistance (Rct), constant phase element (CPE), and Warburg impedance (Ws). Where Rs is the equivalent series resistance, Rct is the charge transfer resistance at the electrode–electrolyte interface, and constant phase element (CPE) means the constant phase-angle element relating to the nonideal characteristic of the double layer, and the Warburg impedance (short) is the representative as Ws [37]. For simulation the electrochemical cell sensing system, we used Warburg element (short) to represent diffusion in Figure 12b. According to the phenomenon of material transport, the mass transfer resistance can be known. From Table 2, it can be seen that the calculated data of each element show that Rs, Rct, and Wz take the bimetallic AuPd/MWCNT as the smallest value, indicating that the resistance of active ions to diffuse to the electrode is small, and the charge transfer between dopamine and the surface is fast by addition of Au and Pd on MWCNT.

4. Conclusions

In this work, a series of AuPd/MWCNTs was successfully synthesized using sonochemistry method and applied to detect dopamine. Energy-dispersive X-ray spectroscopy (EDS), X-ray diffraction (XRD), transmission electron microscope (TEM), field emission-scanning electron microscopy (FE-SEM), as well as X-ray photoelectron spectroscopy (XPS) were employed for characterizing morphology, composition, and structure of AuPd/MWCNT, suggesting that Au and Pd nanoparticles were deposited on the surface of MWCNT. 1% Pd-5% Au/MWCNT showed a wide detection range from 0.98 to 200 μM, and a low detection limit of 0.058 μM for dopamine. It reveals long-term stability (16 days), low operating temperature, and real-time detection of trace-level dopamine, revealing the application of AuPd/MWCNTs as an effective electrode material for dopamine detection.

Author Contributions

Conceptualization, H.-N.L. and R.-J.W.; methodology, R.-J.W.; software, Y.-S.L.; validation, Y.-S.L.; formal analysis, Y.-S.L.; investigation, Y.-S.L. and X.-J.C.; resources, H.-N.L. and R.-J.W.; data curation, Y.-S.L. and M.-H.C.; writing—original draft preparation, Z.Z.; writing—review and editing, H.-N.L. and R.-J.W.; supervision, R.-J.W.; project administration, R.-J.W.; funding acquisition, H.-N.L. and R.-J.W. All authors have read and agreed to the published version of the manuscript.

Funding

This research was funded by the Ministry of Science and Technology (Grant No.: MOST 110-2113-M-126-001), Taiwan.

Institutional Review Board Statement

Not applicable.

Informed Consent Statement

Not applicable.

Data Availability Statement

Not applicable.

Acknowledgments

The authors would like to thank the Ministry of Science and Technology (grant No.: MOST 110-2113-M-126-001), Taiwan, R.O.C., for the financial support that it provided for this study.

Conflicts of Interest

The authors declare no conflict of interest.

References

  1. Coddington, L.T.; Dudman, J.T. Learning from Action: Reconsidering Movement Signaling in Midbrain Dopamine Neuron Activity. Neuron 2019, 104, 63–77. [Google Scholar] [CrossRef]
  2. Schultz, W. Updating dopamine reward signals. Curr. Opin. Neurobiol. 2013, 23, 229–238. [Google Scholar] [CrossRef]
  3. Latif, S.; Jahangeer, M.; Razia, D.M.; Ashiq, M.; Ghaffar, A.; Akram, M.; Allam, A.E.; Bouyahya, A.; Garipova, L.; Shariati, M.A.; et al. Dopamine in Parkinson’s disease. Clin. Chim. Acta. 2021, 522, 114–126. [Google Scholar] [CrossRef]
  4. Kesby, J.P.; Eyles, D.W.; McGrath, J.J.; Scott, J.G. Dopamine, psychosis and schizophrenia: The widening gap between basic and clinical neuroscience. Transl. Psychiat. 2018, 8, 30. [Google Scholar] [CrossRef]
  5. de Benedetto, G.E.; Fico, D.; Pennetta, A.; Malitesta, C.; Nicolardi, G.; Lofrumento, D.D.; Nuccio, F.D.; Pesa, V.L. A rapid and simple method for the determination of 3,4-dihydroxyphenylacetic acid, norepinephrine, dopamine, and serotonin in mouse brain homogenate by HPLC with fluorimetric detection. J. Pharm. Biomed. Anal. 2014, 98, 266–270. [Google Scholar] [CrossRef]
  6. Gao, W.-Y.; Qi, L.-M.; Liu, Z.-Y.; Majeed, S.; Kitte, S.A.; Xu, G.-B. Efficient lucigenin/thiourea dioxide chemiluminescence system and its application for selective and sensitive dopamine detection. Sens. Actuators B Chem. 2017, 238, 468–472. [Google Scholar] [CrossRef]
  7. Zhang, L.; Qv, S.; Wang, Z.; Cheng, J. Determination of dopamine in single rat pheochromocytoma cell by capillary electrophoresis with amperometric detection. J. Chromatogr. B 2003, 792, 381–385. [Google Scholar] [CrossRef]
  8. Mahshid, S.; Li, C.; Mahshid, S.S.; Askari, M.; Dolati, A.; Yang, L.; Luo, S.; Cai, Q. Sensitive determination of dopamine in the presence of uric acid and ascorbic acid using TiO2 nanotubes modified with Pd, Pt and Au nanoparticles. Analyst 2011, 136, 2322–2329. [Google Scholar] [CrossRef]
  9. Lin, Y.; Chen, C.; Wang, C.; Pu, F.; Ren, J.; Qu, X. Silver nanoprobe for sensitive and selective colorimetric detection of dopaminevia robust Ag–catechol interaction. Chem. Commun. 2011, 47, 1181–1183. [Google Scholar] [CrossRef]
  10. Ling, Y.; Wang, L.; Zhang, X.Y.; Wang, X.H.; Zhou, J.; Sun, Z.; Li, N.B.; Luo, H.Q. Ratiometric fluorescence detection of dopamine based on effect of ligand on the emission of Ag nanoclusters and aggregation-induced emission enhancement. Sens. Actuators B Chem. 2020, 310, 127858. [Google Scholar] [CrossRef]
  11. Jiang, Z.; Gao, P.; Yang, L.; Huang, C.; Li, Y. Facile in Situ Synthesis of Silver Nanoparticles on the Surface of Metal-Organic Framework for Ultrasensitive Surface-Enhanced Raman Scattering Detection of Dopamine. Anal. Chem. 2015, 87, 12177–12182. [Google Scholar] [CrossRef] [PubMed]
  12. Iftikhar, I.; El-Nour, K.M.A.; Brajter-Toth, A. Detection of transient dopamine antioxidant radicals using electrochemistry in electrospray ionization mass spectrometry. Electrochim. Acta 2017, 249, 145–154. [Google Scholar] [CrossRef]
  13. Ahmadi, N.; Bagherzadeh, M.; Nemati, A. Comparison between electrochemical and photoelectrochemical detection of dopamine based on titania-ceriagraphene quantum dots nanocomposite. Biosens. Bioelectron. 2020, 151, 111977. [Google Scholar] [CrossRef] [PubMed]
  14. Li, J.; Zhao, J.; Wei, X. A sensitive and selective sensor for dopamine determination based on a molecularly imprinted electropolymer of o-aminophenol. Sens. Actuators B Chem. 2009, 140, 663–669. [Google Scholar] [CrossRef]
  15. Palomar, Q.; Gondran, C.; Lellouche, J.-P.; Cosnier, S.; Holzinger, M. Functionalized tungsten disulfide nanotubes for dopamine and catechol detection in a tyrosinasebased amperometric biosensor design. J. Mater. Chem. B 2020, 8, 3566–3573. [Google Scholar] [CrossRef]
  16. Emadoddin, M.; Mozaffari, S.A.; Ebrahimi, F. An antifouling impedimetric sensor based on zinc oxide embedded polyvinyl alcohol nanoplatelets for wide range dopamine determination in the presence of high concentration ascorbic acid. J. Pharm. Biomed. Anal. 2021, 205, 114278. [Google Scholar] [CrossRef]
  17. Lv, Q.; Chen, L.-S.; Liu, H.-X.; Zou, L.-L. Peony-like 3D-MoS2/graphene nanostructures with enhanced mimic peroxidase performance for colorimetric determination of dopamine. Talanta 2022, 247, 123553. [Google Scholar] [CrossRef]
  18. Ghanbari, K.; Hajheidari, N. ZnO–CuxO/polypyrrole nanocomposite modified electrode for simultaneous determination of ascorbic acid, dopamine, and uric acid. Anal. Biochem. 2015, 473, 53–62. [Google Scholar] [CrossRef]
  19. Lin, J.; Huang, B.; Dai, Y.-F.; Wei, J.; Chen, Y.-W. Chiral ZnO nanoparticles for detection of dopamine. Mater. Sci. Eng. C 2018, 93, 739–745. [Google Scholar] [CrossRef]
  20. Liu, Y.; Liu, J.; Liu, J.; Gan, W.; Ye, B.-C.; Li, Y.-C. Highly sensitive and selective voltammetric determination of dopamine using a gold electrode modified with a molecularly imprinted polymeric film immobilized on flaked hollow nickel nanospheres. Microchim. Acta 2017, 184, 1285–1294. [Google Scholar] [CrossRef]
  21. Atchudan, R.; Pandurangan, A.; Joo, J. Effects of Nanofillers on the Thermo-Mechanical Properties and Chemical Resistivity of Epoxy Nanocomposites. J. Nanosci. Nanotechnol. 2015, 15, 4255–4267. [Google Scholar] [CrossRef] [PubMed]
  22. Tülbez, S.; Esen, Z.; Dericioglu, A.F. Effect of CNT impregnation on the mechanical and thermal properties of C/C-SiC composites. Adv. Compos. Hybrid Mater. 2020, 3, 177–186. [Google Scholar] [CrossRef]
  23. Pham, T.T.H.; Dien, N.D.; Vu, X.H. Facile synthesis of silver/gold alloy nanoparticles for ultra-sensitive rhodamine B detection. RSC Adv. 2021, 11, 21475–21488. [Google Scholar] [CrossRef]
  24. Yang, M.; Wang, Z.; Wang, W.; Liu, C.-J. Synthesis of AuPd alloyed nanoparticles via room-temperature electron reduction with argon glow discharge as electron source. Nanoscale Res. Lett. 2014, 9, 405. [Google Scholar] [CrossRef] [PubMed]
  25. Mo, F.; Xie, J.; Wu, T.; Liu, M.; Zhang, Y.; Yao, S. A sensitive electrochemical sensor for bisphenol A on the basis of the AuPd incorporated carboxylic multi-walled carbon nanotubes. Food Chem. 2019, 292, 253–259. [Google Scholar] [CrossRef] [PubMed]
  26. Pakdee, U.; Chiangga, S.; Suwannatus, S.; Limsuwan, P. Growth of MWCNTs on Flexible Stainless Steels without Additional Catalysts. J. Nanomater. 2017, 2017, 5672728. [Google Scholar] [CrossRef]
  27. Zhang, H.-J.; Jia, Q.-C.; Kong, L.-B. Molybdenum dioxide supported carbon nanotubes@carbon constructs disordered nanocluster particles as anodes for lithium-ion capacitors with long-term cycling stability. J. Mater. Sci. Mater. Electron. 2021, 32, 18912–18930. [Google Scholar] [CrossRef]
  28. Meškinis, Š.; Vasiliauskas, A.; Andrulevičius, M.; Peckus, D.; Tamulevičius, S.; Viskontas, K. Diamond Like Carbon Films Containing Si: Structure and Nonlinear Optical Properties. Materials 2020, 13, 1003. [Google Scholar] [CrossRef]
  29. Xie, Y.-L.; Yuan, J.; Ye, H.-L.; Song, P.; Hu, S.-Q. Facile ultrasonic synthesis of graphene/SnO2 nanocomposite and its application to the simultaneous electrochemical determination of dopamine, ascorbic acid, and uric acid. J. Electroanal. Chem. 2015, 749, 26–30. [Google Scholar] [CrossRef]
  30. Yang, Y.; Li, M.; Zhu, Z. A novel electrochemical sensor based on carbon nanotubes array for selective detection of dopamine or uric acid. Talanta 2019, 201, 295–300. [Google Scholar] [CrossRef]
  31. Ma, L.; Zhang, Q.; Wu, C.; Zhang, Y.; Zeng, L. PtNi bimetallic nanoparticles loaded MoS2 nanosheets: Preparation and electrochemical sensing application for the detection of dopamine and uric acid. Anal. Chim. Acta 2019, 1055, 17–25. [Google Scholar] [CrossRef] [PubMed]
  32. Huang, Z.-N.; Zou, J.; Teng, J.; Liu, Q. A novel electrochemical sensor based on self-assembled platinum nanochains-Multi-walled carbon nanotubes-graphene nanoparticles composite for simultaneous determination of dopamine and ascorbic acid. Ecotoxicol. Environ. Saf. 2019, 172, 167–175. [Google Scholar] [CrossRef] [PubMed]
  33. Zhang, M.; Fu, D. An Electrochemical Sensor for Dopamine Detection Based on Ternary Pd-Au-P Composites Supported on PDDA/RGO. Int. J. Electrochem. Sci. 2019, 14, 9909–9920. [Google Scholar] [CrossRef]
  34. Arvinte, A.; Crudu, I.-A.; Doroftei, F.; Timpu, D.; Pinteala, M. Electrochemical codeposition of silver-gold nanoparticles on CNT-based electrode and their performance in electrocatalysis of dopamine. J. Electroanal. Chem. 2018, 829, 184–193. [Google Scholar] [CrossRef]
  35. Yan, J.; Liu, S.; Zhang, Z.; He, G.; Zhou, P.; Liang, H.; Tian, L.; Zhou, X.; Jiang, H. Simultaneous electrochemical detection of ascorbic acid, dopamine and uric acid based on graphene anchored with Pd-Pt nanoparticles. Colloids Surf. B 2013, 111, 392–397. [Google Scholar] [CrossRef]
  36. Jiang, J.; Du, X. Sensitive electrochemical sensors for simultaneous determination of ascorbic acid, dopamine, and uric acid based on Au@Pd-reduced graphene oxide nanocomposites. Nanoscale 2014, 6, 11303–11309. [Google Scholar] [CrossRef]
  37. Wei, X.; Yang, P.; Li, H.; Wang, S.; Xing, Y.; Liu, X.; Zhang, S. Synthesis and properties of mesoporous Zn-doped Li1.2Mn0.54Co0.13Ni0.13O2 as cathode materials by a MOFs-assisted solvothermal method. RSC Adv. 2017, 7, 35055. [Google Scholar] [CrossRef] [Green Version]
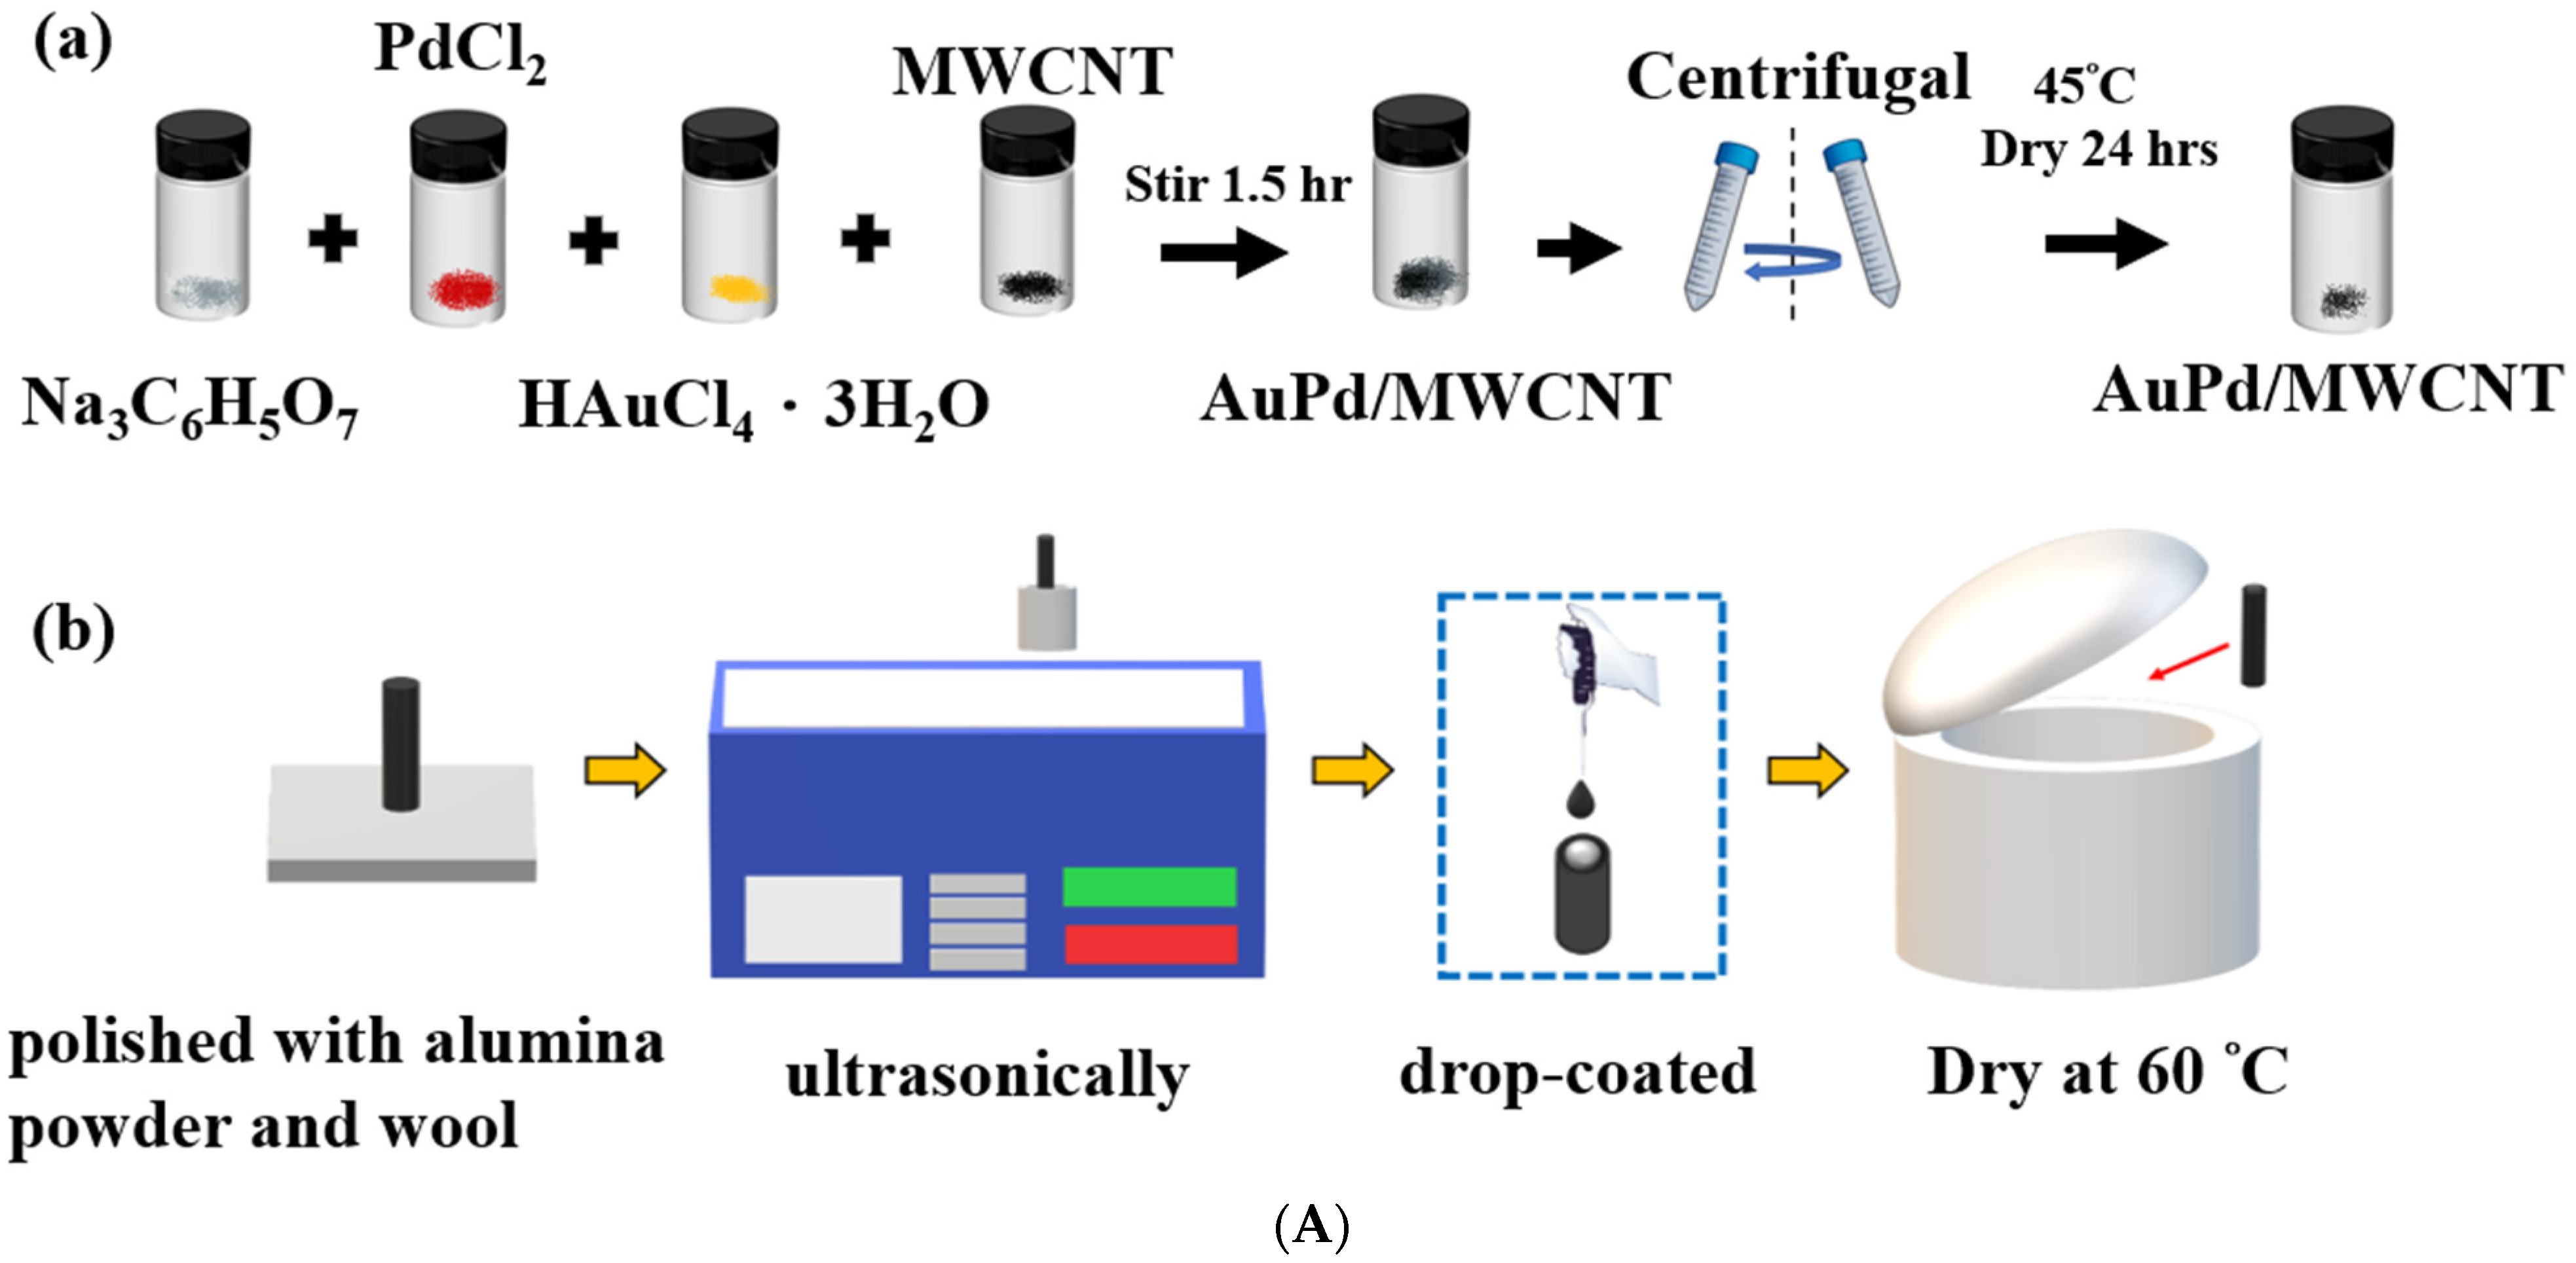
Figure 1. (A) (a) Synthesis of the sensing materials and (b) preparation of the sensing electrode for the detecting system. (B) The electrochemical dopamine detection system.
Minerals 12 01145 g001aMinerals 12 01145 g001b
Figure 2. XRD patterns of the various kinds of sensing materials samples.
Minerals 12 01145 g002
Figure 3. SEM images of (a) MWCNT, (b) 1% Au/MWCNT, (c) 1% Pd/MWCNT, (d) 1% Pd-5% Au/MWCNT.
Minerals 12 01145 g003
Figure 4. TEM images of as-synthesized sensing material samples; (a,b) low to high resolution TEM images of MWCNT, (c,d) low to high resolution TEM images of 1% Au/MWCNT, (e,f) low to high resolution TEM images of 1% Pd/MWCNT, (f) 1% Pd/MWCNT, (g) 1% Pd-5% Au/MWCNT.
Minerals 12 01145 g004aMinerals 12 01145 g004b
Figure 5. (a) Elemental analysis of 1% Pd-5% Au/MWCNT using EDS; (b) element mapping patterns of 1% Pd-5% Au/MWCNT.
Minerals 12 01145 g005aMinerals 12 01145 g005b
Figure 6. XPS spectra of the sensing material 1% Pd-5% Au/MWCNT; (a) survey spectrum, (b) C 1s, (c) O 1s, (d) Au 4f, (e) Pd 3d, (f) Mo 3d, (g) Si 2p.
Minerals 12 01145 g006aMinerals 12 01145 g006b
Figure 7. (a) CV curves of the various kinds of sensing material samples. (b) Oxidation-reduction reaction mechanisms of DA and relative compounds.
Minerals 12 01145 g007
Figure 8. (a) DPV curves of different electrodes in 200 μM dopamine solution. (b) The calibration curve between the peak current intensity and dopamine concentration of various kinds of electrodes. (c) The DPV current versus DA concentration from 0.098 μM to 6.8 μM.
Minerals 12 01145 g008aMinerals 12 01145 g008b
Figure 9. (a) DPV curve for various pH values. (b) Plot of the oxidation peak potentials versus the pH values.
Minerals 12 01145 g009
Figure 10. (a) DPV curves for selective detection. (b) Interfering effect of ascorbic acid and uric acid. (c) Standard addition of the DA concentration from 6.25 μM to 100 μM under 400 μM AA and 1000 μM UA. (d) The calibration curve of DPV peak current versus various 6.25 μM to 100 μM DA concentration and under 400 μM AA and 1000 μM UA.
Minerals 12 01145 g010
Figure 11. (a) Peak currents of DPVs with total ten experiments. (b) Recycling stability tests over as-obtained 1% Pd-5% Au/MWCNT at room temperature.
Minerals 12 01145 g011
Figure 12. (a) Proposed electrochemical sensing mechanism for the as-prepared 1% Pd-5% Au/MWCNT; (b) electrochemical impedance spectroscopy (EIS) of the electrochemical behavior of different electrodes.
Minerals 12 01145 g012
Table 1. Comparison of different electrodes for the determination of dopamine (DA).
ElectrodeLinear Range (μM)LOD (μM)References
PtNi@MOS20.5–1500.1[31]
PtNCs-MWCNTs-GNPs2–500.5[32]
Pd-Au-P/PDDA/rGO3.5–1250.7[33]
Ag-Au/CNT1–1730.052[34]
Pd3Pt1/PDDA-RGO4–2000.04[35]
Au@Pd-RGO0.01–1000.024[36]
1% Pd/MWCNT0.098–6.80.045This work
1% Pd-5%Au/MWCNT0.098–6.80.058This work
Table 2. The simulated the elements value of the equivalence circuits of different sensing electrodes.
ElectrodeRs (Ω)Rct (Ω)CPE Ws (Ω)
Bare GCE20.78106.728.24 × 101269.94
MWCNT85.7494.264.00 × 10−2047.88
1% Au/MWCNT33.0590.981.20 × 10−358.67
1% Pd/MWCNT31.1391.428.70 × 10−4102.3
1% Pd-5% Au/MWCNT18.8283.215.54 × 10−441.36
Publisher’s Note: MDPI stays neutral with regard to jurisdictional claims in published maps and institutional affiliations.