Article

Optimization of Operating Parameters for Coal Low-Temperature Ashing: A Suitable and Efficient Treatment Method for Mineral Analysis in Coal

1
School of Resources and Geosciences, China University of Mining and Technology, Xuzhou 221008, China
2
Key Laboratory of Coalbed Methane Resources and Reservoir Formation Process, Ministry of Education, China University of Mining and Technology, Xuzhou 221008, China
*
Author to whom correspondence should be addressed.
Minerals 2022, 12(9), 1119; https://doi.org/10.3390/min12091119
Submission received: 25 July 2022 / Revised: 30 August 2022 / Accepted: 30 August 2022 / Published: 2 September 2022
(This article belongs to the Special Issue Coal: Chemical, Geochemical and Petrographical Aspects)

Abstract

:
Low-temperature oxygen-plasma ashing plus X-ray diffraction analysis is one of the effective techniques to identify minerals in coal. However, previous publications have not provided any details of the exact low-temperature degrees and corresponding working conditions of ashers, and this could lead to two adverse effects without proper operating guidance: (1) a relatively high temperature (e.g., >150 °C) may cause alteration of minerals (particularly clay minerals), and (2) a relatively low temperature (e.g., <80 °C) may cause a long ashing time and incomplete ashing of organic matter. In this study, the authors introduced the most frequently used low-temperature plasma ashers (PVA TePla IoN 40 made in America and Quorum K1050X made in Britain) to reveal optional operating parameters for low-temperature ashing. The ashing effects were analyzed from the aspects of ash mass, X-ray diffraction patterns, and the qualitative and quantitative analysis of minerals. Considering all the factors above, it is concluded that the ashing is the best when the running power is 200 W for the IoN 40, at which the diffraction peaks of chlorite d(004) and kaolinite d(002) can be clearly distinguished by LTAs-XRD analysis. In addition, different low temperatures have certain influence on the crystal structure of minerals. When the power rises to above 300 W (about 150 °C), the crystal structure of minerals undergoes changes. The symmetry and integrity of the mineral peaks became worse, and destructive interference occurred between the spacing of reflection planes, resulting in significant decrease in diffraction peak intensity; thus, some trace minerals were unable to be identified. The study on the working parameters of the instrument would be helpful to ash coals more effectively and make qualitative and quantitative analysis of minerals more accurate.

1. Introduction

Coal is a complex geological material transformed from plant residue through a series of complex biochemical, physical chemical and geochemical processes [1,2,3,4], and it is mainly composed of organic components (macerals) and mineral matter. The terms mineral matter and mineral in coal are prone to be used interchangeably, without discretion in some cases. The mineral matter in coal generally contains all inorganic components, including discrete crystalline minerals (minerals in the traditional sense), non-crystalline mineraloids, inorganic elements combined with organic matter (mainly Ca, Fe, Mg, Al and Na) and elements dissolved in coal pore water [4,5,6,7,8].
Minerals play a most significant role in the assessment of coal resources utilization. On the one hand, they directly reduce the economic value of coal by diluting the energy; on the other hand, these minerals being the main components of fly ash particles, residual bottom ash and slag generated by coal combustion will contribute to the slagging, agglomeration, corrosion and erosion of the boiler [9]. In addition, the minerals in coal have an impact on human health and the environment in the process of coal mining operations and utilization activities. For example, inhalation of high-content nano-quartz released by burning coal indoor in Xuan Wei County, Yunnan Province, China, is the main cause of the high local rate of lung cancer in women [10,11,12]. In addition, fine-grained quartz and pyrite inhaled by coal miners are also important contributors to Coal Workers Pneumoconiosis (Black Lung Disease) [3,13]. Some sulfides are major hosts of toxic elements (such as As and Hg), which have adverse effects on human health (arsenonsis) and the environment [4,14,15]. Although minerals reduce the economic value of coal and release harmful substances, some critical elements are closely related to minerals in some way (e.g., rare earth elements and Y and Ga are mostly associated with clays, phosphate and carbonate minerals), which have attracted much attention from researchers [3,8,16,17,18,19,20,21]. In addition, coal ash is attracting increasing attention as a potential source of critical elements. For instance, the fly ash derived from Inner Mongolia Haerwusu coal deposits with an Al2O3 concentration up to 51 wt% has been used as a source for Al extraction [22].
From the genetic point of view, the mineral matter in coal, like the organic matter, is a product of various geological processes associated with peat accumulation and rank advance, as well as changes in subsurface fluids and other aspects of sediment diagenesis [5,6,23,24]. Minerals can provide information for the genesis of coal and geological background of coal-accumulating basins and can also help to clarify coalification and explain basic theoretical issues, such as regional geological historical evolution [3,6,21,25,26,27,28,29].
At present, at least 200 minerals have been observed in coal [3,4]. The contents of minerals are generally between a few percent and dozens of percent. The modes of occurrence and origins of most of these minerals have been comprehensively reviewed by Ward [5,6].
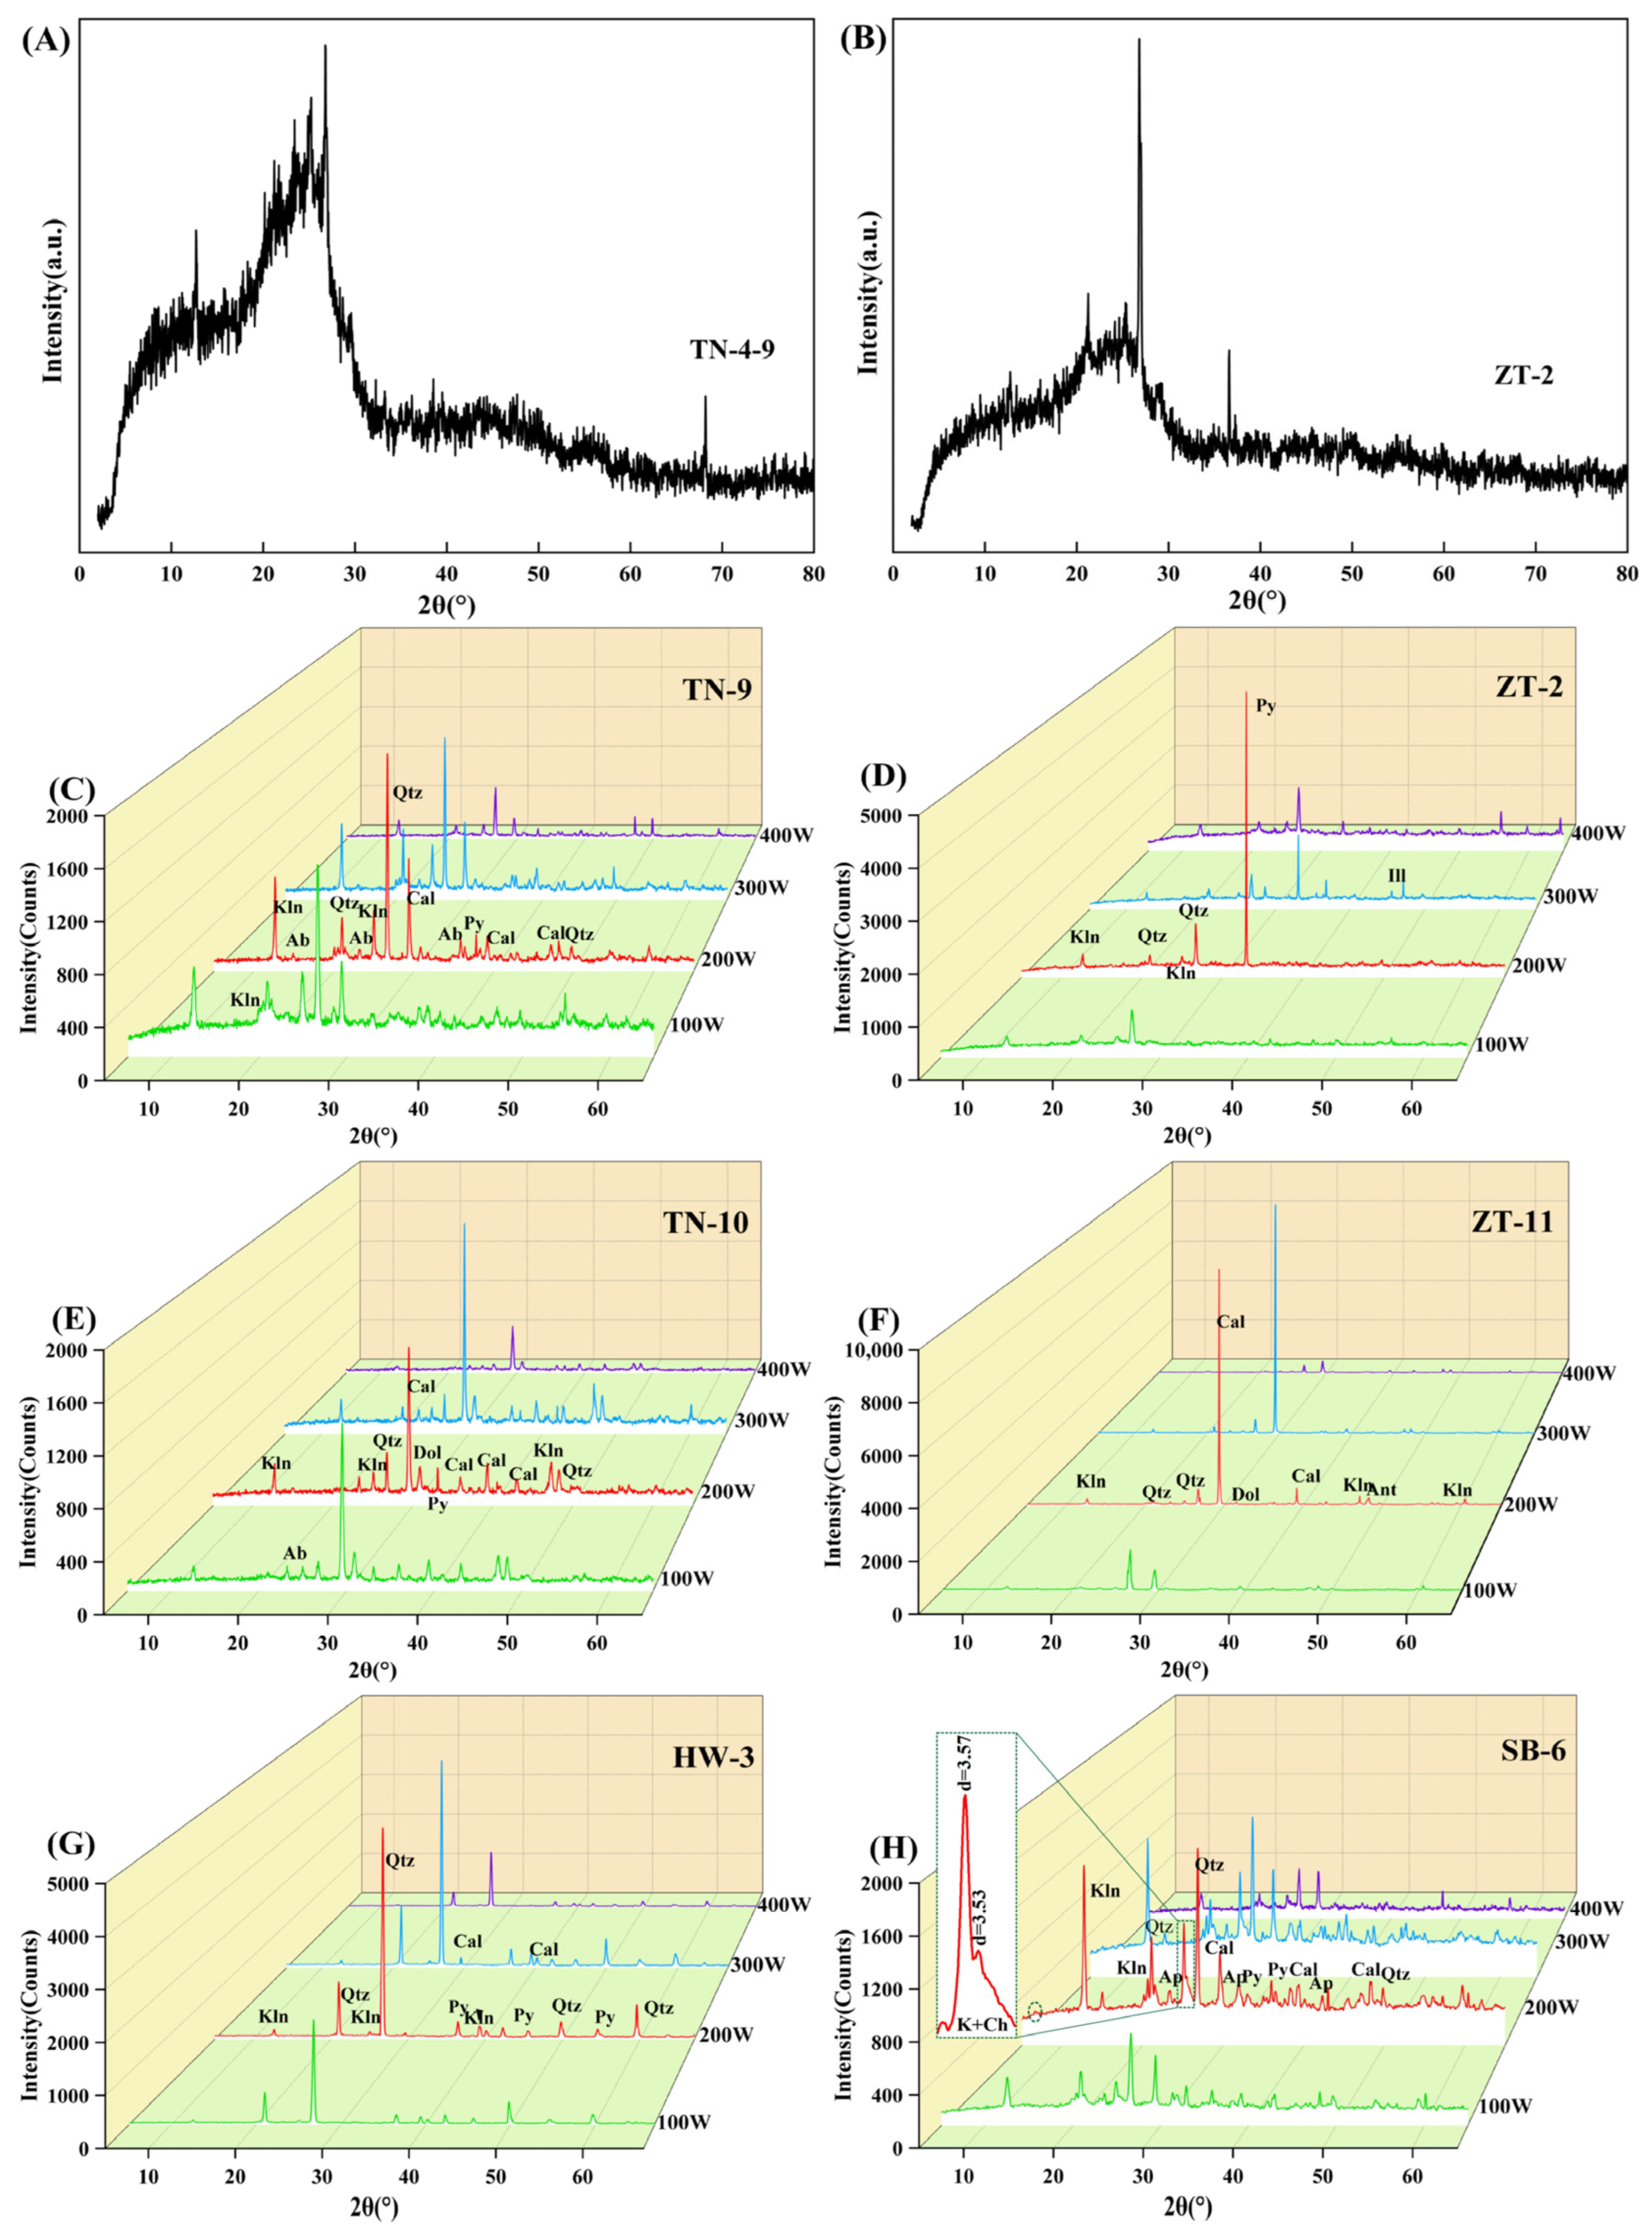
Despite the fact that XRD analyses of raw coals of varied ranks have been used by many researchers [30,31,32], the presence of a “hump” due to the high content of organic matter makes accurate quantification of mineralogical compositions of coals difficult, particularly in low-rank coals. During the high-temperature (815 °C) ashing process, the phases of minerals would be transformed: for example, kaolinite may release structural water, and carbonate minerals would release CO2 by mineral decomposition [33]. Several researchers chose to reduce the temperature for heating coal for a protracted period at around 370 °C to destroy the organic matter. This is still a sufficiently high temperature for many minerals in coal, such as pyrite, siderite, gypsum and some clay minerals, as they may undergo irreversible changes of mass and/or crystal structure [5,34,35,36]. For instance, the dehydration of gypsum and/or the reaction between liberated CaO from organic matter and SOx from the breakdown of pyrite could result in the formation of bassanite or anhydrite during the ashing process or when treating samples before XRD analysis [4,5,30]. However, at low temperature (120~150 °C), in vacuum and under high pressure, the oxygen plasma excited by electrons reacts with the organic matter in coal to produce water and carbon dioxide [37], during which the minerals can be isolated from higher-rank coals without major alteration [8,17,38,39,40,41]. X-ray diffractograms combined with Siroquant analysis is one of the effective means to identify and quantify the minerals in coal [42].
Due to the high crystallinity of minerals in anthracite and bituminous coal, LTAs-XRD analyses can effectively determine the properties of different minerals in coal [42,43,44]. However, lower-rank coals contain a large number of NMIE (non-mineral inorganic elements) with active chemical properties, and minerals of low crystallinity are lower, resulting in higher background values in XRD spectra in the form of a bulge. In the process of low-temperature ashing, the NMIEs (such as Ca, Al and Mg) react with organic sulfur to form sulfate phases in the residue, affecting the qualitative and quantitative analyses of minerals in low-temperature ashes [6,36,45,46].
The Quorum K1050X Plasma Asher is widely used in low-temperature coal ashing because of its simple operation, low consumable requirements and economic benefits [8,17,41]. When there are a few of samples to be ashed, it can meet the requirements of researchers. However, it is often necessary to ash a large number of coal samples in scientific research. This instrument can only ash a single sample at a time, which may require spending a lot of time on the preliminary treatment. Therefore, the efficiency of low-temperature ashing has been an urgent problem to be solved. As the demand for ashing and the maturity of low-temperature oxygen plasma ashing technology increase, low-temperature plasma ashers have made progress. The IoN 40 low-temperature plasma asher is produced by the American PVA TePla, which is a batch-mode plasma system for etching, stripping, cleaning and surface treatments. The IoN Series combines field-proven features with the process flexibility of computer control to offer ultimate performance: high throughput, low particulate generation, process versatility, precise parameter control and fault isolation.
At present, the IoN 40 plasma system is widely used in the field of materials, especially membrane materials, such as membrane preparation by CF4 plasma treatment conducted on an IoN 40 with 150 W or 200 W [47,48,49,50]. In addition, the IoN 40 at a 100 W operating power as used when az5214e was spin coated on the ZnO Nanorod array at 90 °C [51]. LTA was carried out using the IoN 40 at a constant pressure of approximately 40 psi, prior to the study of the effect of acid baking on the minerals present in the tailings using X-ray diffraction [52]. However, previous publications have not provided any details of the exact low-temperature degrees and corresponding working conditions of the ashers, and this could lead to two adverse effects on coal ashing without proper operating guidance: (1) a relatively high temperature (e.g., >150 °C) may cause the alteration of minerals (particularly clay minerals), and (2) a relatively low temperature (e.g., <80 °C) may cause a long ashing time and incomplete ashing of organic matter. In this study, the authors introduced the most frequently used low-temperature plasma ashers (PVA TePla IoN 40 and Quorum K1050X) to reveal optimal operating parameters for low-temperature ashing and made a comparison of the ashing effects of the two plasma ashers.

2. Samples and Analytical Programs

2.1. Instruments

Low-temperature ashing was conducted using the IoN 40 plasma system (PVA TePla, Corona, CA, USA), the chamber of which is pumped by a rotary vacuum pump. In the near-vacuum condition, the oxygen plasma, which is activated by gas mixed with atoms and ions generated by a high-frequency electric field, reacts with coal samples loaded into the working chamber. The oxygen plasma oxidizes and decomposes the organic matter in the coal at a low temperature, without changing the structure and properties of the minerals. A Quorum K1050X (Quorum, London, UK), with the same operating principle as the IoN 40, was used as a comparative device in this study. Table 1 lists the working parameters for the two instruments’ settings.
The XRD analysis for the low-temperature ashes (LTAs) was performed on the Thermo Fisher Scientific ARL EQUINOX 3000 (Thermo Fisher, Paris, France) X-ray powder diffractometer with PSD real-time detector. The XRD pattern was recorded with a 2.6–120° 2θ interval with 1 s minimum collection time and 0.05 resolution.

2.2. Samples and Analytical Methods

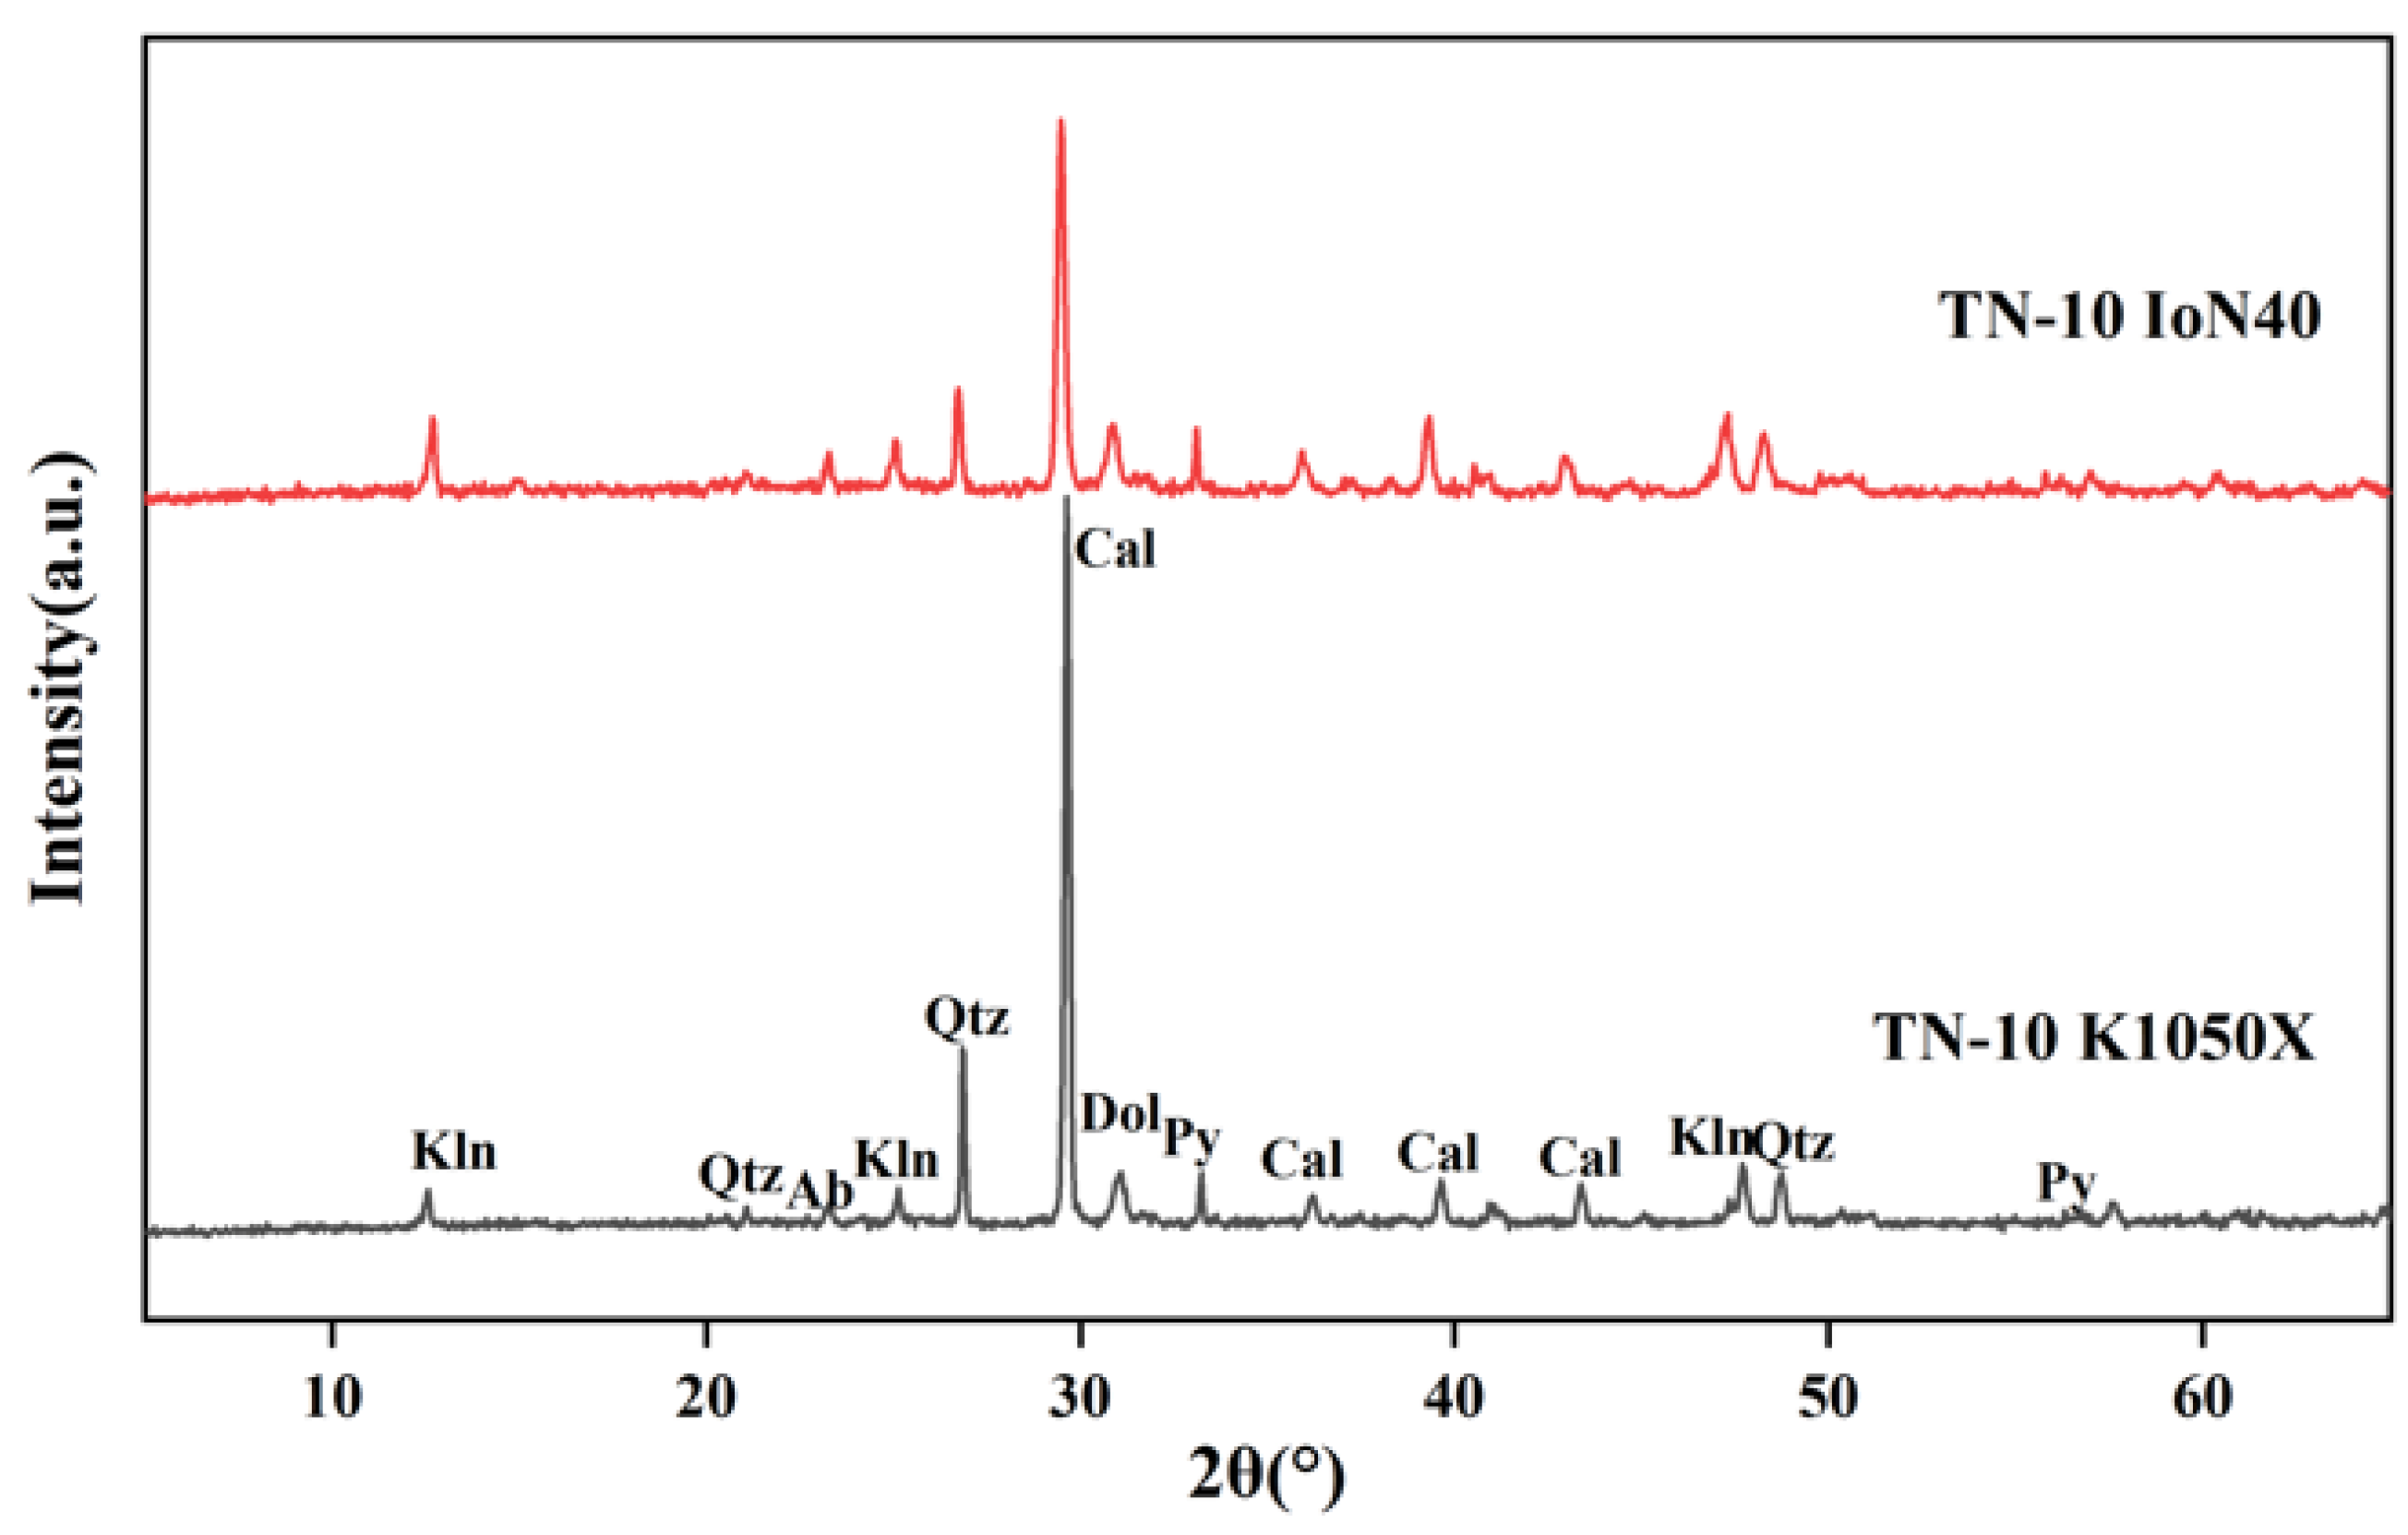
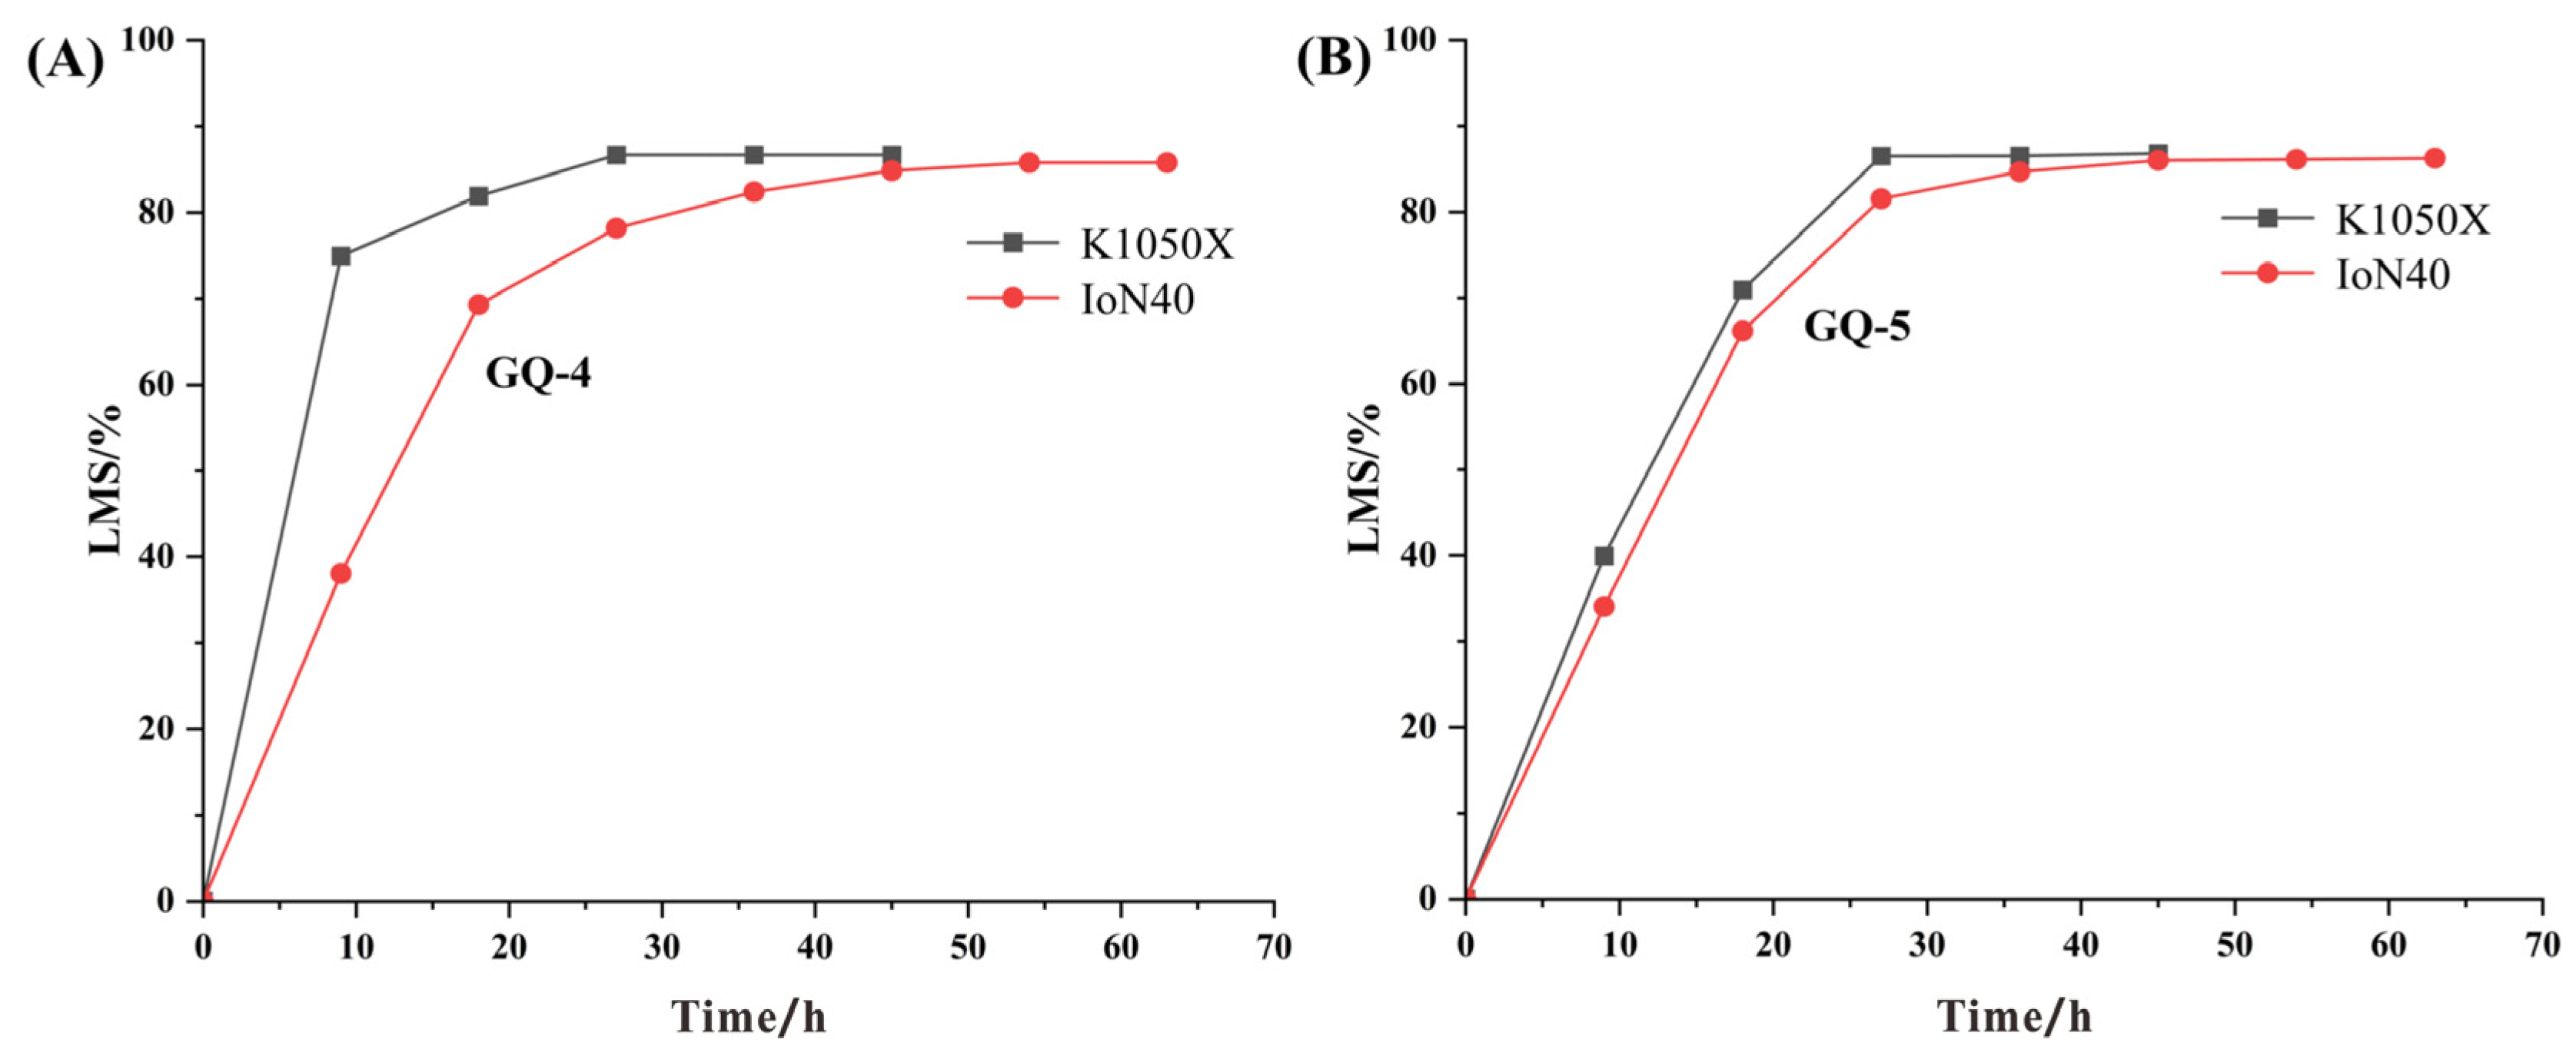
A total of 8 coal samples from coal mines of Shaanxi and Hebei Province, China, were chosen for the ashing process, including samples TN-9 and TN-10 (Tingnan Mine, Shaanxi Province), ZT-2 and ZT-11 (Gaojiapu Mine, Shaanxi Province), SB-6 (Shengbo Mine, Shaanxi Province), HW-3 (Haiwan Mine, Shaanxi Province) of Middle Jurassic; GQ-4 and GQ-5 (Gequan Mine, Hebei Province) of Late Carboniferous. All samples were immediately stored in plastic bags to minimize contamination and oxidation after collection. Each sample was crushed and ground by using a tungsten carbide mill before analysis.
Proximate analysis was conducted using the methods described in standards of ASTM D3173/D3173M-17a, D3174-12 and D3175-18 [53,54,55]. An elemental analyzer (vario MACRO) was used to determine the percentages of C, H and N in the coals, following ASTM D5373-16 [56]. The total sulfur and forms of sulfur were determined following ASTM Standards D4239-18e1 [57] and D2492-02 [58], respectively.
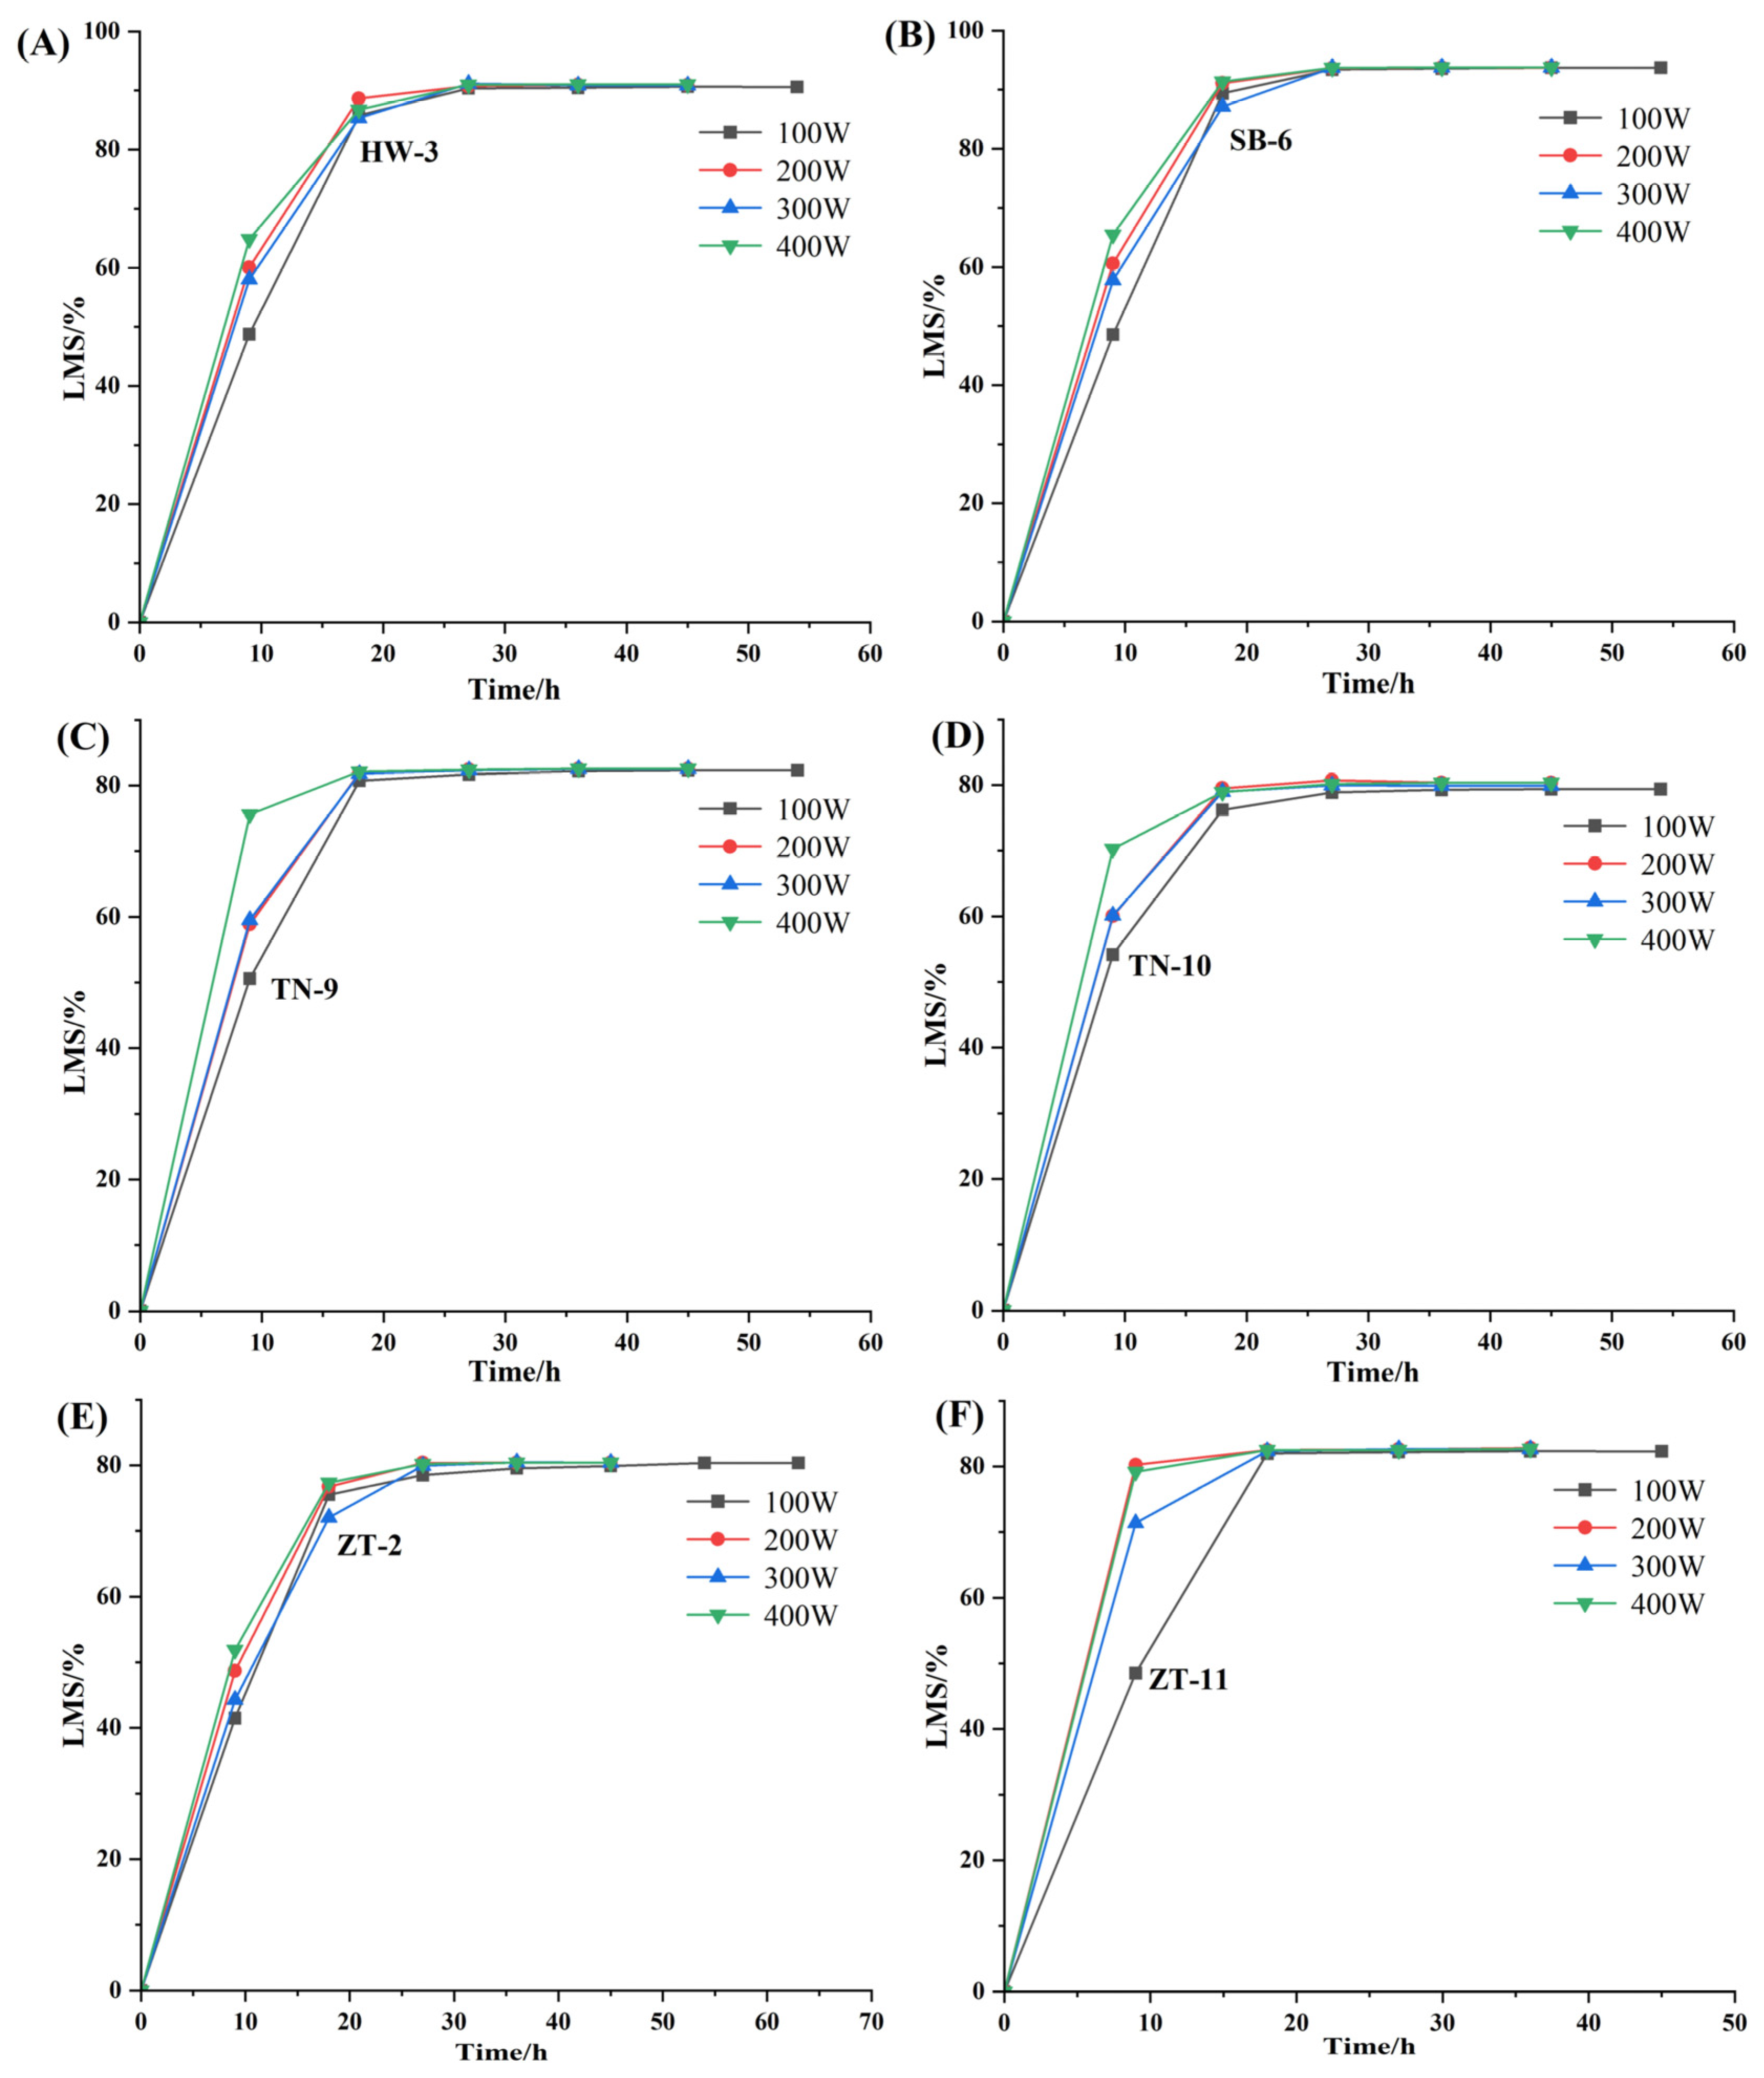
Approximately 2 g (±0.005 g) of each coal (less than 200 mesh) sub-sample was tiled in the reaction boat (60 × 90 mm) and then placed on the electrodes in the IoN 40 asher. Ghe running power was set as 100 (Program A), 200 (Program B), 300 (Program C) and 400 (Program D) watts to compare the ashing effects on the same subsplit coal sample after the ashing completed. Each ashing interval was set to 9 h.
The gas intake affects the glow emission degree of oxygen plasma. When setting the oxygen flow rate, the following factors have to be fulfilled: (1) reaching the degree of plasma glow radiation; (2) the powder sample could not be blown away. Based on the above conditions, the maximum oxygen flow rate was set to 150 mL/min (Table 1).
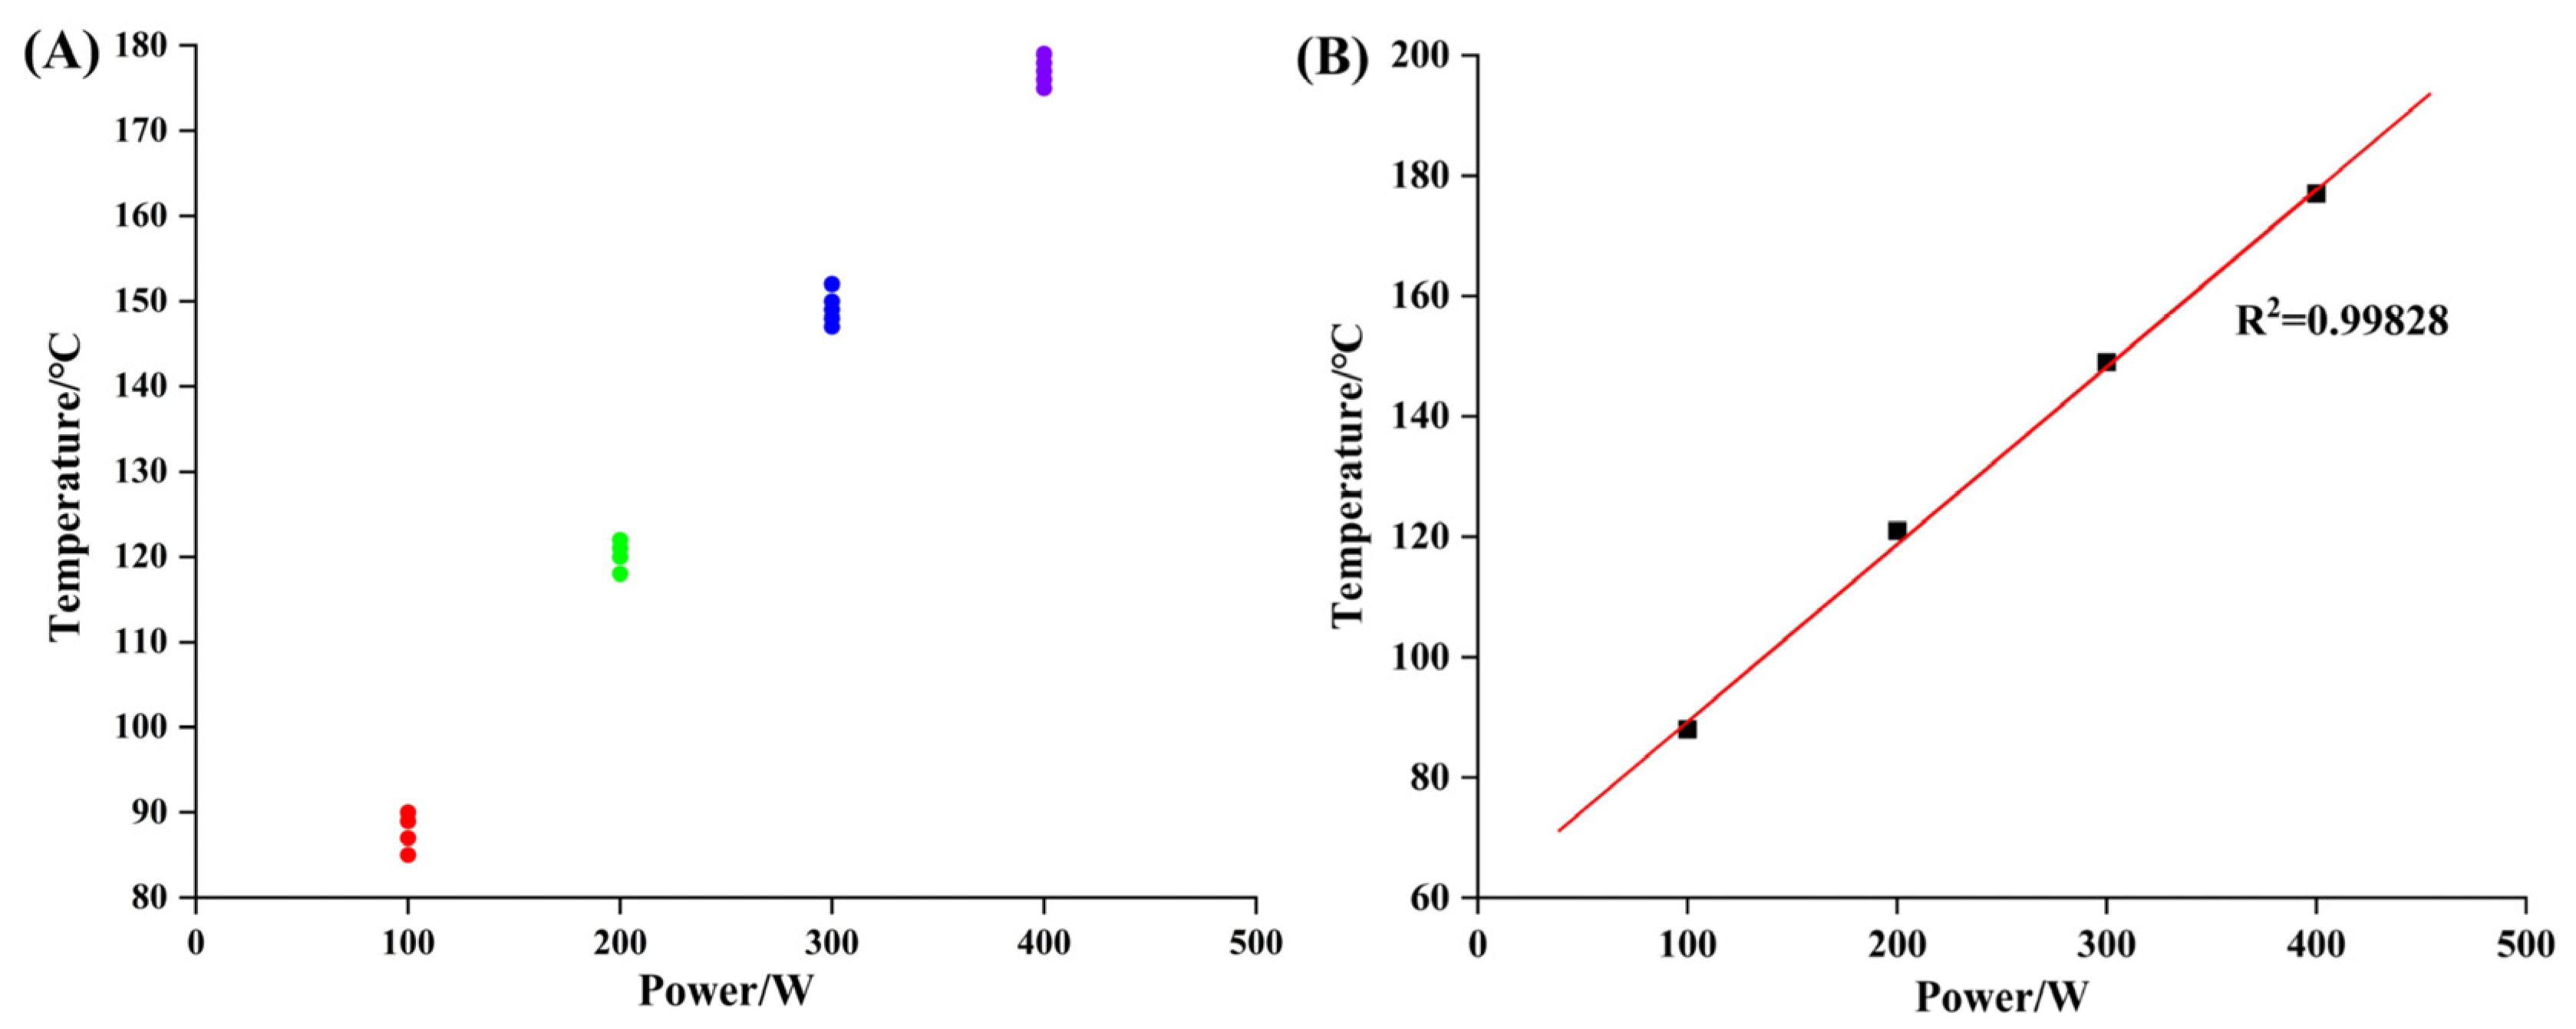
In the experiment, the most important parameter was the operating temperature in the working chamber of the plasma asher. Some researchers obtained control temperatures of 120~150 °C from the research of coal ashing to separate minerals from coal [5,18,36,45,59,60,61,62]. The temperature of the working chamber under varied powers was monitored to obtain the corresponding specific ashing temperature, as shown in Table 2.
A reaction boat with a coal sample was placed into the working chamber of the K1050X. The running power was set to 75 watts (123 °C), and a 20 mL/min oxygen flow rate was used. The ashing interval was also set to 9 h. This program was denoted by E.
After each ashing interval, the samples were weighed and stirred and then continued to be ashed until the mass changed within 4 mg, which was regarded as constant mass.
Approximately 5 g (±0.005 g) of each sub-sample of coal (less than 200 mesh) was spread in each reaction boat and then placed into a muffle furnace, following the temperature and time described in ASTM International Standard [
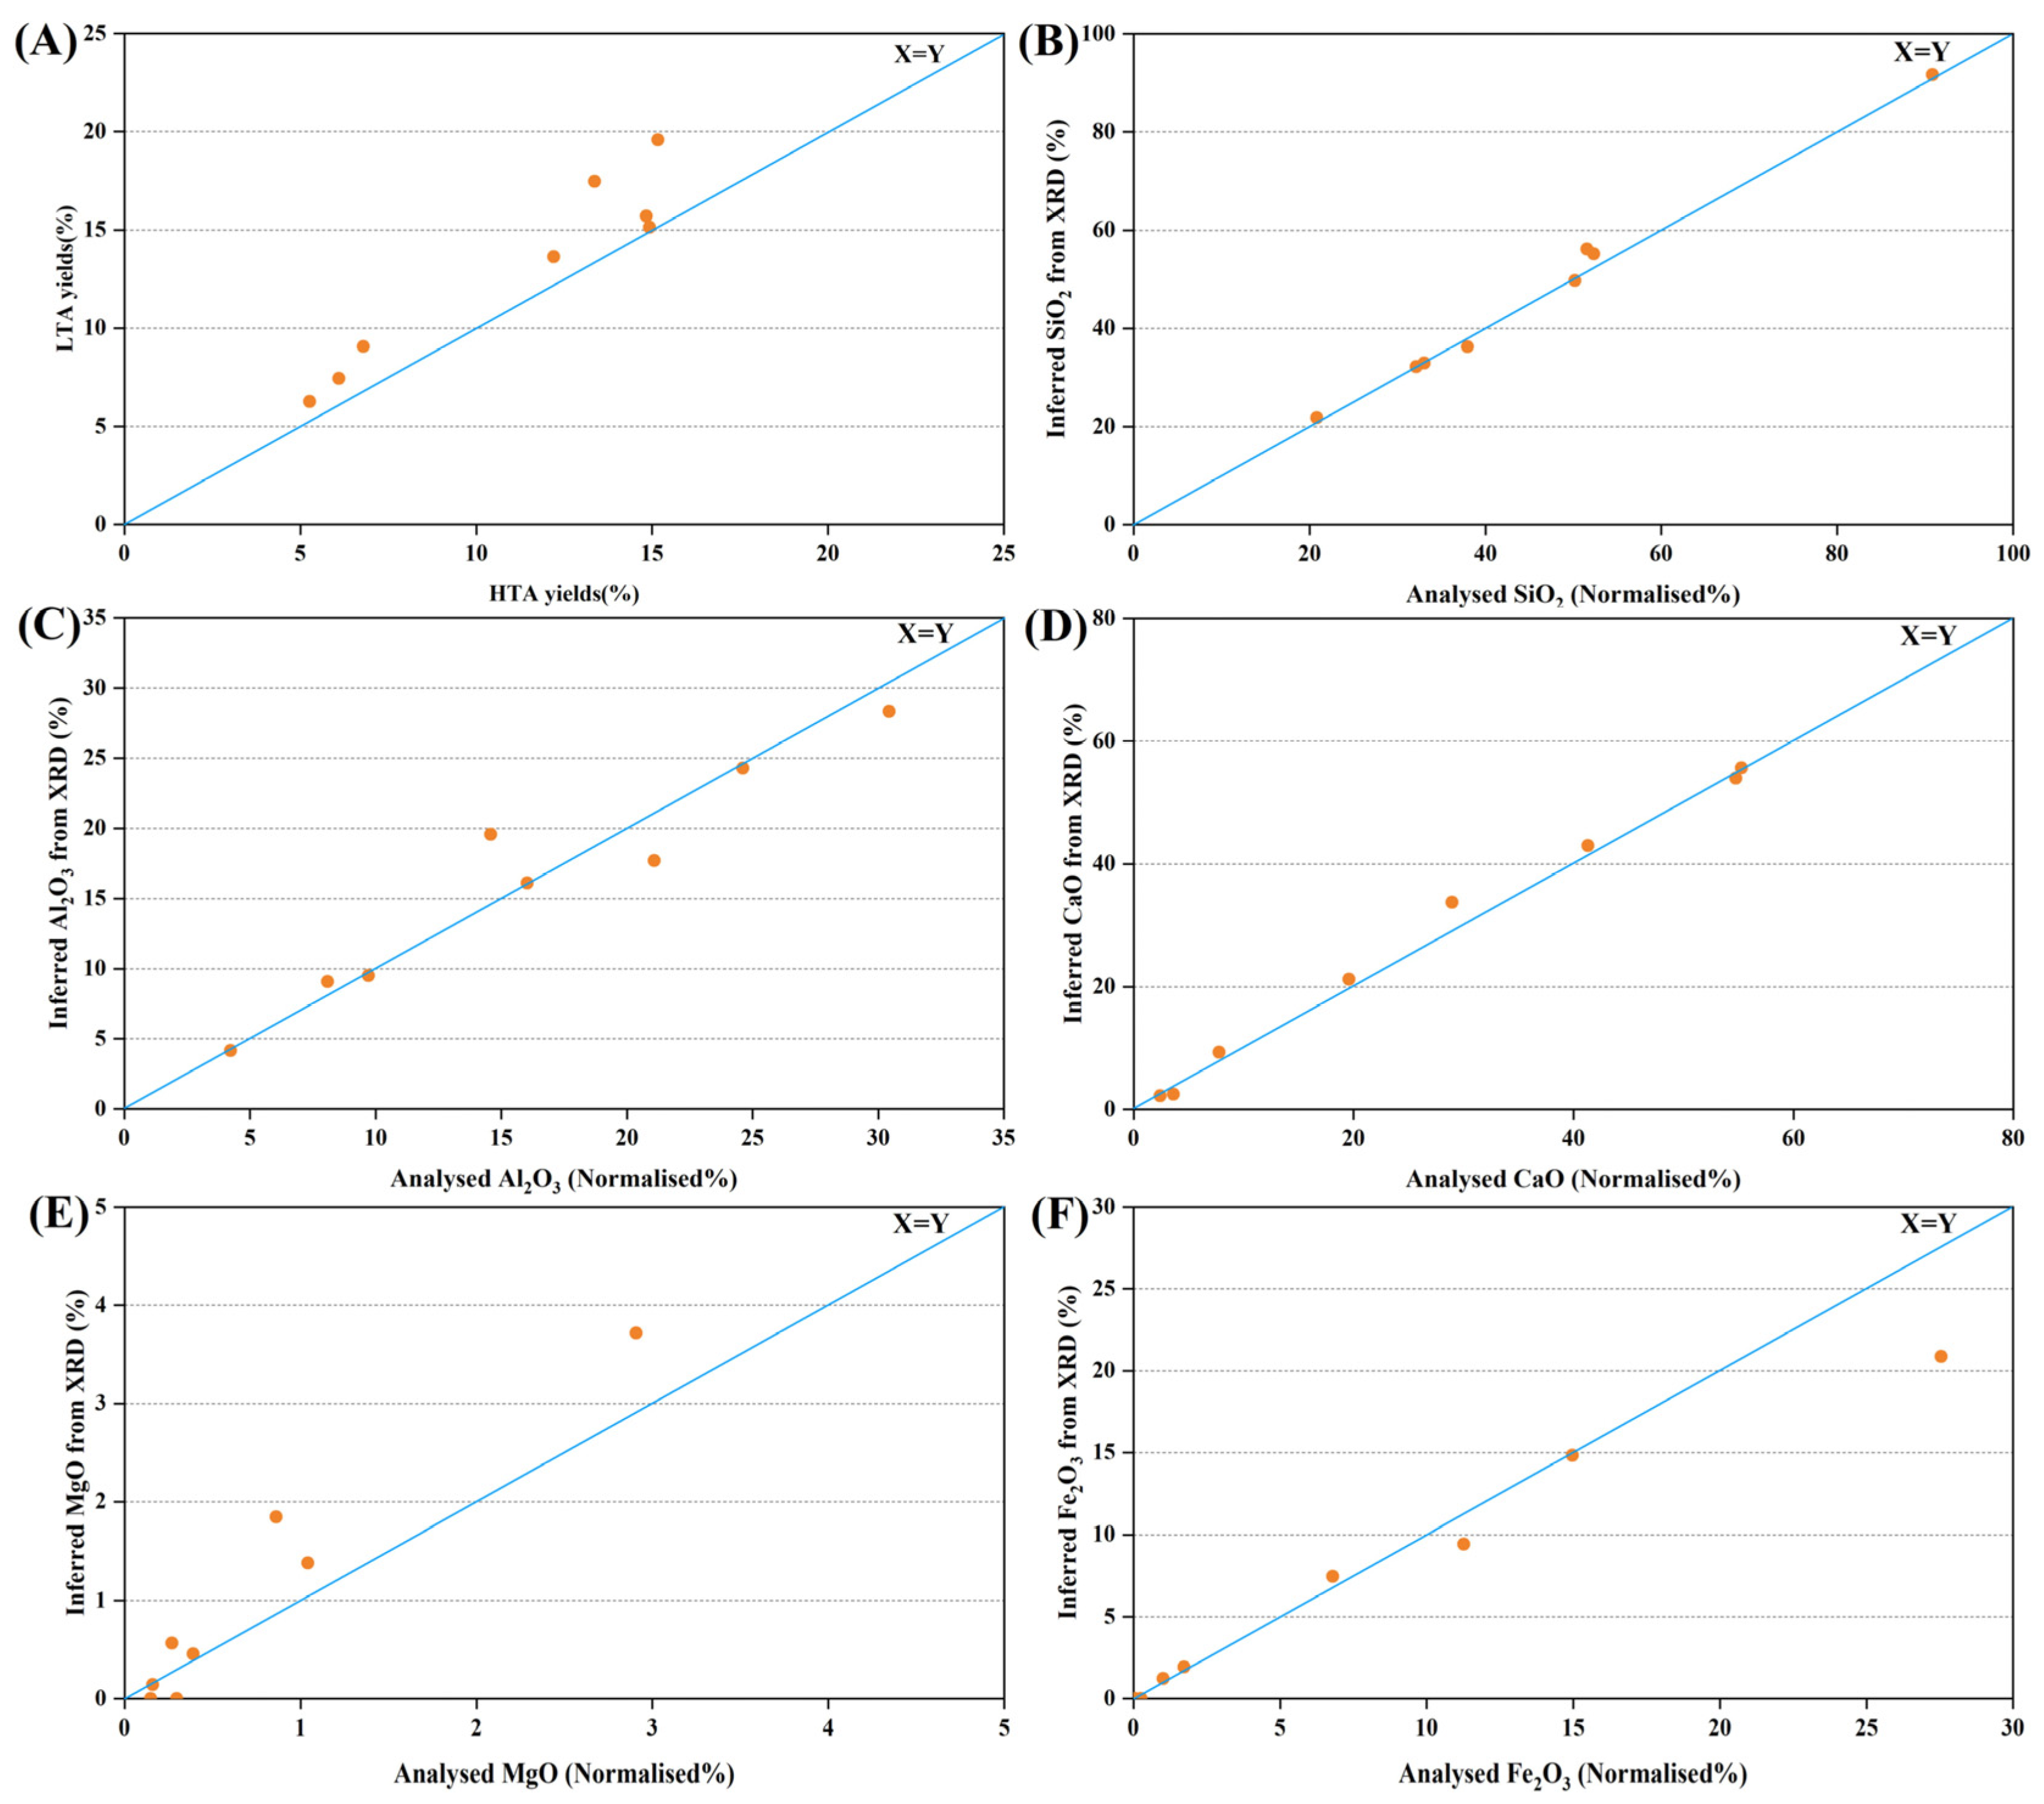
54], to obtain high-temperature ashes (at 815 °C). The obtained ashes were pressed into flakes for XRF analysis.
Samples were crushed to <1 mm and then prepared as epoxy-bound particulate pellets to polish surface treatment, following International Organization for Standardization (ISO) 7404-2, 2009 [63], and examined with 50× oil-immersion, reflected-light optics on microscopes. The random reflectance of vitrinite in each polished coal samples was determined on a Leica DM4P microscope equipped with a Craic UCC-300 spectrophotometer, according to the procedure described in ISO 7404-5 (2009) [64].
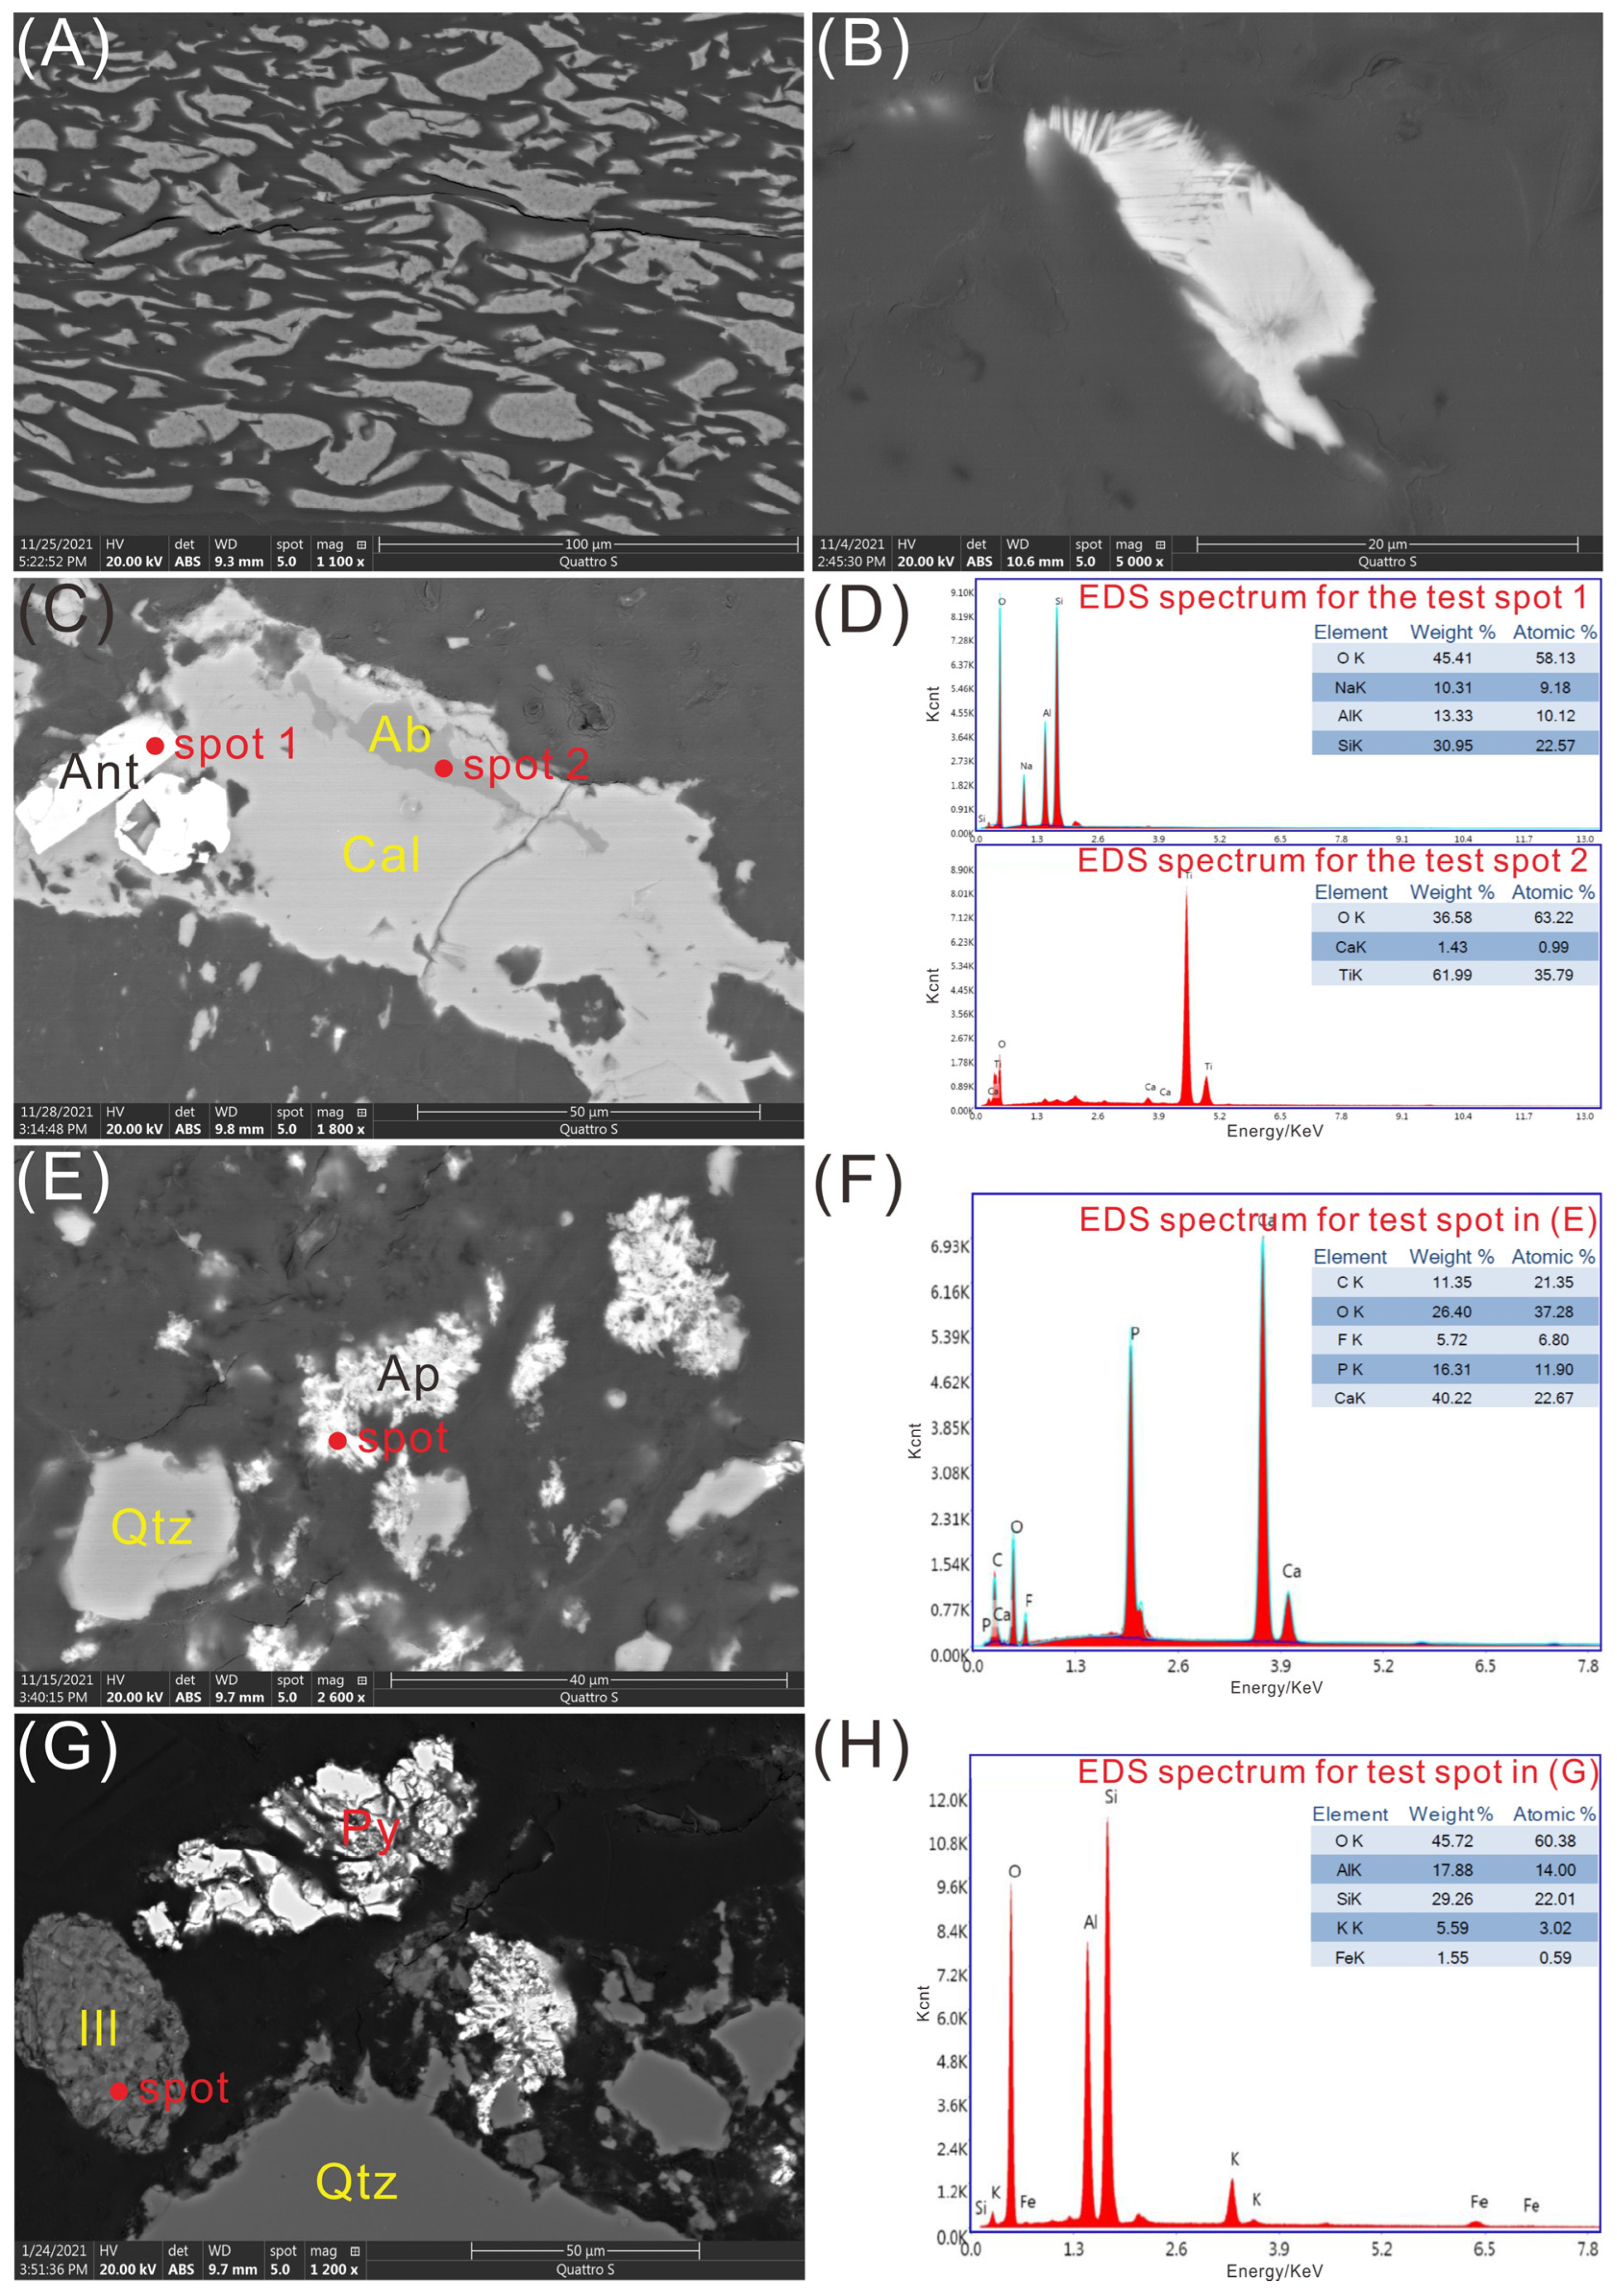
A field emission-scanning electron microscope (FE-SEM, FEI Quattro S), in conjunction with an energy-dispersive X-ray spectrometer (EDS; EDAX Team), was used to study the mineral morphology of coal samples and the distribution of elements in the minerals. Prior to SEM-EDS analysis, the sample briquettes were gold-coated using a Quorum Q150T ES sputtering coater. SEM images were captured via a retractable solid-state backscatter electron detector. The working distance of the FE-SEM-EDS was ~10 mm, beam voltage 20.0 kV and micron spot size 5.

2.3. Qualitative and Quantitative Analysis of Minerals

The LTAs were loaded into the sample cup attached to the XRD, and the powder surface was gently flattened by a cover glass for scanning. The working voltage and current of the XRD is 40 kV and 30 mA, respectively, with a dwell time of 1200 s.
Jade 5.0 software was used to identify the types of minerals in LTAs based on the XRD patterns.
X-ray diffractograms of the LTAs were subjected to quantitative mineralogical analysis using Rietveld-based Siroquant™, a commercial software system initially described by Taylor [65]. This graphic-oriented system allows the different crystallographic parameters for each mineral in the sample to be adjusted interactively to accommodate variations due to atomic substitution, layer disordering, preferred orientation and other factors in the individual phases [39,65,66] and has the characteristics of fast calculation speed, small error and high accuracy. At present, Siroquant™ has been used by many researchers for quantitative analysis of minerals in LTA and whole coal samples [5,17,36,60,61,62,67,68,69,70,71].

2.4. XRF Analysis

X-ray fluorescence (XRF) spectrometry (Thermo Scientific ARL PERFORM’ X 4200) was used to determine the contents of major oxides, including SiO2, Al2O3, CaO, K2O, Na2O, Fe2O3, MnO, MgO, TiO2 and P2O5, in the coal ash samples (at 815 °C).

3. Results

3.1. Proximate and Ultimate Analyses for Raw Coals

The results of proximate and ultimate analyses, total sulfur, forms of sulfur and vitrinite reflectance for the investigated samples are given in Table 3.
The moisture content in the coals varies from 0.31% to 8.09%. They are classified as low ash yield (<20%; dry basis), except for samples TN-9, SB-6 and HW-3 (6.10%, 5.26% and 6.79%, respectively; dry basis) which are classified as ultra-low ash yield, according to the Chinese Standard Method GB/T 15224.1–2010 [72]. The total sulfur content based on dry basis in coals varies greatly from 0.29% to 5.33%. The volatile matter yield based on dry and ash-free bases has a wide range from 14.77% to 48.07%. According to the ASTM D388-12 classification [73], two of the coal samples GQ-4 and GQ-5 are classified as low-volatile bituminous coals, and the rest of the coal samples TN-9, TN-10, ZT-2, ZT-11, SB-6 and HW-3 are high-volatile bituminous coals.

3.2. Major-Element Oxides

Table 4 lists the percentages of major-element oxides in coal samples obtained from XRF analysis. Major-element oxides in the coal ash samples are dominated by SiO2 (33.05%–90.84%, ash basis), Al2O3 (4.23%–30.44%, ash basis) and CaO (2.40%–55.27%, ash basis), followed by Fe2O3 and MgO. Some of the oxides are varied in contents in different ash samples. For instance, in sample HW-3, the content of SiO2 is up to 90.84% (ash basis), while in sample TN-10, the content of SiO2 is as low as 20.84% (ash basis).

3.3. Minerals Identified by SEM-EDS

In addition to the minerals identified by XRD techniques, some minerals in the raw coal samples were identified comprehensively at trace levels by SEM-EDS, including anatase, zircon, apatite, chalcopyrite, and barite (Figure 1).

3.4. Effect of Different Power on Working Chamber Temperature

The temperature variation in the parallel plate electrodes in the IoN 40 plasma asher was continuously monitored. Figure 2A,B show the relationship of operating power with the six recorded temperature changes and their average temperature values (R2 = 0.998), respectively, showing a strong positive correlation between them.

3.5. Analysis of Ashing Efficiency

3.5.1. Ashing Efficiency of Different Programs by IoN 40

The same coal subsample was ashed by using programs A, B, C and D, respectively. After each ashing, surface color changes in the coal samples were recorded and the mass of ashes was weighed. The sample mass reduction after low-temperature ashing was expressed by low-temperature mass loss (LMS). The LMS after primary ashing by almost every program is greater than 50%, as shown in Figure 3. At program D, the LMS changes most greatly after the first ashing. After 2~3 rounds of ashing, the LMS changes little at the programs C and D. When the LTA is basically completed, the sample mass gradually tends to be constant. However, at the program B, the ashing efficiency is higher than that of other programs, and the total ashing time is less than that by other programs. At the program A, it took a long time to make the mass of ashes not varied or varied within 4 mg. Even the total ashing time comes up to 54 h, the LTA-yields are higher as listed in Table 5, indicating that the ashing of coal samples was not complete.

3.5.2. Comparison of Ashing Efficiency by Two Plasma Ashers

The IoN 40-B program shows higher ashing efficiency than other programs and is thus compared with K1050X in the variations in ash color and mass. In Figure 4A, the color of the sample’s surface is black and/or gray after the first ashing, showing little change compared with the raw coal. Its more obvious color change is shown in Figure 4B. Furthermore, the mass of the samples was weighed separately after each ashing. It is found that the change in sample quality in program E is greater than that in B, indicating that the ashing efficiency of the former is higher than the latter until the ashing is completed.

3.6. Comparison of LTAs-XRD Patterns

3.6.1. Comparison of XRD Patterns of Ashes Obtained by IoN 40 Different Programs

XRD analysis was carried out on the LTAs of coal samples (TN-9, TN-10, ZT-2, ZT-11, SB-6, HW-3, GQ-4 and GQ-5) using programs A (88 °C), B (121 °C), C (149 °C) and D (177 °C), respectively, with a comparison of raw coal samples.
As shown in Figure 5, due to the interference of organic matter, the XRD patterns of raw coals show wide “hump” in general (e.g., in samples TN-9, ZT-2; Figure 5A,B), which makes it impossible to distinguish the diffraction peaks of minerals. After the ashing processing by program A, the peaks of most minerals in the LTAs are presented (Figure 5), which are wide with a few miscellaneous peaks showing as “small bulges”. The peak intensity of some minerals is too weak to be identified. For the XRD patterns of LTAs obtained from programs B and C, the mineral peaks are sharp, symmetrical, and show high intensity. However, after ashing by program D, the intensity of most diffraction peaks decreased, and some small peaks tended to disappear.

3.6.2. Comparison of XRD Patterns of LTAs Obtained by the Two Plasma Ashers

The XRD patterns of LTAs obtained by the two ashers, IoN 40 (Program B) and K1050X (Program E), are compared in this study, showing a little difference in symmetry, integrity and intensity of the mineral diffraction peaks (Figure 6), probably caused by the crystal material’s heterogeneity in the ash samples.

3.7. Minerals in LTAs Obtained by the Two Plasma Ashers

The results of mineral quantitative analyses of the LTAs are listed in Table 6. The dominant mineral phases identified are clay minerals, quartz, calcite and pyrite, while dolomite is detected as minor components in most of the LTAs. Some ash samples contain a small amount of anatase, albite, apatite, chlorite and illite. Compared with program E of K1050X, the proportions of dominante minerals in LTAs obtained from the programs B and C of IoN 40 are very close, although they are varied for some trace minerals.

4. Discussion

4.1. Correlation between Ashing Efficiency and Working Power

It is found that there is little correlation between the ashing efficiency and working power of the IoN 40. The ashing efficiency of some coal samples at high power is even lower than that at low power (Figure 3).
The gray color of the ashes obtained by program A indicates that some coal samples have not been completely ashed, and/or it may take a longer time to finish the ashing process. The ashes obtained by programs B, C and D with the mass varied within 4 mg are grayish-white in color, showing that the samples have been completely ashed. In addition, the yields of LTAs obtained by programs B and C are similar to that obtained by program E (Table 5), also indicating that the ashing of the coal samples has been thoroughly completed.
The LMS of the ashes from program D changes greatly with the comparison of ashes from program B after the first ashing. It is assumed that this could be caused by the oxidation of organic matter and the loss of a large amount of adsorption water in some minerals (mainly clay minerals and gypsum) in the coal. With the increase in the ashing temperature (low temperature), the mineral dehydration rate rises. After 2~3 rounds of ashing (18~27 h), the mass of samples, especially TN-9 and ZT-11, gradually tends to be constant, as the adsorbed water is completely lost and the organic matter is almost removed. However, after the second ashing of HW-3 and the third ashing of TN-10, the LMS changes in program B are greater than those in D. This is because the higher ashing temperature in the working chamber in program D changes the surface tension of mineral particles that are coated with organic matter [74,75], which prevents the volatilization of organic matter and reduces the ashing efficiency. In conclusion, there is little correlation between the coal ashing efficiency and the IoN 40 asher’s power level with the same gas inflow and other external factors; therefore, the possibility of improving ashing efficiency by increasing power can be excluded. Furthermore, the ashing effect is the best when the working power is 200 W (the temperature of chamber 121 °C).
The ashing efficiency and LMS of the ashes obtained by IoN 40 (program B) and K1050X (program E) were compared. The total ashing time of GQ-4 and GQ-5 is 45~54 h using program B (Table 7), while the complete ashing time is 27 h using program E (Figure 7). The LMS of the ashes by the IoN 40 asher (program B) is significantly lower than that by the asher K1050X (program E). This is because the oxygen concentration in the chamber of IoN 40 did not reach the optimal concentration required for ashing. In other words, although the oxygen flow in the chamber of IoN 40 is up to 150 mL/min, significantly greater than that of K1050X, the oxygen consumption for a large number of samples makes the average concentration of oxygen plasma required for the sample low in the working chamber. If the gas flow increases (>150 mL/min), the powder samples may be blown away, which can not only block up the entrance to the gas but also pollute other testing samples.

4.2. Comparison of Mineral Diffraction Peaks of LTAs

Comparing the XRD patterns of LTAs obtained from different programs (Figure 5), it is found that there are differences in the intensity and full width at half maxima (FWHM) of the diffraction peak, which reflects different mineral crystal structures. The study is based on Equation (1) from Scherrer as follows [76]:
D = K γ Bcos θ
In the equation, K is the Scherrer constant; B is the FWHM of the diffraction peak of the sample. If B is the FWHM of the diffraction peak, the value of K is 0.89; if B is the integral FWHM of diffraction peak, the value of K is 1. θ is the Bragg diffraction angle, in degrees, and γ is the X-ray wavelength, 0.154056 nm.
According to the equation above, when the X-ray is incident on some small crystals, the diffraction peak is wide and diffuse, the shape of which has small bulges that are not prominent [77,78]. On the contrary, if the crystallinity and the grain size of the crystal increases (the value of D larger), the diffraction intensity will increase, and the diffraction peak of the crystal is slender and sharper, with a prominent shape.
Figure 5 shows that the main peaks of minerals are visible overall in the LTAs-XRD patterns of program A. However, the sub-peaks of kaolinite, quartz and other minerals in SB-6 are not apparent due to their low crystallinity. Especially the peaks of some trace minerals, such as chlorite and apatite, are not prominent, and the signal-to-noise ratio (SNR) is high, indicating that the organic matter has not been completely removed or there are non-crystalline mineraloids.
In the XRD patterns of LTAs obtained by programs B and C, the peaks of the minerals in TN-9 are sharp and complete, with good symmetry and high crystallinity, and the backgrounds of the spectra are low or disappeared. In addition, some small peaks are also revealed (Figure 5C), indicating that kaolinite has high crystallinity, and its diffraction peaks are sharp and symmetrical. The peaks of quartz, pyrite and calcite are narrow, complete, symmetrical and prominent, indicating that these minerals also have high crystallinity. The sub-peaks of minerals are visible overall, while the corresponding peaks are not detected in the LTAs obtained by other programs (Figure 5G). Meanwhile, it is worth noting that the peak of kaolinite at d = 3.57 Å in SB-6 is wide (Figure 5H), as not only does it have a low crystallinity, which belongs to medium-disordered kaolinite [79], but kaolinite and chlorite are also often mixed. The d(002) diffraction peak of kaolinite partially coincides with chlorite d(004) [80,81], combining into a wider and asymmetric peak [82], making it difficult to distinguish. In the analysis of LTAs obtained by program B, the peaks at 3.57 Å and 3.53 Å are different, and the crest between kaolinite d(002) and chlorite d(004) can be distinguished. Furthermore, the diffraction peak of chlorite can be seen at d = 14 Å, although it is very weak. In order to distinguish them accurately, further treatment and analysis, such as heating, hydrochloric acid or hydrazine treating, are required [5,79]. In samples TN-9, ZT-11 and GQ-4, the peaks of dolomite can also be identified well in the LTAs (Figure 5C,F). However, the peaks of dolomite disappear or are too low intensity to distinguish in the LTAs obtained by program C. This is sufficient to show that the XRD patterns of LTAs obtained by program B are superior to those obtained by program C.
When the ashing temperature increases above 150 °C, it has a great influence on the crystal structure of minerals. In Figure 5, the main diffraction peaks of quartz, pyrite, calcite and other minerals are wider, and their intensity is weakened in the LTAs obtained from program D (400 W, 177 °C). This indicates that the increasing amplitude of thermal vibration [83,84] affects the spacing between the reflective crystal planes, leading to the occurrence of destructive interference and changes in crystal symmetry. Similarly, the weakened intensity makes some small mineral peaks difficult to identify, thus affecting the accurate analysis of minerals. Programs B and C show better ashing performance, especially program B, by which the ashes show distinct mineral diffraction peaks, making it beneficial for the subsequent qualitative and quantitative analyses of the minerals.
Table 6 provides the proportions of each crystalline phase in the LTAs obtained by varied programs. Some traces of minerals are not clearly identified in some LTAs obtained by programs A and D, such as anatase, chlorite and dolomite. The contents of dolomite are relatively low in samples TN-9, ZT-11 and GQ-4 (1.1%, 5.7% and 1.8%, respectively, on an organic matter-free basis), and dolomite only was detected in LTAs obtained by program B. Since the sum contents of minerals in each sample are always defined as 100% by default in Siroquant analysis [33], the absence of trace minerals inevitably increases the percentages of the minerals identified, resulting in the uncertainty of the quantitative results. The qualitative and quantitative analysis of minerals in LTAs obtained from the K1050X asher have been confirmed to be reliable [8,12,17,18,40,67]. Similarly, the contents of minerals in LTAs obtained from programs B and C are very close to program E (K1050X). Considering the identification of trace minerals, program B is obviously the better choice.

4.3. Major-Element Oxides and Comparison to Mineralogical Compositions

The percentages of major element oxides inferred from the Siroquant analysis are compared with the normalized concentrations of the same oxides obtained from the XRF analysis (SO3-free and ash basis) [39,40,46]. The low-temperature ash yields of the coal samples are highly correlated with the high-temperature ashes (Figure 8A), indicating that organic matter in the coal samples was effectively removed after low temperature ashing by program B. However, the plots of the LTA yields are distinctly above the equivalent line (Figure 8A), indicating that the LTA yields are greater than HTA yields. In addition, with the increase in the HTA yields, the plots of the LTA yields gradually move away from the equivalent line. This mainly reflects the loss of water of hydration from the clay minerals and the loss of CO2 from the carbonates in the high-temperature ashing procedure. Figure 8 shows a comparison of the proportion of major element oxides inferred from the XRD combined Siroquant analysis and those obtained from the XRF data. The XRD analysis was carried out on the LTAs obtained by program B because the XRD patterns have the most optimal peak intensity and complete mineral types; thus the quantitative mineral results will be closer to the real values than those by programs A, C and D.
The points in the plots of each major element oxides, including SiO2, Al2O3 and CaO are very close to the equality line, suggesting that the inferred percentages of these elements from the XRD results are compatible with the chemical analyses, adding confidence to the quantifications derived from the XRD data [40]. The inferred percentages of MgO by XRD are slightly higher than those determined by XRF chemical analysis, while the inferred proportions of Fe2O3 are slightly lower than those by XRF. This is mainly due to the fact that dolomite CaMg(CO3)2, particularly epigenetic ones in bituminous coals, often contains Fe [85,86,87], which, in most cases, is incorporated into the framework by the isomorphous substitution of Mg (Figure 9). This may explain the apparent over-estimation of MgO (Figure 8E) and the underestimation of Fe2O3 in the inferred data from the XRD results (Figure 8F), relative to the chemical analyses (XRF results).

5. Conclusions

(1) Selection of the Plasma Ashers
The IoN 40 plasma system with a big chamber can be used to ash the coal samples, facilitating the isolation of the minerals from bituminous coals, which meets the needs of low-temperature ashing of a large number of samples (at least 48 samples) in a short time. The K1050X with a small chamber (one sample at a time) is able to ash coal samples faster and more efficiently.
(2) Optimal work program of IoN 40 plasma system
The optimal operation parameters of the IoN 40 plasma system are put forward as follows: the gas intake is 150 mL/min, the pressure is 500 mTorr and the power is 200 watts, especially for clay minerals, whose crystal structure is easy to change or undergo pyrolysis reaction. At XRD analysis of LTAs obtained at running power of 200 watts, it is found that the diffraction peaks of minerals are intact, by which kaolinite d(002) and chlorite d(004) can be clearly distinguished. In addition, the qualitative and quantitative analyses of minerals by XRD + Siroquant are accurate and reliable at the optimal working program.
(3) The effects of different low temperatures on crystalline mineral matter
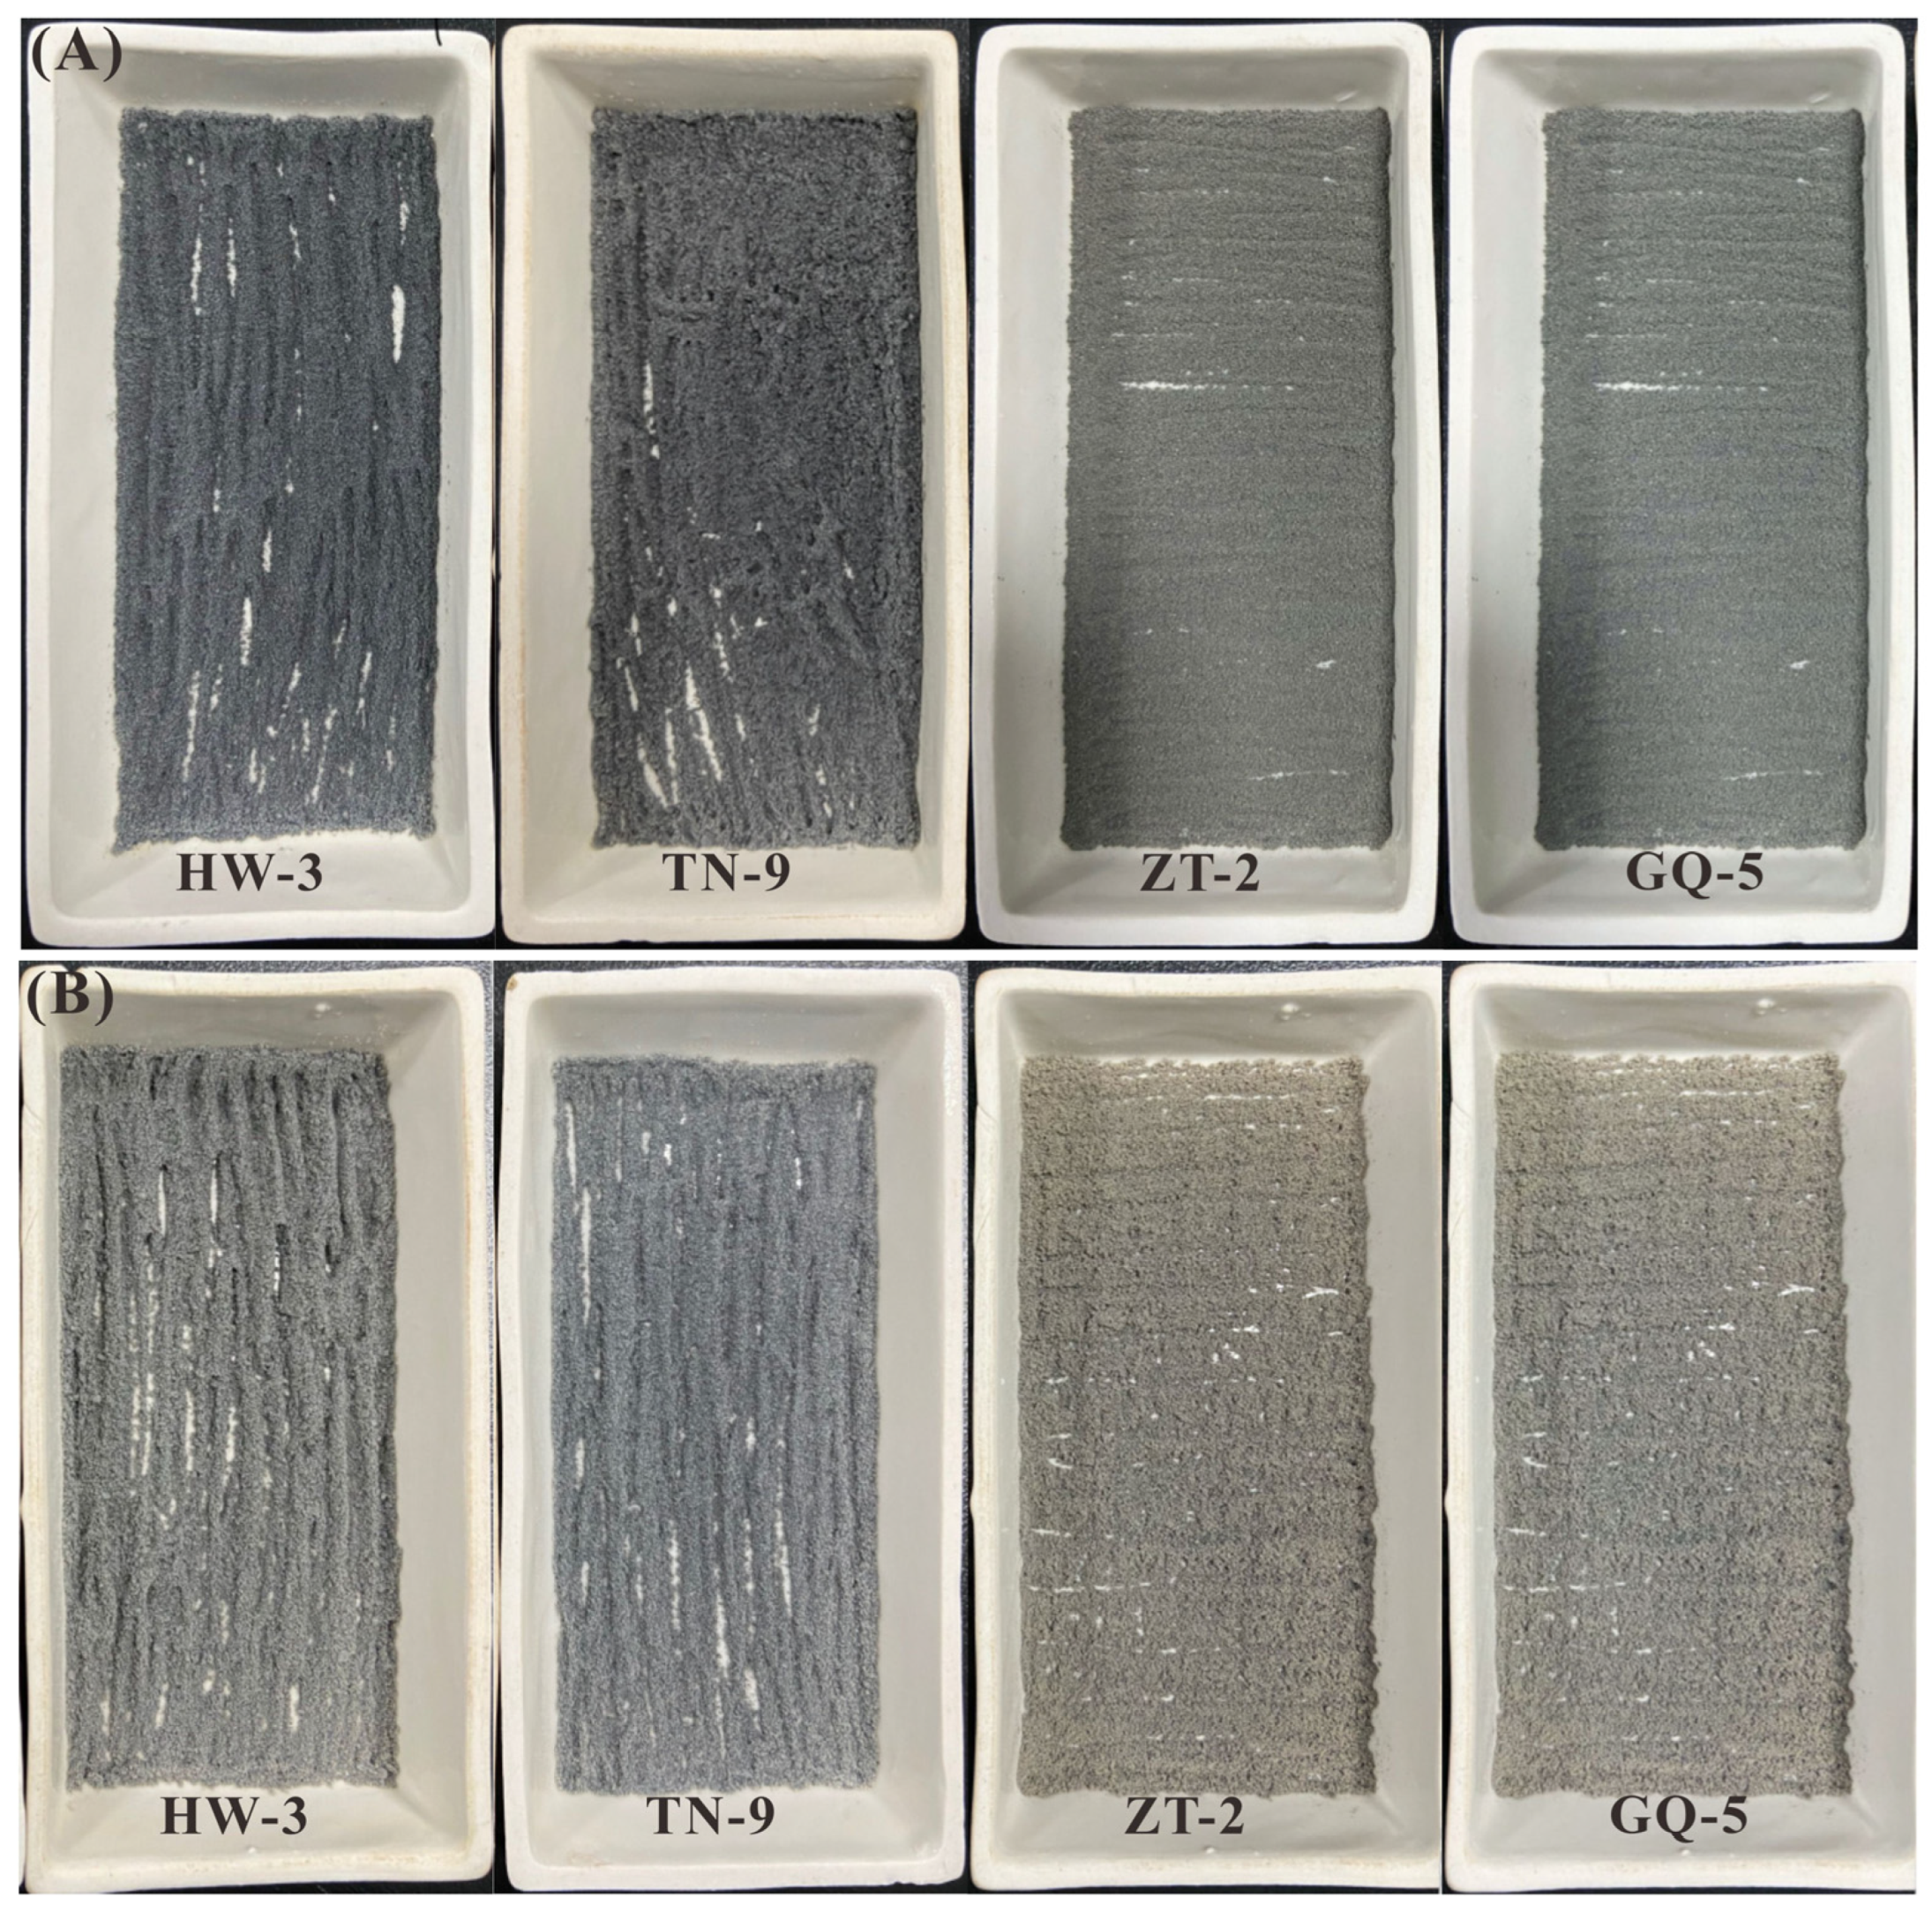
When the ashing temperature is lower than 80 °C (about 100 W), it is not high enough to remove the organic matter completely. When the temperature increases to 150 °C (about 300 W), the symmetry and integrity of the mineral crystal structures begin to become worse. At the same time, the intensity of diffraction peak decreases with increase in ashing temperature, leading to the disappearance of some trace mineral peaks. In summary, the mineral peak intensity and symmetry would not be changed under the ashing temperature of 121 °C and is thus fit for accurate quantitative analysis.

Author Contributions

Q.H.: Conceptualization, methodology, formal analysis, writing—original draft and reviewing. J.L.: writing—reviewing and editing. S.Z., R.J. and N.S.: methodology, investigation and resources. All authors have read and agreed to the published version of the manuscript.

Funding

This research was supported by the National Key R&D Program of China (2021YFC2902003) and the National Science Foundation of China (No. 41902164).

Data Availability Statement

Not applicable.

Acknowledgments

Special thanks are given to Shifeng Dai, two anonymous reviewers and the academic editor for their careful and constructive suggestions and comments on the manuscript.

Conflicts of Interest

The authors declare no conflict of interest.

References

  1. Swaine, D.J. Trace Elements in Coal; Butterworths: London, UK, 1990; p. 278. [Google Scholar]
  2. Ketris, M.P.; Yudovich, Y.E. Estimations of Clarkes for carbonaceous biolithes: World average for trace element contents in black shales and coals. Int. J. Coal Geol. 2009, 78, 135–148. [Google Scholar]
  3. Finkelman, R.B.; Dai, S.F.; French, D. The importance of minerals in coal as the hosts of chemical elements: A review. Int. J. Coal Geol. 2019, 212, 103251. [Google Scholar]
  4. Dai, S.F.; Hower, J.C.; Finkelman, R.B.; Graham, I.T.; French, D.; Ward, C.R.; Eskenazy, G.; Wei, Q.; Zhao, L. Organic associations of non-mineral elements in coal: A review. Int. J. Coal Geol. 2020, 218, 103347. [Google Scholar]
  5. Ward, C.R. Analysis, origin and significance of mineral matter in coal: An updated review. Int. J. Coal Geol. 2016, 165, 1–27. [Google Scholar]
  6. Ward, C.R. Analysis and significance of mineral matter in coal seams. Int. J. Coal Geol. 2002, 50, 135–168. [Google Scholar]
  7. Li, Z.S.; Ward, C.R.; Gurba, L.W. Occurrence of non-mineral inorganic elements in macerals of low-rank coals. Int. J. Coal Geol. 2010, 81, 242–250. [Google Scholar]
  8. Dai, S.F.; Hower, J.C.; Ward, C.R.; Guo, W.M.; Song, H.J.; O’Keefe, J.M.K.; Xie, P.P.; Hood, M.M.; Yan, X.Y. Elements and phosphorus minerals in the middle Jurassic inertinite-rich coals of the Muli Coalfield on the Tibetan Plateau. Int. J. Coal Geol. 2015, 144–145, 23–47. [Google Scholar]
  9. Raask, E. Mineral Impurities in Coal Combustion: Behavior, Problems, and Remedial Measures; Hemisphere Publishing Corporation: Washington, DC, USA, 1985; p. 484. [Google Scholar]
  10. Tian, L. Coal Combustion Emissions and Lung Cancer in Xuan Wei, China. Ph.D. Thesis, University of California, Berkeley, CA, USA, 2005. [Google Scholar]
  11. Tian, L.W.; Dai, S.F.; Wang, J.F.; Huang, Y.C.; Ho, S.C.; Zhou, Y.P.; Lucas, D.; Koshland, C.P. Nano-quartz in Late Permian C1 coal and the high incidence of female lung cancer in the Pearl River Origin area: A retrospective cohort study. BMC Public Health 2008, 8, 398. [Google Scholar] [CrossRef]
  12. Dai, S.F.; Tian, L.W.; Chou, C.L.; Zhou, Y.P.; Zhang, M.Q.; Zhao, L.; Wang, J.M.; Yang, Z.; Cao, H.Z.; Ren, D.Y. Mineralogical and compositional characteristics of late Permian coals from an area of high lung cancer rate in Xuanwei, Yunnan, China: Occurrence and origin of quartz and chamosite. Int. J. Coal Geol. 2008, 76, 318–327. [Google Scholar]
  13. Huang, X.; Gordon, T.; Rom, W.N.; Finkelman, R.B. Interaction of iron and calcium minerals in coals and their roles in coal dust-induced health and environmental problems. Rev. Mineral. Geochem. 2006, 64, 153–178. [Google Scholar] [CrossRef]
  14. Yudovich, Y.E.; Ketris, M.P. Arsenic in coal: A review. Int. J. Coal Geol. 2005, 61, 141–196. [Google Scholar]
  15. Karayiğit, A.I.; Bircan, C.; Mastalerz, M.; Oskay, R.G.; Querol, X.; Lieberman, N.R.; Türkmen, I. Coal characteristics, elemental composition and modes of occurrence of some elements in the İsaalan coal (Balıkesir, NW Turkey). Int. J. Coal Geol. 2017, 172, 43–59. [Google Scholar] [CrossRef]
  16. Kolker, A. Minor element distribution in iron disulfides in coal: A geochemical review. Int. J. Coal Geol. 2012, 94, 32–43. [Google Scholar]
  17. Dai, S.F.; Jiang, Y.F.; Ward, C.R.; Gu, L.D.; Seredin, V.V.; Liu, H.D.; Zhou, D.; Wang, X.B.; Sun, Y.Z.; Zou, J.H.; et al. Mineralogical and geochemical compositions of the coal in the Guanbanwusu Mine, Inner Mongolia, China: Further evidence for the existence of an Al (Ga and REE) ore deposit in the Jungar Coalfield. Int. J. Coal Geol. 2012, 98, 10–40. [Google Scholar]
  18. Dai, S.F.; Wang, X.B.; Seredin, V.V.; Hower, J.C.; Ward, C.R.; O’Keefe, J.M.K.; Huang, W.H.; Li, T.; Li, X.; Liu, H.D.; et al. Petrology, mineralogy, and geochemistry of the Ge-rich coal from the Wulantuga Ge ore deposit, Inner Mongolia, China: New data and genetic implications. Int. J. Coal Geol. 2012, 90–91, 72–99. [Google Scholar]
  19. Dai, S.F.; Li, T.; Seredin, V.V.; Ward, C.R.; Hower, J.C.; Zhou, Y.P.; Zhang, M.Q.; Song, X.L.; Song, W.J.; Zhao, C.L. Origin of minerals and elements in the late Permian coals, tonsteins, and host rocks of the Xinde Mine, Xuanwei, eastern Yunnan, China. Int. J. Coal Geol. 2014, 121, 53–78. [Google Scholar] [CrossRef]
  20. Dai, S.F.; Chekryzhov, I.Y.; Seredin, V.V.; Nechaev, V.P.; Graham, I.T.; Hower, J.C.; Ward, C.R.; Ren, D.Y.; Wang, X.B. Metalliferous coal deposits in East Asia (Primorye of Russia and South China): A review of geodynamic controls and styles of mineralization. Gondwana Res. 2016, 29, 60–82. [Google Scholar]
  21. Diehl, S.F.; Goldhaber, M.B.; Koenig, A.E.; Lowers, H.A.; Ruppert, L.F. Distribution of arsenic, selenium, and other trace elements in high pyrite Appalachian coals: Evidence for multiple episodes of pyrite formation. Int. J. Coal Geol. 2012, 94, 238–249. [Google Scholar] [CrossRef]
  22. Dai, S.F.; Yan, X.Y.; Ward, C.R.; Hower, J.C.; Zhao, L.; Wang, X.B.; Zhao, L.X.; Ren, D.Y.; Finkelman, R.B. Valuable elements in Chinese coals: A review. Int. Geol. Rev. 2018, 60, 590–620. [Google Scholar] [CrossRef]
  23. López-Buendía, A.M.; Whateley, M.K.G.; Bastida, J.; Urquiola, M.M. Origins of mineral matter in peat marsh and peat bog deposits, Spain. Int. J. Coal Geol. 2007, 71, 246–262. [Google Scholar] [CrossRef]
  24. Wüst, R.; Bustin, R.M.; Ross, J. Neo-mineral formation during artificial coalification of low-ash—Mineral free-peat material from tropical Malaysia-potential explanation for low ash coals. Int. J. Coal Geol. 2008, 74, 114–122. [Google Scholar] [CrossRef]
  25. Li, D.H.; Tang, Y.G. Distribution and Enrichment Causes of Trace Elements in Coal in Southwest China; Geological Publishing House: Beijing, China, 2008. [Google Scholar]
  26. Guo, W.M. Enrichment and Differentiation Mechanism of Minerals and Trace Elements in the Paleogene Coals from Hunchun Area of Jilin Province, China. Ph.D. Thesis, China University of Mining and Technology, Beijing, China, 2019. [Google Scholar]
  27. Dai, S.F.; Bechtel, A.; Eble, C.F.; Flores, R.M.; French, D.; Graham, I.T.; Hood, M.M.; Hower, J.C.; Korasidis, V.A.; Moore, T.A. Recognition of peat depositional environments in coal: A review. Int. J. Coal Geol. 2020, 219, 103383. [Google Scholar]
  28. Karayiğit, A.I.; Azeri, N.; Oskay, R.G.; Hower, J.C. Zeolite and associated mineral occurrences in high-sulphur coals from the middle Miocene upper coal seam from underground mines in the Çayirhan coalfield, (Beypazarı, Central Turkey). Int. J. Coal Geol. 2022, 256, 104010. [Google Scholar]
  29. Zhang, Z.H.; Lv, D.W.; Wang, C.S.; Hower, J.C.; Raji, M.; Wang, T.T.; Zhang, J.Q.; Yang, Y. Mineralogical and geochemical characteristics of tonsteins from the Middle Jurassic Yan’an Formation, Ordos Basin, North China. Int. J. Coal Geol. 2022, 253, 103968. [Google Scholar] [CrossRef]
  30. Oskay, R.G.; Christanis, K.; Inaner, H.; Salman, M.; Taka, M. Palaeoenvironmental reconstruction of the eastern part of the Karapınar-Ayrancı coal deposit (Central Turkey). Int. J. Coal Geol. 2016, 163, 100–111. [Google Scholar] [CrossRef]
  31. Querol, X.; Alastuey, A.; Chinchon, J.S.; Turiel, J.L.F.; Soler, A.L. Determination of pyritic sulphur and organic matter contents in Spanish subbituminous coals by X-ray power diffraction. Int. J. Coal Geol. 1993, 22, 279–293. [Google Scholar] [CrossRef]
  32. Siavalas, G.; Linou, M.; Chatziapostolou, A.; Kalaitzidis, S.; Papaefthymiou, H.; Christanis, K. Palaeoenvironment of Seam I in the Marathousa Lignite Mine, Megalopolis Basin (Southern Greece). Int. J. Coal Geol. 2009, 78, 233–248. [Google Scholar] [CrossRef]
  33. Liu, J.J. Occurrence Characteristics of Mineral Matters in Low-Rank Coals and Their Implications for Geological Process. Ph.D. Thesis, China University of Mining and Technology, Beijing, China, 2019. [Google Scholar]
  34. Nelson, J.B. Assessment of mineral species associated with coal. Br. Coal Util. Res. Assoc. Mon. Bull. 1953, 17, 21–55. [Google Scholar]
  35. Brown, H.R.; Durie, R.A.; Schafer, H.N.S. The inorganic constituents of Australian coals: I. The direct determination of the total mineral matter content. Fuel 1959, 38, 295–308. [Google Scholar]
  36. Ward, C.R.; Bocking, M.; Ruan, C.D. Mineralogical analysis of coals as an aid to seam correlation in the Gloucester Basin, New South Wales, Australia. Int. J. Coal Geol. 2001, 47, 31–49. [Google Scholar] [CrossRef]
  37. Song, D.Y. Study on Quantitative and Occurrence Characteristics of Minerals in Coal; China University of Mining and Technology Press: Beijing, China, 2011. [Google Scholar]
  38. Gluskoter, H.J. Electronic low temperature ashing of bituminous coal. Fuel 1965, 44, 285–291. [Google Scholar]
  39. Ward, C.R.; Spears, D.A.; Booth, C.A.; Staton, I.; Gurba, L.W. Mineral matter and trace elements in coals of the Gunnedah Basin, New South Wales, Australia. Int. J. Coal Geol. 1999, 40, 281–308. [Google Scholar] [CrossRef]
  40. Dai, S.F.; Li, T.J.; Jiang, Y.F.; Ward, C.R.; Hower, J.C.; Sun, J.H.; Liu, J.J.; Song, H.J.; Wei, J.P.; Li, Q.Q.; et al. Mineralogical and geochemical compositions of the Pennsylvanian coal in the Hailiushu Mine, Daqingshan Coalfield, Inner Mongolia, China: Implications of sediment-source region and acid hydrothermal solutions. Int. J. Coal Geol. 2015, 137, 92–110. [Google Scholar] [CrossRef]
  41. Zhao, L.; Dai, S.F.; Nechaev, V.P.; Nechaeva, E.V.; Graham, I.T.; French, D.; Sun, J.H. Enrichment of critical elements (Nb-Ta-Zr-Hf-REE) within coal and host rocks from the Datanhao mine, Daqingshan Coalfield, northern China. Ore Geol. Rev. 2019, 111, 102951. [Google Scholar]
  42. Frazer, F.W.; Belcher, C.B. Quantitative determination of the mineral matter content of coal by a radio-frequency oxidation technique. Fuel 1973, 52, 41–46. [Google Scholar] [CrossRef]
  43. Miller, R.N.; Yarzab, R.F.; Given, P.H. Determination of the mineral-matter contents of coals by low-temperature ashing. Fuel 1979, 58, 4–10. [Google Scholar] [CrossRef]
  44. Australian Standard 1038.22; Higher Rank Coal—Mineral Matter and Water of Constitution. Standards Australia: Sydney, Australia, 2000; p. 20.
  45. Ward, C.R.; Taylor, J.C.; Matulis, C.E.; Dale, L.S. Quantification of mineral matter in the Argonne Premium Coals using interactive Rietveld-based X-ray diffraction. Int. J. Coal Geol. 2001, 46, 67–82. [Google Scholar] [CrossRef]
  46. Liu, J.J.; Ward, C.R.; Graham, I.T.; French, D.; Dai, S.F.; Song, X.L. Modes of occurrence of non-mineral inorganic elements in lignites from the Mile Basin, Yunnan Province, China. Fuel 2018, 222, 146–155. [Google Scholar] [CrossRef]
  47. Yang, C.; Li, X.M.; Gilron, J.; Kong, D.F.; Yin, Y.; Oren, Y.; Linder, C.; He, T. CF4 plasma-modified superhydrophobic PVDF membranes for direct contact membrane distillation. J. Membr. Sci. 2014, 456, 155–161. [Google Scholar] [CrossRef]
  48. Tian, M.M.; Yin, Y.; Yang, C.; Zhao, B.L.; Song, J.F.; Liu, J.D.; Li, X.M.; He, T. CF4 plasma modified highly interconnective porous polysulfone membranes for direct contact membrane distillation (DCMD). Desalination 2015, 369, 105–114. [Google Scholar]
  49. Chen, Y.; Tian, M.M.; Li, X.M.; Wang, Y.Q.; An, A.K.; Fang, J.H.; He, T. Anti-wetting behavior of negatively charged superhydrophobic PVDF membranes in direct contact membrane distillation of emulsified wastewaters. J. Membr. Sci. 2017, 535, 230–238. [Google Scholar] [CrossRef]
  50. Yun, C.W.; Chen, Y.; Tijing, L.D.; Phuntsho, S.; He, T.; Choi, J.S.; Kim, S.H.; Shon, H.K. CF4 plasma-modified omniphobic electrospun nanofiber membrane for produced water brine treatment by membrane distillation. J. Membr. Sci. 2017, 529, 234–242. [Google Scholar]
  51. Xiang, D.L.; Liu, Z.R.; Wu, M.Q.; Liu, H.H.; Zhang, X.D.; Wang, Z.; Wang, Z.L.; Li, L.L. Enhanced Piezo-Photoelectric Catalysis with Oriented Carrier Migration in Asymmetric Au-ZnO Nanorod Array. Small 2020, 16, 1907603. [Google Scholar]
  52. Vinoth, K.K.; Maria, H. Sulfuric acid baking and water leaching of rare earth elements from coal tailings. Fuel 2022, 319, 123738. [Google Scholar]
  53. ASTM D3173/D3173M-17a; Standard Test Method for Moisture in the Analysis Sample of Coal and Coke. ASTM International: West Conshohocken, PA, USA, 2017.
  54. ASTM D3174-12; Standard Test Method for Ash in the Analysis Sample of Coal and Coke from Coal. ASTM International: West Conshohocken, PA, USA, 2018.
  55. ASTM D3175-18; Standard Test Method for Volatile Matter in the Analysis Sample of Coal and Coke. ASTM International: West Conshohocken, PA, USA, 2018.
  56. ASTM D5373-16; Standard Test Methods for Determination of Carbon, Hydrogen and Nitrogen in Analysis Samples of Coal and Carbon in Analysis Samples of Coal and Coke. ASTM International: West Conshohocken, PA, USA, 2016.
  57. ASTM D4239-18e1; Standard Test Method for Sulfur in the Analysis Sample of Coal and Coke Using High-Temperature Tube Furnace Combustion. ASTM International: West Conshohocken, PA, USA, 2018.
  58. ASTM D2492-02; Standard Test Method for Forms of Sulfur in Coal. ASTM International: West Conshohocken, PA, USA, 2012.
  59. Ruan, C.D.; Ward, C.R. Quantitative X-ray powder diffraction analysis of clay minerals in Australian coals using Rietveld methods. Appl. Clay Sci. 2002, 21, 227–240. [Google Scholar] [CrossRef]
  60. Zhao, L.; Ward, C.R.; French, D.; Graham, I.T. Mineralogy of the volcanic-influenced Great Northern coal seam in the Sydney Basin, Australia. Int. J. Coal Geol. 2012, 94, 94–110. [Google Scholar] [CrossRef]
  61. Zhao, L.; Ward, C.R.; French, D.; Graham, I.T. Mineralogical composition of Late Permian coal seams in the Songzao Coalfield, southwestern China. Int. J. Coal Geol. 2013, 116–117, 208–226. [Google Scholar] [CrossRef]
  62. Zhao, L.; Ward, C.R.; French, D.; Graham, I.T. Mineralogy and inorganic geochemistry of the early Permian Greta seam, Sydney Basin, Australia. Aust. J. Earth Sci. 2014, 61, 375–394. [Google Scholar] [CrossRef]
  63. International Organization for Standardization (ISO) 7404-2; Methods of Preparing Coal Samples. Methods for Petrographic Analysis of Coal—Part 2. International Organization for Standardization: Geneva, Switzerland, 2009.
  64. International Organization for Standardization (ISO) 7404-5; Method of Determining Microscopically the Reflectance of Vitrinite. Methods for the Petrographic Analysis of Coals—Part 5. International Organization for Standardization: Geneva, Switzerland, 2009.
  65. Taylor, J.C. Computer programs for standardless quantitative analysis of minerals using the full powder diffraction profile. Powder Diffract 1991, 6, 2–9. [Google Scholar] [CrossRef]
  66. Ward, C.R.; Taylor, J.C. Quantitative mineralogical analysis of coals from the Callide Basin, Queensland, Australia using X-ray diffractometry and normative interpretation. Int. J. Coal Geol. 1996, 31, 211–229. [Google Scholar] [CrossRef]
  67. Dai, S.F.; Zou, J.H.; Jiang, Y.F.; Ward, C.R.; Wang, X.B.; Li, T.; Xue, W.F.; Liu, S.D.; Tian, H.M.; Sun, X.H.; et al. Mineralogical and geochemical compositions of the Pennsylvanian coal in the Adaohai Mine, Daqingshan Coalfield, Inner Mongolia, China: Modes of occurrence and origin of diaspore, gorceixite, and ammonian illite. Int. J. Coal Geol. 2012, 94, 250–270. [Google Scholar] [CrossRef]
  68. Dai, S.F.; Ren, D.Y.; Chou, C.L.; Finkelman, R.B.; Seredin, V.V.; Zhou, Y.P. Geochemistry of trace elements in Chinese coals: A review of abundances, genetic types, impacts on human health, and industrial utilization. Int. J. Coal Geol. 2012, 94, 3–21. [Google Scholar] [CrossRef]
  69. Oliveira, M.L.S.; Ward, C.R.; French, D.; Hower, J.C.; Querol, X.; Silva, L.F.O. Mineralogy and leaching characteristics of beneficiated coal products from Santa Catarina, Brazil. Int. J. Coal Geol. 2012, 94, 314–323. [Google Scholar] [CrossRef]
  70. Oliveira, M.L.S.; Ward, C.R.; Sampaio, C.H.; Querol, X.; Cutruneo, C.; Taffarel, S.R.; Silva, L.F.O. Partitioning of mineralogical and inorganic geochemical components of coals from Santa Catarina, Brazil, by industrial beneficiation processes. Int. J. Coal Geol. 2013, 116, 75–92. [Google Scholar] [CrossRef]
  71. Permana, A.K.; Ward, C.R.; Li, Z.S.; Gurba, L.W. Distribution and origin of minerals in high-rank coals of the South Walker Creek area, Bowen Basin, Australia. Int. J. Coal Geol. 2013, 116–117, 185–207. [Google Scholar] [CrossRef]
  72. GB/T 15224.1-2010; Quality classification of Coal. Part 1: Ash Yield. Standardization Administration of China: Beijing, China, 2010.
  73. ASTM Standard D388-12; Standard Classification of Coals by Rank. ASTM International: West Conshohocken, PA, USA, 2012.
  74. Xu, R.S. Behaviors of Minerals in Coal during the Processes of Thermal Transformation. Ph.D. Thesis, China University of Mining & Technology, Beijing, China, 2016. [Google Scholar]
  75. Lan, Z.Q. Mechanism & Dynamic Characteristics of Fouling and Slagging for Coal and Blank Liquor Coal-Water Slurry. Ph.D. Thesis, Zhejiang University, Hangzhou, China, 2007. [Google Scholar]
  76. Guo, J.L.; Shen, Y.N. Several problems needing attention in calculating grain size by Scherrer formula. J. Inn. Mong. Norm. Univ. 2009, 38, 357–358. [Google Scholar]
  77. Harrington, R.; Neder, R.B.; Parise, J.B. The nature of X-ray scattering from geo-nanoparticles: Practical considerations of the use of the Debye equation and the pair distribution function for structure analysis. Chem. Geol. 2012, 329, 3–9. [Google Scholar] [CrossRef]
  78. Basak, M.; Rahman, L.; Ahmed, F.; Biswas, B.; Sharmin, N. The use of X-ray Diffraction peak profile analysis to determine the structural parameters of cobalt ferrite nanoparticles using Debye-Scherrer, Williamson-Hall, Halder-Wagner and Size-strain plot: Different precipitating agent approach. J. Alloys Compd. 2021, 895, 162694. [Google Scholar] [CrossRef]
  79. Yang, Y.X.; Su, Z.B.; Chen, Z.G. Quantitative study of clay minerals by X-ray diffraction (Part 1). Geol. Build. Mater. 1994, 4, 28–34. [Google Scholar]
  80. Fan, X.Y. X-ray qualitative analysis of several typical clay minerals. China Ceram. Ind. 2000, 7, 37–41. [Google Scholar]
  81. Lan, M.J.; Yu, B.S. Determination of scale factor of kaolinite and chlorite in national standard clay minerals. China Sci. Technol. Expo 2010, 22, 1. [Google Scholar]
  82. Zheng, X. Mineral Matter in Lopingian Coals from Eastern Yunnan Province and Its Response to the Regional Geological Evolution. Ph.D. Thesis, China University of Mining and Technology, Beijing, China, 2018. [Google Scholar]
  83. Zhao, M.L.; Xiang, L. Analysis of atomic thermal vibration of powder crystals MgF2 and SrF2 by Rietveld refinement method. J. At. Mol. Phys. 2014, 31, 982–986. [Google Scholar]
  84. Xiang, L.; Zhao, M.L.; Li, P.F.; Sakuma, T. Research on atomic thermal vibration of crystalline silicon at different temperatures. J. Inn. Mong. Univ. Natl. Nat. Sci. Ed. 2015, 30, 185–187, 277. [Google Scholar]
  85. Dai, S.F.; Finkelman, R.B.; French, D.; Hower, J.C.; Graham, I.T.; Zhao, F.H. Modes of occurrence of elements in coal: A critical evaluation. Earth Sci. Rev. 2021, 222, 103815. [Google Scholar] [CrossRef]
  86. Karayiğit, A.I.; Mastalerz, M.; Oskay, R.G.; Buzkan, I. Bituminous coal seams from underground mines in the Zonguldak Basin (NW Turkey): Insights from mineralogy, coal petrography, Rock-Eval pyrolysis, and meso-and microporosity. Int. J. Coal Geol. 2018, 199, 91–112. [Google Scholar] [CrossRef]
  87. Valentim, B.; Couto, H.; French, D.; Golding, S.D.; Guimarães, F.; Guedes, A.; O’Keefe, J.M.K.; Raymond, A.L.; Santos, C.; Valian, A.; et al. Could hot fluids be the cause of natural pyrolysis at the ragged edge of Herrin coal, Millport 7 ½’ quadrangle, Hopkins County, Kentucky? Int. J. Coal Geol. 2020, 231, 103603. [Google Scholar] [CrossRef]
Figure 1. SEM back-scattered electron images of minerals in coal samples: (A) kaolinite as cell-fillings in sample TN-10; (B) chlorite in sample SB-6; (C) anatase, calcite and albite in sample ZT-11; (D) EDS data and spectrum for point 1 and 2 in C; (E) apatite and quartz in sample SB-6; (F) EDS data and spectrum for point in E; (G) illite, pyrite and quartz in sample ZT-2; (H) EDS data and spectrum for point in G. Ab, albite; Cal, calcite; Ant, anatase; Ap, apatite; Qtz, quartz; Ill, illite; Py, pyrite.
Minerals 12 01119 g001
Figure 2. Relation between working power and its corresponding temperature in the ashing chamber. (A) The red, green, blue and purple circles are the value of temperatures monitored at 100 W, 200 W, 300 W and 400 W, respectively. (B) The black squares are the averages of the temperatures.
Minerals 12 01119 g002
Figure 3. Relationship between ashing time and LMS of the coal samples by different powers using IoN 40 asher. (A) HW-3. (B) SB-6. (C) TN-9. (D) TN-10. (E) ZT-2. (F) ZT-11.
Minerals 12 01119 g003
Figure 4. The color changes of coal surface in samples HW-3, TN-9, ZT-2 and GQ-5 after the first ashing at the two ashers. (A) by IoN 40-B program; (B) by K1050X-E program.
Minerals 12 01119 g004
Figure 5. XRD patterns of raw coal samples and LTAs by varied programs. (A,B) raw coal samples of TN-9 and ZT-2; (CH) LTAs of coal samples obtained by varied programs. Kln: kaolinite. Chl: chlorite. Qtz: quartz. Cal: calcite. Py: pyrite. Ab: albite. Dol: dolomite. Ant: anatase. Ap: apatite. Ill: illite.
Minerals 12 01119 g005
Figure 6. XRD patterns of sample TN-10 ashed by plasma ashers IoN 40 (Program B) and K1050X. Kln: kaolinite. Qtz: quartz. Cal: calcite. Py: pyrite. Ab: albite. Dol: dolomite.
Minerals 12 01119 g006
Figure 7. The variation in LMS of the samples GQ-9 (A) and 10 (B) by the ashers IoN 40 and K1050X.
Minerals 12 01119 g007
Figure 8. (A) comparison of the low- and high-temperature ash yields; (BF) observed normalized oxide percentages from chemical analysis (x-axis) to oxide percentages for sample ash inferred from XRD data (y-axis). The diagonal line in each plot indicates equality. LTA, low-temperature ash yield; HTA, high-temperature ash yield.
Minerals 12 01119 g008
Figure 9. SEM back-scattered electron images of minerals in sample TN-10: (A) pyrite and dolomite; (B) EDS data and spectrum for point in A. Dol, dolomite; Py, pyrite.
Minerals 12 01119 g009
Table 1. Operating parameters of the two plasma ashers.
InstrumentIoN 40K1050X
Parameter settingsOxygen flow rate (mL/min)15020
Power (W)0~60075
Each ashing time (h)99
Pressure500 mTorr6 × 10−1 mbar
Table 2. Working chamber temperature monitored under different operating power in IoN 40 Plasma Asher.
Power (W)Temperature (°C)Average (°C)
100 (A)85, 87, 89, 90, 87, 8988
200 (B)120, 118, 122, 121, 122, 121121
300 (C)152, 148, 149, 150, 147, 148149
400 (D)179, 177, 176, 178, 175, 177177
Margin of error of 2 °C.
Table 3. Proximate and ultimate analyses (%), forms of sulfur (%) and vitrinite random reflectance (%) of the coal samples.
SampleMadAdVdafCdafHdafNdafSt,dSp,dSs,dSo,dRo,ran
TN-91.10 6.10 26.53 76.65 3.86 0.95 1.03 0.54 0.011 0.48 0.57
TN-101.32 15.17 41.84 80.15 4.90 1.33 1.20 0.78 0.008 0.41 0.61
ZT-20.79 14.93 31.31 82.91 4.51 1.16 5.33 2.89 0.070 2.36 0.67
ZT-110.75 13.37 28.58 85.55 3.89 0.83 0.40 ---0.70
SB-66.30 5.26 38.86 73.64 4.69 0.80 0.32 ---0.56
HW-38.09 6.79 48.07 68.18 4.95 1.00 0.29 ---0.54
GQ-40.32 14.83 15.30 90.693.791.543.31 0.15 0.003 3.16 1.82
GQ-50.31 12.20 14.77 90.203.821.513.57 0.08 0.003 3.48 1.76
M, moisture; A, ash yield; V, volatile matter content; C, carbon; H, hydrogen; N, nitrogen; St, total sulfur; Sp, pyritic sulfur; Ss, sulfate sulfur; So, organic sulfur; ad, air-dry basis; d, dry basis; daf, dry and ash-free basis; -, no data; Ro, ran, average vitrinite random reflectance. GQ-4,5, from unpublished data.
Table 4. The percentages of major-element oxides in the coal samples (%, ash basis).
SampleLOISiO2TiO2Al2O3Fe2O3MnOMgOCaONa2OK2OP2O5
TN-993.9052.300.8021.0914.970.040.167.782.760.030.07
TN-1084.8320.840.388.0911.260.372.9155.270.830.010.03
ZT-285.0751.530.8114.5827.550.060.303.630.830.670.05
ZT-1186.6333.050.619.710.050.300.8654.750.590.020.06
SB-694.7450.200.6916.046.800.021.0419.592.170.183.27
HW-393.2190.840.154.231.730.010.152.400.350.040.10
GQ-485.1732.130.4624.610.260.390.2741.330.410.110.02
GQ-587.8037.990.2930.441.020.280.3928.950.510.110.03
LOI, loss-on-ignition (%).
Table 5. The LTAs yield (%) of coal samples obtained by the different programs of two ashers.
SampleIoN 40-AIoN 40-BIoN 40-CIoN 40-DK1050X-E
TN-97.587.447.467.407.43
TN-1020.6219.5819.6819.6419.60
ZT-219.6415.2315.5515.5815.29
ZT-1117.7017.4817.3917.3317.43
SB-66.276.276.206.076.27
HW-39.539.069.108.949.02
GQ-418.6415.9116.3316.0815.71
GQ-515.9513.5813.9613.4913.63
Table 6. Mineral compositions of LTAs determined by XRD and Siroquant (wt%, on organic matter-free basis).
SampleAsherProgramQtzKlnCalPyDolApAntIllAbChl
TN-9IoN 40A30.528.415.113.7 12.3
B20.428.012.624.51.1 13.4
C21.926.819.426.3 5.6
D33.630.918.715.6 1.2
K1050XE22.727.615.622.53.8 7.8
TN-10IoN 40A4.211.164.87.74.6 7.6
B6.213.555.812.510.5 1.5
C5.712.658.312.75.2 5.5
D5.211.970.92.79.3
K1050XE6.613.552.816.59.3 2.3
ZT-2IoN 40A28.731.915.419.8 4.2
B24.129.95.033.3 7.7
C19.932.77.423.6 16.4
D46.420.714.810.8 7.3
K1050XE25.527.67.529.9 8.70.8
ZT-11IoN 40A23.921.854.3
B14.716.362.1 5.7 1.2
C18.413.866.5 1.3
D22.512.365.2
K1050XE17.116.460.4 3.6 2.5
SB-6IoN 40A28.830.219.815.4 5.8
B24.828.722.58.5 8.1 7.4
C22.133.925.56.2 10.3 2.0
D29.724.229.312.2 4.6
K1050XE23.929.225.77.8 6.4 7.0
HW-3IoN 40A89.32.76.21.8
B82.310.03.83.9
C80.99.37.32.5
D95.11.71.22.0
K1050XE84.38.03.24.5
GQ-4IoN 40A 61.238.8
B2.543.052.7 1.8
C1.253.045.8
D 51.748.3
K1050XE1.845.750.3 2.2
GQ-5IoN 40A6.243.848.81.2
B2.151.842.71.91.5
C3.647.546.02.9
D9.039.951.1
K1050XE2.250.644.92.3
Qtz, quartz. Kln, kaolinite. Cal, calcite. Py, pyrite. Dol, dolomite. Ap, apatite. Ant, anatase. Ill, illite. Ab, albite. Chl, chlorite.
Table 7. The rank of the coal samples and their ashing time (h) in program B.
SampleRank of the CoalAshing Time
TN-9high volatile bituminous coal18~27
TN-10high volatile bituminous coal27~36
ZT-2high volatile bituminous coal27~36
ZT-11high volatile bituminous coal18~27
SB-6high volatile bituminous coal27~36
HW-3high volatile bituminous coal27~36
GQ-4low volatile bituminous coal45~54
GQ-5low volatile bituminous coal45~54
Publisher’s Note: MDPI stays neutral with regard to jurisdictional claims in published maps and institutional affiliations.

