Article

Characteristics of Coal Slurry Aggregate Induced by Inorganic Salts

Department of Mining Engineering, Taiyuan University of Technology, Taiyuan 030024, China
*
Author to whom correspondence should be addressed.
Minerals 2022, 12(9), 1100; https://doi.org/10.3390/min12091100
Submission received: 12 August 2022 / Revised: 26 August 2022 / Accepted: 27 August 2022 / Published: 29 August 2022
(This article belongs to the Section Mineral Processing and Extractive Metallurgy)

Abstract

:
The impact of coagulant type and dosage on the clarity, zeta potential, floc size, and floc structure of a coal slurry suspension was investigated. The results showed that the critical coagulation concentrations of trivalent ions are 0.81 mM and 0.018 mM for coal–coal and coal–kaolinite, respectively, which are lower than those of divalent ions. The initial settling was more affected by AlCl3 and FeCl3 than MgCl2 and CaCl2, while the supernatant turbidity was significantly decreased at a lower dosage (0.06 mM) for trivalent ions, consistent with the classical Derjaguin–Landau–Verwey–Overbeek theory, zeta potential results, and adsorption behaviors of quartz crystal microbalance with dissipation. The floc size and settling rate induced by AlCl3 and FeCl3 were greater than those of divalent ions at lower concentrations and tended to have an irregular and porous structure, enhancing the coagulation effect. The findings highlight the differences in the physical characteristics of floc size and structure in optimizing the coagulation process produced by electrical neutralization and sweep-floc coagulation of amorphous metal hydroxide precipitates.

1. Introduction

Coagulation is a process in water treatment for removing suspended colloidal particles by combining individual particles into aggregates [1,2,3,4]. The coagulants depress or destroy repulsive forces, often arising from long-range electrostatic, steric, electrostatic, and/or short-range hydration forces. The attractive van der Waals forces become predominant and are able to bring and hold the particles together [5,6,7]. In this process, inorganic multivalent cations (mainly Mg2+, Ca2+, Al3+, and Fe3+) are commonly used [8,9,10,11]. A series of soluble hydrolysis species are formed when a coagulant is added to wastewater with positive charges and can adsorb on the surface of colloidal particles and destabilize the colloidal particles, forming agglomerates [12]. At sufficiently enough coagulant dosages, a precipitate is generated by a trivalent cation, which can sweep colloidal particles from the suspension and provide clean water [13]. Furthermore, many irregular and porous structure aggregates are generated and progressively become stable under hydraulic shear, before settling and dewatering in the thickener and filter [14,15].
Although the use of inorganic coagulants has significantly increased, studies on coagulation processes and floc structure have not been well established with the earlier conceptual models. The comparative behaviors of traditional metal coagulants, such as calcium and alum, should be more clearly related to the mechanism and model, in both qualitative and quantitative aspects. The Derjaguin–Landau–Verwey–Overbeek (DLVO) theory, which deals with the electrical double-layer and physical interactions and model, has been applied to conventional coagulation chemicals and processes [16,17]. The chemical aspect of coagulation has been integrated with a model based on the chemical behavior of soluble and insoluble hydroxide in these cases, and the DLVO theory has been used as a qualitative background for the coagulation model. However, only a few studies have applied the DLVO model quantitatively to the particle aggregation phase after charge neutralization [18].
Generally, floc properties, such as size distribution, density, and settling velocity, are powerful parameters used to measure the degree of coagulation [3,19], and they depend on factors such as mineralogy, coagulant, internal shear, and sediment concentration [20,21]. However, the flocs will be broken into smaller aggregates under hydraulic shear, which will result in lower removal efficiencies [22,23]. Therefore, the fragile nature of flocs requires in situ sampling to accurately characterize their properties under field conditions, and in situ settling velocities are obtained using gravimetric analysis, optical methods, acoustic-based Reynolds flux [24], and imaging [25,26]. One advantage of the imaging method is that floc size and settling velocity are collected concurrently for individual particles; this will not lead to mechanical or fluent rupture, and the floc density can be estimated using the Stokes settling or modifications of the drag relationship for higher Reynolds numbers.
The critical coagulation concentration (CCC) was determined using the interaction energy in this study, and the adhesive behavior of coagulants on carbon was examined experimentally using quartz crystal microbalance with dissipation (QCM-D). Following that, an in situ image analysis method was used to examine particle aggregation under different coagulants, CCC doses, and floc structures. As a result, a qualitative and semi-quantitative comparison of inorganic multivalent cation-affected floc structure was obtained, which may be quantitatively evaluated for coagulation performance.

2. Materials and Methods

2.1. Theoretical Calculation

The classical DLVO theory assumes that colloidal interaction forces are the sum of van der Waals forces and electrical double-layer forces [16,18]. For two identical spherical particles, these forces are always defined as attraction and repulsion, respectively. Dispersed particles aggregate or remain stable, depending on whether attraction or repulsion predominates. Considering spherical particles in a liquid medium at a sufficiently high electrolyte concentration, the van der Waals energy can be expressed as:
V v d w = A a 12 H
where A is the Hamaker constant of the interacting media (coal–water–coal, coal–water–kaolinite, kaolinite–water-kaolinite), a is the particle radius, H is the distance of closest approach between the particles and is much smaller than the particle radius (21.81 μm), H«a.
The electrostatic double-layer energy is shown as:
V D L = 64 n 0 k T a κ 2 tan h 2 ( z e ψ 0 4 k T ) exp ( κ H )
where n0 is the bulk ion concentration, k and T are the Boltzmann constant and the absolute temperature, z is the ion valence, e is the elementary charge, ψ0 is the surface potential, and κ is the Debye parameter,
κ = ( e 2 N A ε k T z i 2 c i ) 1 / 2
where ε and   ε 0 are the relative permittivity and permittivity of free space, respectively.
Although other interactions between the particles in the electrolyte suspension, such as hydration, hydrophobic, and steric forces, were examined, it was thought that the competing forces regulating particle aggregation were those quantified above [27]. The total interaction energy was calculated using the following equation:
V T = V v d w + V D L

2.2. Measurements of Coagulant Adsorption by QCM-D

Coagulant adsorption was measured using a QCM-D (E4) system (Q-sense, Gothenburg, Sweden). Quartz crystal oscillators (sensors) were customized amorphous carbon sensors with a diameter of 14 mm and a fundamental shear oscillation frequency of 5 MHz. Experiments were conducted with natural pH at 22 °C. All readings were performed at a constant flow rate of 0.15 mL/min of water from Milli-Q [28,29,30]. To determine the accurate amount of mass adsorbed on the sensors, modeling of the adsorbed mass was performed using the Voight model, provided in the QCM-D software (Q-tool) [31,32].
The QCM-D response is sensitive to any mass change in the quartz crystal. The density and thickness of the adsorbed layer affect the response as well as the viscoelastic properties of the adsorbed species [33]. For flat, uniform, and rigid films, the change in resonance frequency Δf = f − f0 is directly proportional to the adsorbed mass (Δm), which is normally referred to as the Sauerbrey equation [34].
Δ m = C n Δ f
where C is the mass sensitivity constant (17.7 ng/cm Hz at f =5 MHz) and n is the overtone number (1, 3, 5, 7, 9, …; the number of resonances for the output frequency of a quartz oscillator). Based on this relationship, a decreasing resonance frequency corresponds to proportional mass uptake on the crystal surface of the sensor [35].
In a QCM-D system, the dissipation of the sensors energy, D, results from the adsorption of a viscous or loose layer and is measured by:
D = E D 2 π E S
where ED is the energy dissipated during one oscillation and ES is the energy stored in the oscillating system. In the Voigt-based model, the frequency change (Δf) and energy dissipation (ΔD) of crystal oscillations in a QCM-D experiment are related to the physical parameters of the adsorbed film (e.g., thickness, viscosity, shear modulus, and density) [36]. In the calculation, the frequency and dissipation energy loss were used as model inputs, whereas the adsorbed layer was assumed to be uniform in thickness and density [37].

2.3. Coagulation Test and Floc Size, Structure Analysis

The coagulation test was conducted using a 250 mL beaker. The suspension was mixed at 500 rpm for 3 min after coagulation (MgCl2, CaCl2, AlCl3, and FeCl3 aqueous solutions) and then stirred slowly at 100 rpm for 10 min. The settled aggregated particles (flocs) were transferred for analysis, and the zeta potential of the suspension was measured after slow stirring for 20 min.
Floc size distribution and structural information of flocs were determined using particle image velocimetry (PIV, DENTIC) under natural light. The settled flocs were transferred into a cuboid plexiglass tank of dimensions 80 mm × 80 mm × 200 mm dropped in DI water by gravity. The sedimentation images were recorded and preprocessed using Dynamic and ImageJ software, and the floc size of Feret’s diameter, dF, was noted [38]. The position of each particle in 5-frame continuous photographs was determined by analyzing a series of images taken at the same interval during the sedimentation process. By calculating the centroid coordinates of each particle, the motion displacement Δl of the particles can be obtained, and the settling velocity is calculated by:
v i = Δ l Δ t
The average settling velocity of particles of various sizes was found by using continuous settling velocity for each of the successive two frames and the Stokes formula was used to compute the floc density:
Δ ρ = ρ f ρ w = 18 μ v i g D f 2
In this study, the Reynolds coefficient was ignored for the static settlement of the flocs. where ρ f is the effective density, ρ w   is the density of water, μ is the dynamic viscosity coefficient of deionized water (0.0010828 Pa · s), g is gravitational acceleration (9.81 m/s2), and Df is floc size.

3. Results and Discussion

3.1. Theoretical Calculation

The electrostatic double-layer force/energy depends on the concentration of the electrolyte, and critical CCC is one of the most significant characteristics of colloidal dispersions. It is defined as the minimum concentration of counterions required to induce coagulation of colloidal particles and is often applied to assess the status of colloidal dispersion.
The CCC calculation method is based on the interaction energies of two colloidal particles. The total interaction energy in DLVO theory is the summation of two energies.
V T = 64 n 0 k T a κ 2 tan h 2 ( z e ψ 0 4 k T ) exp ( κ H ) A a 12 H
The condition of CCC based on V max = 0 , consider
V T = 64 n 0 k T a κ 2 tan h 2 ( z e ψ 0 4 k T ) exp ( κ H ) A a 12 H = 0
d V T d H = A a 12 H 2 64 n 0 k T a κ tan h 2 ( z e ψ 0 4 k T ) exp ( κ H ) = 0
For the Equation (10) multiplied by 1 H leads to
64 n 0 k T a H κ 2 tan h 2 ( z e ψ 0 4 k T ) exp ( κ H ) A a 12 H 2 = 0
Equation (11) = (12), 64 n 0 k T a κ tan h 2 ( z e ψ 0 4 k T ) exp ( κ H ) = 64 n 0 k T a H κ 2 tan h 2 ( z e ψ 0 4 k T ) exp ( κ H ) , so
κ H = 1
put κ H = 1 into (10) leads to,
64 n 0 k T a κ 2 tan h 2 ( z e ψ 0 4 k T ) exp ( 1 ) A a 12 κ = 0
Therefore,
κ 3 = 768 n 0 k T exp ( 1 ) A tan h 2 ( z e ψ 0 4 k T )
For lower surface potential, ψ 0 = 14 mV < 25 mV , Equation (3) can be equal to:
κ = ( 1000 e 2 N A ε k T i z i 2 c i ) 1 2
where ε = ε 0 ε r = 8.854 × 10 12 × 78.5 = 6.95 × 10 10 F m ,   k   is   1.3805 × 10 23 J / K , T   is   298 K , e   is   1.602 × 10 19 C , N A   is   6.023 × 10 23 mol 1 . The inverse Debye parameters (double layer thickness) of the different electrolytes are shown in Table 1.
It can be observed from Table 2 that multivalent cations can compress the electrostatic double layer more rapidly than monovalent ions. Therefore, substituting Equation (15) in Equation (14) leads to:
( i z i 2 c i ) 3 = 79824 C 2 ε 3 k 5 T 5 A 2 e 6 N A tan h 4 ( z e ψ 0 4 k T )
For divalent ions (MgCl2 and CaCl2), Equation (16) can be changed as follows:
C = 370 ε 3 k 5 T 5 A 2 e 6 N A tan h 4 ( 2 e ψ 0 4 k T )
Similar, for trivalent ion (AlCl3 and FeCl3),
C = 49.2 ε 3 k 5 T 5 A 2 e 6 N A tan h 4 ( 3 e ψ 0 4 k T )
where A is the Hamaker constant of the interacting media with values 0.73 kT for coal in water, 32.23 kT for kaolinite in water, and 4.83 kT for coal and kaolinite in water. On substituting these into Equations (17) and (18), the CCC of different electrolytes is shown in Table 2.

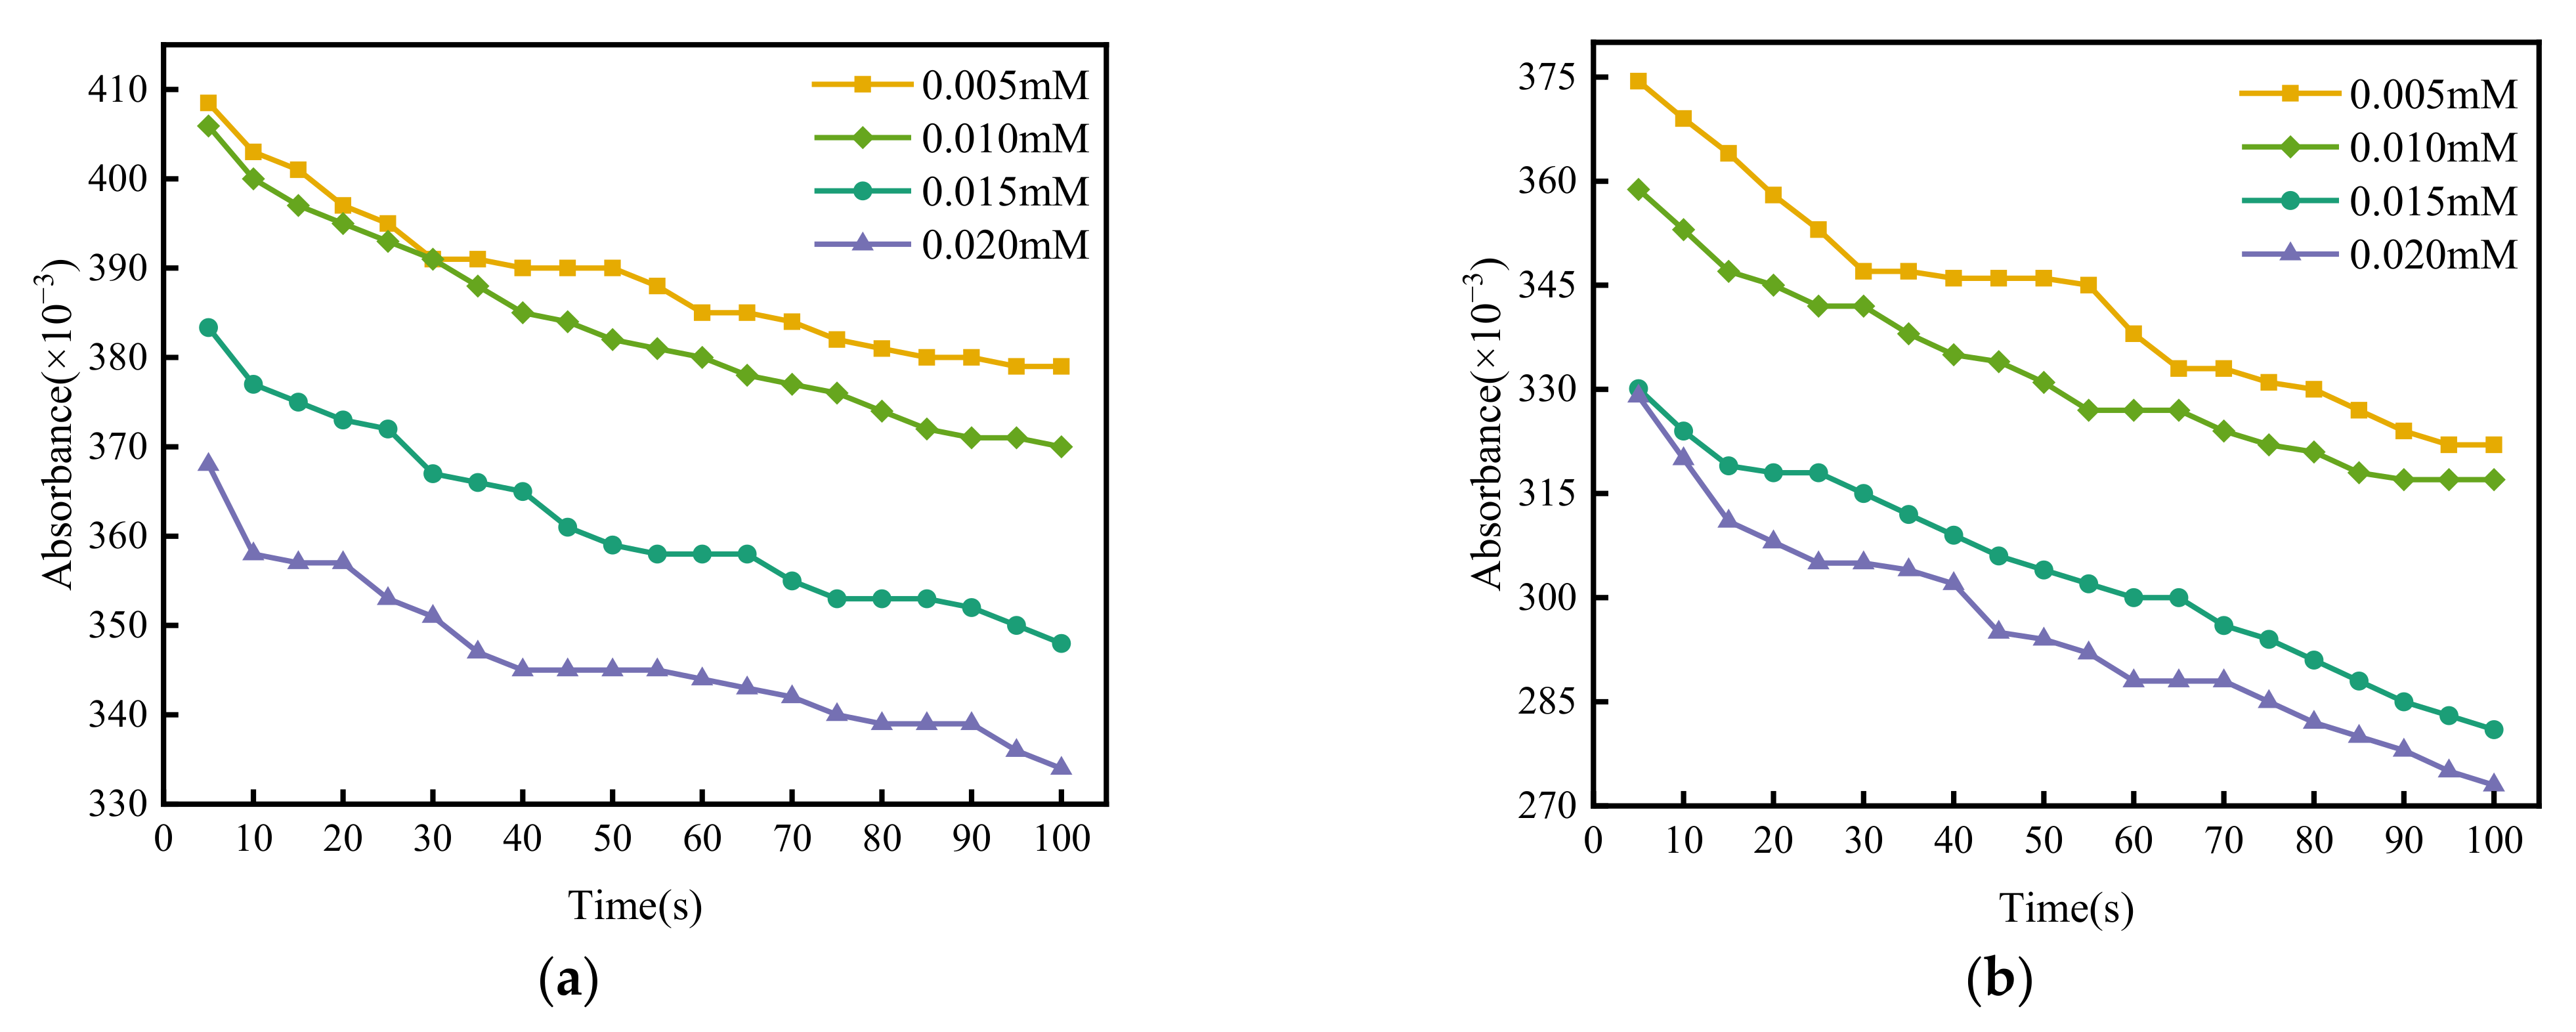
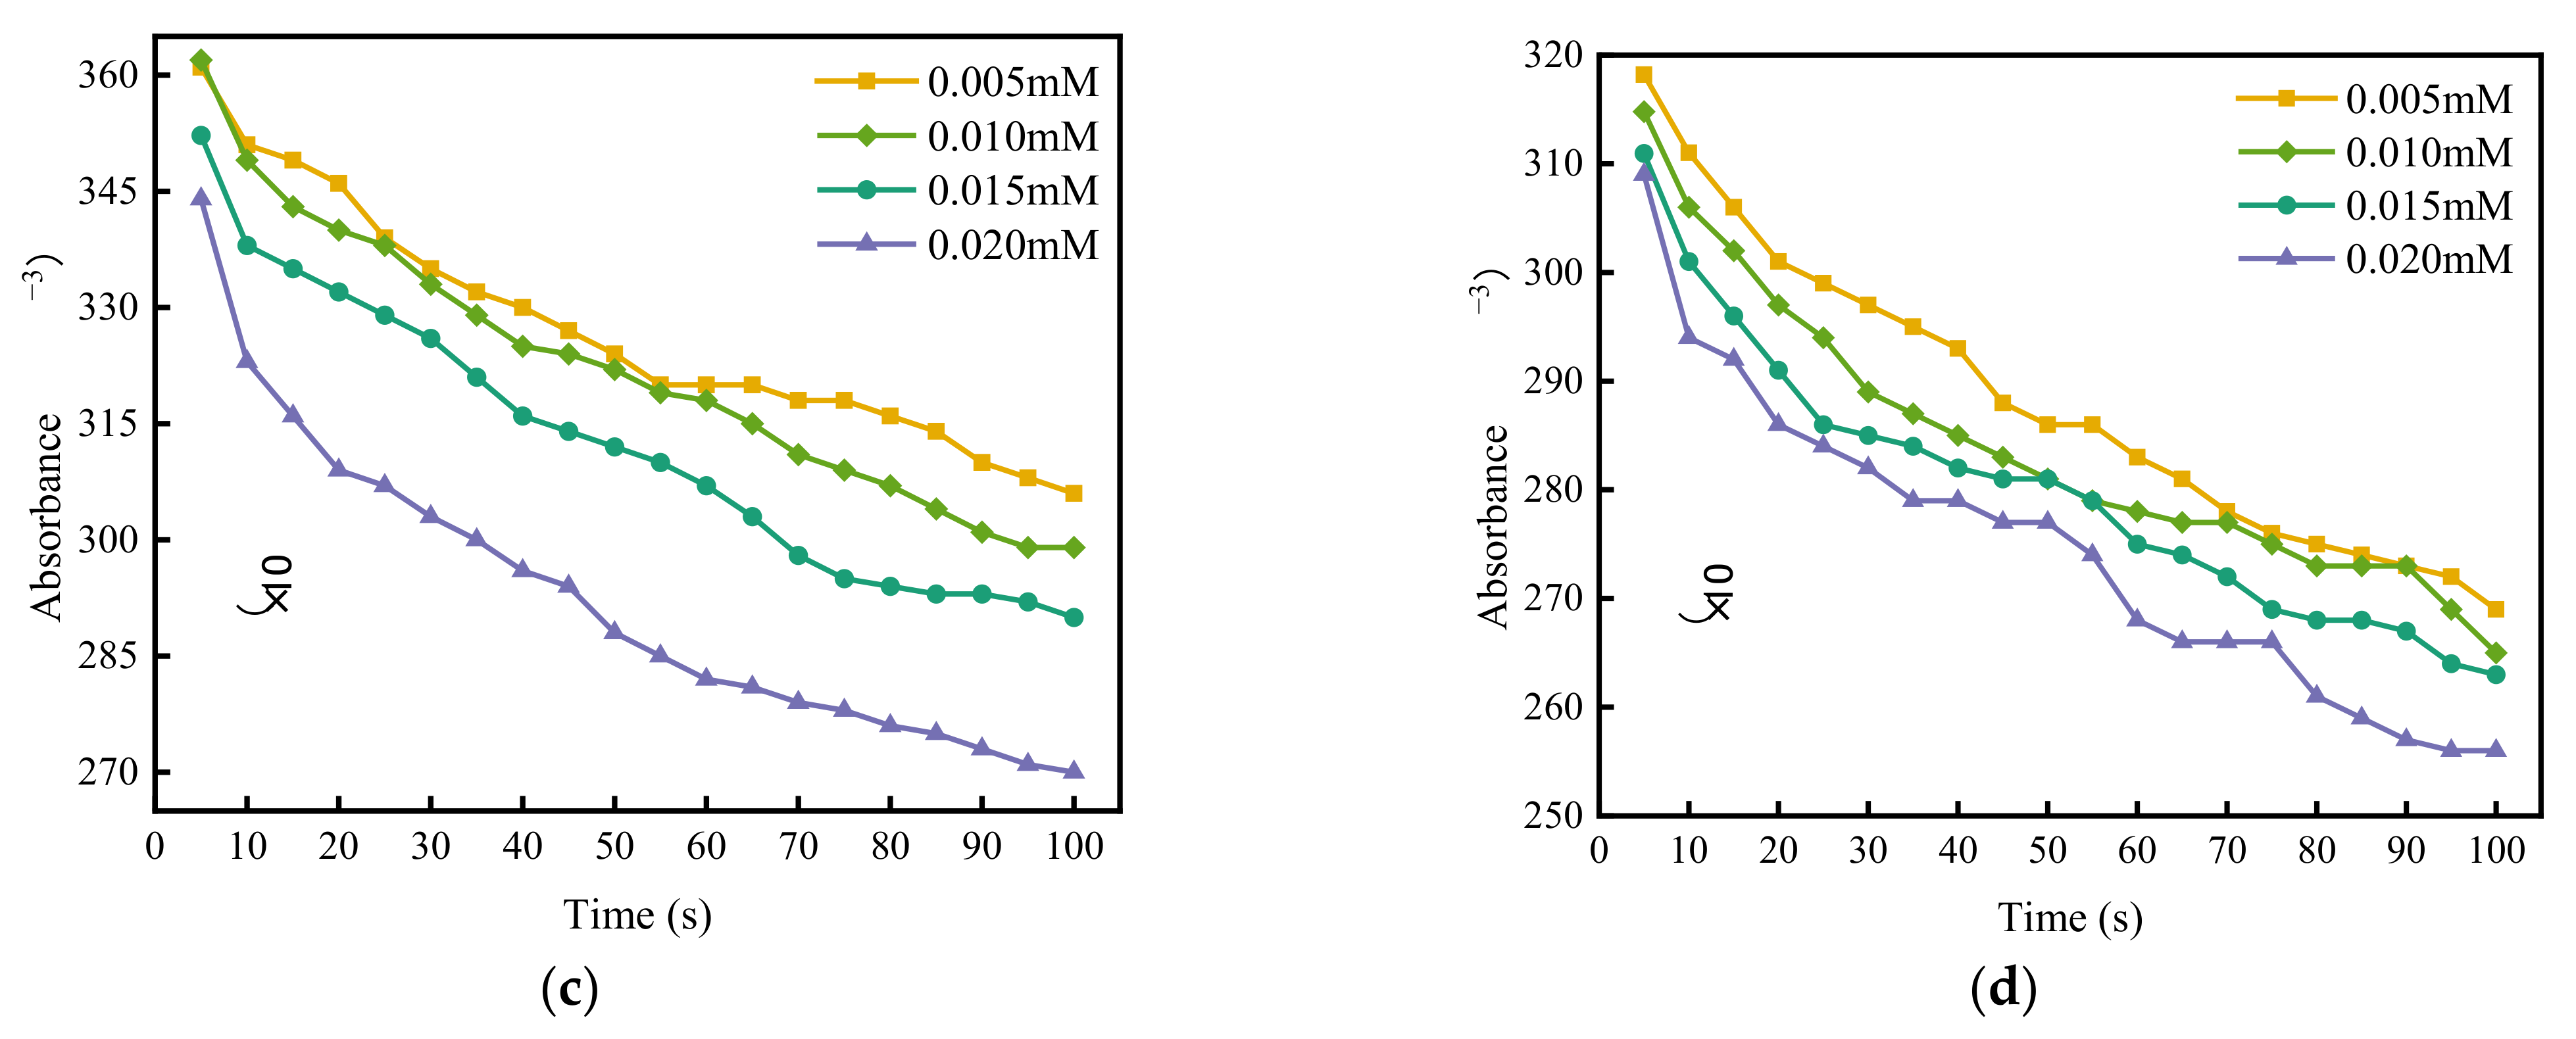
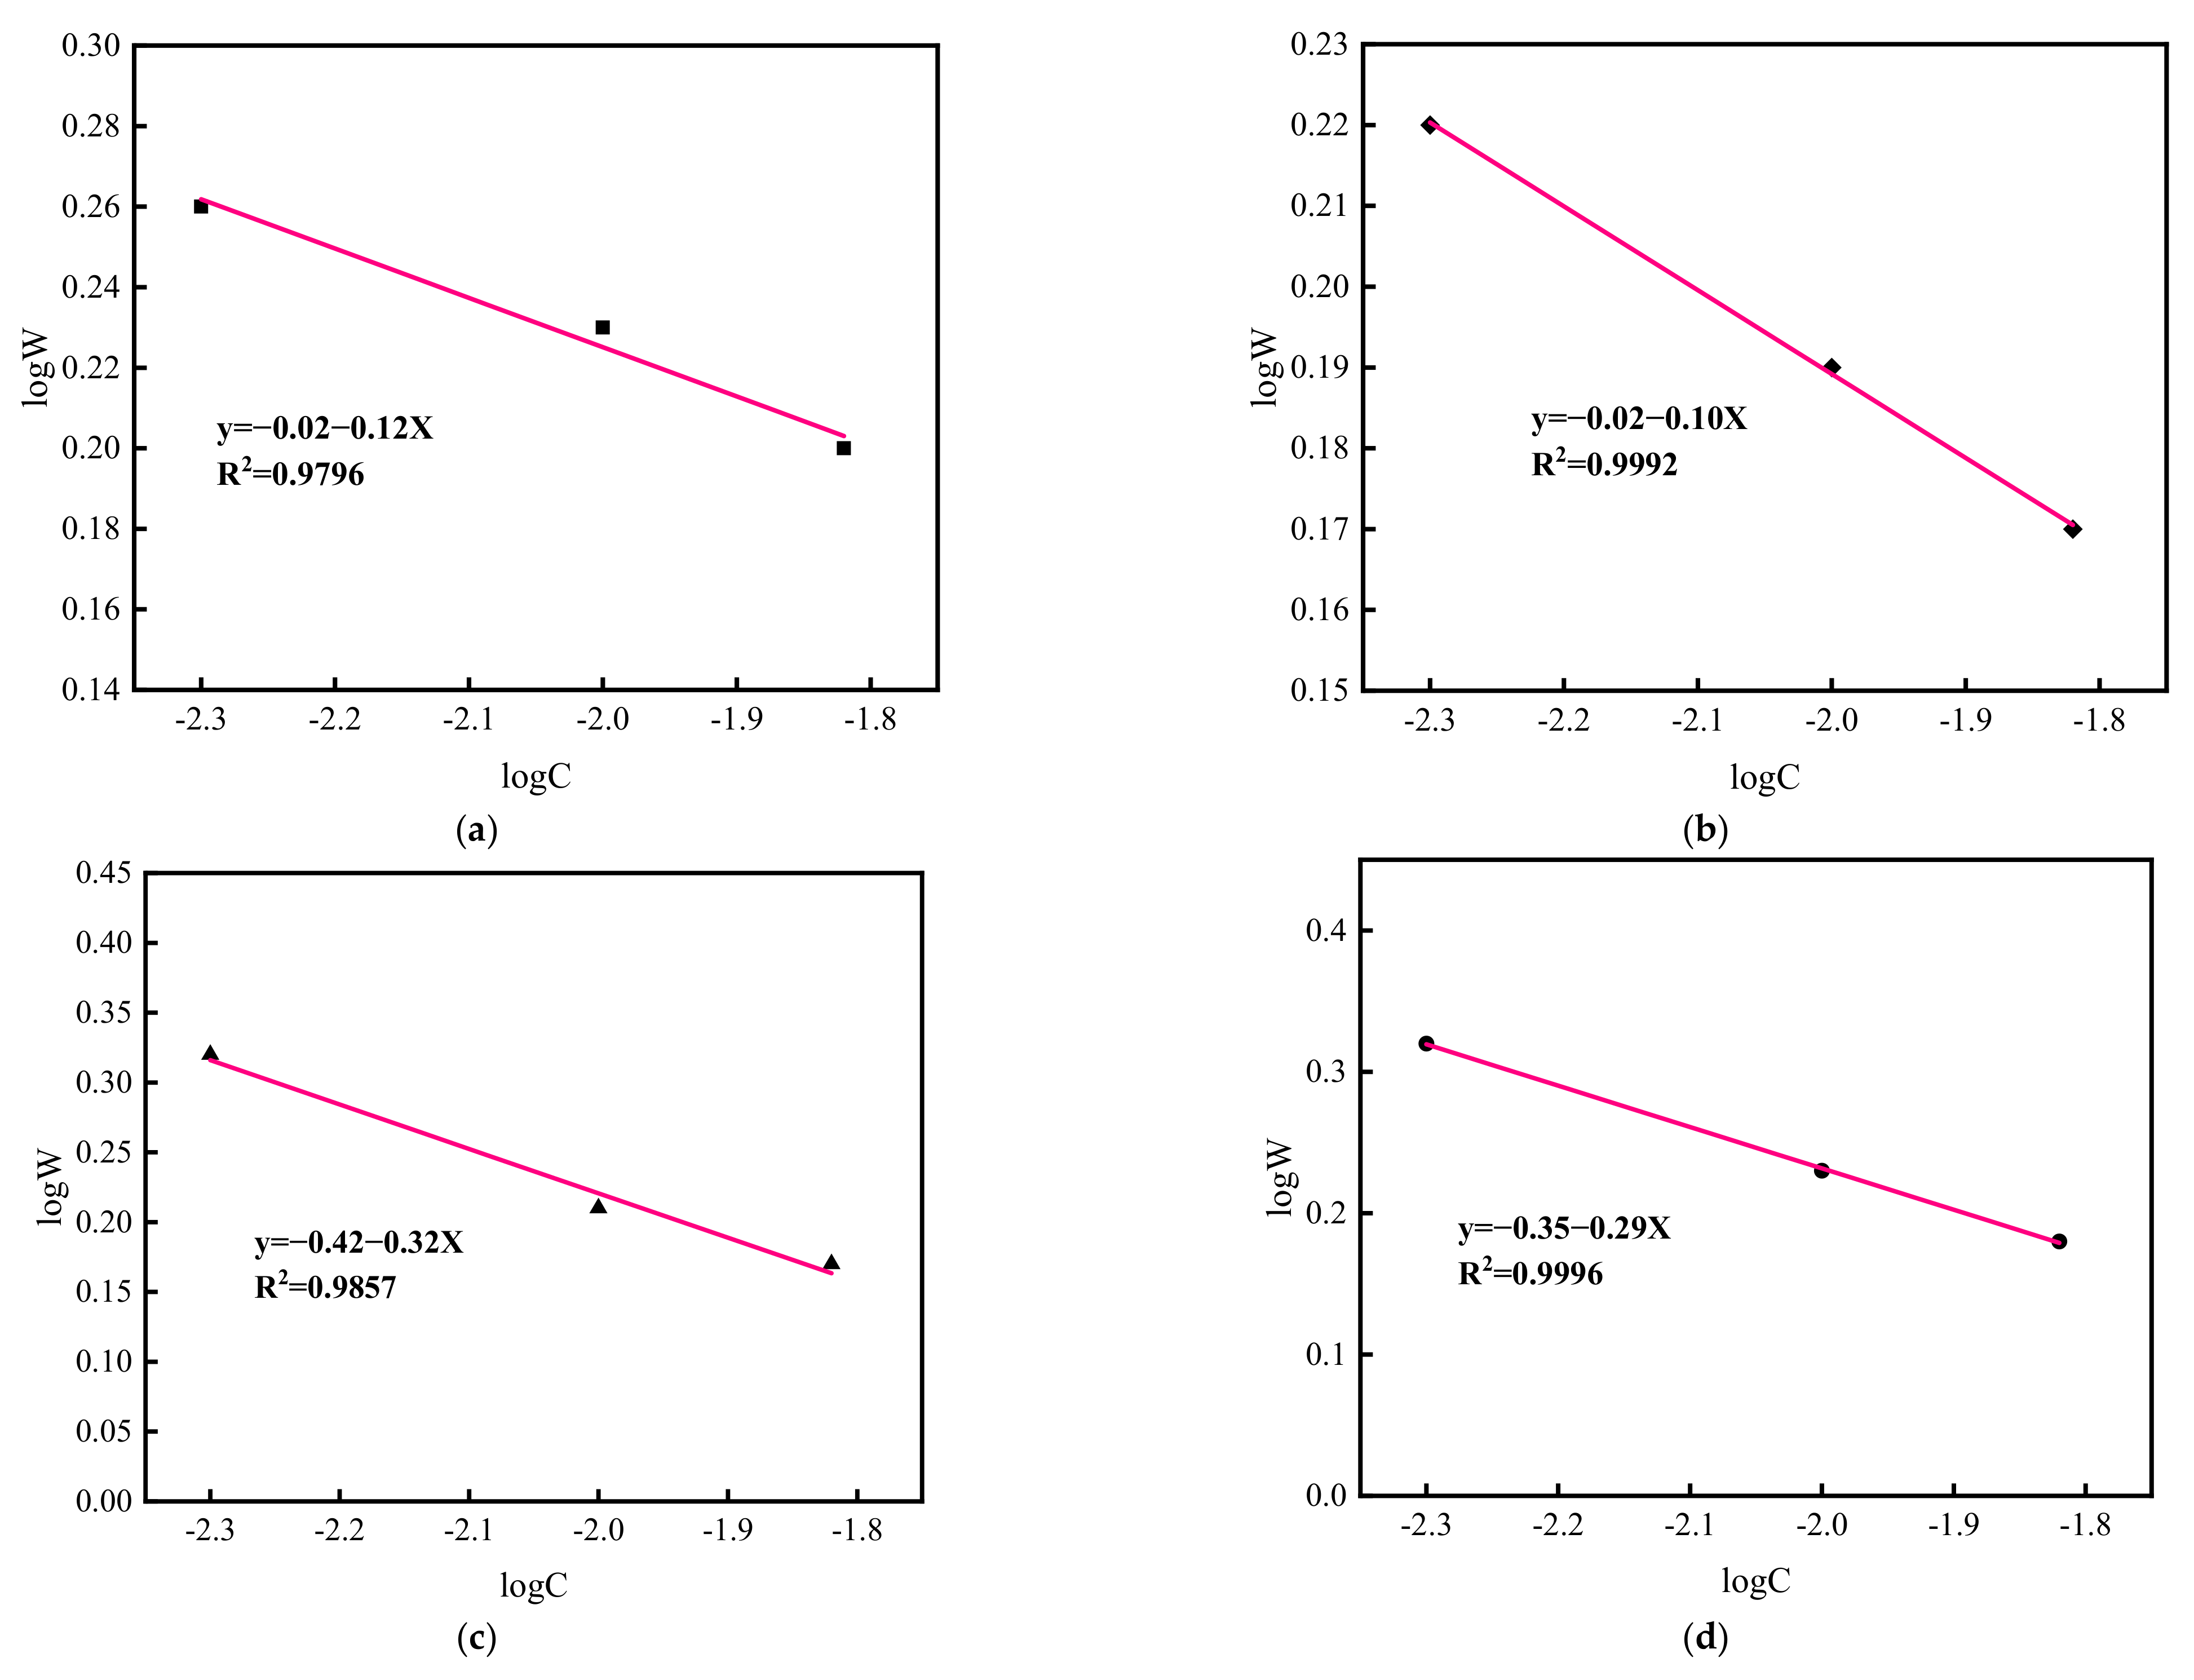
3.2. Critical Coagulation Concentrations
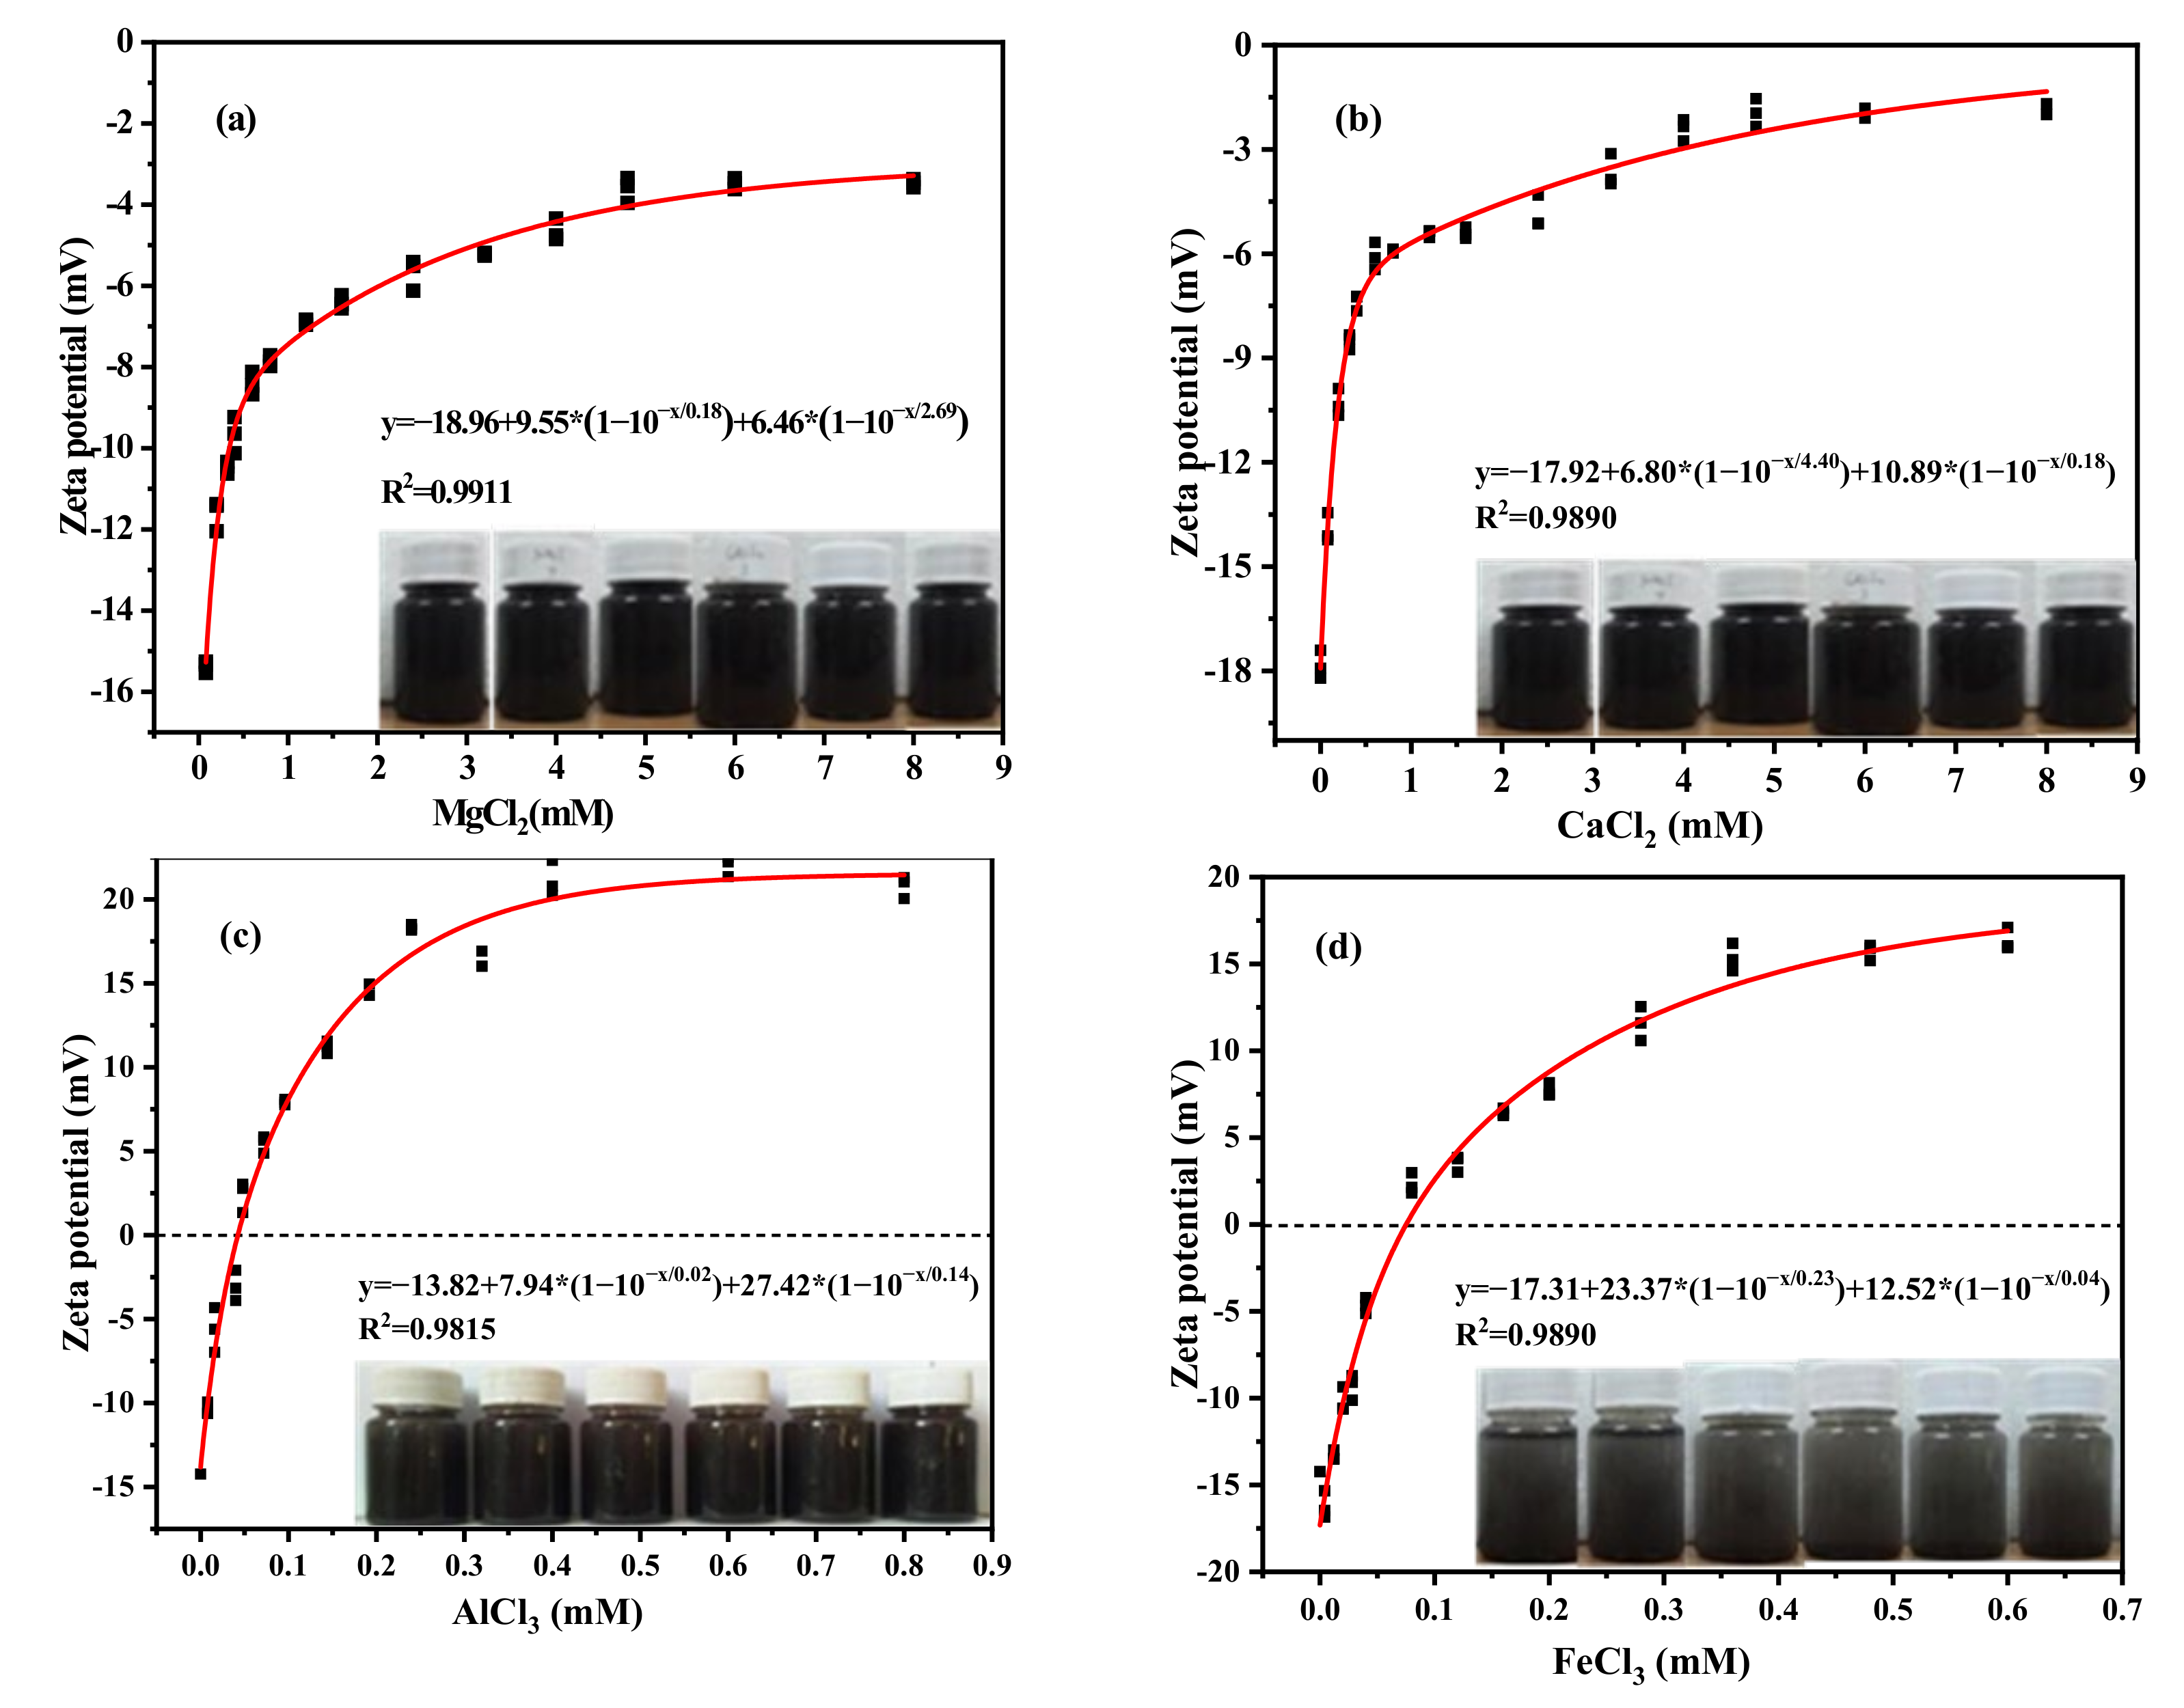
After adding coagulant with different concentrations into a coal slurry, the absorbance of the solution changed with time as shown in Figure 1.
According to the spectrophotometric method, make a tangent to the initial point of each curve in Figure 2. The maximum tangent slope is taken as the fast coagulation rate constant Kf, and the remaining tangent slopes are taken as the slow coagulation rate constant Ks. The ratio of Kf to Ks is the value of the stability factor W under different coagulant concentrations, and then logW is plotted with logC of coagulant concentrations, as shown in Figure 2. The intersection of the fitting line and the abscissa is the logarithm of the CCC values, which are −0.17, −0.2, −1.31, and −1.21, respectively, i.e., 0.68 mM, 0.63 mM, 0.05 mM, and 0.06 mM.

3.3. Zeta Potential

Coal slurry is a complex mixture with multiple components and phases, in which the colloidal particles are coagulated and aggregated through the action of charge neutralization, patch aggregation, bridge connection, and sweep flocculation in series or synchronously for negatively charged particles resulting from the existence of preferential dissociation (or dissolution), adsorption and ionization, lattice substitution, and other phenomena [39,40]. Although it is difficult to separate these mechanisms throughout the aggregation process, analyzing zeta potential variation and particle removal as a function of coagulant dosage might provide some insight [41].
As shown in Figure 3, similar charge properties were observed upon injection of Mg2+, Ca2+, Al3+, and Fe3+. However, the zeta potential always remained negative, even when the dosage of Mg2+ and Ca2+ increased to 4.8 mM, and reached zero with an increase in concentration. However, the zeta potential could be reversed when the concentrations of Al3+ and Fe3+ were 0.048 mM and 0.072 mM, respectively. These results are in agreement with the CCC calculation results. Under electrical neutralization of cations, the surface potential can be compressed and lowered rapidly; the dosage magnitudes of Mg2+ and Ca2+ were 0.66 mM and 0.60 mM, respectively, corresponding to 1.35 mM. (coal–coal)~ and 0.031 mM (coal–kaolinite), and the magnitude of Al3+ and Fe3+ (0.05 mM, 0.06 mM) on surface charge condition of zero were in the range of 0.81 mM (coal–coal)~0.018 mM (coal–kaolinite). With an increase in the amount of Al3+ and Fe3+, the zeta potential of the particles rapidly shifted into the positive zone. The transmittance of the suspension also increased and then decreased because the particles were coated with more positive cations for precipitation, leading to strong repulsion and no aggregation at higher dosages. The following formula is obtained through data fitting:
y = a + b ( 1 e x / c ) +   d ( 1 e x / f )
a, b, c, d, and f were measured by test.
The inner were representative suspension pictures, in which the dosage of Mg2+ and Ca2+ both were 0.6, 1.6, 2.4, 3.2, 4.0, and 4.8 mM, while the dosage of Al3+ and Fe3+ both were 0.008, 0.024, 0.048, 0.072, 0.096, and 0.144 mM.

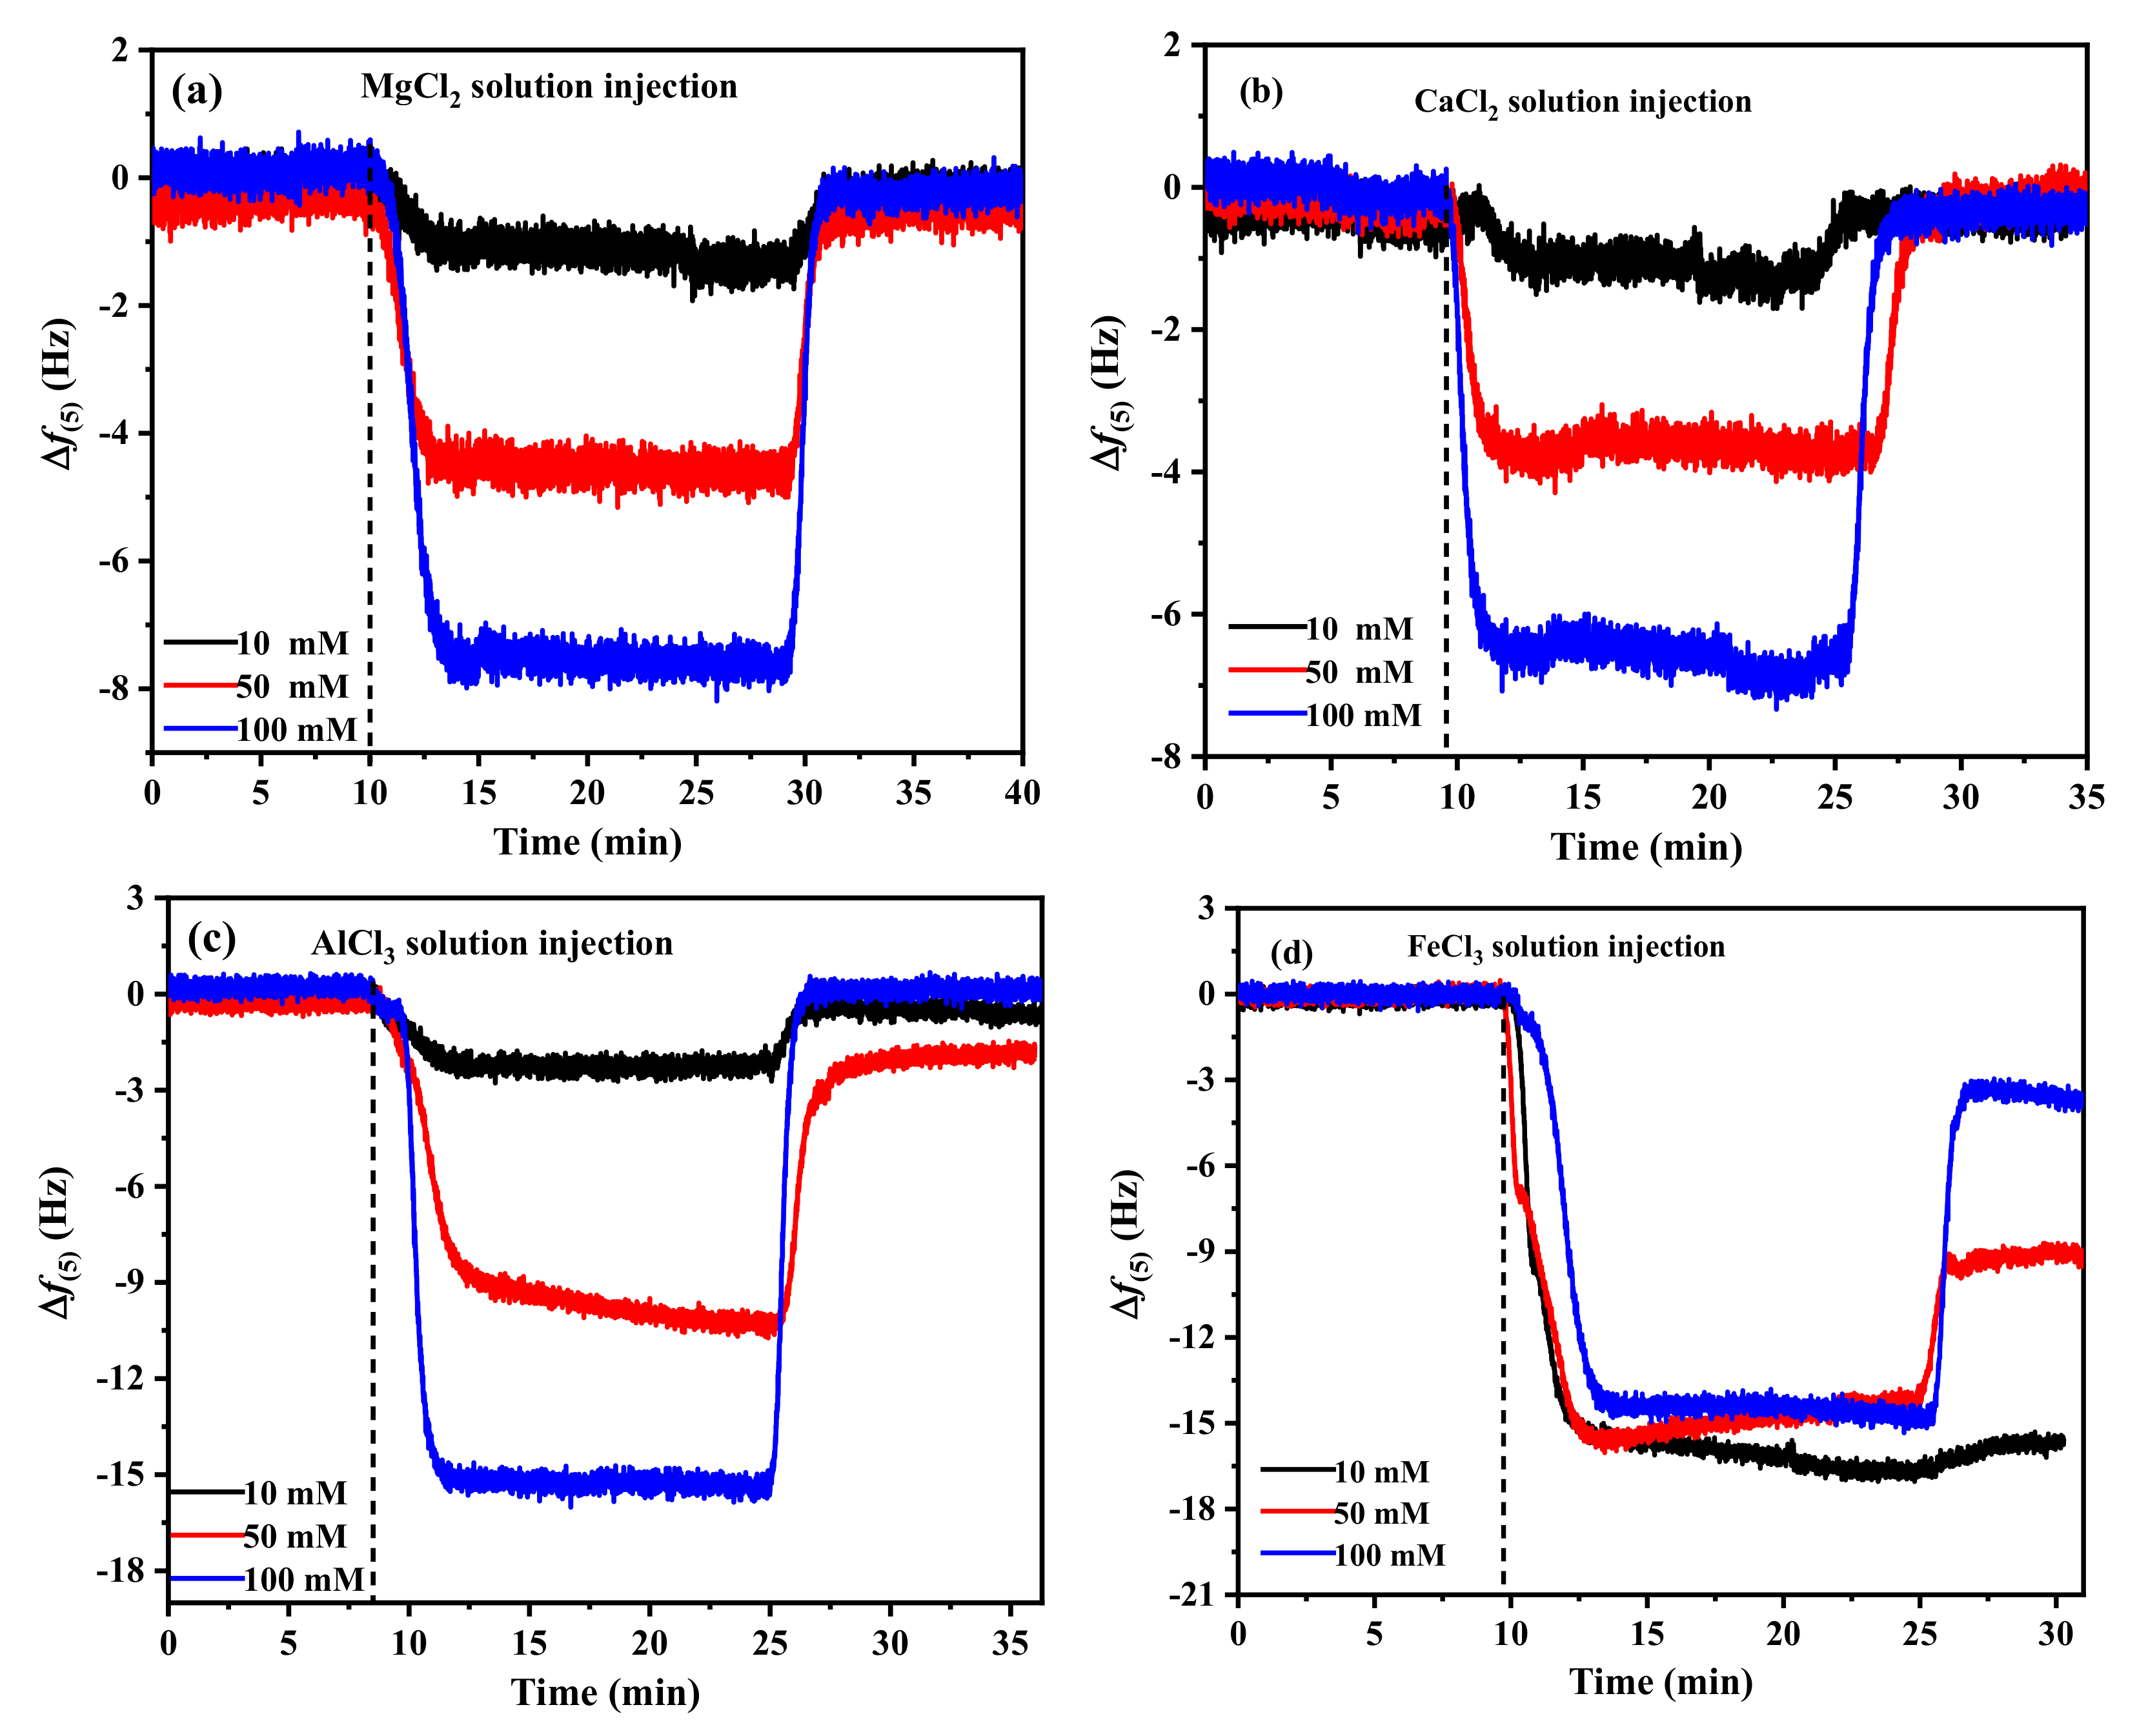
3.4. Coagulants Adsorption

The adsorption of coagulants on the carbon sensor was measured by QCM-D at natural pH with different coagulants (10 mM, 50 mM, 100 mM) [42,43,44]. The curves of Δf at the fifth overtone are shown in Figure 4. When the coagulant was injected, Δf decreased from the baseline. The near-steady-state Δf values for each concentration were obtained within a short time (5 min). The patterns of frequency and dissipation change with time at the three concentrations were similar. When higher concentrations of metal cations were injected, Δf decreased significantly. The values of Δf were ~1, ~4, and ~7 Hz in the MgCl2 and CaCl2 solutions at concentrations of 10 mM, 50 mM, and 100 mM, respectively, and all frequencies of Mg2+ were slightly larger than those of Ca2+. The frequency shift of Al3+ is larger than that of the divalent cations. The magnitude of Δf reached approximately 15 Hz at a concentration of 100 mM AlCl3. However, Figure 4d shows a rapid decrease in the frequency, accompanied by a rapid increase in dissipation, which was observed on switching to FeCl3 solution with a lower concentration of 10 mM. For the deposition of Fe3+ on the model coal surfaces, Δf became increasingly negative and reached ~16 Hz, indicating stronger and more significant effect adsorption of Fe3+ on the carbon sensor surface, which could be mainly due to electrostatic attraction between the cations and the negatively charged sensor. Washing the adsorbed layer with Milli-Q water after achieving equilibrium of adsorption resulted in complete desorption of Mg2+, Ca2+, and Al3+, but the partial desorption of Fe3+ means that there is not only electrostatic attraction but also a coordination complex generated in the solution [16,18].
A homogeneous viscoelastic film with shear viscosity, shear modulus, thickness, and density can be used to describe the adsorbed layer. The ΔD/Δf ratio is used to determine the adsorbed layer. Figure 5 shows plots of ΔD against Δf for the sixth overtone. For Mg2+ and Ca2+, the frequency shifts were less than 5 Hz, showing that this layer has a high degree of elasticity and can be considered hard. At different concentrations, the layers generated by Mg2+, Ca2+, and Al3+ were comparable, stiffer, and more compact than those formed by Fe3+. A higher ΔD/Δf ratio of Fe3+ corresponds to a relatively non-rigid open structure, which is steeper than other cations and gradually gentler with the increase in concentration [45]. Additionally, a change in the slope of ΔD/Δf for Fe3+ indicated coverage-induced structural changes in the adsorbed layer. A decrease in the slope indicated that the layer became more rigid owing to the increased packing density [37].
The maximum mass (mmax) of metal cations deposited on the sensor from different coagulant suspensions was obtained using the Sauerbery equation. The results in Table 3 showed a significant increase in mmax of cations deposition from 24.3 ng/cm2 to 186.2 ng/cm2, 20.5 ng/cm2 to 162.7 ng/cm2, 54.1 ng/cm2 to 339.8 ng/cm2, and 299.9 to 349.8 μg/cm2 in MgCl2, CaCl2, AlCl3, and FeCl3 solutions, respectively, with increasing concentration from 10 mM to 100 mM. This shows that Fe ions can be easily adsorbed on the sensor and reduce the surface charge at lower concentrations. Therefore, the sedimentation of the FeCl3 effect was better than others.

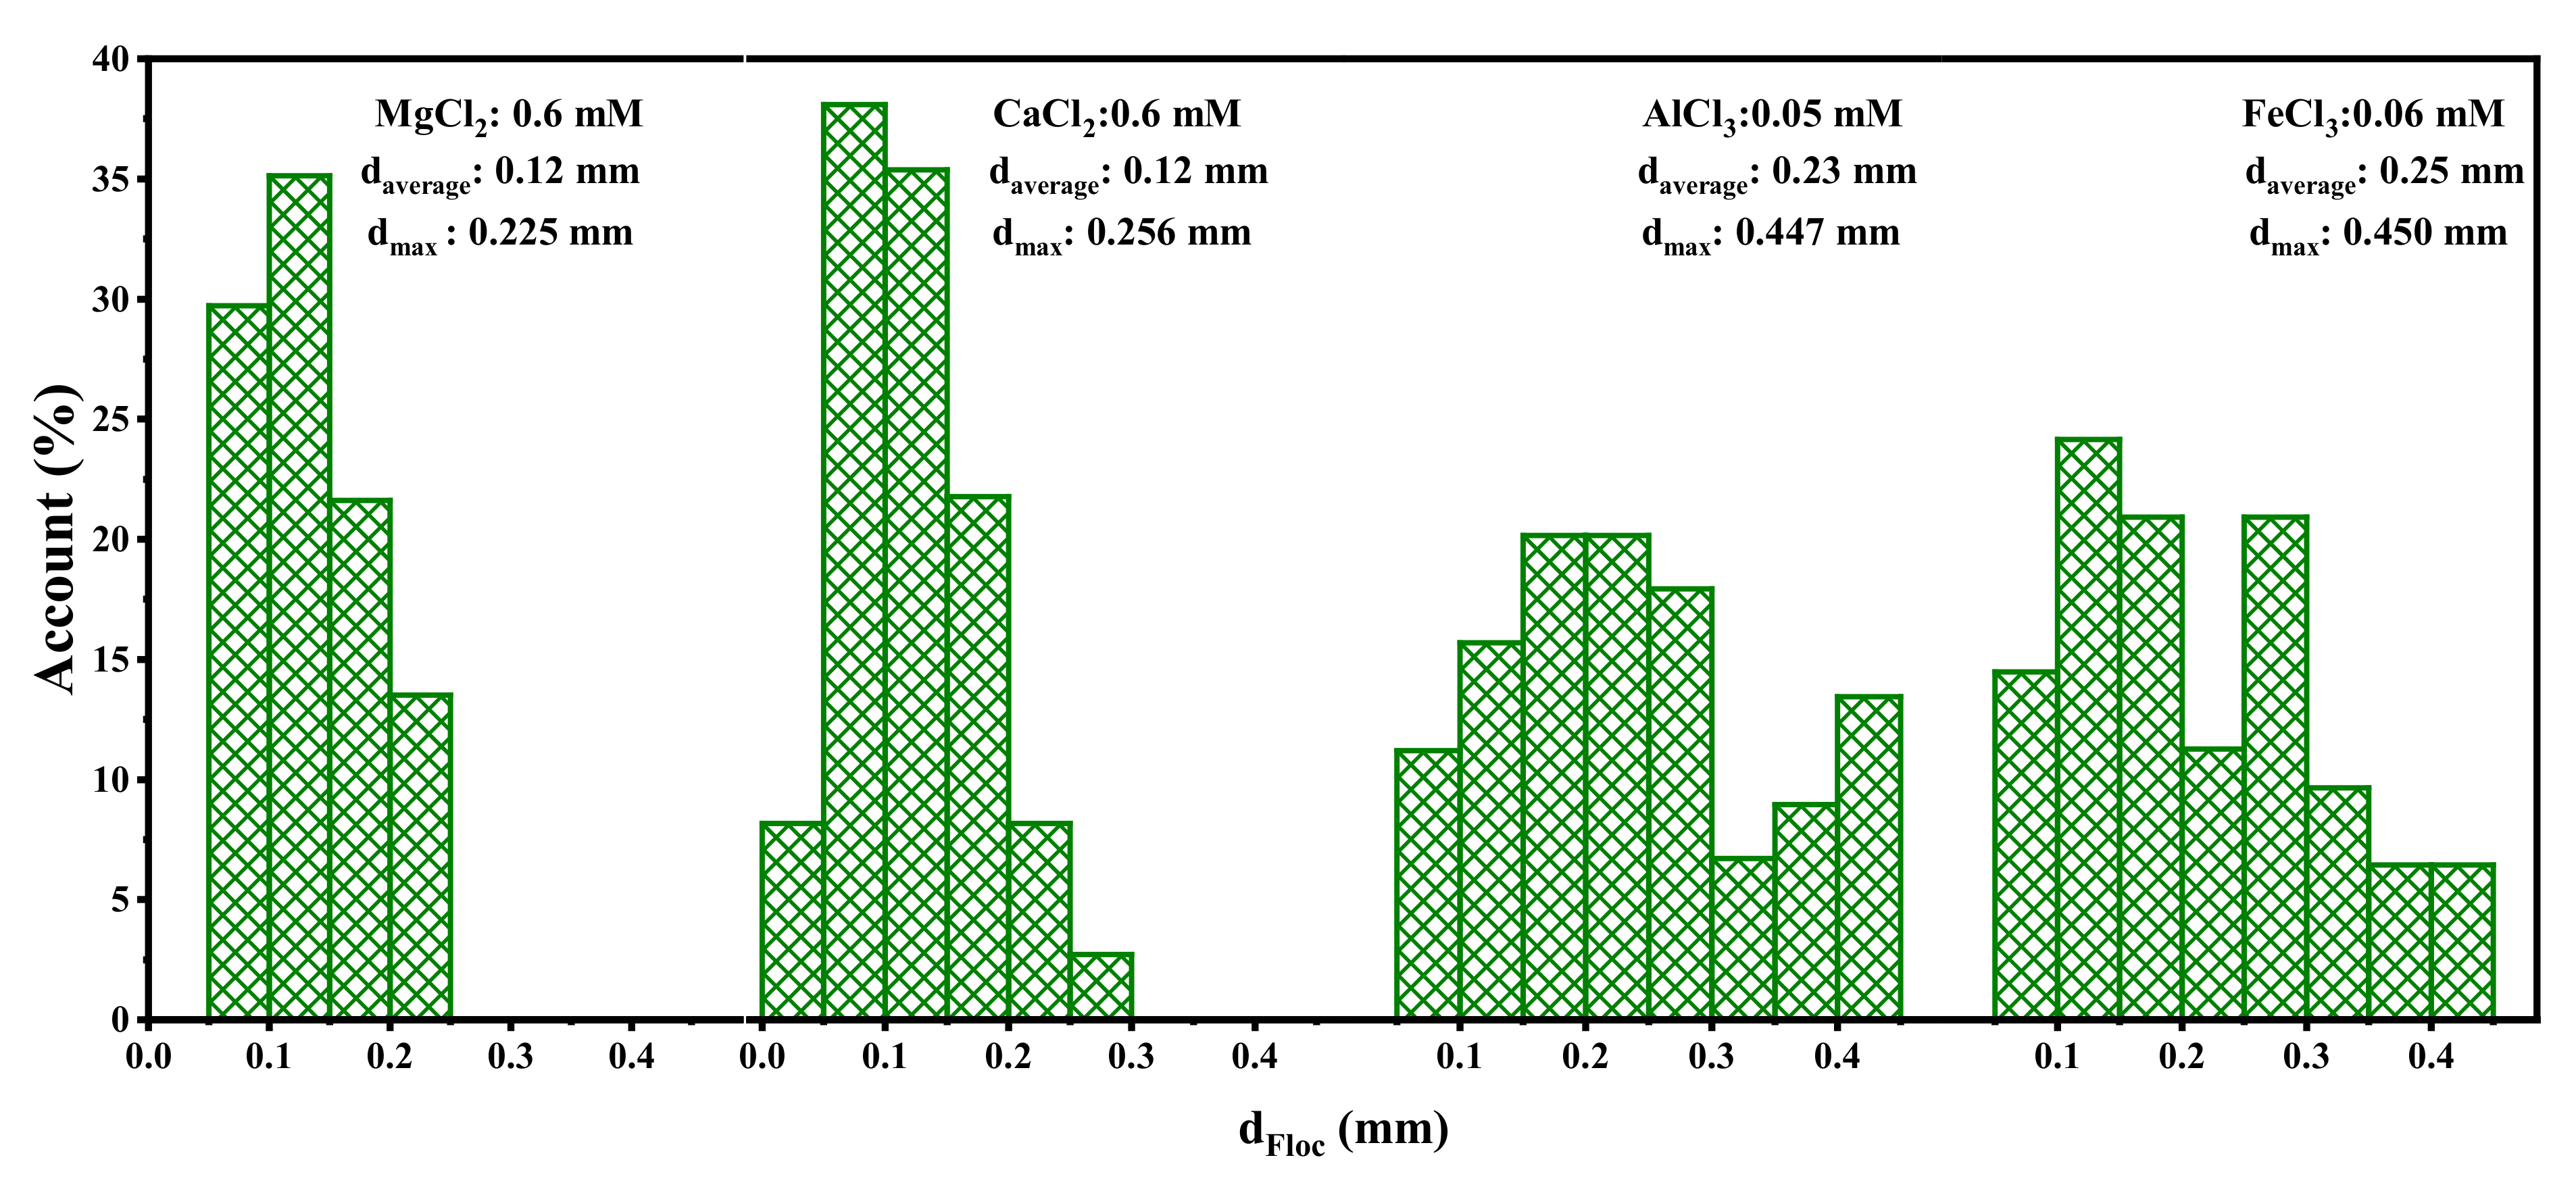
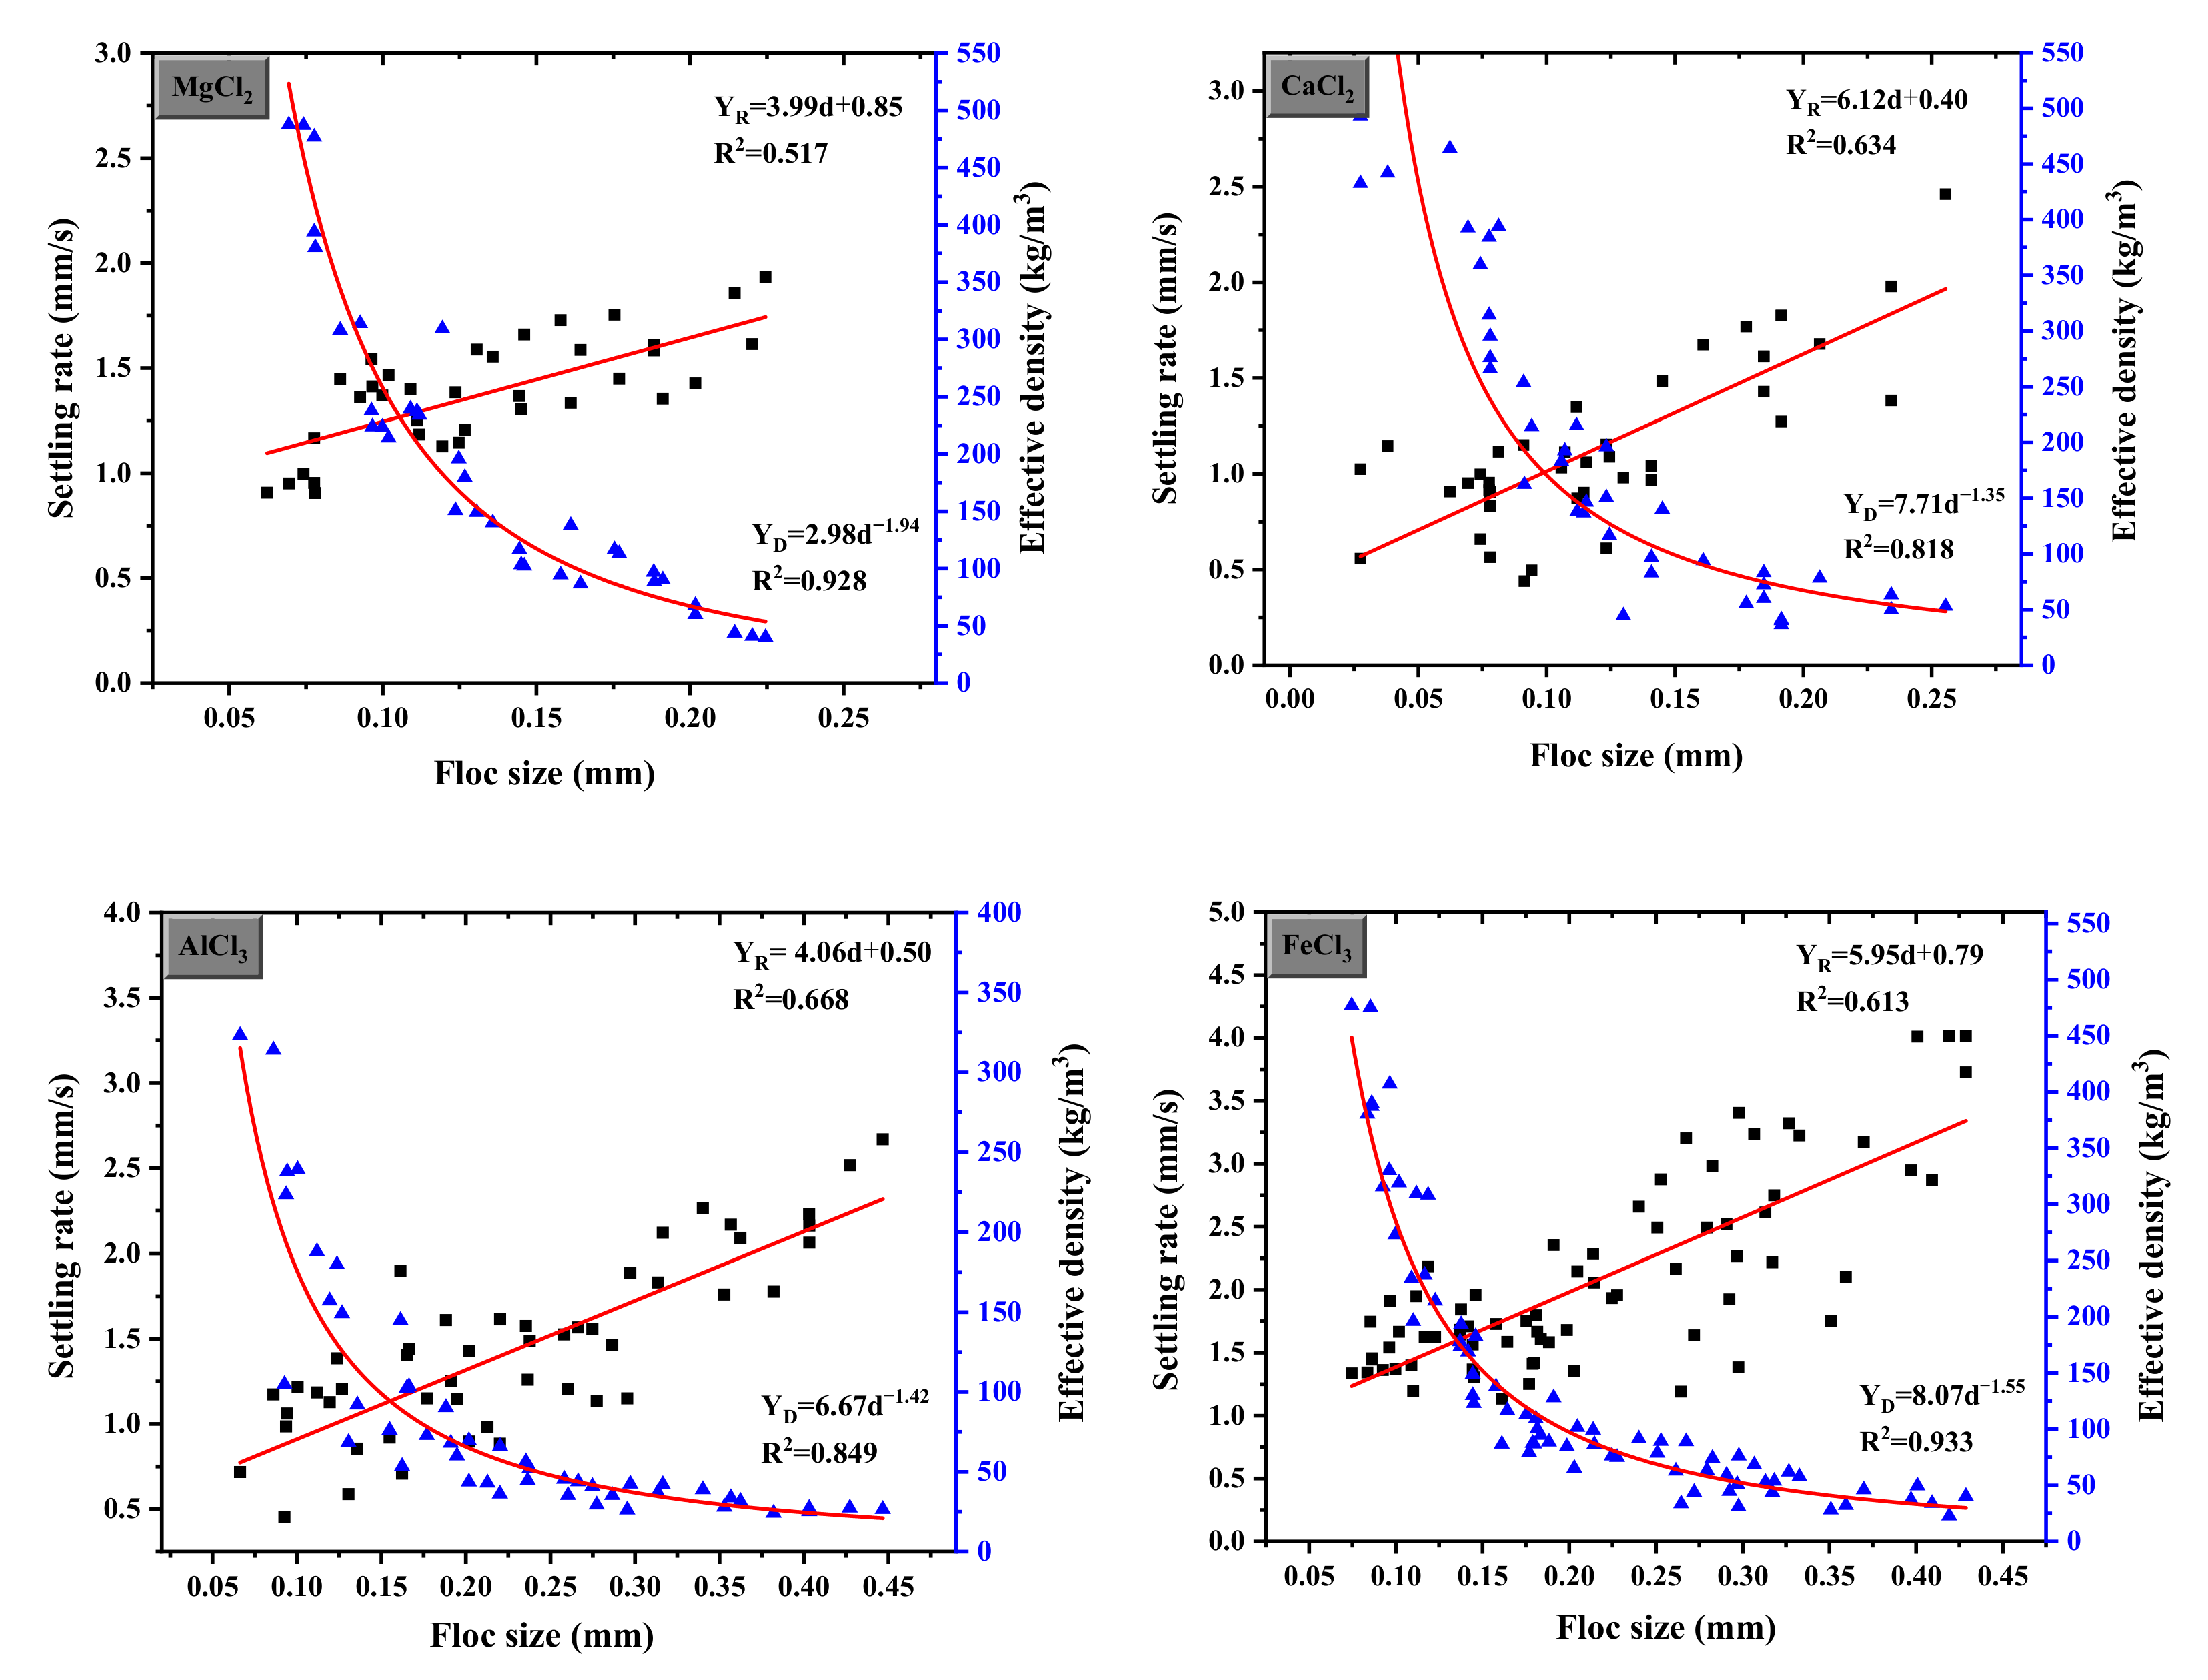
3.5. Floc Size Distribution and Floc Properties

The rate of aggregation is significantly influenced by coagulation mechanisms. The floc size distribution under different coagulant additions nearing CCC is shown in Figure 6. It can be seen that it is difficult to form flocs added with divalent cations. The maximum floc size formed by Mg2+ and Ca2+ was 0.225 mm. For aluminum and iron, the floc diameter can reach ~450 µm at one-tenth the divalent dosage, which is twice that of magnesium and calcium. As shown in Figure 7, trivalent ion coagulants have a larger size range of larger flocs, with the most common floc sizes (more than 60%) being 0.05 mm–0.15 mm and 0.1 mm–0.3 mm for divalent and trivalent ions, respectively. However, no aggregation improvement occurred for trivalent ion coagulants at higher dosages due to the strong repulsion between positively charged particles, coinciding with the zeta potential results. The floc images obtained with different coagulant additions are shown in Figure 7. It can be seen that particle aggregation occurs initially due to particle–particle collisions, which leads to small aggregates and later particle–aggregate and then aggregate–aggregate collisions [46]. As a result, flocs formed porous objects with highly irregular and open structures.
The floc structure properties of sedimentation velocity calculated by PIV and ImageJ and the effective density calculated by the Stokes formula as a function of floc size are shown in Figure 8. The settling rate of flocs formed by the coagulant was slow and generally increased with an increase in floc size, which could be interpreted by a linear function. The effective density decreased with increasing the floc size, which correlated with the Allometric1 model. The sedimentation velocity of Fe3+ was the fastest, and the average velocity and maximum sedimentation rate were 2.14 mm/s and 4.07 mm/s, respectively. The settling velocity of Al3+ was slightly lower than the former with an average velocity of 1.44 mm/s and a maximum velocity of 2.67 mm/s. MgCl2 and CaCl2 generated smaller flocs, and the sedimentation velocity of these flocs was lower. Moreover, it can be seen that the density of main floc diameter affected by Mg2+, Ca2+, Al3+, and Fe3+ ranging from 0.1–0.15 mm, 0.1–0.15 mm, 0.1–0.2 mm, and 0.2–0.3 mm was 250–145 kg/m3, 210–80 kg/m3, 200–60 kg/m3, and 100–50 kg/m3, respectively, the magnitude order of effective density was Mg2+ < Ca2+/Al3+ < Fe3+. Therefore, small flocs formed by electrostatic interactions have a higher effective density but are limited in their growth. Particle destabilization can be considered as an adsorption process for trivalent metals with in situ-hydrolyzed species with a reduced positive charge. Precipitates emerged on the surface as a result of the transition of in situ-produced polynuclear species, resulting in precipitate coverage on the charged surface. As the dosage increased, more precipitates formed not only on the particle surface but also in the solution. Particle collisions expanded from particle–particle to particle–precipitate and precipitate–precipitate, resulting in larger flocs at higher dosages. Thus, there was little water in the small flocs, and the porous larger flocs containing more water led to looser and open structures and lower effective density, which is consistent with the results of QCM-D.
The dosage of MgCl2, CaCl2, AlCl3 and FeCl3 were 0.6 mM, 0.6 mM, 0.05 mM, and 0.06 mM, respectively. The characteristics of different coagulants are summarized in Table 4.

4. Conclusions

Particle aggregation induced by inorganic multivalent cations can be interpreted using DLVO theory, metal ion adsorption, and floc structure. Initial settling was shown to be more strongly influenced by AlCl3 and FeCl3 than MgCl2 and CaCl2, and supernatant turbidity was greatly reduced at lower dosages for trivalent ions, consistent with the classical DLVO theory, zeta potential data, and QCM-D adsorption. The floc properties showed a power correlation and were found to be strongly dependent on the coagulant type. The floc size and settling rate induced by trivalent ions were larger than those of divalent ions at lower concentrations, but the former showed an irregular and porous structure with the formation of amorphous metal hydroxide precipitates, which can cause sweep-floc coagulation and enhance the coagulation effect.

Author Contributions

Conceptualization, Y.F.; methodology, Y.F.; software, X.M.; validation, Y.Z. and W.J.; formal analysis, Y.F.; investigation, Y.F.; resources, X.D.; data curation, Y.F.; writing—original draft preparation, Y.F.; writing—review and editing, X.M., N.L. and Y.Z.; visualization, Y.Z.; supervision, X.D.; project administration, X.D.; funding acquisition, X.D. All authors have read and agreed to the published version of the manuscript.

Funding

This research is funded by the Fund for International Cooperation and Exchange of the National Natural Science Foundation of China (Grant No. 51820105006), and the National Natural Science Foundation of China (Grant No. 52074189). The study was also supported by the Fund for International Cooperation in Science and Technology of the Major Research Plan of Shanxi Province (Grant No. 201803D421104), and Fund Program for the Scientific Activities of Selected Returned Overseas Professionals in Shanxi Province (2019).

Data Availability Statement

The data that support the findings of this study are available from the corresponding author upon reasonable request. The data are not publicly available due to privacy.

Acknowledgments

The authors thank the Canadian Center for Clean Coal/Carbon and Mineral Processing Technologies (C5MPT) and China Scholarship Council (CSC) for their financial support.

Conflicts of Interest

The authors declare no conflict of interest.

References

  1. Wei, J.; Gao, B.; Yue, Q.; Wang, Y.; Li, W.; Zhu, X. Comparison of coagulation behavior and floc structure characteristic of different polyferric-cationic polymer dual-coagulants in humic acid solution. Water Res. 2009, 43, 724–732. [Google Scholar] [CrossRef] [PubMed]
  2. Feng, J.; Yu, Q.; He, A.; Sheng, D.G. A theoretical model for the hydraulic conductivity of montmorillonite in relation to the concentration and valence of electrolyte cations in solution. J. Hydrol. 2021, 600, 126567. [Google Scholar] [CrossRef]
  3. Wang, Y.; Gao, B.Y.; Xu, X.M.; Xu, W.Y.; Xu, G.Y. Characterization of floc size, strength and structure in various aluminum coagulants treatment. J. Colloid Interface Sci. 2009, 332, 354–359. [Google Scholar] [CrossRef] [PubMed]
  4. Kim, S.H.; Moon, B.H.; Lee, H.I. Effects of pH and dosage on pollutant removal and floc. Microchem. J. 2001, 68, 197–203. [Google Scholar] [CrossRef]
  5. Wei, X.; Pan, D.; Xu, Z.; Xian, D.; Li, X.; Tan, Z.; Liu, C.; Wu, W. Colloidal stability and correlated migration of illite in the aquatic environment: The roles of pH, temperature, multiple cations and humic acid. Sci. Total Environ. 2021, 768, 144174. [Google Scholar] [CrossRef] [PubMed]
  6. Teh, C.Y.; Budiman, P.M.; Shak, K.P.Y.; Wu, T.Y. Recent Advancement of Coagulation–Flocculation and Its Application in Wastewater Treatment. Ind. Eng. Chem. Res. 2016, 55, 4363–4389. [Google Scholar] [CrossRef]
  7. Wang, C.; Sun, C.; Liu, Q. Formation, breakage, and re-growth of quartz flocs generated by non-ionic high molecular weight polyacrylamide. Miner. Eng. 2020, 157, 106546. [Google Scholar] [CrossRef]
  8. Listiarini, K.; Sun, D.D.; Leckie, J.O. Organic fouling of nanofiltration membranes: Evaluating the effects of humic acid, calcium, alum coagulant and their combinations on the specific cake resistance. J. Membr. Sci. 2009, 332, 56–62. [Google Scholar] [CrossRef]
  9. Liu, C.; Wang, X.; Qin, L.; Li, H.; Liang, W. Magnetic coagulation and flocculation of a kaolin suspension using Fe3O4 coated with SiO2. J. Environ. Chem. Eng. 2021, 9, 105980. [Google Scholar] [CrossRef]
  10. Ozkan, A.; Yekeler, M. Coagulation and flocculation characteristics of celestite with different inorganic salts and polymers. Chem. Eng. Processing Process Intensif. 2004, 43, 873–879. [Google Scholar] [CrossRef]
  11. Dominguez, J.R.; Gonzalez, T.; Garcia, H.M.; Sanchez-Lavado, F.; Beltran de Heredia, J. Aluminium sulfate as coagulant for highly polluted cork processing wastewaters: Removal of organic matter. J. Hazard Mater. 2007, 148, 15–21. [Google Scholar] [CrossRef] [PubMed]
  12. Lin, Z.; Li, P.; Hou, D.; Kuang, Y.; Wang, G. Aggregation Mechanism of Particles: Effect of Ca2+ and Polyacrylamide on Coagulation and Flocculation of Coal Slime Water Containing Illite. Minerals 2017, 7, 30. [Google Scholar] [CrossRef]
  13. Wang, S.; Alagha, L.; Xu, Z. Adsorption of organic–inorganic hybrid polymers on kaolin from aqueous solutions. Colloids Surf. A Physicochem. Eng. Asp. 2014, 453, 13–20. [Google Scholar] [CrossRef]
  14. Davis, C.C.; Edwards, M. Role of Calcium in the Coagulation of NOM with Ferric Chloride. Environ. Sci. Technol. 2017, 51, 11652–11659. [Google Scholar] [CrossRef]
  15. Droppo, I.G.; Exall, K.; Stafford, K. Effects of chemical amendments on aquatic floc structure, settling and strength. Water Res. 2008, 42, 169–179. [Google Scholar] [CrossRef]
  16. Xia, Y.; Xing, Y.; Li, M.; Liu, M.; Tan, J.; Cao, Y.; Gui, X. Studying interactions between undecane and graphite surfaces by chemical force microscopy and molecular dynamics simulations. Fuel 2020, 269, 117367. [Google Scholar] [CrossRef]
  17. Xing, Y.; Gui, X.; Karakas, F.; Cao, Y. Role of Collectors and Depressants in Mineral Flotation: A Theoretical Analysis Based on Extended DLVO Theory. Minerals 2017, 7, 223. [Google Scholar] [CrossRef]
  18. Farahat, M.; Hirajima, T.; Sasaki, K. Adhesion of Ferroplasma acidiphilum onto pyrite calculated from the extended DLVO theory using the van Oss-Good-Chaudhury approach. J. Colloid Interface Sci. 2010, 349, 594–601. [Google Scholar] [CrossRef]
  19. Wang, D.; Wu, R.; Jiang, Y.; Chow, C.W.K. Characterization of floc structure and strength: Role of changing shear rates under various coagulation mechanisms. Colloids Surf. A Physicochem. Eng. Asp. 2011, 379, 36–42. [Google Scholar] [CrossRef]
  20. Nasser, M.S. Characterization of floc size and effective floc density of industrial papermaking suspensions. Sep. Purif. Technol. 2014, 122, 495–505. [Google Scholar] [CrossRef]
  21. Sabah, E.; Erkan, Z.E. Interaction mechanism of flocculants with coal waste slurry. Fuel 2006, 85, 350–359. [Google Scholar] [CrossRef]
  22. Weber-Shirk, M.L.; Lion, L.W. Fractal Models for Floc Density, Sedimentation Velocity, and Floc Volume Fraction for High Peclet Number Reactors. Environ. Eng. Sci. 2015, 32, 978–982. [Google Scholar] [CrossRef]
  23. Ofori, P.; Nguyen, A.V.; Firth, B.; McNally, C.; Ozdemir, O. Shear-induced floc structure changes for enhanced dewatering of coal preparation plant tailings. Chem. Eng. J. 2011, 172, 914–923. [Google Scholar] [CrossRef]
  24. Cartwright, G.M.; Friedrichs, C.T.; Smith, S.J. A test of the ADV-based Reynolds flux method for in situ estimation of sediment settling velocity in a muddy estuary. Geo-Mar. Lett. 2013, 33, 477–484. [Google Scholar] [CrossRef]
  25. Smith, S.J.; Friedrichs, C.T. Size and settling velocities of cohesive flocs and suspended sediment aggregates in a trailing suction hopper dredge plume. Cont. Shelf Res. 2011, 31, S50–S63. [Google Scholar] [CrossRef]
  26. Jarvis, P.; Jefferson, B.; Parsons, S.A. Measuring Floc Structural Characteristics. Rev. Environ. Sci. Bio Technol. 2005, 4, 1–18. [Google Scholar] [CrossRef]
  27. Zhang, Z.; Zhao, L.; Li, Y.; Chu, M. A Modified Method to Calculate Critical Coagulation Concentration Based on DLVO Theory. Math. Probl. Eng. 2015, 2015, 317483. [Google Scholar] [CrossRef]
  28. Zou, M.; Wu, Y.; Redmile-Gordon, M.; Wang, D.; Liu, J.; Huang, Q.; Cai, P. Influence of surface coatings on the adhesion of Shewanella oneidensis MR-1 to hematite. J. Colloid Interface Sci. 2022, 608, 2955–2963. [Google Scholar] [CrossRef]
  29. Xu, R.; Zou, W.; Wang, T.; Huang, J.; Zhang, Z.; Xu, C. Adsorption and interaction mechanisms of Chi-g-P(AM-DMDAAC) assisted settling of kaolinite in a two-step flocculation process. Sci. Total Environ. 2022, 816, 151576. [Google Scholar] [CrossRef]
  30. Molaei, N.; Bashir Wani, O.; Bobicki, E.R. A comparative study of biopolymer adsorption on model anisotropic clay surfaces using quartz crystal microbalance with dissipation (QCM-D). J. Colloid Interface Sci. 2022, 615, 543–553. [Google Scholar] [CrossRef]
  31. Liu, Z.; Kou, J.; Xing, Y.; Sun, C.; Liu, P.; Zhang, Y. Ozone Ice as an Oxygen Release Reagent for Heap Leaching of Gold Ore. Minerals 2021, 11, 1251. [Google Scholar] [CrossRef]
  32. Liu, Z.; Kou, J.; Xing, Y.; Sun, C. Recovery of Gold from Ore with Potassium Ferrocyanide Solution under UV Light. Minerals 2021, 11, 387. [Google Scholar] [CrossRef]
  33. Chen, Q.; Cao, T.; Xiong, Y.; Wang, C.; Lin, Z.; Chen, Z.; Xu, S.; Xu, Z. Understanding Interactions between Clay and Model Coal Surfaces in Electrolyte Solutions by a Quartz Crystal Microbalance with Dissipation Study. Energy Fuels 2018, 32, 233–240. [Google Scholar] [CrossRef]
  34. Chen, Q.; Cao, T.; Xiong, Y.; Wang, C.; Lin, Z.; Chen, Z.; Xu, S.; Xu, Z. Adsorption of High-Molecular-Weight EOR Polymers on Glass Surfaces Using AFM and QCM-D. Energy Fuels 2013, 27, 2437–2444. [Google Scholar] [CrossRef]
  35. Klein, C.; Harbottle, D.; Alagha, L.; Xu, Z. Impact of fugitive bitumen on polymer-based flocculation of mature fine tailings. Can. J. Chem. Eng. 2013, 91, 1427–1432. [Google Scholar] [CrossRef]
  36. Yan, M.; Wang, D.; Xie, J.; Liu, C.; Cheng, J.; Chow, C.W.; van Leeuwen, J. Investigation of the adsorption characteristics of natural organic matter from typical Chinese surface waters onto alumina using quartz crystal microbalance with dissipation. J. Hazard Mater. 2012, 215–216, 115–121. [Google Scholar] [CrossRef]
  37. Alagha, L.; Wang, S.; Yan, L.; Xu, Z.; Masliyah, J. Probing adsorption of polyacrylamide-based polymers on anisotropic Basal planes of kaolinite using quartz crystal microbalance. Langmuir 2013, 29, 3989–3998. [Google Scholar] [CrossRef]
  38. Smith, S.J.; Friedrichs, C.T. Image processing methods for in situ estimation of cohesive sediment floc size, settling velocity, and density. Limnol. Oceanogr. Methods 2015, 13, 250–264. [Google Scholar] [CrossRef]
  39. Tang, J.; Zhang, Y.; Bao, S. The Effect of Ca2+ and Mg2+ on the Dispersion and Flocculation Behaviors of Muscovite Particles. Minerals 2016, 6, 93. [Google Scholar] [CrossRef]
  40. Li, W.; Li, Y.; Xiao, Q.; Wei, Z.; Song, S. The Influencing Mechanisms of Sodium Hexametaphosphate on Chalcopyrite Flotation in the Presence of MgCl2 and CaCl2. Minerals 2018, 8, 150. [Google Scholar] [CrossRef] [Green Version]
  41. Long, T.; Huang, X.; Xiao, W. The Effect of Surface Charge on the Separation of Pyrite from Serpentine by Flotation. Minerals 2019, 9, 629. [Google Scholar] [CrossRef]
  42. Cheng, W.; Deng, Z.; Tong, X.; Lu, T. Hydrophobic Agglomeration of Fine Pyrite Particles Induced by Flotation Reagents. Minerals 2020, 10, 801. [Google Scholar] [CrossRef]
  43. Inam, M.A.; Khan, R.; Park, D.R.; Ali, B.A.; Uddin, A.; Yeom, I.T. Influence of pH and Contaminant Redox Form on the Competitive Removal of Arsenic and Antimony from Aqueous Media by Coagulation. Minerals 2018, 8, 574. [Google Scholar] [CrossRef]
  44. Dong, Y.; Li, H.; Fan, Y.; Ma, X.; Sun, D.; Wang, Y.; Gao, Z.; Dong, X. Tunable Dewatering Behavior of Montmorillonite Suspension by Adjusting Solution pH and Electrolyte Concentration. Minerals 2020, 10, 293. [Google Scholar] [CrossRef]
  45. Yan, M.; Liu, C.; Wang, D.; Ni, J.; Cheng, J. Characterization of adsorption of humic acid onto alumina using quartz crystal microbalance with dissipation. Langmuir 2011, 27, 9860–9865. [Google Scholar] [CrossRef] [PubMed]
  46. Jin, P.; Song, J.; Yang, L.; Jin, X.; Wang, X.C. Selective binding behavior of humic acid removal by aluminum coagulation. Environ. Pollut. 2018, 233, 290–298. [Google Scholar] [CrossRef]
Figure 1. Effect of electrolyte concentration on absorbance. (a) MgCl2, (b) CaCl2, (c) AlCl3, (d) FeCl3.
Minerals 12 01100 g001aMinerals 12 01100 g001b
Figure 2. LogW–logC curve of different coagulants. (a) MgCl2, (b) CaCl2, (c) AlCl3, (d) FeCl3.
Minerals 12 01100 g002
Figure 3. Zeta potential under different coagulants (ad).
Minerals 12 01100 g003
Figure 4. Change in frequency (Δf) associated with the adsorption of different coagulants on QCM-D carbon sensors in 10 mM, 50 mM, and 100 mM solution. (a) MgCl2, (b) CaCl2, (c) AlCl3, (d) FeCl3.
Minerals 12 01100 g004
Figure 5. Adsorbed layer properties of different coagulants on QCM-D carbon sensors.
Minerals 12 01100 g005
Figure 6. Floc size distribution for different coagulants under nearing CCC.
Minerals 12 01100 g006
Figure 7. Floc image at the end of coagulation process for different coagulants under various dosages. The coagulants were MgCl2, CaCl2, AlCl3, and FeCl3 from top to bottom, respectively.
Minerals 12 01100 g007
Figure 8. Floc settling rate and effective density as a function of floc size under different coagulants.
Minerals 12 01100 g008
Table 1. The double-layer thickness of different electrolytes under different concentration (nm).
10−4 mol/L10−3 mol/L10−2 mol/L10−1 mol/L100 mol/L
NaCl/KCl30.419.613.040.960.30
MgCl2/CaCl217.565.551.760.560.18
AlCl3/FeCl312.423.931.240.390.12
Table 2. The critical coagulation concentration of different coagulants.
Coal-CoalKaolinite-KaoliniteCoal-Kaolinite
MgCl2 and CaCl21.35 mM0.00069 mM0.031 mM
AlCl3 and FeCl30.81 mM0.00042 mM0.018 mM
Table 3. Mass adsorption of different coagulants on QCM-D carbon sensors following the linear Sauerbrey.
Sauerbrey Mass (ng/cm2)Sauerbrey Thickness (nm)
MgCl2CaCl2AlCl3FeCl3MgCl2CaCl2AlCl3FeCl3
10 mM24.320.554.1299.90.250.230.542.97
50 mM94.785.2229.4320.30.950.832.293.16
100 mM186.2162.7339.8349.81.841.573.343.46
Table 4. Summarization of floc characteristics by different coagulants.
Fractal DimensionAverage dF
mm
Maximum of dF
mm
Average of Settle Velocity
mm/s
Average of Effective Density
kg/m3
Growth Factor
MgCl21.510.120.230.94102.9511.20
CaCl21.540.120.261.02111.6512.75
AlCl31.630.230.451.4484.2522.30
FeCl31.670.250.452.2681.5322.50
Publisher’s Note: MDPI stays neutral with regard to jurisdictional claims in published maps and institutional affiliations.

