Review

Texture and Trace Element Geochemistry of Quartz: A Review

School of Geosciences and Info-Physics, Central South University, Changsha 410017, China
*
Author to whom correspondence should be addressed.
Minerals 2022, 12(8), 1042; https://doi.org/10.3390/min12081042
Submission received: 7 July 2022 / Revised: 7 August 2022 / Accepted: 16 August 2022 / Published: 19 August 2022
(This article belongs to the Special Issue Isomorphism and Solid Solutions of Minerals and Related Compounds)

Abstract

:
Quartz is one of the most abundant minerals. Used in a variety of materials, it preserves geological history and reflects alteration conditions. Data were collected (>2400 data points) from more than 40 ore deposits to understand its internal texture and geochemistry. Cathodoluminescence imaging is a technique for examining the internal texture of quartz that may reveal information about the crystal’s origin and evolution. The dominant trace elements in quartz lattice are Al, P, Li, Ti, Ge, K, and Na. These, combined with internal texture, can distinguish quartz from different origins and can differentiate between different types of ore deposits, as each type of ore deposit has its own unique CL characteristics. Therefore, Al did not correlate with cathodoluminescence (CL) in epithermal Au-Sb-Hg, Carlin-type Au, epithermal Ag, or shale-hosted Zn deposits. Epithermal base metal and porphyry-Cu-type deposits were intermediate, and Mississippi-Valley-type, epithermal Au-Ag, and porphyry Cu-Mo deposits were characterized for Al correlation with CL. Furthermore, Gigerwald, Rohdenhaus, and Westland deposits had Li/Al ratios less than one, suggesting that H (as hydroxyl substituting for oxygen) completed the charge. However, trace elements (i.e., Ge, Sb, Ti, and Al), sector zoning, and resorption surfaces were vital parameters to differentiate between magmatic and hydrothermal quartz. Additionally, titanium and aluminum were the most important trace elements. Their values could be used to differentiate between different quartz types. Among them, hydrothermal and pegmatitic quartz were characterized by lower temperatures and Ti concentrations. Rhyolitic quartz was characterized by the lowest Al, the highest temperatures, and lower Al/Ti ratios. Aluminum, Li, and H were most important in hydrothermal and metamorphic quartz, but magmatic quartz was generally enriched with Ti.

1. Introduction

Quartz, as one of the most important and abundant minerals, has a distinct ability to endure post-crystallization alteration and weathering, causing it to record the crystallization history. According to previous studies, quartz can be used as a source rock indicator, and it can occur in a wide range of geological environments [1,2,3,4]. Most papers have worked on trace element distribution, the evaluation of magmatic and hydrothermal plutons, radiation-induced defects in Ge-rich α-quartz, TitaniQ (titanium-in-quartz) geothermometers, cathodoluminescence (CL) observations of magmatic or hydrothermal quartz, and the pressure and temperature effects on crystallization processes [5,6,7,8,9,10,11]. Some authors have used CL textures, trace element analyses, fluid inclusions, oxygen isotopes, infrared techniques, microstructural characteristics, or the application of mineral thermometry to distinguish mineralized quartz from barren quartz [12,13,14,15,16]. Several studies have described variations in Ti, Al, Li, Na, and H contents, suggesting that these variations are due to changes in the chemical composition of the growth medium, growth rate, pH, temperature, and pressure [17,18]. A few studies have been conducted on igneous quartz comparisons with hydrothermal quartz [19,20,21,22,23,24]. Furthermore, Ref. [25] investigated quartz in a variety of hydrothermal veins and came up with a generalized textural description for quartz. Moreover, with the advancement of LA-ICP-MS, EPMA, and CL, several studies of quartz related to granitic pegmatites, granites, greisen, granophyre, hydrothermal deposits, metamorphic rocks, skarn deposits, etc. have been conducted [6,10,21,26,27].
Quartz has a robust atomic configuration of the Si–O bond, which allows a small number of other elements (such as Al, Ti, and Ge) into its structure [19,23,28,29,30,31,32]. Additionally, variability in the concentrations of Ti, Al, Ge, and Li is used for genetic interpretation and classification in igneous quartz and, to some extent, in hydrothermal quartz as well [9,22,23,33,34,35]. The dominant trace elements are Al, P, Li, Ti, Ge, and Na in magmatic quartz. It has the highest Ti and lowest Ge contents, with more H than Li, K, and P [36]. Contrarily, the most important trace elements in hydrothermal quartz are Al, Li, Na, and H [37], where Al is the most prominent element that correlates positively with Li. It has also been observed that hydrothermal quartz undergoes quite complex situations because of the huge variation in trace elements compared to magmatic quartz. Furthermore, trace element composition can be used to distinguish between ore deposits and between magmatic and hydrothermal quartz. Previously, Al and Ti have been used for porphyry, orogenic gold, and epithermal deposit differentiation. This study adds new input on using these elements to differentiate hydrothermal, rhyolitic, granitic, and pegmatitic quartz. Quartz also records its development history by changes in CL intensity and is highly sensitive to the formation’s physicochemical setting [38,39].
The internal growth textures and grain size distribution yield valuable information on the nature and evolution of the melt from which the crystal developed, i.e., it helps to identify multiple generations of quartz, the crystallization history, magmatic processes, etc. [5,21,40,41,42,43,44]. According to Ref. [45], an embayed texture is common in magmatic quartz, commonly showing oscillatory, concentric, convoluted, truncated growth zoning with variable CL intensities, and may attach in groups or clusters (i.e., Huangshping and Empire mine deposits as a reference) [46,47,48,49,50]. Magmatic quartz is characterized by resorption surfaces, while hydrothermal quartz has sector zoning [5,21,51,52]. Some authors have documented the relationships between the trace element contents in quartz and its CL (i.e., Jerritt, Canyon, and Creede epithermal deposits as a reference) [12,13,14,53,54,55]. The relation between Al and CL can be used to differentiate between different high-temperature (i.e., porphyry deposits) and low-temperature (i.e., Mississippi-Valley-type) deposits. However, Al and K are associated with Cl and, although often not, Ti is often associated with a CL intensity above 500 °C. The goals of this study are: (1) to discuss magmatic and hydrothermal quartz by focusing on internal texture and geochemistry, (2) to illustrate the link between trace element distribution and CL intensity, and (3) to differentiate different quartz types and ore deposits based on their trace element concentrations. Future work requires attention to enhance our knowledge about Ge content in quartz, which is still limited, as well as the role of H effects and why Al sometimes fluctuates more and sometimes less.

2. Characteristics of Magmatic Quartz

Magmatic quartz is characterized by high temperature (>400 °C) and pressure [56,57]. The thermal history of magmatic quartz can be determined with a TitaniQ (Ti in quartz) thermometer above 500 °C [52,58]. In early magmatic quartz phenocrysts, the calculated temperature has correlated positively with the Ti concentration (Figure 1), i.e., there were less than 10 ppm Ti in quartz formed at less than 350 °C and greater than 10 ppm Ti in quartz formed at greater than 400 °C [12,27,59]. Additionally, X-ray diffraction, X-ray absorption, and molecular dynamics models support the idea that Ti4+ explicitly replaces Si4+ and is incorporated into quartz structure tetrahedral sites. Ti can also be integrated into lower oxidation states, such as Ti3+ and Ti2+, but an extra charge-balancing mechanism is required [60,61,62]. However, with the advancements in laser ablation inductively coupled plasma mass spectrometry (LA-ICP-MS) and EPMA analytical techniques, we can easily measure the Ti concentration. This Ti can be used further to interpret the approximate crystallization temperature of the subjected magmatic quartz grain with the help of the following simplified model:
T e m p e r a t u r e = A + B + C
where
A = 65 + Ti 22.65 + Ti + 646.24
B = Ti 11.31 Ti Ti 11.31 Ti + 25.25
C = 7.8 Ti 6.75 + 0.86 10.55 Ti Ti 10.55
According to Ref. [14], barren quartz had a high Ti concentration relative to ore-related quartz (such as that in the Krásná Hora and Roudný deposits). The Ti values for barren and ore-related quartz range from 11–50 ppm and 2–9 ppm, respectively. Pack’s research supports the idea of [34]. The latter focused on the Oyu Tolgoi and Zesen Uul porphyry systems in southern Mongolia. His research added that barren quartz had a high CL intensity and temperature (>600 °C), with high Ti contents compared to mineralization associated with the second quartz stage [39]. In addition, this Ti concentration and temperature correlated with the intensity of the CL emission, i.e., brighter parts were marked by higher temperature, pressure, and Ti concentration [21,41,52,58,63,64]. Therefore, it is well-known that magmatic quartz grains with higher defects or impurities (Ti) create intense CL, and vice versa [59].
Furthermore, magmatic quartz crystallization started from euhedral forms and progressed toward subhedral, L-anhedral, and anhedral forms [59]. According to Ref. [8], crystals with simple oscillatory zoning (SOZ) and multiple oscillatory zoning (MOZ) formed at temperatures ranges from 700–800 °C during the early phases (Figure 2). A few authors have described that diffusion-controlled mechanisms form this oscillatory zoning, and it illustrates magmatic conditions [5,21,51,52,65]. However, sedimentary provenance researchers have used the existence of oscillatory zoning to suggest an igneous origin of quartz grains [66,67]. Moreover, volcanic and plutonic rocks are characterized, generally, by clusters of crystals, as observed in the Huangshaping Pb-Zn deposit, where individual crystals in a cluster with a darker, rounded core, as well as oscillatory and normal zoning, indicate that the crystal formed earlier.

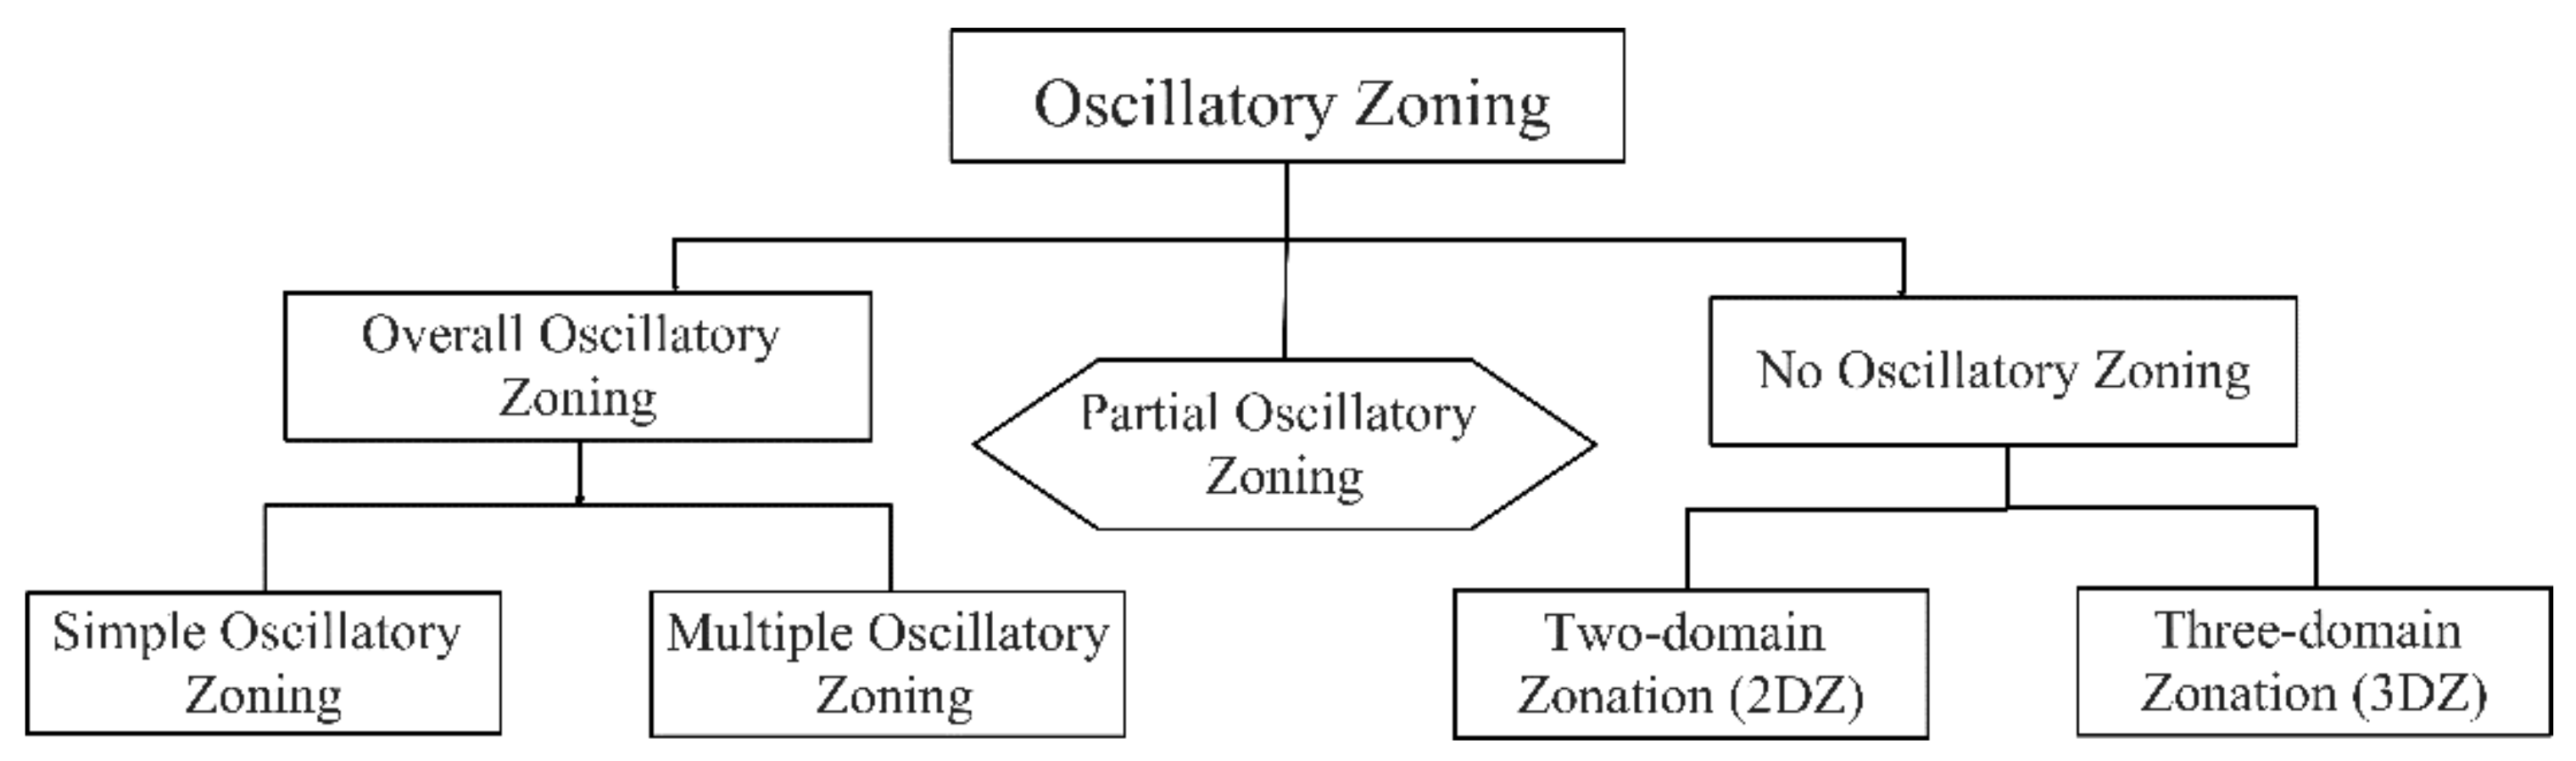
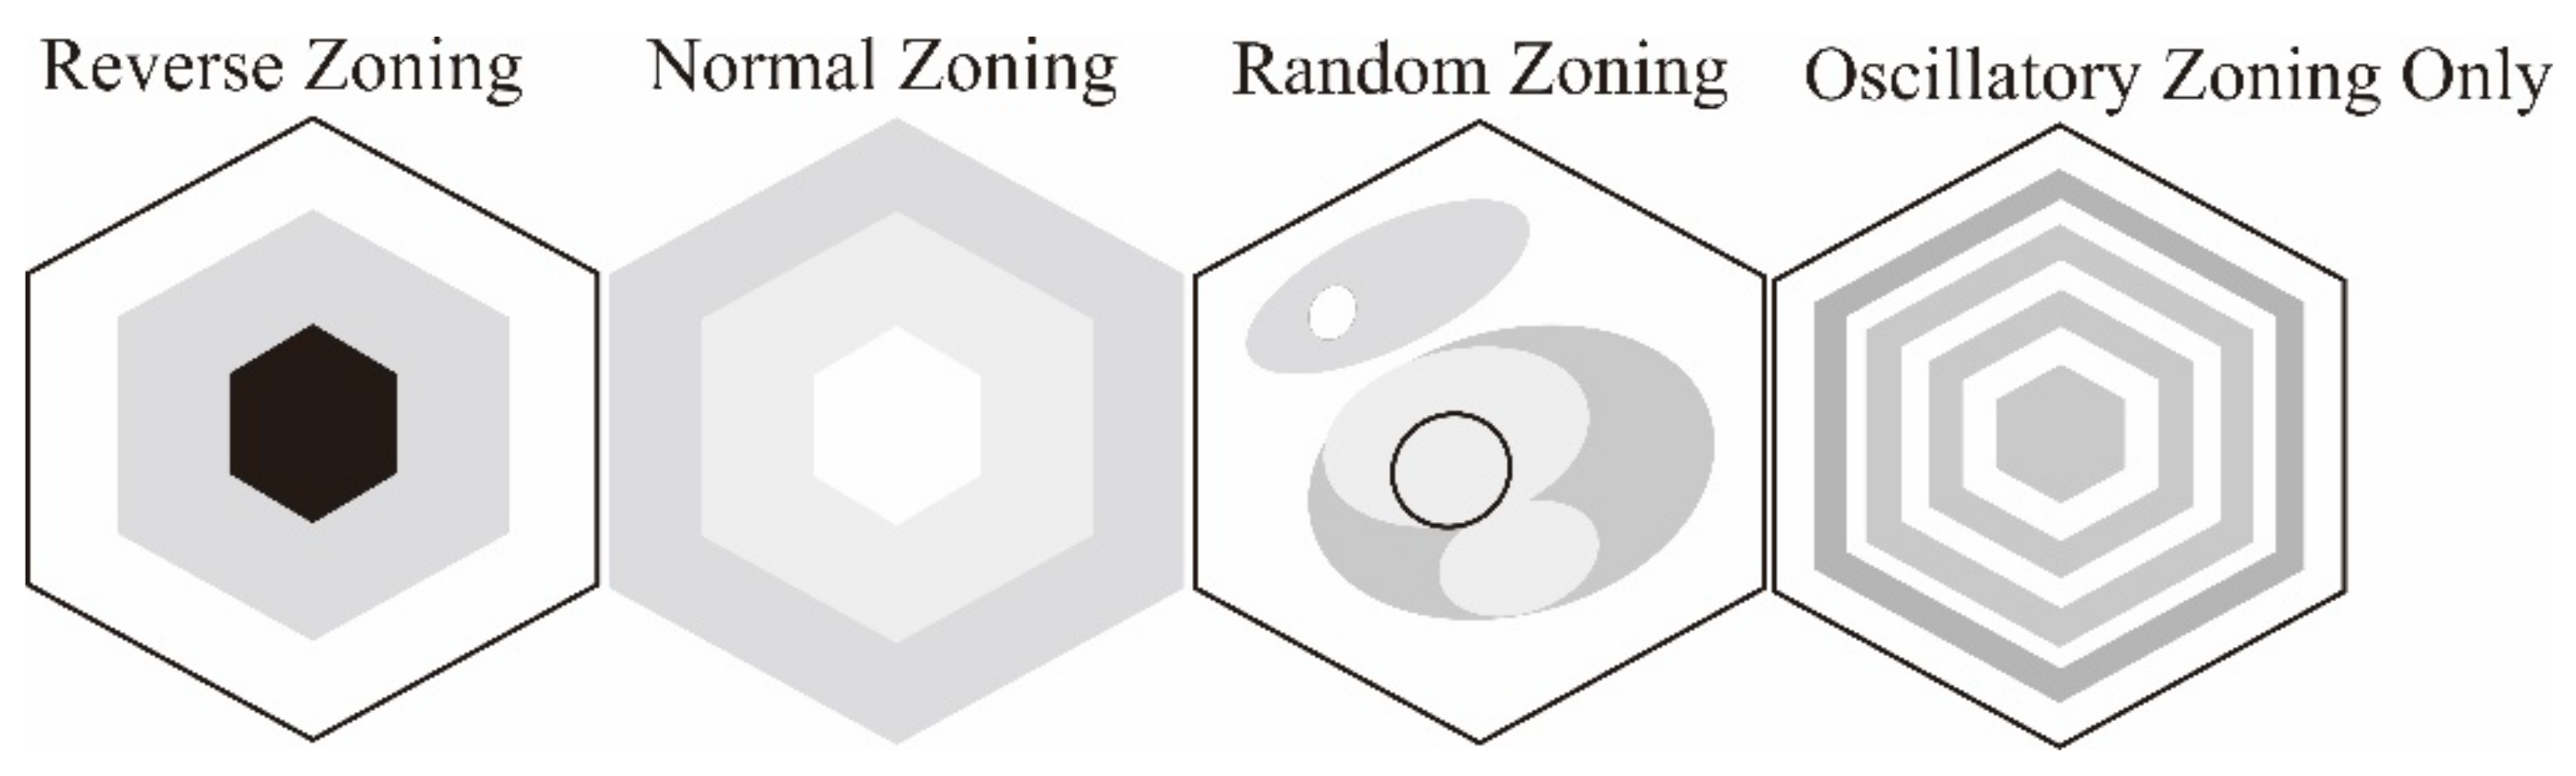
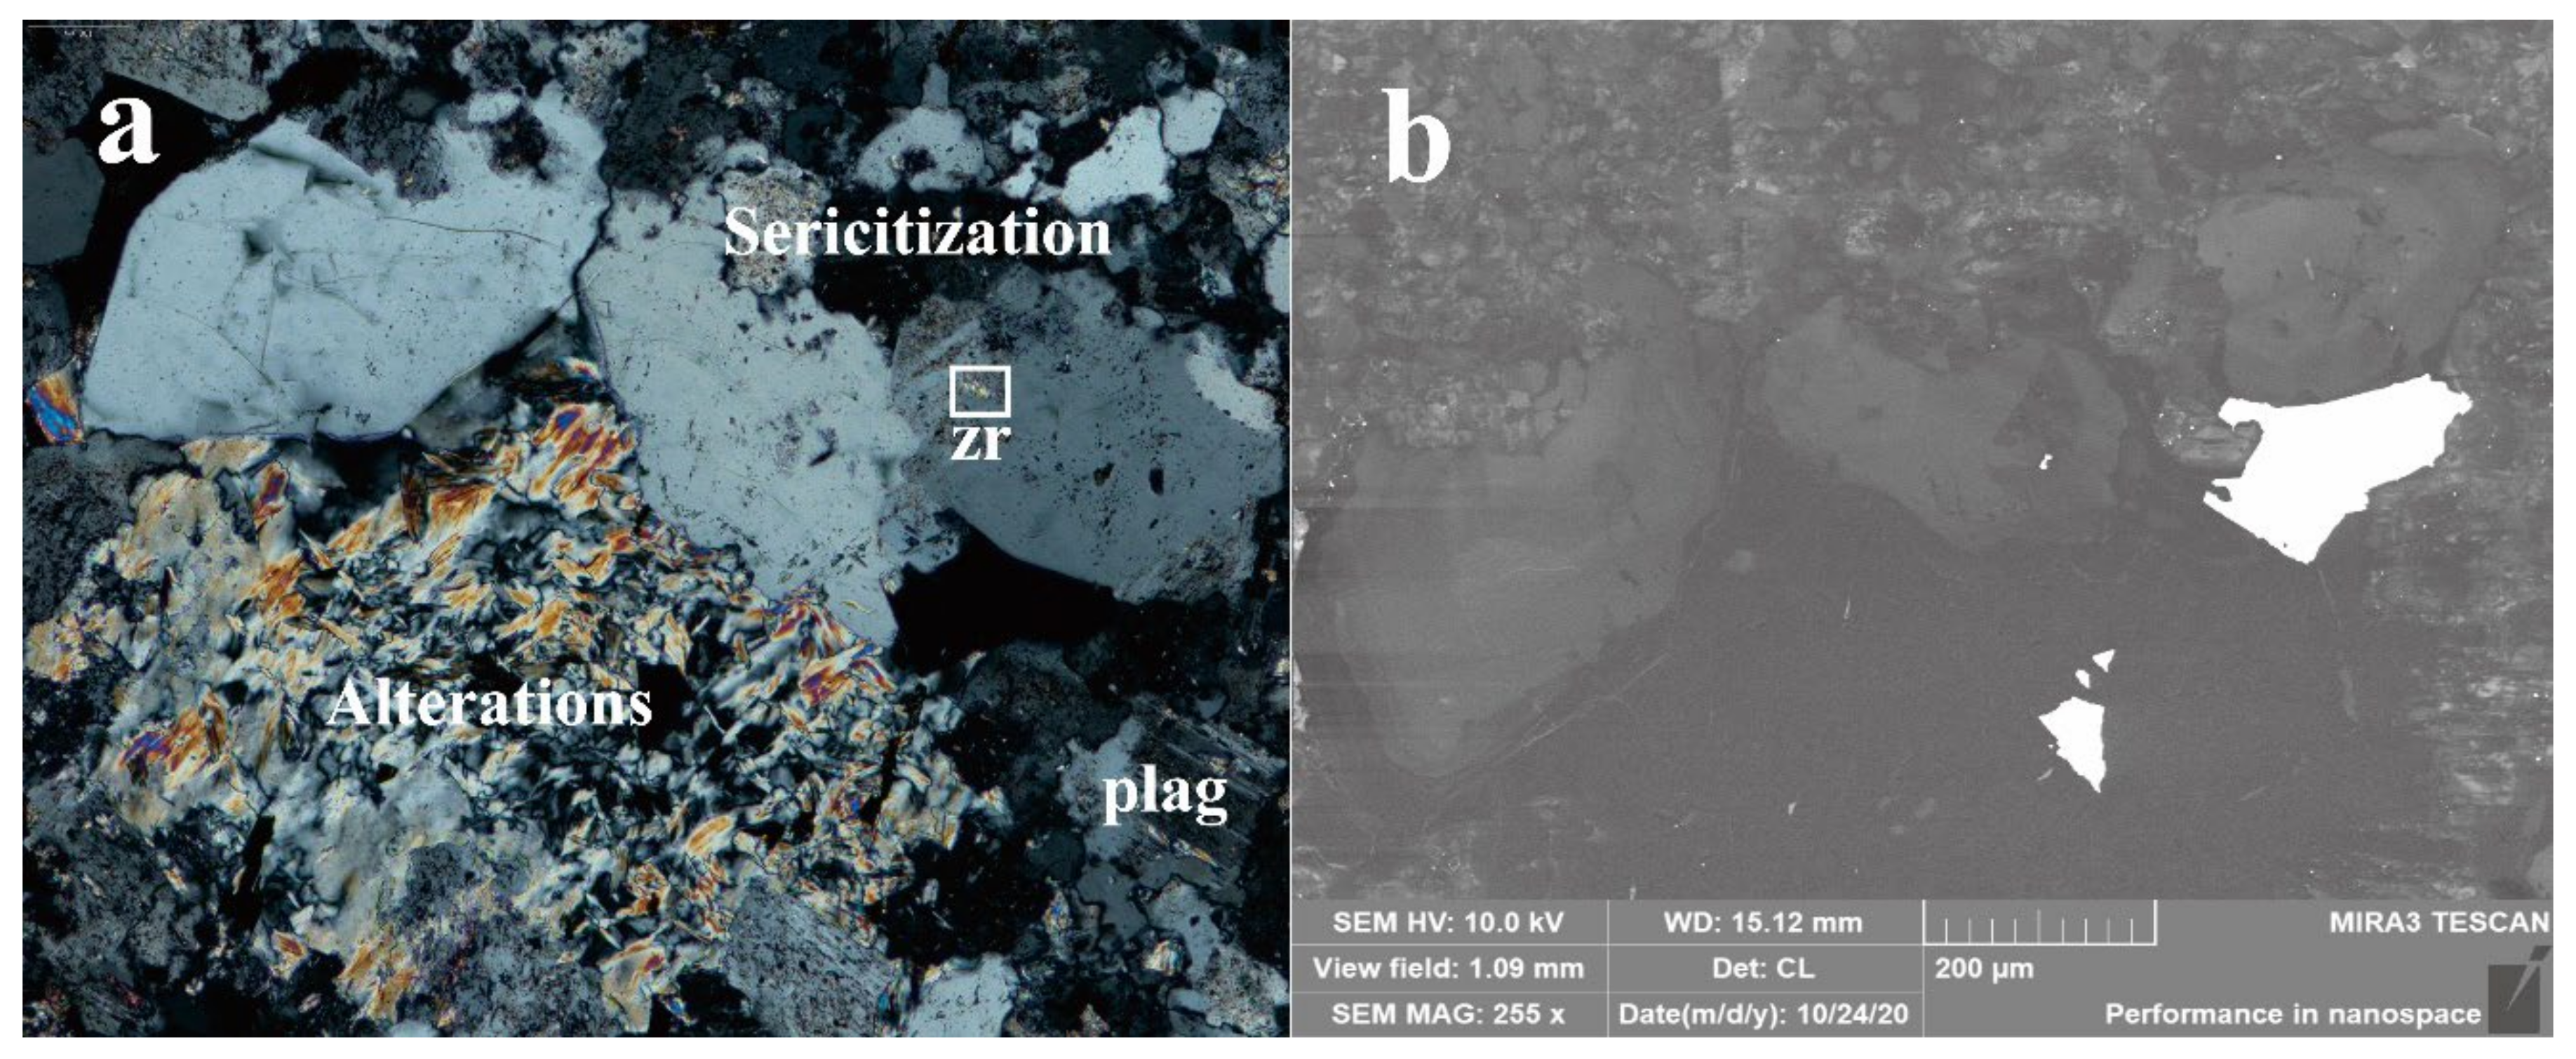
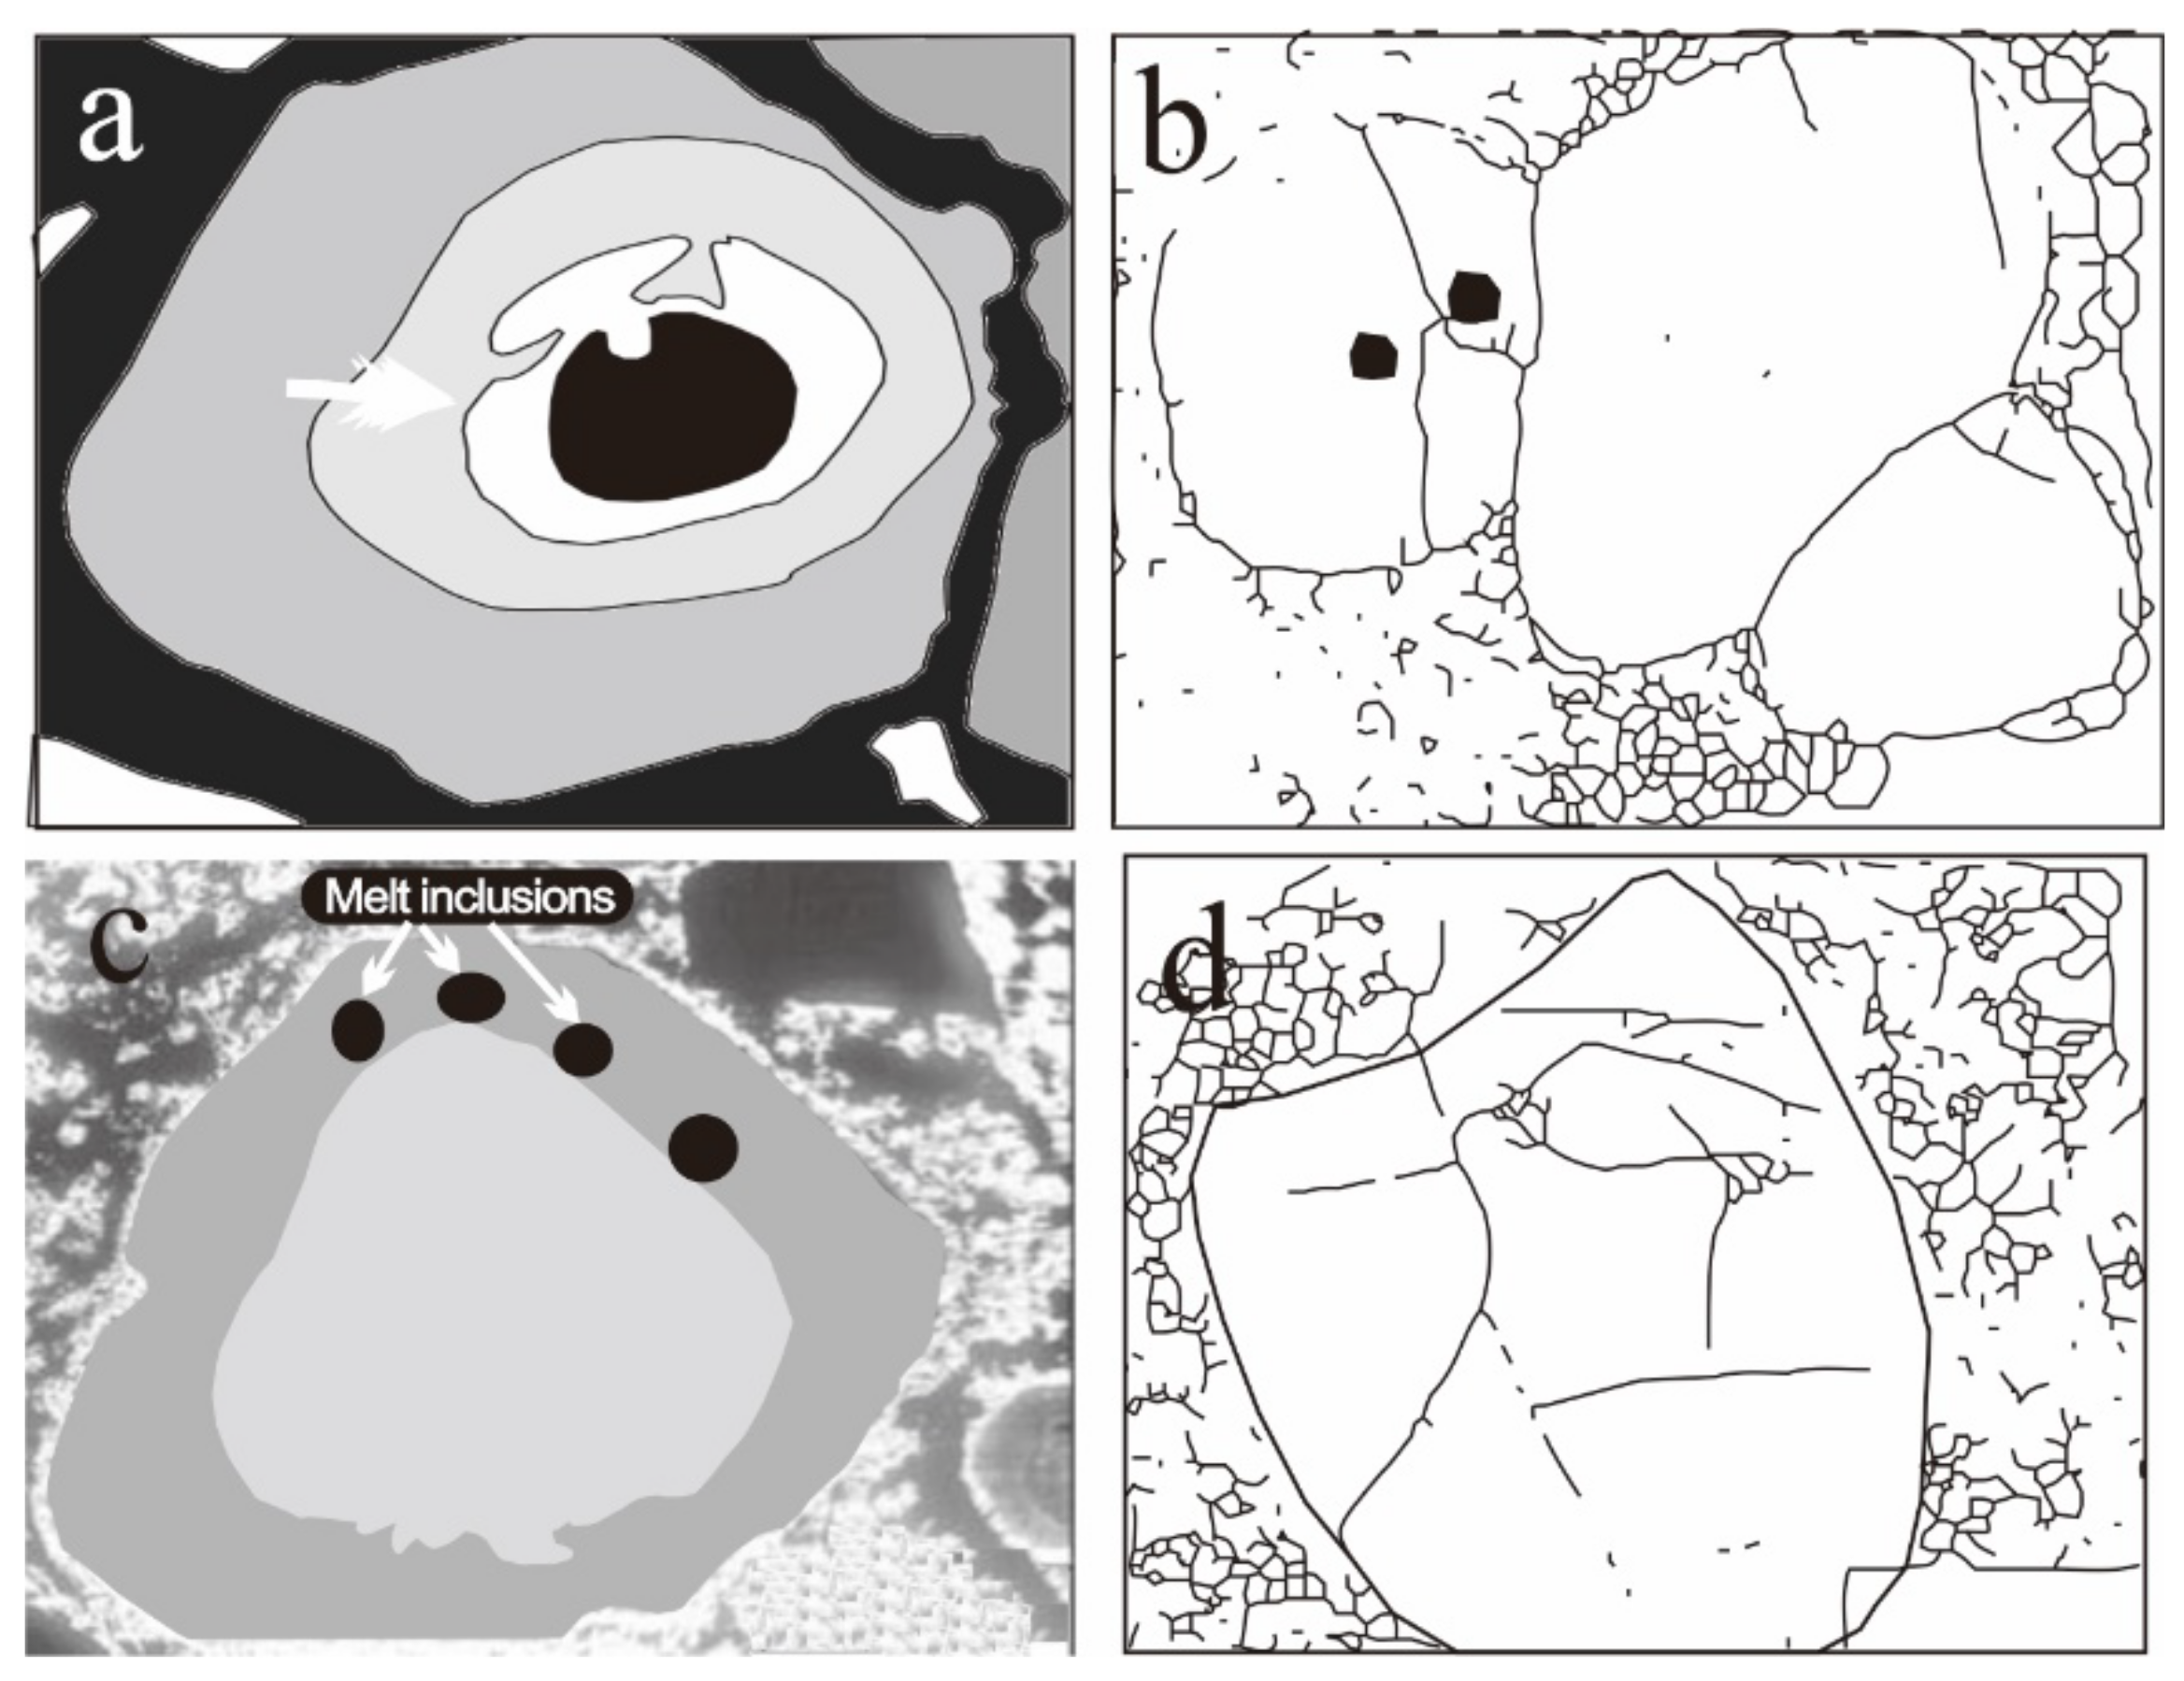
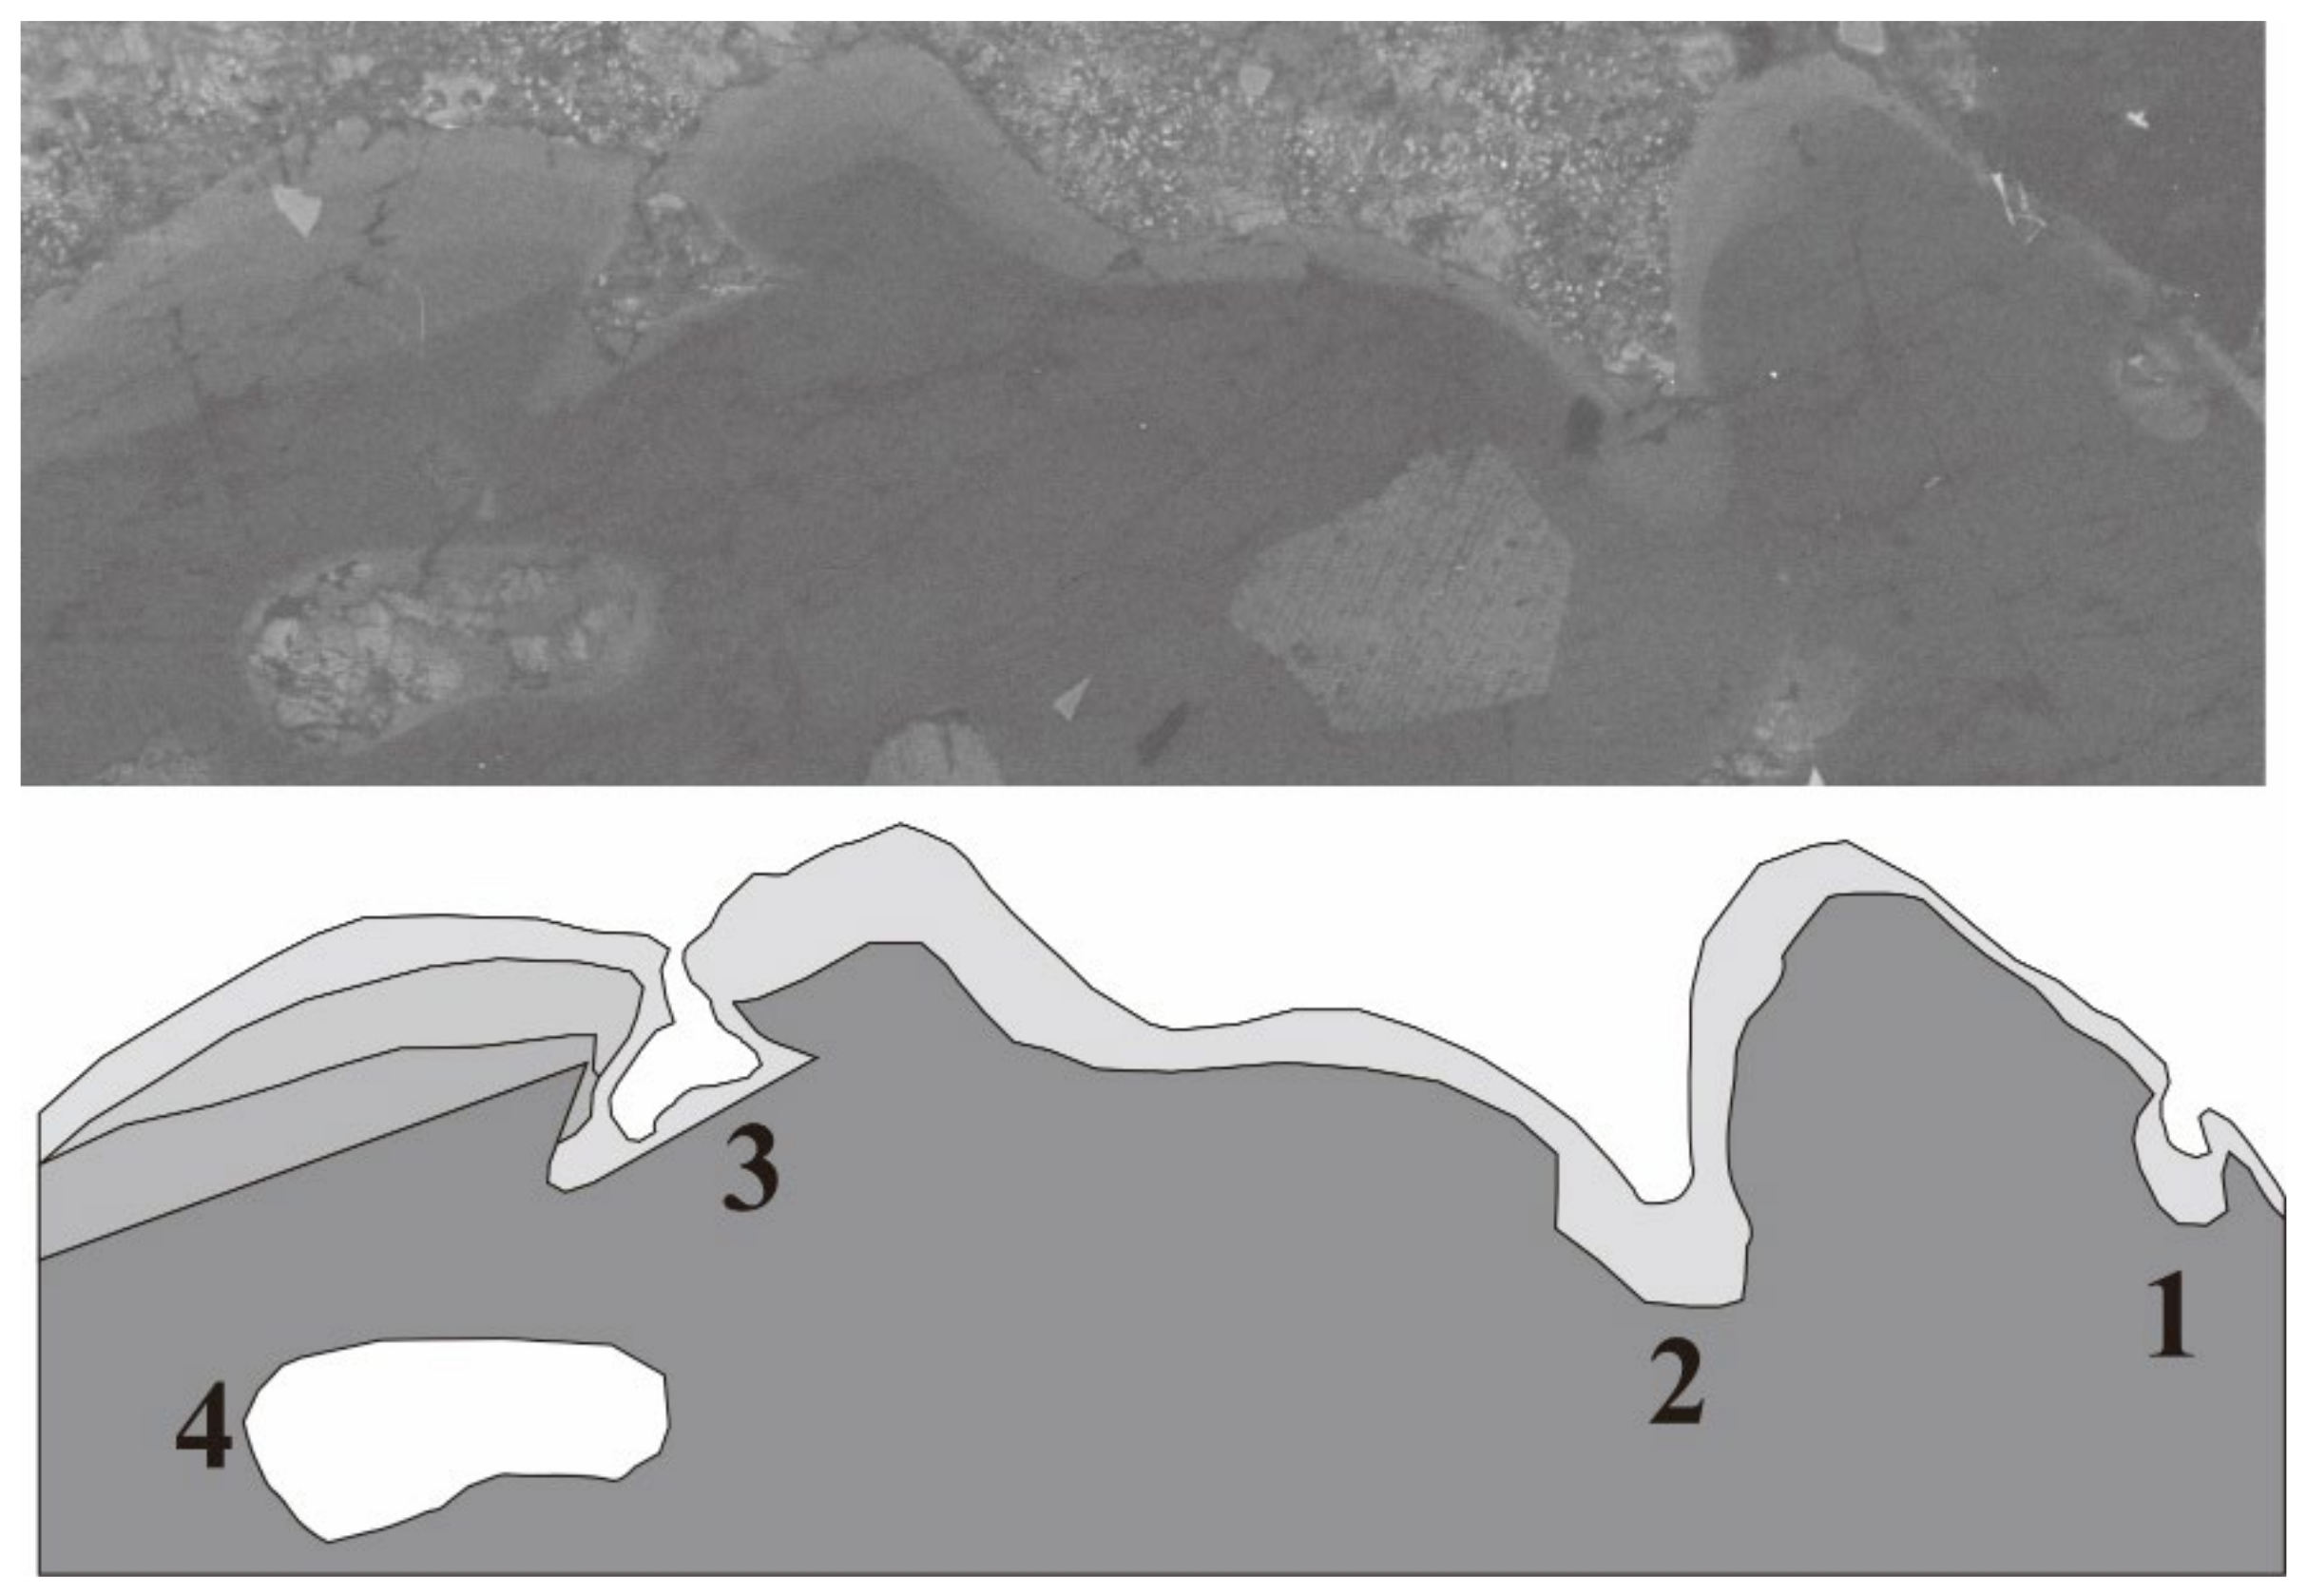
2.1. Internal Texture

Quartz’s internal texture can be divided into primary growth textures and secondary structures. The former develop in early magmatic quartz phenocrysts, such as snowball quartz and comb quartz [20,29,68]. Comb quartz also has similar CL properties and structural features to snowball quartz (highly evolved topaz bearing albite granite), but it does not form double-ended crystals [29,56,68]. Variation in primary growth textures indicates disturbances in the growth and diffusion rates during crystallization. It depends on melt composition, crystal transport, the ascent velocity of the melt, and pressure and temperature changes. The diffusion rate controls the melt width of zoning and compositional variation [57]. However, with higher diffusion rates, fewer compositional differences occur in magmatic quartz. Moreover, the secondary structures result from alteration, which overprint and delete primary ones (see cathodoluminescence feature portion for further details) [5,21].
In at least 75 rock-forming and accessory minerals, i.e., silicates, oxides, halides, sulfide, carbonates, sulfates, phosphates, and magmatic and hydrothermally altered minerals, oscillatory zoning is seen to exist [69]. It is the variation in dark and bright luminescence belts, and it can record quartz crystal growth history. Zoning can be further divided into three parts: overall oscillatory zoning, partial oscillatory zoning, and no oscillatory zoning (Figure 3) [8,20]. Overall oscillatory zonation occupies the complete area of quartz crystals. This can be further divided into SOZ (simple oscillatory zonation covering the entire area) and MOZ (multiple oscillatory zones within the crystal). SOZ mostly shows rounded zonation, and it is formed under constant temperature conditions. Oscillatory zoning in some areas and no oscillatory zoning in other parts are characterized by partial oscillatory zoning. In euhedral and subhedral crystals, oscillatory zoning patterns are commonly observed, and no oscillatory zoning patterns are widely seen in L-anhedral and anhedral crystals, suggesting that no oscillatory zonation occurs at a late stage (low temperature) [59]. Ref. [70] indicated that oscillatory zonation formation arose from a diffusion-controlled intrinsic crystal growth mechanism. This is true for Toki granite, where the magma chamber undergoes physical and chemical changes only before solidification [71,72].
Step zoning and oscillatory zoning (formed at significantly lower temperatures) are characteristic of primary CL structures [8]. Step zones are characterized by external factor variations, bordered by resorption surfaces, and truncate pre-existing growth zones. These resorption surfaces show SiO2 undersaturation, resulting in the rounding of crystal nuclei caused by isothermal decompression or temperature change (i.e., crystal settling or magma mixing), as commonly seen in eastern Erzgebirge granites and rhyolites (Figure 4a) [21,36]. Quartz nucleation usually occurs on small mica or feldspar grains, but occasionally two or more quartz crystals form around one particle (Figure 4b). In addition, foreign particles enter the quartz lattice and are preserved as inclusions (Figure 4c) [21,24]. These surfaces (i.e., dendritic growth textures; Figure 4d) are due to temperature and magma composition changes.

Cathodoluminescence Features

The emission of light after the excitation of solid material using high-energy electrons is known as cathodoluminescence (CL) [73,74]. Commonly used electron beam excitation conditions for CL analysis are 10–20 kV acceleration voltage and 5–15 μA/mm2 current density. The electrons of the subjected material are excited by incident electrons, and their direct de-excitation from conduction to the valence band results in the emission of CL [39]. In quartz, the CL ranges from near-ultraviolet (350 nm) to near-infrared (750 nm) [73]. Volcanic quartz has mostly red (590–780 nm), violet (380–435 nm), and medium to bright blue (380–515 nm) CL colors, while plutonic quartz has bright to medium blue CL colors [1,39]. In addition, 380 nm and 450 nm are characteristic of Al defects in quartz and magmatic quartz, respectively. It visualizes grain texture, alteration patterns, different populations, growth zoning, and deformation features (i.e., Carcoar, Barry, and Sunset Hills granites in Australia, for example). Furthermore, fluid movement, quartz generations, and primary and secondary microstructures can also be observed by CL imaging, which cannot be distinguished by transmitted or polarized light [8,21,28,44,75].
Cathodoluminescence (CL) was reported more than 150 years ago, and the first report on quartz was submitted by [57]. After that, Ref. [76] investigated quartz CL characteristics from different crystalline rocks. He concluded that plutonic, volcanic, and metamorphic quartzes had different CL characteristics and could be differentiated based on these features [1]. Plutonic quartz may or may not display CL zoning, but it is characterized by dark CL streaks and patches, recrystallization textures, dissolution features, and weak CL intensities of the growth zones. Furthermore, volcanic quartz mostly displays CL zoning with well-preserved, more rounded and embayed growth zones and violet to red CL color (due to a strong 650 nm emission) [65,66]. Additionally, metamorphic quartz shows the least CL textural variations, a mottled texture, and close-spaced fractures (if tectonically deformed) with red, brown, violet, and blue luminescence [1,35,77]. In addition, granitic quartz is characterized by weak growth zonation with recrystallization and dissolution features [33,78]. Refs. [44,79] both concluded that CL imaging could be used for revealing shock damage in minerals due to meteorite impact.
Ref. [80] observed a decrease in CL intensity and Ti concentration in Land’s End pluton (UK) from a magmatic to a hydrothermal environment and an increase in Al and Fe concentrations. Muller further extended his research work in 2010 (Oyu Tolgoi and Zesen Uul porphyry systems in southern Mongolia) and reported that each of four quartz generations had distinct CL features, with a combined decreasing trend in temperature [34]. Ref. [4] correlated different source rocks of Cambrian quartz-rich sandstone by using quartz CL, grain morphology, and zircon U-Pb ages [1]. Ref. [44] added new input and presented the internal texture revealed by CL imaging (combined with other techniques) of Teplice rhyolites. Moreover, Refs. [81,82] used CL to support the paragenetic sequence of gold mineralization at the Bilihe deposit (China) and the Asachinskoe epithermal gold deposit (Russia).
CL is controlled by activator and sensitizer elements. Titanium, Al, Fe, H, Li, Mn, Ge, and Ga act as CL activator elements [57,83]. Activators are the impurities responsible for extrinsic luminescence, while sensitizers are the elements required for activators to produce luminescence. The diversity of cathodoluminescence patterns is divided into different zones, i.e., reverse zoning (dark inner and bright margin), normal zoning (bright inner and dark margin), random zoning (CL dark and bright alternating layers), and oscillatory zoning only (Figure 5) [84]. Normal zoning is related to a decrease in temperature conditions, while reverse zoning is characterized by increased temperature (i.e., due to magma mixing) [8]. These variations in CL intensity are due to structural defects in the quartz lattice [57,70,85]. According to [37], homogeneous CL properties indicated slow crystal growth, while inhomogeneous and patchy luminescence, wedge-shaped growth zones, and variable CL characteristics indicated the rapid crystallization of a rough or disturbed surface.
Cathodoluminescence textures can be divided into primary and secondary CL textures. The primary CL textures are developed during crystal growth and included euhedral crystals (with oscillatory zoning) and spheroidal, chalcedonic, and mosaic textures, while the secondary structures form during alteration, retrograde processes, and healing [57,69,85]. However, according to [75], each vein-type had its specific CL intensity, and it could distinguish mineralization events. Ref. [86] further explained that CL patterns displaying dark cores overgrown by bright rims, darker CL microfractures, recrystallization textures, or dissolution features are typical for plutonic quartz, especially in porphyry-related intrusions [52,77,87]. Volcanic quartz phenocrysts typically show well-preserved growth zones of oscillating CL intensities [1]. Metamorphic quartz typically emits a dull and homogenous CL response [35,59,77]. In comparison, hydrothermal quartz displays the greatest range of CL textures, representing large-scale physiochemical changes in the hydrothermal system [12].
Ref. [5] introduced lobate depressions at the crystal surface as growth embayments. These growth impediments (Figure 6) are caused by immiscible liquids, fluid-rich molten droplets, and vapor bubbles that stick on the crystal surface and obstruct crystal growth, which results in growth embayment. Bubble formation can be explicated by depressurization (degassing) before the main intrusion [5]. A few authors have supported the idea of embayment by magma mixing [45,88,89]. Ref. [45] further elaborated the point of view of [90] that fluorine could decrease the solidus temperature of melts to below 550 °C. According to them, with high fluorine activity in the fluid, the dissolution of the quartz was even faster, which facilitated the formation of extensive, deep, and sinuous embayments.
Crystals having embayments commonly show oscillatory, concentric, convoluted, and truncated growth zoning with variable CL intensities and may attach in groups or clusters [46,47,48,49,50]. According to Ref. [45], an embayed texture is common in many volcanic and shallow plutonic rocks. However, the intrusive rocks that have been observed at the Huangshaping deposit (China), the Empire Mine (USA), and the Antamina Cu-Zn deposit contain extremely embayed quartz phenocrysts. Chang called it vermicular quartz phenocrysts. These are due to the resorption of quartz due to magma ascent, decompression, magma mixing, and rapid growth [45,88,91,92].

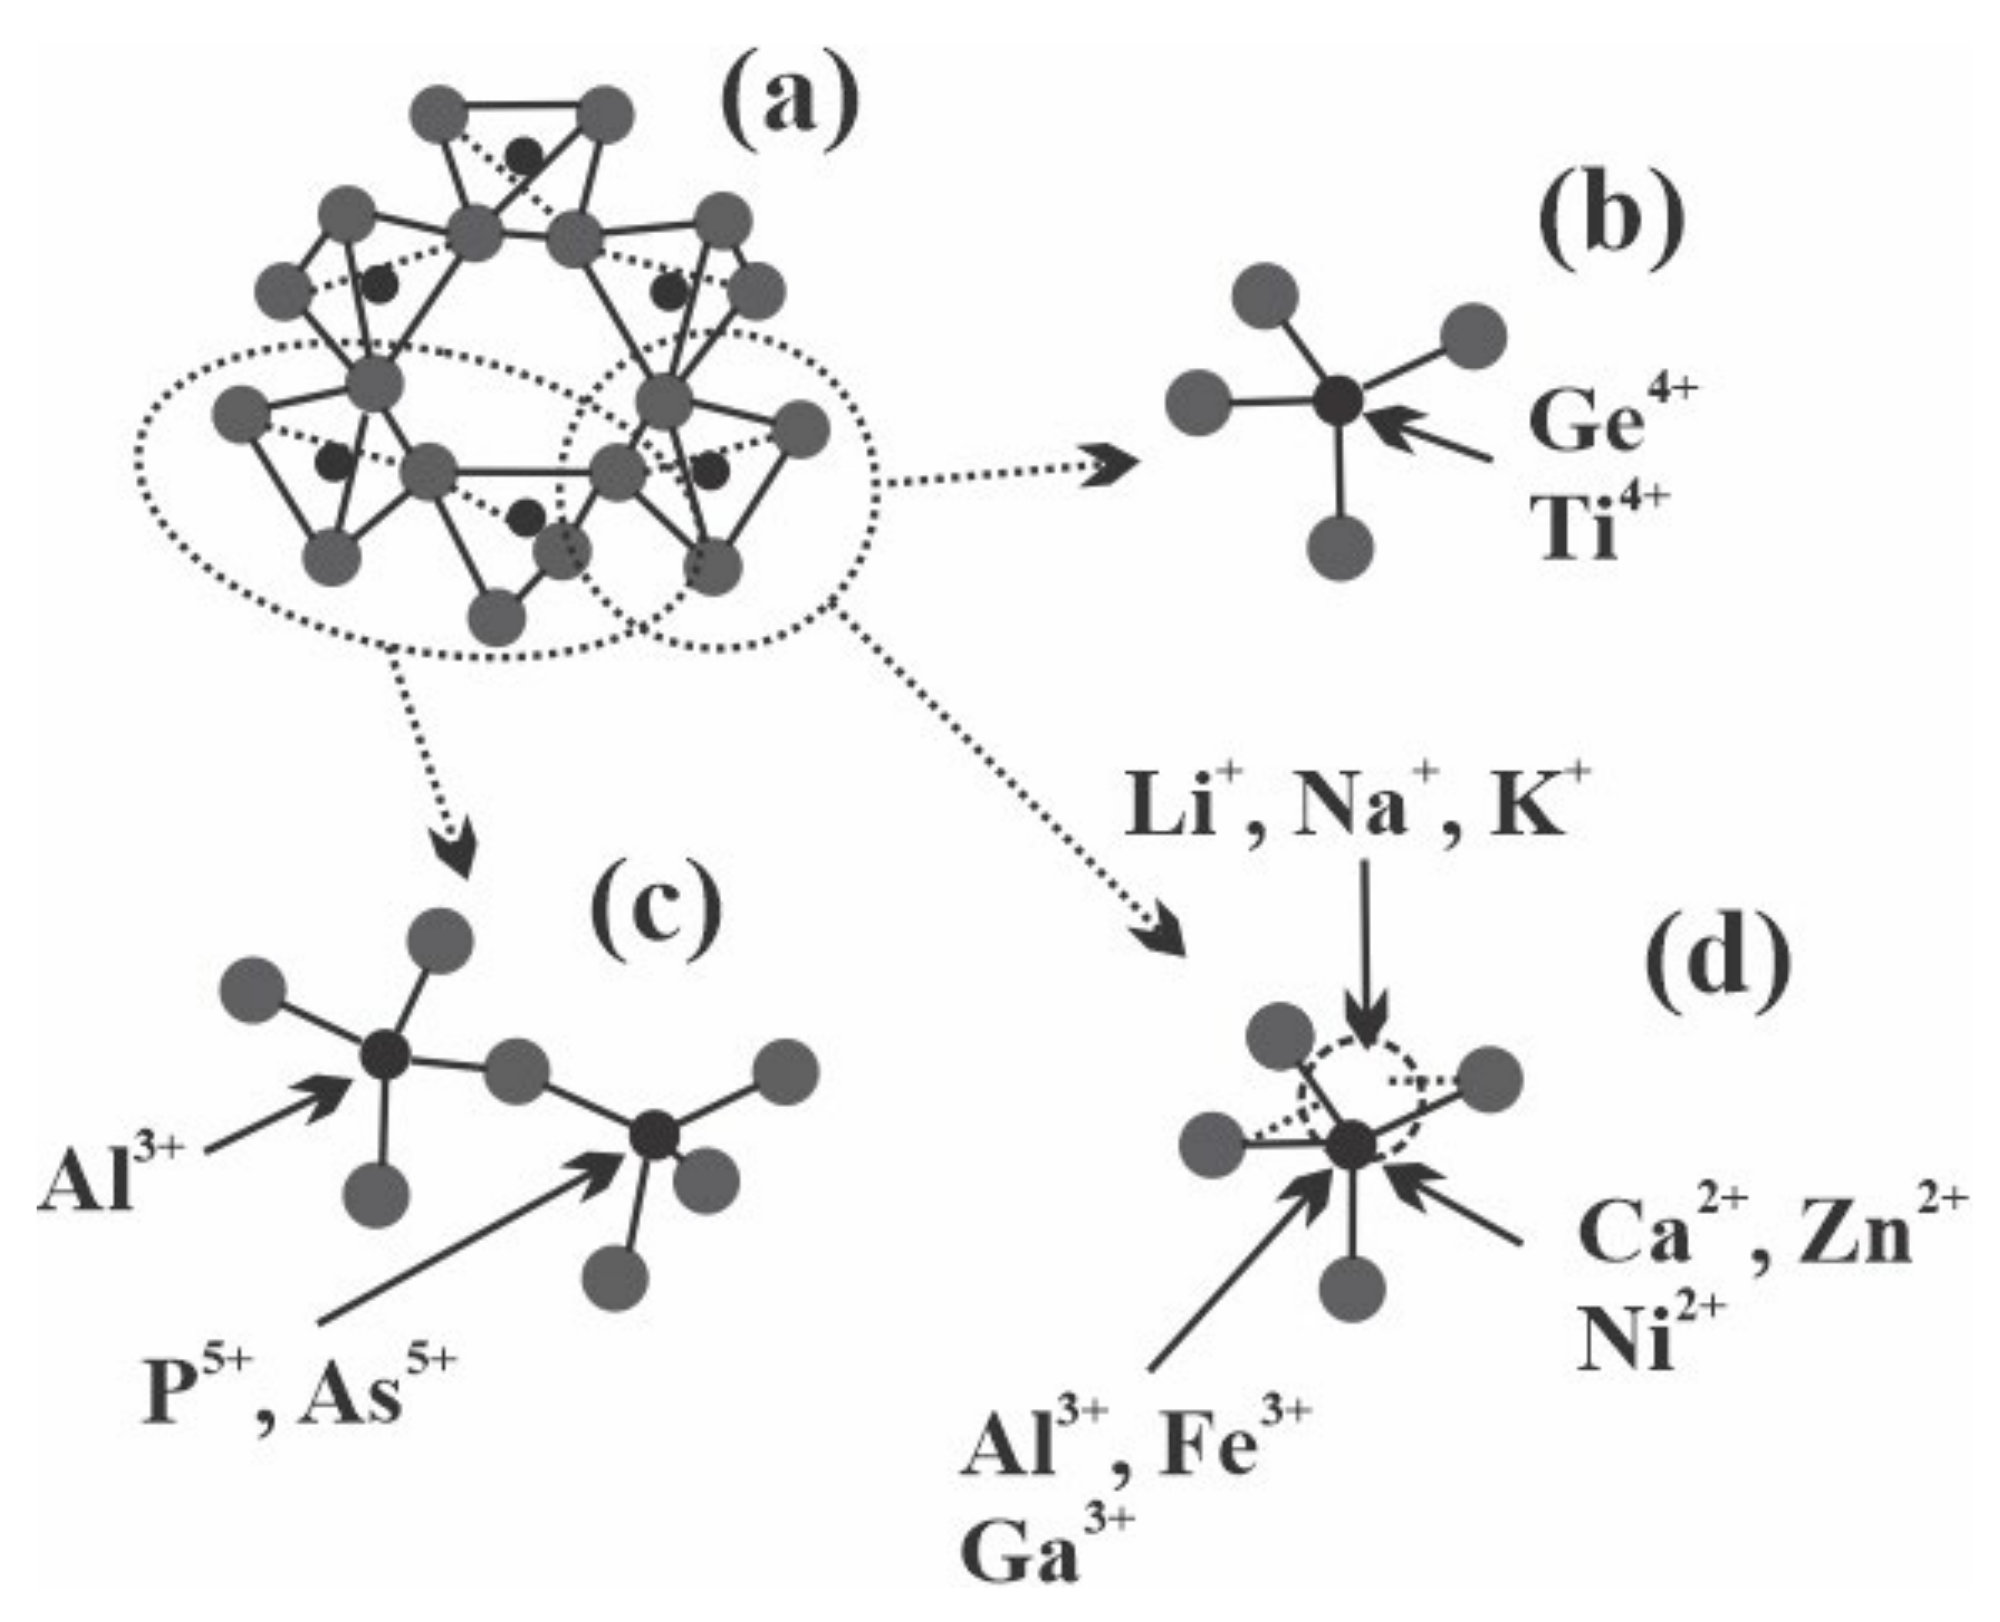
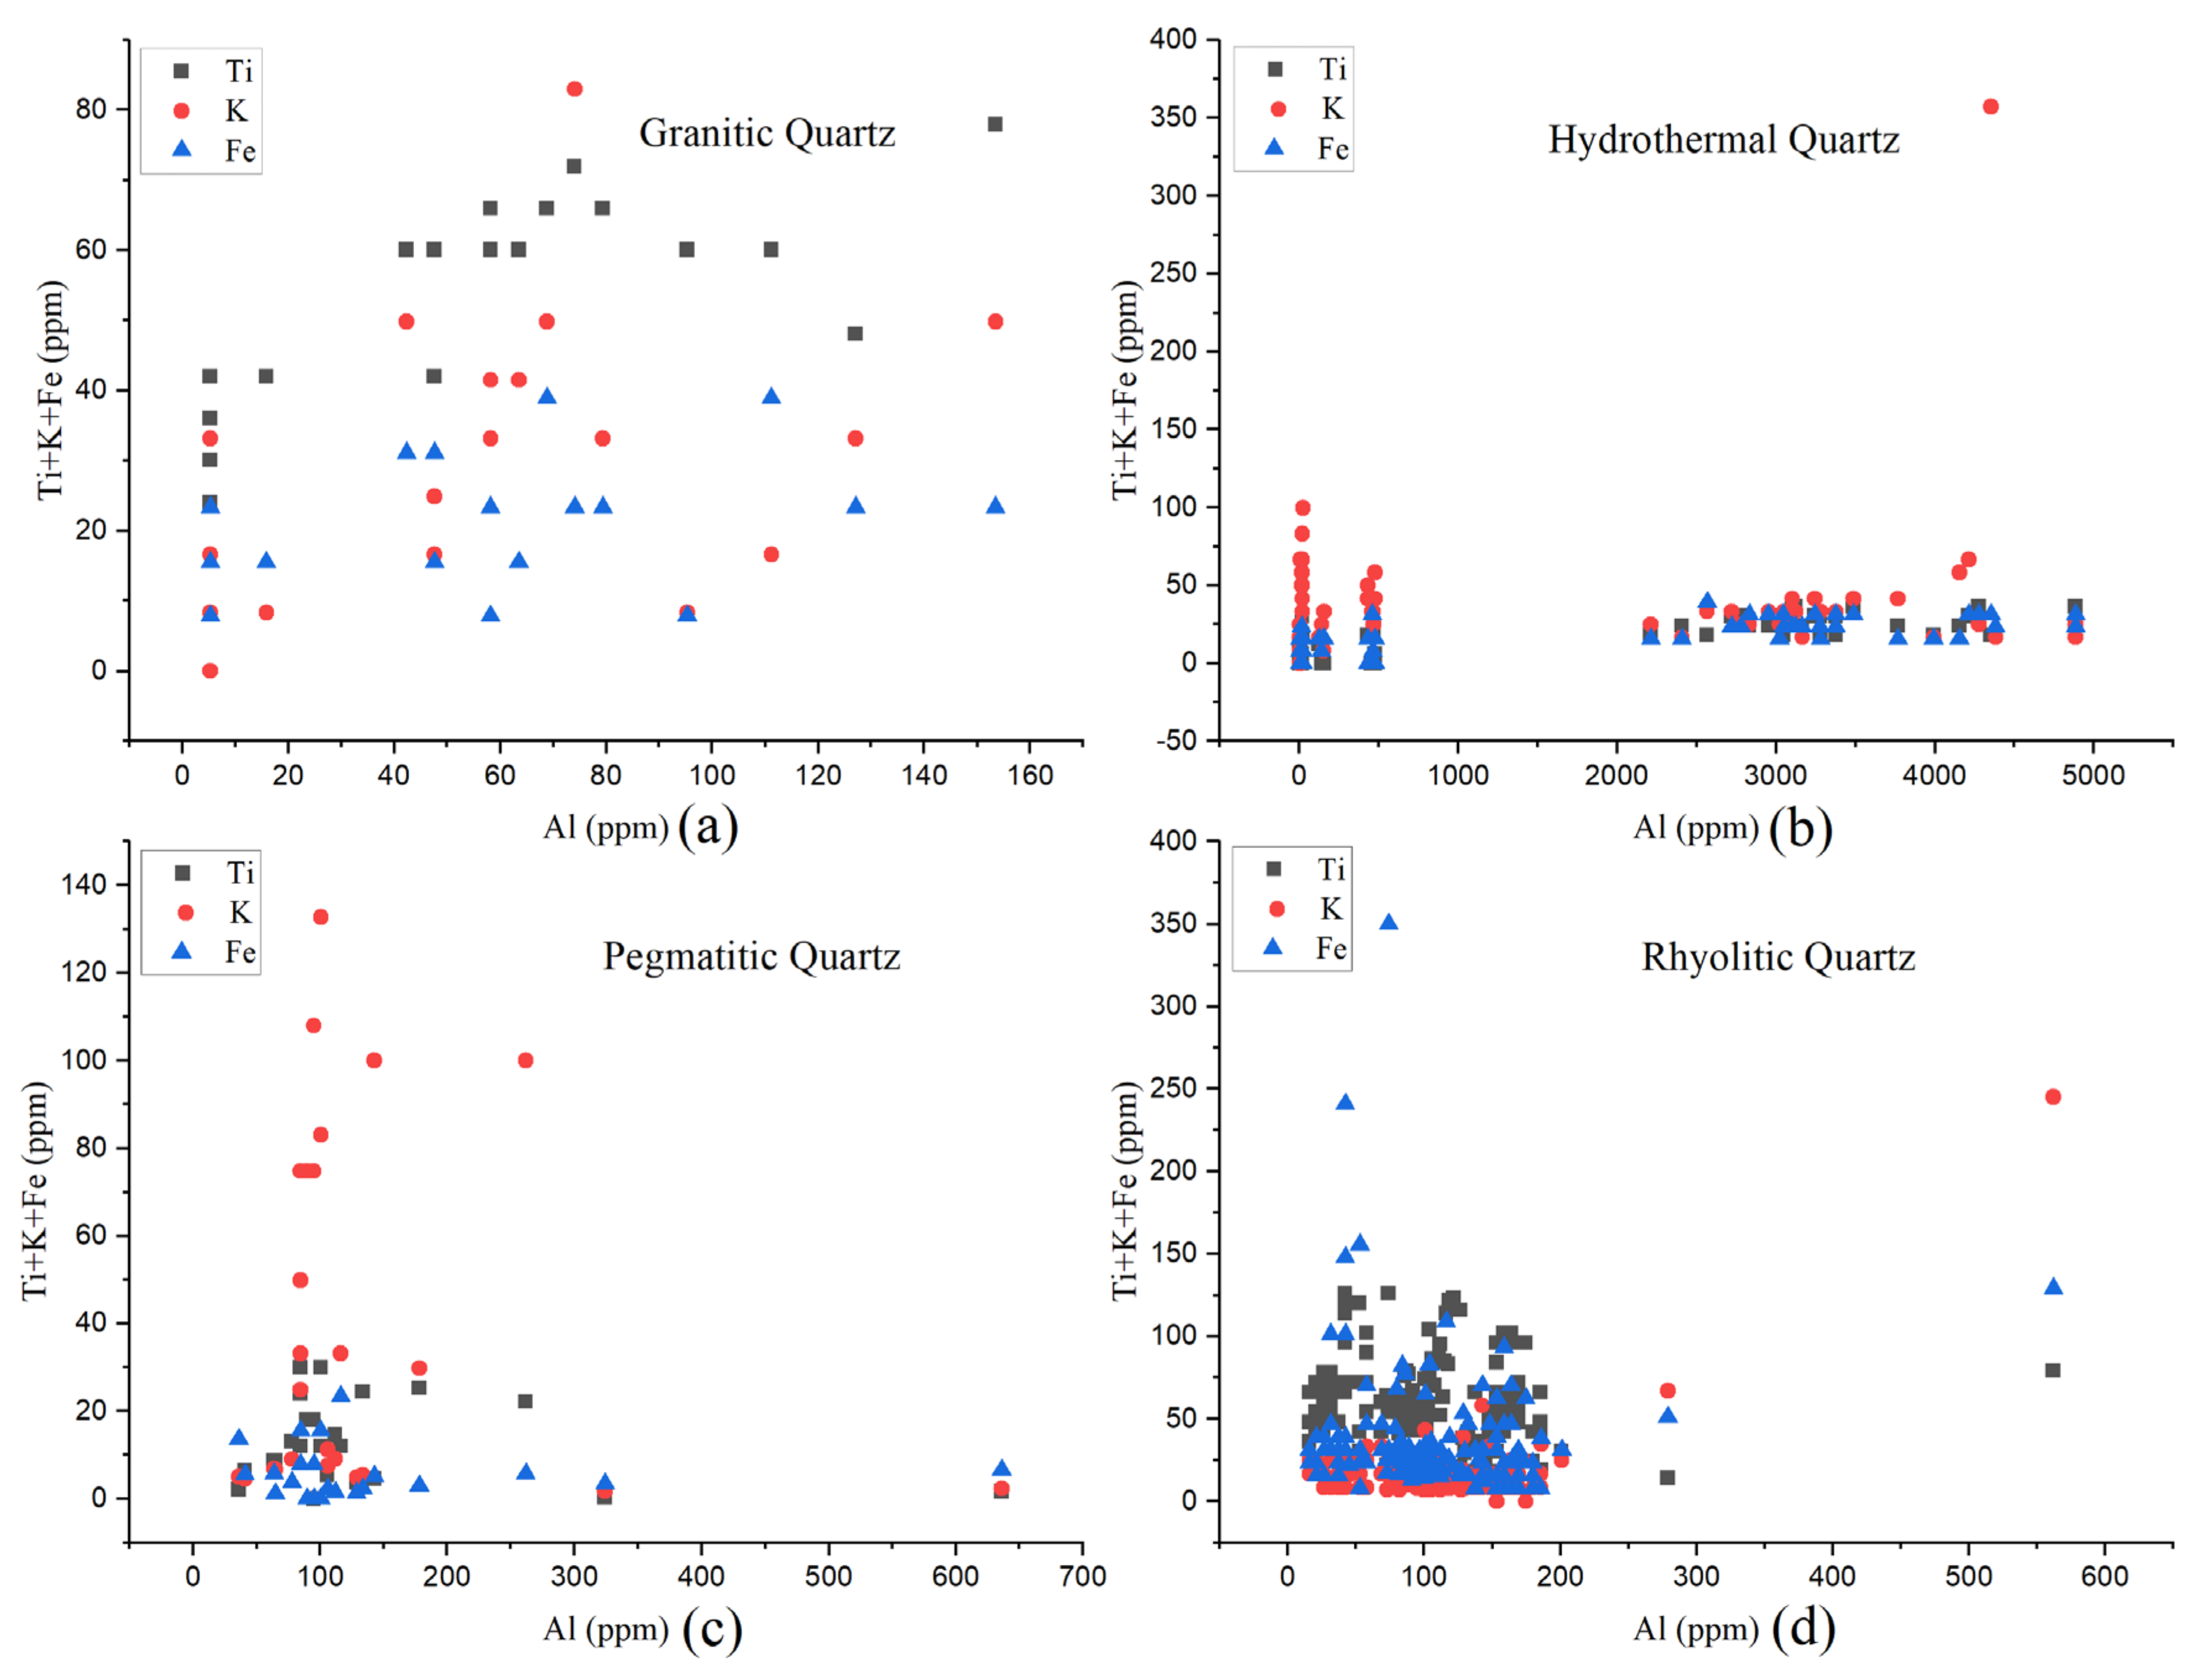
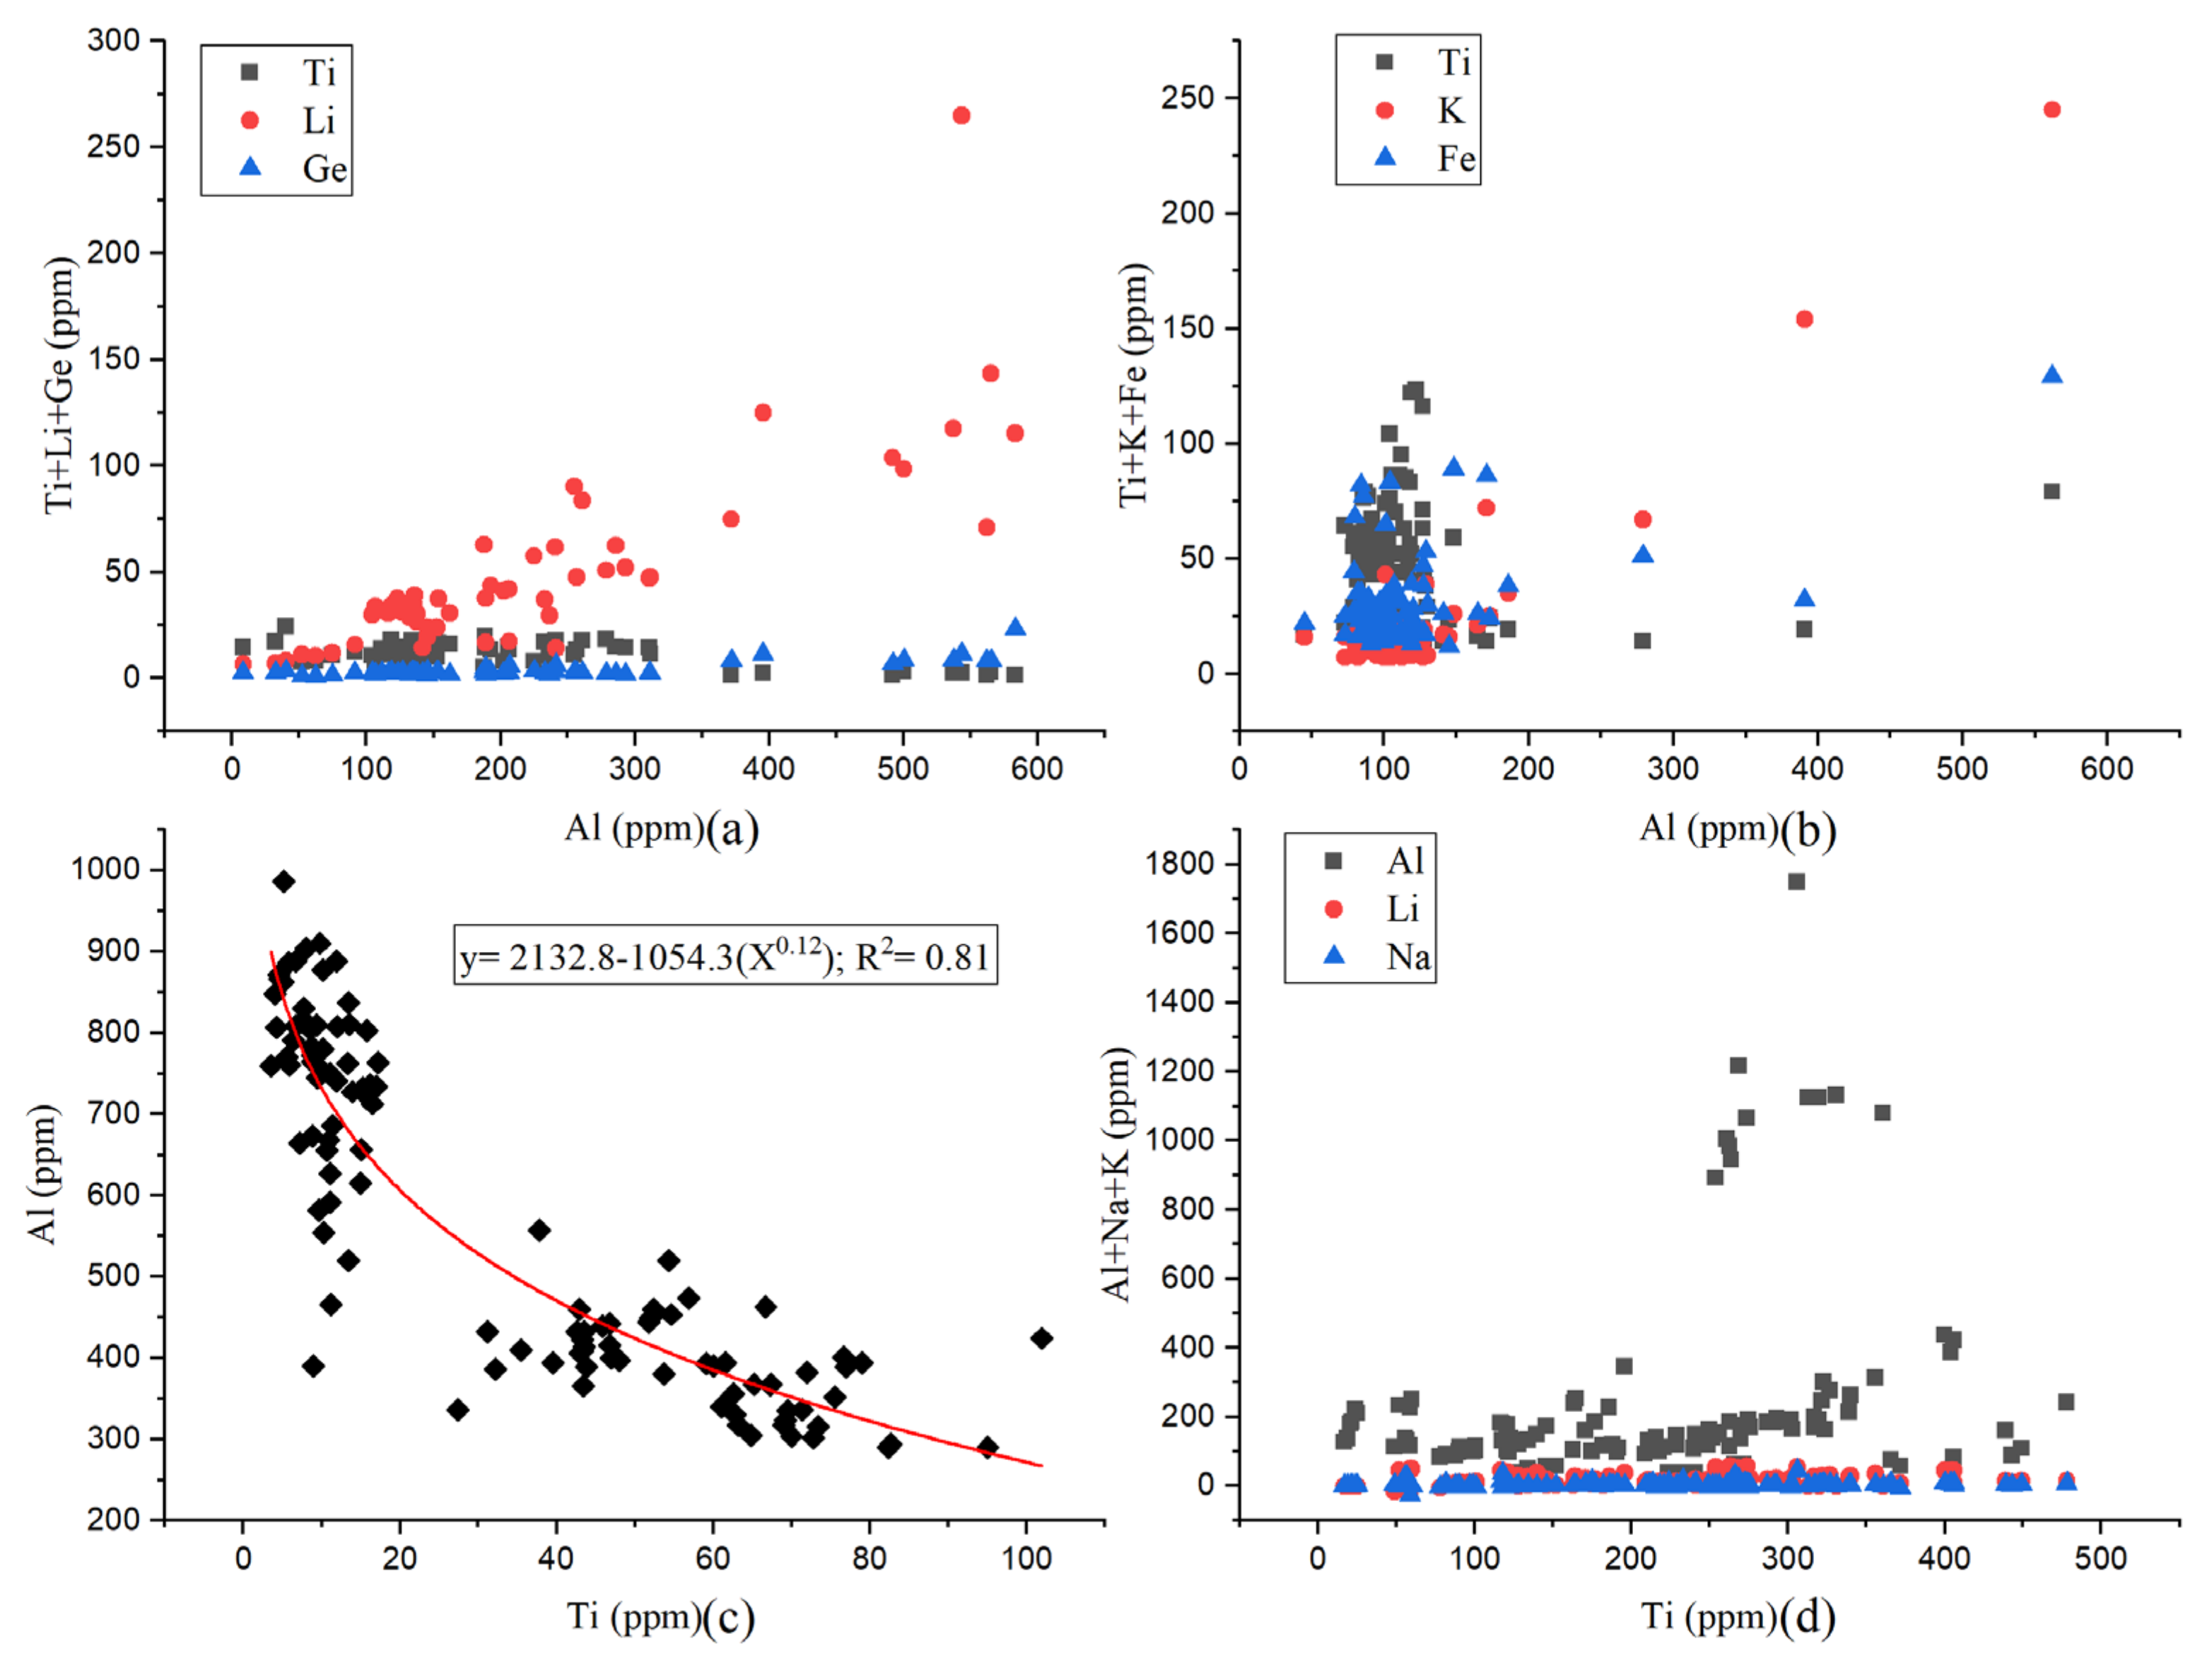
2.2. Chemical Composition

According to early studies by [93], there is little chance of using quartz compositional variation for genetic interpretation [21]. Since then, numerous studies have revealed that quartz trace element contents vary significantly among different environments within zoned crystals and have been used to differentiate magmas of different origins (i.e., for better understanding of the fractionation process) [21,22,23,24,87]. Currently, the combination of LA-ICP-MS and cathodoluminescence imaging is widely used to select and determine quartz trace element chemistry. In magmatic quartz, trace elements are susceptible to petrogenetic processes and can record the origin and evolution of rocks [23,33]. The dominant trace elements are Al, P, Li, Ti, Ge, K, Ca, and Na in magmatic quartz (Figure 7a). Furthermore, according to [23], greater than 50% of the bonds are covalent. Their concentration is controlled by their abundance in the melt, the pressure, the temperature, and the physio-chemical conditions of the system [7,9,23,33,94]. High Ti and low Al concentrations are recorded in the early crystallization stage, and vice versa [56].
According to Ref. [24], quartz may integrate otherwise incompatible elements into its atomic lattice. Grain boundaries are important Ti mobilization conduits with higher point defects and vacancy concentrations and are presumed to result in the higher solubility of incompatible components [62,95,96]. In the quartz lattice, Ti4+ and Ge4+, both tetravalent ions, occur as a simple substitute for Si4+ (Figure 7b) [23,65]. Phosphorous and bismuth, pentavalent ions, are integrated as coupled substitutions with Al3+ or another trivalent ion (Fe3+, Sc3+, Ga3+, or B3+) in two neighboring silicon tetrahedron structures (Figure 7c). A trivalent cation (Al3+, Fe3+, Sc3+, or Ga3+) enters quartz to substitute for Si, which needs monovalent (Li+) or divalent cations (Ca2+, Ni2+, Cr2+, or Be2+) as charge compensators (Figure 7d) [23]. Furthermore, lithium is also an important element, after Al and Ti, that enters the crystal lattice of igneous quartz with a content more significant than 10 ppm (Figure 8a) [26]. The special relationship between Al and Li is due to their close ionic radius (0.535 and 0.76 Å), making them suitable for charge balancing when they participate with Al compared to other elements, such as Na and K (1.02 and 1.38 Å).
Ti4+ and O2 typically form six-fold coordinated octahedra. High crystallization temperatures (more than 500 °C) are required to fit the Ti4+ into a four-fold coordinated quartz lattice [21]. The Ti intake depends on the melt temperature, pressure, and activity of TiO2 [8,20,41,51,58,60]. Ref. [35] indicated that Fe could also incorporate into quartz as a substitutional ion for Si or bound on mineral micro-inclusions [97]. In magmatic quartz, the average Fe concentration rises at high temperatures at the grain margin, suggesting a high Fe diffusion rate at higher temperatures [57]. Additionally, Fe act as an activator and a quencher, while Fe+3 and Fe+2 participate in interstitial and substitutional positions [98]. On the other hand, K shows a positive relationship with Al, indicating that K acts as a charge compensator (Figure 8b) [21]. As we can observe in Figure 8c, in magmatic quartz, the Al concentration is sharply reduced with increasing Ti concentration. Contrarily, Al also shows a positive relation with Ti between 200–400 ppm, while Li and Na do not show any specific correlation with Ti (Figure 8a,d). According to [7], Ti solubility was not affected by changes in the Al and Na concentrations, which indicated that Ti solubility was not controlled by the excess of other trace elements.

2.3. Relation between Internal Texture and Trace Elements

Cathodoluminescence with trace element chemistry has been considered a prevailing approach to understanding quartz paragenesis from different environments, such as plutonic, volcanic, hydrothermal, sedimentary, and metamorphic environments [75,99,100,101,102,103]. Previously, several attempts have been made to combine CL characteristics with trace element analysis [5,42,52,56,87,104]. In igneous quartz, CL correlates positively with temperature and Ti concentration (i.e., the Cinovec and Zinnwald deposits, Czech Republic) [12,41,86]. Additionally, this Ti (as well as Li, Al, and Na, to some extent) solubility in quartz is a function of temperature, pressure, melt composition, and crystal growth rate [7,49,60,105]. This correlation can also be observed at several porphyry copper deposits such Butte, Oyu Tolgoi, Bingham, El Slvador, El Teniente, and Los Pelambres [34,35,54,76,106]. Thus, relatively brighter CL (higher Ti) zones may indicate crystallization at relatively higher temperatures or lower pressures [41,60,105]. Ref. [107] further indicated that Al-rich zones were associated with blue luminescence, but the luminescence intensity was not related to Al concentration in these zones, while [63,108] observed a positive correlation between Al concentration and CL intensity [86]. This can be further explained, as Al is positively correlated with CL intensity in most high-temperature quartz. However, in most low-temperature quartz, the Al and CL intensities are inversely related (i.e., Red Dog, Jerritt Canyon, Butte Main Stage, McLaughlin, and Creede deposits) [12].

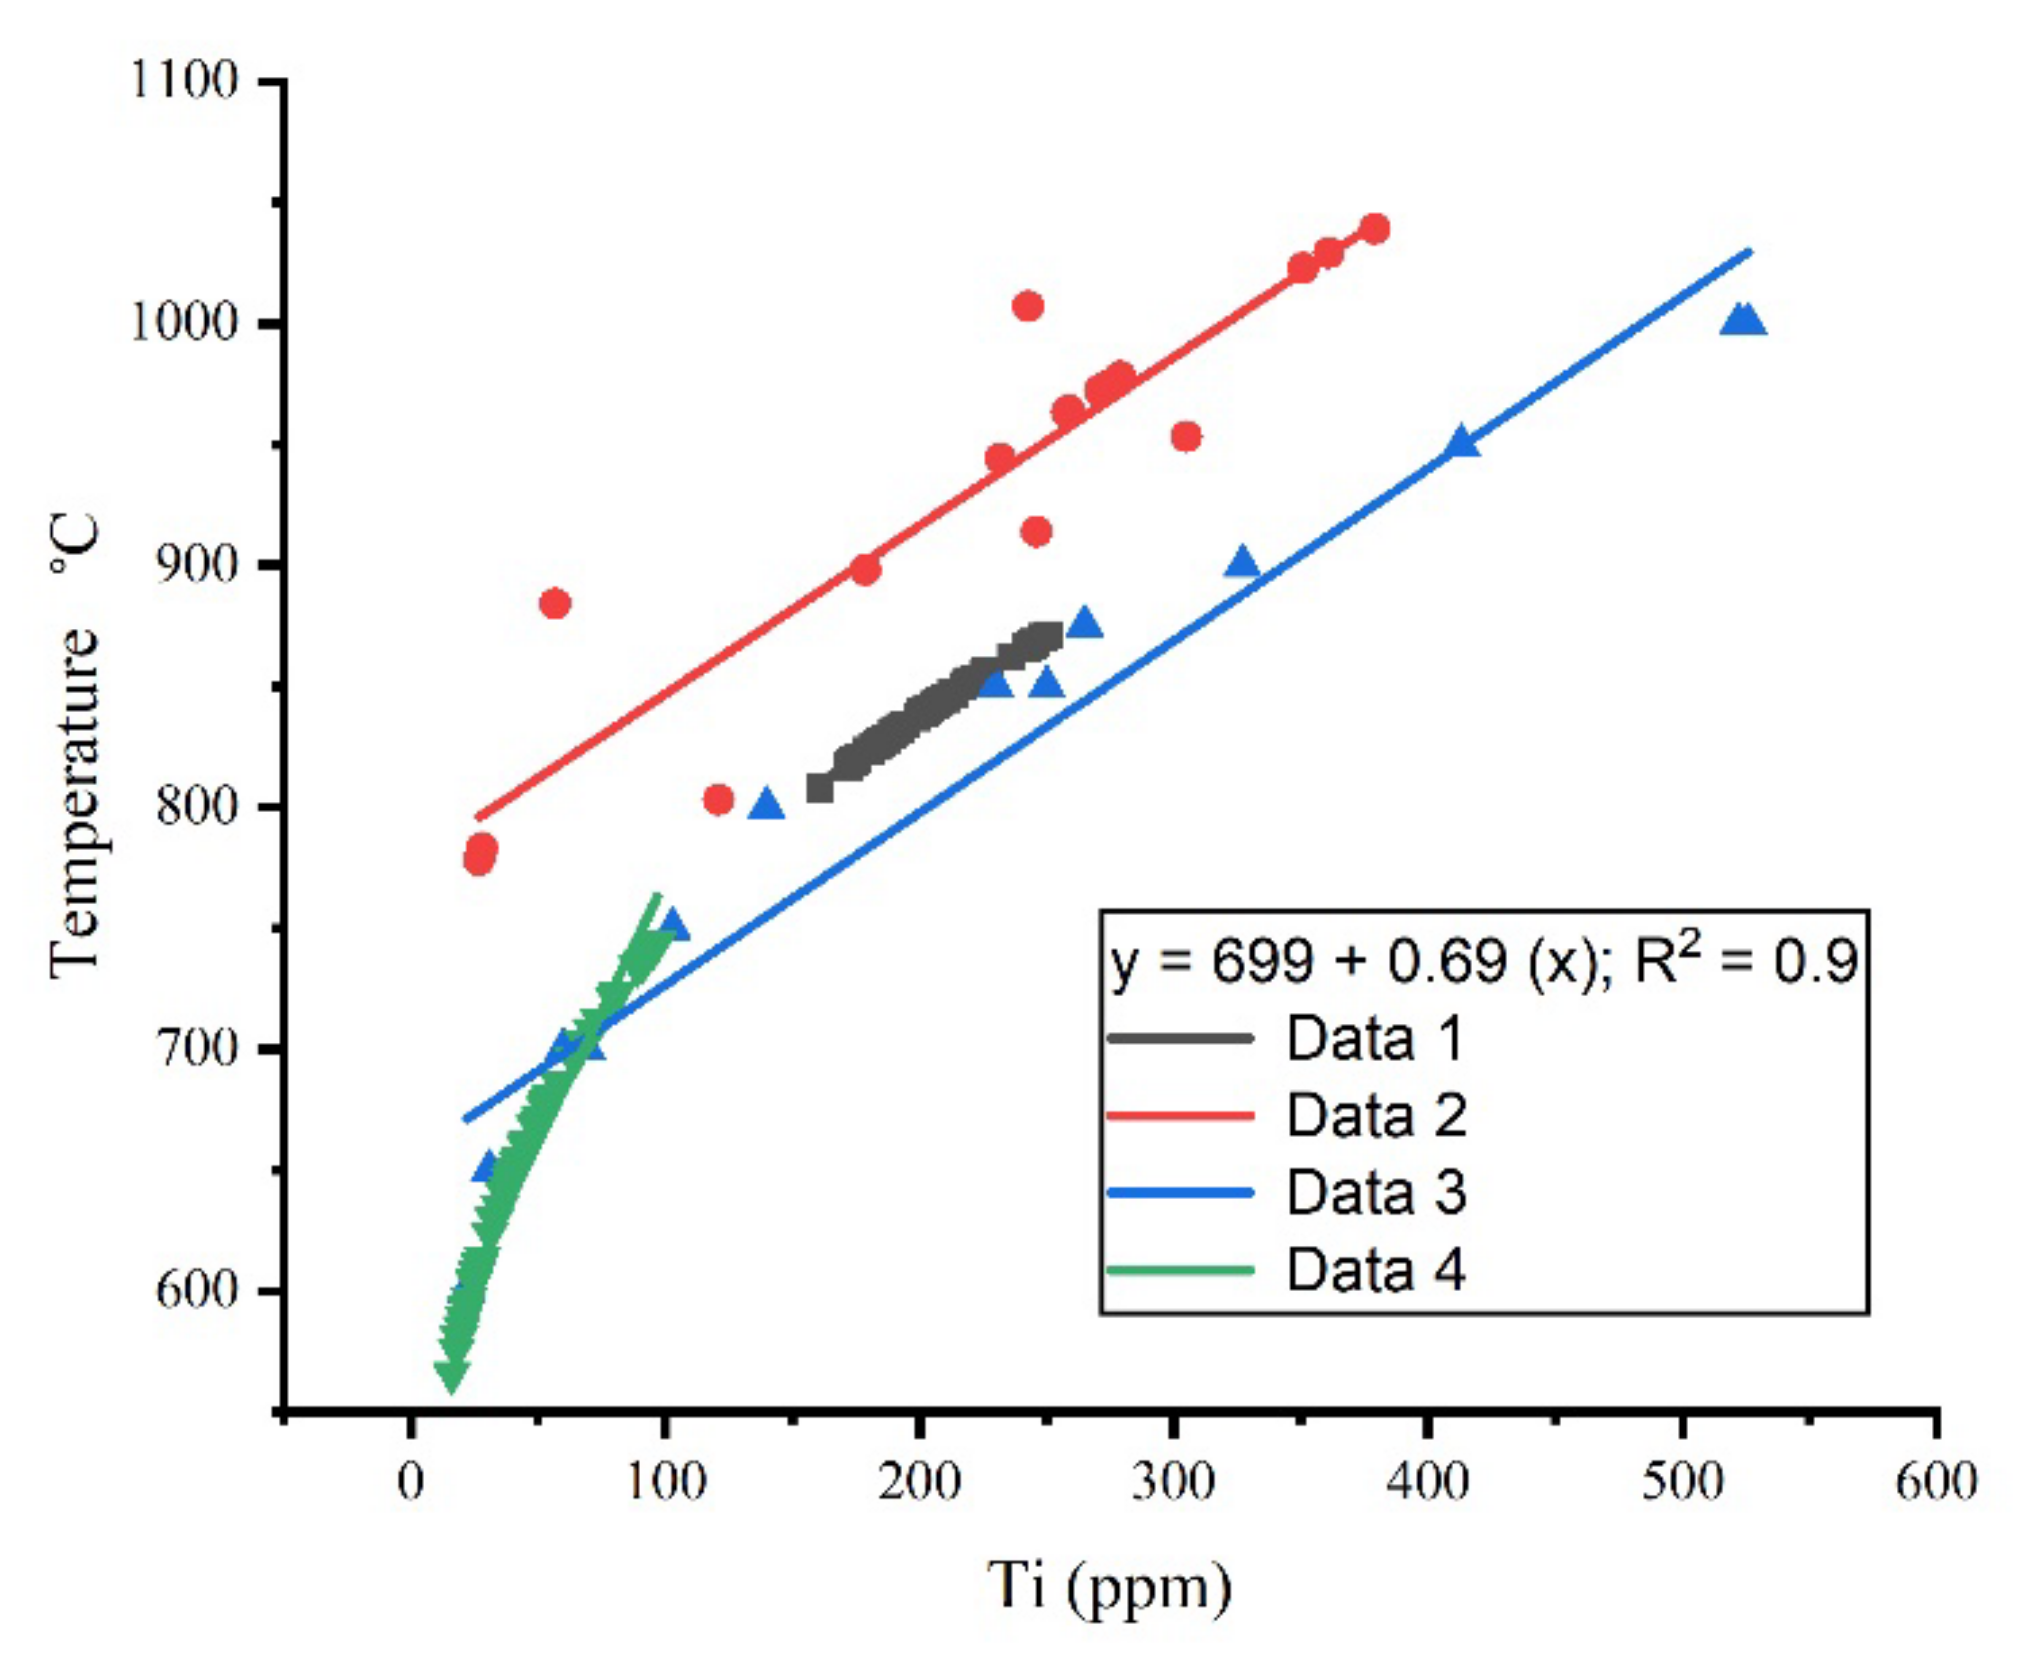
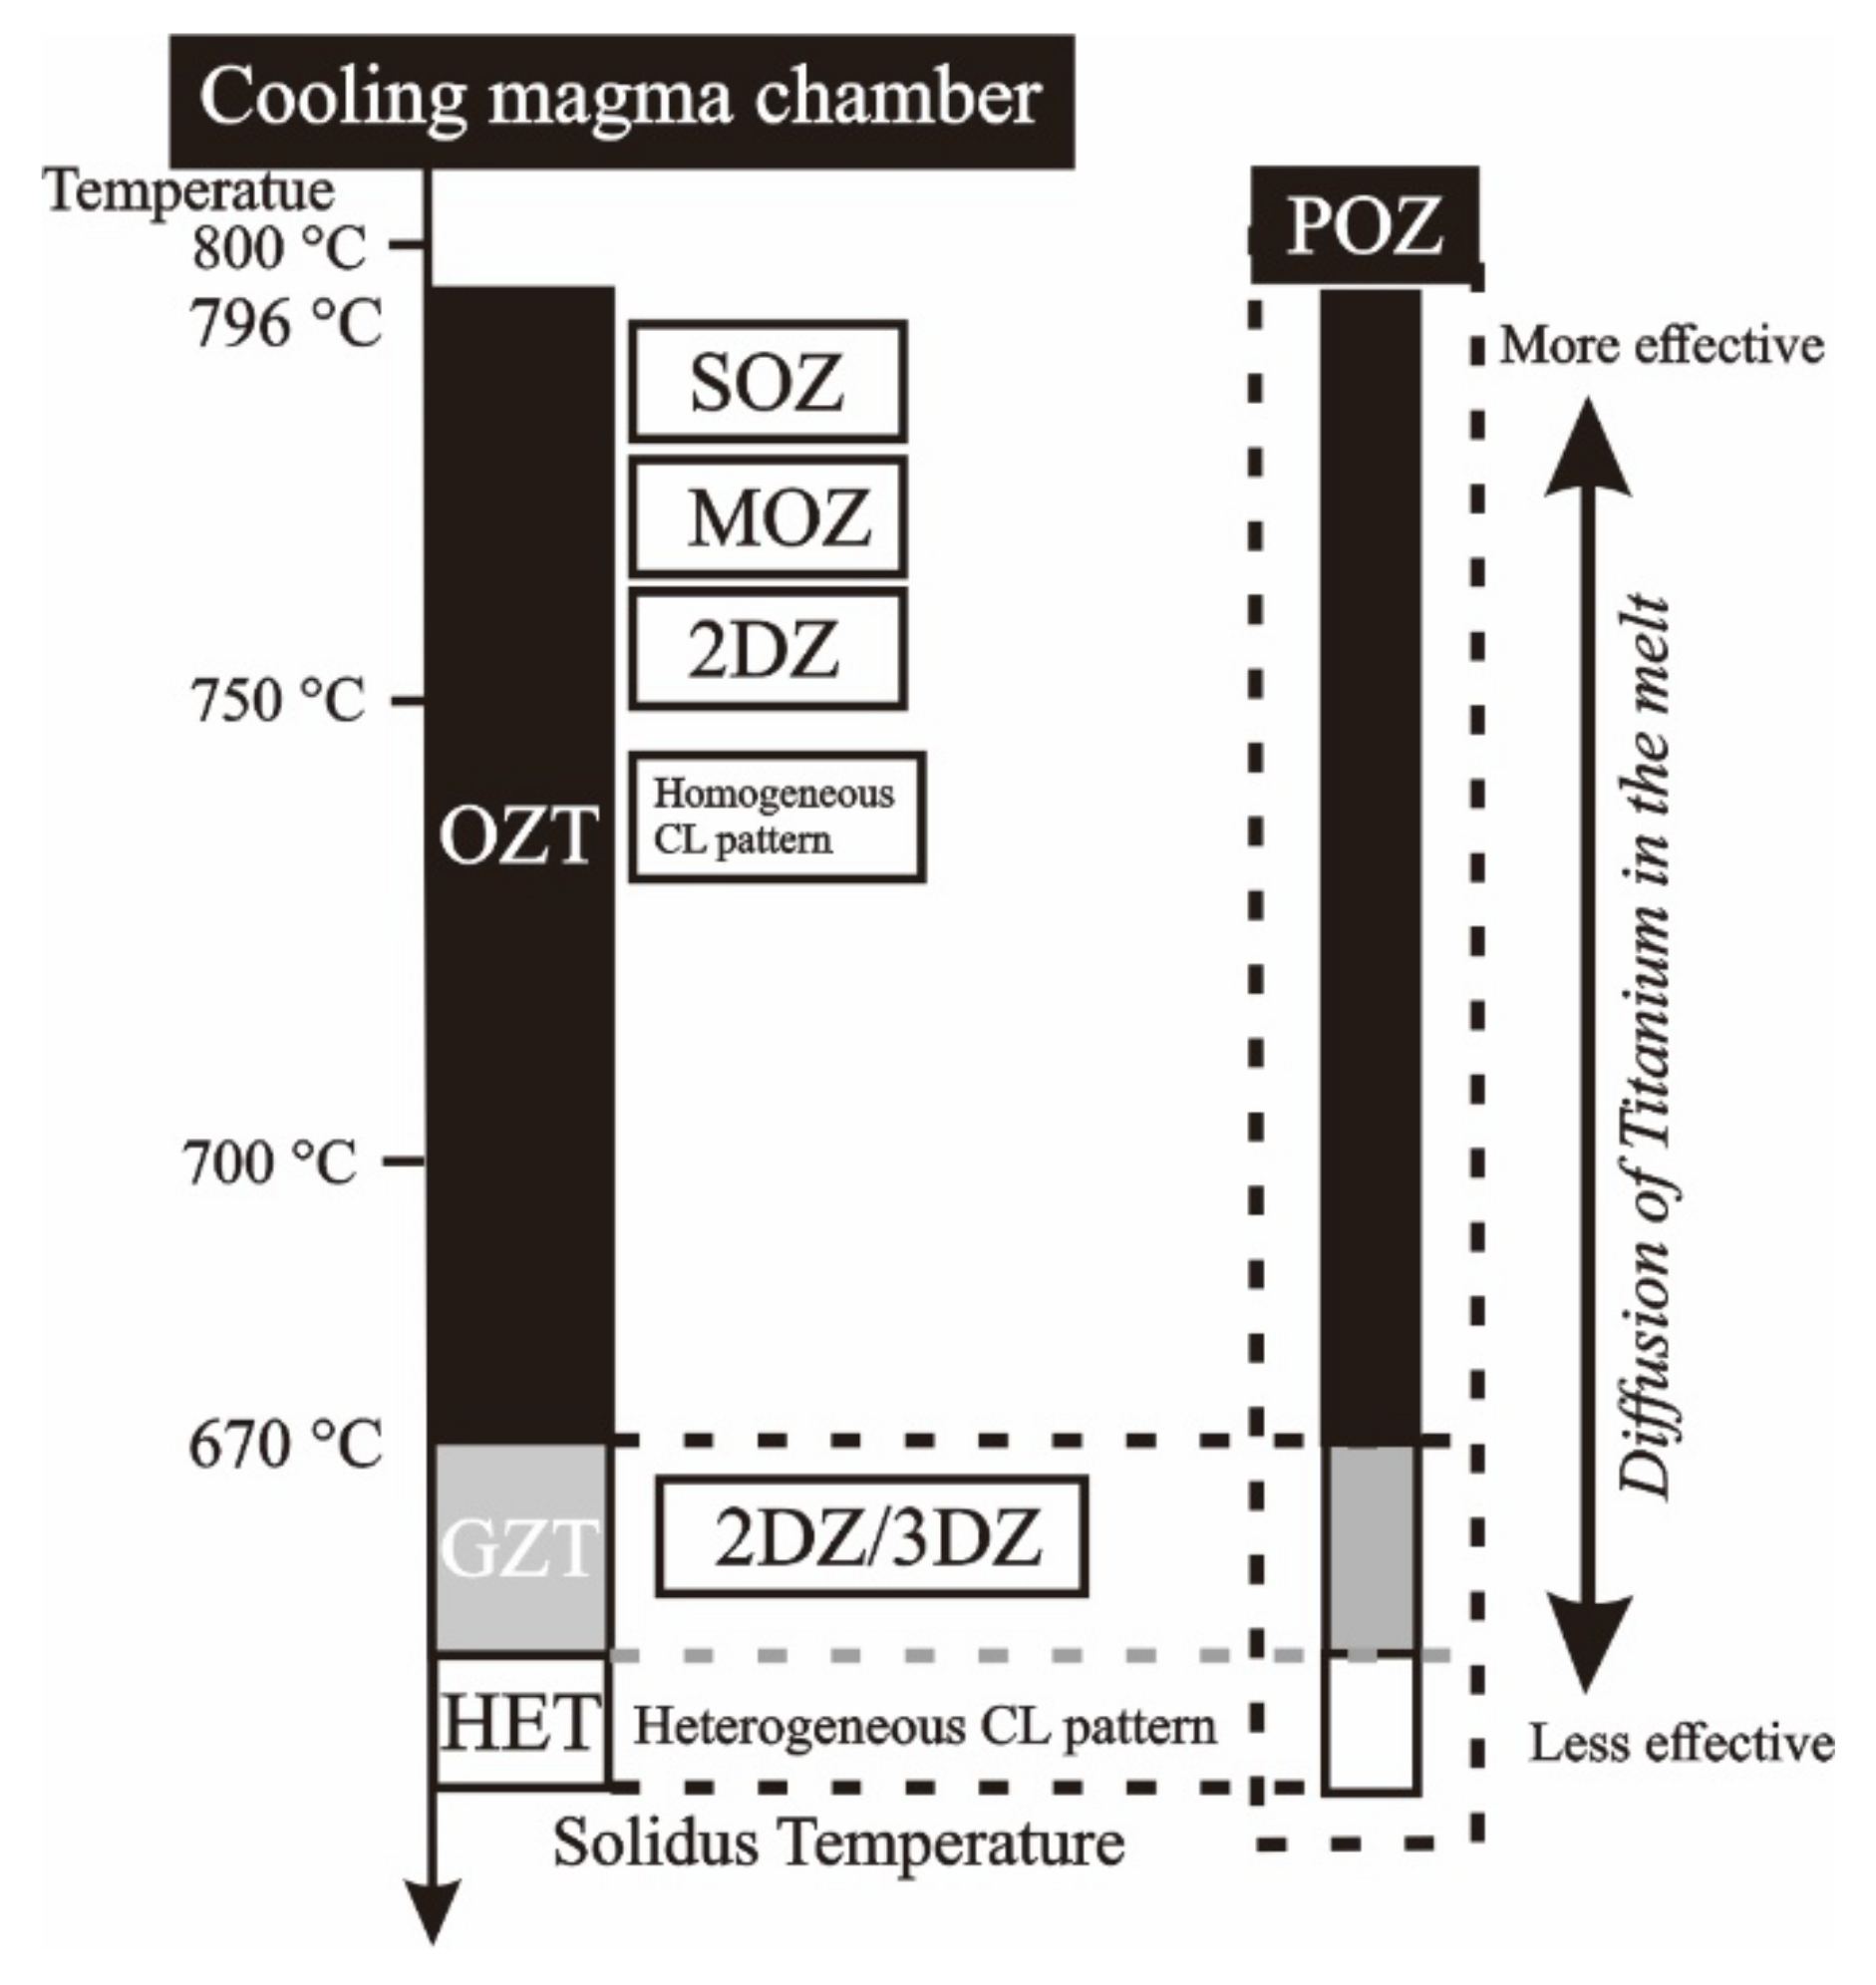
2.4. Titanium Diffusion

Grain boundary diffusion is expected to have a considerable influence on Ti mobility [62]. Over the temperature range of 700–1150 °C, the following Arrhenius relation was obtained for diffusion: DTi: 7 × 10⁻⁸ exp (−273 ± 12 kJ mol−1/RT) m2sec−1 [38]. Over the temperature range investigated, i.e., 1000–1400 °C, the grain boundary diffusion of Ti was between three and four orders of magnitude faster than lattice diffusion. It can be expressed by the following Arrhenius relationship: D (m2s−1) = 2.0 ± 0.08 × 10⁷ exp (−195 ± 7 kJ·mol−1/RT) [62]. In volcanic and plutonic rocks, titanium content is usually used to quantify crystallization temperatures, partially due to diffusion, to determine the time scales between the formation and eruption of quartz [41,42,109,110,111]. According to Ref. [38], rates of Ti diffusion in quartz were thought to be primarily a function of temperature, with higher temperatures enabling greater diffusion rates. For example, at 500 °C, Ti was found to have a diffusion rate of approximately 2 µm per Ma in quartz compared to 500 µm per Ma at 800 °C. These Ti diffusion-based techniques have also previously been used to solve metamorphic event time scales, the periods required to shape porphyry ore deposits, and to re-examine quartz crystallization temperatures [111,112,113,114]. It was also observed that elements with higher atomic masses (i.e., Ti) had lower diffusion rates compared to lighter elements (i.e., Li and Al) [53].

2.5. TitaniQ Thermometry and Genetic Programming (GP)

TitaniQ has diverse applications in determining temperature estimates in high-grade metamorphic rocks, hydrothermal veins, magmatic rocks, migmatites, mylonites, and deformed rocks [7,34,61,62,115]. The idea of using the titanium content of quartz as a thermometer was initially developed by Ref. [116]. Later, a TitaniQ thermometer was designed by Ref. [41], and it was based on mineral quartz [7]. This method is easy to use (requires only one phase of analysis) and has a high precision (±2 °C) for rocks that are formed at greater than 500 °C [41,117,118]. Some authors have used it to better understand magma chamber processes [119,120]. A TitaniQ geothermometer operates under the principle that, at higher temperatures, quartz incorporates increasing concentrations of Ti [7,41,60,103]. Although TitaniQ geothermometers have been applied to natural systems where rutile is present, they can be applied to non-rutile-bearing systems if the Ti activity can be estimated [63]. TitaniQ thermometry and diffusion chronometry tell us how long and at what temperatures shallow, crustal magmatic systems remain partially molten, both of which are fundamental for assessing volcanic hazards [111]. Ref. [7] described that, due to very variable growth rates in hydrothermal environments, TitaniQ mostly worked in igneous quartz. Furthermore, Ref. [121] predicted that Ti incorporation into quartz should also be pressure-dependent.
Most recently, the pressure effect on TitaniQ was calibrated by Ref. [60] for pressures ranging from 5 to 20 kbar. His model is relevant to hydrothermal quartz in the upper few Km of the Earth’s crust, and it requires the Ti content, pressure, and activity to calculate the temperature. Ref. [7] further extended this research work and elaborated that, at a fixed temperature, the Ti concentration increased with decreasing pressure, while at a fixed pressure of 1 kbar, the concentration increased with increasing temperature. Over the temperature range of 600–1000 °C at 1 GPa pressure, Ref. [41] obtained the following relationship: T(K) = −3765/log (XTi,QtzTiO2) − 5.69. In this study, genetic programming (GP) was used to generate a model for measuring the temperature by merely obtaining the Ti concentration of magmatic quartz (for details, see Table 1). It is a technique used for artificial intelligence that automatically produces models based on genetic evaluation, regression, and neural approaches. GP does not need to predefine the function and adds or eliminates various parameter combinations on its own [122]. These gene-expression-programming (GEP) models have been compared with other published models and with linear and nonlinear regression. It was concluded that GEP outfit other models and proposed inflexible accuracy [123,124]. These models are using in geoscience for obtaining better results.

3. Characteristic of Hydrothermal Quartz

Quartz is one of the most common hydrothermal minerals. It is formed from fluids of different origins and compositions under a wide range of temperature (50–750 °C) and pressure conditions [35,37,43,67]. Unlike other hydrothermal minerals, hydrothermal quartz is chemically simple and unreactive and maintains its geological history [125]. The trace element content is typically too low to allow growth zones to be imaged by back-scattered electron or transmitted light microscopy. The most important trace elements in hydrothermal quartz crystallized below 450 °C are Al, Li, Na, and H [37]. It was also observed from the Gigerwald deposit that the inclusion of poorer regions showed a correlation between Li and Ge with Al, indicating that the presence of fluid inclusion does not affect the concentration of lattice-hosted trace elements, except Na [37]. Additionally, it was also possible to reconstruct T-P conditions based on fluid inclusions for hydrothermal quartz if the fluid inclusions did not suffer from post-entrapment modifications [7].
More extensive trace element contents indicate growth disturbance at lower temperatures (<250 °C), reflected by sector zoning, even though sector zoning is not essentially an indication of disturbance [7,125]. The possibility of sector zoning was addressed in previous research on amethyst, smoky, and hydrothermal quartz oxygen isotopes, but it followed different trends than trace element sector zoning [17]. It was due to disequilibrium in the crustal–fluid element partitioning because different faces incorporated different numbers of elements. Crystals formed below 300 degrees at Gigerwald and Vattis signified growth and sector zoning. In contrast, crystals from Grosstal, which formed at 400 degrees, did not have growth or sector zoning. This indicated that the presence of growth and sector zoning in hydrothermal quartz was related to low temperatures, different face growth mechanisms, and the fluid medium composition [17].
Hydrothermal quartz is frequently idiomorphic and zoned and displays discontinuous internal fabrics, indicating that growth conditions are periodically changing. According to Ref. [54], the higher the growth rate, the higher the trace element incorporation. Fast-growing zones contained the lowest Li and H to overcome the charge deficit and, in that case, intrinsic defects (i.e., oxygen deficiency centers) existed that affected the luminescence properties (e.g., Gigerwald deposits) [37]. Ref. [12] noticed CL variations in low-temperature quartz, where Ti was below the detection limit, meaning that variation in other trace elements also affected the CL intensity.

3.1. Internal Texture

Hydrothermal quartz exhibits uneven textures, including multiple secondary textures, under SEM-CL [35]. These textures are an important indicator of fluid processes and mineralization events [35,126]. The most frequently found CL textures in hydrothermal quartz are euhedral growth zones; rounded overgrowth cores; micro brecciation; rounded or wavy concentric zonation; a homogeneous texture; mosaic textures; xenocrystic cores; and spherical, and spider, textures [37,67,127] (see Table 2 for further details). According to Ref. [21], post-magmatic recrystallization textures, such as fluid saturation textures, cannibalizing, and metasomatic quartz textures formed by hydrothermal processes, showed either weak red-brown or no luminescence [21]. Refs. [12,35] reported that quartz geological settings could also be predicted based on CL textures, and they distinguished between epithermal, porphyry-type, and orogenic Au deposits (details are in the comparison section). As such, mineral replacement (a secondary texture) was pronounced in pseudomorphs (original crystal shape is preserved and replaced by quartz), which was common in some epithermal ore deposits (i.e., Red Dog Pb-Zn deposit as a reference) [35].
The variation in CL intensity results in a form of growth and sector zoning. Many authors have reported different points of view about sector zoning [128,129,130], but a comprehensive answer was presented by Ref. [67]. According to the author, sector zoning was controlled by anisotropic processes operating at the crystal surface (i.e., surface topography). Furthermore, according to Ref. [131], sector zoning occurred as a euhedrally terminated crystal with featureless characteristics in transmitted light, while concentric zoning was referred to as variation in growth zones. Sector zoning determines disequilibrium growth and is limited mainly to the exterior zones at <250 °C. The latter (concentric zoning) is characterized by incorporating larger trace elements [125]. Early quartz is dissolved by hydrothermal fluid, and later CL dark quartz fills the fractures and pore spaces (secondary textures) created in early quartz. These dissolution features include rounded or embayed bright cores with euhedrally dark CL overgrowths.
Table 2. Some typical hydrothermal quartz textures with their features.
Sketch of TextureTexture TypeGrain SizeGrain FormCommentsReferences
Minerals 12 01042 i001Oscillatory Zoned Euhedral CrystalVariablePrismatic
  • Primary texture
  • Common in epithermal and other low-temperature quartz
[35,127]
Minerals 12 01042 i002Spherical textureFineAnhedral
  • Primary texture
  • Only observed in epithermal vein
[35]
Minerals 12 01042 i003Mosaic textureFineAnhedral
  • Primary texture
  • Results from rapid quartz precipitation upon pressure drop in porphyry-type hydrothermal systems
[35,132]
Minerals 12 01042 i004Spider and cobweb textureFinePrismatic/mimics host
  • Secondary texture
  • Common in porphyry-type deposits
[35]
Minerals 12 01042 i005Sector ZoningVariable
  • Commonly observed in low-temperature deposits
  • Limited to the exterior zones of crystals
  • Commonly associated with disequilibrium growth
[86,125,131,133,134]
Minerals 12 01042 i006Rounded concentric zonationVariableVariableChanges in the chemical composition of the fluid or temperature of crystallization [131,133]

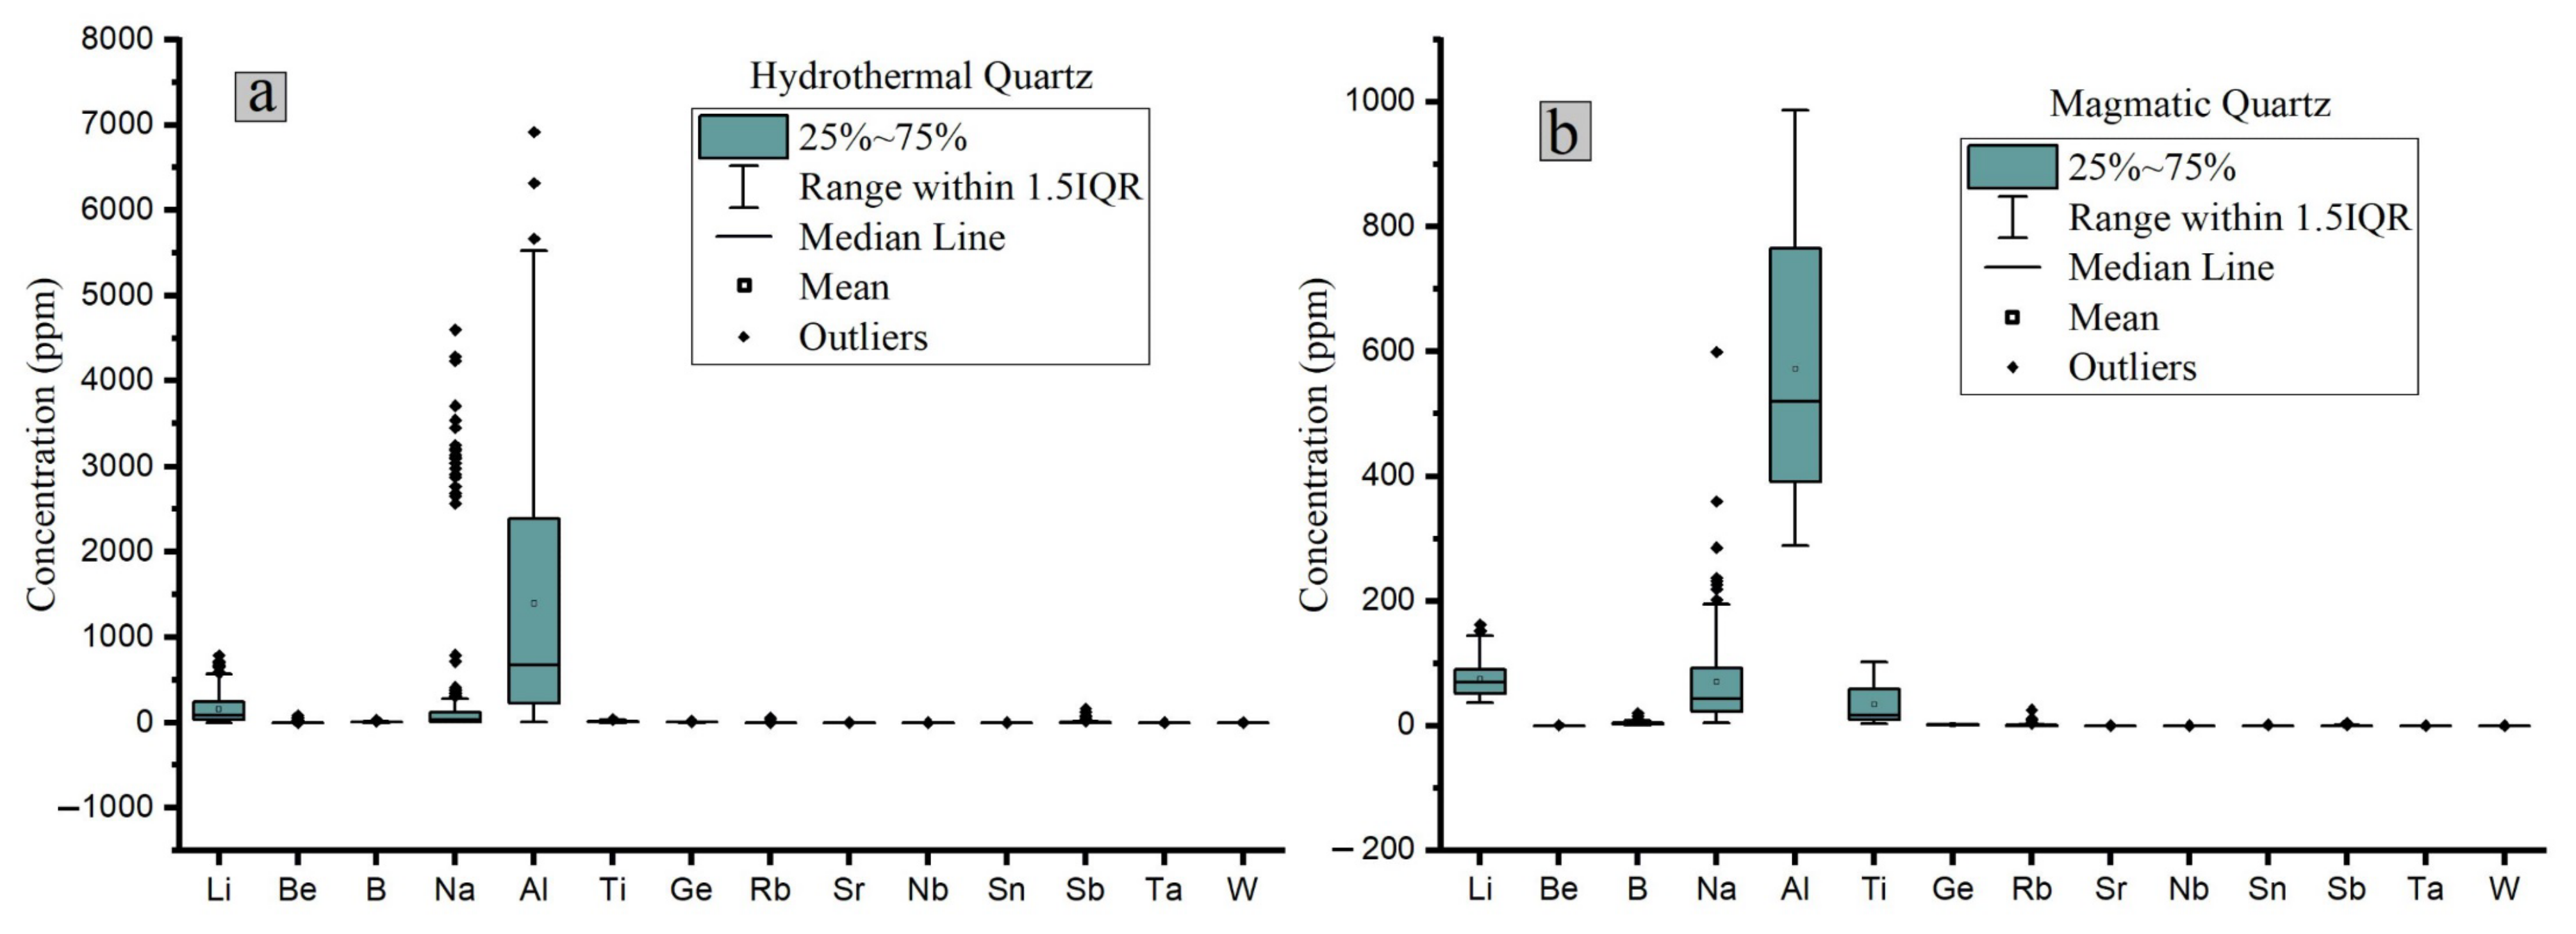
3.2. Chemical Composition

In terms of shape, geochemical variation, and origin of deformation, trace element variations in quartz have previously been addressed without any unified findings on trace elements [17,23]. Fluid chemistry, precipitation rate, crystal orientation, oxygen fugacity, pressure, and temperature are parameters that control defect incorporation in hydrothermal quartz [22,126,134,135]. The concentrations of trace elements vary according to the formation environment and are essential petrogenic indicators (for details, see the implications in the hydrothermal system section) [5,57]. For example, lower and variable Al concentrations (<1000 ppm) at the Woxi deposit in southern China, along with higher and variable Ti and Ge concentrations (up to 26 ppm Ti), suggested a less acidic, fluctuating pH; fluid mixing; and a higher temperature of composition. The Xikuangshan deposits, on the other hand, were distinguished by higher and homogeneous Al concentrations (>3000 ppm), as well as lower and homogeneous Ti and Ge concentrations (average: 2 ppm Ti), indicating a more acidic, stable pH; fluid boiling; and lower temperature fluctuation [136]. This indicated that the Ge concentration also decreases with decreasing temperature in hydrothermal quartz. Ref. [17] further elaborated the lower incorporation of Ge when more Al (+Li) was available.
Ref. [97] reported the substitution of Si by Al, Li*, and H* (* charge compensator; H impurity can be quantified with FTIR spectroscopy). This incorporation of Al into quartz lattice is supported by high contents of water and charge compensator elements [26]. According to Ref. [53], in quartz lattice, Titanium, Be, Fe, and K were compatible elements, while Ge, Li, and Al were incompatible, whereas P was transitional. Al requires a charge compensator compared to Ti and Ge, and Li, H, K, and Na lead to balancing charges (Figure 9) [35,37,125,127]. It has also been observed from the Gigerwald, Rohdenhaus, and Westland deposits that the Li/Al ratio is always less than one, suggesting that another ion should complete the charge, which can be achieved with the presence of hydrogen as hydroxyl substituting for oxygen. The strong correlation between Al and monovalent cations can be observed in low-temperature hydrothermal quartz, and in high-temperature hydrothermal quartz, this correlation is weak because of variable growth rates between Al and monovalent cations [37,53,137].
Low-temperature (110–300 °C) hydrothermal quartz data were collected from the Gigerwald (Switzerland), Rohdenhaus (Germany), and Westland (New Zealand Alps) deposits [37,73]. In quartz from these deposits, variations in Al concentrations were observed in all the samples, and variations in Li, Na, and Ge were observed in several. Titanium, K, and Fe were below detection in most of the samples. At lower temperatures, the aluminum fluctuation was more significant than at higher temperatures (>400 °C) [35,53]. According to some researchers, Al and Fe may be enriched in low-temperature quartz and, if supplemented with phosphorus, they may be increased at high temperatures [35,53]. This indicates that high P concentrations can also affect the Al concentration [56]. Additionally, according to [35,37], low-temperature hydrothermal quartzes, such as Mississippi-Valley-type quartz, alpine fissure quartz, and epithermal ore bodies, demonstrated the connection between Al and monovalent cations most clearly. Contrarily, in high-temperature hydrothermal quartz, this correlation also existed but was weaker due to rapid and variable diffusion rates among Al and the monovalent cations in quartz [137]. It has been observed in Mississippi, Carlin, epithermal, and zinc deposits from the Magmont Mine, Jerritt Canyon, Butte Montana, and Red Dog deposits, respectively, that aluminum and Li positively correlate with one another, but they do not always relate with Ti.
In addition, Ref. [126] described that, at the Mt. Leyshon deposit, only Li correlated strongly with Al (Figure 9), while Na and K correlated to some extent. This weaker correlation between Al and Na and K, rather than Al and Li, was due to their presence in fluid inclusions, while Li was due to point defects. Additionally, Al concentrations in quartz describe hydrothermal fluid Al concentration, which strongly depends on pH. Ref. [17] showed that a surge in pH resulted in a rise in tetrahedral Al compared to octahedral Al, which incorporated Al into the growing crystals, i.e., Alpine vein quartz growth zoning attributed to high pH aqueous solutions. However, a decrease in Al concentration indicated acidic fluid neutralization (i.e., Jerritt Canyon and McLaughlin deposits), leading to ore precipitation. Therefore, it can be said that the Al concentration in quartz can fingerprint the ore precipitation processes [12].
The trace element variations and the resulting CL textures reflect the rate of crystallization, the magma composition, the pressure, the temperature, and the history of deformation [23,100,135,138]. Ref. [43] described that the CL characteristics of hydrothermal quartz may also depend on the crystallization temperature [12]. However, according to Ref. [35], in low-temperature hydrothermal quartz (less than 350 °C), the Ti concentration was less than a few ppm. In that situation, the CL intensity correlated with the Al concentration and charge-balancing elements, but this correlation was not consistent. Contrarily, for quartz formed in temperatures greater than 400 °C, the CL correlated well with the Ti concentration [35]. However, negative correlation was observed between Al and CL intensity in a recent study conducted by Ref. [97]. In comparison to Q1 and Q2, Q3 had the lowest Al concentration and highest CL intensity. A similar scenario was observed by Ref. [139] at the Butte porphyry Cu deposit. According to Ref. [75], progressive younger stages of hydrothermal quartz exhibited progressively less luminescence and less Ti content. Ref. [140] described that fluid composition, saturation, pH, and temperature significantly influenced the growth dynamics and trace element composition and, thus, likely the CL properties of hydrothermal quartz. Moreover, Ref. [17] added that sector zoning was also characterized by variation in the Li/Al ratios. The presence of sector and growth zoning is due to lower temperature (less than 300 °C), fluid composition, and different face growth mechanisms.

4. Alpha and Beta Quartz

Two variants of quartz are observed: high-temperature (alpha quartz) and low-temperature (beta quartz). Alpha quartz belongs to the hexagonal crystal system, while beta quartz belongs to the trigonal crystal system. The temperature of 573 °C is the transition temperature between high- and low-temperature quartz. Theoretically, it is believed that, when quartz transforms from alpha–beta habit, healed microcracks may form [35,141]. This transition causes silica tetrahedra rotation concerning one another [141]. The alpha–beta shift causes an anisotropic contraction of 0.86 vol% vertical to the c-axis and 1.3 vol% parallel to the c-axis and induces stress within individual grains [20]. According to Ref. [43], lower-temperature alpha quartz was characterized by a 144-degree Si-O-Si angle, a lattice energy of 12,967 to 15,043 kJ/mol, a Mohs hardness of 7, and a specific gravity of 2.65 g cm−3. Contrarily, high-temperature beta quartz was characterized by a 153-degree Si-O-Si angle, a lattice energy of 13,596 kJ/mol, a Mohs hardness of 7, and a specific gravity of 2.51 g cm−3. Moreover, transient blue CL emission at 390 nm is a common feature of α-quartz crystallized from aqueous solutions and was observed both in natural and synthetic hydrothermal quartz specimens.

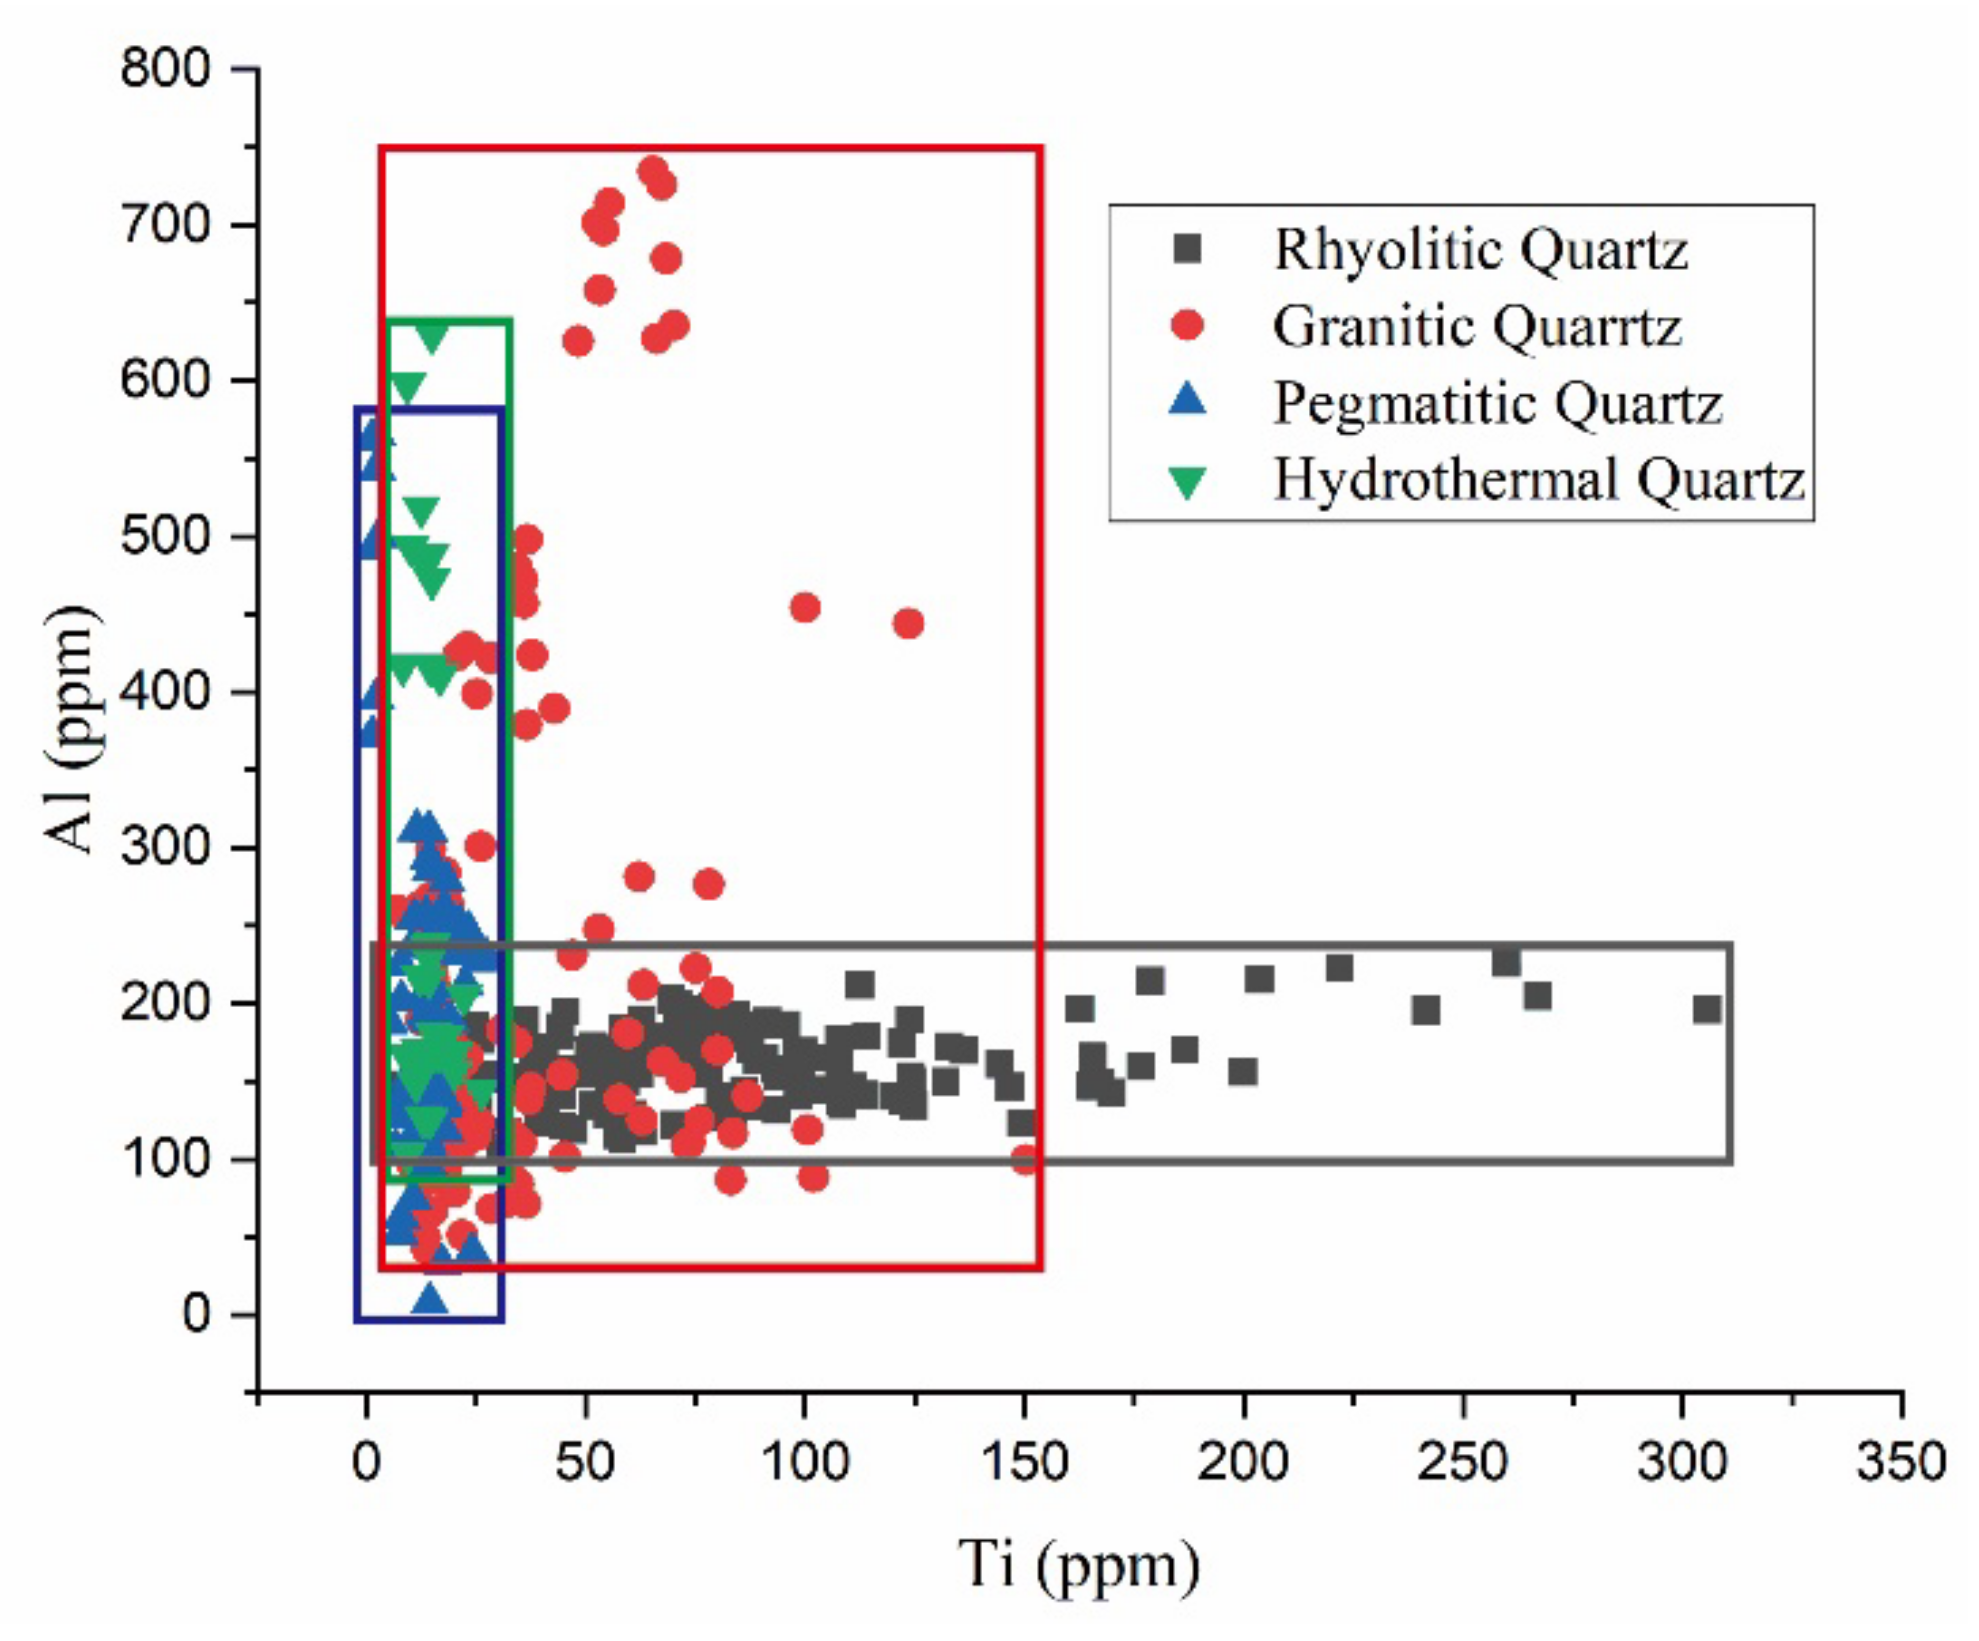
5. Comparison between Hydrothermal and Magmatic Quartz

The most common trace elements in quartz lattice are Ti and Al. Aluminum is the most abundant element, while titanium is closely correlated with quartz precipitation temperature and luminescence [75]. However, hydrothermal quartz has higher Al, Li, Na, and K concentrations, while there is greater Ti enrichment in magmatic quartz (Figure 10) [23,26,35,37]. The trace element composition can be used to distinguish between ore deposits and between magmatic and hydrothermal quartz, i.e., Al and Ti concentrations vary between epithermal deposits, orogenic Au deposits, and porphyry-type deposits [9,35]. As such, in the Xikuangshan deposit, the Al and Ti concentrations are close to epithermal deposits (Al: 20–4000 ppm; Ti: <3 ppm), while the Woxi deposit concentrations are close to porphyry-type or orogenic-type deposits (Al: 4.9–1713.4 ppm; Ti: 3.37–27.95 ppm) [12,136].
The Ge/Al ratios of magmatic quartz and hydrothermal quartz are less than 0.008 and greater than 0.008, respectively. Magmatic quartz has the highest Ti and lowest Ge contents, while hydrothermal quartz has the opposite scenario [9]. Germanium is absorbed on the surface of Fe-oxide and removed from the melt when Fe-oxide is formed, which is why most magmatic quartz has a lower Ge concentration [23,65]. However, it was observed from wetland deposits (New Zealand Alps) that, in the case of hydrothermal quartz, there were Ge and Ti values ranging from 1.2–4.8 ppm and 0.5–0.7 ppm, respectively. On the other hand, there was a surge in Ti values in magmatic quartz from 23–69 ppm, while all the Ge samples were below the detection limit.
Hydrothermal quartz is characterized by high Li/Al ratios when contrasted with magmatic quartz [65]. Compared to hydrothermal quartz, the high H/(Li, K, or P) ratios of igneous quartz suggest that igneous quartz contains more H than Li, K, and P [36]. Furthermore, [13] did not find a correlation between Al and Sb. He found a 4.5 ppm maximum value of Sb for magmatic quartz, while hydrothermal quartz contained a much higher Sb value [126]. These are some parameters that can be used to differentiate between hydrothermal and magmatic quartz. In this study, we found a correlation between Al and Ti in the case of magmatic quartz, while confusing behaviors of these two elements in the case of hydrothermal quartz were observed. This indicated that hydrothermal quartz grows in a relatively complex situation compared to magmatic quartz.
Sector zoning, absent in magmatic quartz, is a general characteristic of hydrothermal quartz and is formed by multiple intakes of trace elements over various crystal faces [5,21,51,52]. It is most pronounced in Al-rich, outer crystal zones [125]. All crystal faces become rough at higher temperatures (near melting), obtaining foreign ions accordingly, and that is why there is a lack of sector zoning in magmatic quartz. Contrarily, magmatic quartz is characterized by resorption surfaces. During the early phase of magma ascent, resorption surfaces and step zoning indicate melt composition changes, pressure, and temperature [57]. In contrast to magmatic quartz’s blue luminescence, hydrothermal quartz formed during post-magmatic alteration can easily be characterized by either weak red-brown or no luminescence [21]. Magmatic quartz shows emission bands at 400, 440, and 480 nm, and these bands disappear or decrease in secondary hydrothermal quartz [142]. Apart from a magmatic and hydrothermal quartz comparison, [135] worked in the Erzgebirge tin mining district (Germany), the Kasperske Hory gold quartz vein deposits (Czech Republic), and the Muruntau and Myutenbai gold deposits (Uzbekistan). He concluded that metamorphic and hydrothermal quartz could also be distinguished based on trace elements. As compared to hydrothermal quartz, metamorphic quartz has a lower trace element concentration. Moreover, metamorphic quartz exhibits LREE enrichment with a variable Ce anomaly, while hydrothermal quartz exhibits HREE enrichment with a positive Eu anomaly.

6. Conditions Necessary for Mineralization

The trace element contents of quartz closely reflect the composition of the fluids leading to the precipitation of the different minerals and the formation of inclusions [143]. This early-stage ore fluid is characterized by high temperature, salinity, and CO2. In the middle stage, fluid boiling leads to CO2 release, decreased oxygen fugacity, and rapid ore material precipitation. The late-stage fluids have lower temperature, salinity, CO2, and daughter minerals, as well as meteoric-water-dominated fluids [144]. These ore-forming fluids are mainly magmatic water with particular meteoric water involvement [145]. This fluid mixing not only reduces the fluid temperature and metal solubility but also causes dilution, which changes the fluid salinity, acidity, and redox properties, i.e., metal deposition in Haisugou was mainly driven by mixing with meteoric water and related cooling [146,147]. Moreover, Ref [148] concluded this, as lower temperature, higher density, increased oxygen fugacity, and salinity decline contributed to accelerated mineral accumulation.

7. Implications for Hydrothermal Systems and Ore Deposits

The amounts of trace elements vary between different ore deposits, as well as in CL textures, which can help discriminate between various ore deposits. Several researchers have previously used this relationship (based on Al and Ti concentrations) to differentiate between porphyry-type deposits, epithermal deposits, and orogenic Au deposits [6,35,53]. According to them, Ti ranges from 1–200 ppm in porphyry deposits, and Al ranges from 50–500 ppm [29,54,75]. Contrarily, epithermal ore deposits contain less than three ppm Ti and 20–4000 ppm Al. Additionally, orogenic gold deposits have 1–10 ppm Ti and 100–1000 ppm Al [6,35]. Now, we extended this research by using it for hydrothermal, rhyolitic, granitic, and pegmatitic quartz. Figure 11 shows the Al and Ti concentrations from 34 ore deposits. Each of them can be distinguished based on their Ti and Al concentrations. The LA-ICP-MS findings indicated that hydrothermal quartz with an Al/Ti ratio of 8–27 ppm Ti and 103–630 ppm Al differed from around 7–65. In contrast, granitic quartz Ti and Al values ranged from 7–150 ppm and 42–734 ppm, respectively, with the Al/Ti ratios fluctuating between 0.7–37. In comparison, pegmatitic quartz Ti values varied from 1–27 ppm, with Al values ranging from 8–565 ppm. Their ratios of Al/Ti varied from 0.6–468. On the other hand, rhyolitic quartz Ti concentrations ranged from 6–305 ppm, where Al values differed from 109–226 ppm. Their ratios of Al/Ti ranged from 0.6–23. Hydrothermal and pegmatitic quartz were distinguished by lower Ti concentrations, where low Al concentrations and lower Al/Ti ratios are found in rhyolitic quartz. Furthermore, according to Ref. [6], these Al/Ti ratios could be used to differentiate between skarn (2.12–2617) deposits and porphyry (1–10)-, orogenic (10–100)-, and epithermal (100–1000)-type deposits.
These 34 ore deposits (Figure 12) indicated the highest Ti concentration in rhyolitic quartz, indicating its highest formation temperature. Surprisingly, rhyolitic quartz also showed high concentrations of Fe (7.8–349.8 ppm) and K. This high Fe concentration suggested its high concentration at higher temperatures. Granitic quartz showed an almost-smooth distribution of these trace elements with a lower concentration of Al. Pegmatitic quartz showed transitional behavior, while hydrothermal quartz was characterized by the lowest Ti concentration with the highest Al and K concentrations. This indicateed the lower temperature of the formation of hydrothermal quartz compared to other deposits. In addition, antimony is not widely reported in hydrothermal quartz, although up to 100 ppm has been reported in some low-temperature ore deposits [35,53]. However, fluid inclusion in hydrothermal quartz increases the Na and K concentrations up to several orders of magnitude, so care must be taken to quantify these element concentrations [35]. This systematic difference in the concentrations of trace elements between various forms of quartz suggests that quartz represents the conditions of geological formation and subsequent alteration. Further data obtained from more than 12 hydrothermal ore deposits formed between 100–750 °C suggested that Fe was not present in porphyry-type deposits above 300 °C and did not correlate with Al and CL properties [12]. Al and K are associated with Cl (and often not), but Ti is often associated with CL intensities above 500 °C. It has also commonly been observed that chalcopyrite is associated with CL dark quartz (less than 10 ppm Ti; sulfide-associated), which cuts earlier CL light quartz (50–200 ppm Ti) from some porphyry copper deposits, such as Los Pelambres and El-Teniente porphyry Cu deposits [12,34,35,54,75]. In addition, Al did not correlate with CL in epithermal Au-Sb-Hg, Carlin-type Au, epithermal Ag, or shale-hosted Zn deposits, while epithermal base metal and porphyry-Cu-type deposits are transitional. In comparison, Al correlated to CL in Mississippi-Valley-type, epithermal Au-Ag, and porphyry Cu-Mo deposits [12].
Different kinds of deposits can be distinguished by varying CL textures [35,149]. Pegmatitic quartz is characterized by mottled and homogenous CL textures with blue to green CL color (around 500 nm) [1,65,150]. However, dissolution features, mosaic textures, healed microfractures, and contrasting CL patterns (often with dark cores and bright rims) are prominent in porphyry copper deposits, while repeated layers of chalcedonic textures, brecciation, euhedrally sector-zoned crystals, colloform, and very little dissolution textures define epithermal deposits [51,77,127]. Moreover, orogenic gold deposits are characterized by dull gray, homogenous, and mottled CL textures [35,77,97].

8. Applications of Quartz and CL in Geoscience

With a relative abundance of more than 12% (greater than 90% found in igneous rocks), quartz is one of the most common minerals in the Earth’s crust. In comparison, sedimentary rocks supply over 95% of the quartz raw materials used in industry. Its industrial usage includes quartz sand for the foundry and glass industries (i.e., in Germany), perfect crystals (optical quartz), and Si ore to produce Si alloys and semiconductors [43]. High-purity quartz (HPQ; contains less than 50 µg/g contaminating elements) is an important material used in a wide variety of high-tech devices, and demand for HPQ is growing rapidly due to its increasing consumption [151,152]. Quartz’s luminescence properties have a wide variety of applications. To evaluate the provenance of detrital quartz grains in sands and sandstones was one of the first applications [153].
Another important application of CL is the visualization of primary and secondary microstructures in minerals, which are not usually observable in conventional microscopy (Figure 13) [65]. It also provides special resolution up to a 1-micrometer scale and can detect smaller variations in trace element concertation [54]. CL is used for the identification of minerals, mineral distribution and quantification, the visualization of primary and secondary microstructures, growth zoning, deformation features, fluid flow, crystal chemistry, trace element distribution, internal structures, the reconstruction of geological processes, and the characterization of technical products [65,154,155,156,157]. These microstructures, i.e., oscillatory zoning, sector zoning, chemical heterogeneities, and micro-inclusions, help reconstruct the growth conditions of minerals and reveal secondary alteration processes, such as deformation and fluid flow, recrystallization, and radiation damage.

9. Conclusions

  • Titanium is the most important element in magmatic quartz, while Al is the most important in hydrothermal quartz;
  • Cathodoluminescence intensity is directly proportional to the Ti concentration, but the concentrations of other trace elements also affect the CL intensity;
  • By using luminescence properties, we can differentiate between magmatic and hydrothermal quartz;
  • Each type of ore deposit has its own unique CL characteristics;
  • Barren quartz veins contain high Ti contents compared to fertile ones;
  • The Ge concentration is higher in magmatic quartz compared to hydrothermal quartz;
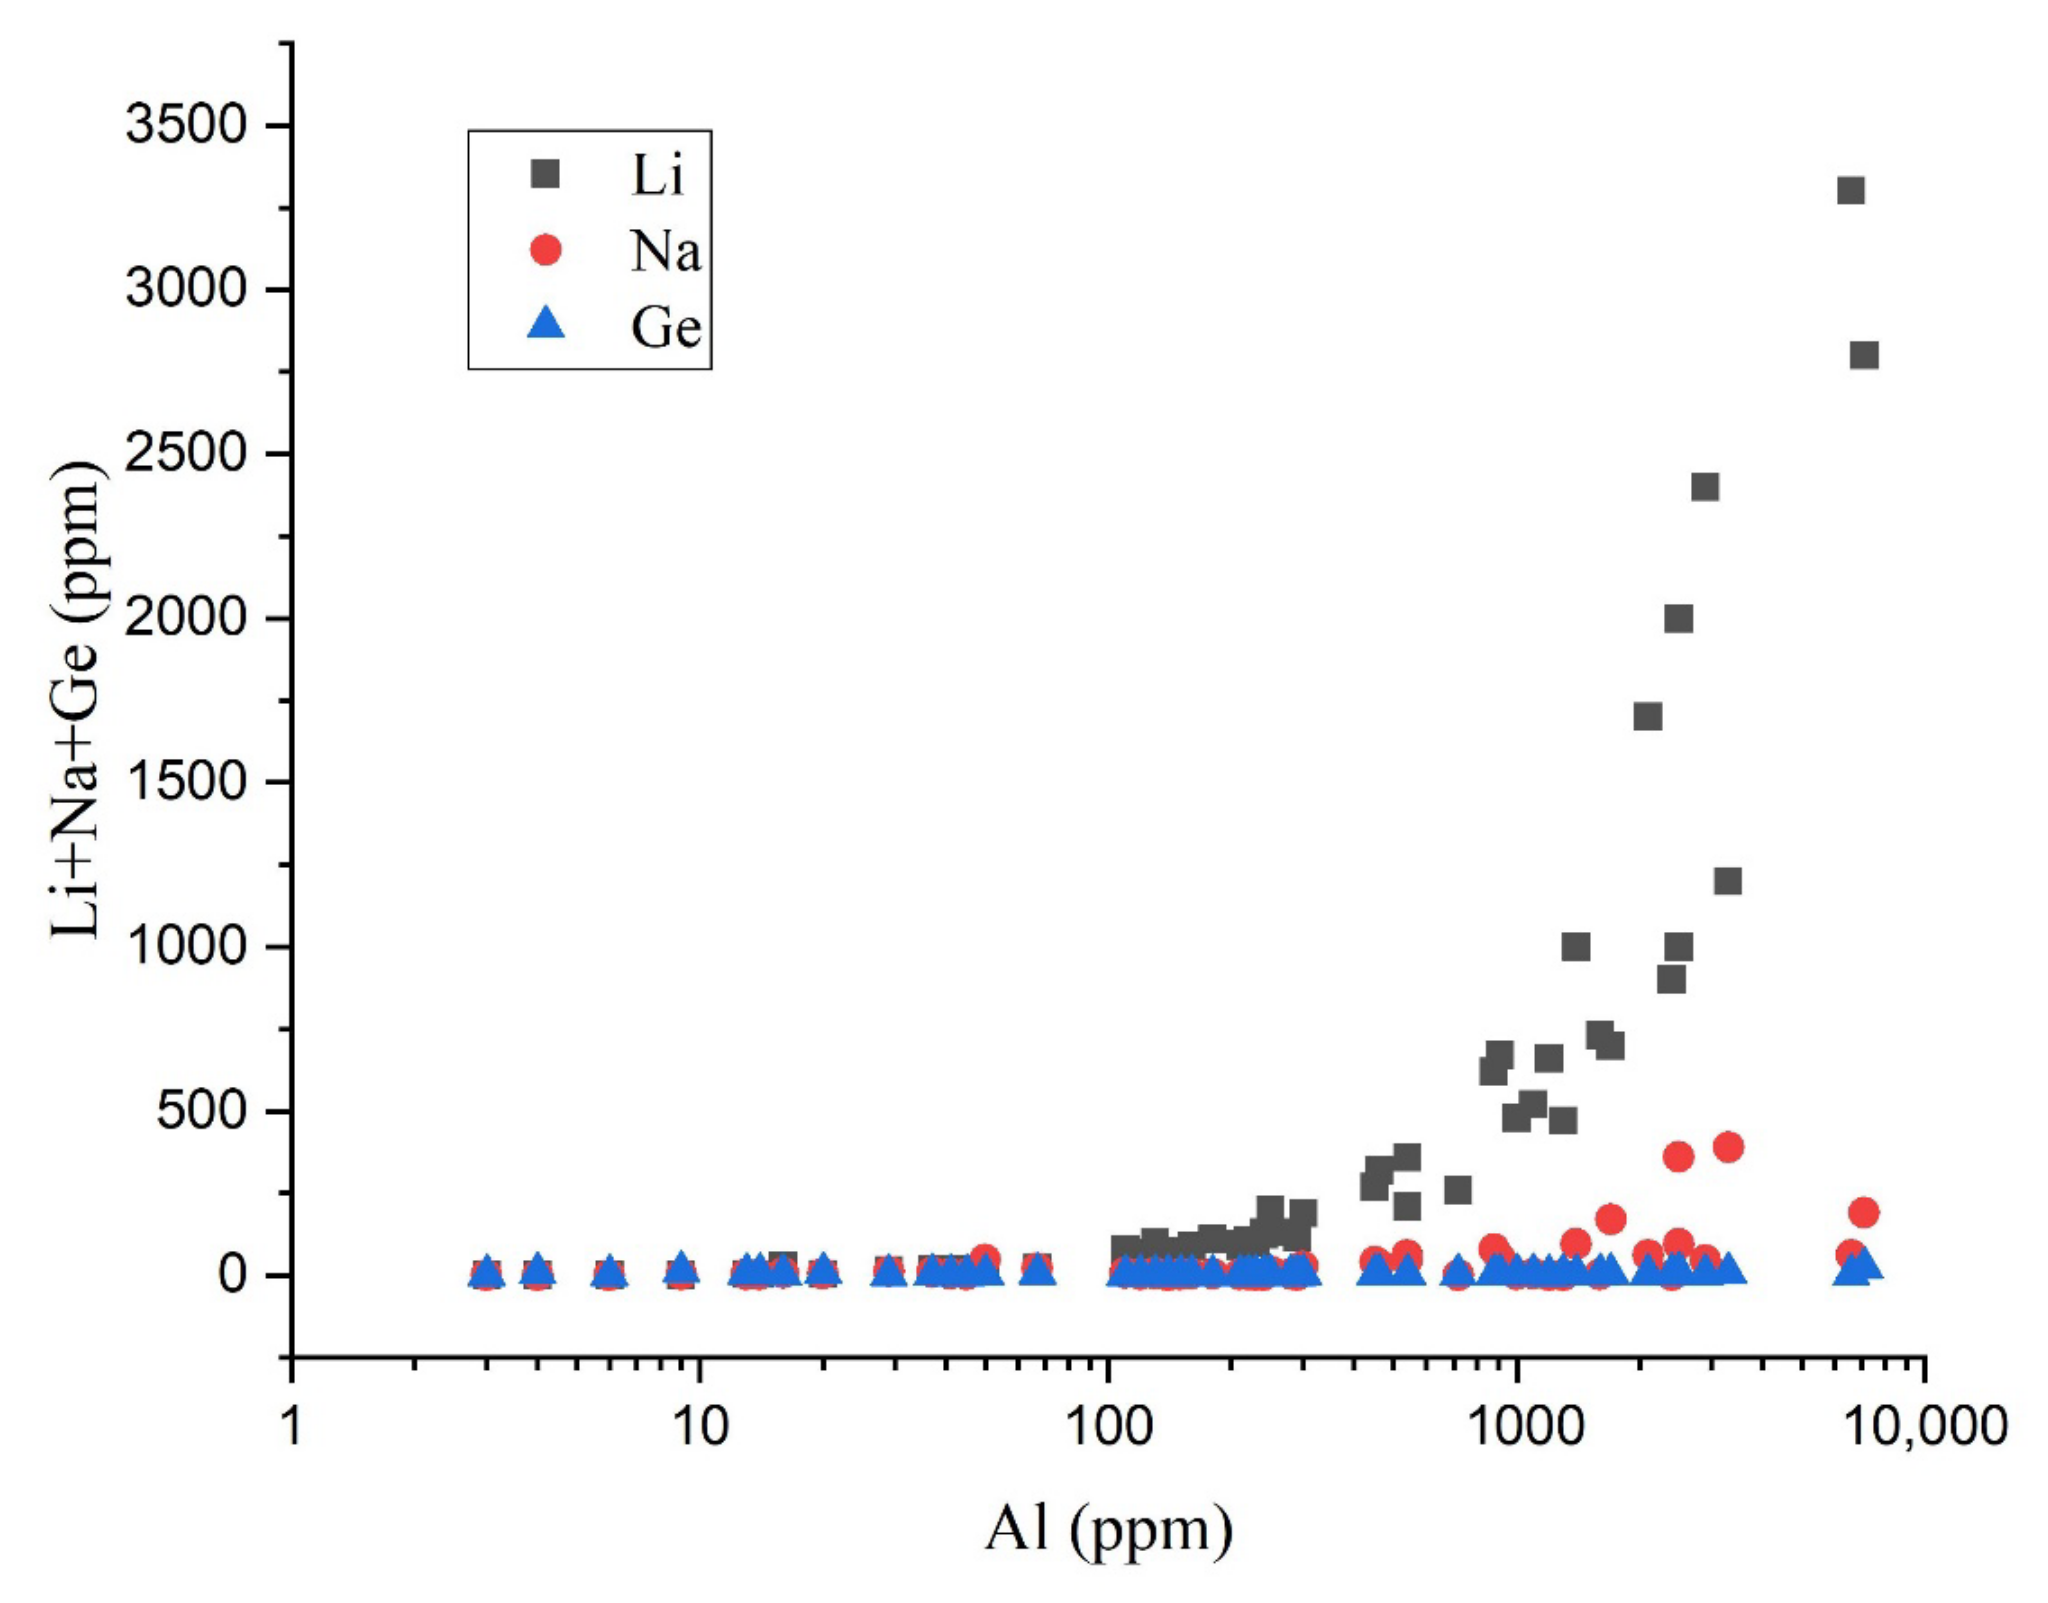
  • Li, Na,
  • and K act as charge compensators in quartz lattices;
  • The Ge/Al ratios of magmatic quartz and hydrothermal quartz are less than 0.008 and greater than 0.008, respectively.

Author Contributions

Conceptualization, S.A.S.; methodology, Y.Z. and S.A.S.; software, S.A.S.; validation, L.Z. and H.Z.; formal analysis, S.A.S.; investigation, S.A.S.; resources, L.Z. and S.A.S.; data curation, L.Z., H.Z. and S.A.S.; writing—original draft preparation, S.A.S.; writing—review and editing, Y.Z. and S.A.S.; visualization, Y.Z. and L.Z.; supervision, Y.S. and Y.Z.; project administration, Y.S.; funding acquisition, Y.S. and Y.Z. All authors have read and agreed to the published version of the manuscript.

Funding

This research was funded by the Science and Technology Innovation Program of Hunan Province (2021RC4055) and the APC was funded by (2021RC4055).

Conflicts of Interest

The authors declare no conflict of interest.

References

  1. Augustsson, C.; Reker, A. Cathodolumenescence Spectra of Quartz As Provenance Indicators Revisited. J. Sediment. Res. 2012, 82, 559–570. [Google Scholar] [CrossRef]
  2. Kwon, Y.-I.; Boggs, S. Provenance interpretation of Tertiary sandstones from the Cheju Basin (NE East China Sea): A comparison of conventional petrographic and scanning cathodoluminescence techniques. Sediment. Geol. 2002, 152, 29–43. [Google Scholar] [CrossRef]
  3. Palmer, S.E.; Kyser, T.; Hiatt, E.E. Provenance of the Proterozoic Thelon Basin, Nunavut, Canada, from detrital zircon geochronology and detrital quartz oxygen isotopes. Precambrian Res. 2003, 129, 115–140. [Google Scholar] [CrossRef]
  4. Augustsson, C.; Rusing, T.; Adams, C.J.; Chmiel, H.; Kocabayoglu, M.; Buld, M.; Zimmermann, U.; Berndt, J.; Kooijman, E. Detrital Quartz and Zircon Combined: The Production of Mature Sand with Short Transportation Paths Along the Cambrian West Gondwana Margin, Northwestern Argentina. J. Sediment. Res. 2011, 81, 284–298. [Google Scholar] [CrossRef]
  5. Müller, A.; Seltmann, R.; Behr, H.J. Application of cathodoluminescence to magmatic quartz in a tin granite—Case study from the Schellerhau Granite Complex, Eastern Erzgebirge, Germany. Miner. Depos. 2000, 35, 169–189. [Google Scholar] [CrossRef]
  6. Zhang, Y.; Cheng, J.; Tian, J.; Pan, J.; Sun, S.; Zhang, L.; Zhang, S.; Chu, G.; Zhao, Y.; Lai, C. Texture and trace element geochemistry of quartz in skarn system: Perspective from Jiguanzui Cu–Au skarn deposit, Eastern China. Ore Geol. Rev. 2019, 109, 535–544. [Google Scholar] [CrossRef]
  7. Huang, R.; Audétat, A. The titanium-in-quartz (TitaniQ) thermobarometer: A critical examination and re-calibration. Geochim. Cosmochim. Acta 2012, 84, 75–89. [Google Scholar] [CrossRef]
  8. Yuguchi, T.; Ogita, Y.; Kato, T.; Yokota, R.; Sasao, E.; Nishiyama, T. Crystallization processes of quartz in a granitic magma: Cathodoluminescence zonation pattern controlled by temperature and titanium diffusivity. J. Southeast Asian Earth Sci. 2020, 192, 104289. [Google Scholar] [CrossRef]
  9. Müller, A.; Herklotz, G.; Giegling, H. Chemistry of quartz related to the Zinnwald/Cínovec Sn-W-Li greisen-type deposit, Eastern Erzgebirge, Germany. J. Geochem. Explor. 2018, 190, 357–373. [Google Scholar] [CrossRef]
  10. Breiter, K.; Ďurišová, J.; Dosbaba, M. Chemical signature of quartz from S- and A-type rare-metal granites—A summary. Ore Geol. Rev. 2020, 125, 103674. [Google Scholar] [CrossRef]
  11. Mashkovtsev, R.I.; Balitsky, V.S.; Pan, Y. EPR characteristics of radiation-induced defects in Ge-rich α-quartz. Solid State Sci. 2022, 125, 106833. [Google Scholar] [CrossRef]
  12. Rusk, B.G.; Lowers, H.A.; Reed, M.H. Trace elements in hydrothermal quartz: Relationships to cathodoluminescent textures and insights into vein formation. Geology 2008, 36, 547. [Google Scholar] [CrossRef]
  13. Monnier, L.; Lach, P.; Salvi, S.; Melleton, J.; Bailly, L.; Béziat, D.; Gouy, S. Quartz trace-element composition by LA-ICP-MS as proxy for granite differentiation, hydrothermal episodes, and related mineralization: The Beauvoir Granite (Echassières district), France. Lithos 2018, 320–321, 355–377. [Google Scholar] [CrossRef]
  14. Pacák, K.; Zachariáš, J.; Strnad, L. Trace-element chemistry of barren and ore-bearing quartz of selected Au, Au-Ag and Sb-Au deposits from the Bohemian Massif Trace-element chemistry of barren and ore-bearing quartz of selected Au, Au–Ag and Sb–Au deposits from the Bohemian Massif. J. Geosci. 2019, 64, 19–35. [Google Scholar] [CrossRef]
  15. Breiter, K.; Svojtka, M.; Ackerman, L.; Švecová, K. Trace element composition of quartz from the Variscan Altenberg—Teplice caldera (Krušné hory/Erzgebirge Mts, Czech Republic/Germany): Insights into the volcano-plutonic complex evolution. Chem. Geol. 2012, 326, 36–50. [Google Scholar] [CrossRef]
  16. Dong, G.; Morrison, G.; Jaireth, S. Quartz textures in epithermal veins, Queensland; classification, origin and implication. Econ. Geol. 1995, 90, 1841–1856. [Google Scholar] [CrossRef]
  17. Jourdan, A.-L.V.; Mullis, J.; Ramseyer, K.; Spiers, C. Evidence of growth and sector zoning in hydrothermal quartz from Alpine veins. Eur. J. Miner. 2009, 21, 219–231. [Google Scholar] [CrossRef]
  18. Miyoshi, N.; Yamaguchi, Y.; Makino, K. Successive zoning of Al and H in hydrothermal vein quartz. Am. Miner. 2005, 90, 310–315. [Google Scholar] [CrossRef]
  19. Larsen, G.; Polvé, B.R.; Juve, M. Granitic pegmatite quartz from Evje-Iveland: Trace element chemistry and implications for high purity quartz formation. Bull. Geol. Surv. Norw. 2000, 436, 57–65. [Google Scholar]
  20. Müller, A.; Lennox, P.; Trzebski, R. Cathodoluminescence and micro-structural evidence for crystallisation and deformation processes of granites in the Eastern Lachlan Fold Belt (SE Australia). Contrib. Miner. Pet. 2002, 143, 510–524. [Google Scholar] [CrossRef]
  21. Behr, H.-J.; Kronz, A. Trace elements and cathodoluminescence of igneous quartz in topaz granites from the Hub Stock (Slavkovský Les Mts., Czech Republic). Miner. Pet. 2003, 79, 167–191. [Google Scholar] [CrossRef]
  22. Götze, J.; Plötze, M.; Graupner, T.; Hallbauer, D.K.; Bray, C.J. Trace element incorporation into quartz: A combined study by ICP-MS, electron spin resonance, cathodoluminescence, capillary ion analysis, and gas chromatography. Geochim. Cosmochim. Acta 2004, 68, 3741–3759. [Google Scholar] [CrossRef]
  23. Larsen, R.B.; Henderson, I.; Ihlen, P.M.; Jacamon, F. Distribution and petrogenetic behaviour of trace elements in granitic pegmatite quartz from South Norway. Contrib. Miner. Pet. 2004, 147, 615–628. [Google Scholar] [CrossRef]
  24. Jacamon, F.; Larsen, R.B. Trace element evolution of quartz in the charnockitic Kleivan granite, SW-Norway: The Ge/Ti ratio of quartz as an index of igneous differentiation. Lithos 2009, 107, 281–291. [Google Scholar] [CrossRef]
  25. Dowling, K.; Morrison, G. Application of quartz textures to the classification of gold deposits using North Queensland examples. Econ. Geol. Monogr. 1989, 6, 342–355. [Google Scholar]
  26. Breiter, K.; Ďurišová, J.; Dosbaba, M. Quartz chemistry—A step to understanding magmatic-hydrothermal processes in ore-bearing granites: Cínovec/Zinnwald Sn-W-Li deposit, Central Europe. Ore Geol. Rev. 2017, 90, 25–35. [Google Scholar] [CrossRef]
  27. Beurlen, H.; Müller, A.; Silva, D.; Da Silva, M.R.R. Petrogenetic significance of LA-ICP-MS trace-element data on quartz from the Borborema Pegmatite Province, northeast Brazil. Miner. Mag. 2011, 75, 2703–2719. [Google Scholar] [CrossRef]
  28. Götze, J.; Möckel, R. Quartz: Deposits, Mineralogy and Analytics; Springer: Berlin/Heidelberg, Germany, 2012. [Google Scholar]
  29. Müller, A.; van den Kerkhof, A.M.; Behr, H.J.; Kronz, A.; Koch-Müller, M. The evolution of late-Hercynian granites and rhyolites documented by quartz—A review. Earth Environ. Sci. Trans. R. Soc. Edinb. 2010, 100, 185–204. [Google Scholar] [CrossRef]
  30. Götze, D.; Plötze, J.; Habermann, M. Origin, spectral characteristics, and practical applications of the cathodoluminescence of quartz—A review. Mineral. Petrol. 2001, 71, 225–250. [Google Scholar] [CrossRef]
  31. Flem, B.; Mansfeld, J.; Lahaye, Y.; Larsen, R.B.; Dundas, S. LA-HR-ICP-MS analysis of quartz and principles governing the distribution and speciation of structural impurities in igneous quartz. Rep. Geol. Surv. Norw. 2000, 81, 1–42. [Google Scholar]
  32. Muller, A.; Welch, M.D. Frontiers in quartz research. Miner. Mag. Themat Issue 2009, 73, 517–518. [Google Scholar]
  33. Larsen, R.B.; Jacamon, F.; Kronz, A. Trace element chemistry and textures of quartz during the magmatic hydrothermal transition of Oslo Rift granites. Miner. Mag. 2009, 73, 691–707. [Google Scholar] [CrossRef]
  34. Müller, A.; Herrington, R.; Armstrong, R.; Seltmann, R.; Kirwin, D.J.; Stenina, N.G.; Kronz, A. Trace elements and cathodoluminescence of quartz in stockwork veins of Mongolian porphyry-style deposits. Miner. Depos. 2010, 45, 707–727. [Google Scholar] [CrossRef]
  35. Rusk, B. Cathodoluminescent textures and trace elements in hydrothermal quartz. In Quartz: Deposits, Mineralogy and Analytics; Götze, J., Möckel, R., Eds.; Springer: Berlin/Heidelberg, Germany, 2012; pp. 307–329. [Google Scholar]
  36. Müller, A.; Koch-Müller, M. Hydrogen speciation and trace element contents of igneous, hydrothermal and metamorphic quartz from Norway. Miner. Mag. 2009, 73, 569–583. [Google Scholar] [CrossRef]
  37. Götte, T.; Pettke, T.; Ramseyer, K.; Koch-Müller, M.; Mullis, J. Cathodoluminescence properties and trace element signature of hydrothermal quartz: A fingerprint of growth dynamics. Am. Miner. 2011, 96, 802–813. [Google Scholar] [CrossRef]
  38. Cherniak, D.; Watson, E.; Wark, D. Ti diffusion in quartz. Chem. Geol. 2007, 236, 65–74. [Google Scholar] [CrossRef]
  39. Baele, J.; Decrée, S.; Rusk, B. Cathodoluminescence applied to ore geology and exploration. In Ore Deposits: Origin, Exploration, and Exploitation; John Wiley & Sons: Hoboken, NJ, USA, 2019; pp. 131–161. [Google Scholar]
  40. Ding, T.; Ma, D.; Lu, J.; Zhang, R. Garnet and scheelite as indicators of multi-stage tungsten mineralization in the Huangshaping deposit, southern Hunan province, China. Ore Geol. Rev. 2018, 94, 193–211. [Google Scholar] [CrossRef]
  41. Wark, D.A.; Watson, E.B. TitaniQ: A titanium-in-quartz geothermometer. Contrib. Mineral. Petrol. 2006, 152, 743–754. [Google Scholar] [CrossRef]
  42. Wark, D.; Hildreth, W.; Spear, F.; Cherniak, D.; Watson, E. Pre-eruption recharge of the Bishop magma system. Geology 2007, 35, 235. [Google Scholar] [CrossRef]
  43. Götze, J. Chemistry, textures and physical properties of quartz—Geological interpretation and technical application. Mineral. Mag. 2009, 73, 645–671. [Google Scholar] [CrossRef]
  44. Götze, J.; Schertl, H.-P.; Neuser, R.D.; Kempe, U.; Hanchar, J.M. Optical microscope-cathodoluminescence (OM–CL) imaging as a powerful tool to reveal internal textures of minerals. Miner. Pet. 2012, 107, 373–392. [Google Scholar] [CrossRef]
  45. Chang, Z.; Meinert, L.D. The magmatic–hydrothermal transition—Evidence from quartz phenocryst textures and endoskarn abundance in Cu–Zn skarns at the Empire Mine, Idaho, USA. Chem. Geol. 2004, 210, 149–171. [Google Scholar] [CrossRef]
  46. Wilcock, J.; Goff, F.; Minarik, W.G.; Stix, J. Magmatic recharge during the formation and resurgence of the Valles Caldera, New Mexico, USA: Evidence from quartz compositional zoning and geothermometry. J. Petrol. 2013, 54, 635–664. [Google Scholar] [CrossRef]
  47. Bégué, F.; Deering, C.D.; Gravley, D.M.; Kennedy, B.M.; Chambefort, I.; Gualda, G.A.R.; Bachmann, O. Extraction, Storage and Eruption of Multiple Isolated Magma Batches in the Paired Mamaku and Ohakuri Eruption, Taupo Volcanic Zone, New Zealand. J. Pet. 2014, 55, 1653–1684. [Google Scholar] [CrossRef]
  48. Graeter, K.A.; Beane, R.J.; Deering, C.D.; Gravley, D.; Bachmann, O. Formation of rhyolite at the Okataina Volcanic Complex, New Zealand: New insights from analysis of quartz clusters in plutonic lithics. Am. Miner. 2015, 100, 1778–1789. [Google Scholar] [CrossRef]
  49. Pamukcu, A.S.; Ghiorso, M.S.; Gualda, G.A.R. High-Ti, bright-CL rims in volcanic quartz: A result of very rapid growth. Contrib. Miner. Pet. 2016, 171, 105. [Google Scholar] [CrossRef]
  50. Befus, K.S.; Manga, M. Supereruption quartz crystals and the hollow reentrants. Geology 2019, 47, 710–714. [Google Scholar] [CrossRef]
  51. Vasyukova, O.V.; Kamenetsky, V.S.; Goemann, K.; Davidson, P. Diversity of primary CL textures in quartz from porphyry environments: Implication for origin of quartz eyes. Contrib. Miner. Pet. 2013, 166, 1253–1268. [Google Scholar] [CrossRef]
  52. Wiebe, R.A.; Wark, D.A.; Hawkins, D.P. Insights from quartz cathodoluminescence zoning into crystallization of the Vinalhaven granite, coastal Maine. Contrib. Miner. Pet. 2007, 154, 439–453. [Google Scholar] [CrossRef]
  53. Rusk, B.; Koenig, A.; Lowers, H. Visualizing trace element distribution in quartz using cathodoluminescence, electron microprobe, and laser ablation-inductively coupled plasma-mass spectrometry. Am. Mineral. 2011, 96, 703–708. [Google Scholar] [CrossRef]
  54. Landtwing, T.; Pettke, M. Relationships between SEM-cathodoluminescence response and trace element composition of hydrothermal vein quartz. Am. Miner. 2005, 90, 122–131. [Google Scholar] [CrossRef]
  55. Cruz-Uribe, A.M.; Mertz-Kraus, R.; Zack, T.; Feineman, M.D.; Woods, G.; Jacob, D.E. A new LA-ICP-MS method for Ti in quartz: Implications and application to high pressure rutile–quartz veins from the Czech Erzgebirge. Geostand. Geoanalytical Res. 2016, 41, 29–40. [Google Scholar] [CrossRef]
  56. Müller, A.; Kronz, A.; Breiter, K. Trace elements and growth patterns in quartz: A fingerprint of the evolution of the subvolcanic Podlesí Granite System (Krušné hory Mts., Czech Republic). Vestn. Ces. Geol. Ust. 2002, 77, 135–145. [Google Scholar] [CrossRef]
  57. Müller, A. Cathodoluminescence and Characterisation of Defect Structures in Quartz with Applications to the Study of Granitic Rocks. Ph.D. Thesis, University of Göttingen, Göttingen, Germany, 2000. [Google Scholar]
  58. Ehrlich, K.; Verš, E.; Kirs, J.; Soesoo, A. Titaan-kvartsis geotermomeetria meetodi rakendamine paleoproterosoilise Suursaare kvartsporfüüri kristalliseerumistemperatuuride määramisel. Est. J. Earth Sci. 2012, 61, 195–204. [Google Scholar] [CrossRef]
  59. Boggs, S.; Kwon, Y.-I.; Goles, G.G.; Rusk, B.G.; Krinsley, D.; Seyedolali, A. Is Quartz Cathodoluminescence Color a Reliable Provenance Tool? A Quantitative Examination. J. Sediment. Res. 2002, 72, 408–415. [Google Scholar] [CrossRef]
  60. Thomas, J.B.; Watson, E.B.; Spear, F.S.; Shemella, P.T.; Nayak, S.K.; Lanzirotti, A. TitaniQ under pressure: The effect of pressure and temperature on the solubility of Ti in quartz. Contrib. Miner. Pet. 2010, 160, 743–759. [Google Scholar] [CrossRef]
  61. Ashley, K.T.; Webb, L.E.; Spear, F.S.; Thomas, J.B. P-T-D histories from quartz: A case study of the application of the TitaniQ thermobarometer to progressive fabric development in metapelites. Geochem. Geophys. Geosystems 2013, 14, 3821–3843. [Google Scholar] [CrossRef]
  62. Bromiley, G.D.; Hiscock, M. Grain boundary diffusion of titanium in polycrystalline quartz and its implications for titanium in quartz (TitaniQ) geothermobarometry. Geochim. Cosmochim. Acta 2016, 178, 281–290. [Google Scholar] [CrossRef]
  63. Buthelezi, M.; Ashwal, L.; Horváth, P. Application of titanium-in-quartz geothermometry to magmatic quartz in evolved rocks from the Bushveld Complex, South Africa. South Afr. J. Geol. 2017, 120, 241–250. [Google Scholar] [CrossRef]
  64. Matthews, N.E.; Pyle, D.; Smith, V.; Wilson, C.; Huber, C.; Van Hinsberg, V. Quartz zoning and the pre-eruptive evolution of the ~340-ka Whakamaru magma systems, New Zealand. Contrib. Miner. Pet. 2011, 163, 87–107. [Google Scholar] [CrossRef]
  65. Götze, J. Application of Cathodoluminescence Microscopy and Spectroscopy in Geosciences. Microsc. Microanal. 2012, 18, 1270–1284. [Google Scholar] [CrossRef] [PubMed]
  66. Bernet, M.; Bassett, K. Provenance Analysis by Single-Quartz-Grain SEM-CL/Optical Microscopy. J. Sediment. Res. 2005, 75, 492–500. [Google Scholar] [CrossRef]
  67. Tanner, D.; Henley, R.W.; Mavrogenes, J.A.; Holden, P. Combining in situ isotopic, trace element and textural analyses of quartz from four magmatic-hydrothermal ore deposits. Contrib. Miner. Pet. 2013, 166, 1119–1142. [Google Scholar] [CrossRef]
  68. Muller, A. The genetic significance of snowball quartz in high fractionated tin granites of the Krušne Hory/Erzgebirge Miner. Depos. Miner. Depos. Process. Process. Rotterdam Balkema. 1999, 1, 409–412. [Google Scholar]
  69. Breiter, K.; Müller, A.; Leichmann, J.; Gabašová, A. Textural and chemical evolution of a fractionated granitic system: The Podlesí stock, Czech Republic. Lithos 2005, 80, 323–345. [Google Scholar] [CrossRef]
  70. Shore, M.; Fowler, A.D. Oscillatory zoning in minerals: A common phenomenon. Can. Miner. 1996, 34, 1111–1126. [Google Scholar]
  71. Fowler, C.; Prokoph, A.; Stern, A.; Dupuis, R. Organization of oscillatory zoning in zircon: Analysis, scaling, geochemistry, and model of a zircon from Kipawa, Quebec, Canada. Geochim. Consmochim. Acta 2002, 66, 311–328. [Google Scholar] [CrossRef]
  72. Yuguchi, T.; Iwano, H.; Kato, T.; Sakata, S.; Hattori, K.; Hirata, T.; Sueoka, S.; Danhara, T.; Ishibashi, M.; Sasao, E.; et al. Zircon growth in a granitic pluton with specific mechanisms, crystallization temperatures and U–Pb ages: Implication to the ‘spatiotemporal’ formation process of the Toki granite, central Japan. J. Mineral. Petrol. Sci. 2016, 111, 9–34. [Google Scholar] [CrossRef]
  73. Yuguchi, T.; Sueoka, S.; Iwano, H.; Izumino, Y.; Ishibashi, M.; Danhara, T.; Sasao, E.; Hirata, T.; Nishiyama, T. Position-by-position cooling paths within the Toki granite, central Japan: Constraints and the relation with fracture population in a pluton. J. Southeast Asian Earth Sci. 2018, 169, 47–66. [Google Scholar] [CrossRef]
  74. Götte, T.; Ramseyer, K. Trace element characteristics, luminescence properties and real structure of quartz. In Quartz: Deposits, Mineralogy and Analytics; Springer: Berlin/Heidelberg, Germany, 2012; pp. 265–285. [Google Scholar]
  75. Yacobi, B.G.; Holt, D.B. Cathodoluminescence Microscopy of Inorganic Solids; Springer Science & Business Media: Berlin/Heidelberg, Germany, 2013. [Google Scholar]
  76. Rusk, B.G.; Reed, M.H.; Dilles, J.H.; Kent, A. Intensity of quartz cathodoluminescence and trace-element content in quartz from the porphyry copper deposit at Butte, Montana. Am. Miner. 2006, 91, 1300–1312. [Google Scholar] [CrossRef]
  77. Zinkernagel, U. Cathodoluminescence of quartz and its application to sandstone petrology. In Contributions to Sedimentary Geology; Schweizerbart Science Publishers: Stuttgart, Germany, 1978. [Google Scholar]
  78. Frelinger, S.N.; Ledvina, M.D.; Kyle, J.R.; Zhao, D. Scanning electron microscopy cathodoluminescence of quartz: Principles, techniques and applications in ore geology. Ore Geol. Rev. 2015, 65, 840–852. [Google Scholar] [CrossRef]
  79. Müller, A.; Breiter, K.; Seltmann, R.; Pécskay, Z. Quartz and feldspar zoning in the eastern Erzgebirge volcano-plutonic complex (Germany, Czech Republic): Evidence of multiple magma mixing. Lithos 2005, 80, 201–227. [Google Scholar] [CrossRef]
  80. Boggs, S.; Krinsley, D.H.; Goles, G.G.; Seyedolali, A.; Dypvik, H. Identification of shocked quartz by scanning cathodoluminescence imaging. Meteorit. Planet. Sci. 2001, 36, 783–791. [Google Scholar] [CrossRef]
  81. Müller, A.; Seltmann, R.; Halls, C.; Siebel, W.; Dulski, P.; Jeffries, T.; Spratt, J.; Kronz, A. The magmatic evolution of the Land’s End pluton, Cornwall, and associated pre-enrichment of metals. Ore Geol. Rev. 2006, 28, 329–367. [Google Scholar] [CrossRef]
  82. Yang, Z.; Chang, Z.; Paquette, J.; White, N.C.; Hou, Z.; Ge, L. Magmatic Au mineralization at the Bilihe Au deposit, China. Econ. Geol. 2015, 110, 1661–1668. [Google Scholar] [CrossRef]
  83. Takahashi, R.; Müller, A.; Matsueda, H.; Okrugin, V.M.; Ono, S.; van den Kerkhof, A.; Kronz, A.; Elena, D.A. Cathodoluminescence and trace elements in quartz: Clues to metal precipitation mechanisms at the Asachinskoe gold deposit in Kamchatka. In Origin and Evolution of Natural Diversity, Proceedings of the International Symposium, The Origin and Evolution of Natural Diversity, Sapporo, Japan, 1–5 October 2007; COE for Neo-Science of Natural History, Hokkaido University: Sapporo, Japan, 2008; pp. 175–184. [Google Scholar]
  84. Van den Kerkhof, A.M.; Scherer, T.; Riganti, A. Cathodoluminescence and EPR analysis of Archean quarzites from the Nondweni Greenstone Belt, South Africa. In Proceedings of the International Conference on Cathodoluminescence and Related Techniques in Geosciences and Geomaterials, Nancy, France, 2–4 September 1996; p. 75. [Google Scholar]
  85. Vasyukova, O.V. Types and origin of quartz and quartz-hosted fluid inclusions in mineralised porphyries. Ph.D. Thesis, University of Tasmania, Hobart, Australia, 2011. [Google Scholar]
  86. Watt, G.R.; Wright, P.; Galloway, S.; McLean, C. Cathodoluminescence and trace element zoning in quartz phenocrysts and xenocrysts. Geochim. Cosmochim. Acta 1997, 61, 4337–4348. [Google Scholar] [CrossRef]
  87. Vasyukova, O.; Goemann, K.; Kamenetsky, V.; MacRae, C.; Wilson, N. Cathodoluminescence properties of quartz eyes from porphyry-type deposits: Implications for the origin of quartz. Am. Miner. 2012, 98, 98–109. [Google Scholar] [CrossRef]
  88. Kontak, D.J.; Clark, A.H. The Minastira peraluminous granite, Puno, southeastern Peru: A quenched, hypabyssal intrusion recording magma commingling and mixing. Miner. Mag. 1997, 61, 743–764. [Google Scholar] [CrossRef]
  89. Burt, R.M.; Cole, J.W.; Vroon, P.Z. Volcanic geology and geochemistry of Motuhora (Whale Island), Bay of Plenty, New Zealand. N. Zeal. J. Geol. Geophys. 1996, 39, 565–580. [Google Scholar] [CrossRef]
  90. Manning, D. The effect of fluorine on liquidus phase relationships in the system Qz-Ab-Or with excess water at 1 kb. Contrib. Miner. Pet. 1981, 76, 206–215. [Google Scholar] [CrossRef]
  91. Eklund, O.; Shebanov, A.D. The origin of rapakivi texture by sub-isothermal decompression. Precambrian Res. 1999, 95, 129–146. [Google Scholar] [CrossRef]
  92. Kuşcu, G.G.; Floyd, P.A. Mineral compositional and textural evidence for magma mingling in the Saraykent volcanics. Lithos 2001, 56, 207–230. [Google Scholar] [CrossRef]
  93. Frondel, C. Origin of the Segmental Coloration of Amethyst and Smoky Quartz. American Museum Novitates; no. 758; American Museum of Natural History: New York, NY, USA, 1934. [Google Scholar]
  94. Gurbanov, S.V.; Chernukha, A.G.; Koshchug, D.G.; Kurasova, D.G.; Fedyushchenko, S.P. EPR spectroscopy and geochemistry of rock-forming quartz as an indicator of the superimposed processes in rocks of igneous associations of various ages in the Greater Caucasus. Geochem. Int. 1999, 37, 519–604. [Google Scholar]
  95. Hiraga, T.; Anderson, I.M.; Kohlstedt, D.L. Chemistry of grain boundaries in mantle rocks. Am. Miner. 2003, 88, 1015–1019. [Google Scholar] [CrossRef]
  96. Hiraga, T.; Anderson, I.M.; Kohlstedt, D.L. Grain boundaries as reservoirs of incompatible elements in the Earth’s mantle. Nature 2004, 427, 699–703. [Google Scholar] [CrossRef]
  97. Lan, Q.; Lin, J.; Fu, S.; Luo, J. Cathodoluminescent textures and trace element signatures of hydrothermal quartz from the granite-related No. 302 uranium deposit, South China: A reconnaissance study for their genetic significances. J. Geochem. Explor. 2021, 224, 106740. [Google Scholar] [CrossRef]
  98. Muller, A.; Wiedenbeck, M.; van den Kerkhof, A.M.; Kronz, A.; Simon, K. Trace elements in quartz-a combined electron microprobe, secondary ion mass spectrometry, laser-ablation ICP-MS, and cathodoluminescence study. Eur. J. Mineral. 2003, 15, 747–763. [Google Scholar] [CrossRef]
  99. Leeman, W.P.; MacRae, C.M.; Wilson, N.C.; Torpy, A.; Lee, C.A.; Student, J.J.; Thomas, J.B.; Vicenzi, E.P. A study of cathodoluminescence and trace element compositional zoning in natural quartz from volcanic rocks: Mapping titanium content in quartz. Microsc. Microanal. 2012, 18, 1322–1341. [Google Scholar] [CrossRef]
  100. Breiter, K.; Müller, A. Evolution of rare-metal granitic magmas documented by quartz chemistry. Eur. J. Mineral. 2009, 21, 335–346. [Google Scholar] [CrossRef]
  101. Shane, P.; Smith, V.C.; Nairn, I. Millennial timescale resolution of rhyolite magma recharge at Tarawera volcano: Insights from quartz chemistry and melt inclusions. Contrib. Miner. Pet. 2008, 156, 397–411. [Google Scholar] [CrossRef]
  102. Spear, F.S.; Wark, D.A. Cathodoluminescence imaging and titanium thermometry in metamorphic quartz. J. Metamorph. Geol. 2009, 27, 187–205. [Google Scholar] [CrossRef]
  103. Wehrle, E.A.; McDonald, A.M. Cathodoluminescence and trace-element chemistry of quartz from Sudbury offset dikes: Observations, interpretations, and genetic implications. Can. Mineral. 2019, 57, 947–963. [Google Scholar] [CrossRef]
  104. Ruffini, R.; Borghi, A.; Cossio, R.; Olmi, F.; Vaggelli, G. Volcanic Quartz Growth Zoning Identified by Cathodoluminescence and EPMA Studies. Mikrochim. Acta 2002, 139, 151–158. [Google Scholar] [CrossRef]
  105. Barbee, O.; Chesner, C.; Deering, C. Quartz crystals in Toba rhyolites show textures symptomatic of rapid crystallization. Am. Mineral. J. Earth Planet. Mater. 2020, 105, 194–226. [Google Scholar] [CrossRef]
  106. Donovan, J.J.; Lowers, H.A.; Rusk, B.G. Improved electron probe microanalysis of trace elements in quartz. Am. Mineral. 2011, 96, 274–282. [Google Scholar] [CrossRef]
  107. Ramseyer, K.; Mullis, J. Factors influencing short-lived blue cathodoluminescence of alpha-quartz. Am. Mineral. 1990, 75, 791–800. [Google Scholar]
  108. Perny, B.; Eberhardt, P.; Ramseyer, K.; Mullis, J.; Pankrath, R. Microdistribution of Al, Li, and Na in α quartz: Possible causes and correlation with short-lived cathodoluminescence. Am. Mineral. 1992, 77, 534–544. [Google Scholar]
  109. Chamberlain, K.J.; Morgan, D.; Wilson, C. Timescales of mixing and mobilisation in the Bishop Tuff magma body: Perspectives from diffusion chronometry. Contrib. Miner. Pet. 2014, 168, 1034. [Google Scholar] [CrossRef]
  110. Gualda, G.A.R.; Pamukcu, A.S.; Ghiorso, M.S.; Sutton, A.S.R., Jr.; Rivers, M.L. Timescales of Quartz Crystallization and the Longevity of the Bishop Giant Magma Body. PLoS ONE 2012, 7, e37492. [Google Scholar] [CrossRef]
  111. Jollands, M.C.; Bloch, E.; Müntener, O. New Ti-in-quartz diffusivities reconcile natural Ti zoning with time scales and temperatures of upper crustal magma reservoirs. Geology 2020, 48, 654–657. [Google Scholar] [CrossRef]
  112. Mercer, C.; Reed, M.H. Time Scales of Porphyry Cu Deposit Formation: Insights from Titanium Diffusion in Quartz. Econ. Geol. 2015, 110, 587–602. [Google Scholar] [CrossRef]
  113. Ackerson, M.R.; Mysen, B.O.; Tailby, N.D.; Watson, E.B. Low-temperature crystallization of granites and the implications for crustal magmatism. Nature 2018, 559, 94–97. [Google Scholar] [CrossRef] [PubMed]
  114. Spear, F.S.; Ashley, K.T.; Webb, L.E.; Thomas, J.B. Ti diffusion in quartz inclusions: Implications for metamorphic time scales. Contrib. Miner. Pet. 2012, 164, 977–986. [Google Scholar] [CrossRef]
  115. Cole, J.W.; Deering, C.D.; Burt, R.M.; Sewell, S.; Shane, P.A.R.; Matthews, N.E. Okataina Volcanic Centre, Taupo Volcanic Zone, New Zealand: A review of volcanism and synchronous pluton development in an active, dominantly silicic caldera system. Earth-Sci. Rev. 2014, 128, 1–17. [Google Scholar] [CrossRef]
  116. Ostapenko, G.T.; Gamarnik, M.Y.; Gorogotskaya, L.I.; Kuznetsov, G.V.; Tarashchan, A.N.; Timoshkova, L.P. Isomorphism of titanium substitution for silicon in quartz: Experimental data. Miner. Zh 1987, 9, 30–40. [Google Scholar]
  117. Behr, W.M.; Platt, J.P. A naturally constrained stress profile through the middle crust in an extensional terrane. Earth Planet. Sci. Lett. 2011, 303, 181–192. [Google Scholar] [CrossRef]
  118. Reid, M.R.; Vazquez, J.A.; Schmitt, A.K. Zircon-scale insights into the history of a Supervolcano, Bishop Tuff, Long Valley, California, with implications for the Ti-in-zircon geothermometer. Contrib. Mineral. Petrol. 2011, 161, 293–311. [Google Scholar] [CrossRef]
  119. Ehrlich, K.; Vers, E.; Kirs, J.; Soesoo, A. Using a titanium-in-quartz geothermometer for crystallization temperature estimation of the Palaeoproterozoic Suursaari quartz porphyry. Est. J. Earth Sci. 2012, 61, 195. [Google Scholar] [CrossRef]
  120. Girard, G.; Stix, J. Rapid extraction of discrete magma batches from a large differentiating magma chamber: The Central Plateau Member rhyolites, Yellowstone Caldera, Wyoming. Contrib. Mineral. Petrol. 2010, 160, 441–465. [Google Scholar] [CrossRef]
  121. Ostapenko, G.T.; Tarashchan, A.N.; Mitsyuk, B.M. Rutile-quartz geothermobarometer. Geochem. Int. 2007, 45, 506–508. [Google Scholar] [CrossRef]
  122. Ferreira, C. Gene Expression Programming: Mathematical Modeling by an Artificial Intelligence; Springer: Berlin/Heidelberg, Germany, 2006; Volume 21. [Google Scholar]
  123. Iqbal, M.F.; Liu, Q.-F.; Azim, I.; Zhu, X.; Yang, J.; Javed, M.F.; Rauf, M. Prediction of mechanical properties of green concrete incorporating waste foundry sand based on gene expression programming. J. Hazard. Mater. 2019, 384, 121322. [Google Scholar] [CrossRef] [PubMed]
  124. Javed, M.F.; Amin, M.N.; Shah, M.I.; Khan, K.; Iftikhar, B.; Farooq, F.; Aslam, F.; Alyousef, R.; Alabduljabbar, H. Applications of Gene Expression Programming and Regression Techniques for Estimating Compressive Strength of Bagasse Ash based Concrete. Crystals 2020, 10, 737. [Google Scholar] [CrossRef]
  125. Jourdan, A.-L.; Vennemann, T.W.; Mullis, J.; Ramseyer, K. Oxygen isotope sector zoning in natural hydrothermal quartz. Miner. Mag. 2009, 73, 615–632. [Google Scholar] [CrossRef]
  126. Allan, M.M.; Yardley, B.W. Tracking meteoric water infiltration into a magmatic hydrothermal system: A cathodoluminescence, oxygen isotope, and trace element study of quartz from Mt. Leyshon, Australia. Chem. Geol. 2007, 240, 343–360. [Google Scholar] [CrossRef]
  127. Lehmann, K.; Berger, A.; Gotte, T.; Ramseyer, K.; Wiedenbeck, M. Growth related zonations in authigenic and hydrothermal quartz characterized by SIMS-, EPMA-, SEM-CL-and SEM-CC-imaging. Mineral. Mag. 2009, 73, 633–643. [Google Scholar] [CrossRef]
  128. Northrup, P.A.; Reeder, R.J. Evidence for the importance of growth-surface structure to trace element incorporation in topaz. Am. Mineral. 1994, 79, 1167–1175. [Google Scholar]
  129. Wass, S.Y. The origin and petrogenetic significance of hour-glass zoning in titaniferous clinopyroxenes. Miner. Mag. 1973, 39, 133–144. [Google Scholar] [CrossRef]
  130. Watson, E.B.; Liang, Y. A simple model for sector zoning in slowly grown crystals: Implications for growth rate and lattice diffusion, with emphasis on accessory minerals in crustal rocks. Am. Mineral. 1995, 80, 1179–1187. [Google Scholar] [CrossRef]
  131. Onasch, C.M.; Vennemann, T.W. Disequilibrium partitioning of oxygen isotopes associated with sector zoning in quartz. Geology 1995, 23, 1103–1106. [Google Scholar] [CrossRef]
  132. Rusk, M.; Reed, B. Scanning electron microscope: Cathodoluminescence analysis of quartz reveals complex growth histories in veins from the Butte porphyry copper deposit, Montana. Geology 2002, 30, 727–730. [Google Scholar] [CrossRef]
  133. Nadoll, P.; Rehm, M.; Duschl, F.; Klemd, R.; Kraemer, D.; Sośnicka, M. REY and Trace Element Chemistry of Fluorite from Post-Variscan Hydrothermal Veins in Paleozoic Units of the North German Basin. Geosciences 2018, 8, 283. [Google Scholar] [CrossRef]
  134. Ihinger, P.D.; Zink, S.I. Determination of relative growth rates of natural quartz crystals. Nature 2000, 404, 865–869. [Google Scholar] [CrossRef] [PubMed]
  135. Monecke, T.; Kempe, U.; Götze, J. Genetic significance of the trace element content in metamorphic and hydrothermal quartz: A reconnaissance study. Earth Planet. Sci. Lett. 2002, 202, 709–724. [Google Scholar] [CrossRef]
  136. Fu, S.; Lan, Q.; Yan, J. Trace element chemistry of hydrothermal quartz and its genetic significance: A case study from the Xikuangshan and Woxi giant Sb deposits in southern China. Ore Geol. Rev. 2020, 126, 103732. [Google Scholar] [CrossRef]
  137. Cherniak, D. Diffusion in Quartz, Melilite, Silicate Perovskite, and Mullite. Rev. Miner. Geochem. 2010, 72, 735–756. [Google Scholar] [CrossRef]
  138. Ramseyer, K.; Mullis, J. Geologic application of cathodoluminescence of silicates. In Cathodoluminescence in Geosciences; Springer: Berlin/Heidelberg, Germany, 2000; pp. 177–191. [Google Scholar]
  139. Rusk, B.G.; Reed, M.H.; Dilles, J.H. Fluid Inclusion Evidence for Magmatic-Hydrothermal Fluid Evolution in the Porphyry Copper-Molybdenum Deposit at Butte, Montana. Econ. Geol. 2008, 103, 307–334. [Google Scholar] [CrossRef]
  140. Shibue, Y.; Chiba, H.; Kusakabe, M.; Morishita, Y. Temperatures and Oxygen Isotopic Compositions of Hydrothermal Fluids for the Takatori Tungsten-copper Deposit, Japan. Resour. Geol. 2005, 55, 101–110. [Google Scholar] [CrossRef]
  141. Johnson, S.E.; Song, W.J.; Cook, A.C.; Vel, S.S.; Gerbi, C.C. The quartz α↔β phase transition: Does it drive damage and reaction in continental crust? Earth Planet. Sci. Lett. 2021, 553, 116622. [Google Scholar] [CrossRef]
  142. Aparicio, A.; Bustillo, M. Cathodoluminescence Spectral Characteristics of Quartz and Feldspars in Unaltered and Hydrothermally Altered Volcanic Rocks (Almeria, Spain). Spectrosc. Lett. 2012, 45, 104–108. [Google Scholar] [CrossRef]
  143. Schaarschmidt, A.; Haase, K.M.; de Wall, H.; Bestmann, M.; Krumm, S.; Regelous, M. Upper crustal fluids in a large fault system: Microstructural, trace element and oxygen isotope study on multi-phase vein quartz at the Bavarian Pfahl, SE Germany. Geol. Rundsch. 2018, 108, 521–543. [Google Scholar] [CrossRef]
  144. Chen, Y.-J.; Pirajno, F.; Li, N.; Guo, D.-S.; Lai, Y. Isotope systematics and fluid inclusion studies of the Qiyugou breccia pipe-hosted gold deposit, Qinling Orogen, Henan province, China: Implications for ore genesis. Ore Geol. Rev. 2009, 35, 245–261. [Google Scholar] [CrossRef]
  145. Yu, D.; Xu, D.; Zhao, Z.; Huang, Q.; Wang, Z.; Deng, T.; Zou, S. Genesis of the Taolin Pb-Zn deposit in northeastern Hunan Province, South China: Constraints from trace elements and oxygen-sulfur-lead isotopes of the hydrothermal minerals. Miner. Deposita 2020, 55, 1467–1488. [Google Scholar] [CrossRef]
  146. Shu, Q.; Lai, Y. Fluid Inclusion and Oxygen Isotope Constraints on the Origin and Hydrothermal Evolution of the Haisugou Porphyry Mo Deposit in the Northern Xilamulun District, NE China. Geofluids 2017, 2017, 10–12. [Google Scholar] [CrossRef]
  147. Seward, T.M. Metal transport by hydrothermal ore fluids. Geochem. Hydrothermal Ore Depos. 1997, 3, 435–486. [Google Scholar]
  148. Hensler, A.-S.; Hagemann, S.G.; Brown, P.E.; Rosière, C. Using oxygen isotope chemistry to track hydrothermal processes and fluid sources in itabirite-hosted iron ore deposits in the Quadrilátero Ferrífero, Minas Gerais, Brazil. Miner. Depos. 2013, 49, 293–311. [Google Scholar] [CrossRef]
  149. Lubben, J.D. Silicification across the Betze-Post Carlin-Type Gold Deposit: Clues to Ore Fluid Properties and Sources, Northern Carlin Trend, Nevada. Master’s Thesis, University of Nevada, Reno, NV, USA, 2003. [Google Scholar]
  150. Götze, J.; Plötze, M.; Trautmann, T. Structure and luminescence characteristics of quartz from pegmatites. Am. Mineral. 2005, 90, 13–21. [Google Scholar] [CrossRef]
  151. Müller, A.; Wanvik, J.E.; Ihlen, P.M. Petrological and chemical characterisation of high-purity quartz deposits with examples from Norway. In Quartz: Deposits, Mineralogy and Analytics; Springer: Berlin/Heidelberg, Germany, 2012; pp. 71–118. [Google Scholar]
  152. Harben, P.W. The Industrial Mineral Handybook—A Guide to Markets, Specifications and Prices, 4th ed.; Industrial Mineral Information: Worcester Park, UK, 2002; p. 412. [Google Scholar]
  153. Richter, D.K.; Götte, T.; Götze, J.; Neuser, R.D. Progress in application of cathodoluminescence (CL) in sedimentary petrology. Mineral. Petrol. 2003, 79, 127–166. [Google Scholar] [CrossRef]
  154. Gorobets, B.S.; Rogozine, A.A. Luminescent Spectra of Minerals; RPC VIMS: Moscow, Russia, 2002. [Google Scholar]
  155. Gaft, M.; Reisfeld, R.; Panczer, G. Luminescence Spectroscopy of Minerals and Materials; Springer: Berlin/Heidelberg, Germany, 2005. [Google Scholar]
  156. Boggs, S., Jr.; Krinsley, H. Application of Cathodoluminescence Imaging to the Study of Sedimentary Rocks; Cambridge University Press: Cambridge, UK, 2006. [Google Scholar]
  157. Gucsik, A. Cathodoluminescence and Its Application in the Planetary Sciences; Springer: Berlin/Heidelberg, Germany, 2009. [Google Scholar]
Figure 1. Displayed temperature increase with increasing Ti content: Data 1 (black dots), Data 2 (red dots), Data 3 (blue triangle), and Data 4 (green triangle) are collected from [8,41,63,64], respectively.
Minerals 12 01042 g001
Figure 2. Demonstration of the cooling magma chamber history: SOZ and MOZ are formed at higher temperatures than homogeneous and heterogeneous CL (modified from [8]).
Minerals 12 01042 g002
Figure 3. Flow chart representing types of oscillatory zoning.
Minerals 12 01042 g003
Figure 4. Sketches of SEM-CL images of quartz phenocryst. (a) Phenocryst with a resorbed crystal core and bright overgrowth (white arrow). (b) Zoned phenocrysts with melt inclusions. (c) Resorption episode followed by irregular growth, which results in the entrapment of melt inclusions (MIs). (d) Rounded (resorbed) quartz phenocryst with blurred internal growth zoning (modified from [5,29]).
Minerals 12 01042 g004
Figure 5. Four types of CL patterns observed from magmatic quartz.
Minerals 12 01042 g005
Figure 6. Sample H13-2 of magmatic quartz porphyry from Huangshaping showing the lobate depressions. Some of the impediments (4) are so deep that they look like inclusions, and growth zones are adapted the shape of these embayments (1,2,3).
Minerals 12 01042 g006
Figure 7. The structural configuration of quartz trace elements. (a) Quartz atomic lattice structure. (b) Configuration of tetravalent ions (Ge and Ti) as single substitutions for Si. (c) Pentavalent ion (P) and trivalent ion (Al) substituted for two Si ions. (d) Trivalent ion (Al, Fe, or B) substituted for Si, where charge balance is facilitated by a monovalent ion (Li, Na, or K) [23].
Minerals 12 01042 g007
Figure 8. (a) A demonstration of the relationship between Al and other trace elements. The data were collected from [7,27,78]. Li is the only element that strongly correlates with Al. (b) Relationships between Al vs. Ti, K, and Fe. The data were collected from the eastern Erzgebirge volcano-plutonic complex in Germany [78]. (c) Magmatic quartz Al vs. Ti relation, both having an inverse relation. (d) Relationship between Ti vs. Al, Li, and Na. The data were collected from [7].
Minerals 12 01042 g008
Figure 9. Demonstration of the relation between Al and Li, Na, and Ge. Li is the only element that strongly correlates with Al concentration [37,73].
Minerals 12 01042 g009
Figure 10. Representation of the correlation between magmatic and hydrothermal quartz. (a) Representing the trace elements concentration in hydrothermal quartz; (b) representing the magmatic quartz trace elements concentration.
Minerals 12 01042 g010
Figure 11. Demonstration of the relationship between Al and Ti in different types of quartz.
Minerals 12 01042 g011
Figure 12. Representation of the concentrations of trace elements (i.e., Al vs. Ti, K, and Fe) from different ore deposits. (a) Trace elements correlation in granitic quartz; (b) hydrothermal quartz; (c) pegmatitic quartz; (d) rhyolitic quartz.
Minerals 12 01042 g012
Figure 13. Sample H13-5 of orthophyre taken from Huangshaping deposit, southern China. (a) Sericitization and alteration with zircon inclusion in magmatic quartz phenocrysts and plagioclase in surroundings. (b) CL image showing the internal texture. Abbreviation: plag—plagioclase; zr—zircon.
Minerals 12 01042 g013
Table 1. Parameters of GEP models used for Ti concentration vs. temperature relationship.
Linking Function Assessment
ModelNo. of ChromosomeHead SizeGenesLinking FunctionR2
Gene Expression Programming (GEP+)20083Addition0.8
Publisher’s Note: MDPI stays neutral with regard to jurisdictional claims in published maps and institutional affiliations.

