
Green Mining Takes Place at the Power Plant


Abstract
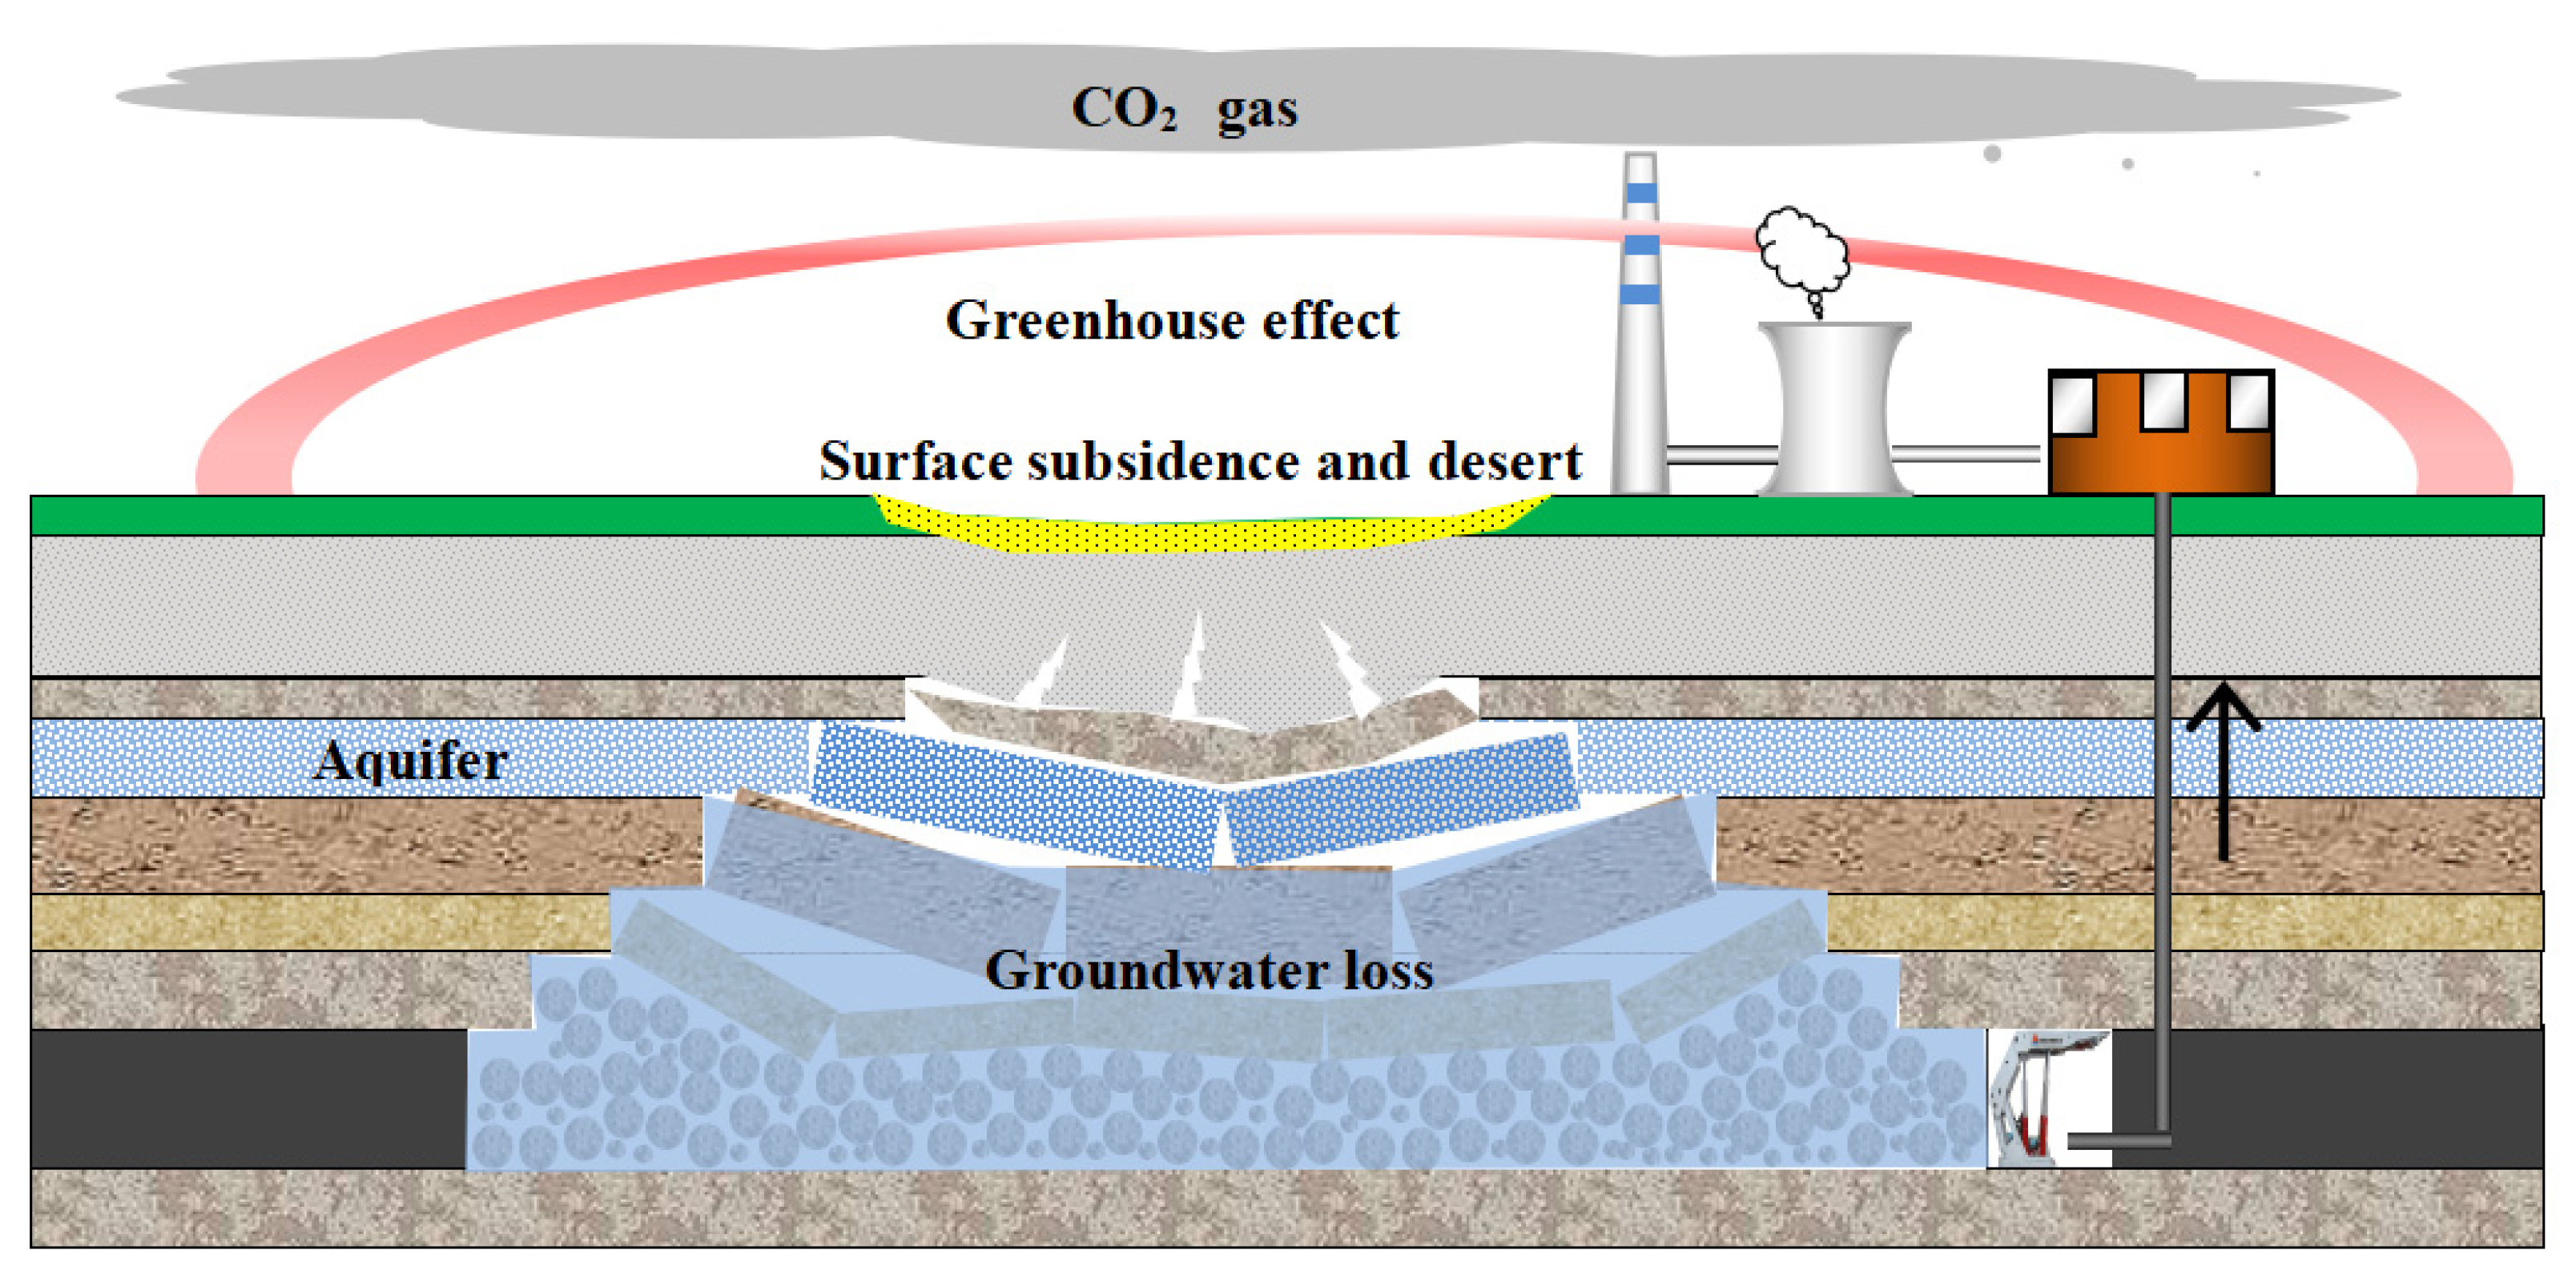
:1. Introduction
2. Materials and Methods
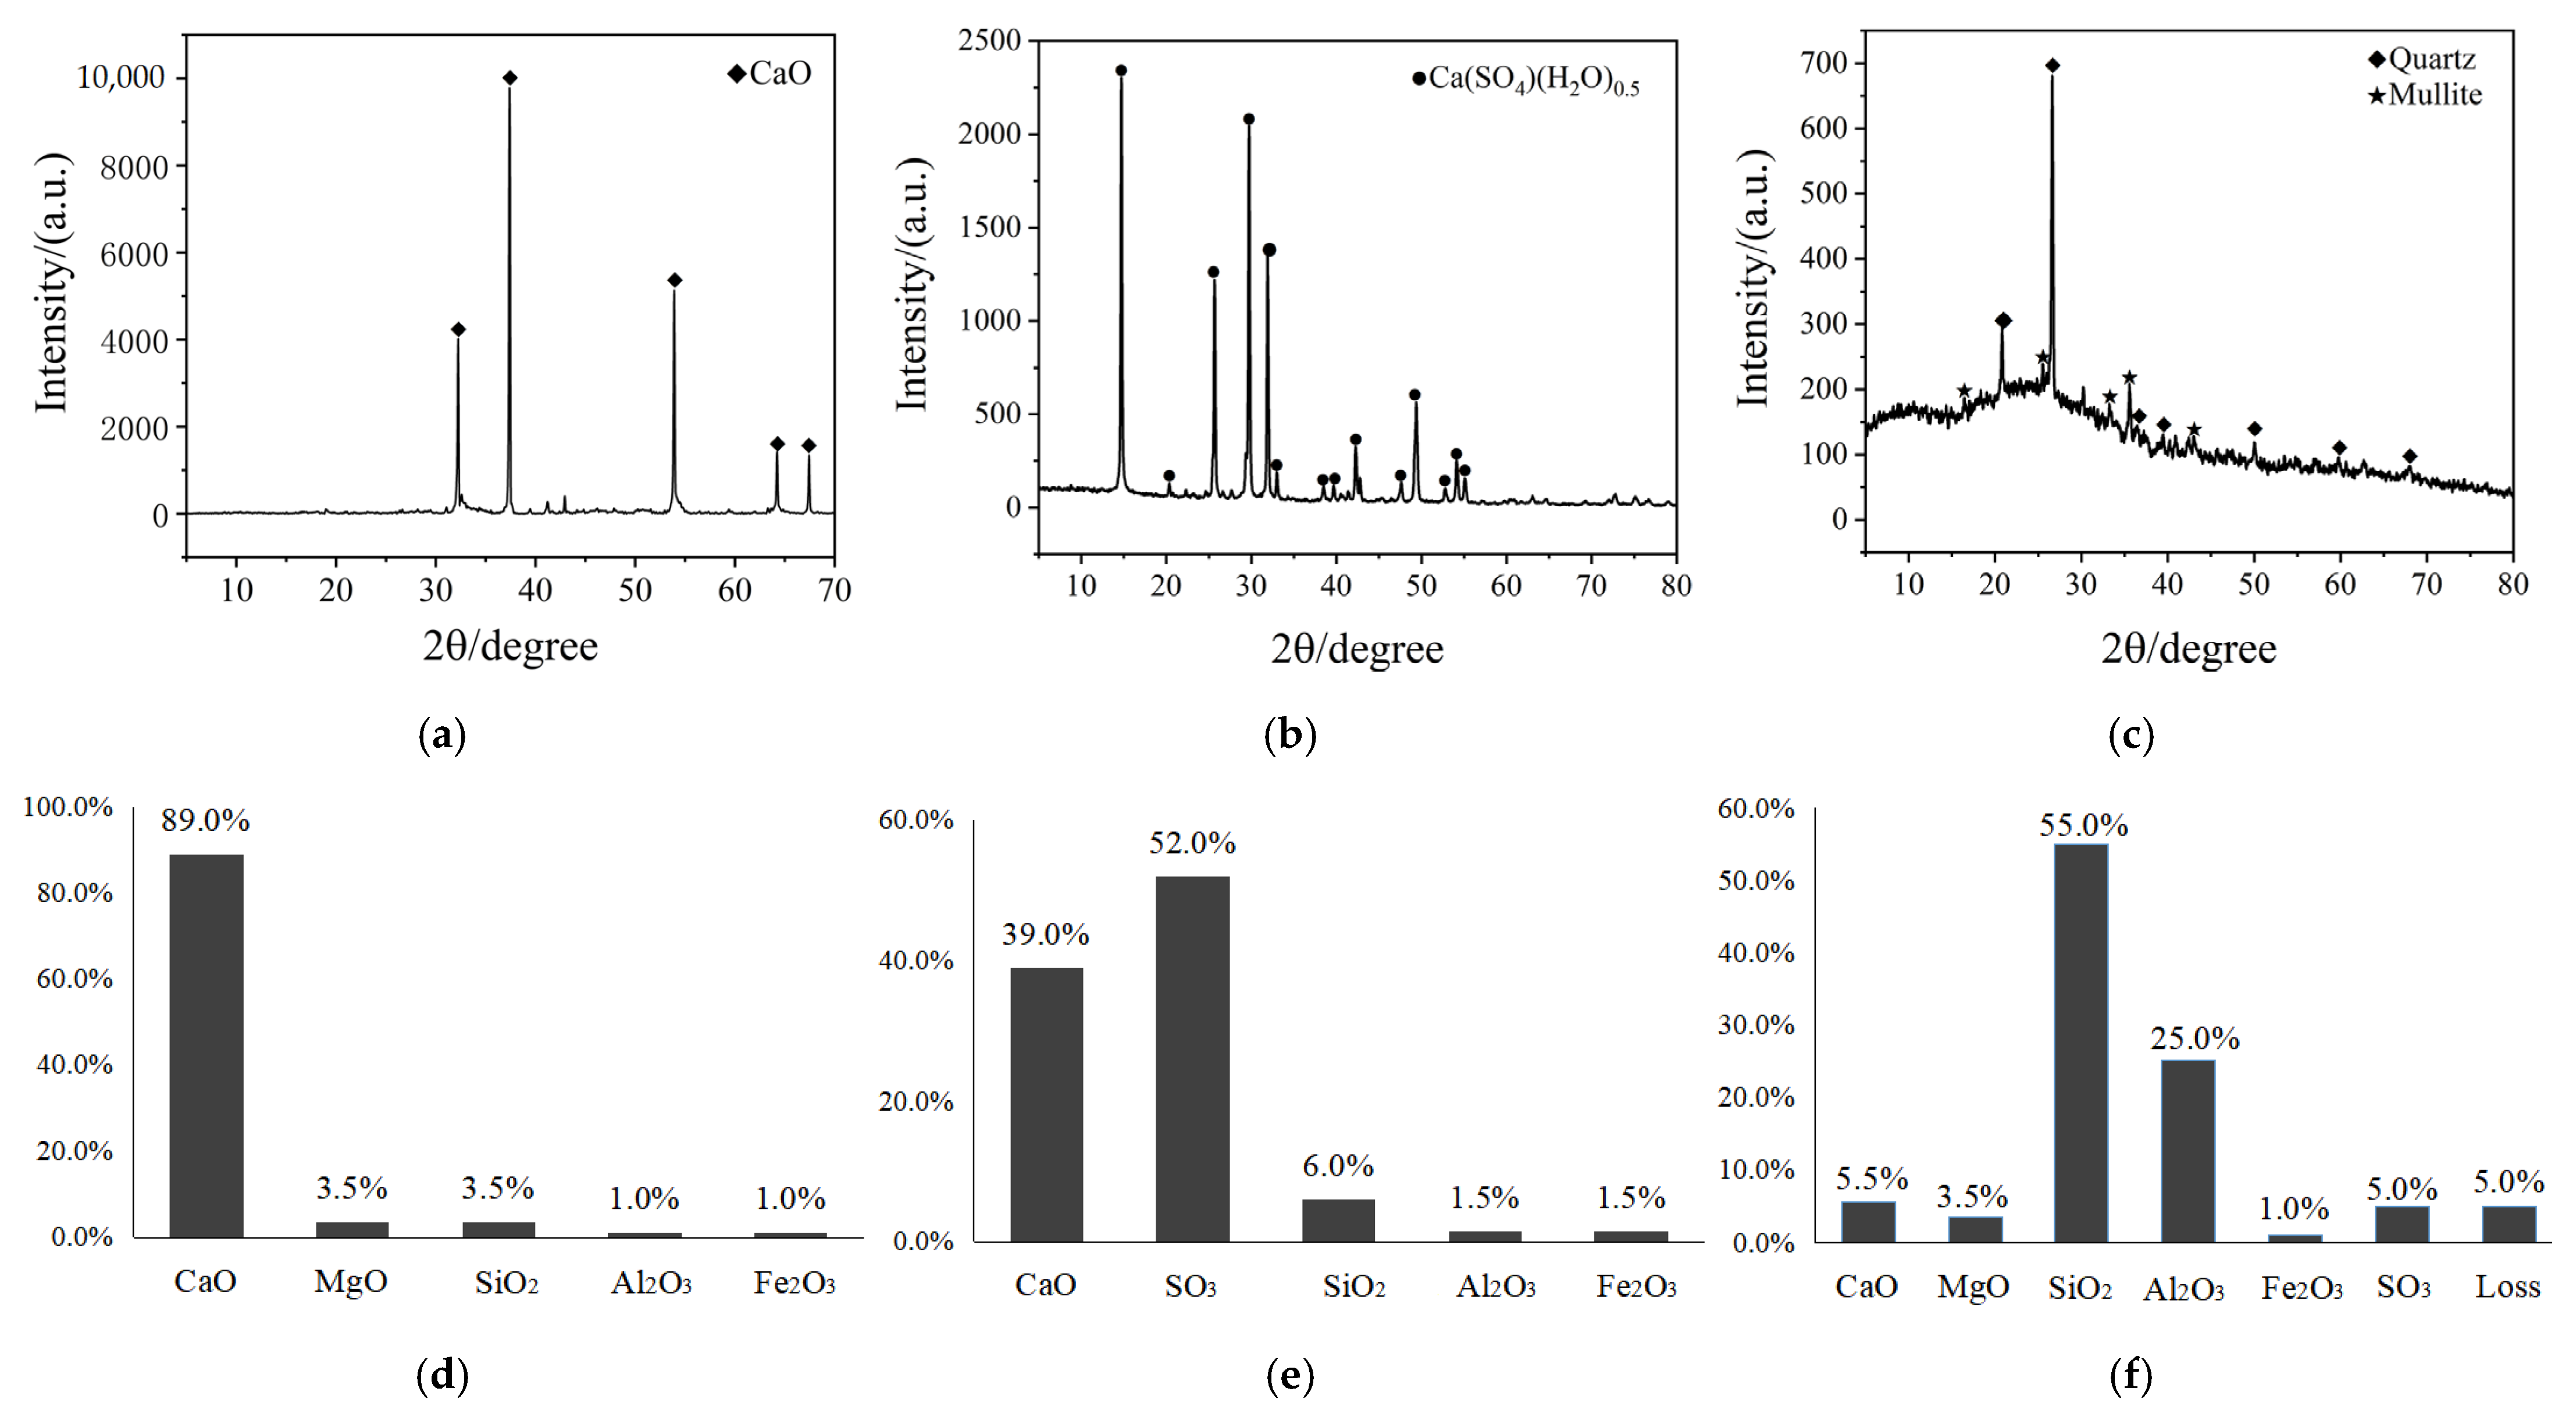
2.1. Experimental Materials
2.2. Specimen Preparation and the Experimental Study
2.3. Study on the Overburden Control Effect of Gray Brick in Backfill Mining
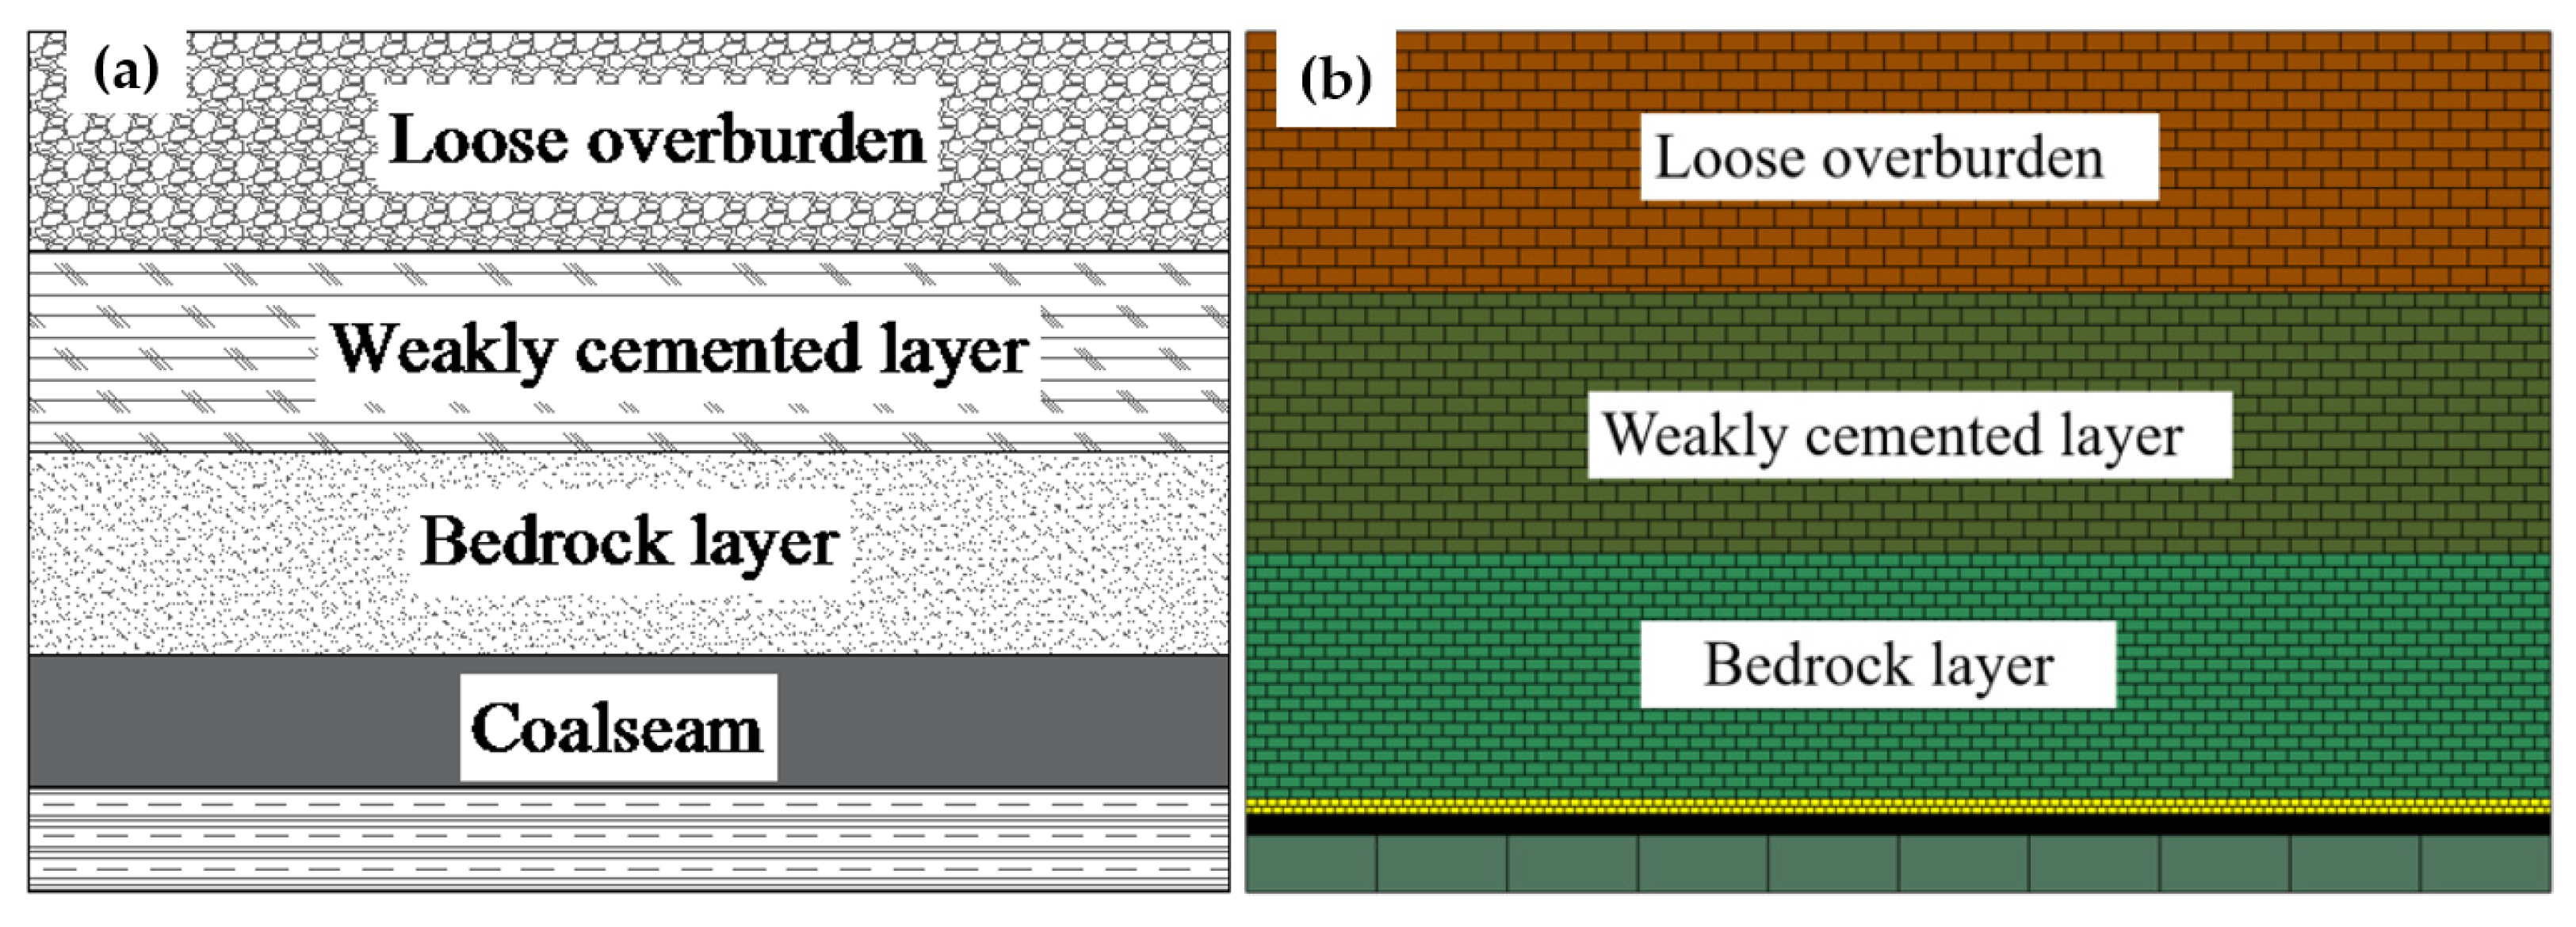
2.3.1. Establishing a Numerical Model
2.3.2. Simulation Scheme
3. Results and Discussion
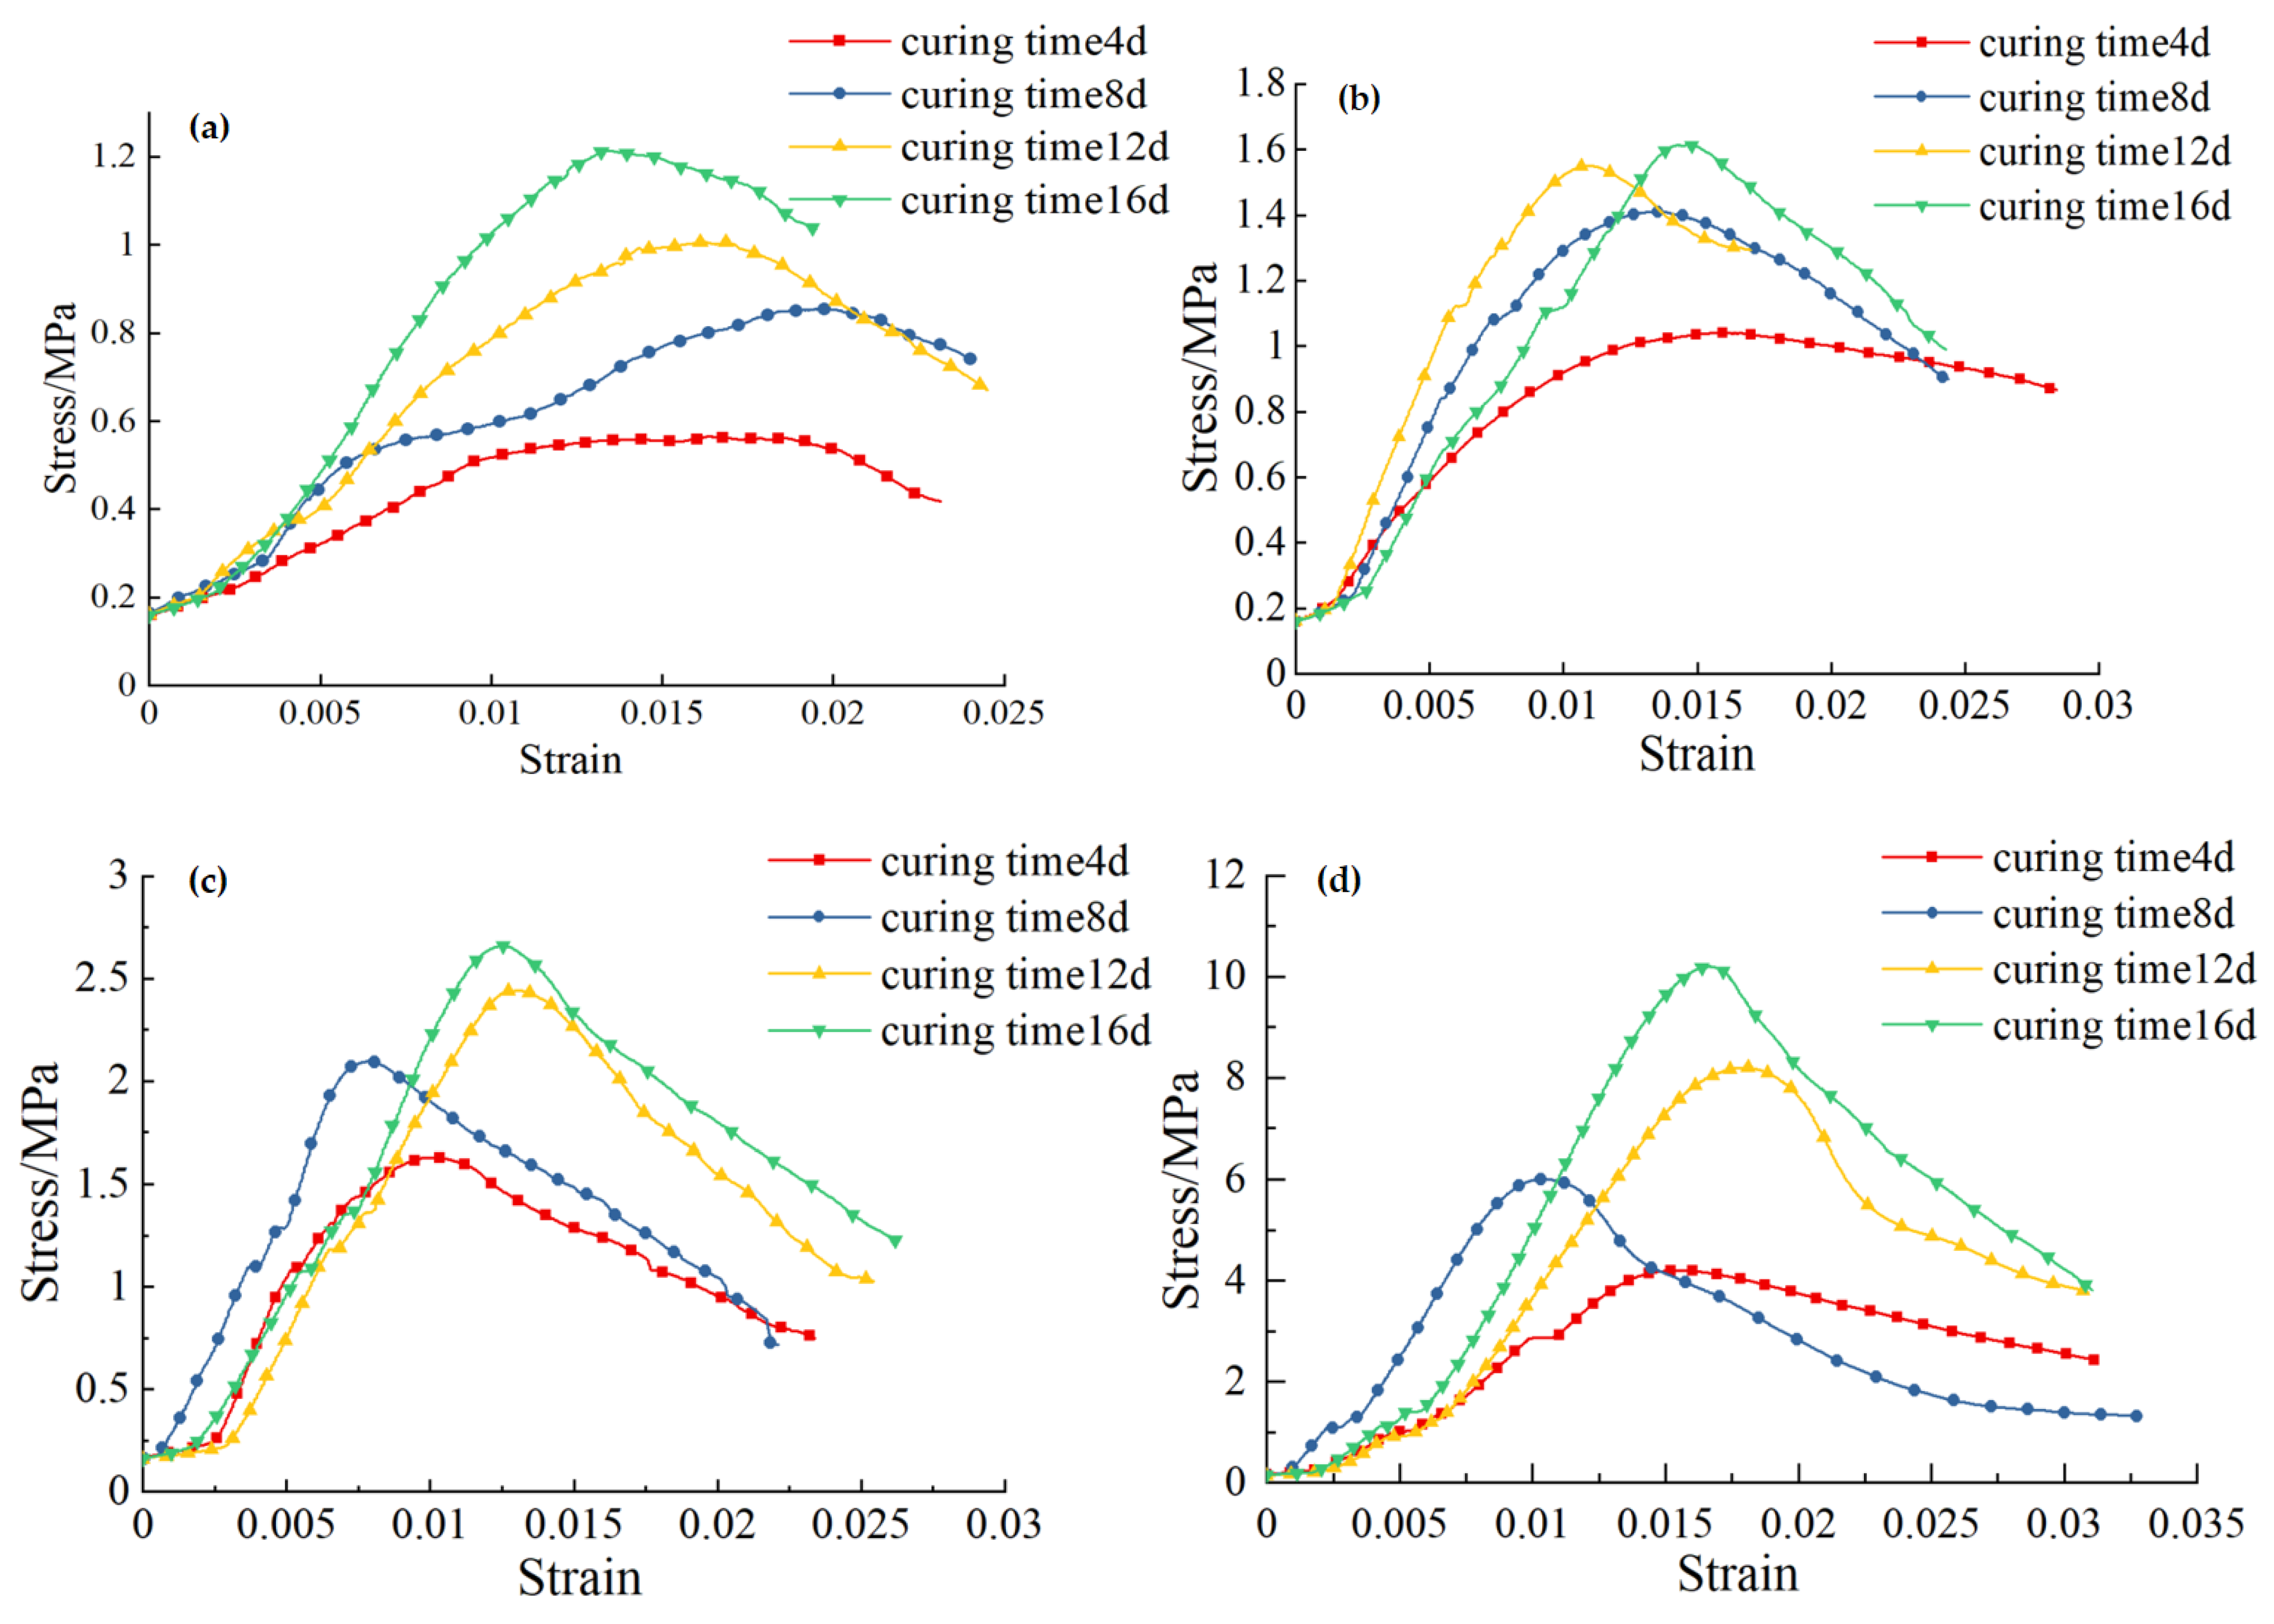
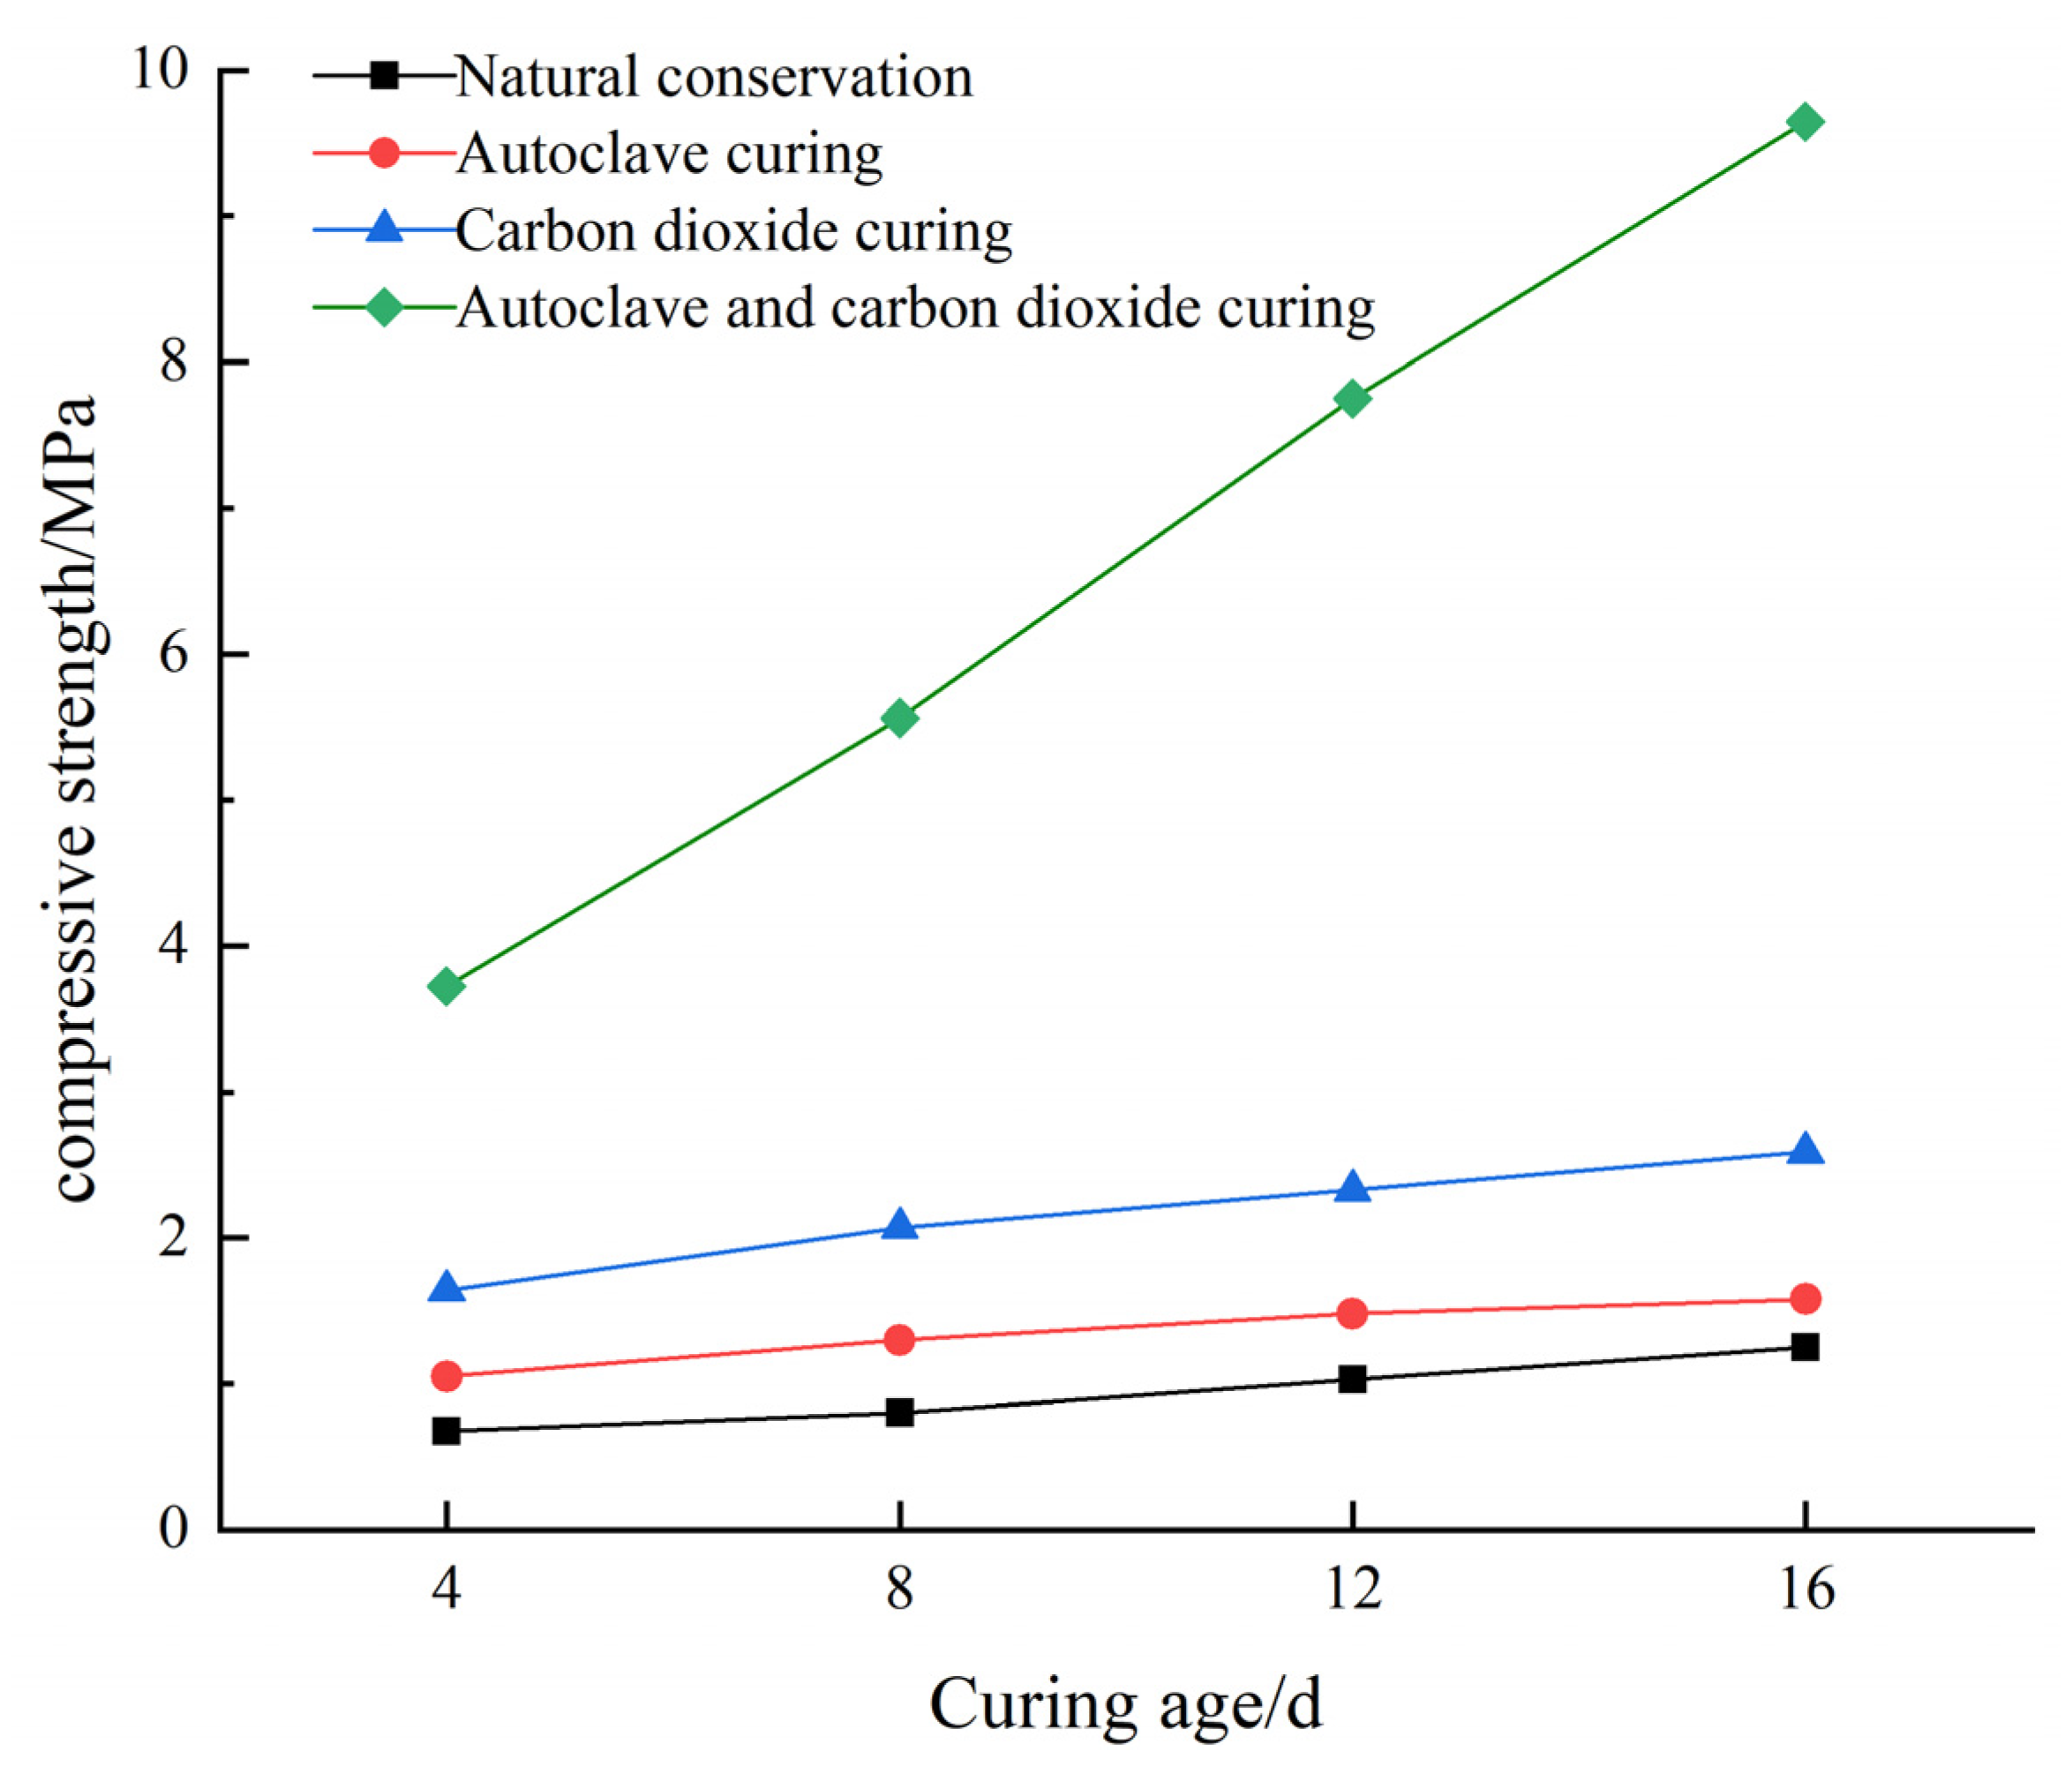
3.1. Analysis of the Bearing Strength of the Gray Brick
3.2. Carbonation Curing Mechanism Analysis of the Gray Brick
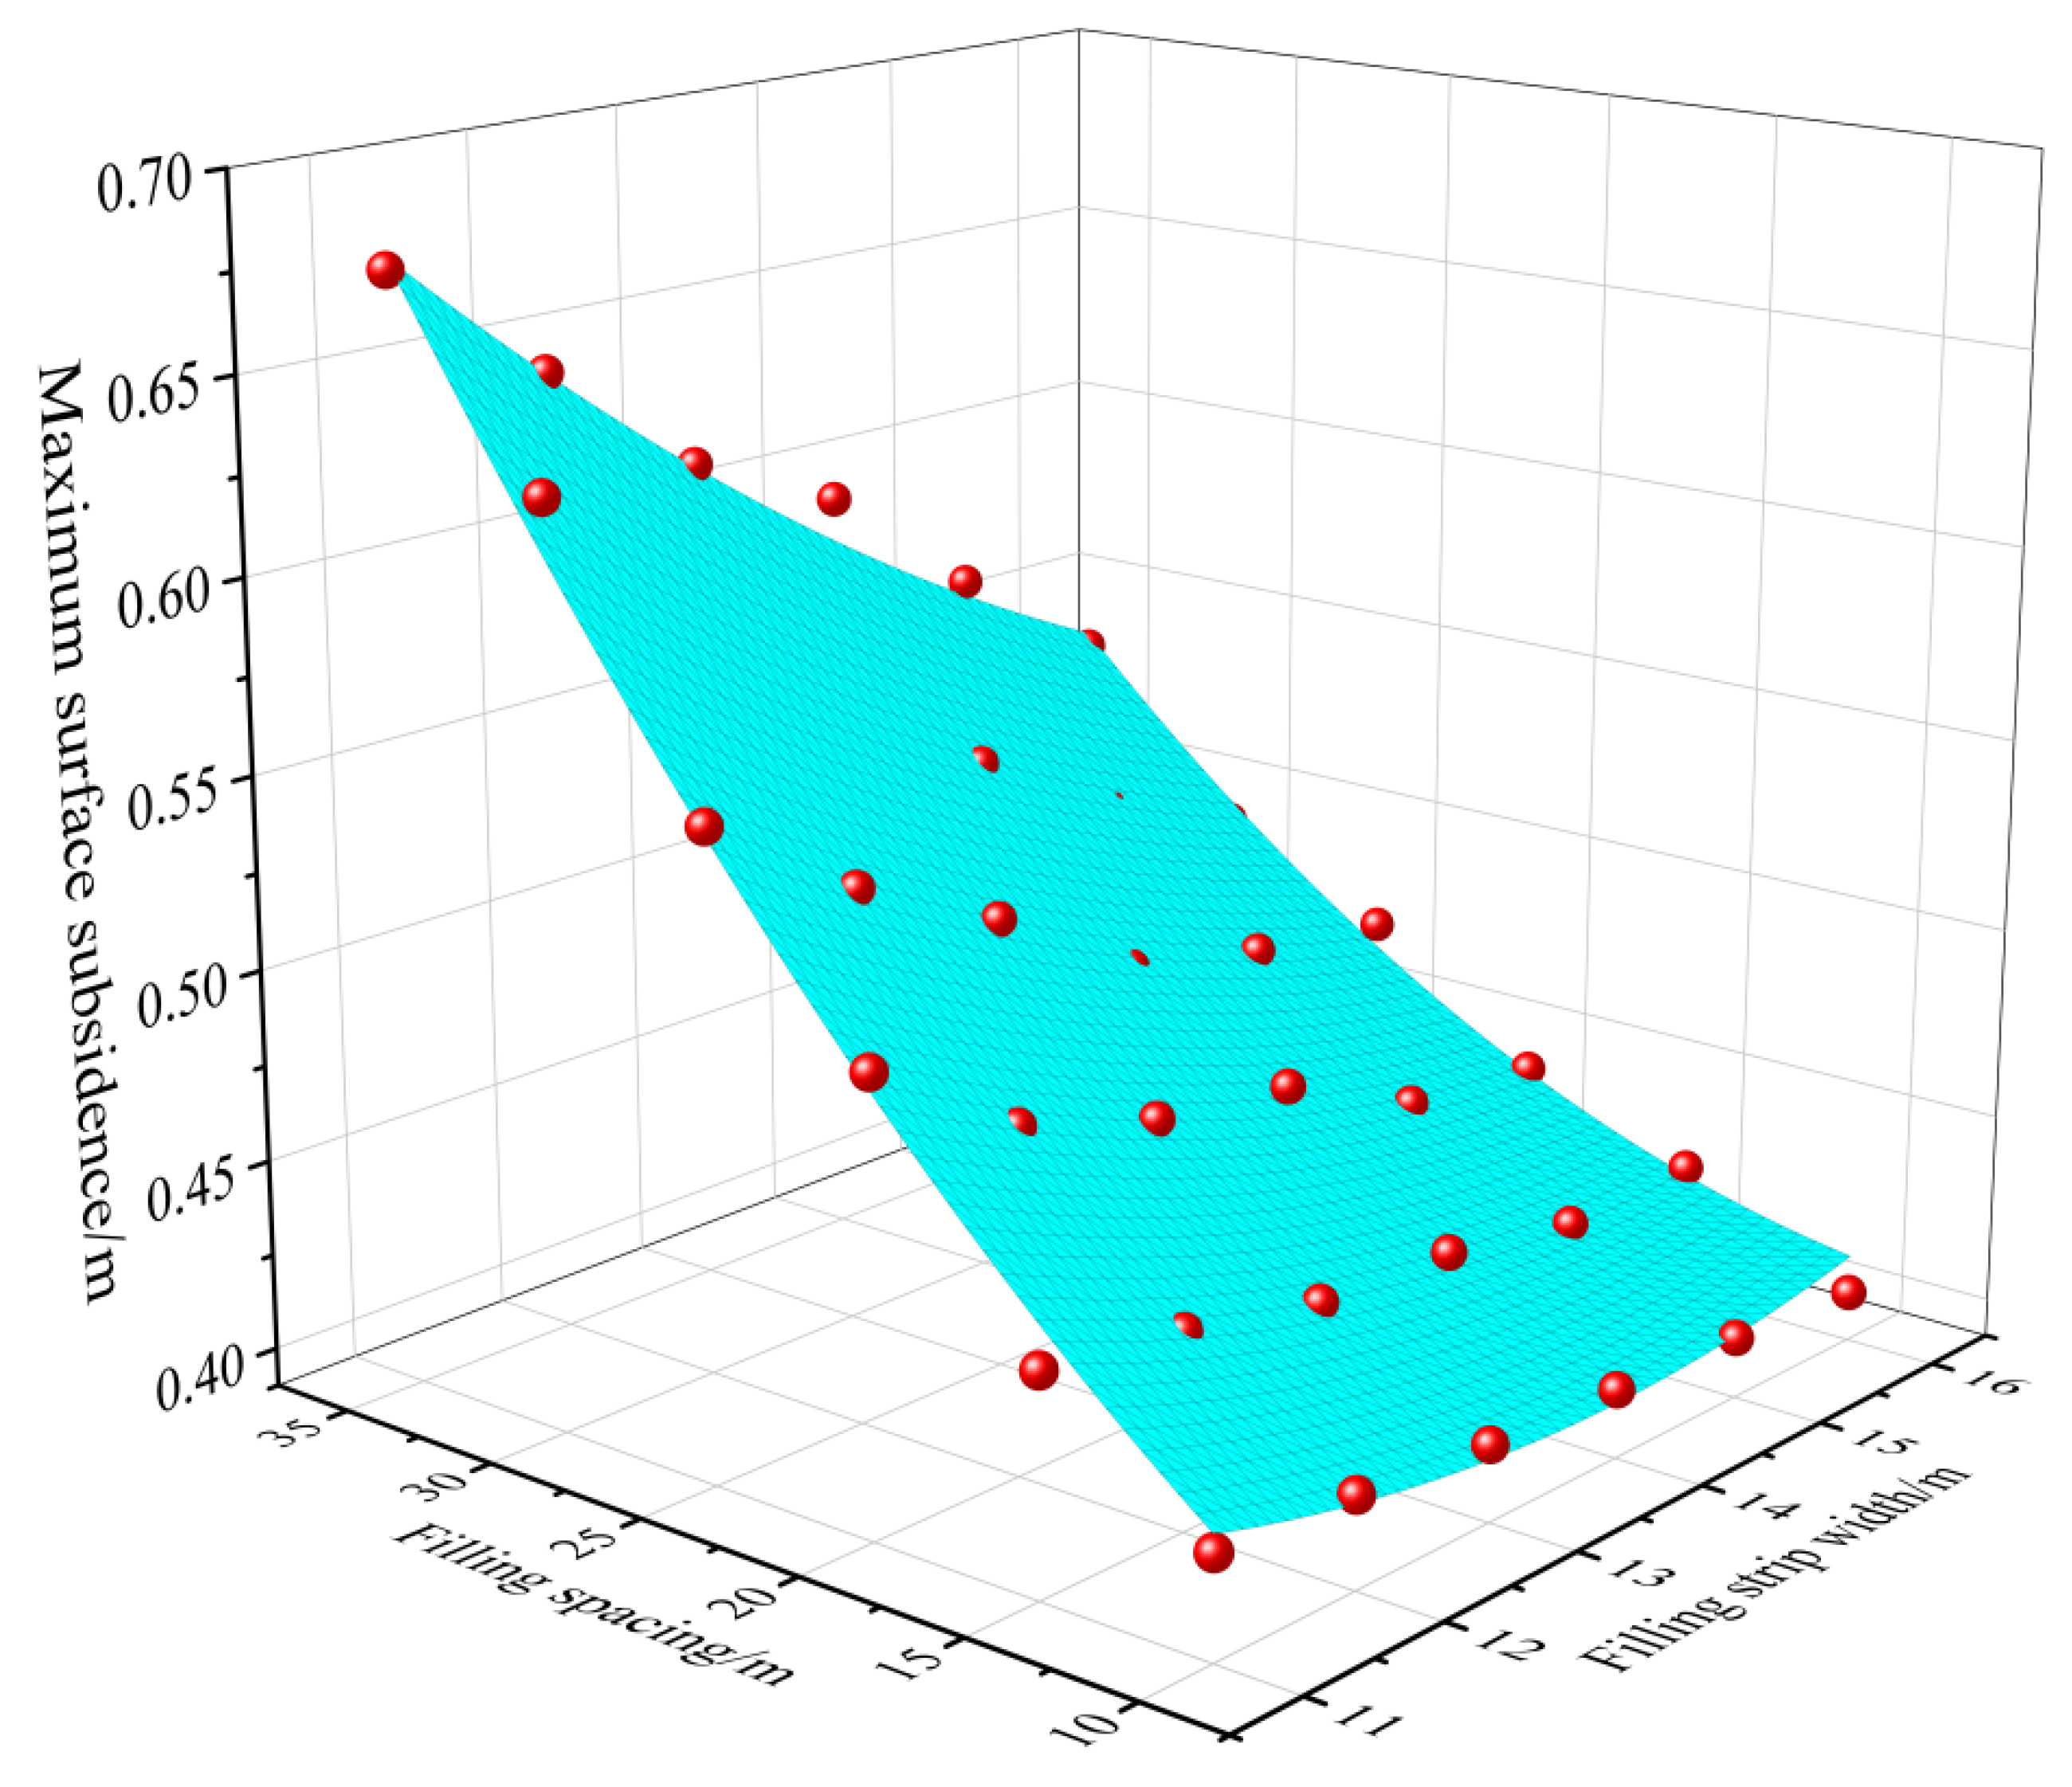
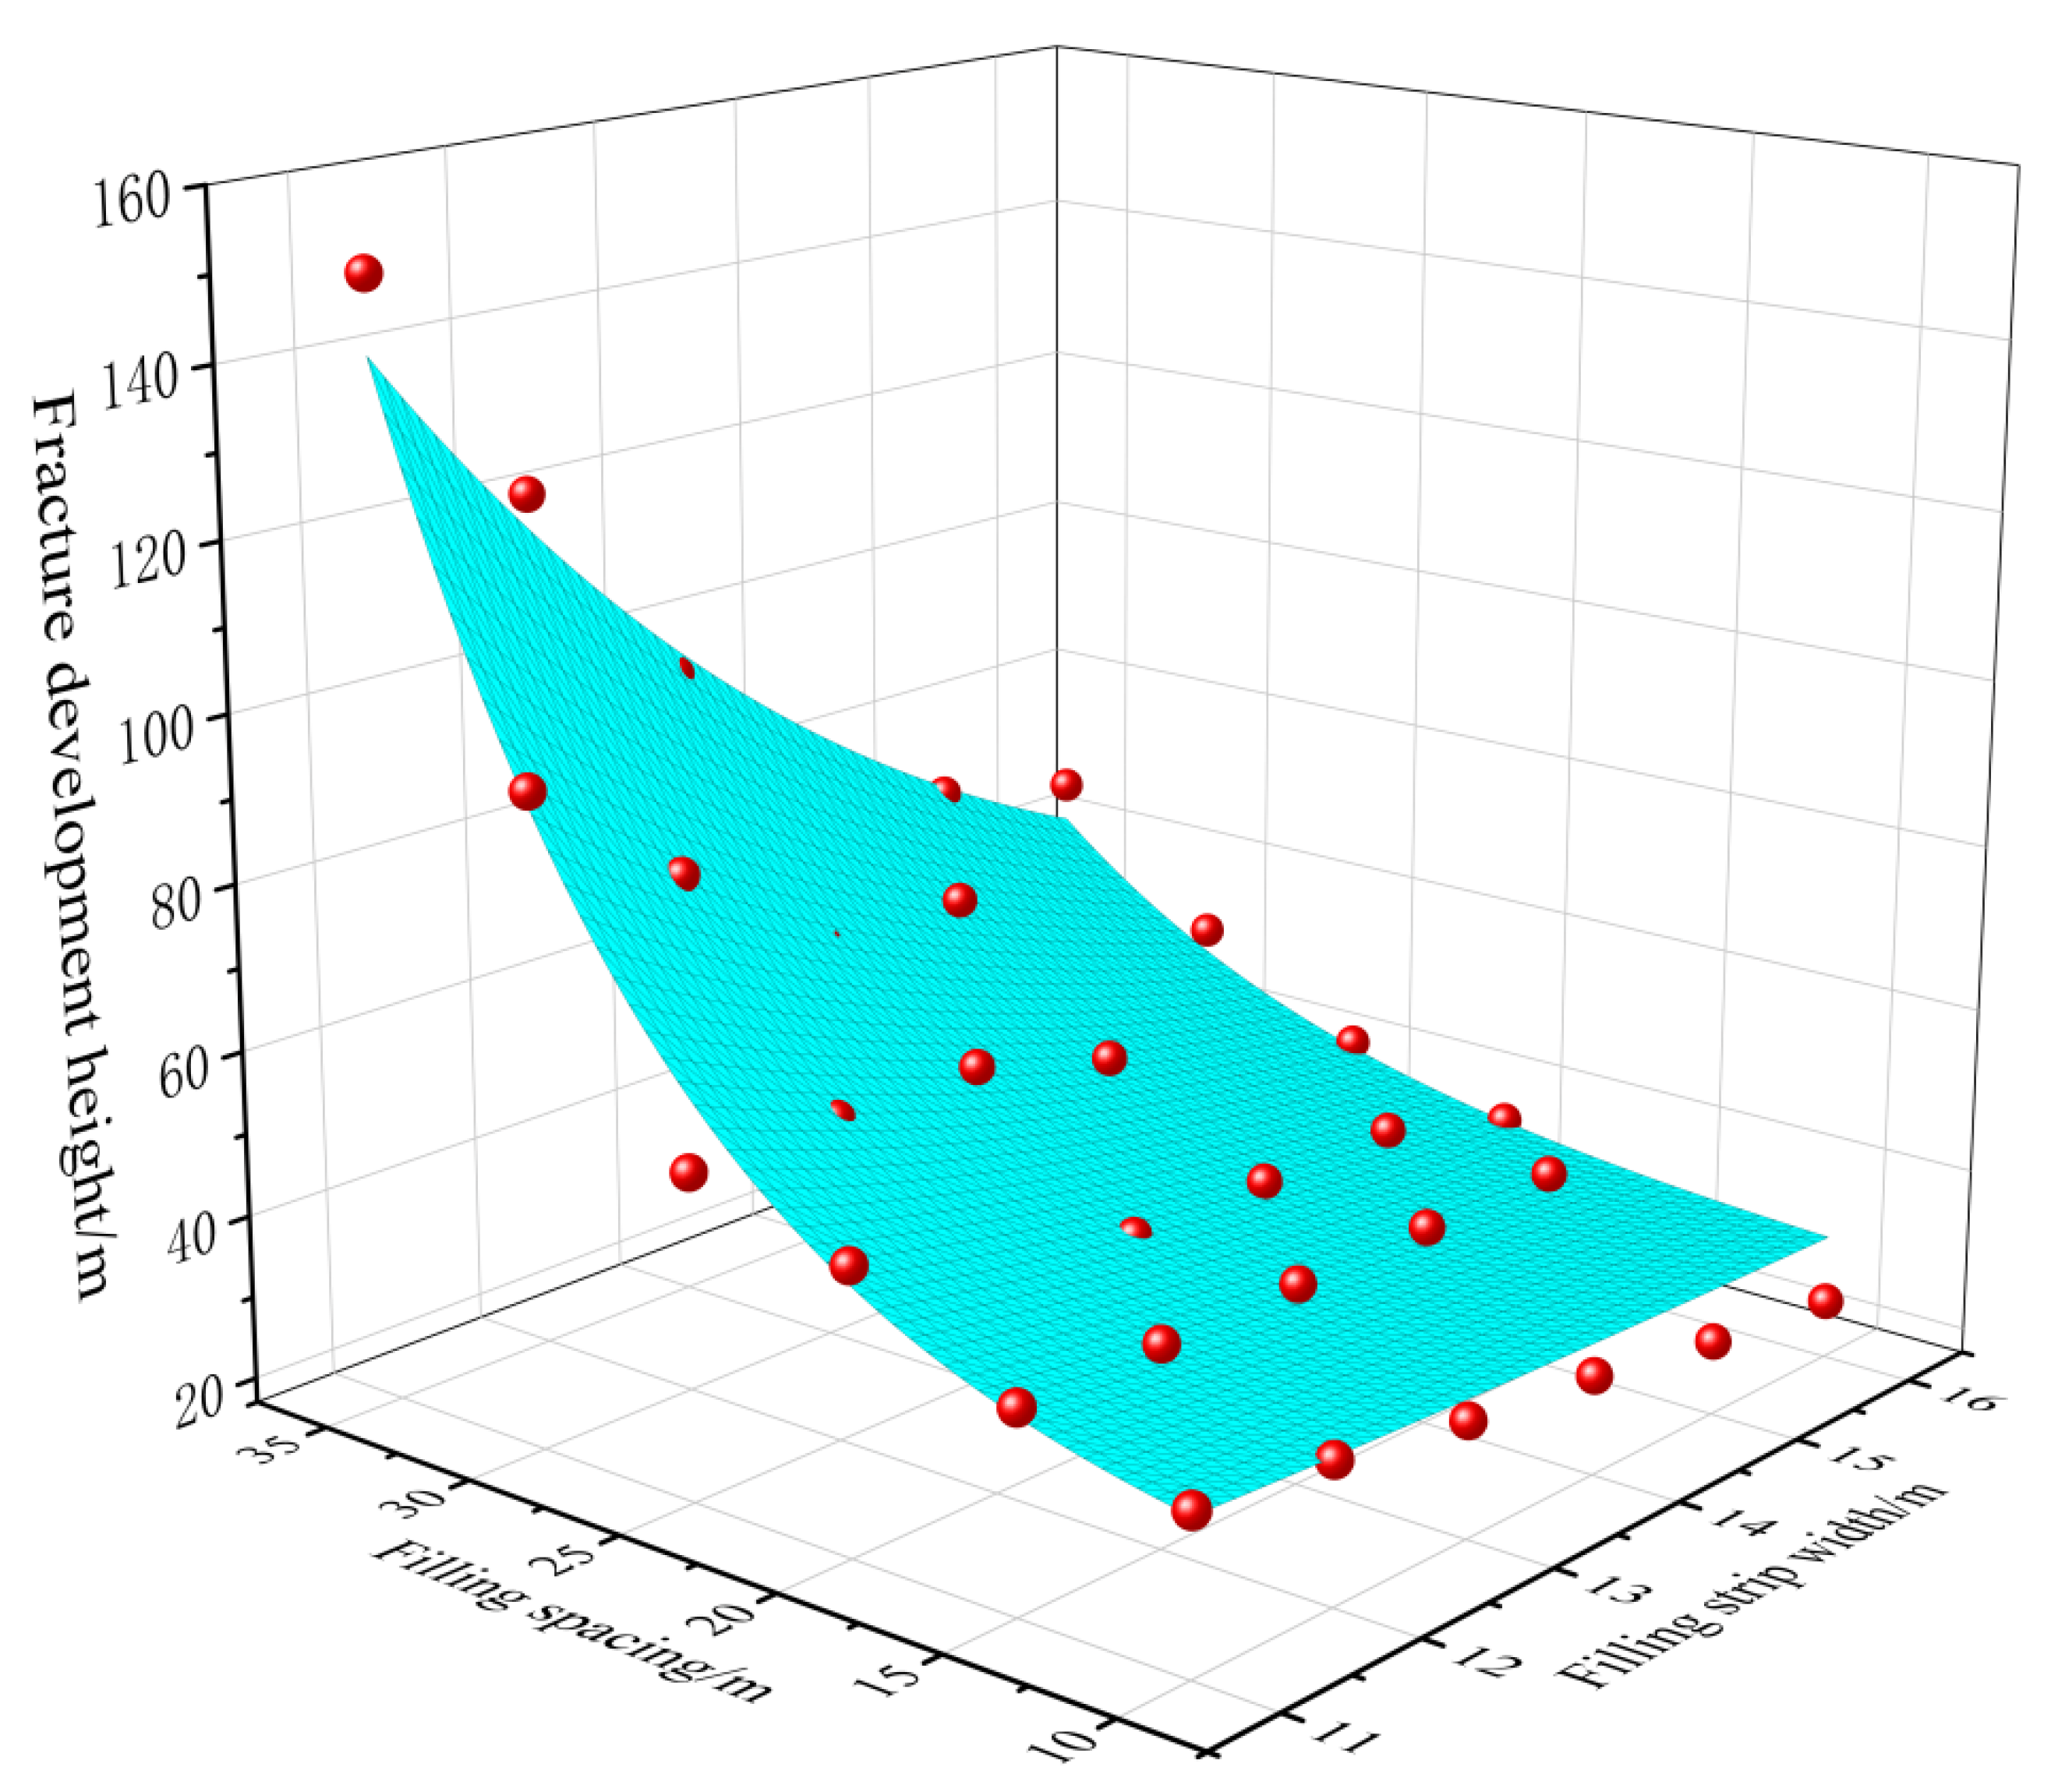
3.3. Stability Analysis of the Overlying Strata Filled with Gray Brick Strips
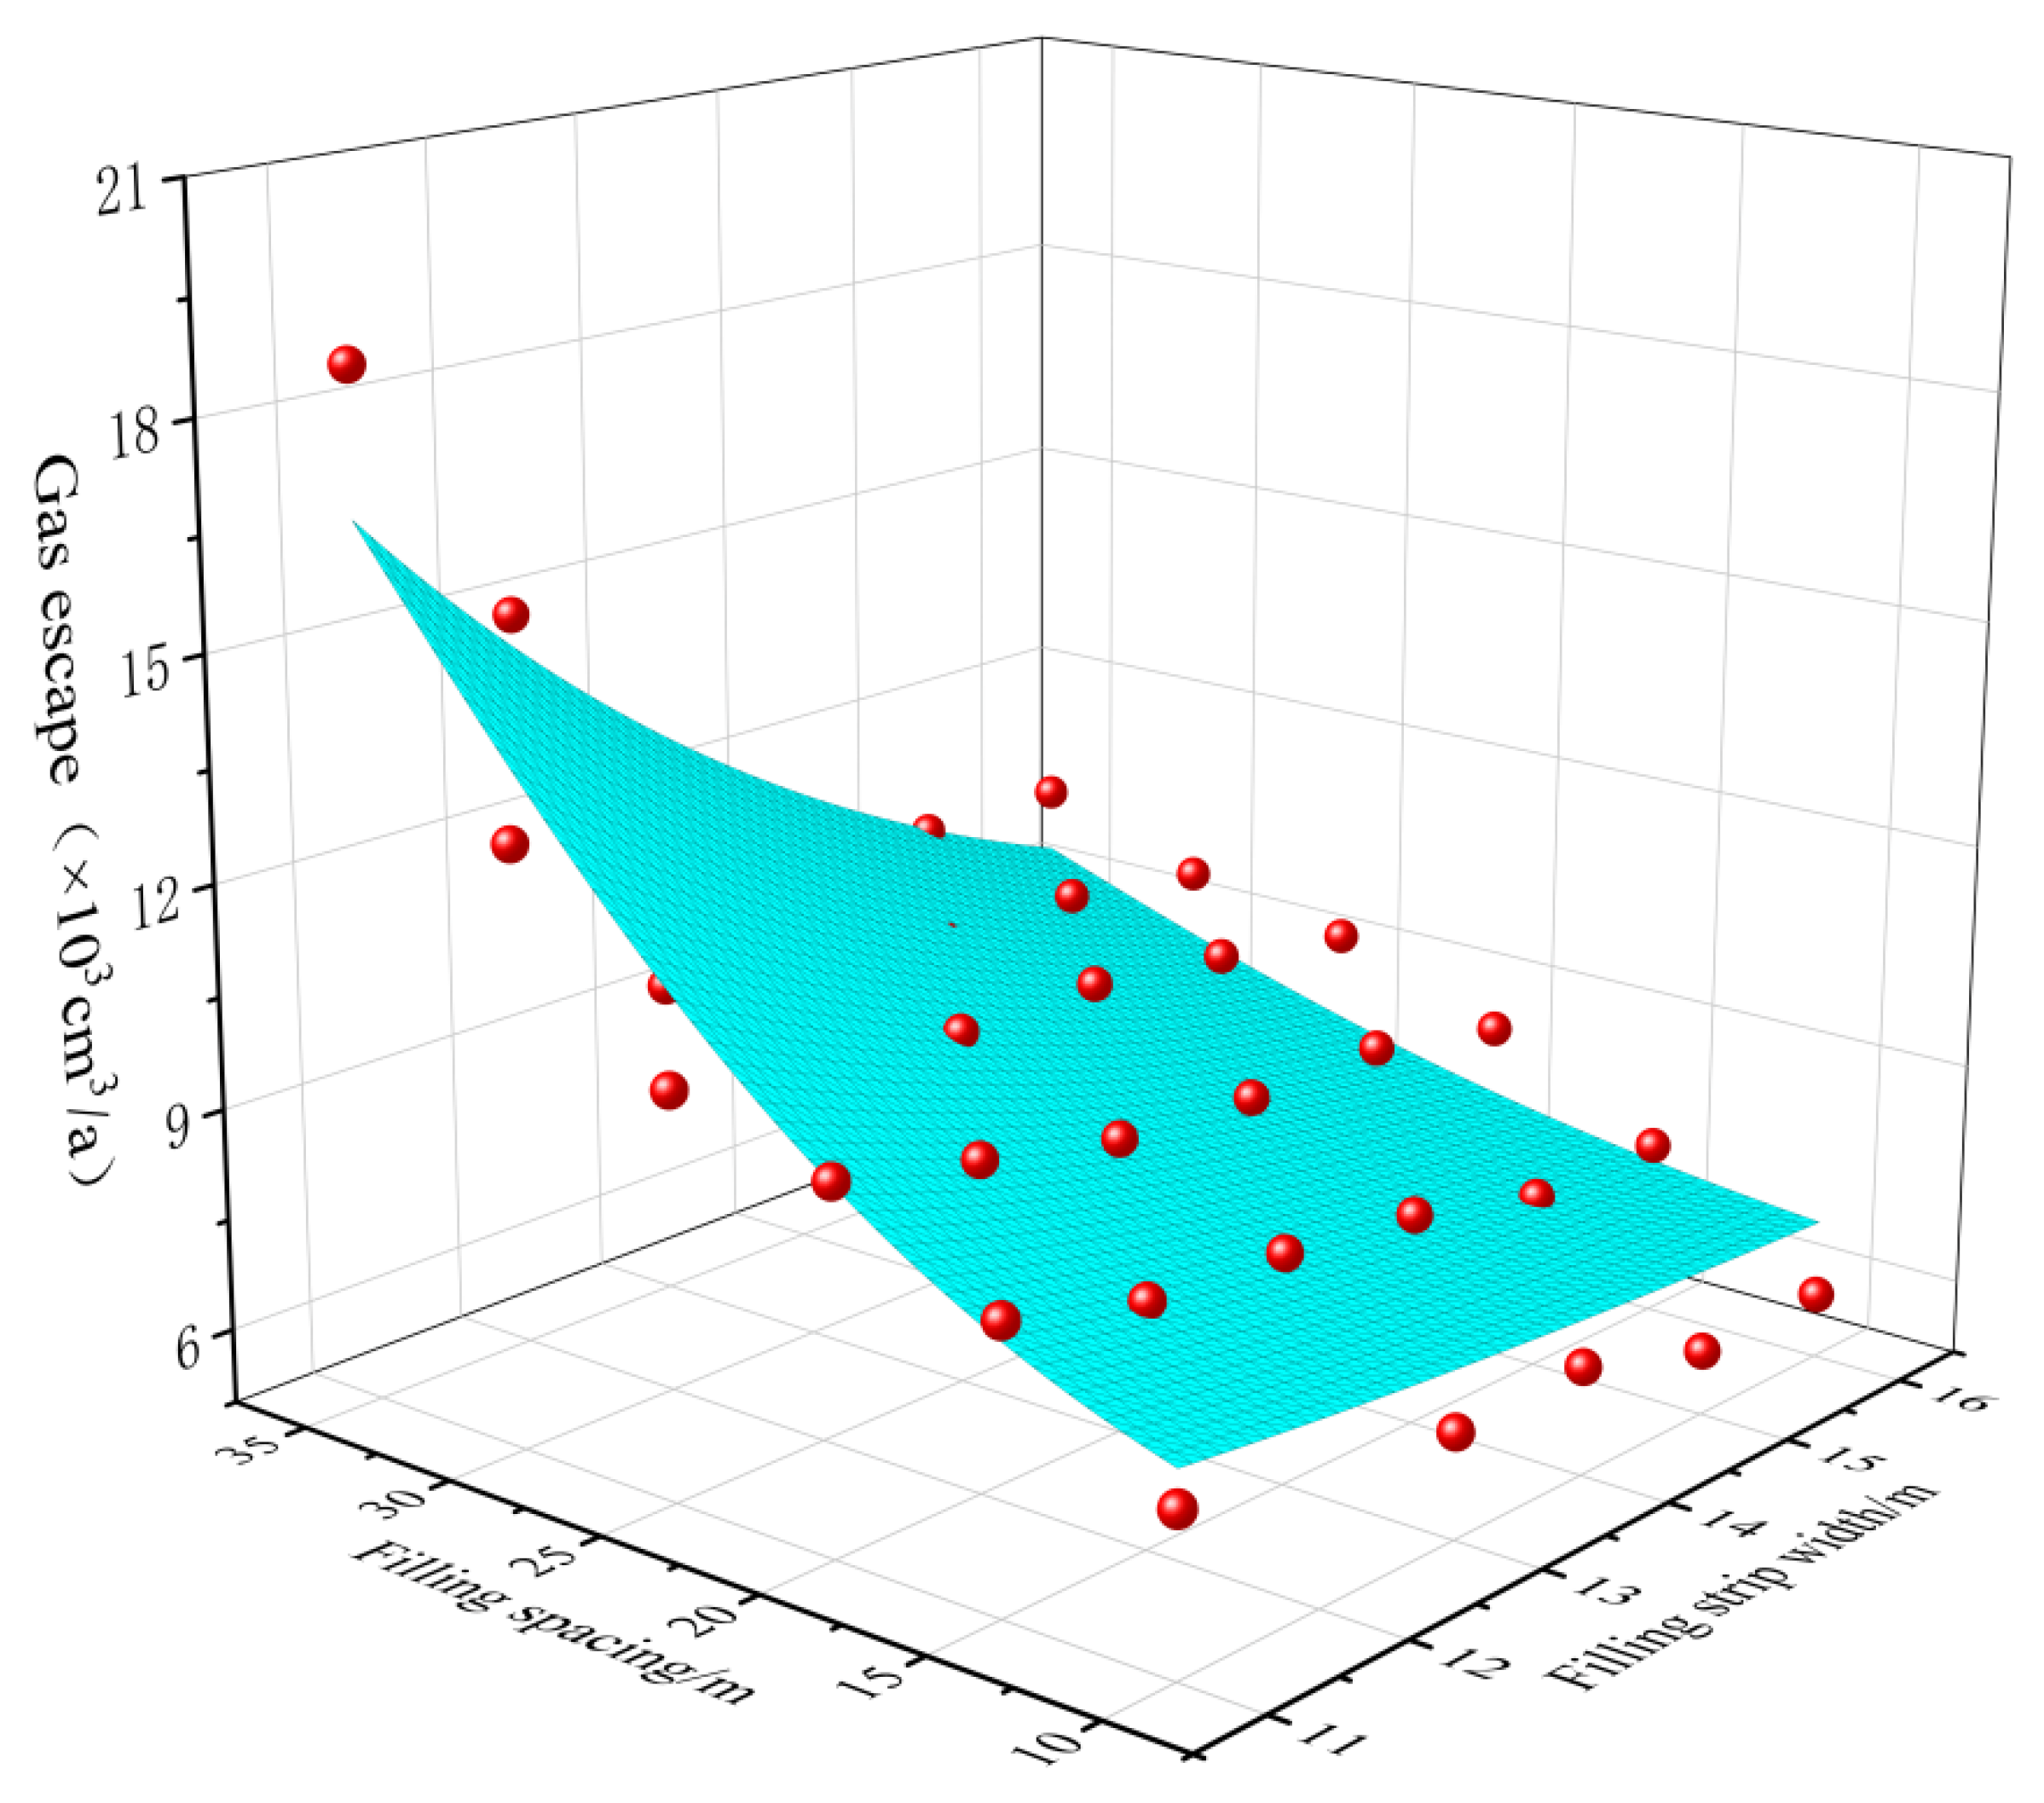
3.4. Evaluation of the Gas Tightness of Overlying Rock Filled with Gray Brick Strips
4. Conclusions
Author Contributions
Funding
Data Availability Statement
Acknowledgments
Conflicts of Interest
References
- Theocharis, A.I.; Zevgolis, I.E.; Roumpos, C.; Koukouzas, N.C. 3D Numerical Analysis for the Valorization Potential of Spoil Heaps by Shallow Foundations. Sustainability 2022, 14, 7363. [Google Scholar] [CrossRef]
- Yang, X.; Yao, W.; Li, P.; Hu, J.; Latifi, H.; Kang, L.; Wang, N.; Zhang, D. Changes of SOC Content in China’s Shendong Coal Mining Area during 1990–2020 Investigated Using Remote Sensing Techniques. Sustainability 2022, 14, 7374. [Google Scholar] [CrossRef]
- Motyka, J.; d’Obyrn, K.; Sracek, O.; Postawa, A.; Źróbek, M. Pit Lakes Affected by a River Contaminated with Brines Originated from the Coal Mining Industry: Evolution of Water Chemistry in the Zakrzówek Horst Area (Krakow, Southern Poland). Energies 2022, 15, 4382. [Google Scholar] [CrossRef]
- Chen, F.; Liu, J.; Zhang, X.; Wang, J.; Jiao, H.; Yu, J. Review on the Art of Roof Contacting in Cemented Waste Backfill Technology in a Metal Mine. Minerals 2022, 12, 721. [Google Scholar] [CrossRef]
- Ajayi, S.A.; Ma, L.; Spearing, A.J.S. Ground Stress Analysis and Automation of Workface in Continuous Mining Continuous Backfill Operation. Minerals 2022, 12, 754. [Google Scholar] [CrossRef]
- Rybak, J.; Khayrutdinov, M.M.; Kuziev, D.A.; Kongar-Syuryun, P.B.; Babyr, N.V. Prediction of the geomechanical state of the rock mass when mining salt deposits with stowing. J. Min. Inst. 2022, 253, 61–70. [Google Scholar] [CrossRef]
- Lim, B.; Alorro, R.D. Technospheric Mining of Mine Wastes: A Review of Applications and Challenges. Sustain. Chem. 2021, 2, 38. [Google Scholar] [CrossRef]
- Jankowski, J.; Spies, B. Impact of longwall mining on surface water–groundwater interaction and changes in chemical composition of creek water. In Proceedings of the XXXV IAH Congress, Lisbon, Portugal, 17–21 September 2007. [Google Scholar]
- Edmonds, C. Five decades of settlement and subsidence. Q. J. Eng. Geol. Hydrogeol. 2018, 51, 403–416. [Google Scholar] [CrossRef]
- Van Der Merwe, J.N. Effects of coal mining on surface topography in South Africa-updates and extensions. J. S. Afr. Inst. Min. 2018, 118, 777–786. [Google Scholar] [CrossRef] [Green Version]
- Isiaka, A.I.; Durrheim, R.J.; Manzi, M.S. High-resolution seismic reflection investigation of subsidence and sinkholes at an abandoned coal mine site in South Africa. Pure Appl. Geophys. 2019, 176, 1531–1548. [Google Scholar] [CrossRef]
- Tiwari, A.; Narayan, A.B.; Dwivedi, R.; Swadeshi, A.; Pasari, S.; Dikshit, O. Geodetic investigation of landslides and land subsidence: Case study of the Bhurkunda coal mines and the Sirobagarh landslide. Surv. Rev. 2018, 52, 134–149. [Google Scholar] [CrossRef]
- Konicek, P.; Soucek, K.; Stas, L.; Singh, R.; Sinha, A. Practices to Control Rock Burst in Deep Coal Mines of Upper Silesian Coal Basin and Their Applicability for Disergarh Seam of Raniganj Coalfield. In Proceedings of the ISRM International Symposium—6th Asian Rock Mechanics Symposium, New Delhi, India, 23–27 October 2010; OnePetro: Richardson, TX, USA, 2010. [Google Scholar]
- Greiving, S.; Gruehn, D.; Reicher, C. The Rhenish Coal-Mining Area—Assessing the Transformational Talents and Challenges of a Region in Fundamental Structural Change. Land 2022, 11, 826. [Google Scholar] [CrossRef]
- Chang, Q.; Chen, J.; Zhou, H.; Bai, J. Implementation of Paste Backfill Mining Technology in Chinese Coal Mines. Sci. World J. 2014, 2014, 821025. [Google Scholar] [CrossRef] [PubMed]
- Yao, Q.; Feng, T.; Liao, Z. Damage characteristics and movement of inclined strata with sublevel filling along the strike in the steep seam. J. China Coal Soc. 2017, 42, 3096–3105. [Google Scholar]
- Ma, D.; Zhang, J.; Duan, H.; Huang, Y.; Li, M.; Sun, Q.; Zhou, N. Reutilization of gangue wastes in underground backfilling mining: Overburden aquifer protection. Chemosphere 2021, 264, 128400. [Google Scholar] [CrossRef]
- Zhang, J.; Li, M.; Taheri, A.; Zhang, W.; Wu, Z.; Song, W. Properties and Application of Backfill Materials in Coal Mines in China. Minerals 2019, 9, 53. [Google Scholar] [CrossRef] [Green Version]
- Qi, C.; Fourie, A. Cemented paste backfill for mineral tailings management: Review and future perspectives. Miner. Eng. 2019, 144, 106025. [Google Scholar] [CrossRef]
- Behera, S.K.; Mishra, D.P.; Singh, P.; Mishra, K.; Mandal, S.K.; Ghosh, C.N.; Kumar, R.; Mandal, P.K. Utilization of mill tailings, fly ash and slag as mine paste backfill material: Review and future perspective. Constr. Build. Mater. 2021, 309, 125120. [Google Scholar] [CrossRef]
- Zhao, Y.; Taheri, A.; Karakus, M.; Chen, Z.; Deng, A. Effects of water content, water type and temperature on the rheological behaviour of slag-cement and fly ash-cement paste backfill. Int. J. Min. Sci. Technol. 2020, 30, 271–278. [Google Scholar] [CrossRef]
- Ercikdi, B.; Cihangir, F.; Kesimal, A.; Deveci, H.; Alp, İ. Utilization of industrial waste products as pozzolanic material in cemented paste backfill of high sulphide mill tailings. J. Hazard. Mater. 2009, 168, 848–856. [Google Scholar] [CrossRef]
- Feng, G.R.; Ren, Y.F.; Zhang, X.Y.; Guo, Y.X.; Kang, L.X. The activating experimental research of fly ash for mining filling material in Tashan Mine. J. China Coal Soc. 2011, 36, 732–737. [Google Scholar]
- Zhou, N.; Ma, H.; Ouyang, S.; Germain, D.; Hou, T. Influential Factors in Transportation and Mechanical Properties of Aeolian Sand-Based Cemented Filling Material. Minerals 2019, 9, 116. [Google Scholar] [CrossRef] [Green Version]
- Peyronnard, O.; Benzaazoua, M. Estimation of the cementitious properties of various industrial by-products for applications requiring low mechanical strength. Resour. Conserv. Recycl. 2011, 56, 22–33. [Google Scholar] [CrossRef]
- Cihangir, F.; Ercikdi, B.; Kesimal, A.; Turan, A.; Deveci, H. Utilisation of alkali-activated blast furnace slag in paste backfill of high-sulphide mill tailings Effect of binder type and dosage. Miner. Eng. 2012, 30, 33–43. [Google Scholar] [CrossRef]
- Deng, X.; Klein, B.; Tong, L.; de Wit, B. Experimental study on the rheological behavior of ultra-fine cemented backfill. Constr. Build. Mater. 2018, 158, 985–994. [Google Scholar] [CrossRef]
- Xu, W.; Cao, P.; Tian, M. Strength Development and Microstructure Evolution of Cemented Tailings Backfill Containing Different Binder Types and Contents. Minerals 2018, 8, 167. [Google Scholar] [CrossRef] [Green Version]
- Wang, X.; Zhang, J.; Li, M.; Gao, F.; Taheri, A.; Huo, B.; Jin, L. Expansion Properties of Cemented Foam Backfill Utilizing Coal Gangue and Fly Ash. Minerals 2022, 12, 763. [Google Scholar] [CrossRef]
- Ermolovich, E.A.; Ivannikov, A.L.; Khayrutdinov, M.M.; Kongar-Syuryun, C.B.; Tyulyaeva, Y.S. Creation of a Nanomodified Backfill Based on the Waste from Enrichment of Water-Soluble Ores. Materials 2022, 15, 3689. [Google Scholar] [CrossRef] [PubMed]
- Bai, X.C.; Duan, Z.H. Development of the Light Quality and High Strength Fly Ash Brick. J. Henan Univ. Nat. Sci. 2009, 39, 5. [Google Scholar]
- Zhang, X.; Lin, J.; Liu, J.; Li, F.; Pang, Z. Investigation of Hydraulic-Mechanical Properties of Paste Backfill Containing Coal Gangue-Fly Ash and Its Application in an Underground Coal Mine. Energies 2017, 10, 1309. [Google Scholar] [CrossRef] [Green Version]
- Zhang, C.; Wang, L.; Yao, Y.; Shi, X.Y. Determination of Concrete Carbonation Depth by Testing the pH Value of Layer-by-layer Grinding Concrete Samples. Mater. Rep. 2022, 36, 7. [Google Scholar]
- Zhang, G.C.; Tao, G.Z.; Meng, X.J.; Li, Y.; Qu, Z.; Xu, R.H.; Yu, S.C.; Chen, M.; Zhou, G.L.; Luan, H.J. Failure law of weak overburden stratum underlying extra-thick alluvium. J. China Coal Soc. 2022. [Google Scholar]
- Li, Y.; Zhao, B.; Yang, J.; Sun, J.; Huang, W.; Li, Z.; Wang, B. Experimental Study on the Influence of Confining Pressure and Bedding Angles on Mechanical Properties in Coal. Minerals 2022, 12, 345. [Google Scholar] [CrossRef]
- Wang, X.; Zhu, W.; Xie, J.; Han, H.; Xu, J.; Tang, Z.; Xu, J. Borehole-Based Monitoring of Mining-Induced Movement in Ultrathick-and-Hard Sandstone Strata of the Luohe Formation. Minerals 2021, 11, 1157. [Google Scholar] [CrossRef]
- Hoek, E.; Brown, E.T. Practical estimates of rock mass strength. Int. J. Rock Mech. Min. Sci. 1997, 34, 1165–1186. [Google Scholar] [CrossRef]
- Wang, S.M.; Shen, Y.J.; Sun, Q.; Liu, L.; Shi, Q.M.; Zhu, M.B.; Zhang, B.; Cui, S.D. Underground CO2 storage and technical problems in coal mining area under the “dual carbon” target. J. China Coal Soc. 2022, 47, 45–60. [Google Scholar]
- Liu, L.; Wang, S.M.; Zhu, M.B.; Zhang, H.; Hou, D.Z.; Xun, C.; Zhang, X.Y.; Wang, X.L.; Wang, M. CO2 storage-cavern construction and storage method based on functional backfill. J. China Coal Soc. 2022, 47, 1072–1086. [Google Scholar]


| Specimen Number | Curing Age | Curing Methods |
|---|---|---|
| I-A-1, I-A-2, I-A-3 | 4 days | After 12 h resting, the specimens were demolded and cured in a humid and ventilated natural environment. |
| I-B-1, I-B-2, I-B-3 | 8 days | |
| I-C-1, I-C-2, I-C-3 | 12 days | |
| I-D-1, I-D-2, I-D-3 | 16 days | |
| II-A-1, II-A-2, II-A-3 | 4 days | After 12 h resting, the specimens were placed directly on the inner surface of the autoclave equipment without demolding. After 5 h of autoclave curing in an environment of 0.165 Mpa and 130 °C, the specimens were taken out and then demolded in a humid and ventilated natural environment for curing. |
| II-B-1, II-B-2, II-B-3 | 8 days | |
| II-C-1, II-C-2, II-C-3 | 12 days | |
| II-D-1, II-D-2, II-D-3 | 16 days | |
| III-A-1, III-A-2, III-A-3 | 4 days | After 12 h resting, the specimens were demolded and cured in drying dishes with CO2 concentration of 0.25 mol/L and pressure of 718.98 Pa. |
| III-B-1, III-B-2, III-B-3 | 8 days | |
| III-C-1, III-C-2, III-C-3 | 12 days | |
| III-D-1, III-D-2, III-D-3 | 16 days | |
| IV-A-1, IV-A-2, IV-A-3 | 4 days | After resting for 12 h, the specimens were placed cured in the autoclave equipment for 5 h, and then the specimens were taken out and demolded in drying dishes with CO2 concentration of 0.25 mol/L and pressure of 718.98 Pa for curing. |
| IV-B-1, IV-B-2, IV-B-3 | 8 days | |
| IV-C-1, IV-C-2, IV-C-3 | 12 days | |
| IV-D-1, IV-D-2, IV-D-3 | 16 days |
| Stratum | Density Kg/m3 | Bulk Modulus /GPa | Shear Modulus /GPa | Friction Angle /Degree | Cohesion /MPa | Tensile Strength /MPa |
|---|---|---|---|---|---|---|
| Loose overburden | 2200 | 0.05 | 0.03 | 25 | 0.7 | 0 |
| Weakly cemented layer | 2580 | 1.03 | 7.5 | 44 | 3.5 | 2 |
| Bedrock layer | 2700 | 2.52 | 1.6 | 48 | 6.97 | 5.4 |
| Roof | 2700 | 2.52 | 1.6 | 48 | 6.97 | 5.4 |
| Coal seam | 1470 | 7.9 | 5.5 | 37 | 3.02 | 3 |
| Floor | 1700 | 5.15 | 4 | 36 | 2.21 | 2.26 |
| Simulation Variables | Expected Simulation Results | |
|---|---|---|
| Different filling spacing | Different filling strip width | Surface subsidence and height of crack propagation |
| 10 m, 15 m, 20 m, 25 m, 30 m, 35 m | 11 m, 12 m, 13 m, 14 m, 15 m, 16 m | |
| Width of 10 m | Width of 15 m | |
| Space of 11 m | 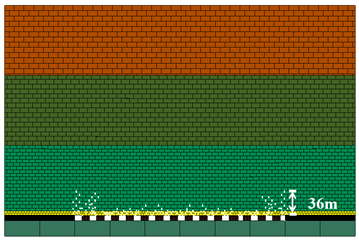 | 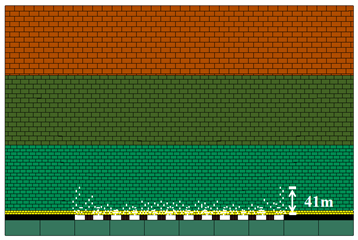 |
| Space of 12 m | 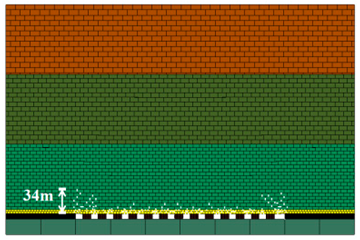 | 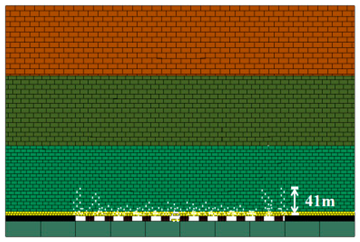 |
| Space of 13 m | 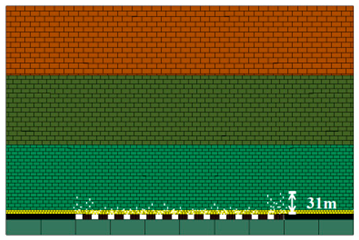 | 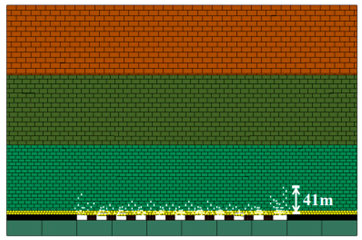 |
| Space of 14 m | 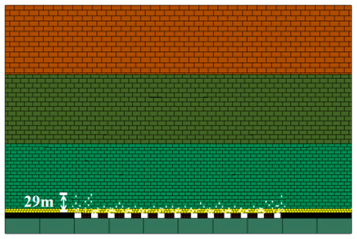 |  |
| Space of 15 m | 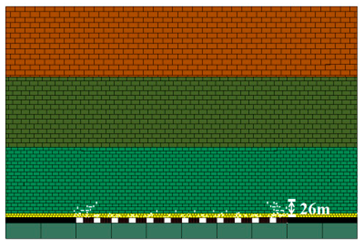 | 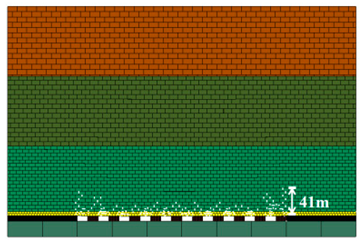 |
| Space of 16 m |  | 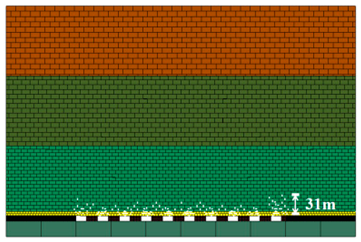 |
| Width of 20 m | Width of 25 m | |
| Space of 11 m | 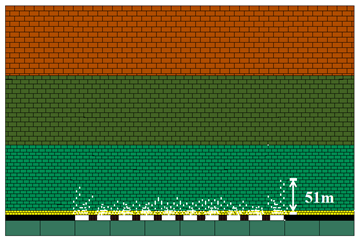 |  |
| Space of 12 m | 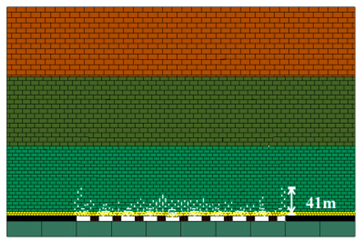 | 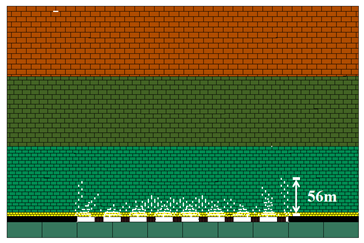 |
| Space of 13 m |  | 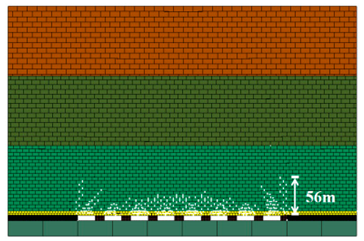 |
| Space of 14 m |  |  |
| Space of 15 m | 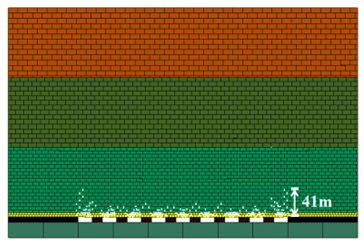 | 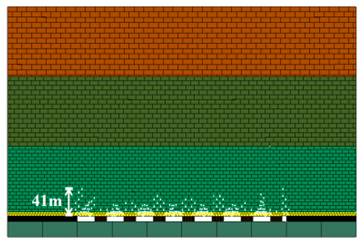 |
| Space of 16 m | 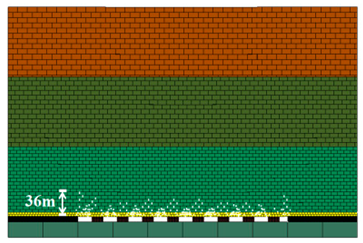 |  |
Publisher’s Note: MDPI stays neutral with regard to jurisdictional claims in published maps and institutional affiliations. |
© 2022 by the authors. Licensee MDPI, Basel, Switzerland. This article is an open access article distributed under the terms and conditions of the Creative Commons Attribution (CC BY) license (https://creativecommons.org/licenses/by/4.0/).
Share and Cite
Zhang, Z.; Liu, H.; Su, H.; Zeng, Q. Green Mining Takes Place at the Power Plant. Minerals 2022, 12, 839. https://doi.org/10.3390/min12070839
Zhang Z, Liu H, Su H, Zeng Q. Green Mining Takes Place at the Power Plant. Minerals. 2022; 12(7):839. https://doi.org/10.3390/min12070839
Chicago/Turabian StyleZhang, Zhiyi, Hao Liu, Hui Su, and Qiang Zeng. 2022. "Green Mining Takes Place at the Power Plant" Minerals 12, no. 7: 839. https://doi.org/10.3390/min12070839
APA StyleZhang, Z., Liu, H., Su, H., & Zeng, Q. (2022). Green Mining Takes Place at the Power Plant. Minerals, 12(7), 839. https://doi.org/10.3390/min12070839