1. Introduction
Coal workers’ pneumoconiosis and other mine dust lung diseases have seen a resurgence both in Australia and the United States. In Australia, coal workers pneumoconiosis (CWP) was re-identified more recently in 2015, and since then 267 mine dust lung disease cases have been reported [
1,
2]. The US has had two decades of increases in both the prevalence and severity of disease [
3]. There have been high levels of regional variability, with miners in central Appalachia being disproportionately affected [
3,
4,
5,
6,
7,
8]. This has prompted new research to characterize dust exposures in both the US and Australian underground coal mines [
9,
10,
11,
12].
The history of exposure monitoring for and the setting of exposure standards for respirable coal dust and silica in coal mines has been detailed in a previous paper [
13]. Characterization work was previously undertaken in the 1980′s but was limited by the technology available at the time [
14,
15]. Particle size distributions could only be calculated for the overall sample. The mineralogy was only analyzed for a select few minerals already known to be present. Today’s technology allows for information to be gathered on individual particles. This allows for particle size distributions to be calculated for each mineralogy and every mineral present to be identified.
Coal contains several minerals as a result of depositional conditions within peat-mire and/or precipitation of porewaters or penetrated fluids during post-coalification [
16]. Therefore, coal dust contains a complex mixture of mineralogical classes from various sources within the mines [
17]. Previous studies have used scanning electron microscopy with energy dispersive X-ray (SEM-EDX) to characterize mineralogy and size distributions of respirable coal mine dust, especially in the USA [
9,
10,
16,
17] and Australia [
12], and well as other countries [
18,
19,
20,
21]. This work has demonstrated that there can be other sources of respirable dust within a mine in addition to the coal seam and an understanding of the mineralogical components, including the silica is needed. The dust characterization present in underground coal mines should be quantified as the dust characteristics can vary widely between and even within mines, which has implications for the health hazards of that dust. It has already been demonstrated that the size of the dust may affect the health hazard [
22].
Following on from this work, characterization analysis was conducted on the FEI Quanta 600 Mk2 Minerals Liberation Analyser (MLA) (Hillsboro, OR, USA), another type of scanning electron microscope (SEM) energy dispersive spectra (EDS) X-ray mineral identification. MLA analysis is typically performed on samples encased in a block of epoxy resin. This work analyses the particles collected on a filter from the ambient air using respirable cyclone elutriators. This paper aims to show the validity of the MLA for analyzing airborne particulate samples taken of the respirable fraction of dust from underground coal mines in Australia.
2. Materials and Methods
Respirable dust samples were collected from ambient air in three Australian underground coal mines in the two major coal mining states of Queensland and New South Wales. All mines sampled are producing metallurgical grade coal. These mines all operate longwall faces and used miner bolter machines. In Australia, separate mining and bolting units are generally only used for bord and pillar mining, also known as room and pillar in the US. No further information can be given about the mine locations due to their request for anonymity. The collection of the ambient air samples underground using respirable cyclone elutriators generally followed the procedure and protocols used in recent sampling efforts in US coal mines and the first round of Australian samples analyzed in the US by SEM-EDX [
9,
10,
12,
16,
17].
A total of 28 samples were collected from 12 locations over three mine sites and seven testing days, as shown in
Table 1. These are labeled mines 6–8 as the Mine 1–5 samples were analyzed in the previous paper using the Virginia Tech Methodology [
12]. The Mine 8 samples were taken in quadruplicate, while singular samples were taken for Mines 6 and 7. This was done because of timelines and personnel allowed to visit the mines due to the pandemic. Some samples could not be analyzed due to overloading and for several samples only mineralogy could be obtained as the loading resulted in a skewed particle size distribution (PSD). Mineralogy is available for 17 of the 28 samples, while reliable PSD data is available for 11 samples.
Samples were taken in a variety of locations in the underground mines which are listed in
Table 1. These included on the longwall, around the continuous miners, on the shuttle car, and during secondary recovery activities. On the longwall, the sampling locations included the area where operators are normally present just by the maingate corner of the longwall as well as around the midface of the longwall. The shuttle car carries coal from the continuous miner to a grizzly which feeds onto the belt line that takes it out of the mine, which is normally within a few hundred meters of the continuous miner.
Samples were collected with Casella Higgins-Dewell type plastic respirable cyclone elutriators (SKU 116000B) on Zefon 37 mm polycarbonate filters with 0.4 micron pore size, both ordered through AirMet Scientific (Newstead, QLD, Australia). Cassettes and cyclones were packed in the laboratory of the Sustainable Minerals Institute at The University of Queensland (UQ). These were either flown to the mine site for sampling in checked baggage or mailed to the person collecting the samples. After collection, filters were removed from the Casella cassettes inside the cyclone elutriators and placed in 37 mm polystyrene cassettes for return transport in carry-on luggage or mailed back in the Casella cassettes. Once received in the mail the filters were removed from the Cassella cassettes that the sample was collected in and were then placed into the 37 mm polystyrene cassettes for storage.
The sampling in Queensland mines used SKC AirChek 3000 pumps (Eighty Four, Pa, USA) while Casella Apex 2 pumps (Kemptson, Bedford, United Kingdom) were used in the New South Wales Mines. Pumps used in Queensland were field calibrated with an SKC Field rotameter (within calibration). All pumps were operated at the required flow rate of 2.2 L/min in line with the requirements of Australian Standard 2985 [
23]. Photos of the sampling frame setup and an example of the frame mounted on a continuous miner during sampling can be found in the previous paper [
12]. The sampling frames were mounted as close as practicable to what would be the worker breathing height during the sampling (approximately 1.5 m height).
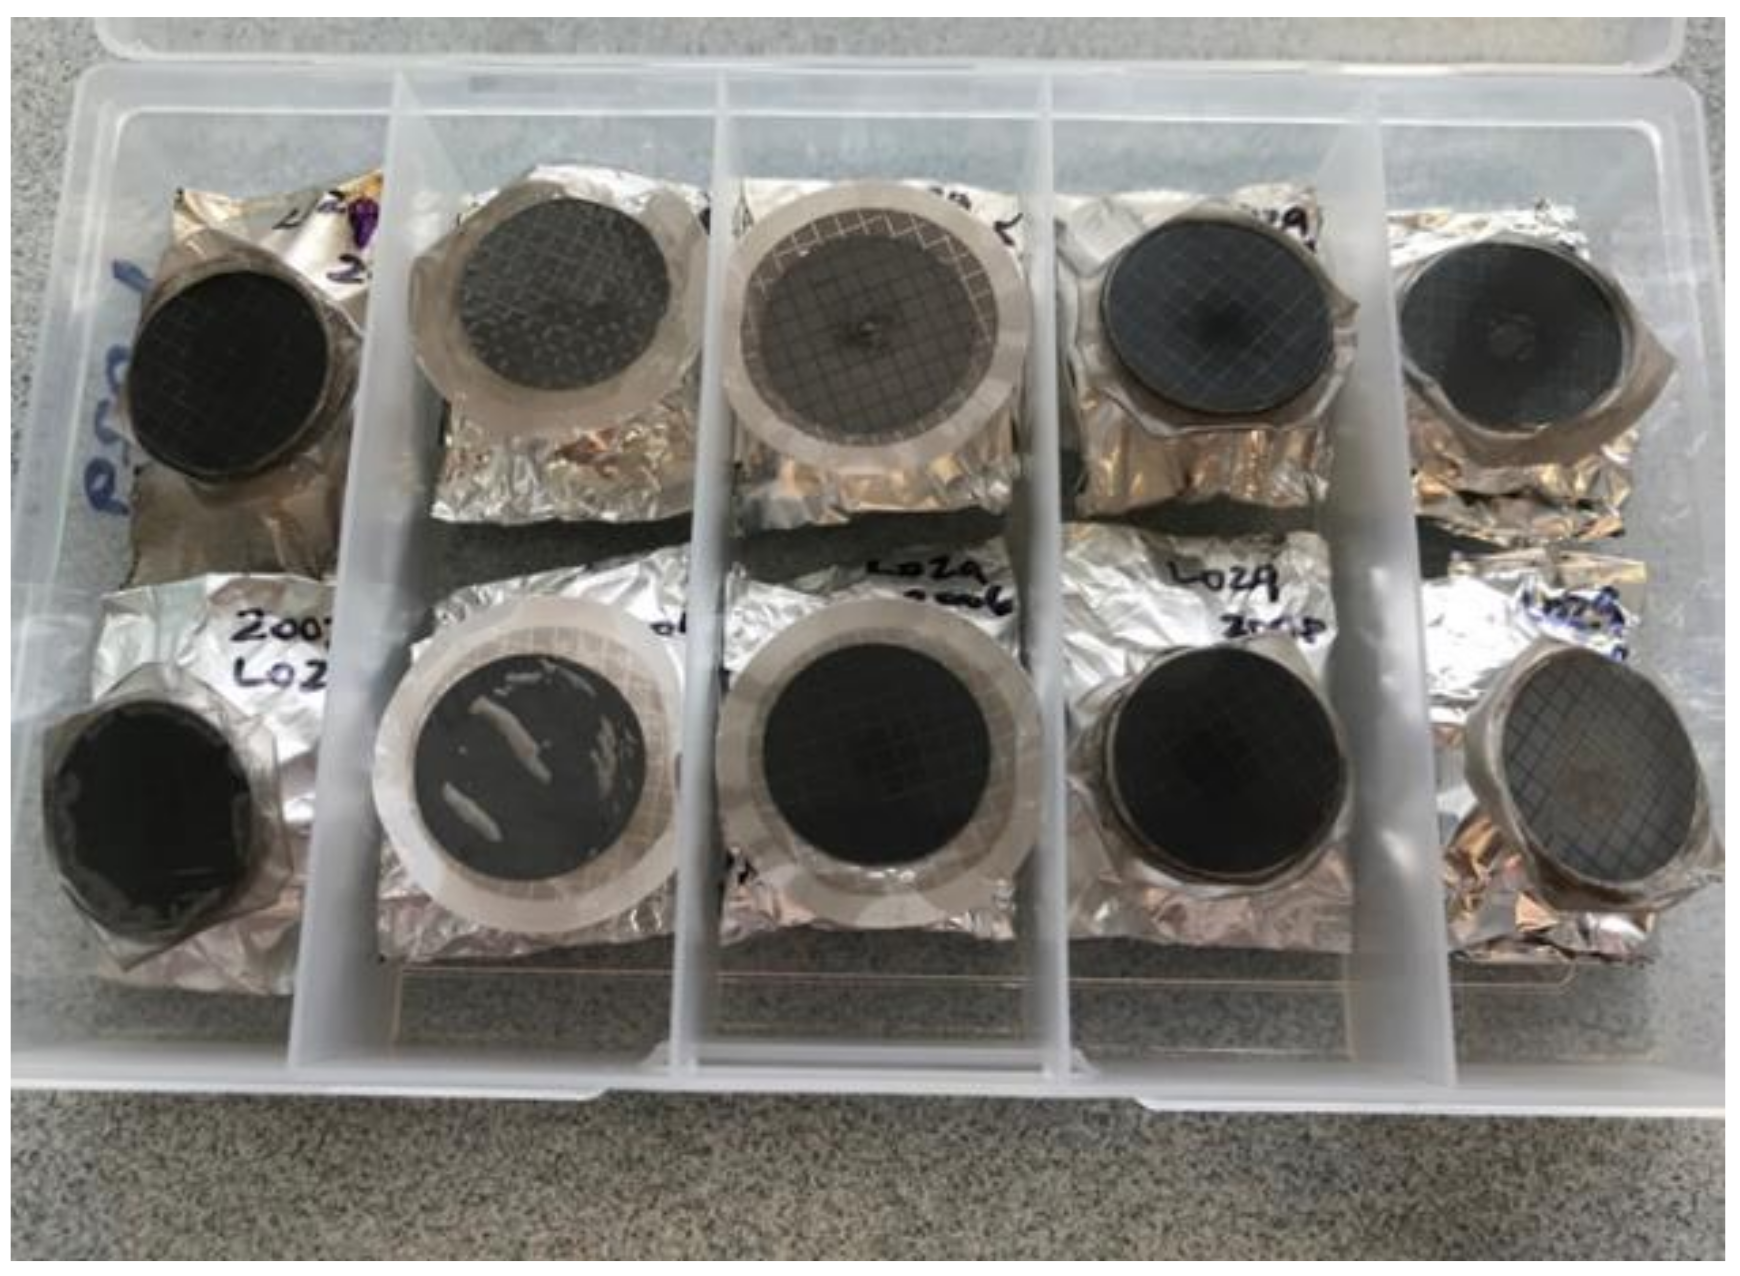
All filters were delivered to the laboratory at the Julius Kruttschnitt Mineral Research Centre (JKMRC) for analysis using the Mineral Liberation Analyser. These filters were mounted to aluminum stubs, and a carbon coating was applied, as shown in
Figure 1. Six regions were analyzed across the filter. An average of 550,000 particles were analyzed per filter with a total of over 8.5 million particles identified on the 17 samples. An FEI Quanta 650 MLA equipped with a Bruker Silicon Drift Detector was used to measure the samples using the XBSE measurement mode [
24]. The system was operated with a 13 mm working distance and an accelerating voltage of 25 kV at a resolution of 0.28 µm per pixel.
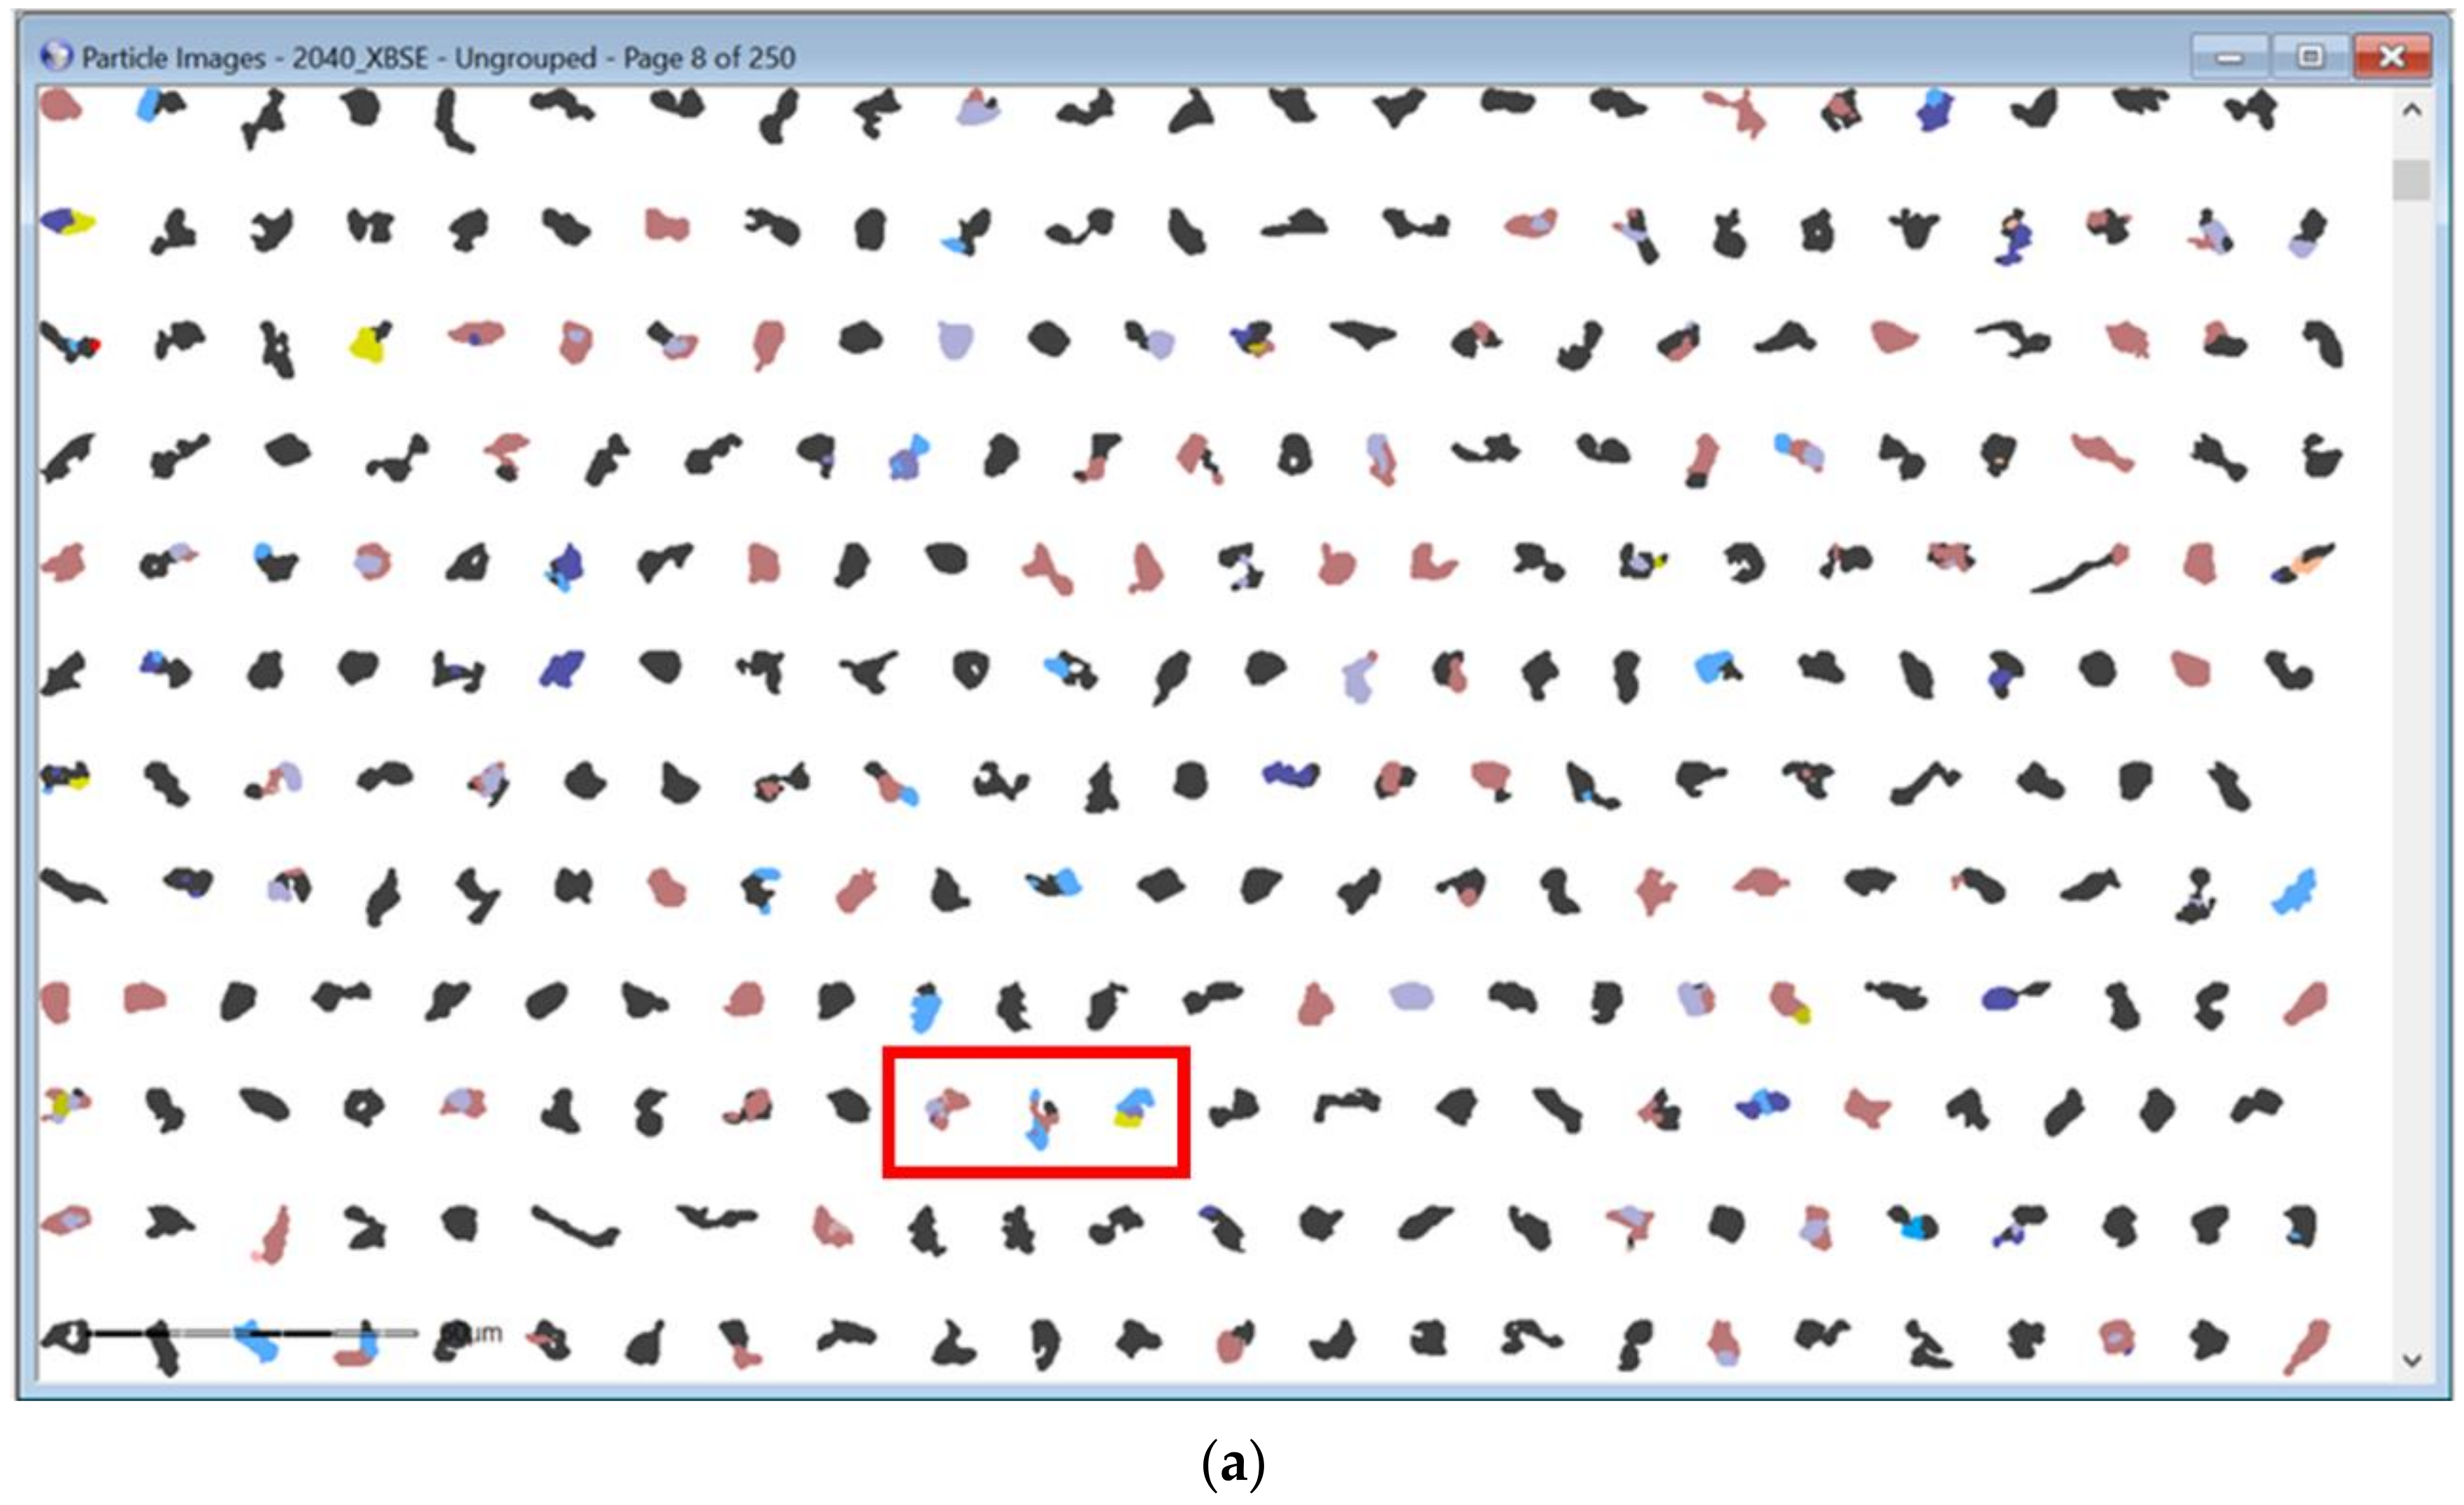
There were 25 different minerals included in the mineral reference library plus an unknown and low counts category. Between 142,000 and 758,000 particles were analyzed per filter. Each of these particles were classified by matching the characteristic X-ray collected during MLA measurement to the mineral reference library. The elemental composition of the minerals included in the mineral reference library is shown in
Table 2, these generally use the stoichiometric composition and standard mineral formulae. The mineral list contains both minerals and mineral groups as well as elemental carbon and the manmade compound, stainless steel. The MLA can identify composite particles (i.e., those particles that contain more than one mineral) and images of all the classified particles are available in the MLA software, Dataview 3.1.4.686. The particle size distributions by minerals that were calculated for this paper are filtered for particles that contain more than 50% of the mineral in question. It is possible that a few particles are excluded from the particle size distributions (PSDs) by mineral because there was no single mineral that accounted for over 50% of the particle. All particles are included in the overall particle size distributions.
Each filter for characterization analysis was given a unique filter ID and location data is added to make up its sample code. The sample code starts with the mine number, which is 6, 7, or 8 in this case, the two letters for the location code and the last two digits of the filter ID. The location coding includes longwall maingate (MG), longwall mid-face (MF), continuous miner (CM), shuttle car (SC), and secondary recovery (SR) as shown in
Table 1. For example, the code for the first sample is 6SR_01, which is from Mine 6, from secondary recovery activities, and is filter number 2001.
3. Results
Similar to the characterization performed previously on samples from Mines 1–4 [
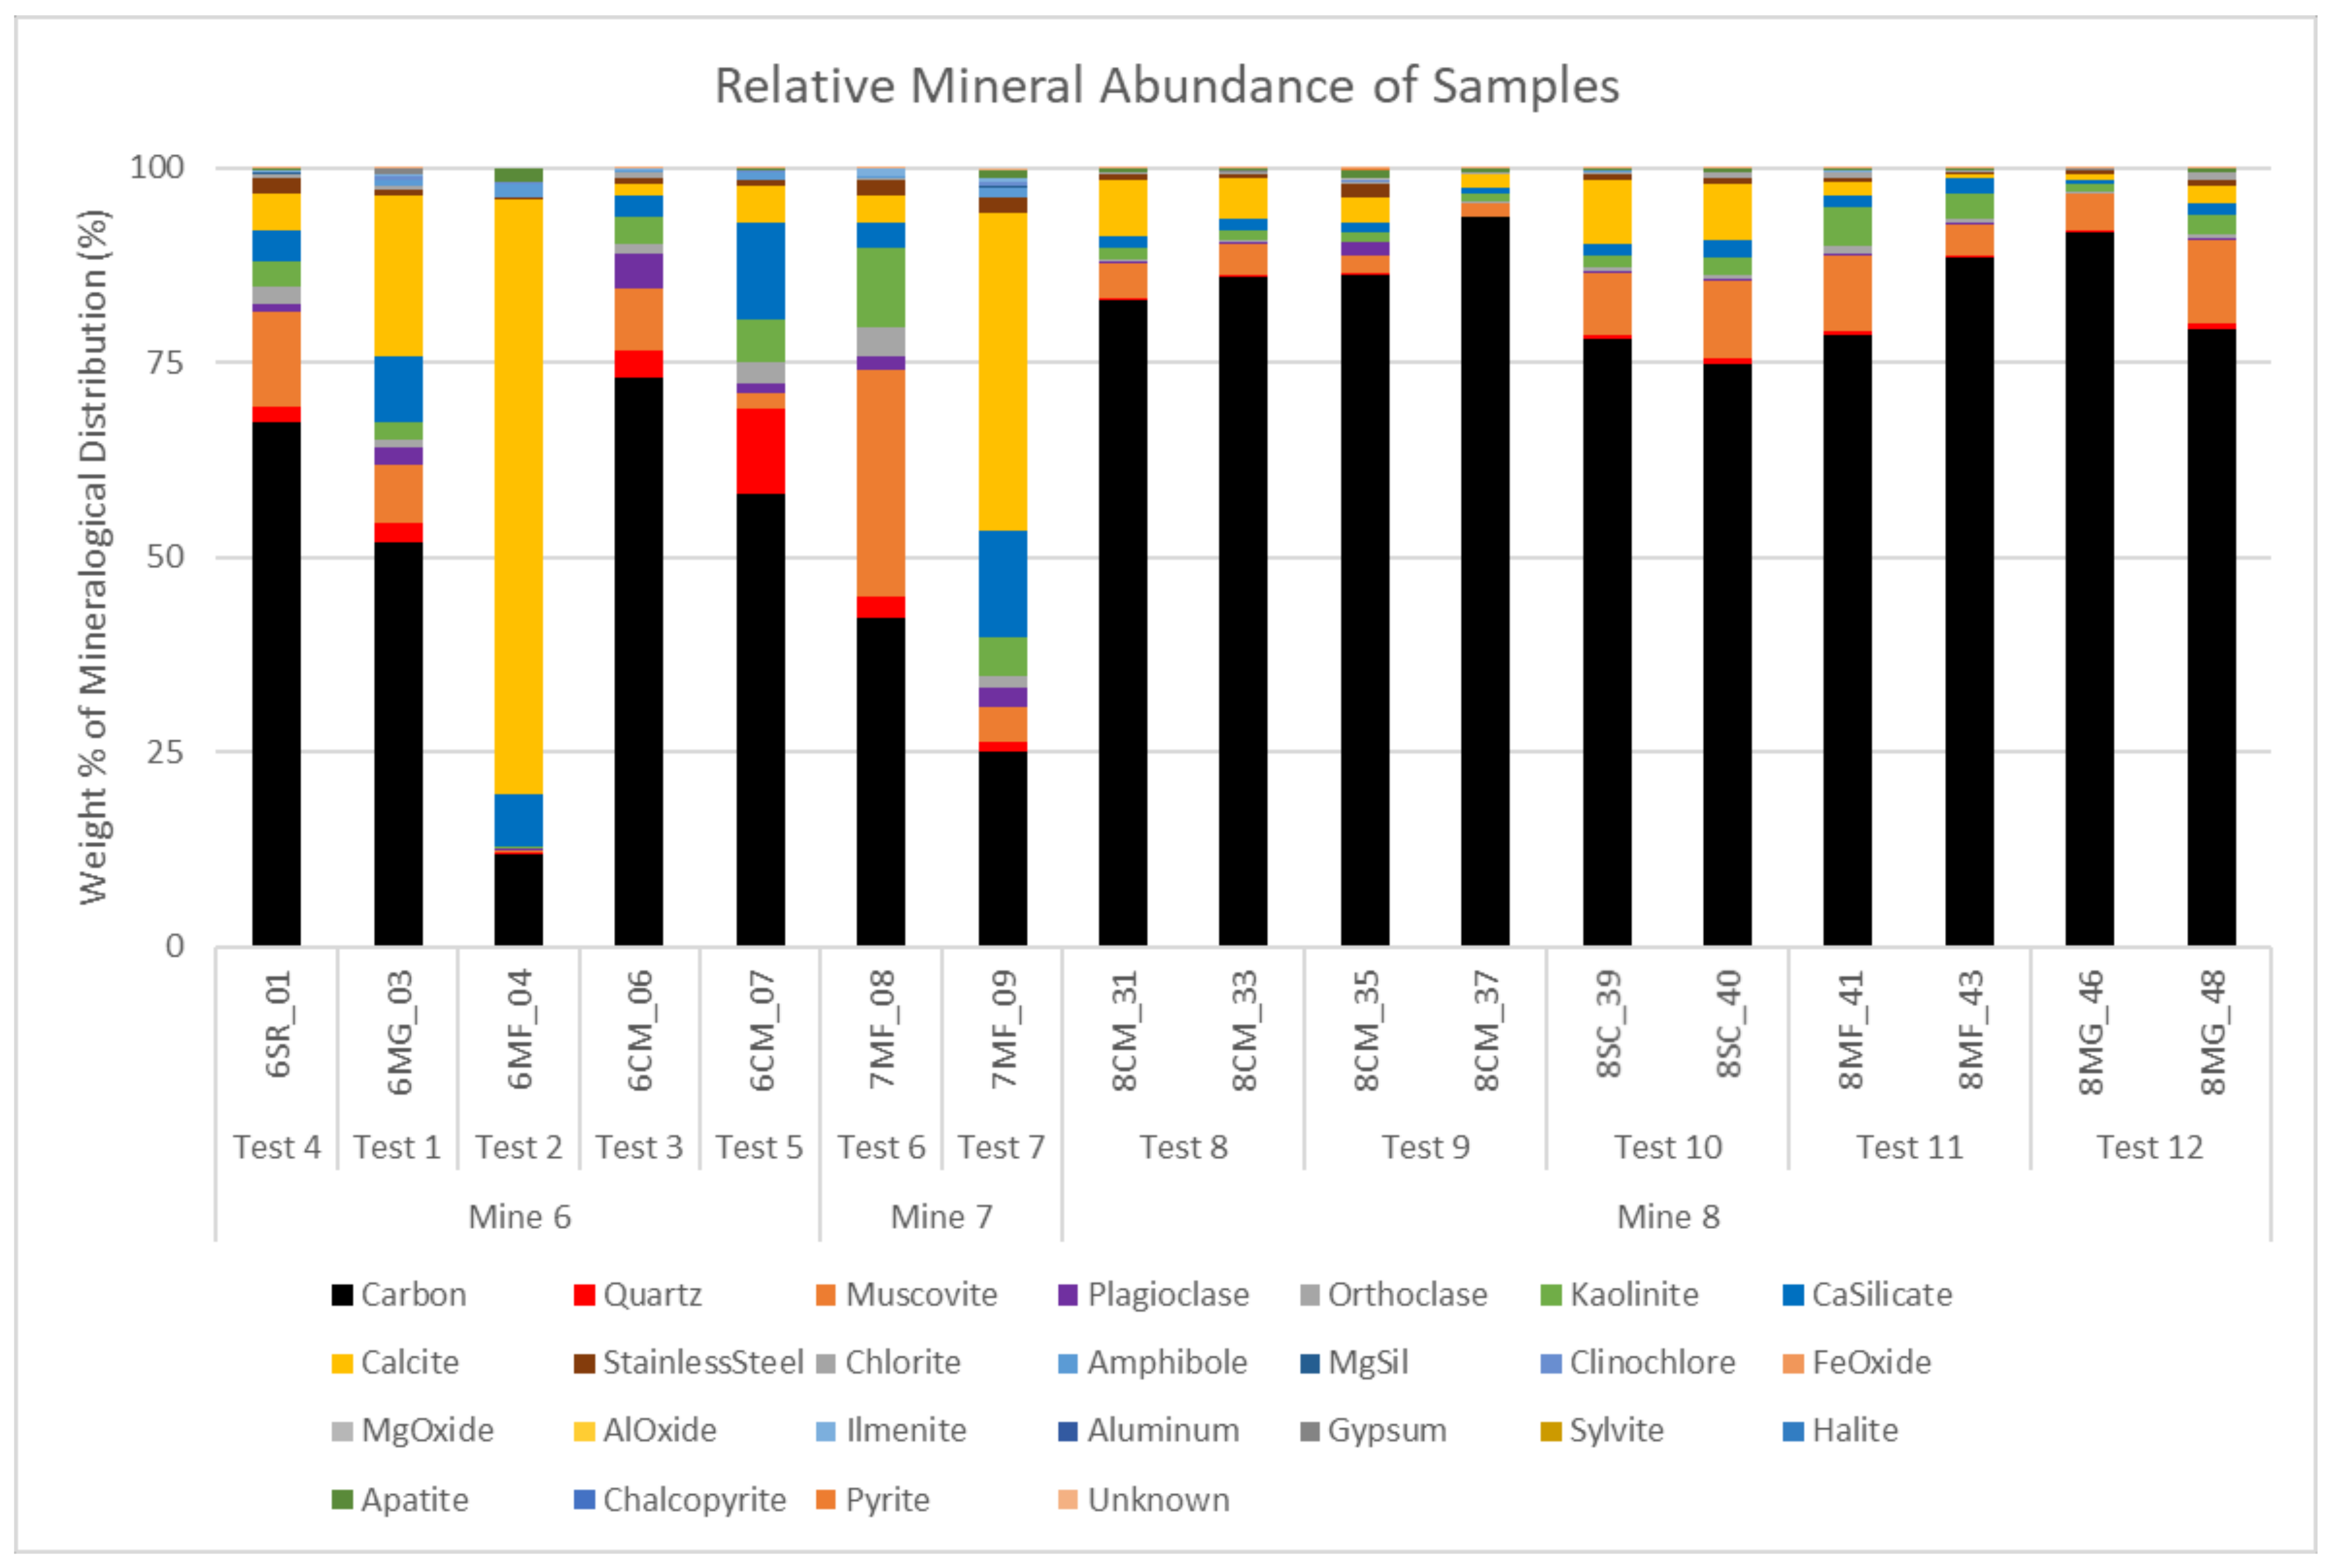
12], the relative mineral abundance for Mines 6–8 was found to differ between mines as well as at various locations within a mine
Figure 2 shows the mineralogy classes for the samples from Mines 6–8 that were analyzed in this phase of the study.
The samples from Mine 8 contain a significant amount of carbon, ranging from 75–92%. Mines 6 and 7 have a much lower and more variable percentage of carbon material. The carbon identified in these samples consists mainly of coal and diesel particulate matter (DPM). It is not possible to differentiate between coal and DPM with the MLA as it is only identifying the presence of carbon, however, these particles can be differentiated optically, due to the DPM being agglomerated chains of nanosized particles. There are large proportions of calcite in the midface samples in Mine 6 and one of the Mine 7 midface samples. The two longwall midface samples from Mine 7 were taken on different days and reflect the changes in the mineralogy over the time period. The two continuous miner samples in Mine 6 were also taken on different days and show variability in mineralogy. There is good agreement between the paired samples taken in Mine 8. The quartz content is shown in red. Mine 8 has very little quartz content while Mines 6 and 7 show a slightly higher percentage of quartz.
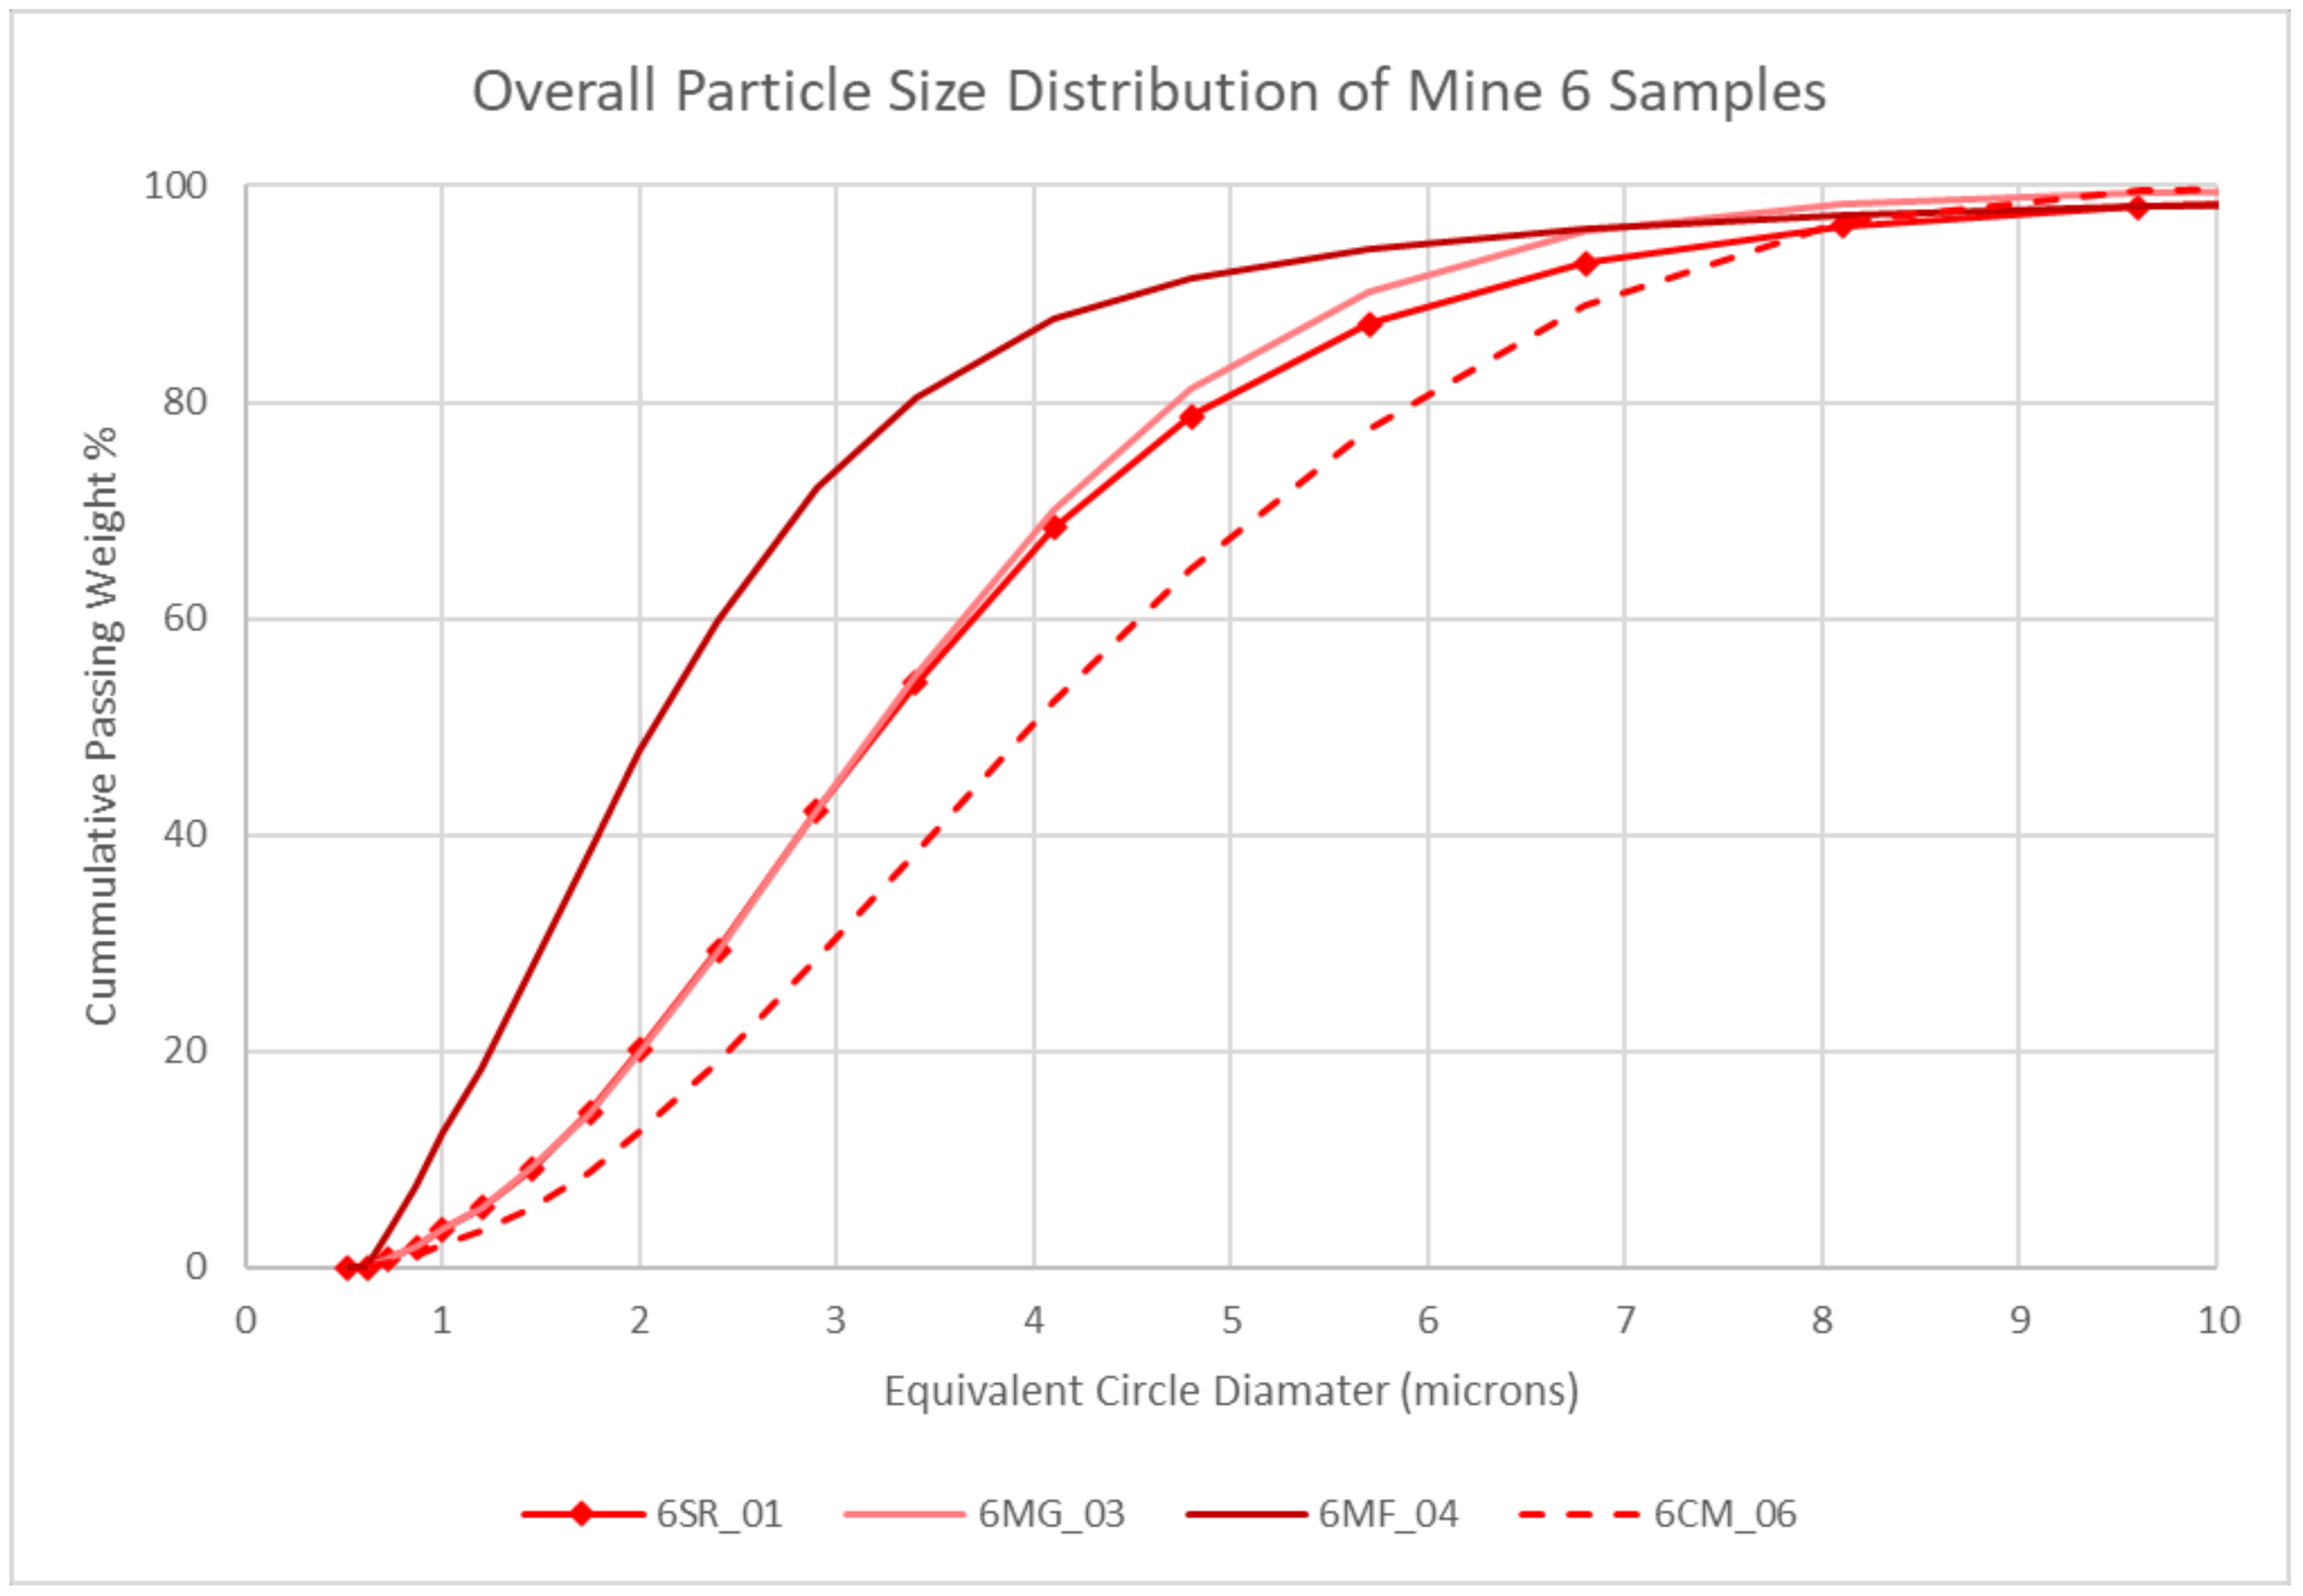
Figure 3 shows the overall particle size distribution of the Mine 6 samples with the equivalent circle diameter in microns plotted against the cumulative passing weight percentage calculated by the MLA. There is a much wider spread in the overall particle size distribution for Mine 6. The coarsest PSD is that of the continuous miner (CM) sample, represented by the dashed line. There was slight overloading on this filter where a small number of overlapping particles were being interpreted by the MLA as larger particles, so sample 6CM_06 has been filtered to remove the particles greater than 13 microns. The maingate samples have a coarser PSD than the midface sample. Both of these trends are consistent with the general findings of relative PSD in Mines 1–4 in the previous paper [
12]. However, the PSDs are not directly comparable between papers in the current format as Mines 1–4 are based on the cumulative percentage of particles by count and this paper uses cumulative passing weight percentage. The particle size distributions for Mine 7 are not shown due to the amount of overloading on some of the filters.
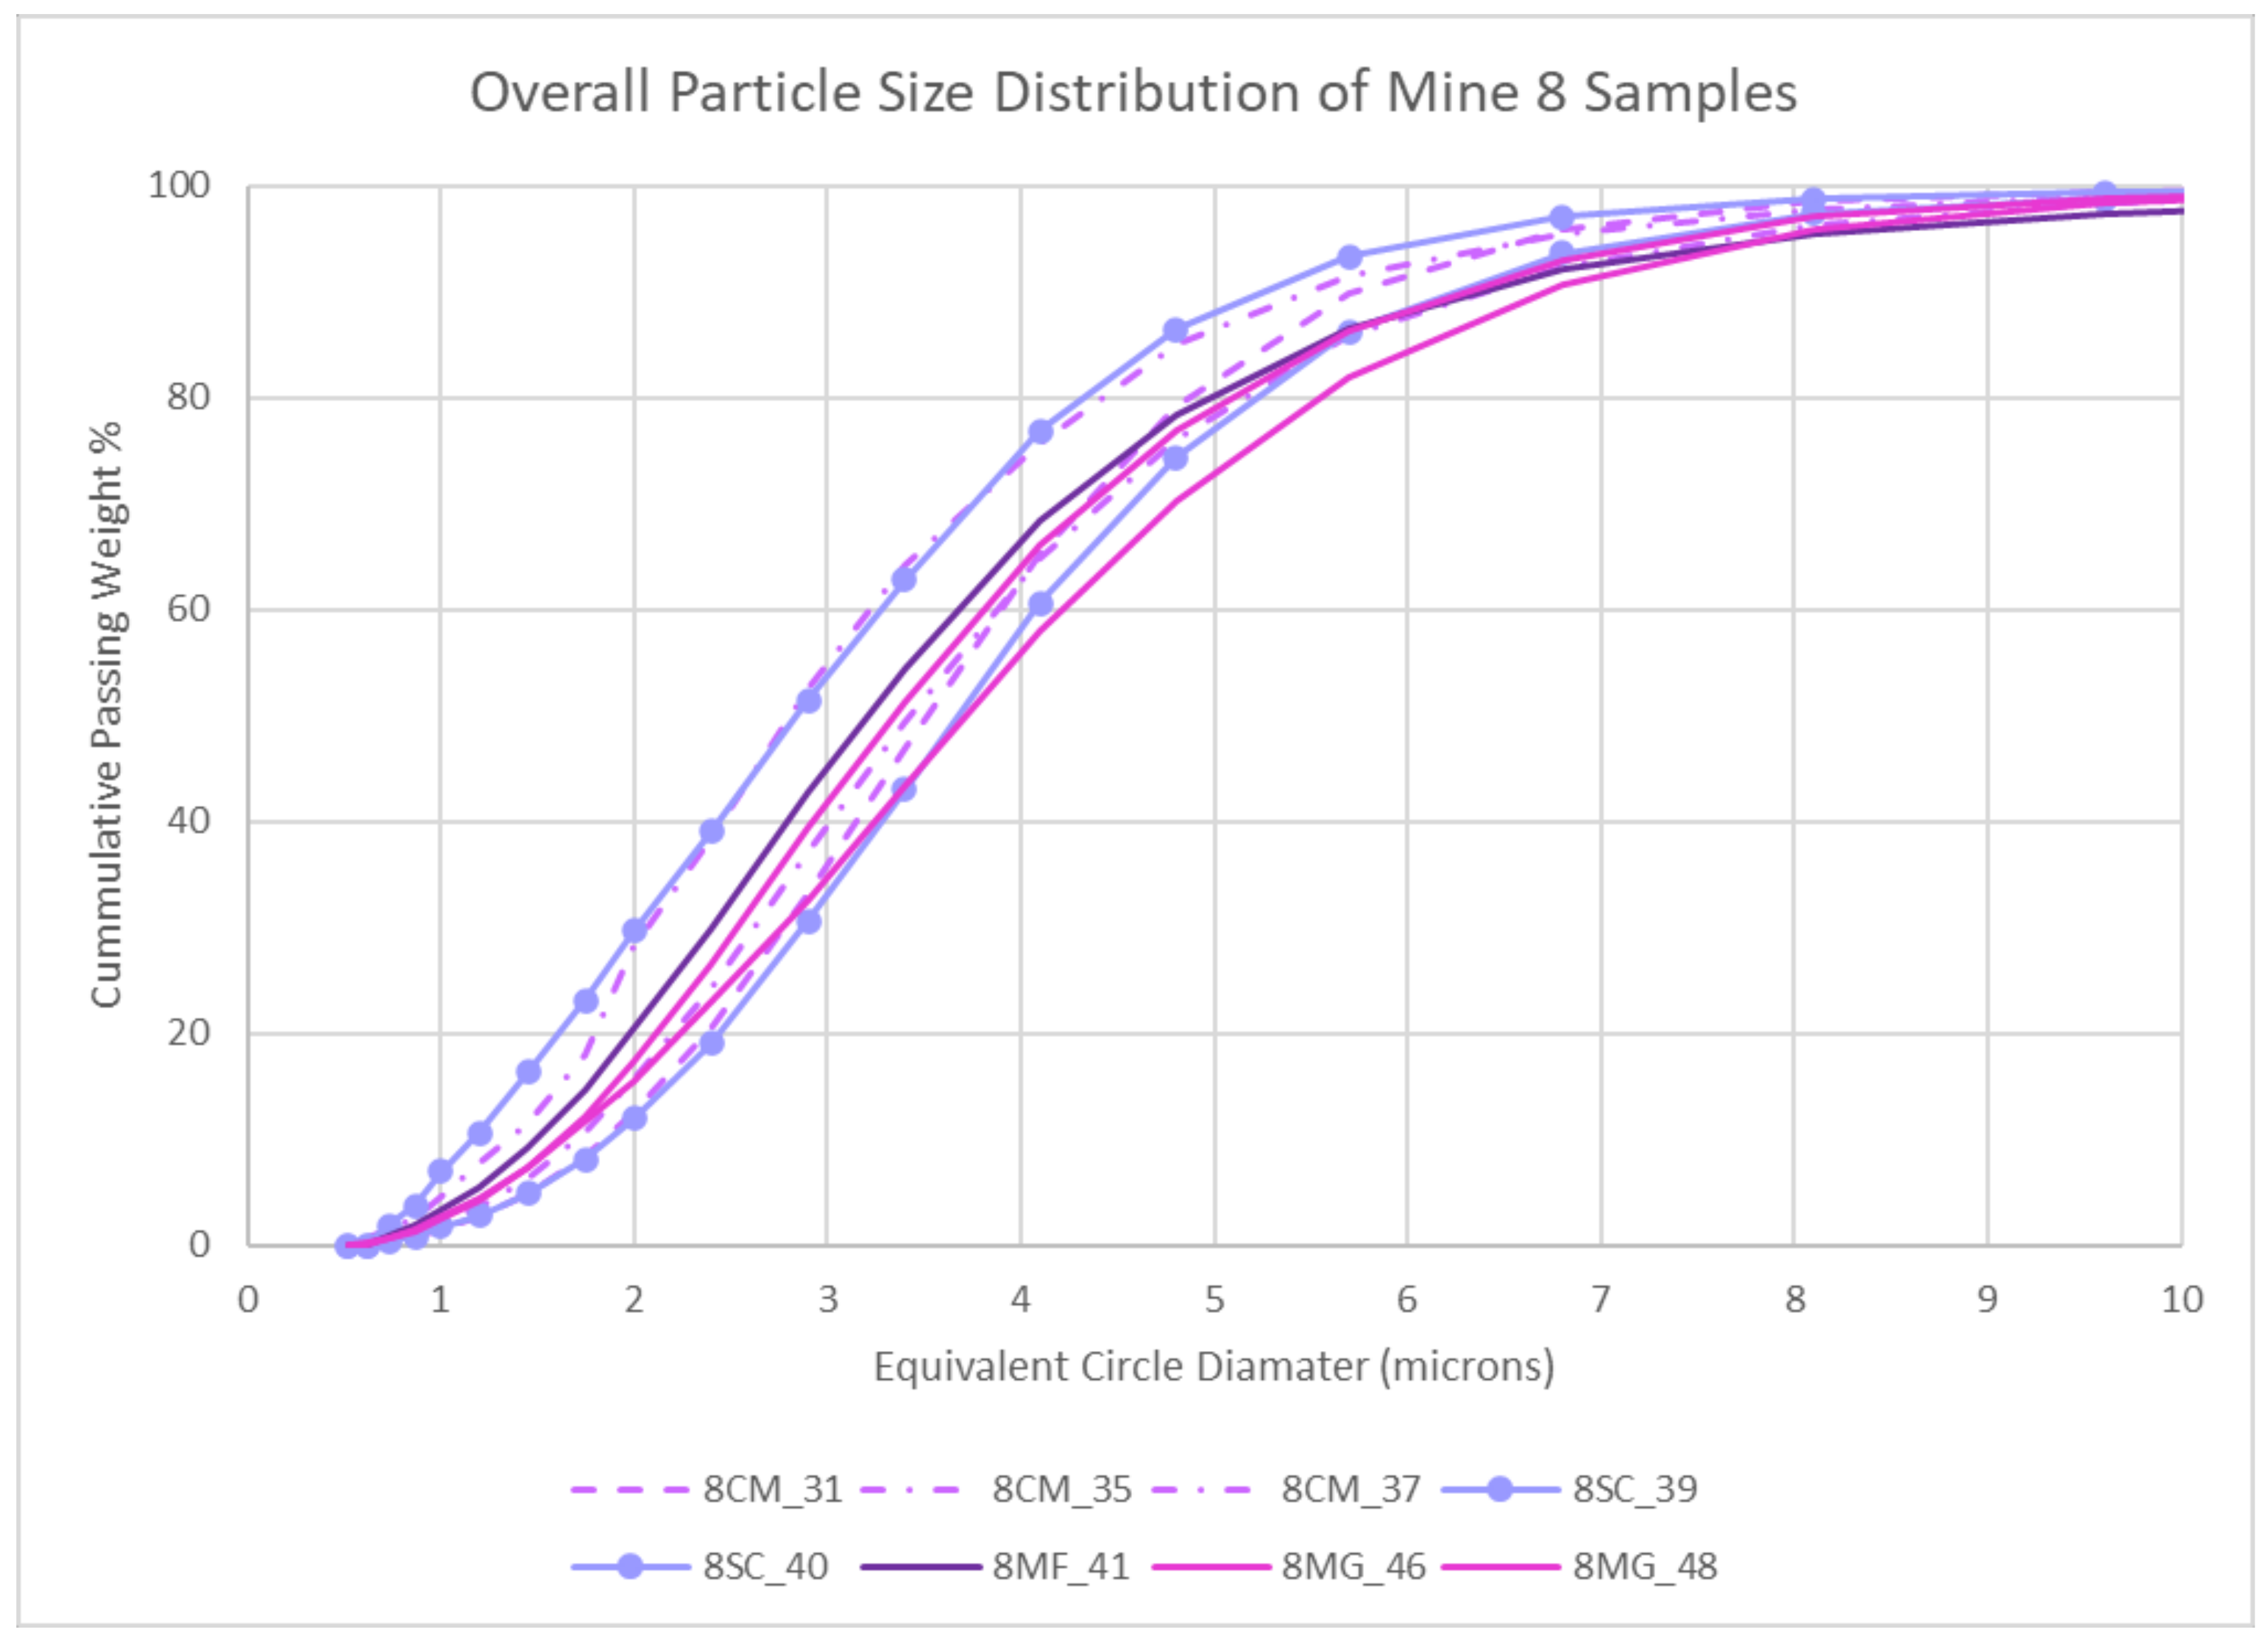
Figure 4 shows the overall particle size distribution of the samples from Mine 8. These samples show a much tighter PSD with less variability between locations in the mine.
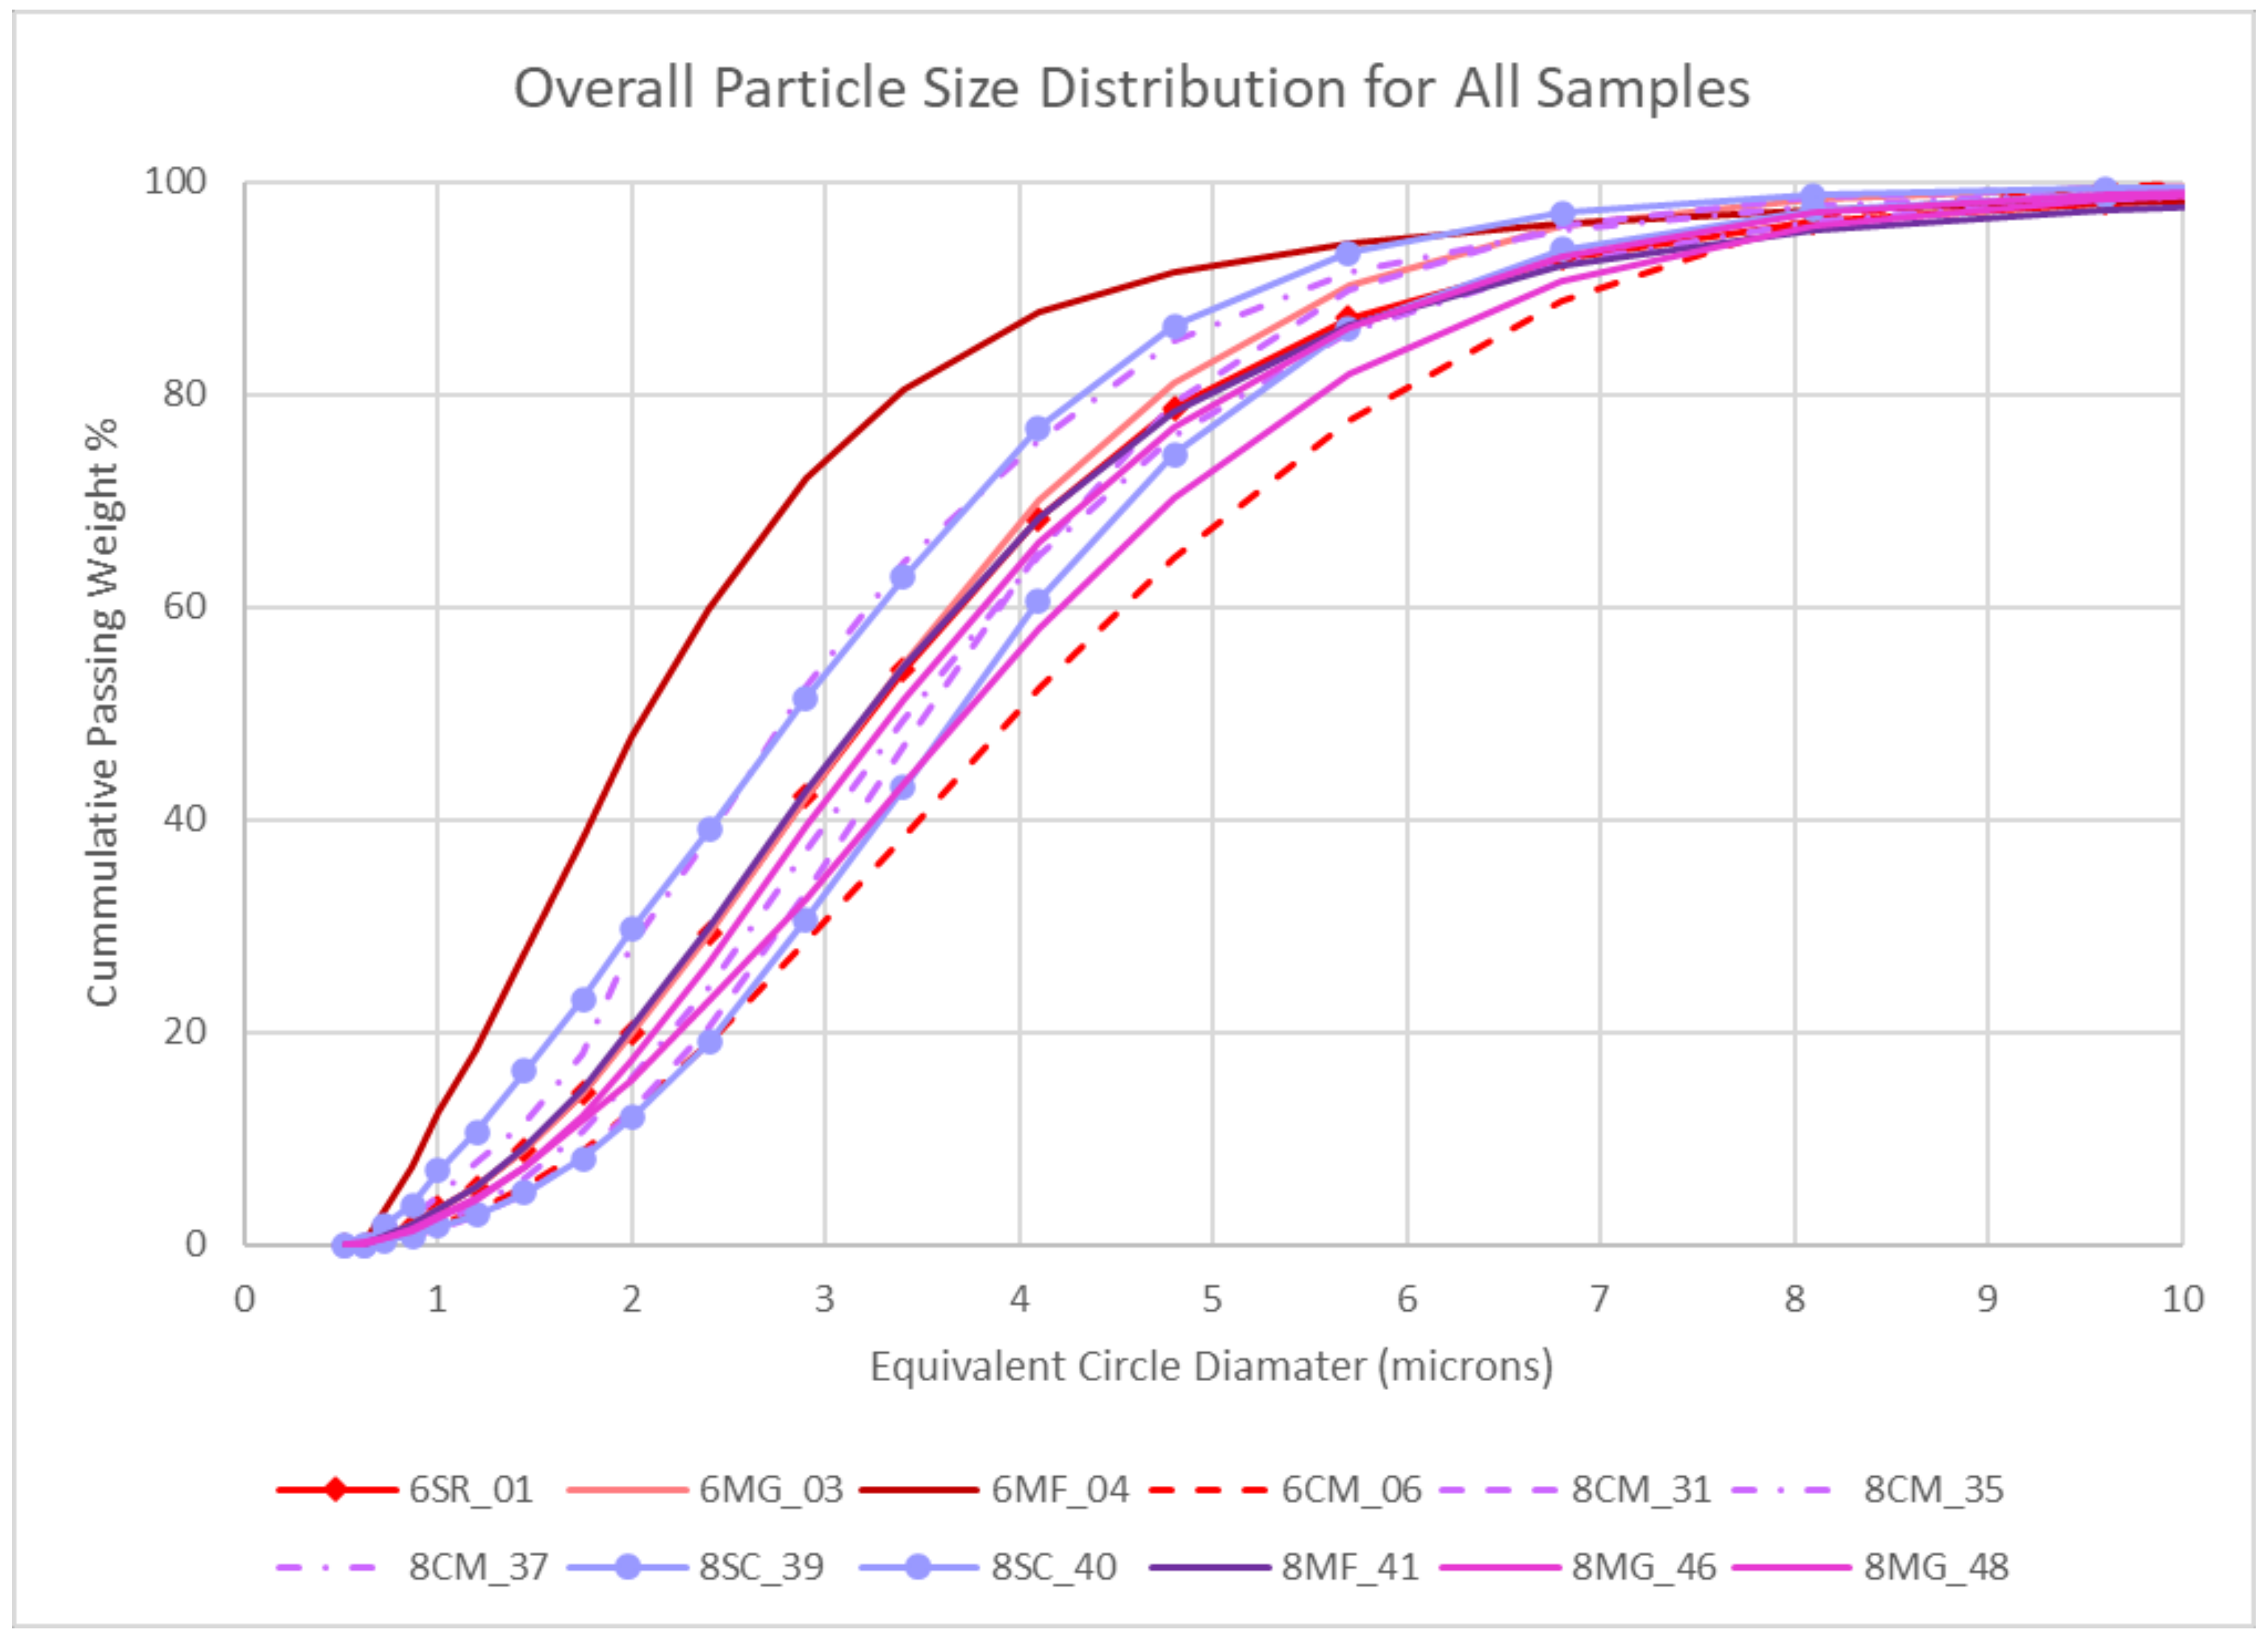
Figure 5 shows the overall particle size distribution of all the samples. The difference in the spread between PSDs is much more noticeable when combined, with Mine 6 having both coarser and finer PSDs than Mine 8. The PSDs for Mine 7 were not able to be calculated due to the overloading of the samples. Mine 8 does not seem to follow the same trends in the PSD progressively getting finer from continuous miner to maingate to midface samples, but this could also be an artifact of how low the variability is in the PSDs for this mine.
The MLA is able to analyze the individual dust particles and determine the PSD of each mineral class. The MLA software defaults to calculating the PSD of any particles that contain any amount of a given mineral. For the purposes of this paper the data has been filtered to include only particles that have >50% by weight of a certain mineral, thus only calculating the PSD for particles that are predominately that mineral. It is possible that some particles will not be included in any PSD apart from the overall PSD if there is no dominant mineral above 50% weight, for example, if a particle contains three minerals of roughly equal weight percent.
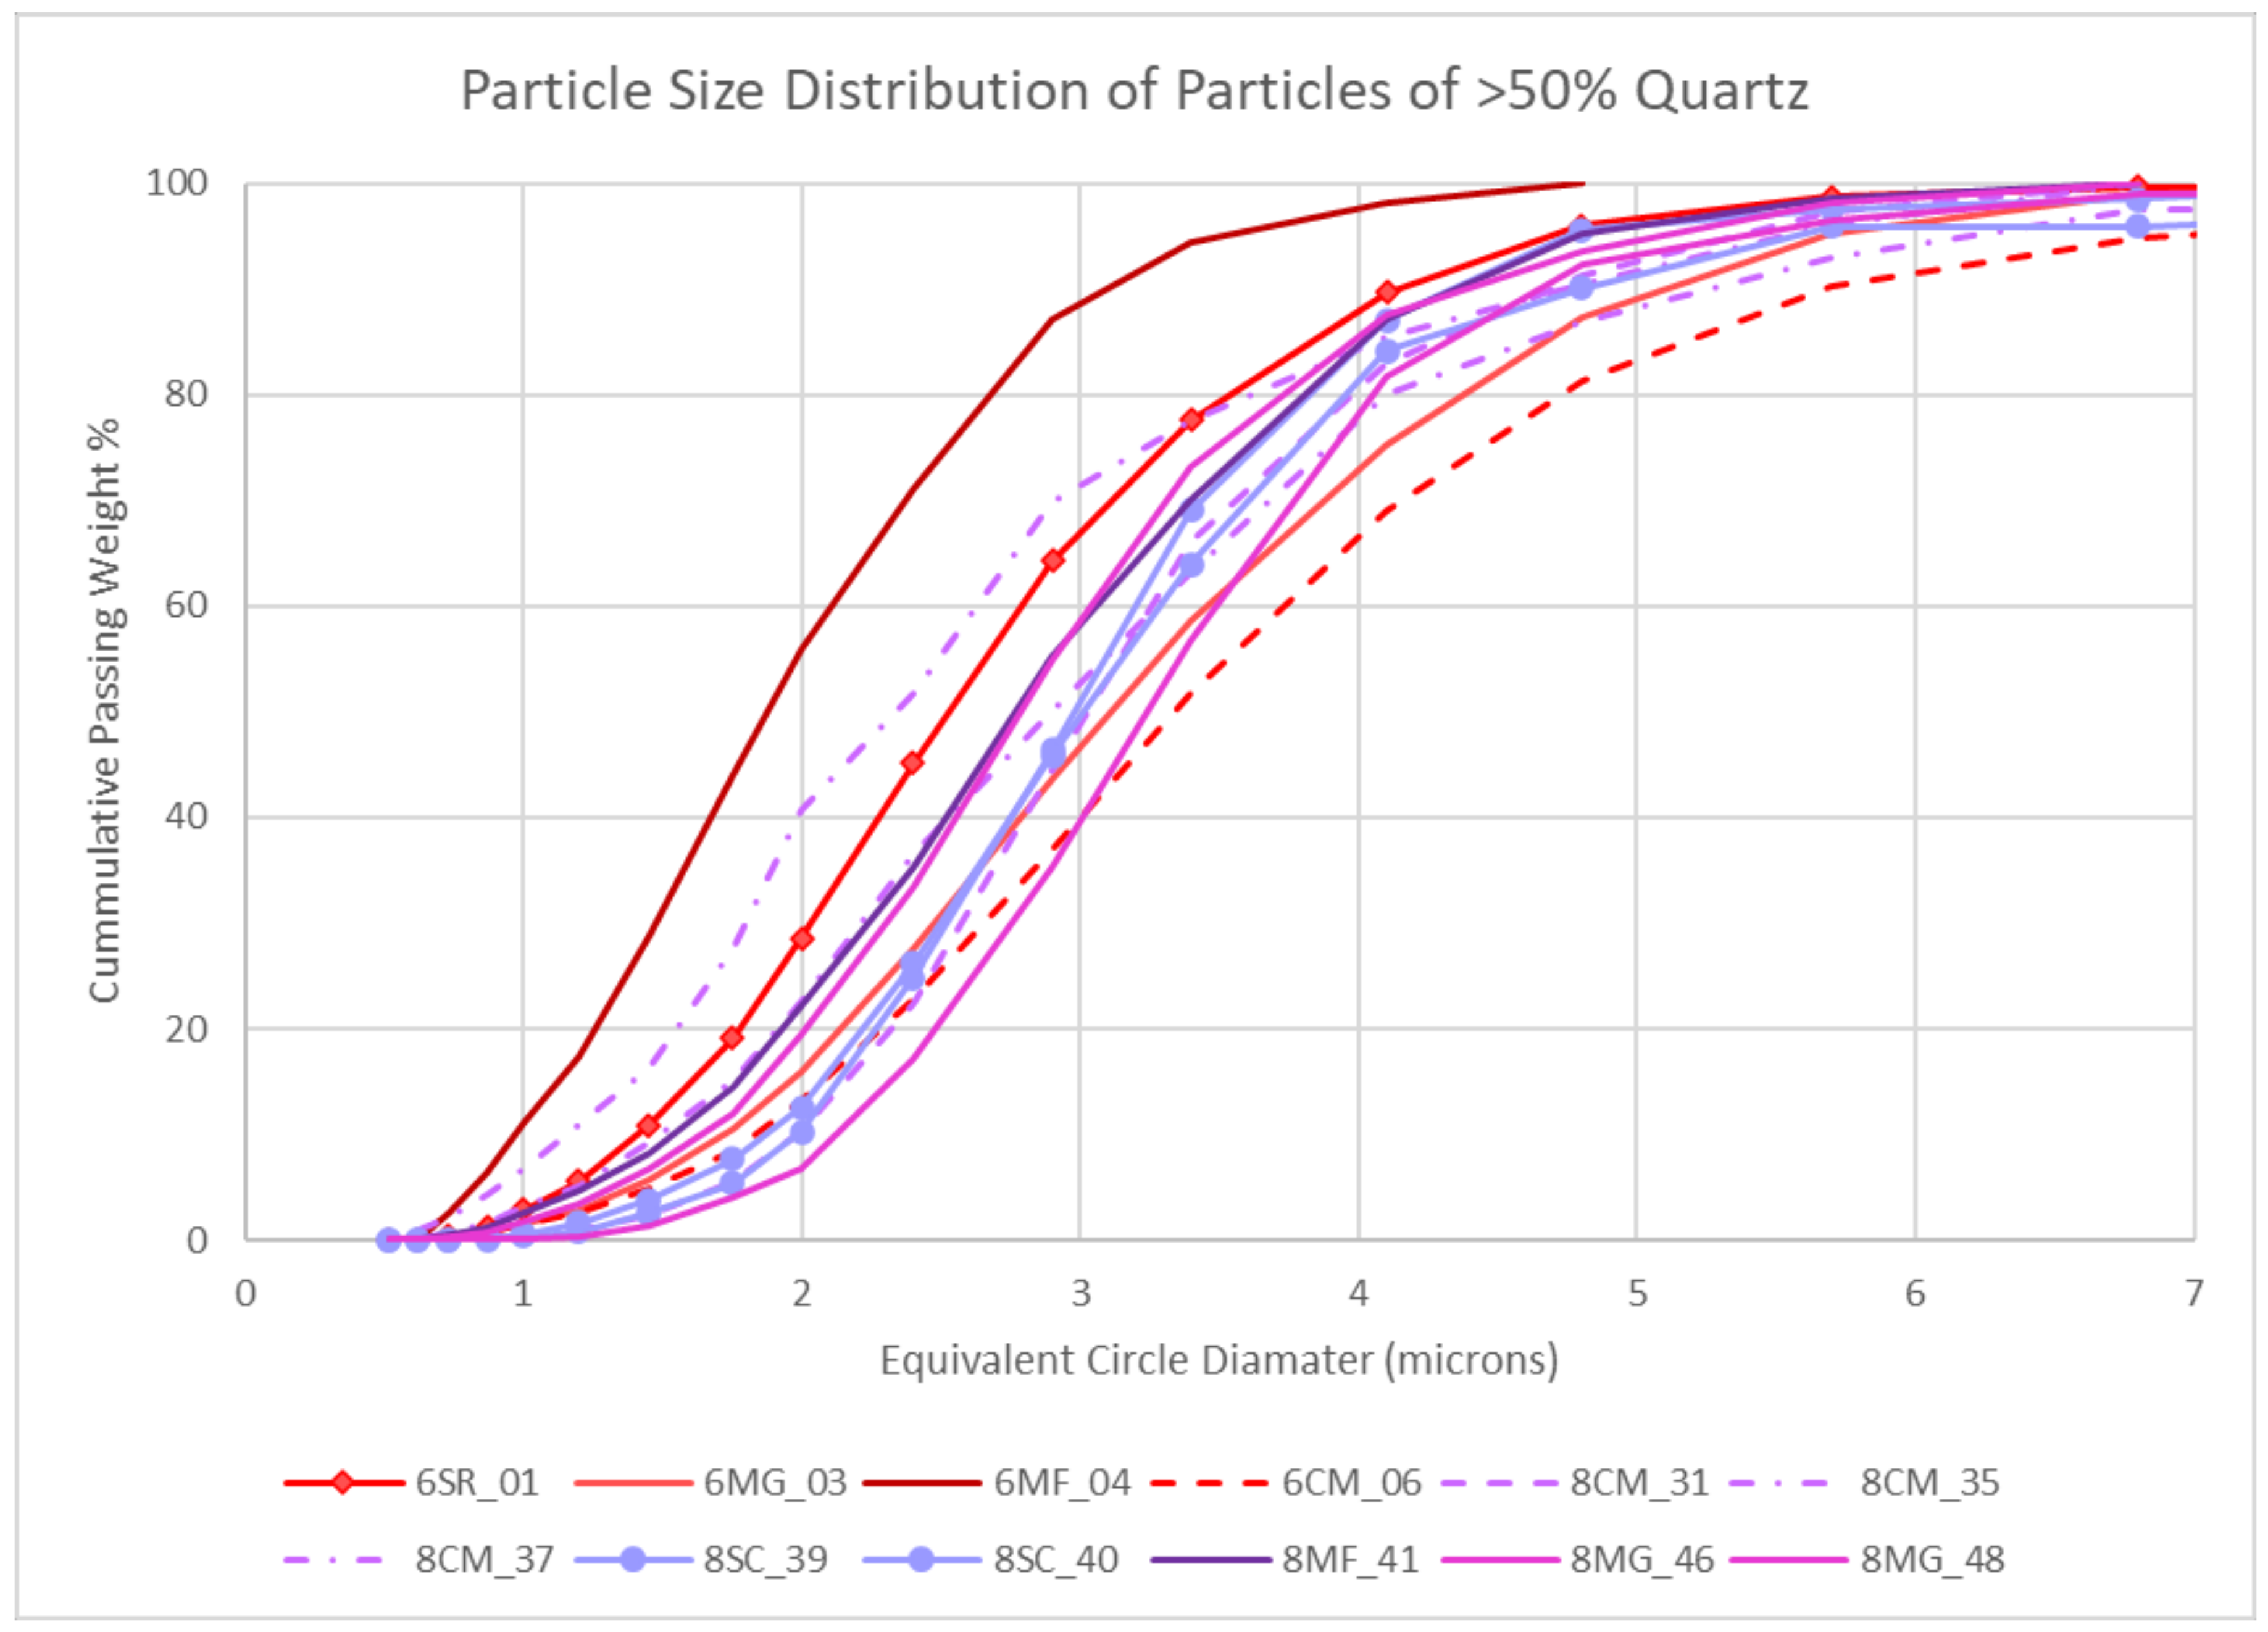
Figure 6 shows the PSD distribution for the particles with >50% weight of quartz. The quartz fraction is usually finer than the overall particle size distribution. The Mine 6 midface sample has an especially fine PSD with 90% of the particles less than 3 microns equivalent circle diameter. Similar to the overall PSD, Mine 8 also has a tighter PSD of quartz than does Mine 6.
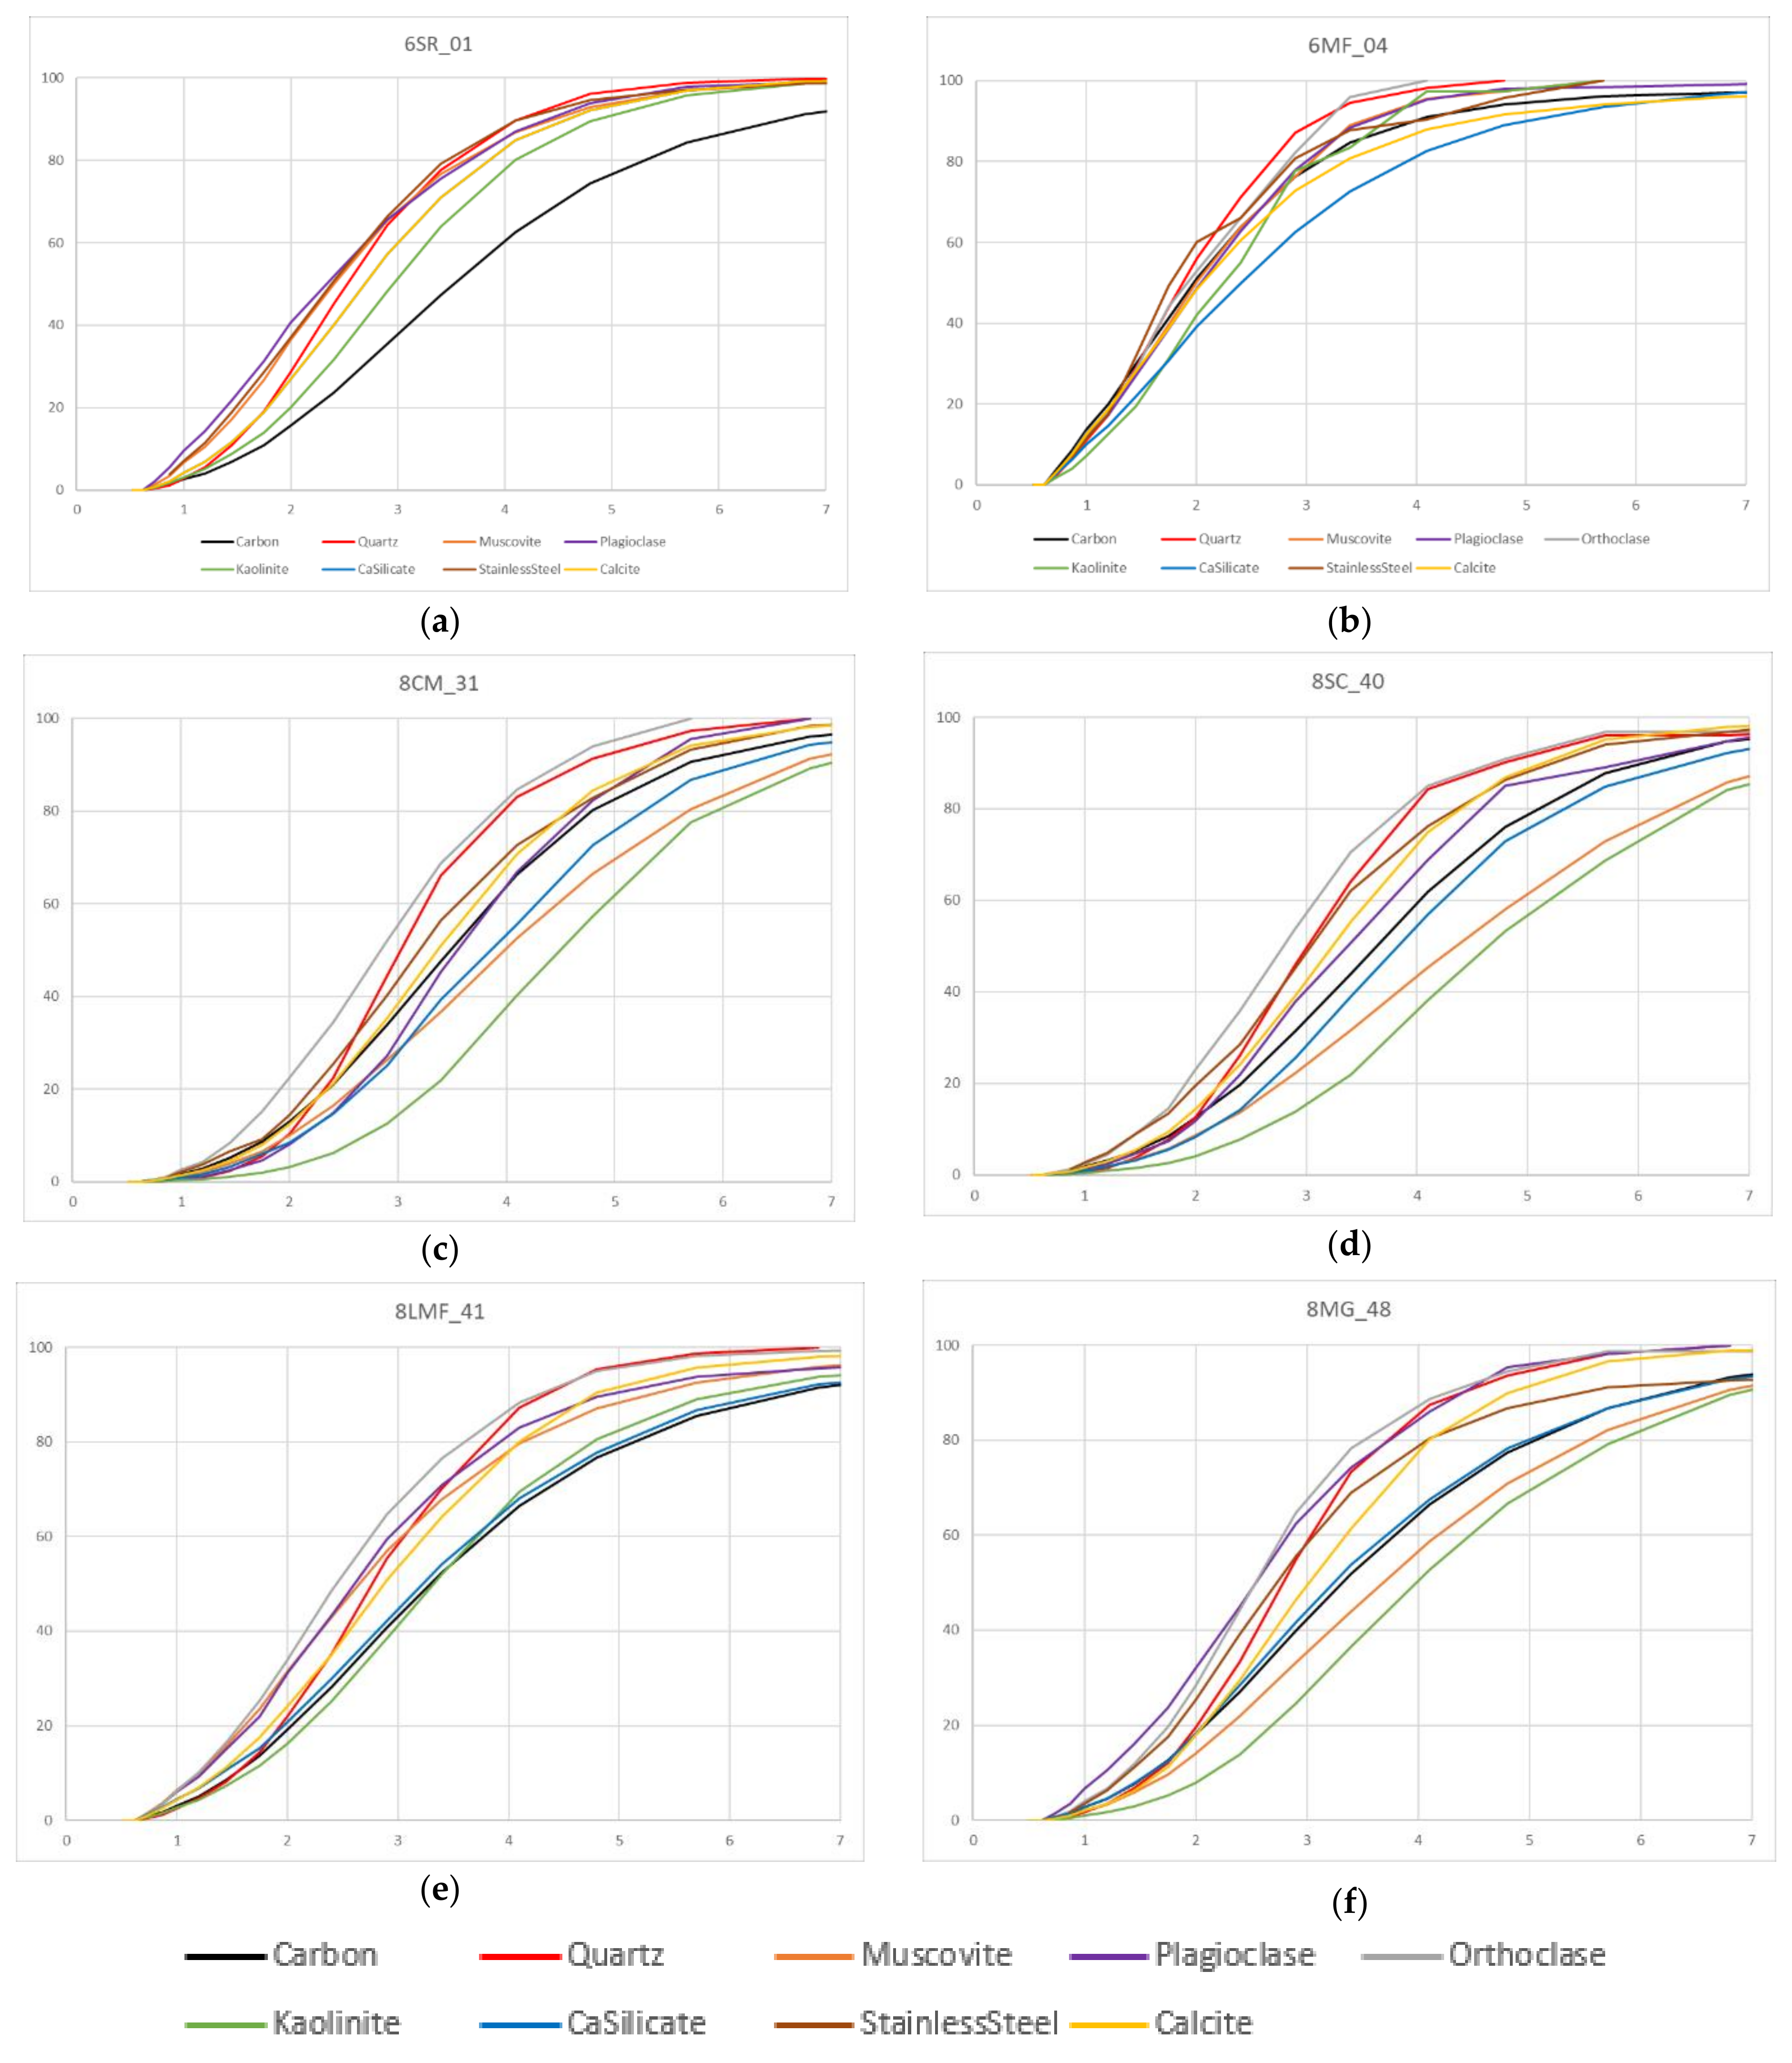
The PSD of several of the mineralogical components is shown in
Figure 7 for various samples. There were 25 different mineralogies identified which are listed above in
Figure 2. For the purposes of showing the variability in PSDs, the predominant minerals have been selected here including carbon, quartz, muscovite, plagioclase, orthoclase, kaolinite, calcium silicate, and calcite.
Stainless steel has also been included in the PSDs by mineral as it was not expected to be found in the samples. The fraction of stainless steel varied from 0.02 to 1.2% percentage in these samples. The actual number of particles containing any stainless steel ranges from 158 to 6180 per filter. None of the mining machines (i.e., continuous miner, longwall) contain stainless steel that could be identified as the source and it has been theorized that these particles may be coming from the diesel engines of the personal transport vehicles that are being operated in the mines. Further investigation is needed into the potential sources of this material.
While the overall PSD of the Mine 6 samples
Figure 7a,b varied more significantly between samples, there is not as large a variability in the individual PSDs. The carbon fraction in the Mine 6 secondary recovery sample is coarser than the other mineralogies, but otherwise, the PSDs are very similar. The PSDs for the various mineralogies of the Mine 8 samples have a wider spread. The kaolinite and muscovite, represented by the green and orange lines respectively, have the coarsest PSDs in
Figure 7c,d,f.
Figure 7e had the narrowest PSD of the Mine 8 samples. As can be seen in all the samples the red lines representing the quartz tend to be on the finer side of the PSDs. The orthoclase, represented by the grey line, also has one of the finest PSDs in
Figure 7b–f. The continuous miner and shuttle car samples
Figure 7c,d were collected at the same time and show good agreement with very similar PSDs for each mineralogy. Not all mineralogical classes were present in each sample.
4. Discussion
The standard MLA sample preparation technique is to create a sample block by encasing ore in epoxy resin. The ore is often crushed prior to being encased in the block. The sample blocks can then be cut on various planes to provide a surface for analysis. The sample preparation for airborne particulate matter is significantly different in that dust from the ambient air is collected on a filter with a respirable cyclone elutriator. The MLA has been used for airborne particulate matter on filter in one previous instance, which was with environmental samples of the inhalable size fraction taken at an iron-ore mine in Brazil [
25]. These samples are the first respirable samples on the filter from Australian underground coal mines to be analyzed on the MLA.
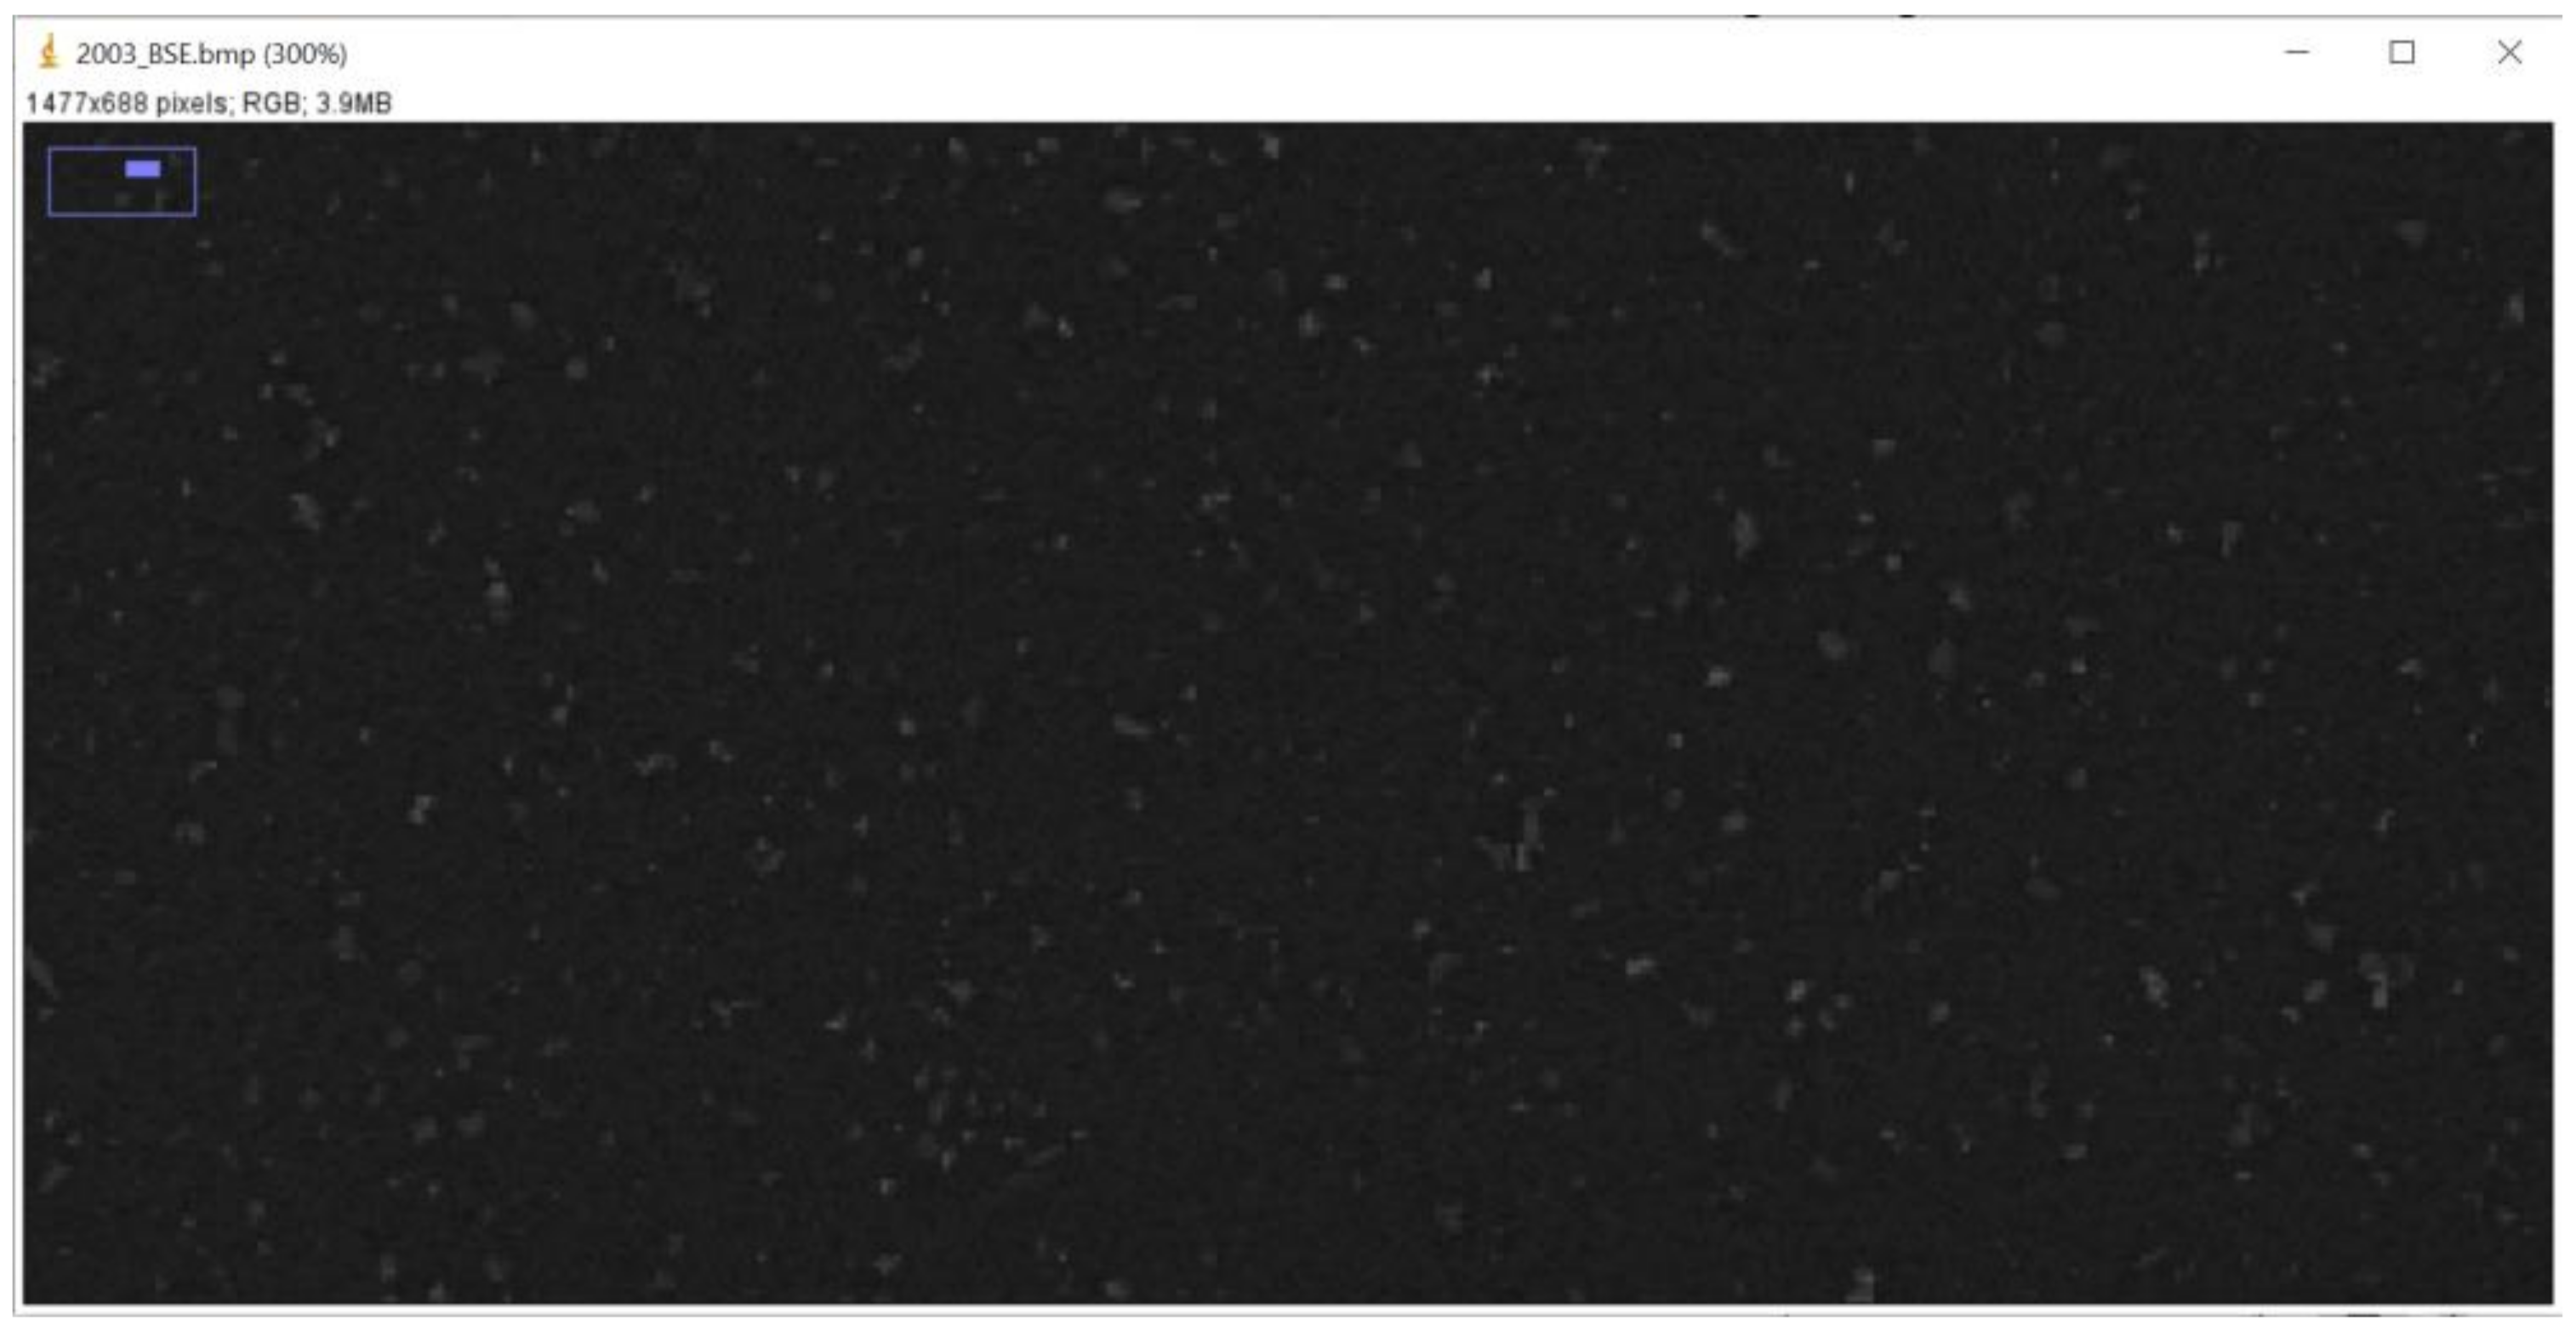
Figure 8 shows a backscattered electron (BSE) image from one of the filters.
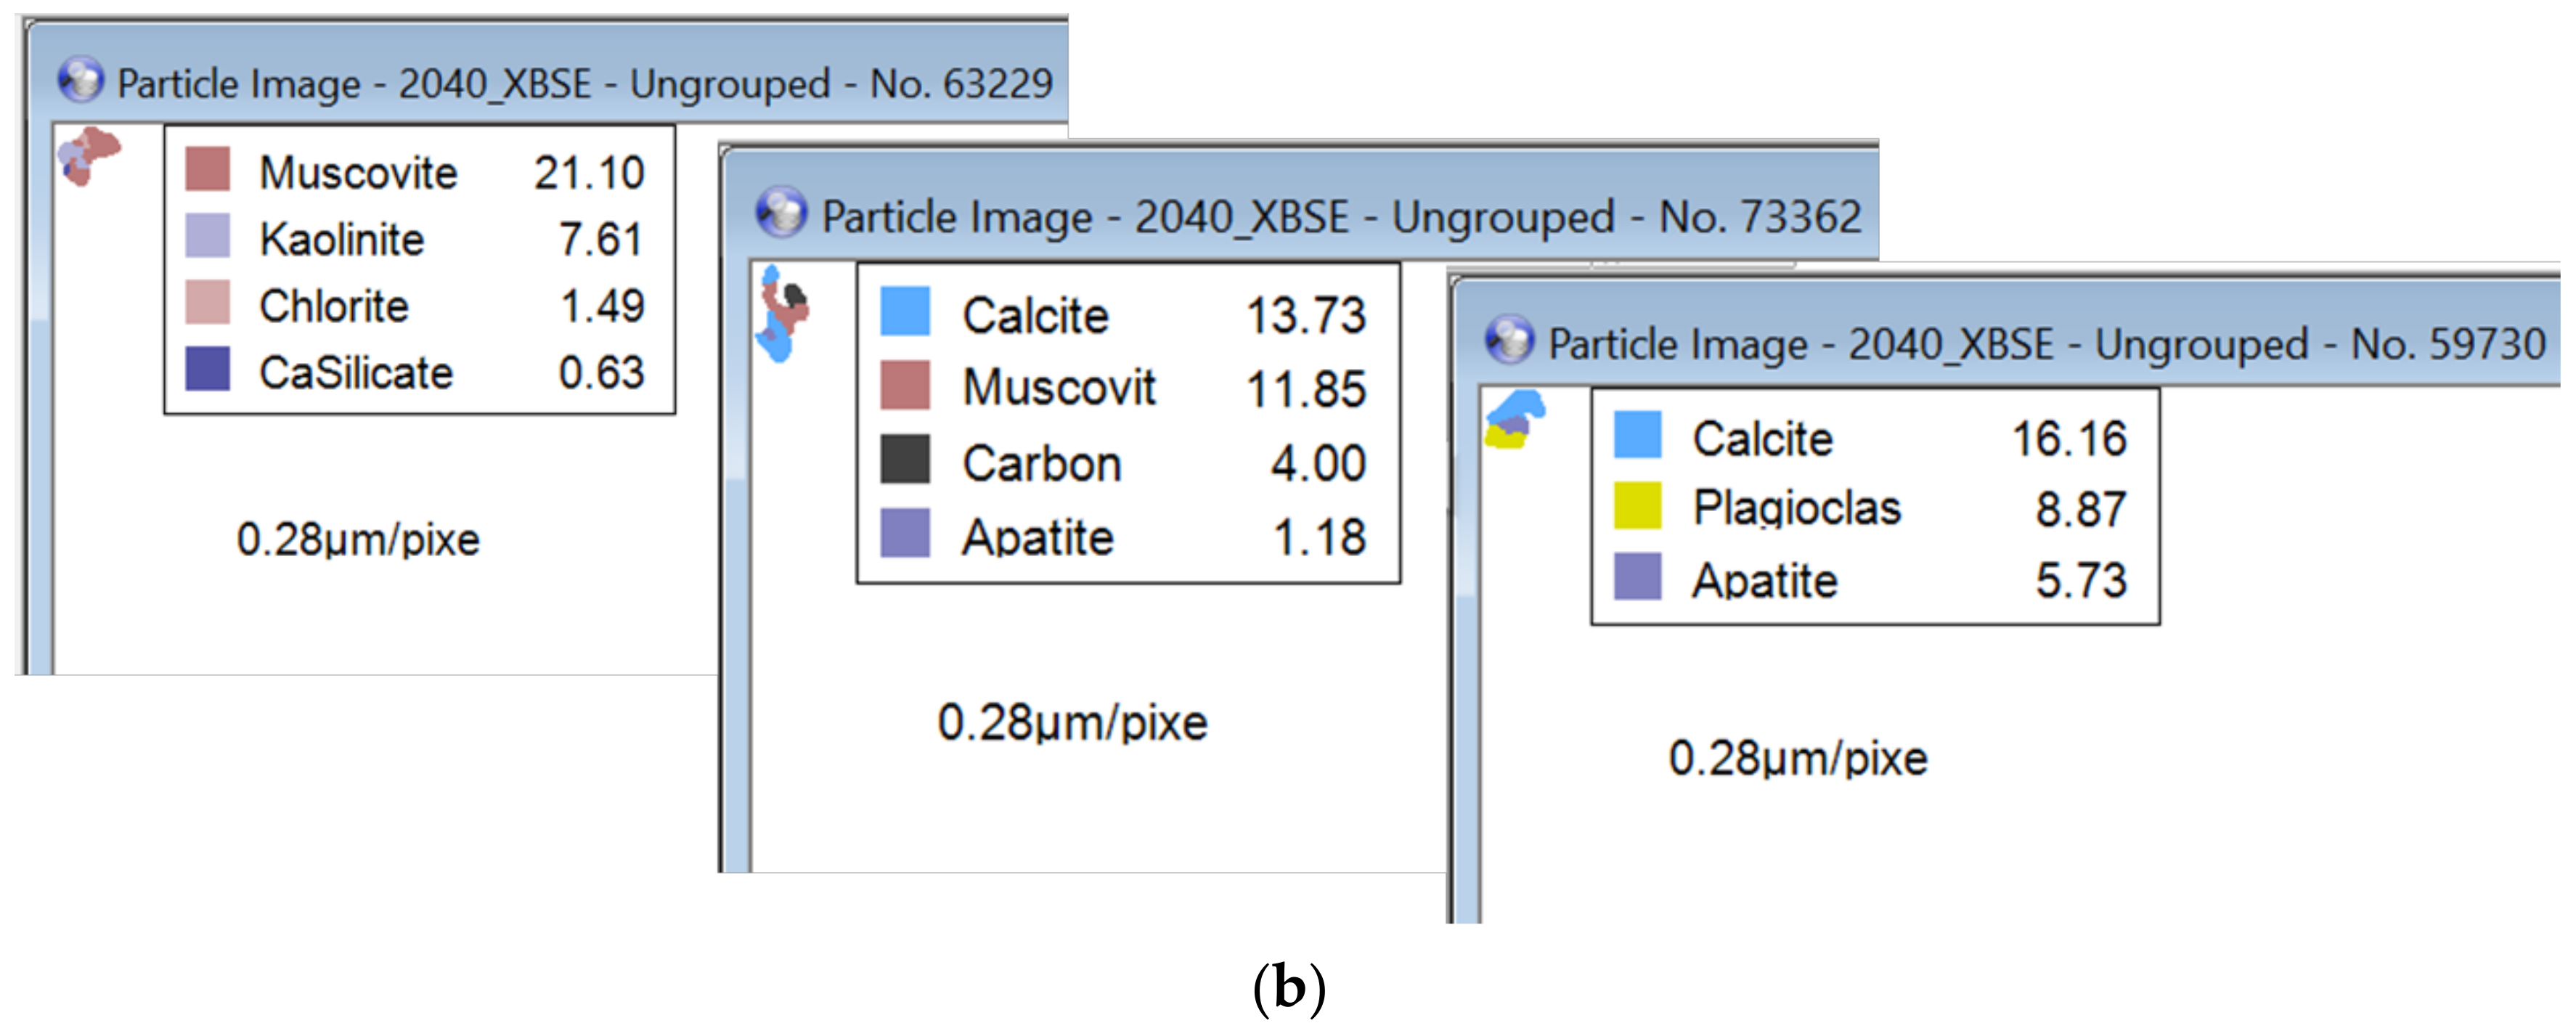
The MLA provides measurements of the individual particles and includes mapping of the minerals within the particles, as shown in
Figure 9. Airborne particulate matter sampling such as this requires that the polycarbonate filters not be overloaded, or the MLA cannot distinguish between the particles and will start aggregating them and treating them as larger particles. These issues can be picked up by looking at the images of the particles and noticing the presence of ‘holes’ in the particles, which is actually a gap between different particles. The MLA methodology also suffers from the same limitation in the inability to differentiate the carbon fraction between coal and diesel particulate matter (DPM), which was discussed in more detail in the previous work [
12].
Similar to the findings for Mines 1–4 [
12], the mineralogies present were found to vary more significantly by mine and to a lesser extent by location within individual mines. The noted variation in mine dust lung disease prevalence rates by region and the variations in geology found make characterization a promising technique for better understanding the relationship between dust exposure and disease. Several types of aluminosilicate particles including muscovite, kaolinite, plagioclase, and orthoclase were identified in the samples. A significant quantity of aluminosilicates have been found during the analysis of lung particle burden and there is currently no exposure standard for this class of particulates [
26]. The shape of the particles was generally found to be ovaloid with a few elongate particles (high length to width ratio).
The mineral class, size, and shape of the particle present in the environment may correlate to varying levels of health hazards of the dust being generated with the ambient air of the mine. Mine dust lung disease prevalence rates have been found to vary by mine and region and the logical next step in establishing that correlation lies in the characterization of the dust [
13]. This characterization work serves as an important precursor to future research needs to determine the extent of the variation in toxicity. Simply crushing and analyzing a coal sample may not be enough given the variety of sizes and mineralogies present from different sources. The cumulative effect of these may be different from that of the individual components [
27,
28]. The collection of samples can easily be done using the same cyclone elutriators that are used regularly in the mines for compliance monitoring. A specialized filter for microscopy analysis and a shorter duration of sampling is needed. Work is being done to standardize the MLA analysis methodology to decrease the amount of time for sample preparation and scanning and ensure repeatability of results.
The variation in PSD indicates that simple mass/gravimetric measurements of dust may not be sufficient to protect all workers. Some tasks may expose workers to a higher number of finer particles that penetrate deeper into the lungs while other workers may be exposed to a smaller number of coarser particles despite there being a similar mass of respirable dust. Furthering the understanding of the variation in particle burden may improve exposure monitoring and control to reduce this risk in the future.


