Abstract
The effects of CO2-water-rock interactions on the injectivity and safety of CO2 geological storage have drawn wide attention. The geochemical reaction mechanisms in carbonate formations after CO2 injection are still controversial. To better understand the transformation of injected CO2 in carbonates and the involved geochemical reactions, we first conducted autoclave experiments reproducing the in-situ conditions of the Lianglitage Formation, Yingshan Formation, and Qiulitage Formation at the Tazhong Uplift in the Tarim Basin. We then established a batch model using TOUGHREACT-ECO2H, validated with the experimental results, to simulate the long-term CO2-water-rock interactions. It was found that the initial mineral compositions and water chemistry have important effects on the CO2-water-rock interactions in carbonate formations. The experiment results show that the dissolution of calcite and dolomite dominates in the early reaction period. However, we still observed some secondary minerals, such as ankerite, montmorillonite, calcite, and dolomite. The CO2-water-rock reactions can be more dramatic when the contents of calcite and dolomite in carbonates are closer. Moreover, the long-term simulation results show that calcite, magnesite, and hematite are the main formed secondary minerals, whereas dolomite is the major dissolved mineral. This study is helpful for a better understanding of the CO2 mineral trapping mechanism in carbonate formations.
1. Introduction
Considering the serious environmental impact caused by global warming, the Paris Agreement set the goal to hold the increase of global average temperature to well below 2 °C and pursue efforts to limit the increase within 1.5 °C compared to preindustrial levels [1,2,3]. In this context, the reduction of greenhouse gas emissions, especially CO2 emission, cannot be delayed. In 2020, China announced that it will strive to peak carbon dioxide emissions before 2030 and achieve carbon neutrality before 2060 [4]. Carbon capture and storage (CCS) is one of the most promising solutions for the strategy of carbon reduction. Among the various methods of storage, CO2 geological storage has drawn tremendous attention due to its large storage capacity.
Geological CO2 sequestration involves four trapping mechanisms [5,6,7]: structural trapping, residual trapping, solubility trapping and mineral trapping. Among them, mineral trapping is considered to be the most stable and permanent way to store atmospheric CO2. However, the mineral dissolution and precipitation resulting from the CO2-water-rock interactions can significantly affect the safety and the injectivity of CO2 geological storage by changing the reservoir conditions [7,8]. Thus, much research has been devoted to clarifying the reaction mechanisms between CO2, water, and various rocks. To date, CO2-water-rock interactions in silicate reservoirs have been widely studied, whereas those in carbonate reservoirs have been paid much less attention [8,9,10]. However, it should be noted that carbonates are more reactive than silicates in acidic environments like the CO2-rich brine [7], and more than 60% of hydrocarbon reservoirs in the world are carbonate formations [11,12]. For this reason, the CO2 mineral trapping mechanism in carbonate rocks plays an important role in the deployment of CCS.
To investigate the mineral trapping mechanism of CO2 in carbonate formations, researchers have performed many experimental and numerical simulation studies [9,13,14,15,16,17,18,19,20,21]. Some results showed that carbonate rocks had a weak mineral trapping capacity [9,22,23,24,25,26]. For example, Azin, et al. (2015) [9] found that the dissolution of dolomite increased the concentration of Ca2+ and Mg2+ in brine, and no secondary carbonates were observed in the experiment. Thus, they proposed that carbonate reservoirs are proper for solubility trapping rather than mineral trapping. In contrast, Berrezueta, et al. (2017) [18] reported that the permeability in carbonates can be decreased by about 10% due to the mineral precipitation after the injection of CO2. It is proposed that the change of permeability in carbonates caused by the CO2 injection can be related to the distribution of pores, the chemical characteristics of brine, the fluid flow rates, the injection period, and thermodynamic conditions [24,27,28,29,30,31,32]. Crockford, et al. (2011) [14] demonstrated that lower NaCl concentration in brine leads to higher reaction rates between CO2, brine, and the Keg River carbonates due to the lack of compositional inhibition. However, the decreases in porosity and permeability are more obvious with higher salt concentration. Izgec, et al. (2007) [25] found that porosity and permeability change is case dependent, and calcite precipitation is mainly influenced by fluid flow directions. Compared to horizontal flow, calcite precipitates more with vertical flow. Researches have also observed other secondary minerals such as dolomite, anhydrite, ankerite, siderite, and magnesite [9,16,31]. In addition, the zeta trends, electrostatic interactions, surface complexation, and adsorption processes under high salinity conditions in carbonate reservoirs can affect water-rock reactions as well [11,33,34]. The related studies show that the increase of Ca2+ and Mg2+ in brine would impact the interactions between the rock surfaces of calcite and dolomite, and hence, affect the dissolution and precipitation of minerals [35,36,37]. The studies above have presented various factors affecting the CO2-water-rock interactions in carbonates, but have not fully clarified the mechanisms. Moreover, they are all based on small time scales, whereas mineral trapping is a very slow process.
The purpose of this study is to better understand the reactive mechanisms induced by CO2 injection into carbonate formations. We performed both lab and numerical experiments based on thermal, mineralogical, and geochemical conditions specific to the carbonate formations of the Tarim Basin. The effects of initial mineral compositions and salinities on the CO2-water-carbonate reactions are also considered.
2. Geological Settings
The Tarim Basin, located in the southern part of Xinjiang Uyghur Autonomous Region, is the largest inland stacked hydrocarbon-bearing basin in China, with a total area of 560,000 km2. The basin is bordered by the Tianshan Mountains in the north and the Kunlun Mountains in the south. The hinterland of the basin is the Taklamakan Desert (Figure 1). Tarim Basin consists of four depressions (the Kuqa, the North, the Southwest, and the Southeast) and three uplifts (the Tabei, the Tadong, and the Central). The central Uplift includes the Bachu Uplift, the Gucheng nosed Uplift, and the Tazhong Uplift. In the Tarim bBasin, except for some portions at Kueche and Kashi city, carbonate formations are covered by Cretaceous, Silurian, and Quaternary deposits. The carbonate formations developed in the tectonic evolution of seafloor retrogradation and transgression are at least 1 km thick, in total.
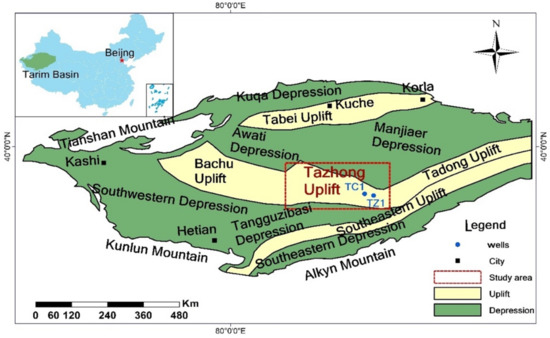
Figure 1.
Geological structures of the Tarim Basin and the location of wells TC1 and TZ1 (modified from Gao, et al. (2018) [38]).
The Tazhong Uplift is the study area in this study because the depth of carbonates is more than 3.5 km in the vicinity of Tazhong and fully meets the conditions for CO2 geological storage and also not too deep. In this area, the carbonate formations consist of Lianglitage Formation (LF), Yingshan Formation (YF), and Qiulitage Formation (QF) from top to bottom (Figure 2) [38,39]. Due to the change of sedimentation phase, the limestone of these formations in the Tazhong uplift gradually turns to dolomite from east to west.
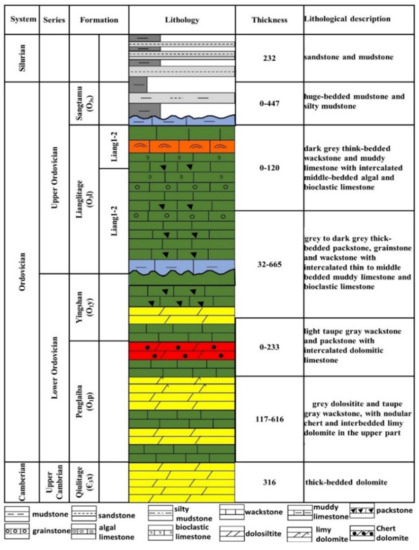
Figure 2.
Stratigraphic column of the Tazhong Uplift in the Tarim Basin(modified from He, et al. (2016) [39]).
3. Materials and Methods
3.1. Sample Description
To investigate the effects of mineral compositions in carbonates, especially the proportion of calcite and dolomite, we have selected rock samples from Lianglitage Formation (LF), Yingshan Formation (YF), and Qiulitage Formation (QF) in the Tazhong Uplift. From the Well TC1, we obtained two core samples belonging to the Lianglitage Formation (LF) and Qiulitage Formation (QF), respectively. In addition, to increase the diversity of mineral compositions, more outcrop samples were collected from the three target formations based on the mineral compositions (Table 1). A 50 wt% calcite–50 wt% dolomite synthetic rock sample was also used in the experiments.

Table 1.
Mineral composition of rock samples before experiments.
3.2. Physical Experimental Conditions
To reproduce the in-situ reservoir conditions, the experimental conditions are outlined as follows: (1) 120 °C for the autoclave reaction temperature (reservoir temperature); (2) synthetic brine with a salinity of 138.42 g/L (drilling report of Well TZ1) (Table 2). To consider the effects of salinity of brine, deionized water is also used in the experiments. The pressure in the reaction autoclave is set as 25 MPa, which is lower than the actual reservoir pressure of 45 MPa, considering the limitation of the apparatus.
Table 2.
Hydro-chemical characteristics of the formation water sample.
3.3. Experimental Apparatus and Procedures
The experiments are conducted in three reaction autoclaves (Figure 3). Each autoclave has a capacity of 100 mL. The autoclaves are made of 316 L stainless steel and support a magnetic steering function. The inner liner of the reactor is made of quartz material. The temperature detector and the sampling pipe is made of Hastelloy C276, a Ni-Cr-Mo wrought alloy generally considered a versatile corrosion resistant alloy material. The experimental procedures are as follows:
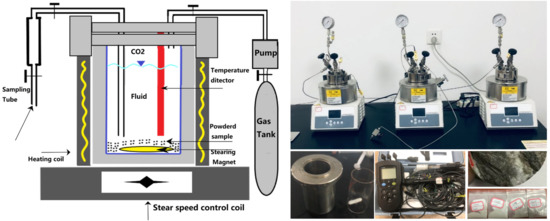
Figure 3.
A schematic representation of the work sequence followed in this study.
- Grind 4 g rock sample in an agate bowl into powders, and sieve the powders to approximately 150 µm grain size. Wash and dry the powder sample;
- Place the treated powder sample in a reactor that is filled with 75 mL synthetic brine and then seal the case;
- Make the top space of the reactor into a vacuum state, and heat it to 120 °C. Inject 99.9 wt% CO2 into the reactor until the pressure reaches to 25 MPa;
- Take a 2 mL fluid sample under pressure every 3 days for the measurement of pH and electrical conductivity with Hach HQ40d.
The experiment takes 15 days until the reaction reaches a balance. Before and after the experiments, the samples were analyzed for mineral compositions with X-ray diffraction (XRD, Bruker AXS D8-Focus, Bruker, Germany). The morphology changes on the mineral surfaces before and after reactions were observed by SEM (Hitachi SU8010, Hitachi, Ltd., Tokyo, Japan), coupled with energy dispersive X-ray spectroscopy (EDS, EDAX, AMETEK, Santiago, CA, USA). Water contents are analyzed by inductively coupled plasma-optical emission spectrometry (ICP-OES, PerkinElmer 5300DV, Waltham, MA, USA).
3.4. Numerical Methods
The numerical simulations were performed with the TOUGHREACT simulator [40], equipped with a new equation of state module ECO2H [41,42], which supports high reservoir temperature up to 300 °C and working pressure up to 60 MPa. TOUGHREACT is a non-isothermal, multiphase reactive transport simulation code, and it is used here to simulate the fluid-rock interactions under batch (zero-dimensional) conditions. The created conceptual model is shown in the figure below (Figure 4).
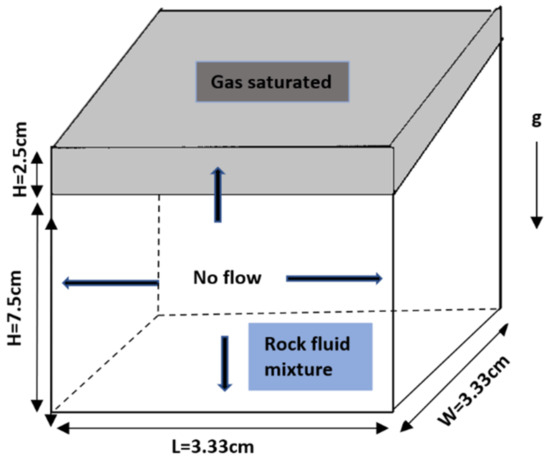
Figure 4.
Conceptual model representation, including the initial and boundary conditions.
In this study, the reactor (0.1 L total volume) has been discretized into two volumes. At the top, a cell characterized by 100% porosity and gas saturated mimics the presence of a CO2 gas cap zone (CO2 is the only initial constituent of this gas zone). At the bottom, a high-porosity (0.947), liquid-saturated cell represents the domain within which the rock powder interacts with the aqueous solvent. The boundaries of the model are set closed. The temperature and pressure in the model are set to 120 °C and 25 MPa, respectively, the same as the experimental conditions in the autoclaves.
The initial mineral compositions shown in Table 3 for the numerical experiments are also set according to the lab experiments, except for Case 6 and Case 6 DI. When calibrating the model, combining the analysis of XRD, SEM-EDS, and water chemistry, it is found that a minor amount of halite and calcite not detected should be added to the modeling of Case 6 and Case 6 DI to achieve relatively good fitting results. Table 4 gives the kinetic properties of the primary and possible secondary minerals in this study. The parameters are all explained below in detail.
Table 3.
List of initial mineral volume fractions.
Table 4.
Summary of primary and secondary mineral species and their kinetic properties.
In TOUGHREACT, the dissolution and precipitation of kinetic minerals are controlled by the kinetic rates. The reaction rates can be expressed as Equation (1) [44]:
where the subscript denotes the index of mineral species,
denotes the rate constant that is temperature dependent,
is the specific surface area, and
is the kinetic mineral saturation ratio. Parameters
and
are measured in the laboratory; Usually, they are set to 1. The positive values of
means mineral dissolution and the negative values of
means mineral precipitation.
For most of the mineral species, the rate constant
is defined as Equation (2) [44]:
where the superscripts
,
,
represent neutral, acidic, and basic mechanisms, respectively;
denotes the activation energy,
is the rate constant at 25 °C,
is the gas constant (8.31 J/mol K),
denotes the temperature,
is the activity of species, and
is the power-term. The TOUGHREACT thermal database is revised from the EQ3/6 geochemical modeling code database [45], for which the parameters are mainly taken from Palandri, et al. (2004) [43].
The initial concentrations of the aqueous species for simulation in Table 5 are calculated from the hydro-chemical characteristics of the formation water sample shown in Table 2 [46]. It should be noted that the concentrations of each aqueous species have to be given out separately. Therefore, here we combined the sum of the mass concentrations of K+ and Na+ and the law of charge conservation to calculate the concentrations of K+ and Na+. In addition, the SiO2, AlO2−, O2, and Fe in the aqueous are assumed to be trace substances.
Table 5.
Initial concentrations of primary aqueous species for simulation.
4. Results and Discussion
The rock samples used in this study can be divided into two main categories: (1) the calcite-rich limestone group (Case 1–3), and (2) the dolomite-rich group with low calcite content (Case 5–6). The rock sample in case 4 consists of 50 wt% calcite and 50 wt% dolomite. The aqueous solutions used to simulate the formation water include the synthetic brine (Case 6) and the deionized water (Case 6 DI). In this section, by the comparison of different cases, the effects of mineral compositions and brine salinities on the interactions between CO2-water-carbonates are investigated.
4.1. Experimental Study on CO2-Water-Rock Interactions
4.1.1. Variation of Water Chemistry
At the beginning of the experiments (0–3 days), the pH of the brine rapidly decreases from 6.8 to 5.6 (Figure 5a) due to the CO2 dissolution (Equation (3)), whereas the electrical conductivity (EC) of brine increases significantly within 0–3 days (Figure 5b). Due to the continued consumption of H+ in mineral dissolution, the descending speed of pH slows down after the third day, and then the pH even begins to ascend. Correspondingly, the EC starts to decline slowly after reaching its peak on the third day.
CO2 + H2O = H+ + HCO3−
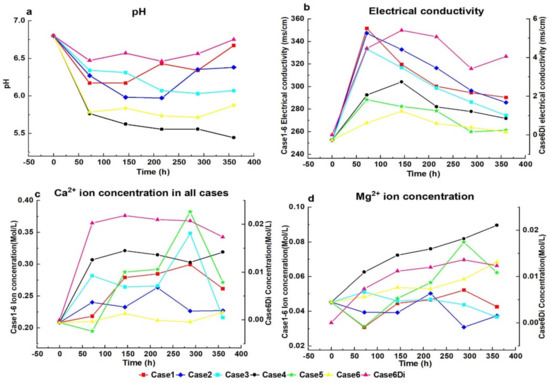
Figure 5.
Evolution of the pH and electrical conductivity in brine during the experiments (a,b). Concentration changes of the major ions Mg2+ and Ca2+ (c,d).
Figure 5c,d illustrates the concentration changes of Ca2+ and Mg2+ in brine. In the early stage of the experiments (0–3 days), the increase of Ca2+ is much higher than that of Mg2+. Considering that dolomite is the only source of Mg2+ (Equation (4)), we conclude that the increase in the concentration of Ca2+ is mainly due to the dissolution of calcite (Equation (5)). That is to say, the dissolution rate of calcite is higher than that of dolomite. For this reason, within 0–3 days, the decreasing rate of pH and the increasing rate of EC for the calcite-rich group is, respectively, lower and higher than those for the dolomite-rich group. In addition, by comparing Case 6 and Case 6 DI, the effect of initial salinity in brine on the reactions is revealed. As shown in Figure 6a, the concentration increments of the Ca2+ and Mg2+ in Case 6 DI are higher than those in Case 6, which denotes that lower salinity of brine can promote the dissolution rate of the minerals [14]. Thus, the pH of Case 6 DI decreases the most slowly and rebounds most obviously in all the cases. In addition, since the initial salinity of Case6 DI is zero, the conductivity of Case 6 DI is much lower than others. As shown in Figure 6b, the Ca2+/Mg2+ ratio decreases in both Case 6 and Case 6 DI. This means during the dissolution process, more Mg2+ is increased in the solution than Ca2+, which is a situation that is better for dolomitization to happen.
CaMg(CO3)2 (dolomite) + 2H+ = Ca2+ + Mg2+ + 2HCO3−
CaCO3 (calcite) + H+ = Ca2+ + HCO3−
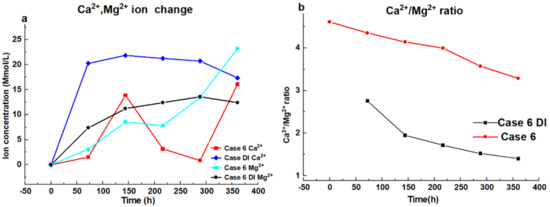
Figure 6.
The increase in Ca2+ and Mg2+ concentrations for Case 6 and Case 6 DI (a). Change of Ca2+/Mg2+ concentration ratio for Case 6 and Case 6 DI (b).
4.1.2. Changes in Mineral Morphology
Scanning electron microscope (SEM) analyses of rock samples before and after experiments illustrate the dissolution of calcite and dolomite. Before the experiment, mineral surfaces of calcite and dolomite were generally smooth (Figure 7a1,b1), whereas with the start of dissolution, corrosion pits and smaller particles at the surfaces become more evident afterward (Figure 7a2,b2). The higher resolution images in Case 4 and Case 6 (Figure 8) show that after the experiment, heavy corrosion occurs, which produces a rough surface morphology mainly caused by calcite and dolomite dissolution. In Case 6 the corrosion pits are very obvious (Figure 8b2). From the EDS and XRD analysis after the experiment, some secondary mineral formations like halite, ankerite (Figure 7a2), montmorillonite (Figure 7b2), and kaolinite can be observed (Equations (6)–(8)). The Fe2+ may come from some iron-bearing, unobserved primary minerals that were not detected.
Na+ + Cl− = NaCl (halite)
Ca2+ + 0.3Mg2+ + 0.7Fe2+ + 2HCO3− = (CaMg0.3Fe0.7)(CO3)2 (ankerite) + 2H+
2Al3+ + 2SiO2 + 5H2O = Al2Si2O5(OH)4 (kaolinite) + 6H+
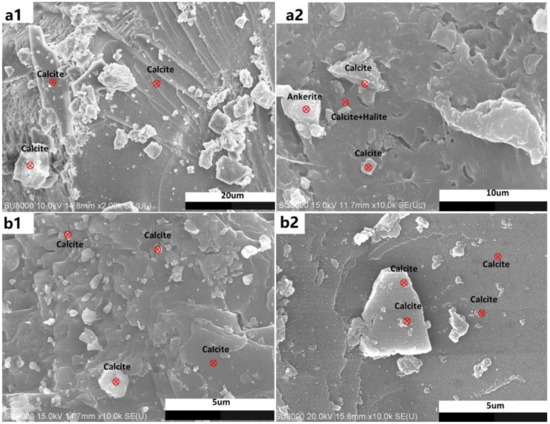
Figure 7.
Scanning electron photomicrographs of rock samples: (a1) Case 1 before experiment; (a2) Case 1 after experiment; (b1) Case 3 before experiment; (b2) Case 3 after experiment.
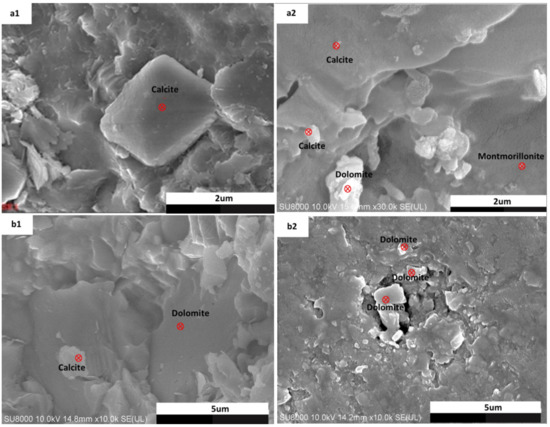
Figure 8.
Scanning electron photomicrographs of rock samples: (a1) Case 4 before experiment; (a2) Case 4 after experiment; (b1) Case 6 before experiment; (b2) Case 6 after experiment.
4.1.3. Transformation between Calcite and Dolomite
Table 6 gives the mineral compositions before and after the CO2-water-rock interaction experiments. It can be seen that the geochemical reactions are more dramatic when the contents of calcite and dolomite in carbonates are closer. According to the changes in calcite and dolomite abundance in the rock samples, the cases can be mainly divided into four categories (Table 7). As can be seen, when the initial calcite content is larger than 90% (Case 1 and Case 2), calcite tends to transform into dolomite. Conversely, when the initial dolomite content is larger than 90% (Case 5 and Case 6), dolomite tends to transform into calcite. It was found that the situation is more complicated when the initial content of calcite and dolomite in carbonates are closer to each other. In Case 3, the initial calcite content is between 50 and 90%, which leads to the transformation from dolomite to calcite. In contrast, when the initial dolomite content in Case 4 is between 50 and 90%, calcite transforms to dolomite. It should be noted that the rock sample in Case 4 is synthetic and consists of 50% calcite and 50% dolomite. The trends shown in Table 7 are consistent with the results of Wang (2020) [47] and Ma (2021) [48].
Table 6.
XRD results of the rock samples before and after the experiments.
Table 7.
The changes in the calcite and dolomite abundance.
4.1.4. Porosity Changes
The samples in this study are all powdered into very small particle sizes. Thus, conventional methods of mercury intrusion and weighting methods are not appropriate to measure the porosity. In a case like this, we can use image processing to obtain the 2D,3D porosity from SEM images [39,49,50,51,52]. The analysis of mineral microstructure by scanning electron microscopy (SEM) is an important research method. Through SEM images, parameters such as rock structure, particle and pore size, shape, and orientation can be obtained. In this study, SEM images of all cases were taken before and after the experiment, and the porosity and pore size distribution of the experimental results were analyzed using MATLAB code [51,52]. By creating depth maps with different thresholding operations for petrography analysis, binarization and segmentation operations can be performed. Finally, the porosity can be determined using the image volume method. It should be noted that visual porosity analysis is more accurate with SEM images with polished thin section samples. In our case, although powders are not able to give as clear surface change results as polished samples, the surfaces are mainly plain and the measures can be used to some extent.
By the method noted above, it was found that the porosity of Case 1, Case 2, Case 4, and Case 5 increased, whereas the porosity of Case 3 and Case 6 decreased after the reactions. This is consistent with the comparison of mineral changes before and after the reaction, except for Case 5. These porosity changes are because of mineral dissolution and precipitation. In all cases, calcite and dolomite composition change is inversely proportional. We can relate this phenomenon to calcite and dolomite displacement by dolomitization and dedolomitization. In proper conditions, the reaction speed of dolomitization can happen in days [53]. When calcite and dolomite alternate, the process of calcite decreasing and transforming into dolomite contributes to dolomitization and increases the lithologic porosity by up to a maximum of 13% [54,55]. Therefore, it can be considered that the dolomitization process in Case 1, Case 2, and Case 4 also increase the rock porosity. Compared with the calcite-rich groups, the increments of porosity in dolomite-rich groups are larger. A possible reason is that more dolomite content can initially dissolve and enrich the Mg2+ content in the brine, which can promote the dolomitization process. In Case 3 and Case 6, the mineral displacement is not sufficient and could result in a decrease in porosity with the precipitated more calcite (Table 8).
Mg2++ 2CaCO3 = CaMg(CO3)2 + Ca2+ (Dolomitization)
CaMg(CO3)2 + Ca2+ + SO42− = 2CaCO3 + Mg2+ SO42− (Dedolomitization)
Table 8.
Porosity changes before and after the experiments.
4.2. Geochemical Modelling of CO2-Water-Rock Interactions
4.2.1. Model Validation
To simulate the long-term mineral trapping process of CO2 in carbonate rocks, we used the trial-and-error method to validate the model. For time efficiency, only Case 6 and Case 6 DI were chosen for this work. When calibrating the model, the mineral surface area is mainly corrected due to its relatively high uncertainty. The calibrated kinetic parameters and modified initial mineral compositions can be seen in Table 3 and Table 4. Figure 9 illustrates that the calibrated model can reasonably capture the variation of major ion concentrations in the lab experiments.
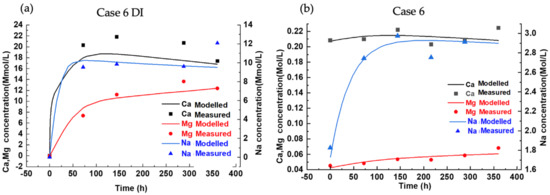
Figure 9.
Fittings of the experimental and simulation results for the major ion concentrations: (a) Case 6 DI; (b) Case 6.
4.2.2. Short-Term Transformation of Minerals
With the mineral kinetic parameters calibrated (Table 3 and Table 4), it can be seen that the predicted results of short-term mineral transformation show the same trends as the XRD results (Figure 10). The effect of salinity on the reactions can be observed in both experiments and simulations. Figure 11 shows the process of mineral dissolution and precipitation in the short term (15 days), represented by the mineral saturation indexes (SI). Minerals precipitate when SI > 0 after reaching the saturation state (SI = 0). As can be seen, compared with Case 6, calcite and magnesite need a longer time to start precipitation in Case 6 DI, and it is also more difficult for other minerals are to reach saturation in Case 6 DI, as the initial ion concentrations in Case 6 DI are extremely low.
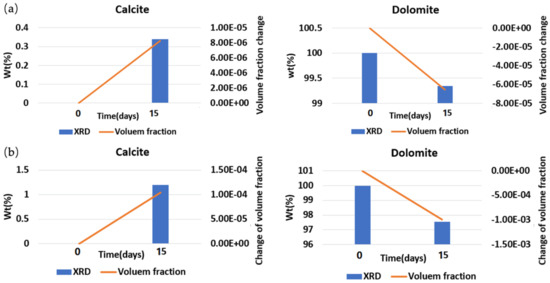
Figure 10.
Comparison of XRD results and predicted results: (a) Case 6; (b) Case 6 DI.
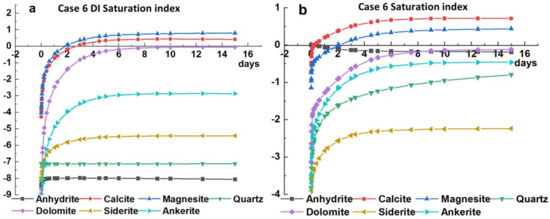
Figure 11.
Variations of mineral saturation indexes in the first 15 days: (a) Case 6 DI; (b) Case 6.
4.2.3. Long-Term Transformation of Minerals
As can be seen in Figure 12b–e, the concentration variations of Ca2+ and Mg2+ and the abundance changes of calcite and dolomite are more dramatic in dolomite-rich carbonates. The decrease of Ca2+ and dolomite and the increase of Mg2+ and calcite show that the precipitation of calcite and dissolution of dolomite are the dominant reactions during the whole process of CO2-water-carbonate interactions.
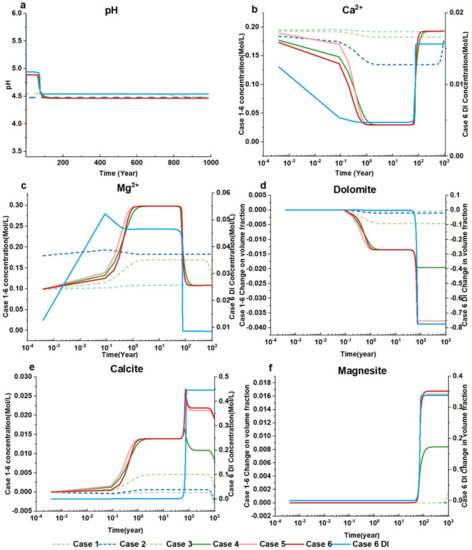
Figure 12.
The variations of pH (a), Ca2+ and Mg2+ concentrations (b,c). The abundance changes of dolomite (d), calcite (e), and magnesite (f).
In the calcite-rich carbonates, Ca2+ increases slowly in the early stage and starts to decline after about 0.5 years. Similarly, Mg2+ also increases slowly in the early stage, but the increase accelerates after 0.1 years. The reason is that the precipitation of calcite overwhelms the dissolution of calcite after 0.1 years, while the dissolution rate of dolomite further increases. It also can be seen that the increase rate of calcite in Case 3 was the fastest, and that in Case 1 was the slowest. In addition, the dolomite-rich cases (Case 4–Case 6) show that the reaction rate of Case 4 is higher than those of Case 6 and Case 5. This corresponds to the higher reaction rate of the mineral transformation when the calcite or dolomite content is in the 50–90% interval. Therefore, it can be determined that, to reach more mineralized CO2, dolomite or limestone formation lithology purity should be less than 10%.
As the carbonate rocks primarily consist of calcite, dolomite, quartz, and kaolinite, the secondary minerals are small amounts of hematite, magnesite, displaced calcite, and dolomite. Due to the low content of iron and aluminum ions in the initial solution, and the high reservoir temperature and pressure, the main carbon-fixing minerals such as ankerite and dawsonite do not appear during the simulation process. Calcite and dissolved dolomite were first formed from the initial time to 100 years, and magnesite began to precipitate in large quantities after 100 years. In addition, more calcite precipitated and more dolomite dissolved after 100 years.
5. Conclusions
To better understand CO2-water-rock interactions and what to expect under conditions similar to carbonate rocks of the deep layers of the Tarim Basin, we ran laboratory and numerical experiments with different initial mineralogical compositions and fluid salinity. These results may provide guidance for careful site selection in the framework of possible CCS operations in the Tarim Basin. The major conclusions are as follows:
- The dissolution of CO2 leads to a rapid decline of pH in the early stage. The pH then rises and becomes stable at the end of the experiments. The dissolution of minerals results in a continuous increase in electrical conductivity until the major secondary minerals reach an equilibrium state and start to precipitate, and then conductivity starts to decrease.
- The SEM analysis demonstrates the dissolution of the calcite and dolomite resulted in a rough surface texture and the formation of dissolution patterns at the edges of the crystals. In addition, some new micropores and pits can be observed. The secondary minerals include ankerite, halite, montmorillonite, calcite, and dolomite. The decreased concentration ratio of Ca2+ to Mg2+ promotes the dolomitization process.
- When the initial calcite content is greater than 90%, or the initial dolomite content is between 50 and 90%, calcite tends to transform to dolomite after the injection of CO2. This dolomitization process increases the rock porosity. When the initial dolomite content is greater than 90%, or the initial calcite content is between 50 and 90%, dolomite transforms to calcite. This dedolomitization process decreases the rock porosity. These can be used for better site selection when considering carbonate reservoirs in CO2 geological storage.
- With the experimental results, corrected reaction rates and surface area are used for the long-term simulations. It was found that in geological time scale, the main secondary minerals that can be observed are calcite, dolomite, magnesite, and hematite. Among them, magnesite and calcite are the main rock-forming minerals, whereas dolomite is the main dissolving mineral. Secondary minerals like ankerite and dawsonite cannot form in the long term mainly due to low iron and aluminum content in the initial system, which limits the CO2 mineral trapping capacity. On the other hand, quartz and kaolinite do not show a significant change in mineral abundance.
Author Contributions
Conceptualization, J.C. and K.A.; methodology, K.A.; software, R.Z.; validation, K.A. and Y.Y.; formal analysis, K.A. and Y.Y.; investigation, K.A.; resources, J.L.; data curation, K.A.; writing—original draft preparation, K.A.; writing—review and editing, J.C. and Y.Y.; visualization, K.A.; supervision, J.C.; project administration, J.C.; funding acquisition, J.C. All authors have read and agreed to the published version of the manuscript.
Funding
This research was funded by the National Natural Science Foundation of China (NSFC) (Grant No. 42172278 and U1911205).
Institutional Review Board Statement
Not applicable.
Informed Consent Statement
Not applicable.
Acknowledgments
We would like to thank Sen Yang for helping interpret the results of XRD and SEM-EDS. Special thanks to Ning Liu for his assistance in the modeling study.
Conflicts of Interest
The authors declare no conflict of interest.
References
- Pachauri, K.; Meyer, A. Climate change 2014 synthesis report. Environ. Policy Collect. 2014, 27, 408. [Google Scholar]
- Metz, B.; Davidson, O.; Coninck, H.D.; Loos, M.; Meyer, L. IPCC Special Report on Carbon Dioxide Capture and Storage; Cambridge University Press: New York, NY, USA, 2005. [Google Scholar]
- Tollefson, J. IPCC says limiting global warming to 1.5 °C will require drastic action. Nature 2018, 562, 172–173. [Google Scholar] [CrossRef] [PubMed]
- Mi, Z.; Sun, X. Provinces with transitions in industrial structure and energy mix performed best in climate change mitigation in China. Commun. Earth Environ. 2021, 2, 182. [Google Scholar] [CrossRef]
- Bachu, S.; Gunter, W.; Perkins, E. Aquifer disposal of CO2: Hydrodynamic and mineral trapping. Energy Convers. Manag. 1994, 35, 269–279. [Google Scholar] [CrossRef]
- Perkins, E.; Czernichowski-Lauriol, I.; Azaroual, M.; Durst, P. Long term predictions of CO2 storage by mineral and solubility trapping in the Weyburn Midale Reservoir. In Greenhouse Gas Control Technologies 7; Elsevier: Amsterdam, The Netherlands, 2005; pp. 2093–2096. [Google Scholar]
- Snæbjörnsdóttir, S.Ó.; Sigfússon, B.; Marieni, C.; Goldberg, D.; Gislason, S.R.; Oelkers, E.H. Carbon dioxide storage through mineral carbonation. Nat. Rev. Earth Environ. 2020, 1, 90–102. [Google Scholar] [CrossRef]
- Siqueira, T.A.; Iglesias, R.S.; Ketzer, J.M. Carbon dioxide injection in carbonate reservoirs—A review of CO2-water-rock interaction studies. Greenh. Gases Sci. Technol. 2017, 7, 802–816. [Google Scholar] [CrossRef]
- Azin, R.; Mehrabi, N.; Osfouri, S.; Asgari, M. Experimental Study of CO2—Saline Aquifer-Carbonate Rock Interaction during CO2 Sequestration. Procedia Earth Planet. Sci. 2015, 15, 413–420. [Google Scholar] [CrossRef]
- Lu, J.; Mickler, P.J.; Nicot, J.-P.; Yang, C.; Darvari, R. Geochemical impact of O2 impurity in CO2 stream on carbonate carbon-storage reservoirs. Int. J. Greenh. Gas Control. 2016, 47, 159–175. [Google Scholar] [CrossRef]
- Tetteh, J.T.; Pham, A.; Peltier, E.; Hutchison, J.M.; Barati Ghahfarokhi, R. Predicting the electrokinetic properties on an outcrop and reservoir composite carbonate surfaces in modified salinity brines using extended surface complexation models. Fuel 2022, 309, 122078. [Google Scholar] [CrossRef]
- Blunt, M.; Fayers, F.J.; Orr, F.M. Carbon dioxide in enhanced oil recovery. Energy Convers. Manag. 1993, 34, 1197–1204. [Google Scholar] [CrossRef]
- Li, F.; Diao, H.; Li, W. Mineral trapping of CO2: Hydrothermal experimental system and thermodynamic simulation on interaction between CO2–H2O–dawsonite bearing sandstone with the pH of 4–9, temperature of 80–140 °C, and increasing pCO2. Mar. Pet. Geol. 2020, 111, 588–602. [Google Scholar] [CrossRef]
- Crockford, P.; Telmer, K. Dissolution Kinetics of Keg River dolomites and implications for spectra energy’s Fort Nelson CCS project. Energy Procedia 2011, 4, 4472–4479. [Google Scholar] [CrossRef][Green Version]
- Pokrovsky, O.S.; Golubev, S.V.; Schott, J.; Castillo, A. Calcite, dolomite and magnesite dissolution kinetics in aqueous solutions at acid to circumneutral pH, 25 to 150 °C and 1 to 55 atm pCO2: New constraints on CO2 sequestration in sedimentary basins. Chem. Geol. 2009, 265, 20–32. [Google Scholar] [CrossRef]
- Pokrovsky, O.S.; Golubev, S.V.; Schott, J. Dissolution kinetics of calcite, dolomite and magnesite at 25 °C and 0 to 50 atm pCO2. Chem. Geol. 2005, 217, 239–255. [Google Scholar] [CrossRef]
- Andre, L.; Audigane, P.; Azaroual, M.; Menjoz, A. Numerical modeling of fluid-rock chemical interactions at the supercritical CO2-liquid interface during CO2 injection into a carbonate reservoir, the Dogger aquifer (Paris Basin, France). Energy Convers. Manag. 2007, 48, 1782–1797. [Google Scholar] [CrossRef]
- Berrezueta, E.; Kovacs, T.; Luquot, L. Qualitative and quantitative changes of carbonate rocks exposed to SC CO2 (Basque-Cantabrian Basin, Northern Spain). Appl. Sci. 2017, 7, 1124. [Google Scholar] [CrossRef]
- Luquot, L.; Gouze, P. Experimental determination of porosity and permeability changes induced by injection of CO2 into carbonate rocks. Chem. Geol. 2009, 265, 148–159. [Google Scholar] [CrossRef]
- Niemi, A.; Bensabat, J.; Joodaki, S.; Basirat, F.; Hedayati, M.; Yang, Z.; Perez, L.; Levchenko, S.; Shklarnik, A.; Ronen, R.; et al. Characterizing CO2 residual trapping in-situ by means of single-well push-pull experiments at Heletz, Israel, pilot injection site—Experimental procedures and results of the experiments. Int. J. Greenh. Gas Control. 2020, 101, 103129. [Google Scholar] [CrossRef]
- Palandri, J.L.; Rosenbauer, R.J.; Kharaka, Y.K. Ferric iron in sediments as a novel CO2 mineral trap: CO2–SO2 reaction with hematite. Appl. Geochem. 2005, 20, 2038–2048. [Google Scholar] [CrossRef]
- Anbar, S.; Akin, S. Development of a linear predictive model for carbon dioxide sequestration in deep saline carbonate aquifers. Comput. Geosci. 2011, 37, 1802–1815. [Google Scholar] [CrossRef]
- Cunningham, J.A.; Campbell, S.W.; Kumar, R. Effect of Temperature on the Geological Sequestration of CO2 in a Layered Carbonate Formation. J. Energy Resour. Technol. 2020, 142, 070907. [Google Scholar] [CrossRef]
- Izgec, O.; Zhu, D.; Hill, A.D. Numerical and experimental investigation of acid wormholing during acidization of vuggy carbonate rocks. J. Pet. Sci. Eng. 2010, 74, 51–66. [Google Scholar] [CrossRef]
- Izgec, O.; Demiral, B.; Bertin, H.; Akin, S. CO2 injection into saline carbonate aquifer formations I: Laboratory investigation. Transp. Porous Media 2007, 72, 1–24. [Google Scholar] [CrossRef]
- Wang, X.; Alvarado, V.; Swoboda-Colberg, N.; Kaszuba, J.P. Reactivity of dolomite in water-saturated supercritical carbon dioxide: Significance for carbon capture and storage and for enhanced oil and gas recovery. Energy Convers. Manag. 2013, 65, 564–573. [Google Scholar] [CrossRef]
- Grgic, D. Influence of CO2 on the long-term chemomechanical behavior of an oolitic limestone. J. Geophys. Res.-Solid Earth 2011, 116, B07201. [Google Scholar] [CrossRef]
- Ott, H.; Oedai, S. Wormhole formation and compact dissolution in single- and two-phase CO2-brine injections. Geophys. Res. Lett. 2015, 42, 2270–2276. [Google Scholar] [CrossRef]
- Yang, Y.F.; Li, Y.W.; Yao, J.; Iglauer, S.; Luquot, L.; Zhang, K.; Sun, H.; Zhang, L.; Song, W.H.; Wang, Z.Y. Dynamic Pore-Scale Dissolution by CO2-Saturated Brine in Carbonates: Impact of Homogeneous Versus Fractured versus Vuggy Pore Structure. Water Resour. Res. 2020, 56. [Google Scholar] [CrossRef]
- Khather, M.; Saeedi, A.; Myers, M.B.; Verrall, M. An experimental study for carbonate reservoirs on the impact of CO2-EOR on petrophysics and oil recovery. Fuel 2019, 235, 1019–1038. [Google Scholar] [CrossRef]
- Li, B.; Goldberg, K. Diagenesis and reservoir quality of Cambrian carbonates in the Tarim Basin, northwestern China. J. Asian Earth Sci. 2022, 223, 104972. [Google Scholar] [CrossRef]
- Pearce, J.K.; Kirste, D.M.; Dawson, G.K.W.; Farquhar, S.M.; Biddle, D.; Golding, S.D.; Rudolph, V. SO2 impurity impacts on experimental and simulated CO2–water–reservoir rock reactions at carbon storage conditions. Chem. Geol. 2015, 399, 65–86. [Google Scholar] [CrossRef]
- Chen, Y.; Sari, A.; Xie, Q.; Saeedi, A. Insights into the wettability alteration of CO2-assisted EOR in carbonate reservoirs. J. Mol. Liq. 2019, 279, 420–426. [Google Scholar] [CrossRef]
- Chen, Y.; Sari, A.; Xie, Q.; Brady, P.V.; Hossain, M.M.; Saeedi, A. Electrostatic Origins of CO2-Increased Hydrophilicity in Carbonate Reservoirs. Sci. Rep. 2018, 8, 17691. [Google Scholar] [CrossRef] [PubMed]
- Brady, P.V.; Carroll, S.A. Direct effects of CO2 and temperature on silicate weathering: Possible implications for climate control. Geochim. Cosmochim. Acta 1994, 58, 1853–1856. [Google Scholar] [CrossRef]
- Tetteh, J.T.; Barimah, R.; Korsah, P.K. Ionic Interactions at the Crude Oil–Brine–Rock Interfaces Using Different Surface Complexation Models and DLVO Theory: Application to Carbonate Wettability. ACS Omega 2022, 7, 7199–7212. [Google Scholar] [CrossRef] [PubMed]
- Chen, Y.; Xie, Q.; Sari, A.; Brady, P.V.; Saeedi, A. Oil/water/rock wettability: Influencing factors and implications for low salinity water flooding in carbonate reservoirs. Fuel 2018, 215, 171–177. [Google Scholar] [CrossRef]
- Gao, D.; Lin, C.; Hu, M.; Yang, H.; Huang, L. Paleokarst of the Lianglitage Formation related to tectonic unconformity at the top of the Ordovician in the eastern Tazhong Uplift, Tarim Basin, NW China. Geol. J. 2018, 53, 458–474. [Google Scholar] [CrossRef]
- He, J.; Ding, W.; Li, A.; Sun, Y.; Dai, P.; Yin, S.; Chen, E.; Gu, Y. Quantitative microporosity evaluation using mercury injection and digital image analysis in tight carbonate rocks: A case study from the Ordovician in the Tazhong Palaeouplift, Tarim Basin, NW China. J. Nat. Gas Sci. Eng. 2016, 34, 627–644. [Google Scholar] [CrossRef]
- Xu, T.; Spycher, N.; Sonnenthal, E.; Zhang, G.; Zheng, L.; Pruess, K. TOUGHREACT Version 2.0: A simulator for subsurface reactive transport under non-isothermal multiphase flow conditions. Comput. Geosci. 2011, 37, 763–774. [Google Scholar] [CrossRef]
- Wan, Y.; Xu, T.; Pruess, K. Impact of fluid-rock interactions on enhanced geothermal systems with CO2 as heat transmission fluid. In Proceedings of the Thirty-Sixth Workshop on Geothermal Reservoir Engineering, Stanford, CA, USA, 31 January–2 February 2011. [Google Scholar]
- Pan, F.; McPherson, B.J.; Lichtner, P.; Karra, S.; Ré, C.L.; Kaszuba, J.P.; Lu, C.; Xu, T. Numerical simulations of interactions between supercritical CO2 and high-temperature fractured rocks in enhanced geothermal systmes. In Proceedings of the Thirty-Seventh Workshop on Geothermal Reservoir Engineering, Stanford, CA, USA, 30 January–1 February 2012. [Google Scholar]
- Palandri, J.L.; Kharaka, Y.K. A Compilation of Rate Parameters of Water-Mineral Interaction Kinetics for Application to Geochemical Modeling; Geological Survey: Menlo Park, CA, USA, 2004. [Google Scholar]
- Lasaga, A.C.; Soler, J.M.; Ganor, J.; Burch, T.E.; Nagy, K.L. Chemical weathering rate laws and global geochemical cycles. Geochim. Cosmochim. Acta 1994, 58, 2361–2386. [Google Scholar] [CrossRef]
- Wolery, T.J. EQ3/6, a Software Package for Geochemical Modeling of Aqueous Systems: Package Overview and Installation Guide (Version 7.0); Lawrence Livermore National Lab.: Livermore, CA, USA, 1992. [Google Scholar]
- Cai, C.; Franks, S.G.; Aagaard, P. Origin and migration of brines from Paleozoic strata in Central Tarim, China: Constraints from 87Sr/86Sr, δD, δ18O and water chemistry. Appl. Geochem. 2001, 16, 1269–1284. [Google Scholar] [CrossRef]
- Wang, S. Experimental and Simulation Study of Carbon Dioxide Storage in Ordovician Carbonate Formation in Tabei Uplift, Tarim Basin. Master’s Thesis, China University of Geoscience, Wuhan, China, 2020. (In Chinese with English Abstract). [Google Scholar]
- Ma, X. Experiments and Numerical Study of CO2 Storage in Ordovician Carbonate Formations in the Tarim Basin, China. Bachelor’s Thesis, China University of Geoscience, Wuhan, China, 2021. (In Chinese with English Abstract). [Google Scholar]
- Casella, L.A.; Griesshaber, E.; Simonet Roda, M.; Ziegler, A.; Mavromatis, V.; Henkel, D.; Laudien, J.; Häussermann, V.; Neuser, R.D.; Angiolini, L.; et al. Micro- and nanostructures reflect the degree of diagenetic alteration in modern and fossil brachiopod shell calcite: A multi-analytical screening approach (CL, FE-SEM, AFM, EBSD). Palaeogeogr. Palaeoclimatol. Palaeoecol. 2018, 502, 13–30. [Google Scholar] [CrossRef]
- Hemes, S.; Desbois, G.; Urai, J.L.; Schröppel, B.; Schwarz, J.-O. Multi-scale characterization of porosity in Boom Clay (HADES-level, Mol, Belgium) using a combination of X-ray μ-CT, 2D BIB-SEM and FIB-SEM tomography. Microporous Mesoporous Mater. 2015, 208, 1–20. [Google Scholar] [CrossRef]
- Rabbani, A.; Ayatollahi, S. Comparing three image processing algorithms to estimate the grain-size distribution of porous rocks from binary 2d images and sensitivity analysis of the grain overlapping degree. Spec. Top. Rev. Porous Media Int. J. 2015, 6, 71–89. [Google Scholar] [CrossRef]
- Ezeakacha, C.; Rabbani, A.; Salehi, S.; Ghalambor, A. Integrated image processing and computational techniques to characterize formation damage. In Proceedings of the SPE International Conference and Exhibition on Formation Damage Control, Lafayette, LA, USA, 7–9 February 2018. [Google Scholar]
- Montes-Hernandez, G.; Findling, N.; Renard, F. Dissolution-precipitation reactions controlling fast formation of dolomite under hydrothermal conditions. Appl. Geochem. 2016, 73, 169–177. [Google Scholar] [CrossRef]
- Jonas, L.; Müller, T.; Dohmen, R.; Baumgartner, L.; Putlitz, B. Transport-controlled hydrothermal replacement of calcite by Mg-carbonates. Geology 2015, 43, 779–782. [Google Scholar] [CrossRef]
- Weyl, P.K. Porosity through dolomitization—Conservation-of-mass requirements. J. Sediment. Res. 1960, 30, 85–90. [Google Scholar] [CrossRef]


Publisher’s Note: MDPI stays neutral with regard to jurisdictional claims in published maps and institutional affiliations. |
© 2022 by the authors. Licensee MDPI, Basel, Switzerland. This article is an open access article distributed under the terms and conditions of the Creative Commons Attribution (CC BY) license (https://creativecommons.org/licenses/by/4.0/).