
A New Route to Upgrading the High-Phosphorus Oolitic Hematite Ore by Sodium Magnetization Roasting-Magnetic Separation-Acid and Alkaline Leaching Process


Abstract
:1. Introduction
2. Materials and Methods
2.1. Materials
2.2. Methods
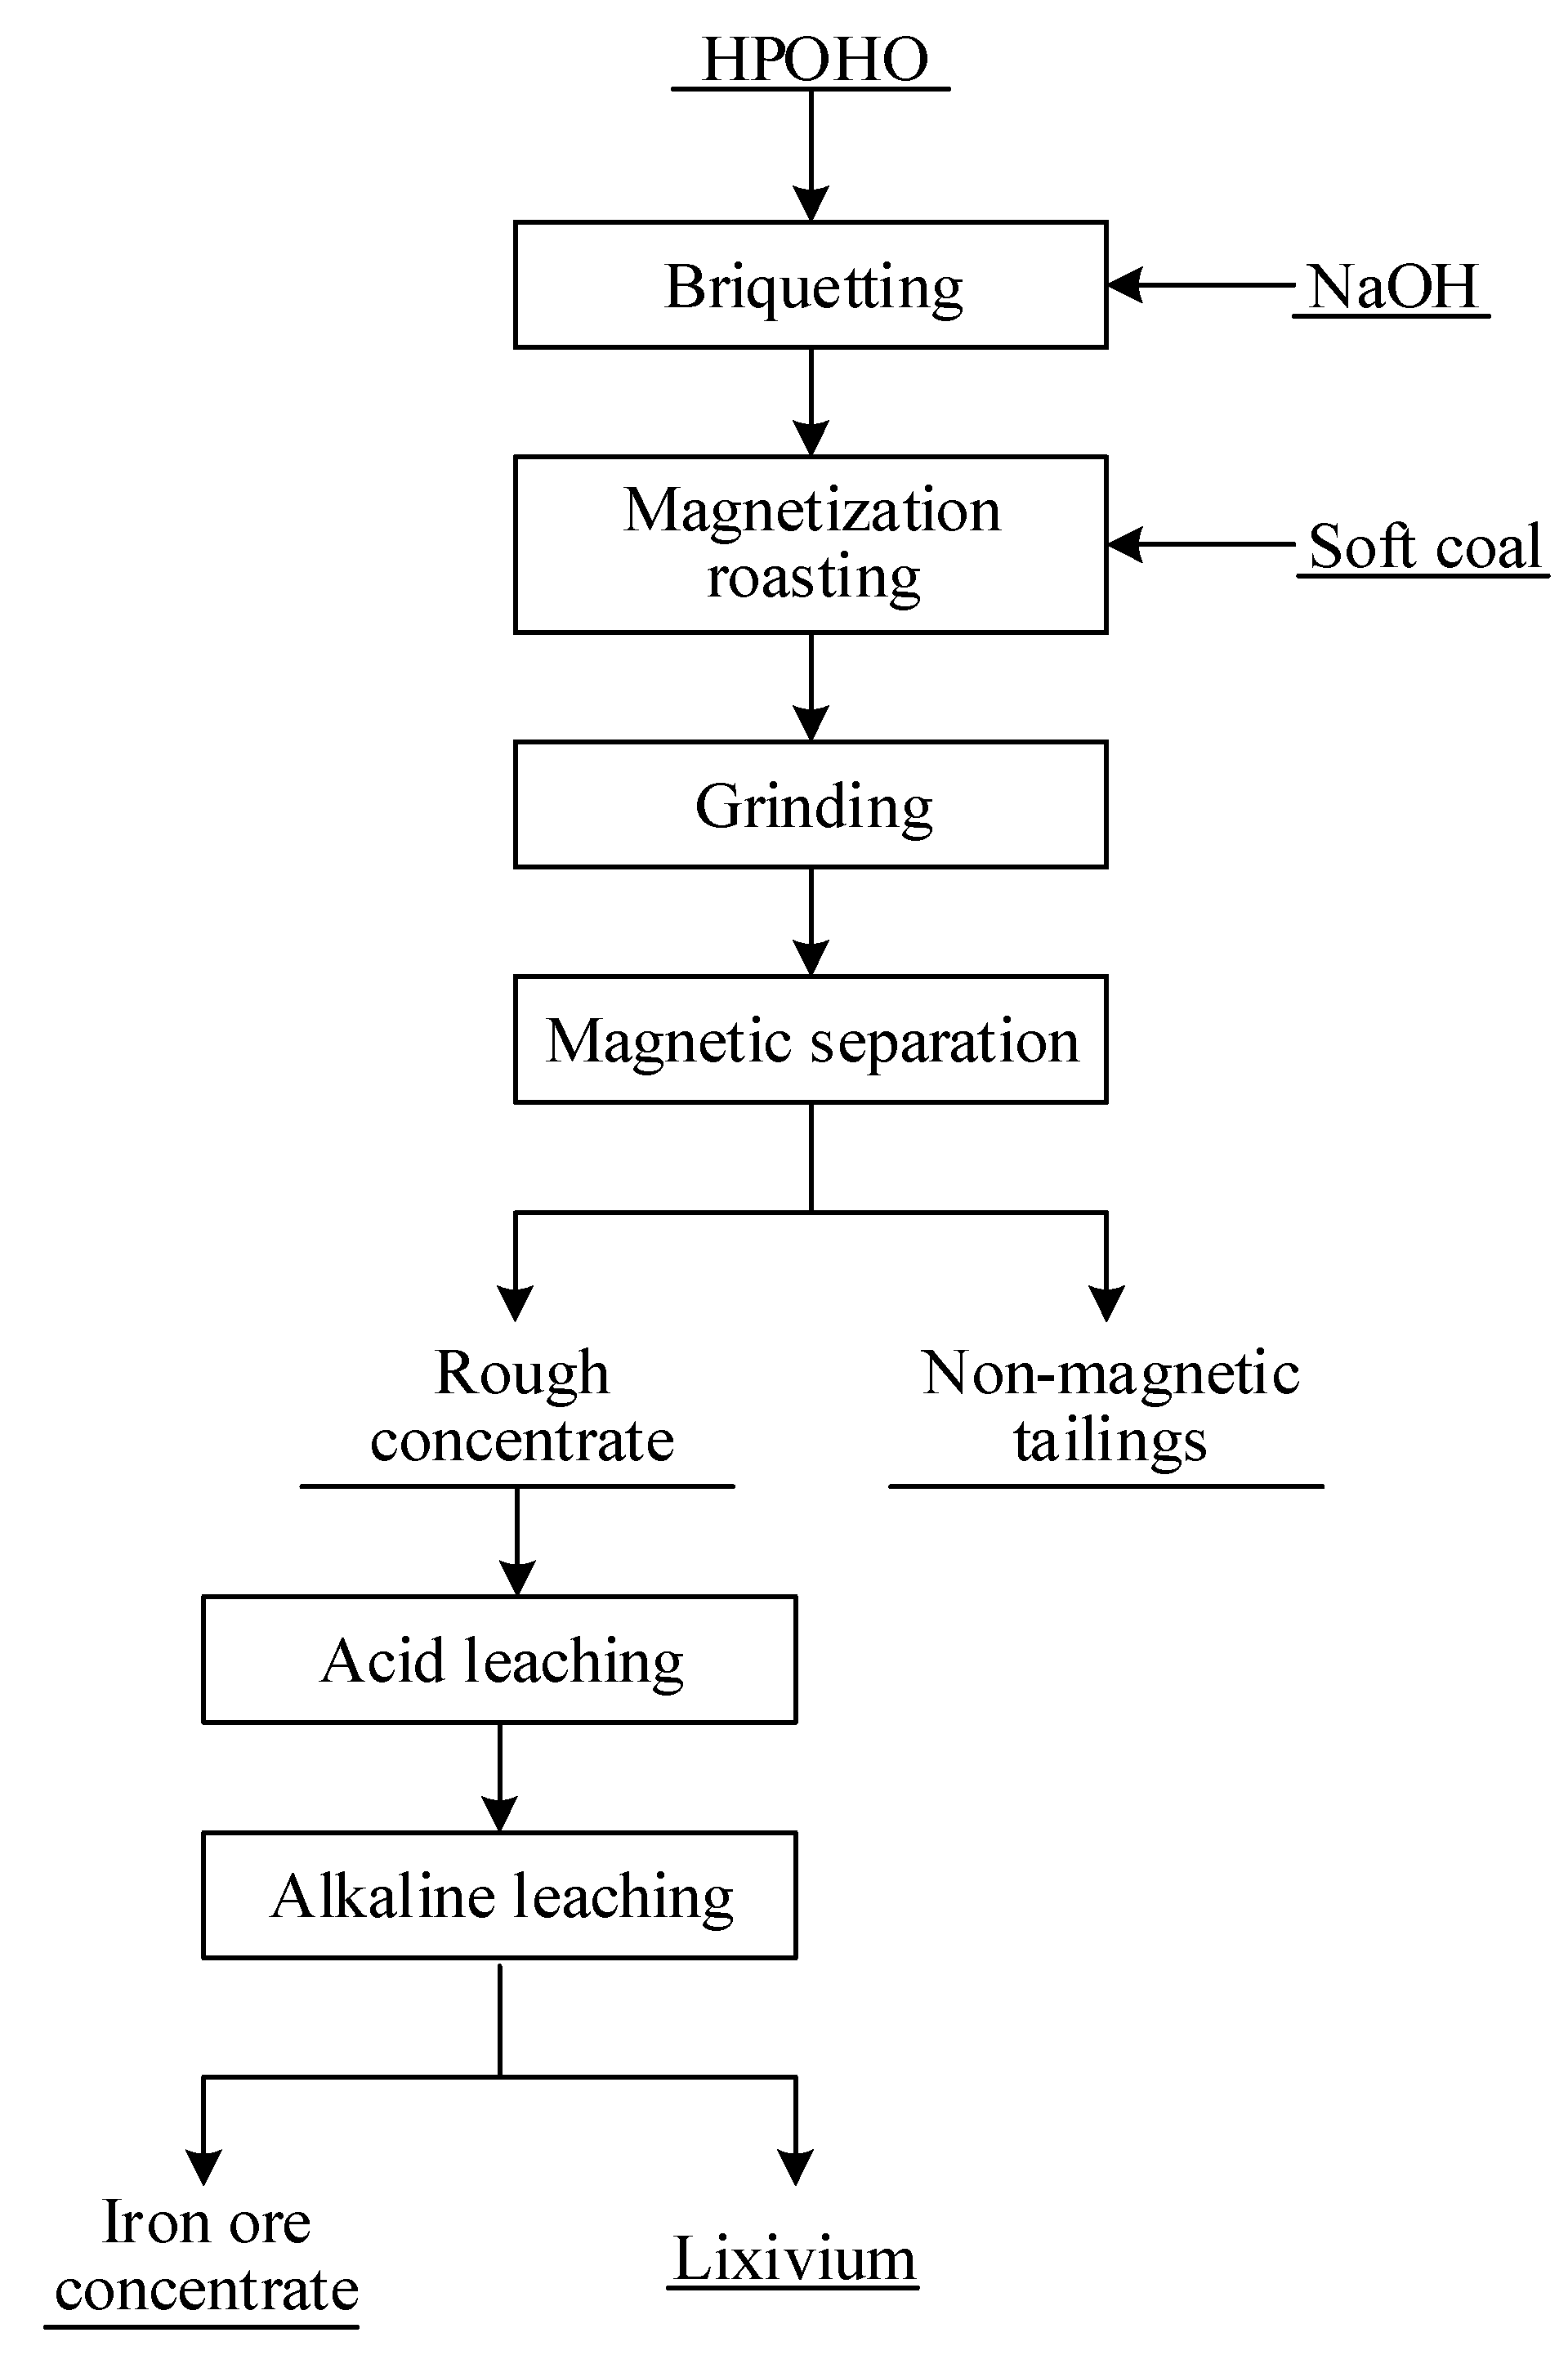
2.2.1. Magnetization Roasting–Magnetic Separation
2.2.2. Acid and Alkaline Leaching
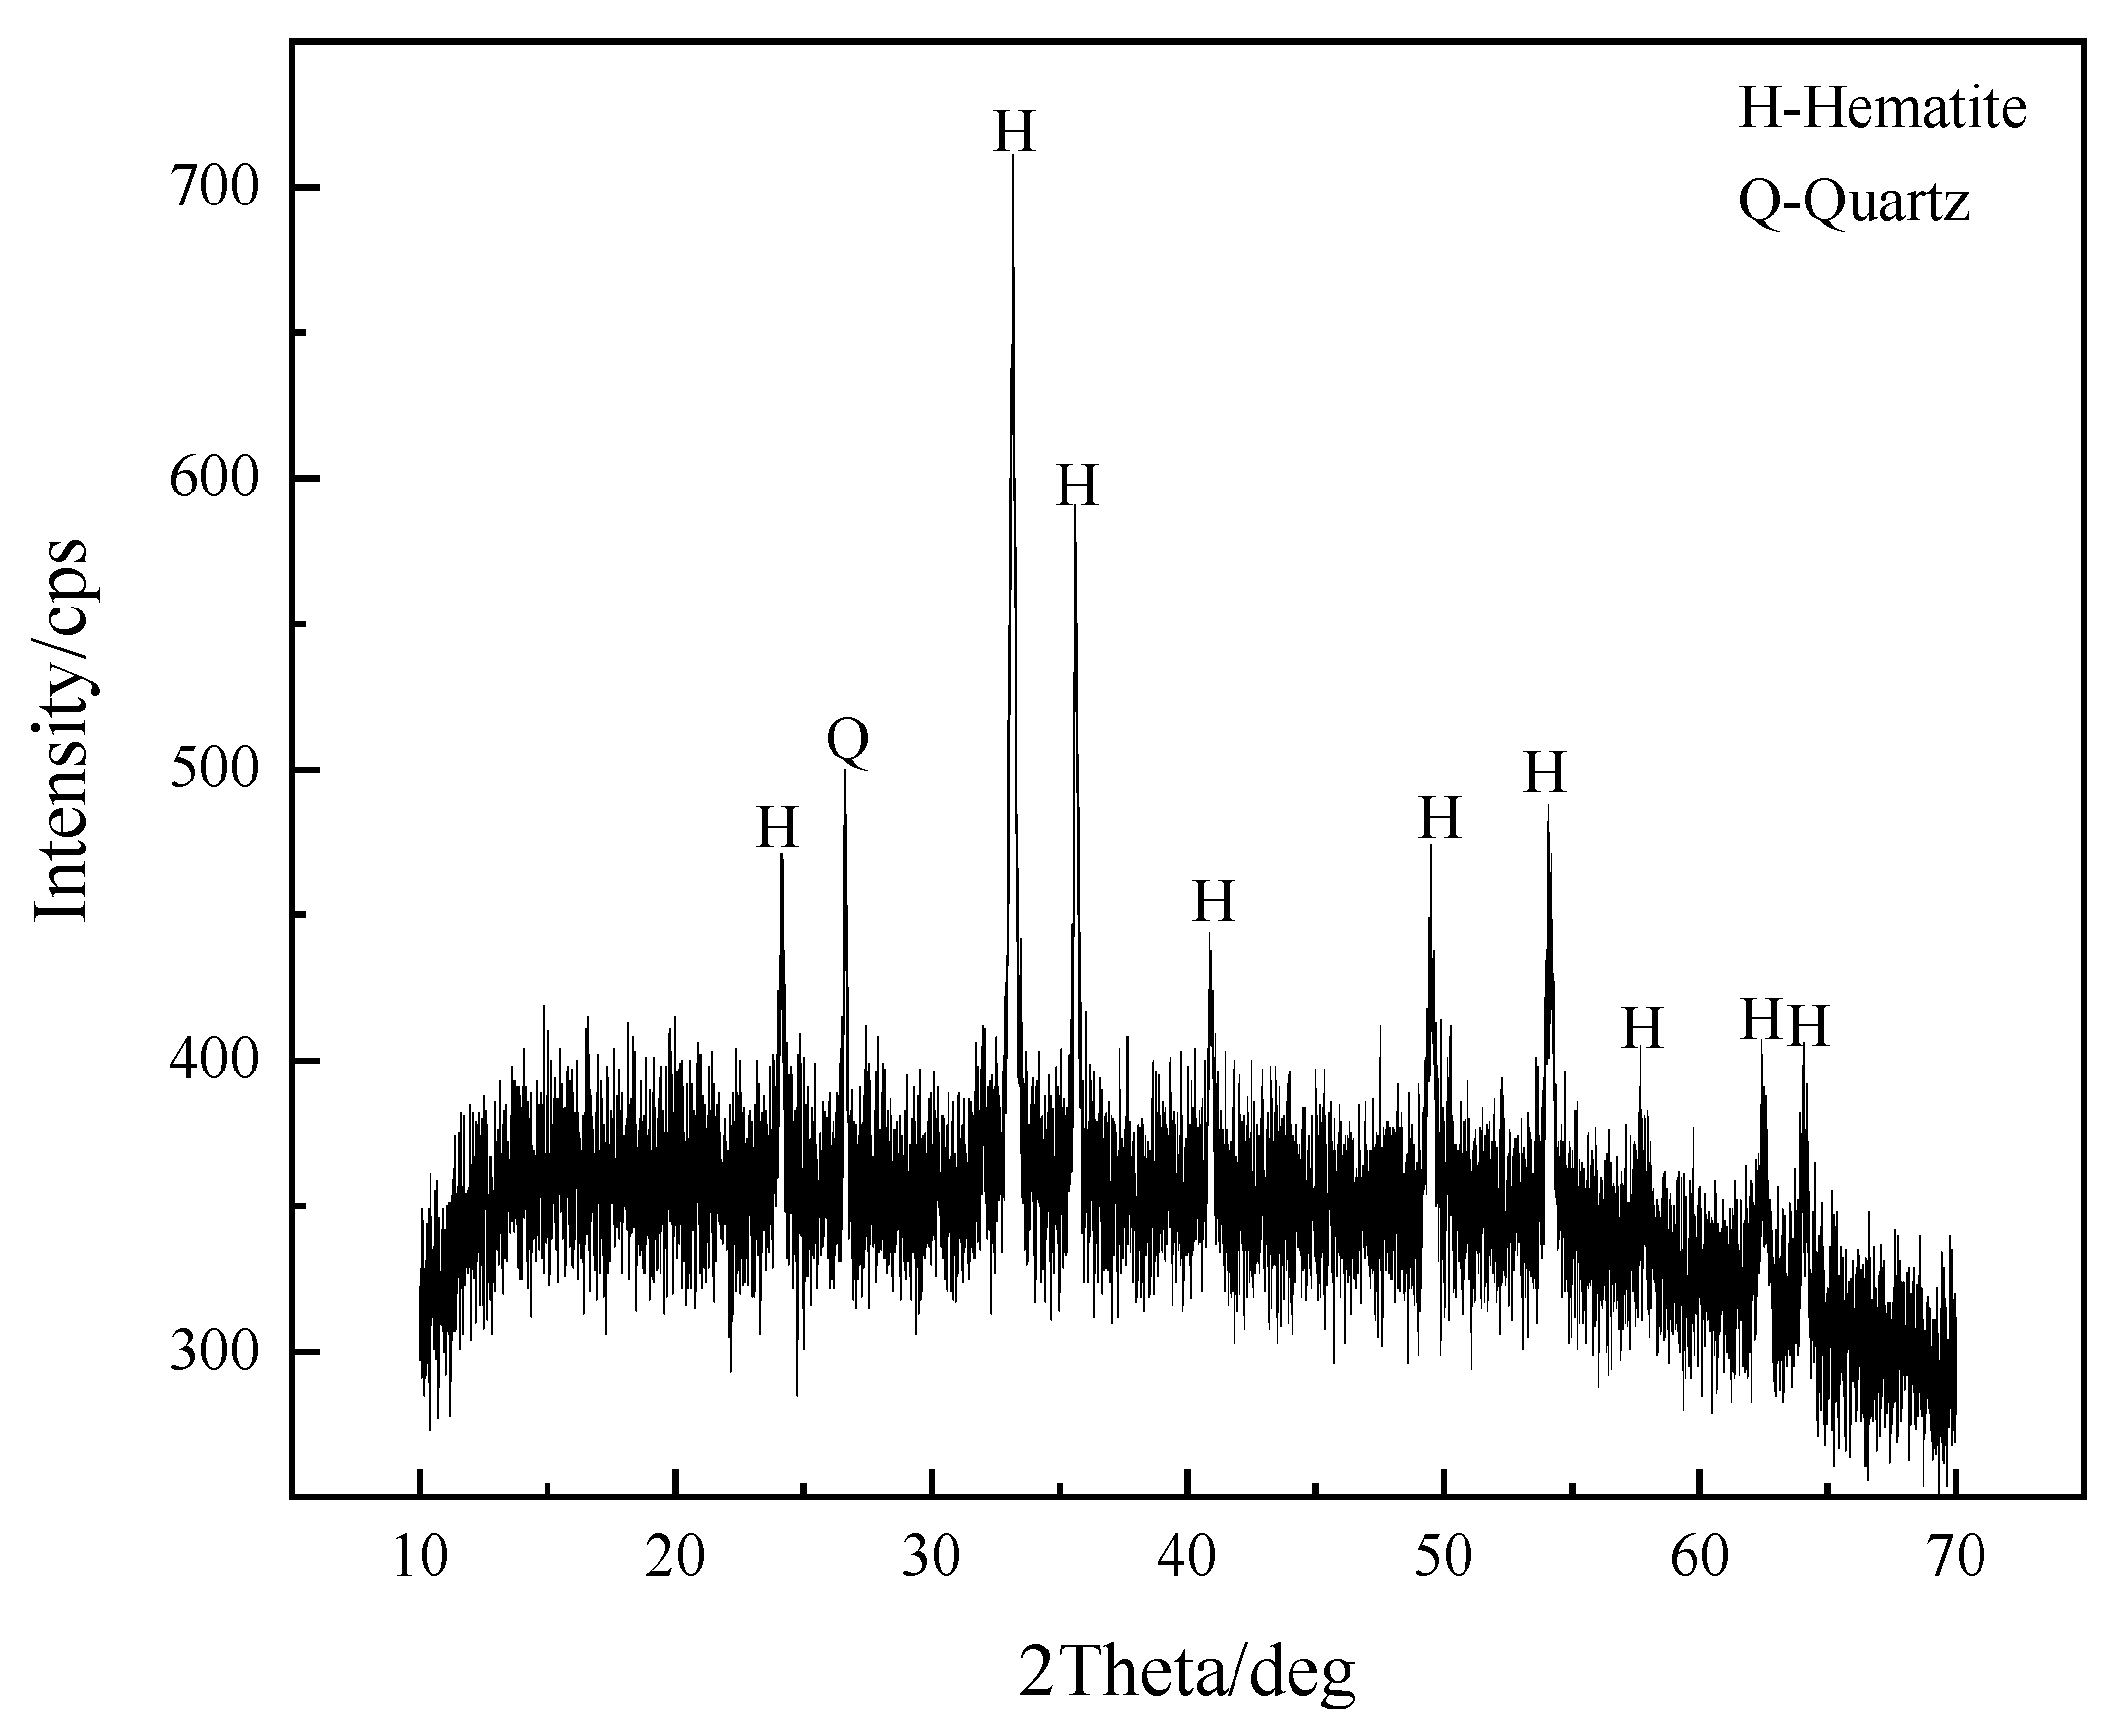
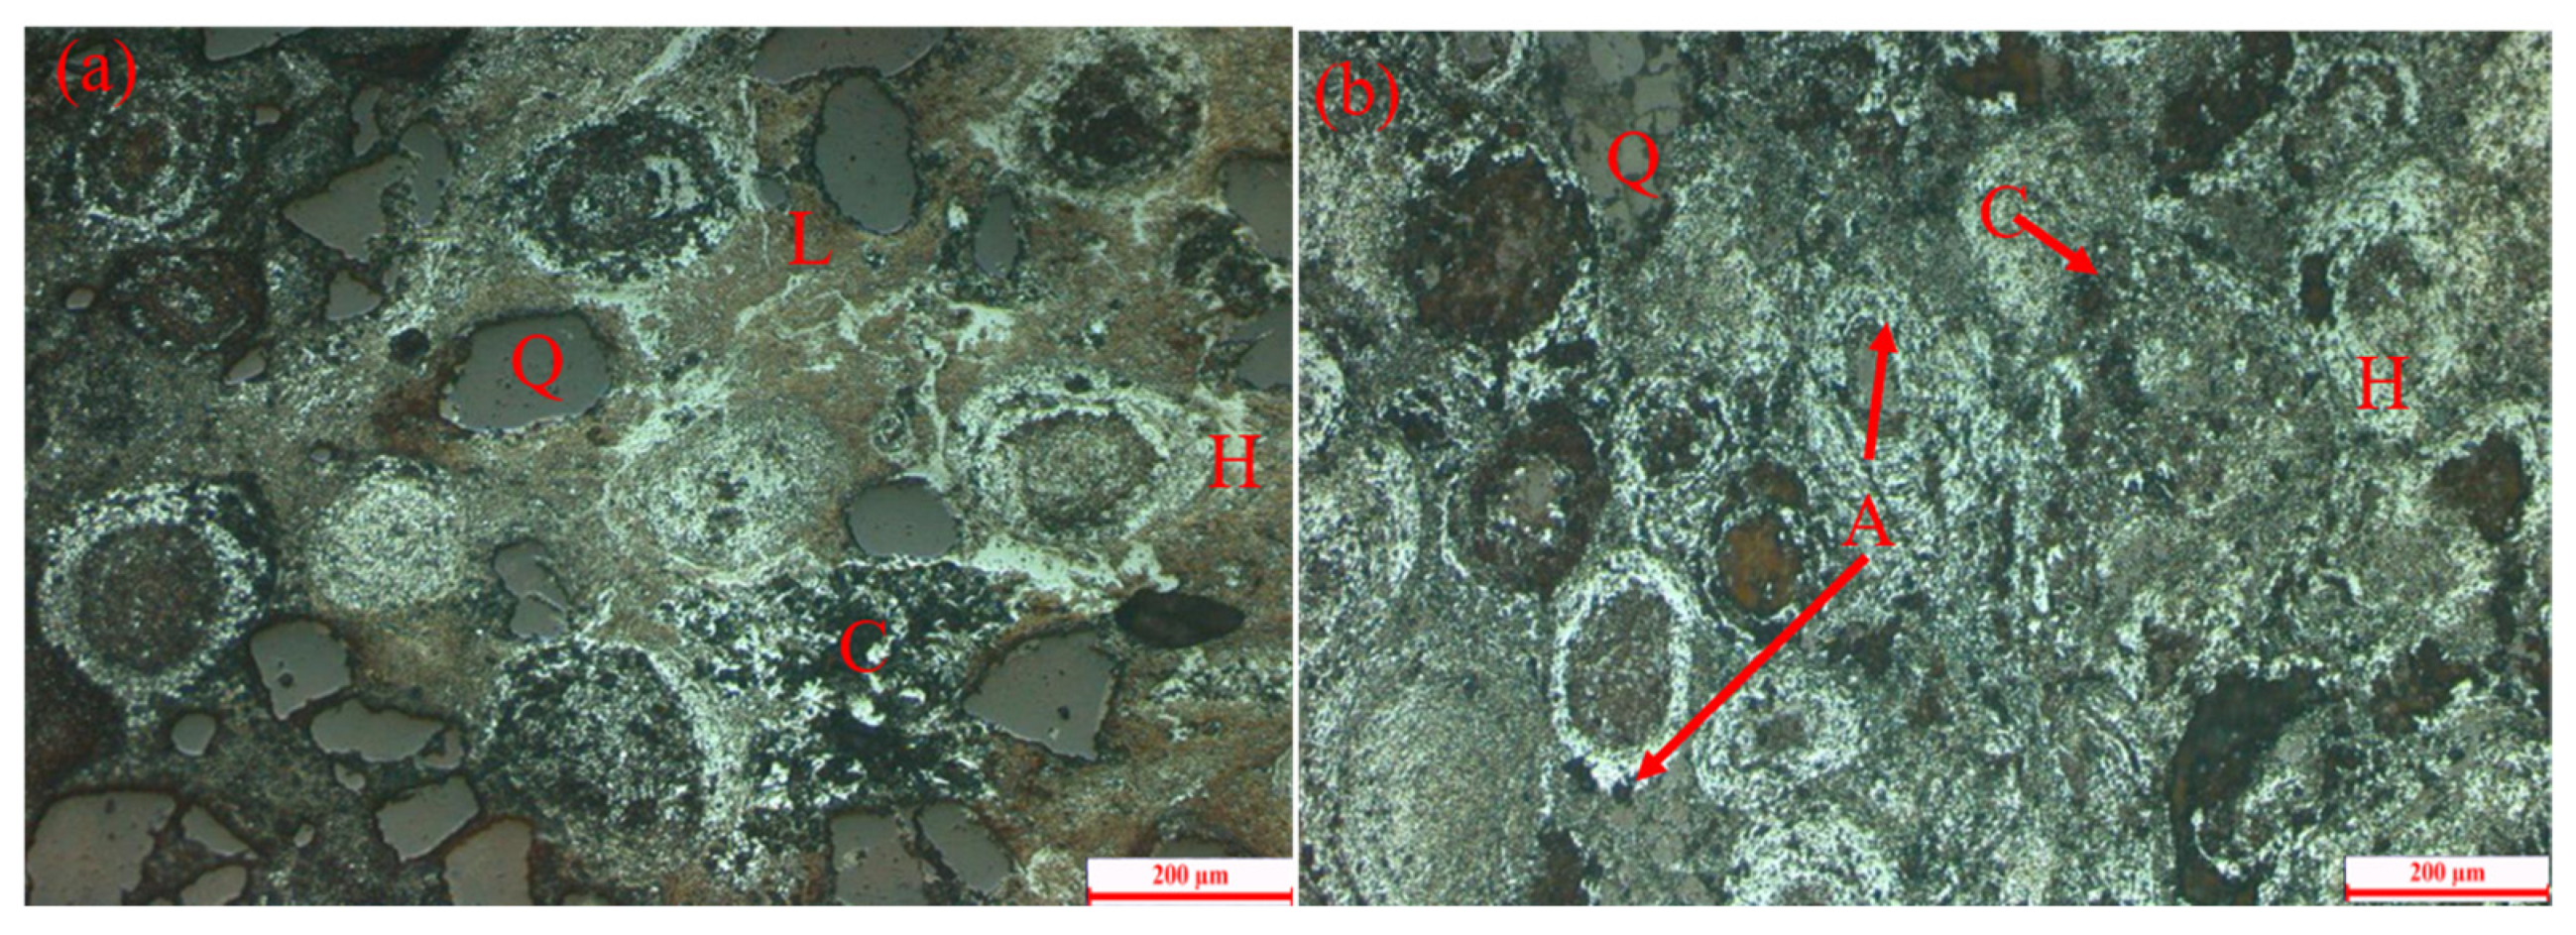
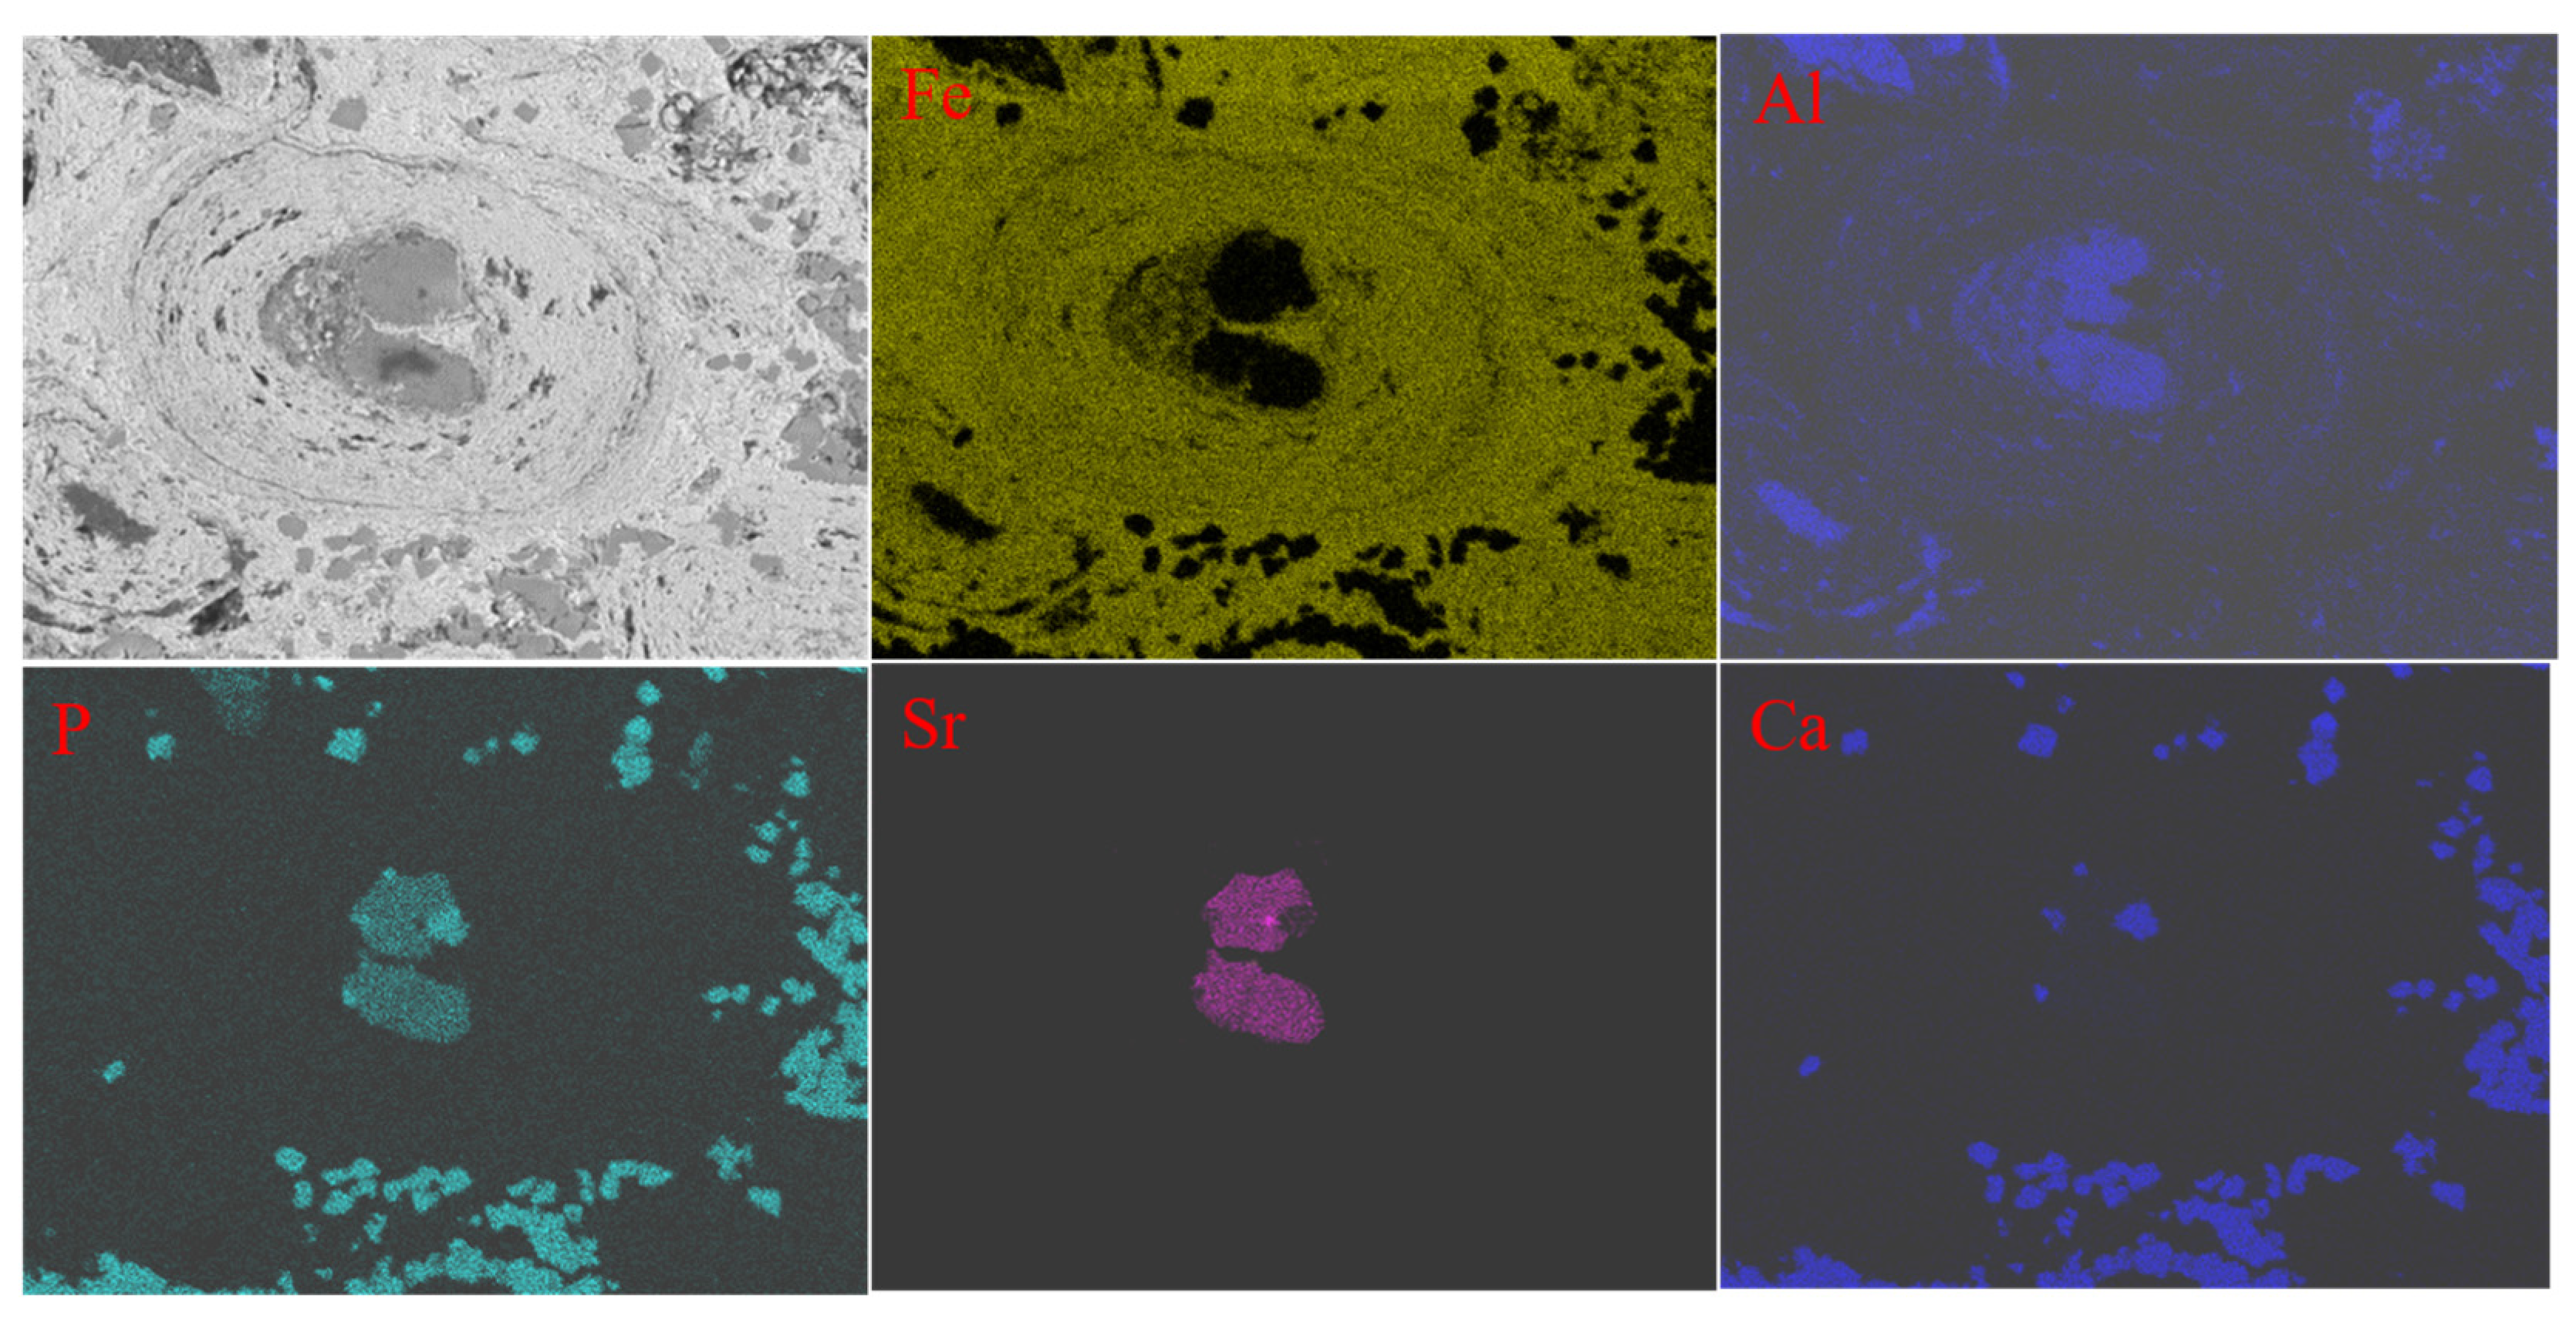
2.3. Characterization of Materials
3. Results and Discussion
3.1. Magnetization Roasting–Magnetic Separation Process
3.2. Acid and Alkaline Leaching of Rough Magnetic Concentrate
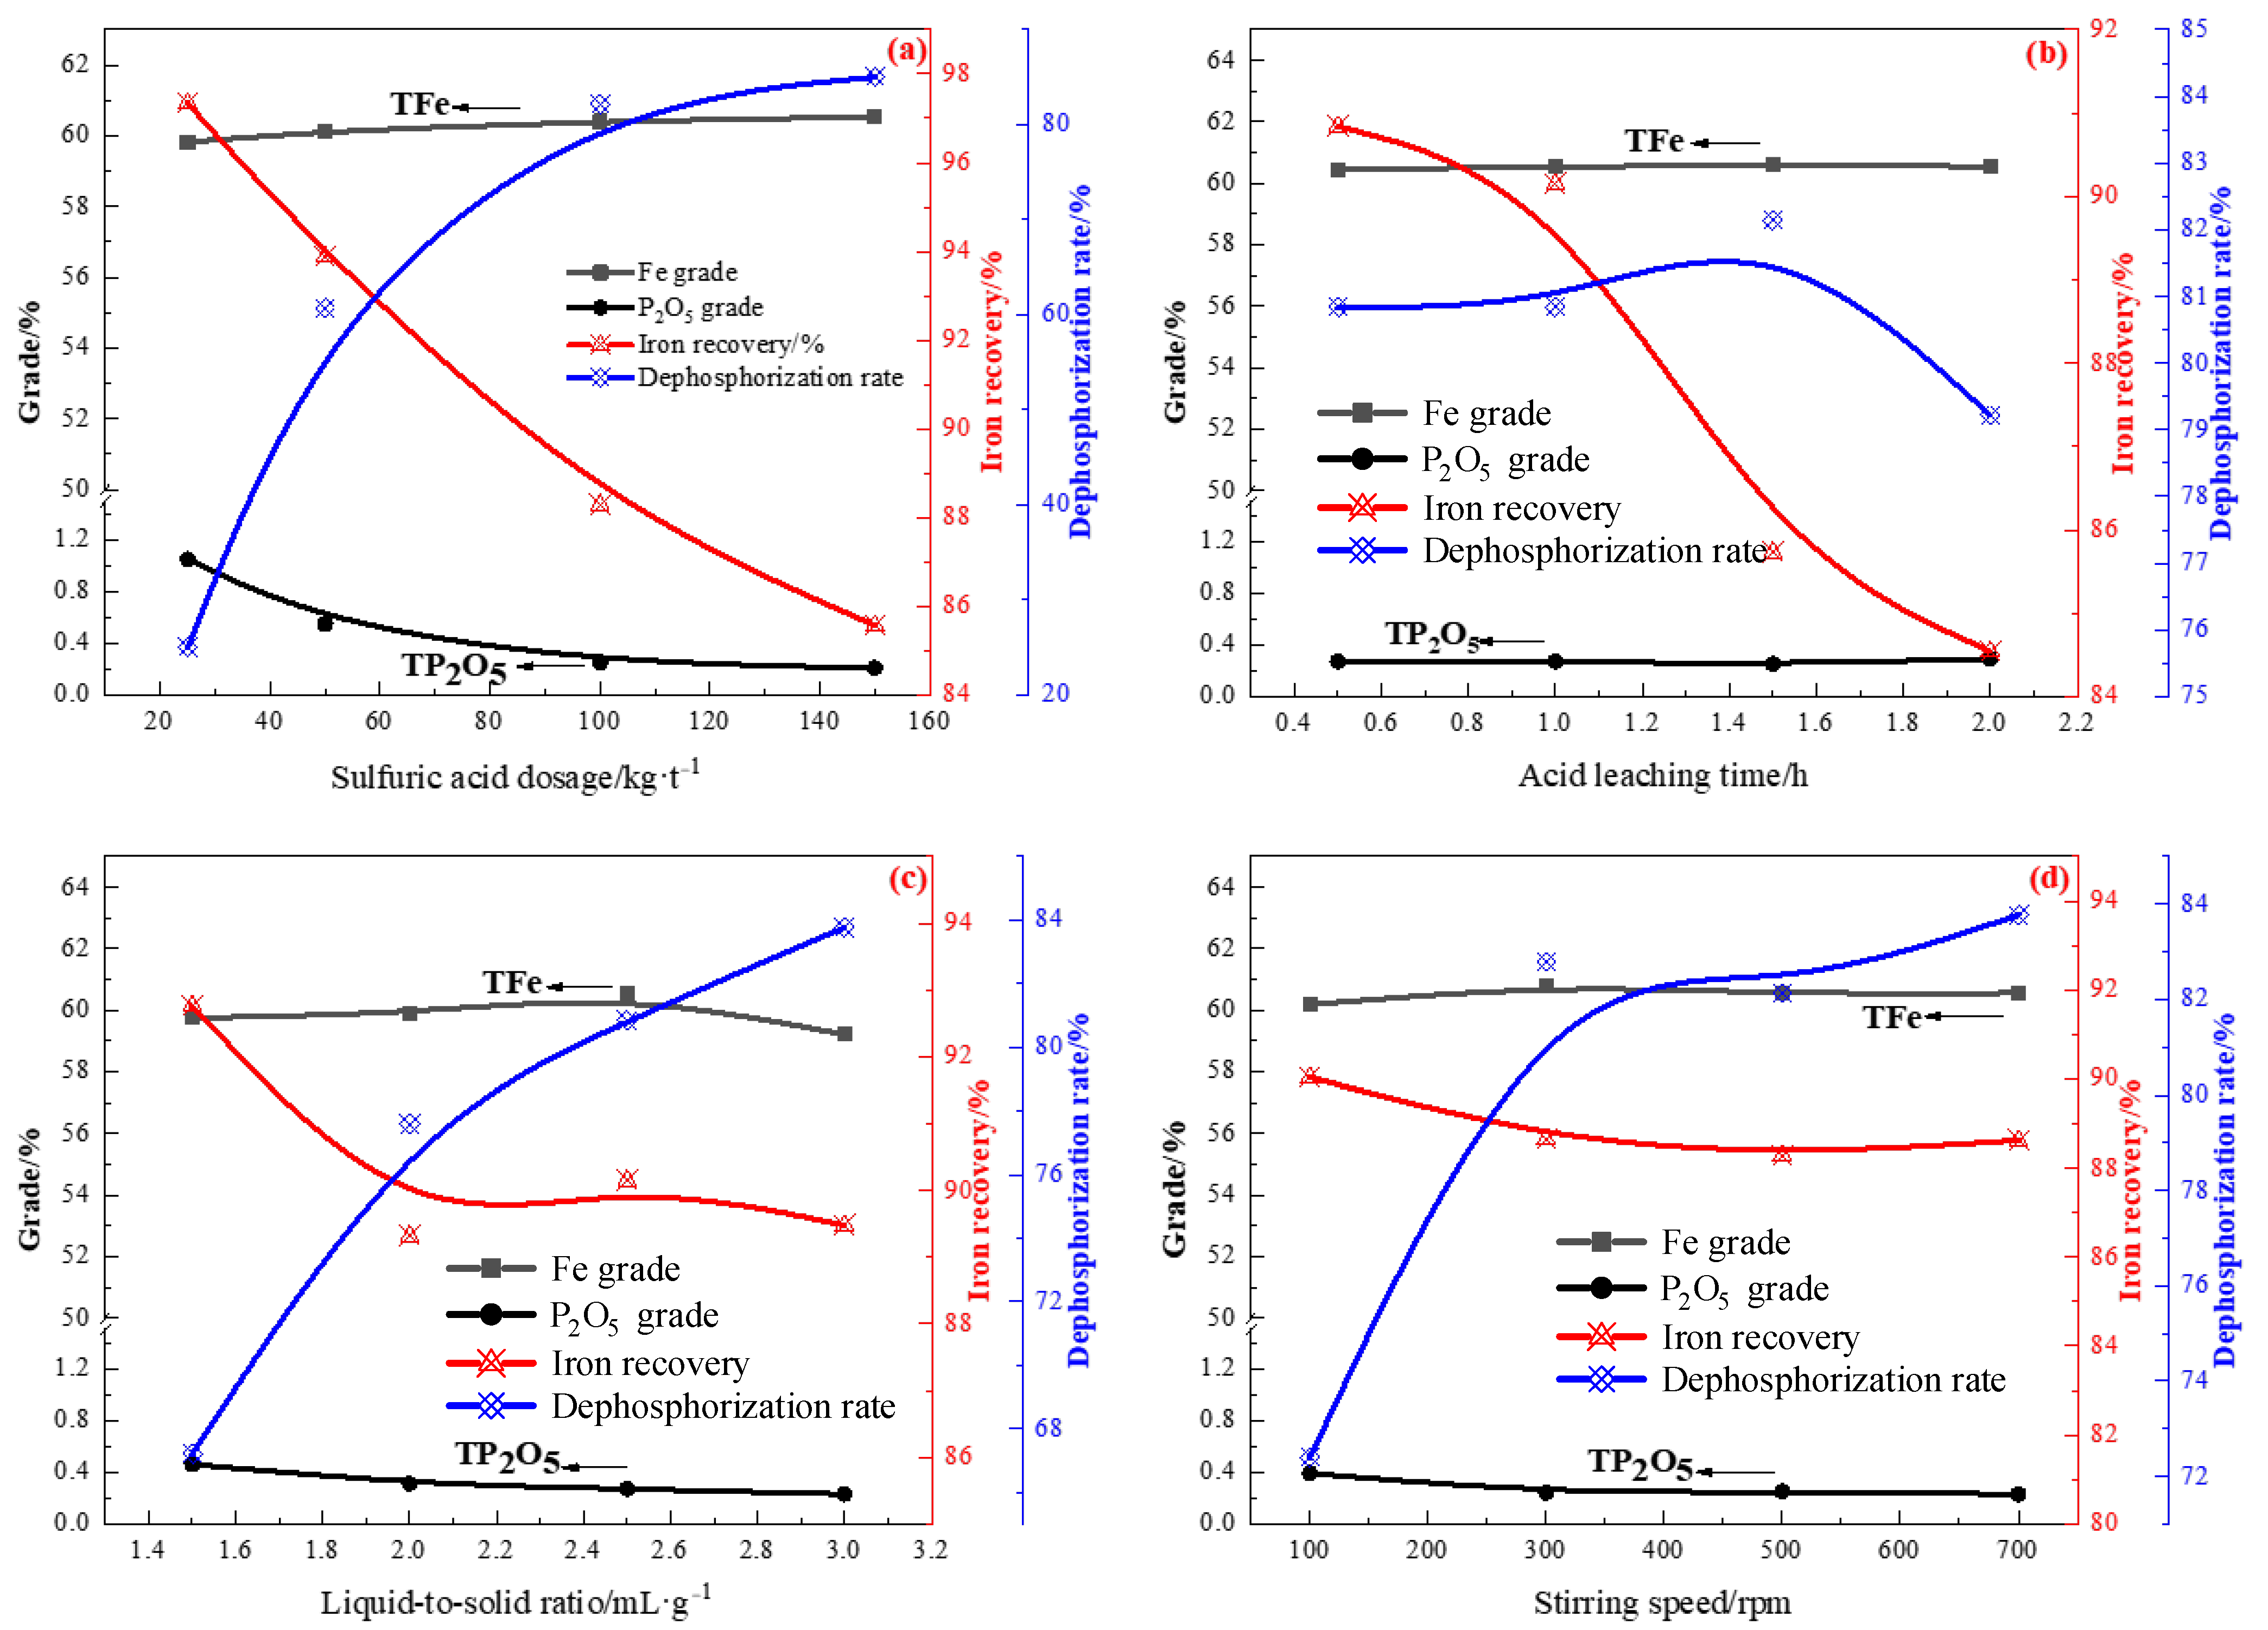
3.2.1. Acid Leaching of the Rough Concentrate
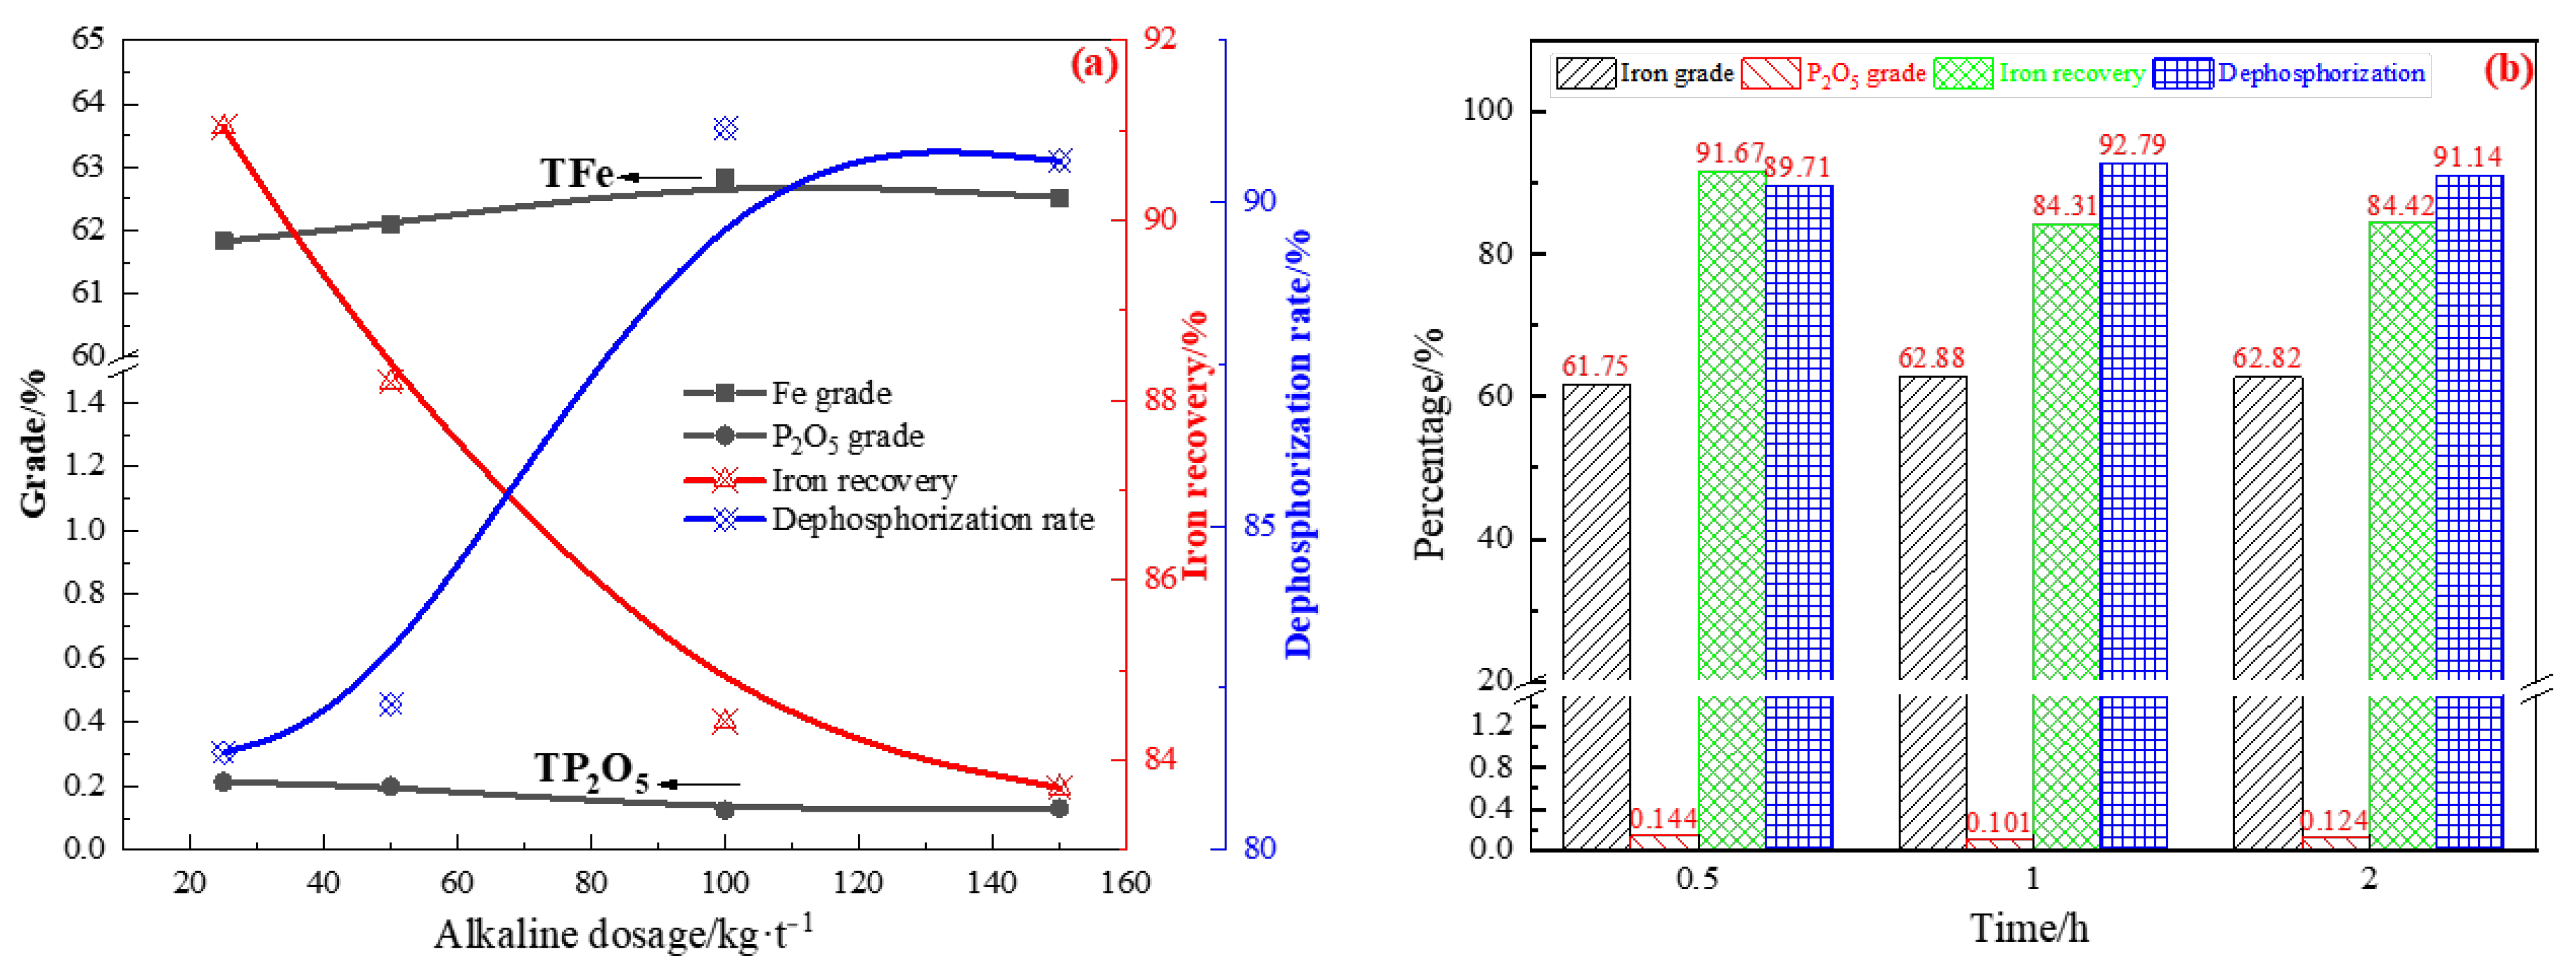
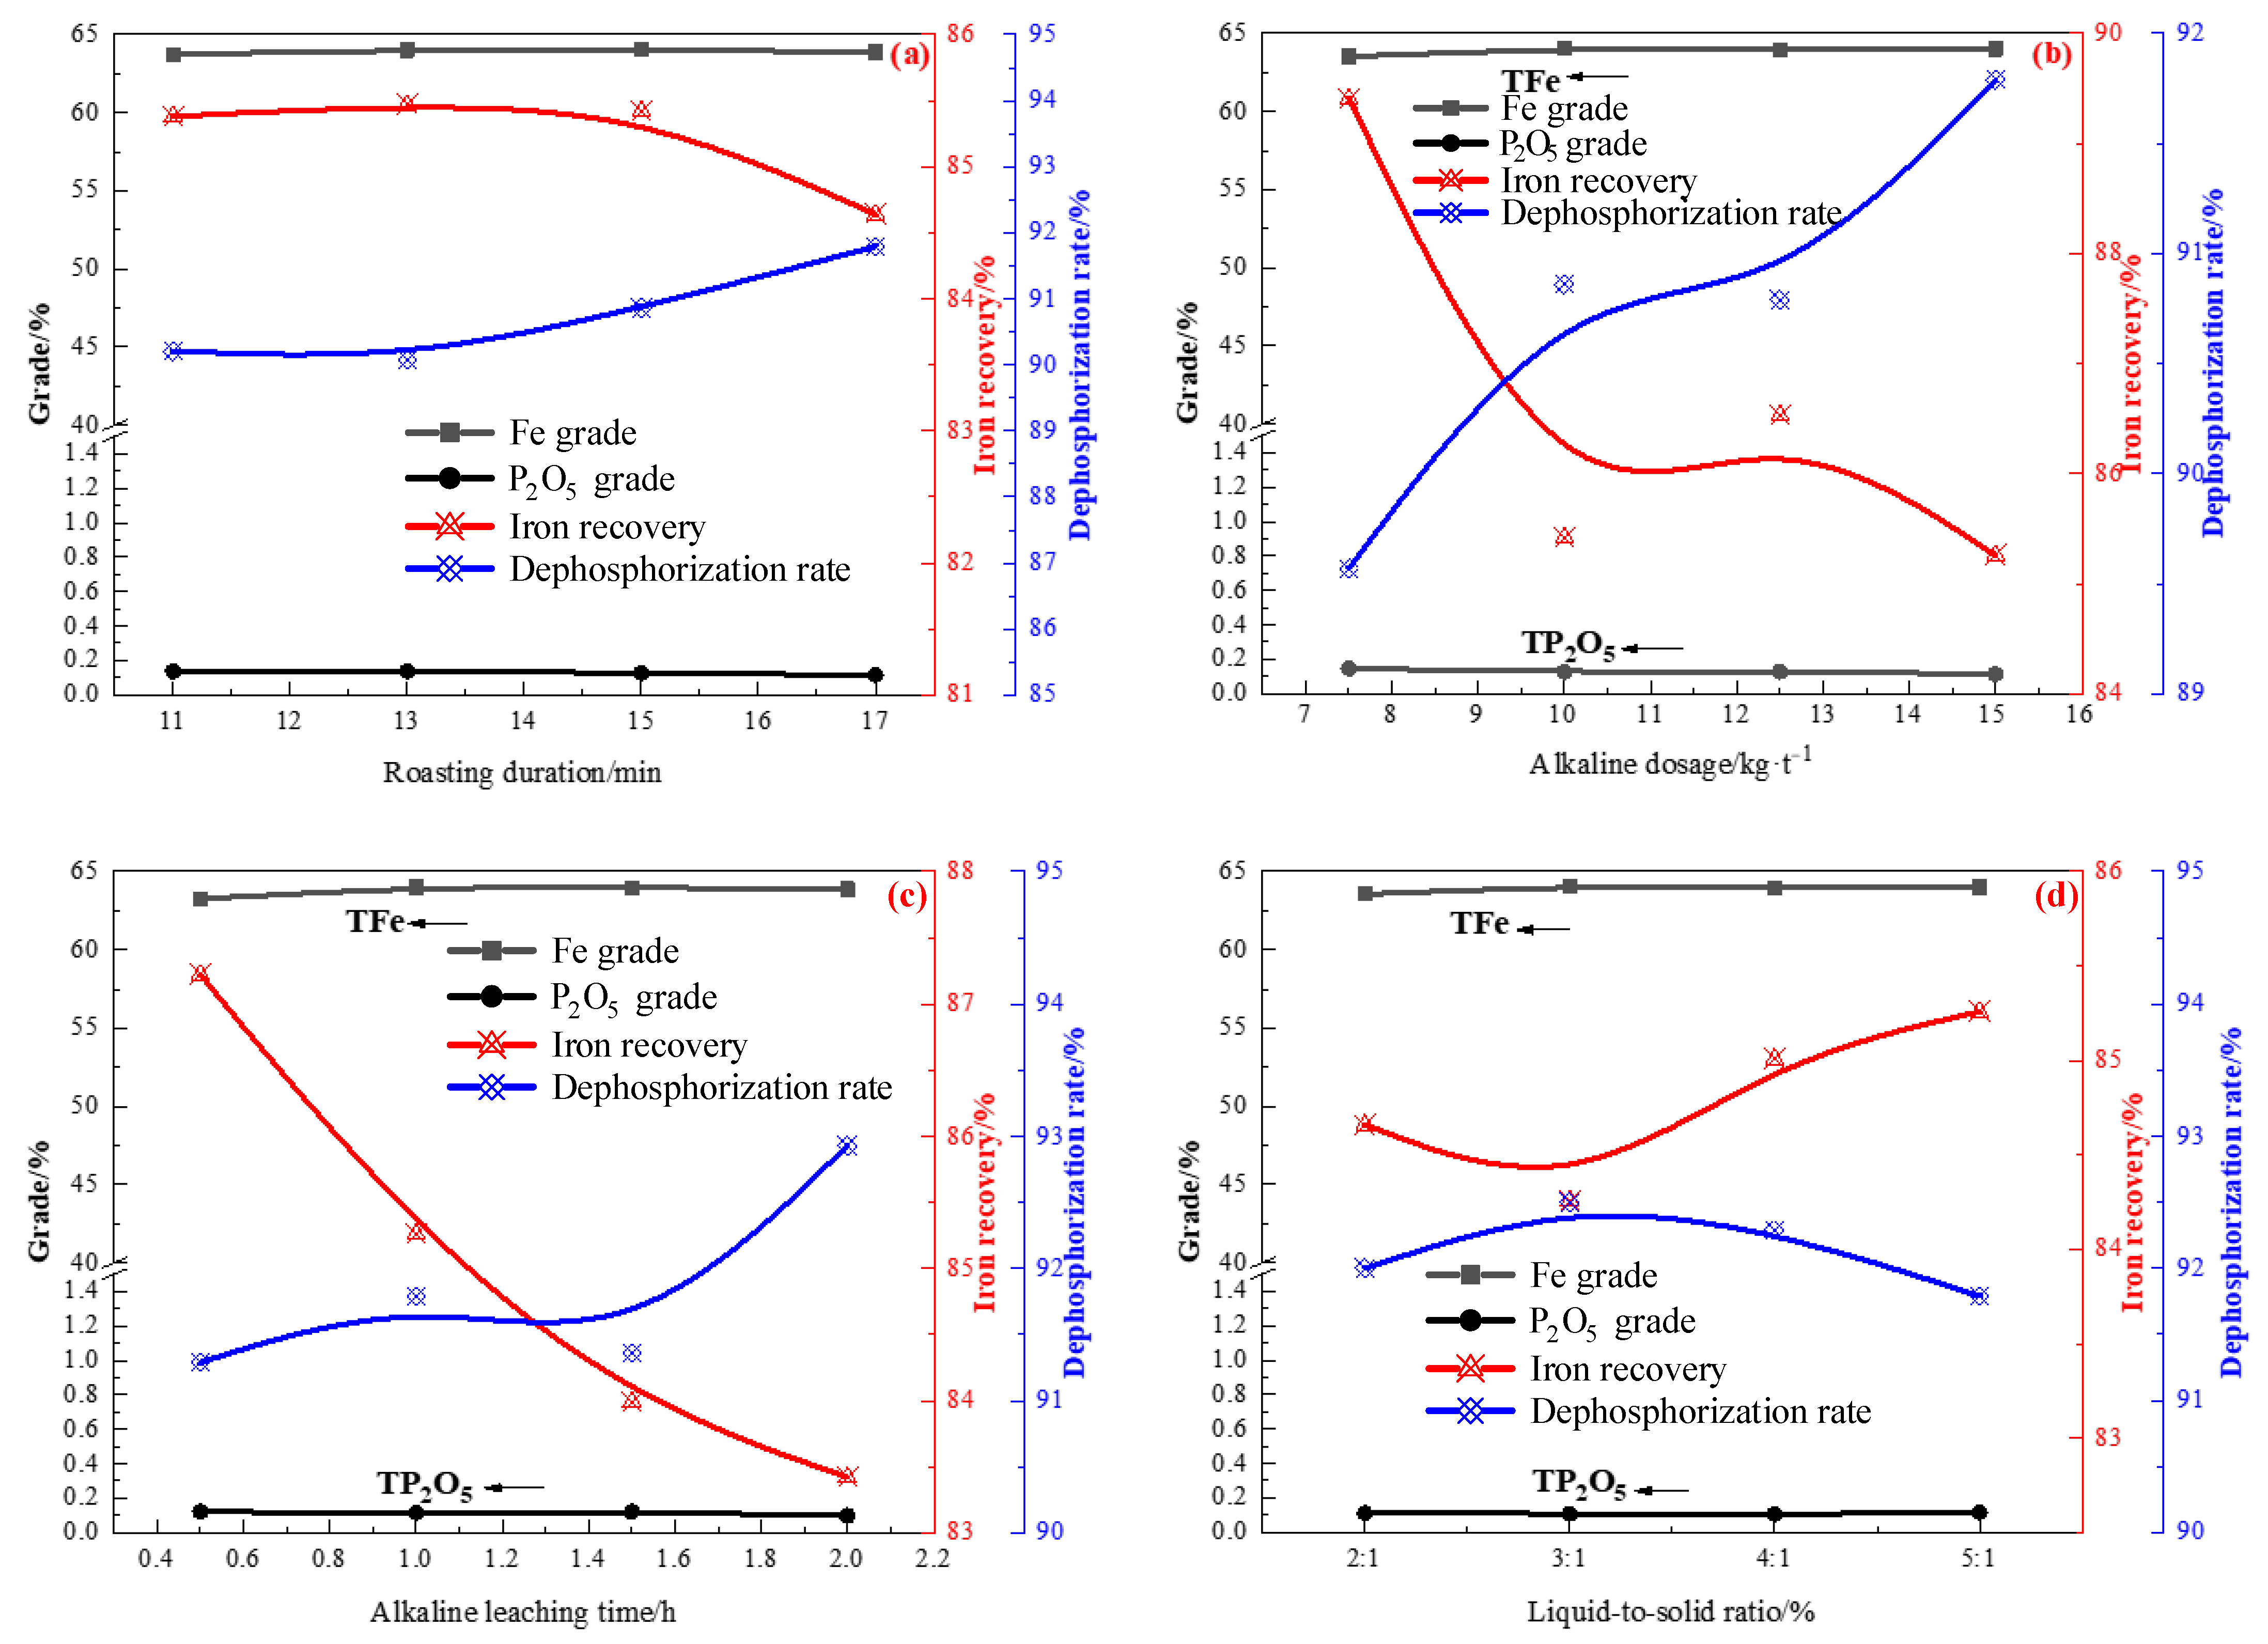
3.2.2. Alkaline Leaching of the Leached Concentrated
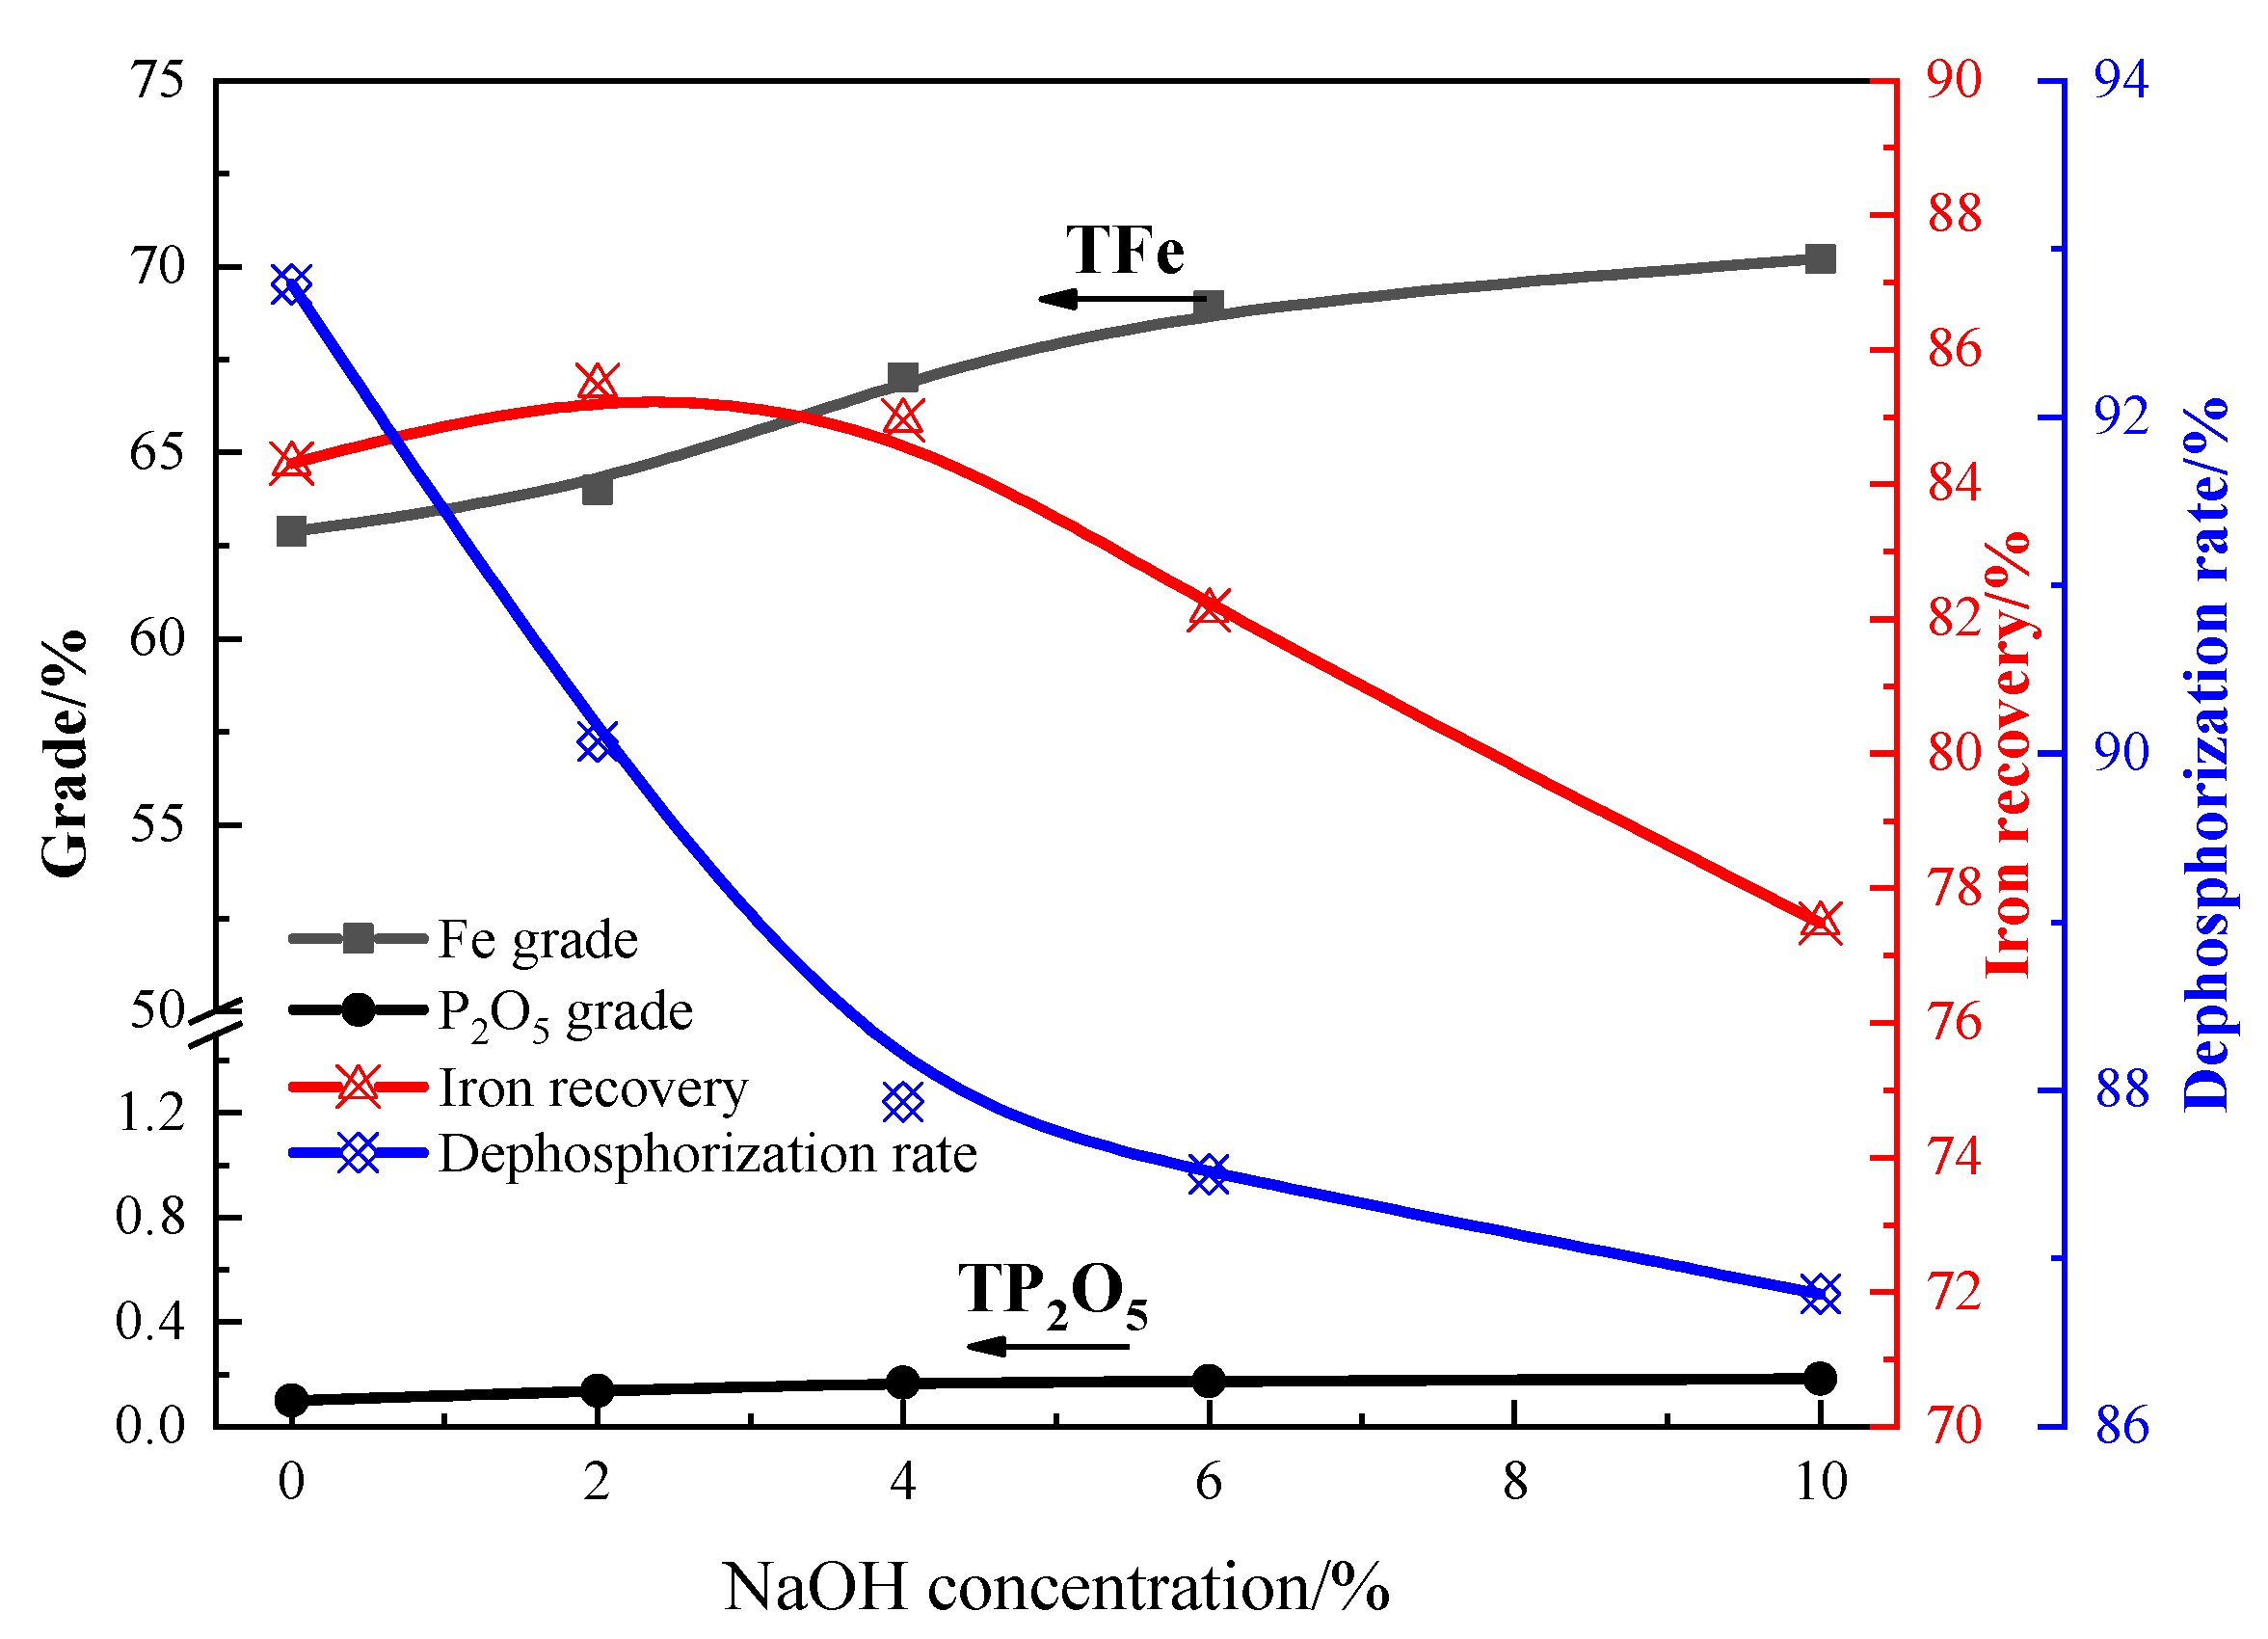
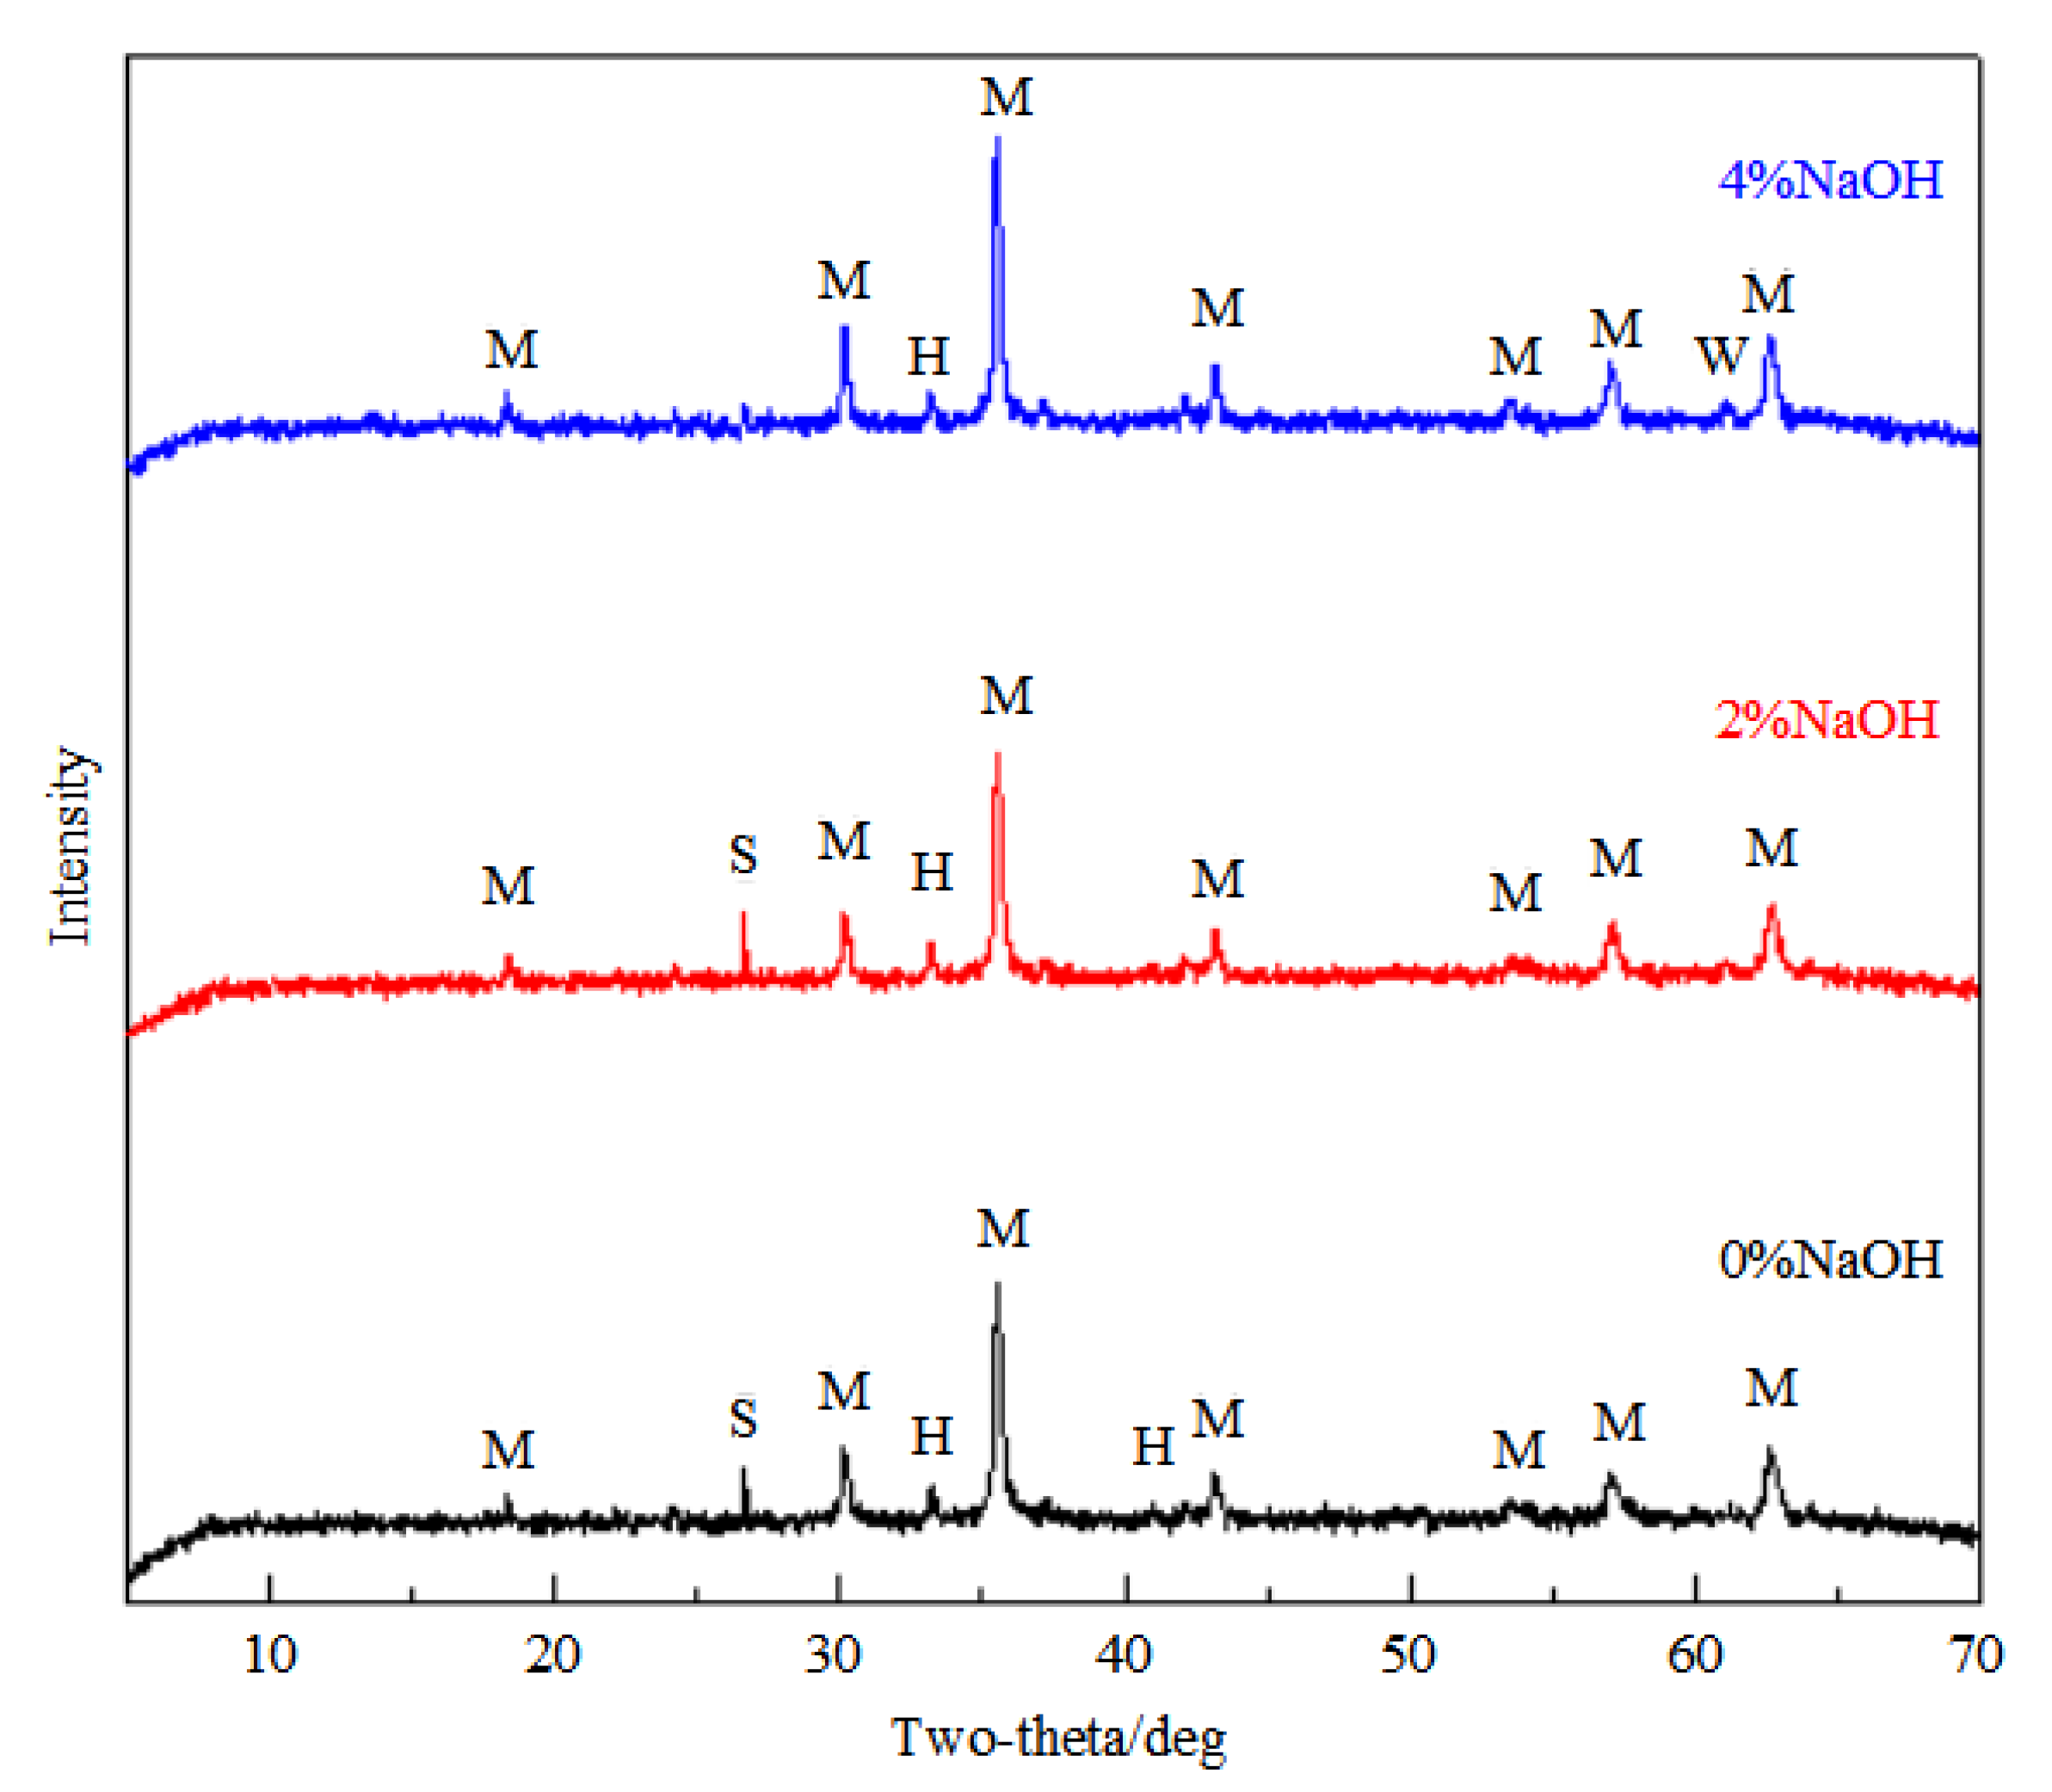
3.3. Sodium Magnetization Roasting
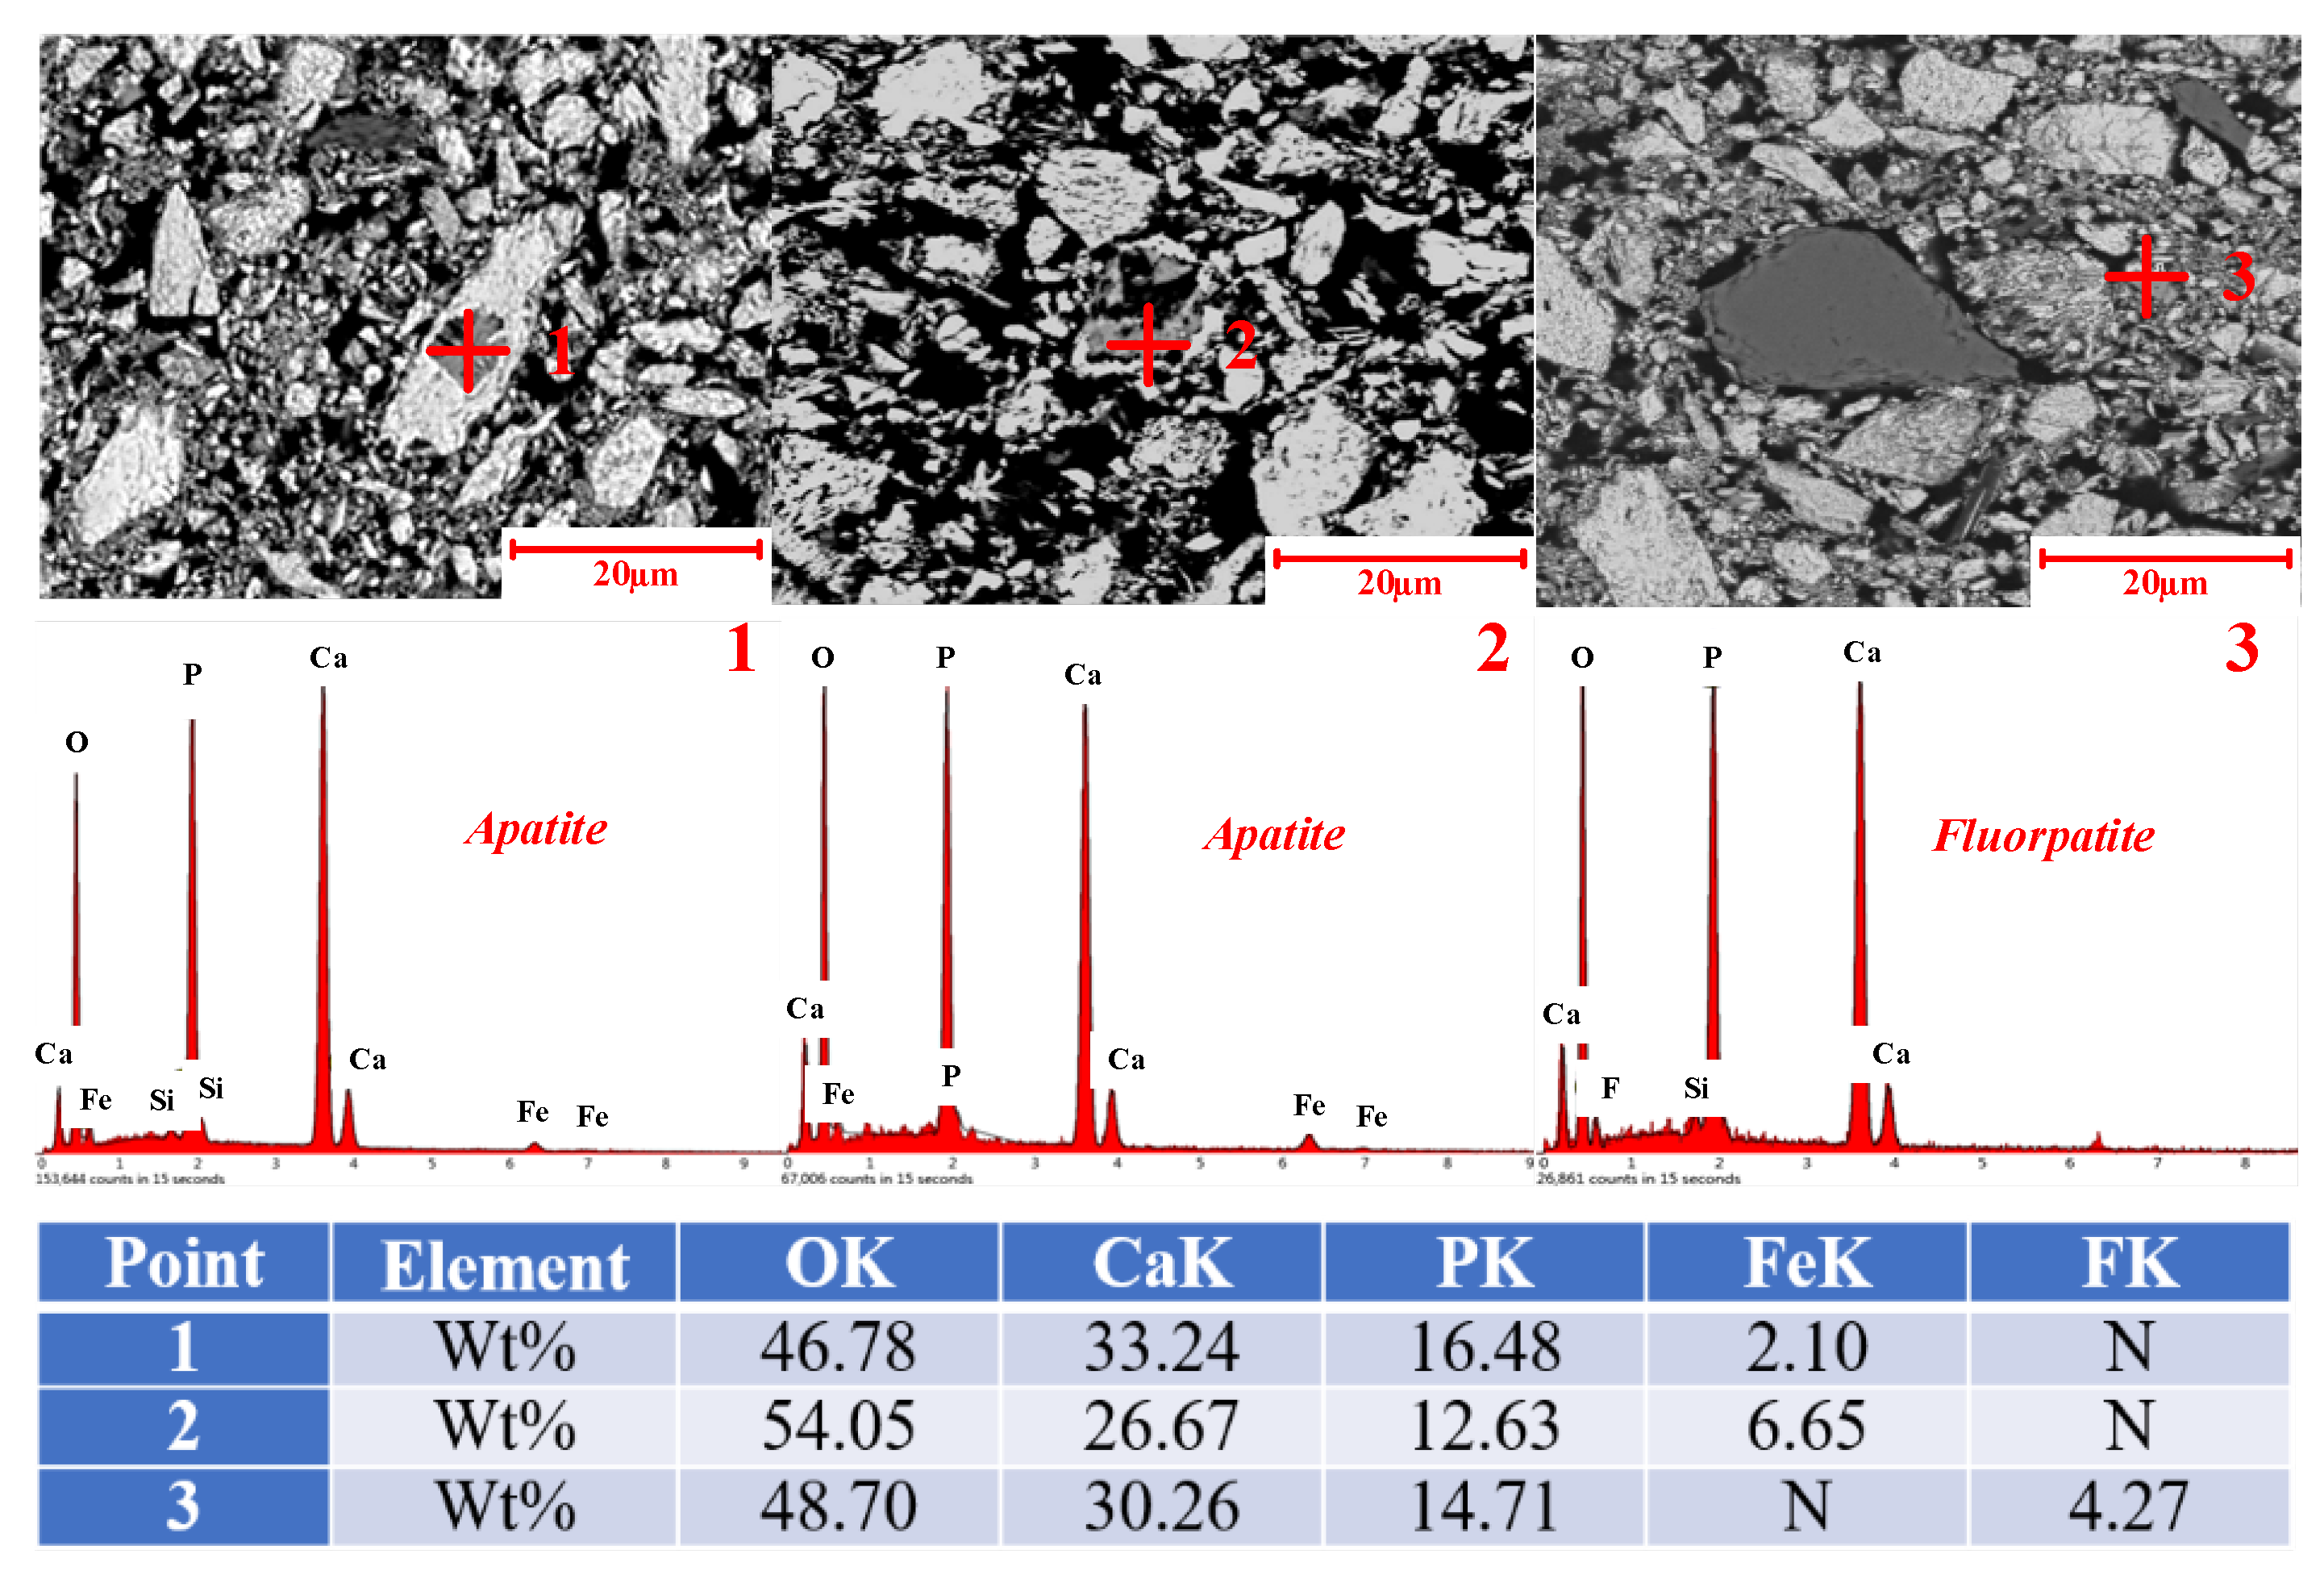
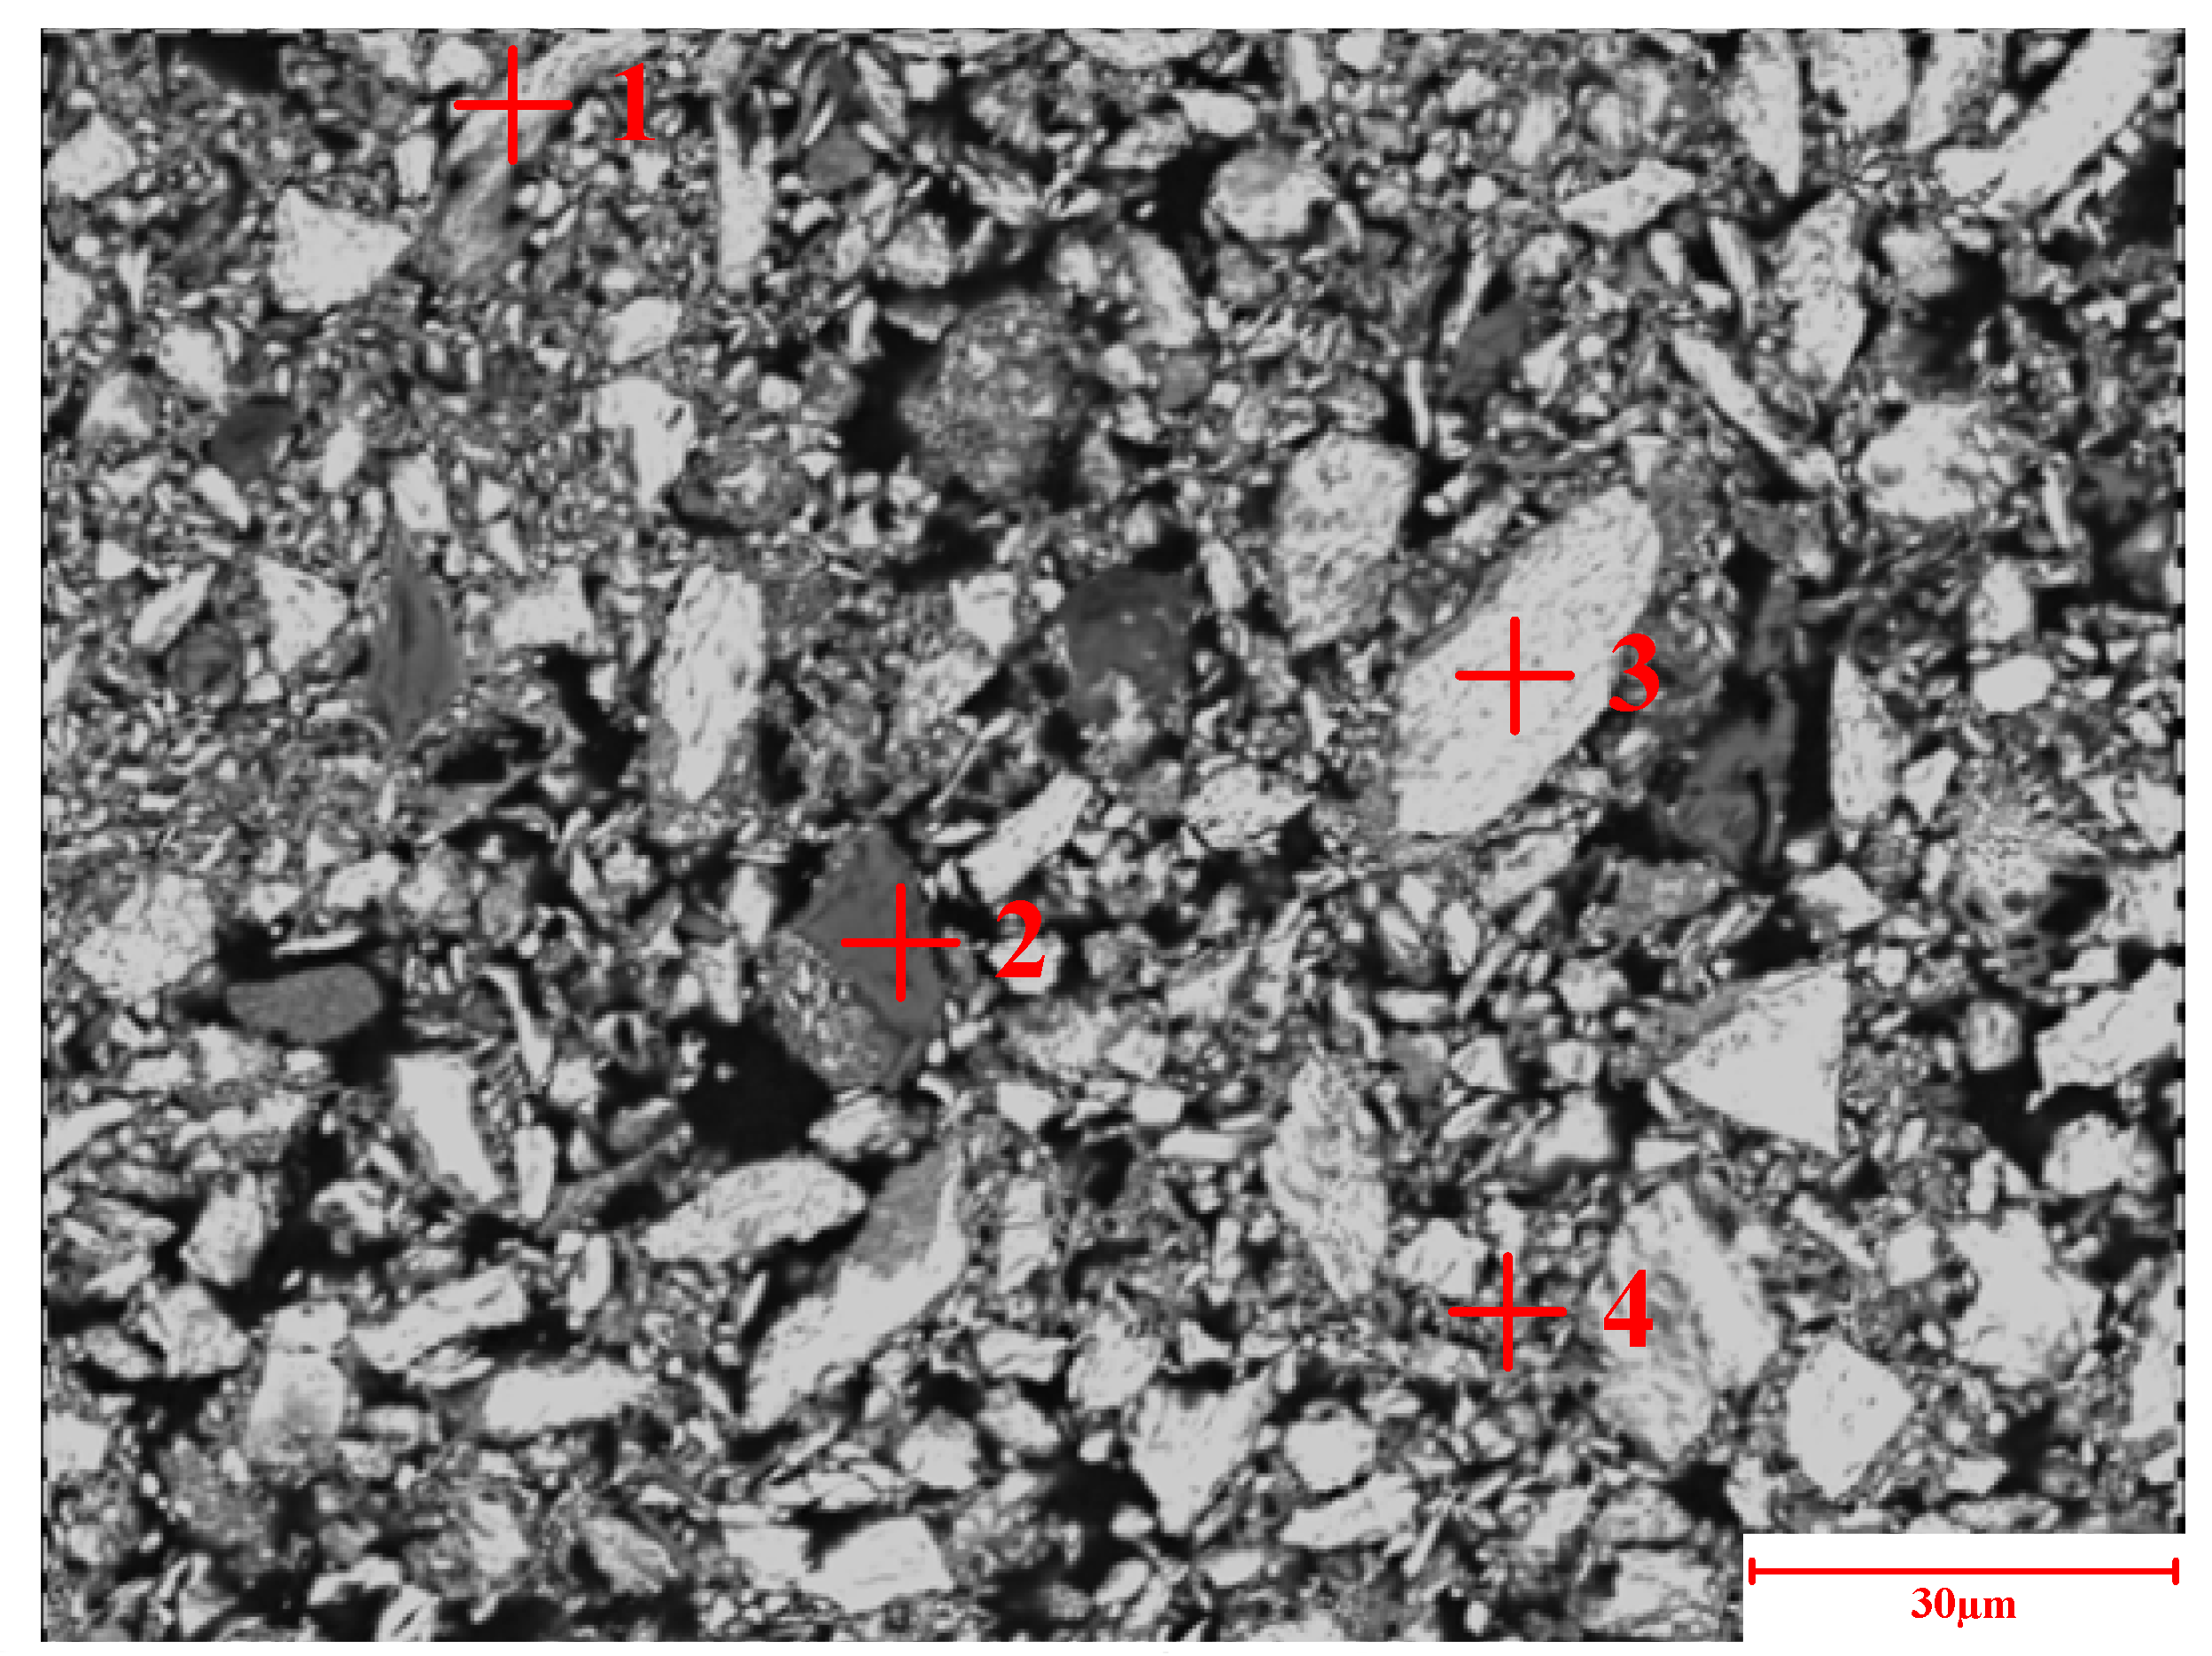
3.4. Characterization of the Iron Ore Concentrate
4. Conclusions
- (1)
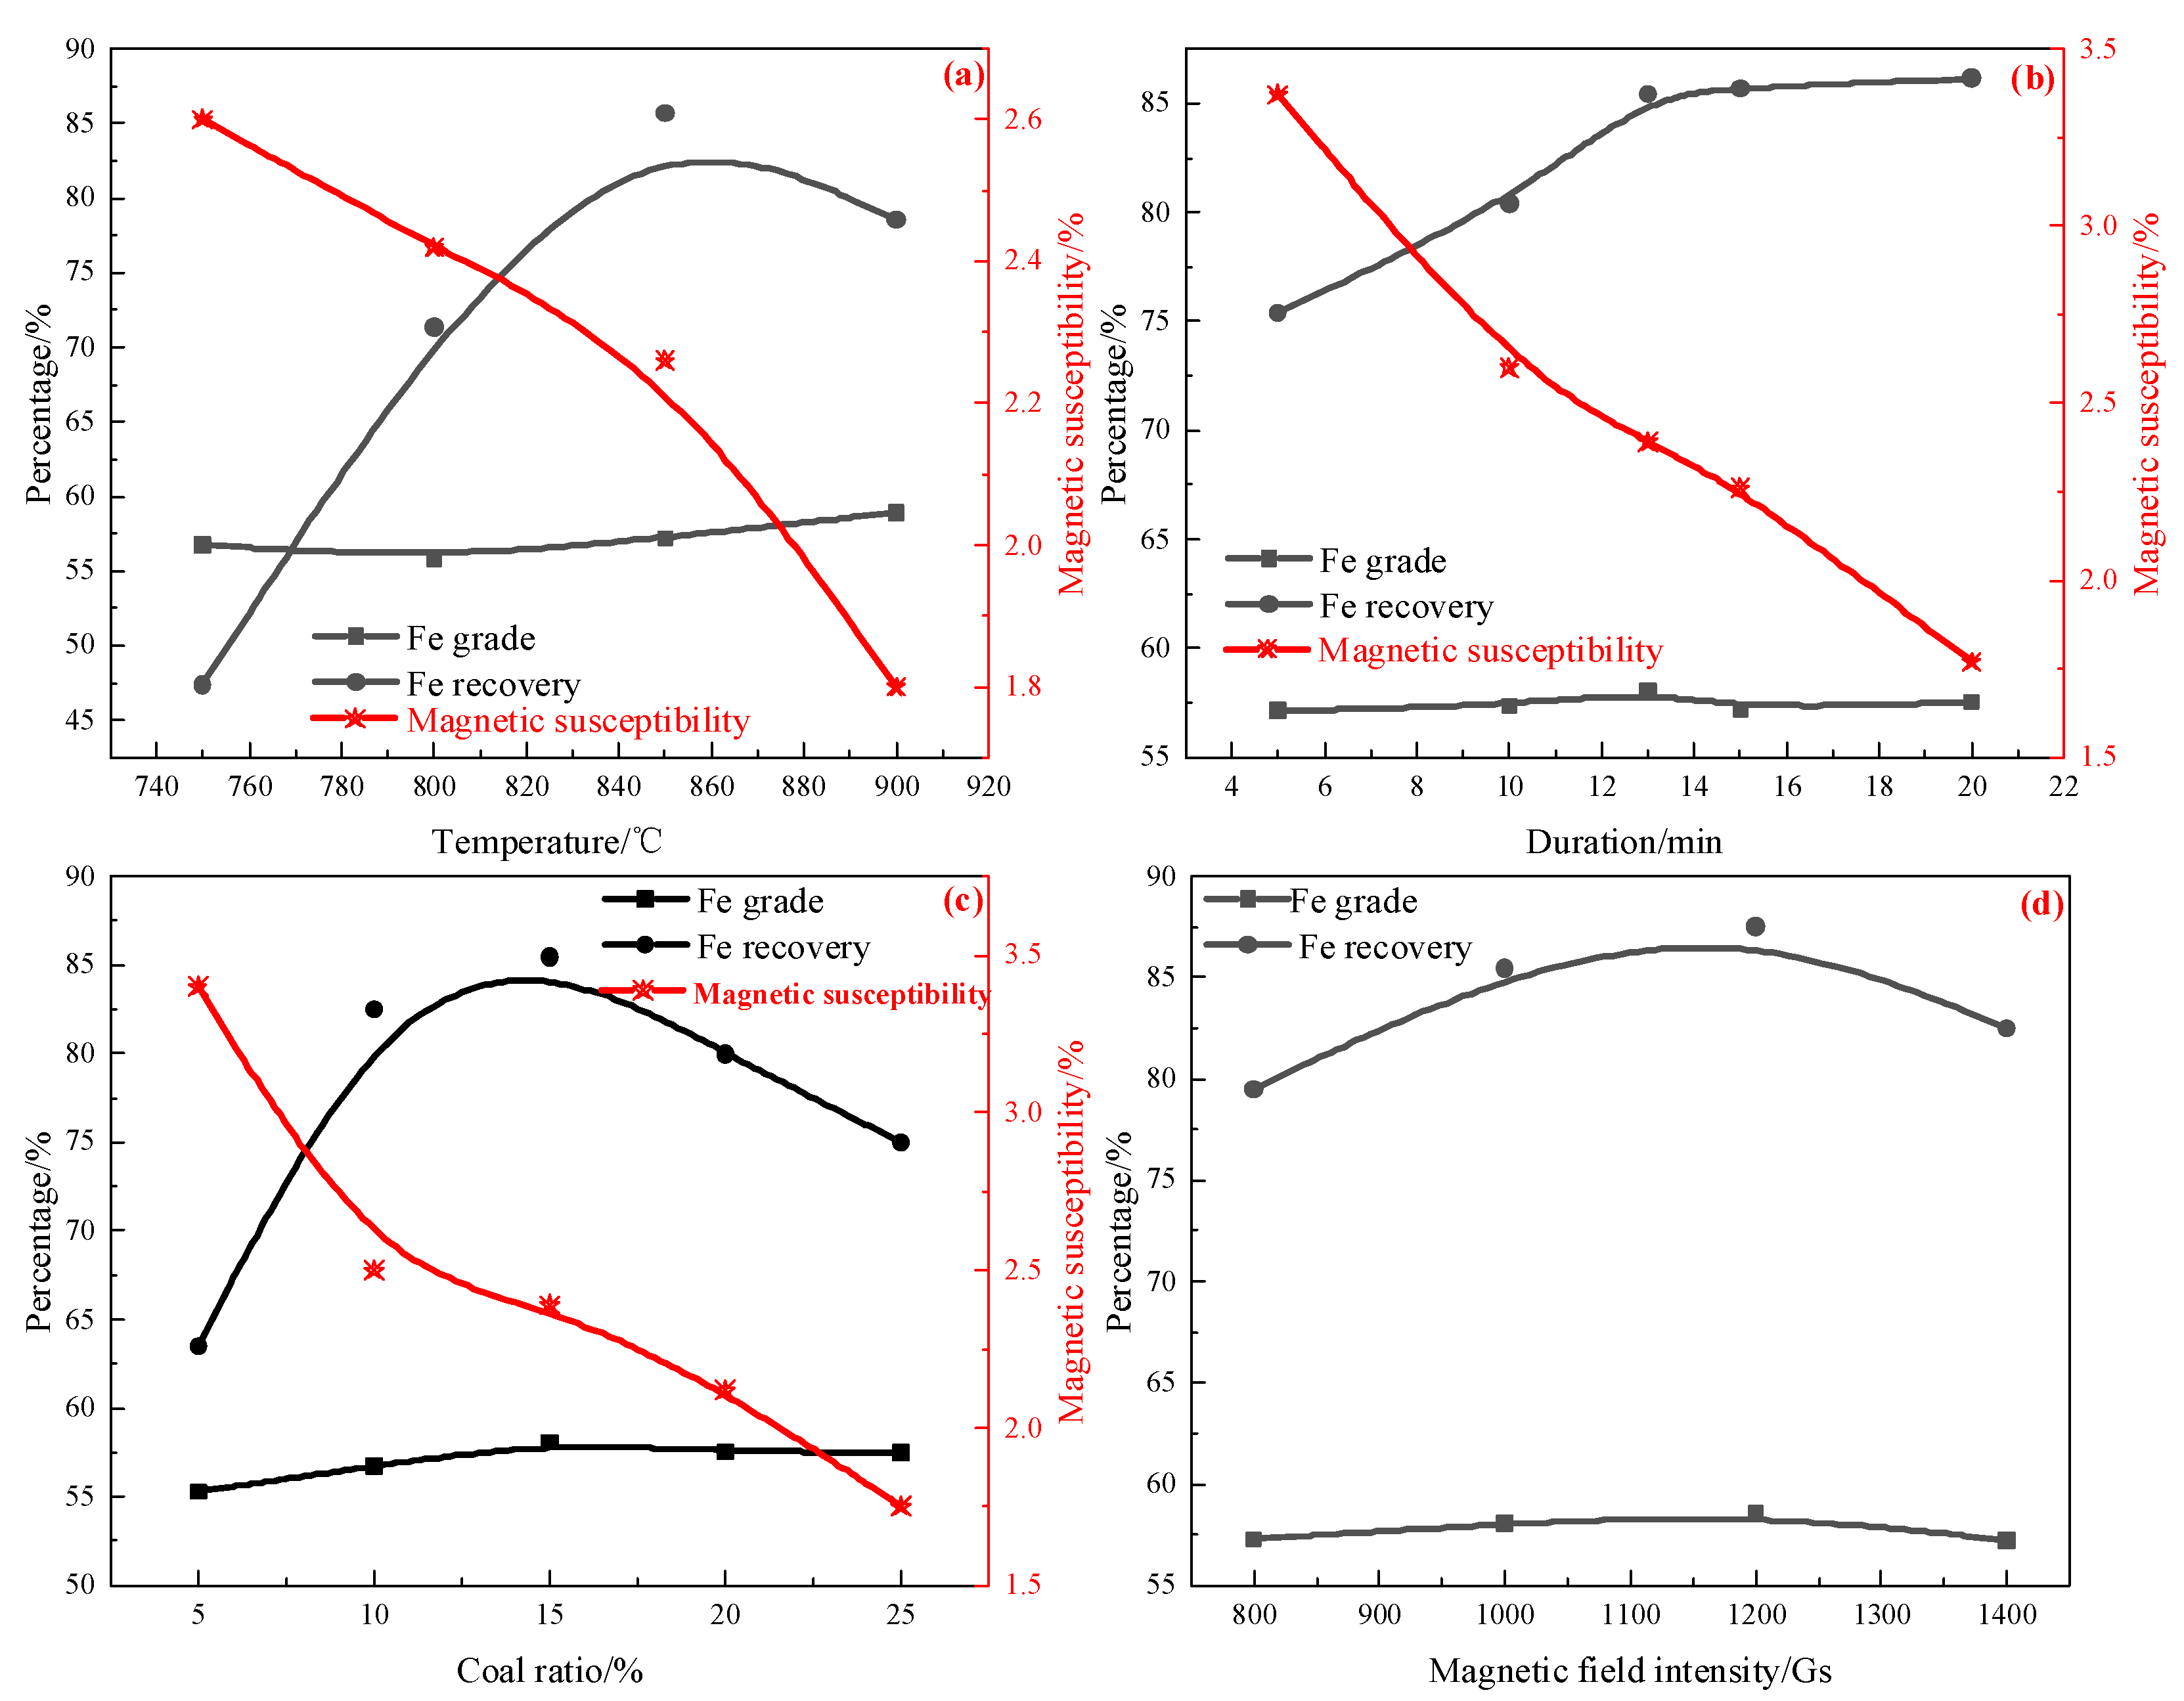
- High-phosphorus oolitic hematite ore containing 49.41% Fe and 2.13% P2O5 was used as a raw material. Magnetization roasting–magnetic separation was used to treat this ore under optimized conditions of roasting at 850 °C for 13 min with 10% coal. The roasted briquettes were subjected to wet magnetic separation under conditions of grinding fineness of 80% less than 0.045 mm and magnetic field intensity of 1200 Gs, and the rough magnetic separation concentrate contained 57.49% Fe and 1.4% P2O5, with an iron recovery rate of 87.5% and a dephosphorization rate of 34.27%. Conventional magnetization roasting could not significantly change the mineral embedding relationship in oolitic hematite ore. Magnetic separation could only separate part of the coarse gangue minerals, and there was no targeted treatment of P, indicating that it is difficult to upgrade iron and phosphorus removal by the conventional magnetization roasting–magnetic separation process.
- (2)
- Acid leaching was performed to remove phosphorus from the rough magnetic separation concentrate. Under optimal conditions, the final product (acid leaching residue), assayed at 60.81% Fe and 0.24% P2O5, was produced at an iron recovery rate of 88.66% and dephosphorization rate of 82.79%. It was found that acid leaching had a certain effect on removing phosphorus. However, the P2O5 content in the iron concentrate was still high, implying that a small part of P does not occur in the form of apatite. Therefore, an alkaline leaching process was used to treat the acid leaching residue. Under conditions of NaOH concentration of 100 kg/t and reaction at 90 °C for 1 h with a liquid-to-solid ratio of 5 and stirring speed of 500 rpm, the iron concentrate contained 62.88% iron and 0.101% P2O5. Due to the strong alkalinity of sodium hydroxide, it can further react with undeleted aluminum and silica gangue minerals in the process of alkali leaching to produce water-soluble sodium silicate and sodium meta-aluminate, which can be removed during slag liquid separation. Compared with the iron ore concentrate assayed at 57.49% Fe and 1.4% P2O5, the final concentrate by the new process, assayed at 64.11% Fe, with an iron recovery of 67.03% and 0.097% P2O5 with a dephosphorization rate of 95.45%, was successfully manufactured.
- (3)
- NaOH can participate in reactions with aluminum- and silica-bearing minerals during the magnetization roasting process, intensifying the removal of these minerals in the acid and alkaline leaching processes. For roasting, 4–6% NaOH was added to the ore, resulting in a higher iron grade and lower SiO2, Al2O3, and P2O5. Sodium magnetization roasting is very effective at transferring hematite into magnetite, and aluminum- and silica-bearing minerals into soluble sodium compounds.
Author Contributions
Funding
Acknowledgments
Conflicts of Interest
References
- Li, G.H.; Zhang, S.H. Effects of sodium salts on reduction roasting and Fe-P separation of high-phosphorus oolitic hematite ore. Int. J. Miner. Processing 2013, 124, 26–34. [Google Scholar] [CrossRef]
- Rao, M.J.; Ouyang, C.X. Behavior of phosphorus during the carbothermic reduction of phosphorus-rich oolitic hematite ore in the presence of Na2SO4. Int. J. Miner. Processing 2015, 143, 72–79. [Google Scholar] [CrossRef]
- Mcgregor, F.; Ramanaidou, E. Phanerozoic ooidal ironstone deposits–generation of potential exploration targets. Appl. Earth Sci. 2010, 119, 60–64. [Google Scholar] [CrossRef]
- Baioumy, H.; Omran, M. Mineralogy, geochemistry and the origin of high-phosphorus oolitic iron ores of Aswan, Egypt. Ore Geol. Rev. 2017, 80, 185–199. [Google Scholar] [CrossRef]
- Li, G.F.; Han, Y.X. Enrichment of phosphorus in reduced iron during coal based reduction of high phosphorus-containing oolitic hematite ore. Ironmak. Steelmak. 2016, 43, 163–170. [Google Scholar] [CrossRef]
- Luo, L.Q.; Zhang, H.Q. Process mineralogy and characteristic associations of iron and phosphorus-based minerals on oolitic hematite. J. Cent. South Univ. 2017, 24, 1959–1967. [Google Scholar] [CrossRef]
- Rao, Z.Q.; Zhang, Y.S. Improved Flotation of Oolitic Hematite Ore Based on a Novel Cationic Collector. Adv. Mater. Res. 2013, 712, 743–747. [Google Scholar] [CrossRef]
- Muhammed, M.; Zhang, Y. A hydrometallurgical process for the dephosphorization of iron ore. Hydrometallurgy 1989, 21, 277–292. [Google Scholar] [CrossRef]
- Ionkov, K.; Gaydardzhiev, S. Dephosphorisation of limonitic concentrate by roasting, acid leaching and magnetic separation. In Proceedings of the Iron Ore Conference 2011, Perth, Australia, 11–13 July 2011; pp. 445–452. [Google Scholar]
- Hanna, J.; Anazia, I.J. Processing of hematitic iron ores. In Advances in Fine Particles Processing; Springer: New York, NY, USA, 1990; pp. 413–425. [Google Scholar]
- Omran, M.; Fabritius, T. Improvement of phosphorus removal from iron ore using combined microwave pretreatment and ultrasonic treatment. Sep. Purif. Technol. 2015, 156, 724–737. [Google Scholar] [CrossRef] [Green Version]
- Nunes, A.P.L.; Pinto, C.L.L. Floatability studies of wavellite and preliminary results on phosphorus removal from a Brazilian iron ore by froth flotation. Miner. Eng. 2012, 39, 206–212. [Google Scholar] [CrossRef]
- Zhang, Y.; Muhammed, M. An integrated process for the treatment of apatite obtained from dephosphorization of iron ore. J. Chem. Technol. Biotechnol. 2010, 47, 47–60. [Google Scholar] [CrossRef]
- Xia, W.T.; Ren, Z.D. Removal of Phosphorus from High Phosphorus Iron Ores by Selective HCl Leaching Method. J. Iron Steel Res. Int. 2011, 18, 1–4. [Google Scholar] [CrossRef]
- Ionkov, K.; Gaydardzhiev, S. Amenability for processing of oolitic iron ore concentrate for phosphorus removal. Miner. Eng. 2013, 46, 119–127. [Google Scholar] [CrossRef]
- Delvasto, P.; Ballester, A. Mobilization of phosphorus from iron ore by the bacterium Burkholderia caribensis FeGL03. Miner. Eng. 2009, 22, 1–9. [Google Scholar] [CrossRef]
- Wang, J.C.; Shen, S.B. Effect of ore solid concentration on the bioleaching of phosphorus from high-phosphorus iron ores using indigenous sulfur-oxidizing bacteria from municipal wastewater. Process Biochem. 2010, 45, 1624–1631. [Google Scholar] [CrossRef]
- Delvasto, P.; Valverde, A. Diversity and activity of phosphate bioleaching bacteria from a high-phosphorus iron ore. Hydrometallurgy 2008, 92, 124–129. [Google Scholar] [CrossRef]
- Matinde, E.; Hino, M. Dephosphorization Treatment of High Phosphorus Iron Ore by Pre-reduction, Mechanical Crushing and Screening Methods. ISIJ Int. 2011, 51, 220–227. [Google Scholar] [CrossRef] [Green Version]
- Matinde, E.; Hino, M. Dephosphorization Treatment of High Phosphorus Iron Ore by Pre-reduction, Air jet Milling and Screening Methods. ISIJ Int. 2011, 51, 544–551. [Google Scholar] [CrossRef] [Green Version]
- Wu, J.; Wen, Z.J. Development of Technologies for High Phosphorus Oolitic Hematite Utilization. Steel Res. Int. 2011, 82, 494–500. [Google Scholar]
- Sun, Y.S.; Han, Y.X. Recovery of iron from high phosphorus oolitic iron ore using coal-based reduction followed by magnetic separation. Int. J. Miner. Metall. Mater. 2013, 20, 411–419. [Google Scholar] [CrossRef]
- Yu, W.; Sun, T. Can sodium sulfate be used as an additive for the reduction roasting of high-phosphorus oolitic hematite ore? Int. J. Miner. Processing 2014, 133, 119–122. [Google Scholar] [CrossRef]
- Zhu, D.Q.; Guo, Z.Q. Synchronous Upgrading Iron and Phosphorus Removal from High Phosphorus Oolitic Hematite Ore by High Temperature Flash Reduction. Metals 2016, 6, 123. [Google Scholar] [CrossRef] [Green Version]
- Yang, C.C.; Zhu, D.Q. Simultaneous Recovery of Iron and Phosphorus from a High-Phosphorus Oolitic Iron Ore to Prepare Fe-P Alloy for High-Phosphorus Steel Production. JOM 2017, 69, 1663–1668. [Google Scholar] [CrossRef]
- Li, S.W.; Pan, J. Synchronous enrichment of phosphorus and iron from a high-phosphorus oolitic hematite ore to prepare Fe-P alloy by direct reduction-magnetic separation process. J. Cent. South Univ. 2021, 28, 2724–2734. [Google Scholar] [CrossRef]
- Kokal, H.; Singh, M. Removal of phosphorus from Lisakovsky iron ore by a roast-leach process. Electrometall. Environ. Hydrometall. 2013, 2, 1517–1541. [Google Scholar]
- Xu, C.Y.; Sun, T.C. Mechanism of phosphorus removal in beneficiation of high phosphorous oolitic hematite by direct reduction roasting with dephosphorization agent. Trans. Nonferrous Met. Soc. China 2012, 22, 2806–2812. [Google Scholar] [CrossRef]
- Ionkov, K.; Gomes, O.; Neumann, R. Process Oriented Characterization of Oolitic Iron Concentrate during Dephosphorisation by Roasting and Leaching. In Proceedings of the IMPC 2016: XXVIII International Mineral Processing Congress, Quebec City, QC, Canada, 11–15 September 2016. [Google Scholar]
- Li, S.W.; Pan, J. A novel process to upgrade the copper slag by direct reduction-magnetic separation with the addition of Na2CO3 and CaO. Powder Technol. 2019, 347, 159–169. [Google Scholar] [CrossRef]
- Wang, D.Z.; Zhu, D.Q. A high-efficiency separation process of Fe and Zn from zinc-bearing dust by direct reduction. J. Iron Steel Res. Int. 2022, 14. [Google Scholar] [CrossRef]
- Xue, Y.X.; Pan, J. Improving High-Alumina Iron Ores Processing via the Investigation of the Influence of Alumina Concentration and Type on High-Temperature Characteristics. Minerals 2020, 10, 802. [Google Scholar] [CrossRef]
- Cekinski, E.; Thomassin, J.H. Surface Investigation of the Reaction Products between Apatite and Sulfuric Acid. Phosphorus Sulfur Silicon Relat. Elem. 1993, 76, 235–238. [Google Scholar] [CrossRef]
- Wang, D.Z.; Zhu, D.Q. An Investigation into the Alkali Metals Removal from Zn-Bearing Dust Pellets in Direct Reduction. JOM 2022, 74, 634–643. [Google Scholar] [CrossRef]


| Elements | TFe | FeO | CaO | MgO | SiO2 | Al2O3 | S | Sr | P2O5 | LOI |
|---|---|---|---|---|---|---|---|---|---|---|
| Content | 49.41 | 0.64 | 2.70 | 0.10 | 14.52 | 5.61 | 0.13 | 0.46 | 2.13 | 2.48 |
| Minerals | Hematite | Fayalite | Iron Sulfide | Iron Carbonate | Magnetite | TFe |
|---|---|---|---|---|---|---|
| Content | 48.42 | 0.37 | 0.07 | 0.30 | 0.02 | 49.18 |
| Iron distribution ratio | 98.45 | 0.75 | 0.14 | 0.61 | 0.04 | 100 |
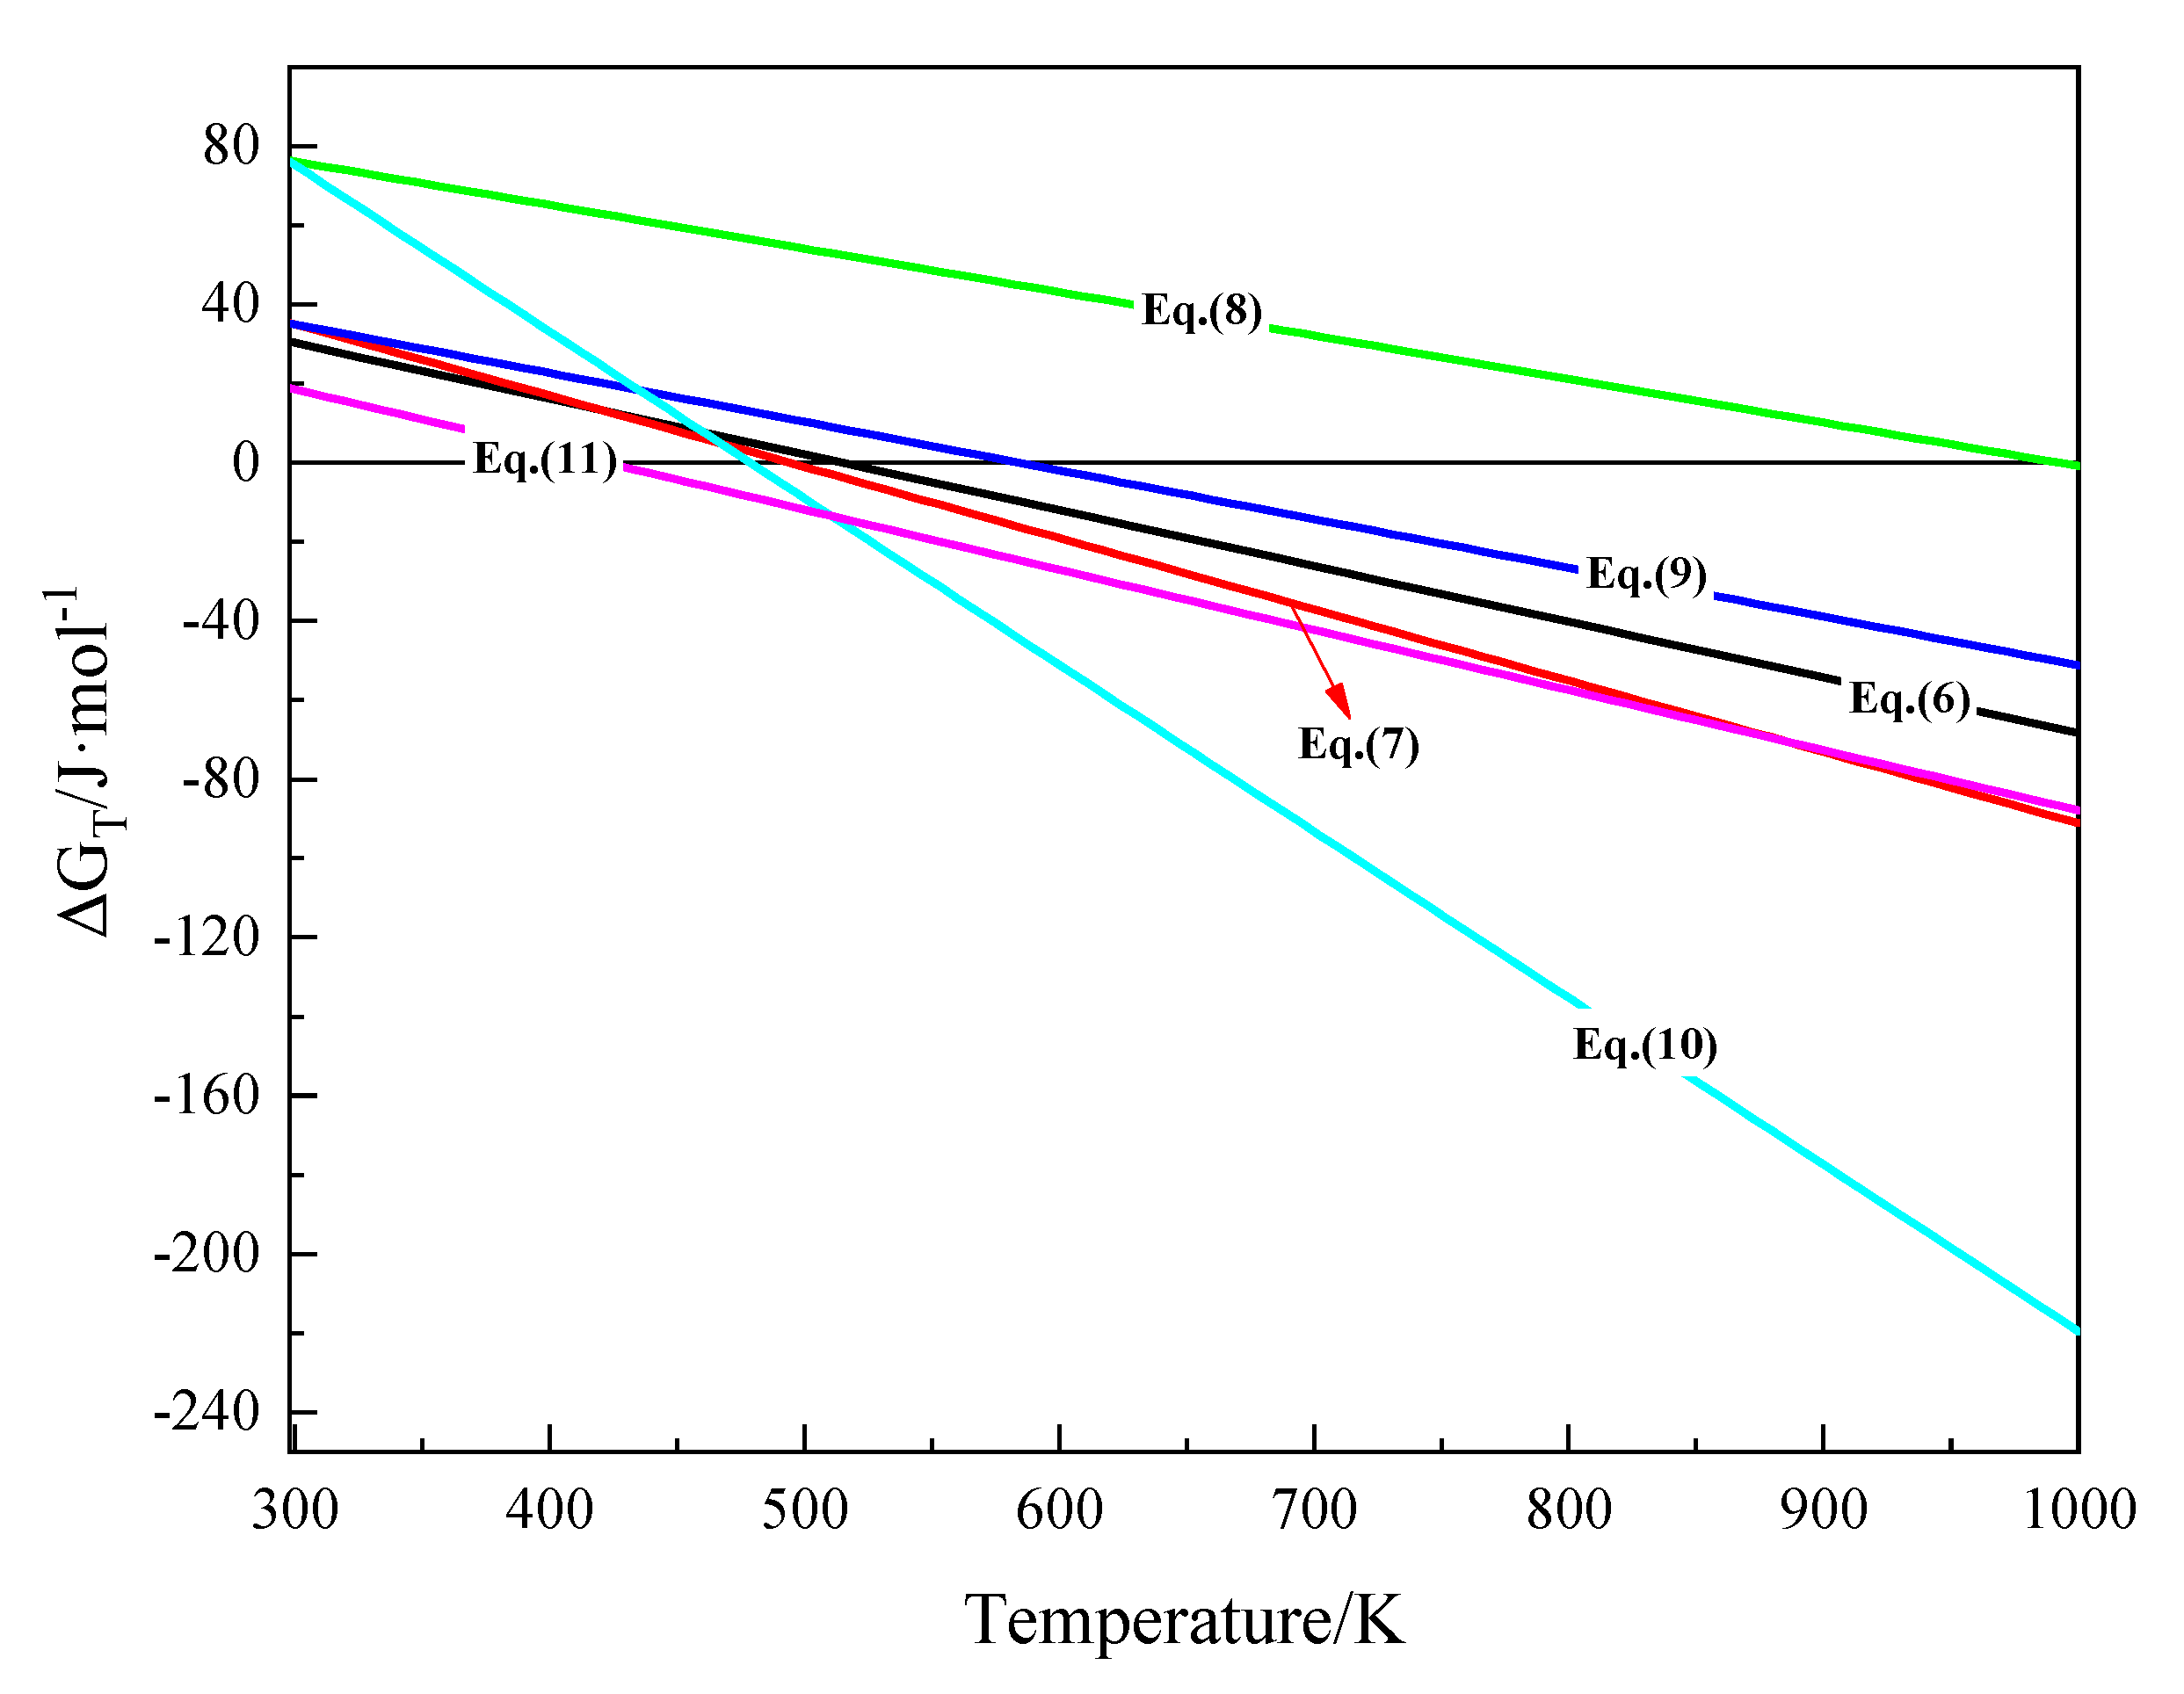
| Equation | Relation of ΔGT–T (J·mol−1) | Temperature Range (K) | Initial Reaction Temperature (K) |
|---|---|---|---|
| (6) | ΔGT = 72,609 − 140.985T | 298~1000 | 515.01 |
| (7) | ΔGT = 89,097 − 180.216T | 298~1000 | 494.39 |
| (8) | ΔGT = 109,180 − 110.007T | 298~1000 | 992.48 |
| (9) | ΔGT = 71,977 − 123.169T | 298~1000 | 584.38 |
| (10) | ΔGT = 201,633 − 421.170T | 298~1000 | 478.74 |
| (11) | ΔGT = 64,297 − 152.206T | 298~1000 | 422.43 |
| Element | TFe | FeO | CaO | MgO | SiO2 | Al2O3 | Na2O | S | P2O5 |
|---|---|---|---|---|---|---|---|---|---|
| Concentrate | 64.11 | 34.63 | 0.81 | 0.03 | 4.90 | 2.79 | 0.06 | 0.10 | 0.097 |
Publisher’s Note: MDPI stays neutral with regard to jurisdictional claims in published maps and institutional affiliations. |
© 2022 by the authors. Licensee MDPI, Basel, Switzerland. This article is an open access article distributed under the terms and conditions of the Creative Commons Attribution (CC BY) license (https://creativecommons.org/licenses/by/4.0/).
Share and Cite
Pan, J.; Lu, S.; Li, S.; Zhu, D.; Guo, Z.; Shi, Y.; Dong, T. A New Route to Upgrading the High-Phosphorus Oolitic Hematite Ore by Sodium Magnetization Roasting-Magnetic Separation-Acid and Alkaline Leaching Process. Minerals 2022, 12, 568. https://doi.org/10.3390/min12050568
Pan J, Lu S, Li S, Zhu D, Guo Z, Shi Y, Dong T. A New Route to Upgrading the High-Phosphorus Oolitic Hematite Ore by Sodium Magnetization Roasting-Magnetic Separation-Acid and Alkaline Leaching Process. Minerals. 2022; 12(5):568. https://doi.org/10.3390/min12050568
Chicago/Turabian StylePan, Jian, Shenghu Lu, Siwei Li, Deqing Zhu, Zhengqi Guo, Yue Shi, and Tao Dong. 2022. "A New Route to Upgrading the High-Phosphorus Oolitic Hematite Ore by Sodium Magnetization Roasting-Magnetic Separation-Acid and Alkaline Leaching Process" Minerals 12, no. 5: 568. https://doi.org/10.3390/min12050568
APA StylePan, J., Lu, S., Li, S., Zhu, D., Guo, Z., Shi, Y., & Dong, T. (2022). A New Route to Upgrading the High-Phosphorus Oolitic Hematite Ore by Sodium Magnetization Roasting-Magnetic Separation-Acid and Alkaline Leaching Process. Minerals, 12(5), 568. https://doi.org/10.3390/min12050568