Article

Co-Remediation of Acid Mine Drainage and Industrial Effluent Using Passive Permeable Reactive Barrier Pre-Treatment and Active Co-Bioremediation

by
Sandisiwe Khanyisa Thisani
1,*,
Daramy Vandi Von Kallon
1 and
Patrick Byrne
2
1
Department of Mechanical and Industrial Engineering Technology, University of Johannesburg, Johannebsurg 2006, South Africa
2
School of Biological and Environmental Sciences, Liverpool John Moores University, Liverpool L2 2QP, UK
*
Author to whom correspondence should be addressed.
Minerals 2022, 12(5), 565; https://doi.org/10.3390/min12050565
Submission received: 12 March 2022 / Revised: 11 April 2022 / Accepted: 15 April 2022 / Published: 30 April 2022
(This article belongs to the Topic Advances in Separation and Purification Techniques)

Abstract

:
This study evaluated the co-remediation performance of an active–passive process comprised of passive permeable reactive barrier acid mine drainage (AMD) pre-treatment and active anaerobic digestion treatment of AMD with effluent as a carbon source. The bioreactor was operated for 24 consecutive days with peak chemical oxygen demand (COD) and sulphate loading rates of 6.6 kg COD/m3/day and 0.89 kg SO42−/m3/day, respectively. The AMD pre-treatment was capable of removing 99%, 94% and 42% of iron (Fe), potassium (K), and aluminium (Al) concentrations, respectively. The biological treatment process was capable of removing 89.7% and 99% of COD and sulphate concentrations, respectively. The treated wastewater copper (Cu), sulphate (SO42−), and pH were within the effluent discharge limits and the potable water standards of South Africa. Fe, Al, manganese (Mn), nickel (Ni), and zinc (Zn) concentrations in the treated wastewater were marginally higher than the discharge and potable water limit with all concentrations exceeding the limit by less than 0.65 mg/L. The remediation performance of the process was found to be effective with limited operational inputs, which can enable low cost co-remediation.

1. Introduction

Acid mine drainage (AMD) and effluent from food and beverage (F&B) industries are toxic wastewater streams that are generated from mining and industrial operations, respectively. These wastewater streams can pose severe harm to the natural environment and to living organisms when allowed to decant to natural water bodies [1,2]. Acid mine drainage is characterised by low pH, high concentrations of dissolved heavy metals, and high concentrations of sulphate (SO42−) [3,4]. Effluent from F&B industries is typically characterised by high organic content, high suspended solids, and low pH [5,6]. Chemical oxygen demand (COD) is a critical indicator of effluent quality of F&B industries due to the high organic contents in the manufacturing processes [7,8].
Conventional anaerobic bioremediation is comprised of numerous interdependent microbial species that breakdown organic pollutants to remediate wastewater streams [6]. The microbial food web in anaerobic digestion (AD) presents an opportunity to integrate a second inorganic wastewater stream such as AMD for co-bioremediation [9]. In the co-bioremediation approach, reducing microorganisms can use the carbon from the organic wastewater stream as an electron donor to breakdown inorganic pollutants [10]. This dual treatment approach where a pollutant from one stream works as an intermediary for the remediation of another has been the topic of much research in recent years [11,12,13,14,15]. However, the research has currently mostly been limited to the use of complex organic matter sources such as primary sewage sludge for co-remediation with AMD [14,16,17,18]. The operational efficiency of sulphidogenic AD solutions are largely dependent on the carbon source utilised [19,20,21,22]. The co-bioremediation of AMD and easily biodegradable industrial effluent could be more efficient, have lower operational costs, and could have a higher remediation quality of both wastewater streams than the existing co-bioremediation of AMD with complex organic matter sources. If suitable treatment quality can be achieved on both streams, industrial effluents could be a cost effective and readily available carbon source for AMD bioremediation.
A major constraint towards the co-bioremediation of AMD using easily biodegradable industrial effluent is the rapid utilisation of the simple organic matter resulting in low pH and acidification of the reactor [10,17]. To mitigate this, an active–passive process has been developed to neutralise the acidity developed by the acidogenic microorganisms in the bioreactor. The active–passive process comprises of passive permeable reactive barrier (PRB) pre-treatment and an active fixed bed pervious concrete anaerobic digester where pH can be neutralised by the dissolution of calcium (Ca) ions from the pervious concrete. The evaluation of the co-remediation capabilities of this process forms the basis of this research.
This research was undertaken to evaluate the co-remediation capabilities of the active–passive process. The research aimed to test the treated AMD and industrial effluent quality achievable during continuous batch operation. The research methodology was designed to test performance at increasing SO42− and COD loading rates. The findings of this research contribute towards the sustainable management of AMD and industrial effluent pollutants. Apart from the loading of the wastewater streams and maintaining the digester temperature, no other external interventions were taken to control the AD operation during the experiment.

2. Methodology

2.1. Acid Mine Drainage and Industrial Effluent Collection and Storage

AMD was collected from an abandoned coal mine in the north-eastern coal fields of KwaZulu-Natal province of South Africa. The AMD was collected at the overflow weir of the mine tailing in 20 L plastic containers, which were kept closed and refrigerated at 4 °C for three days before experimentation. A sample of the collected AMD was analysed for chemical determinands and the results are presented in Table 1.
Effluent wastewater was collected from the effluent holding tank of a confectionary production factory. Major raw ingredients used by the factory include glucose, gelatine, sugar, and starch. The effluent was collected in 20 L plastic containers and kept refrigerated for three days at 4 °C before experimentation commenced. A sample of the effluent was analysed for chemical determinands and the results are presented in Table 2.

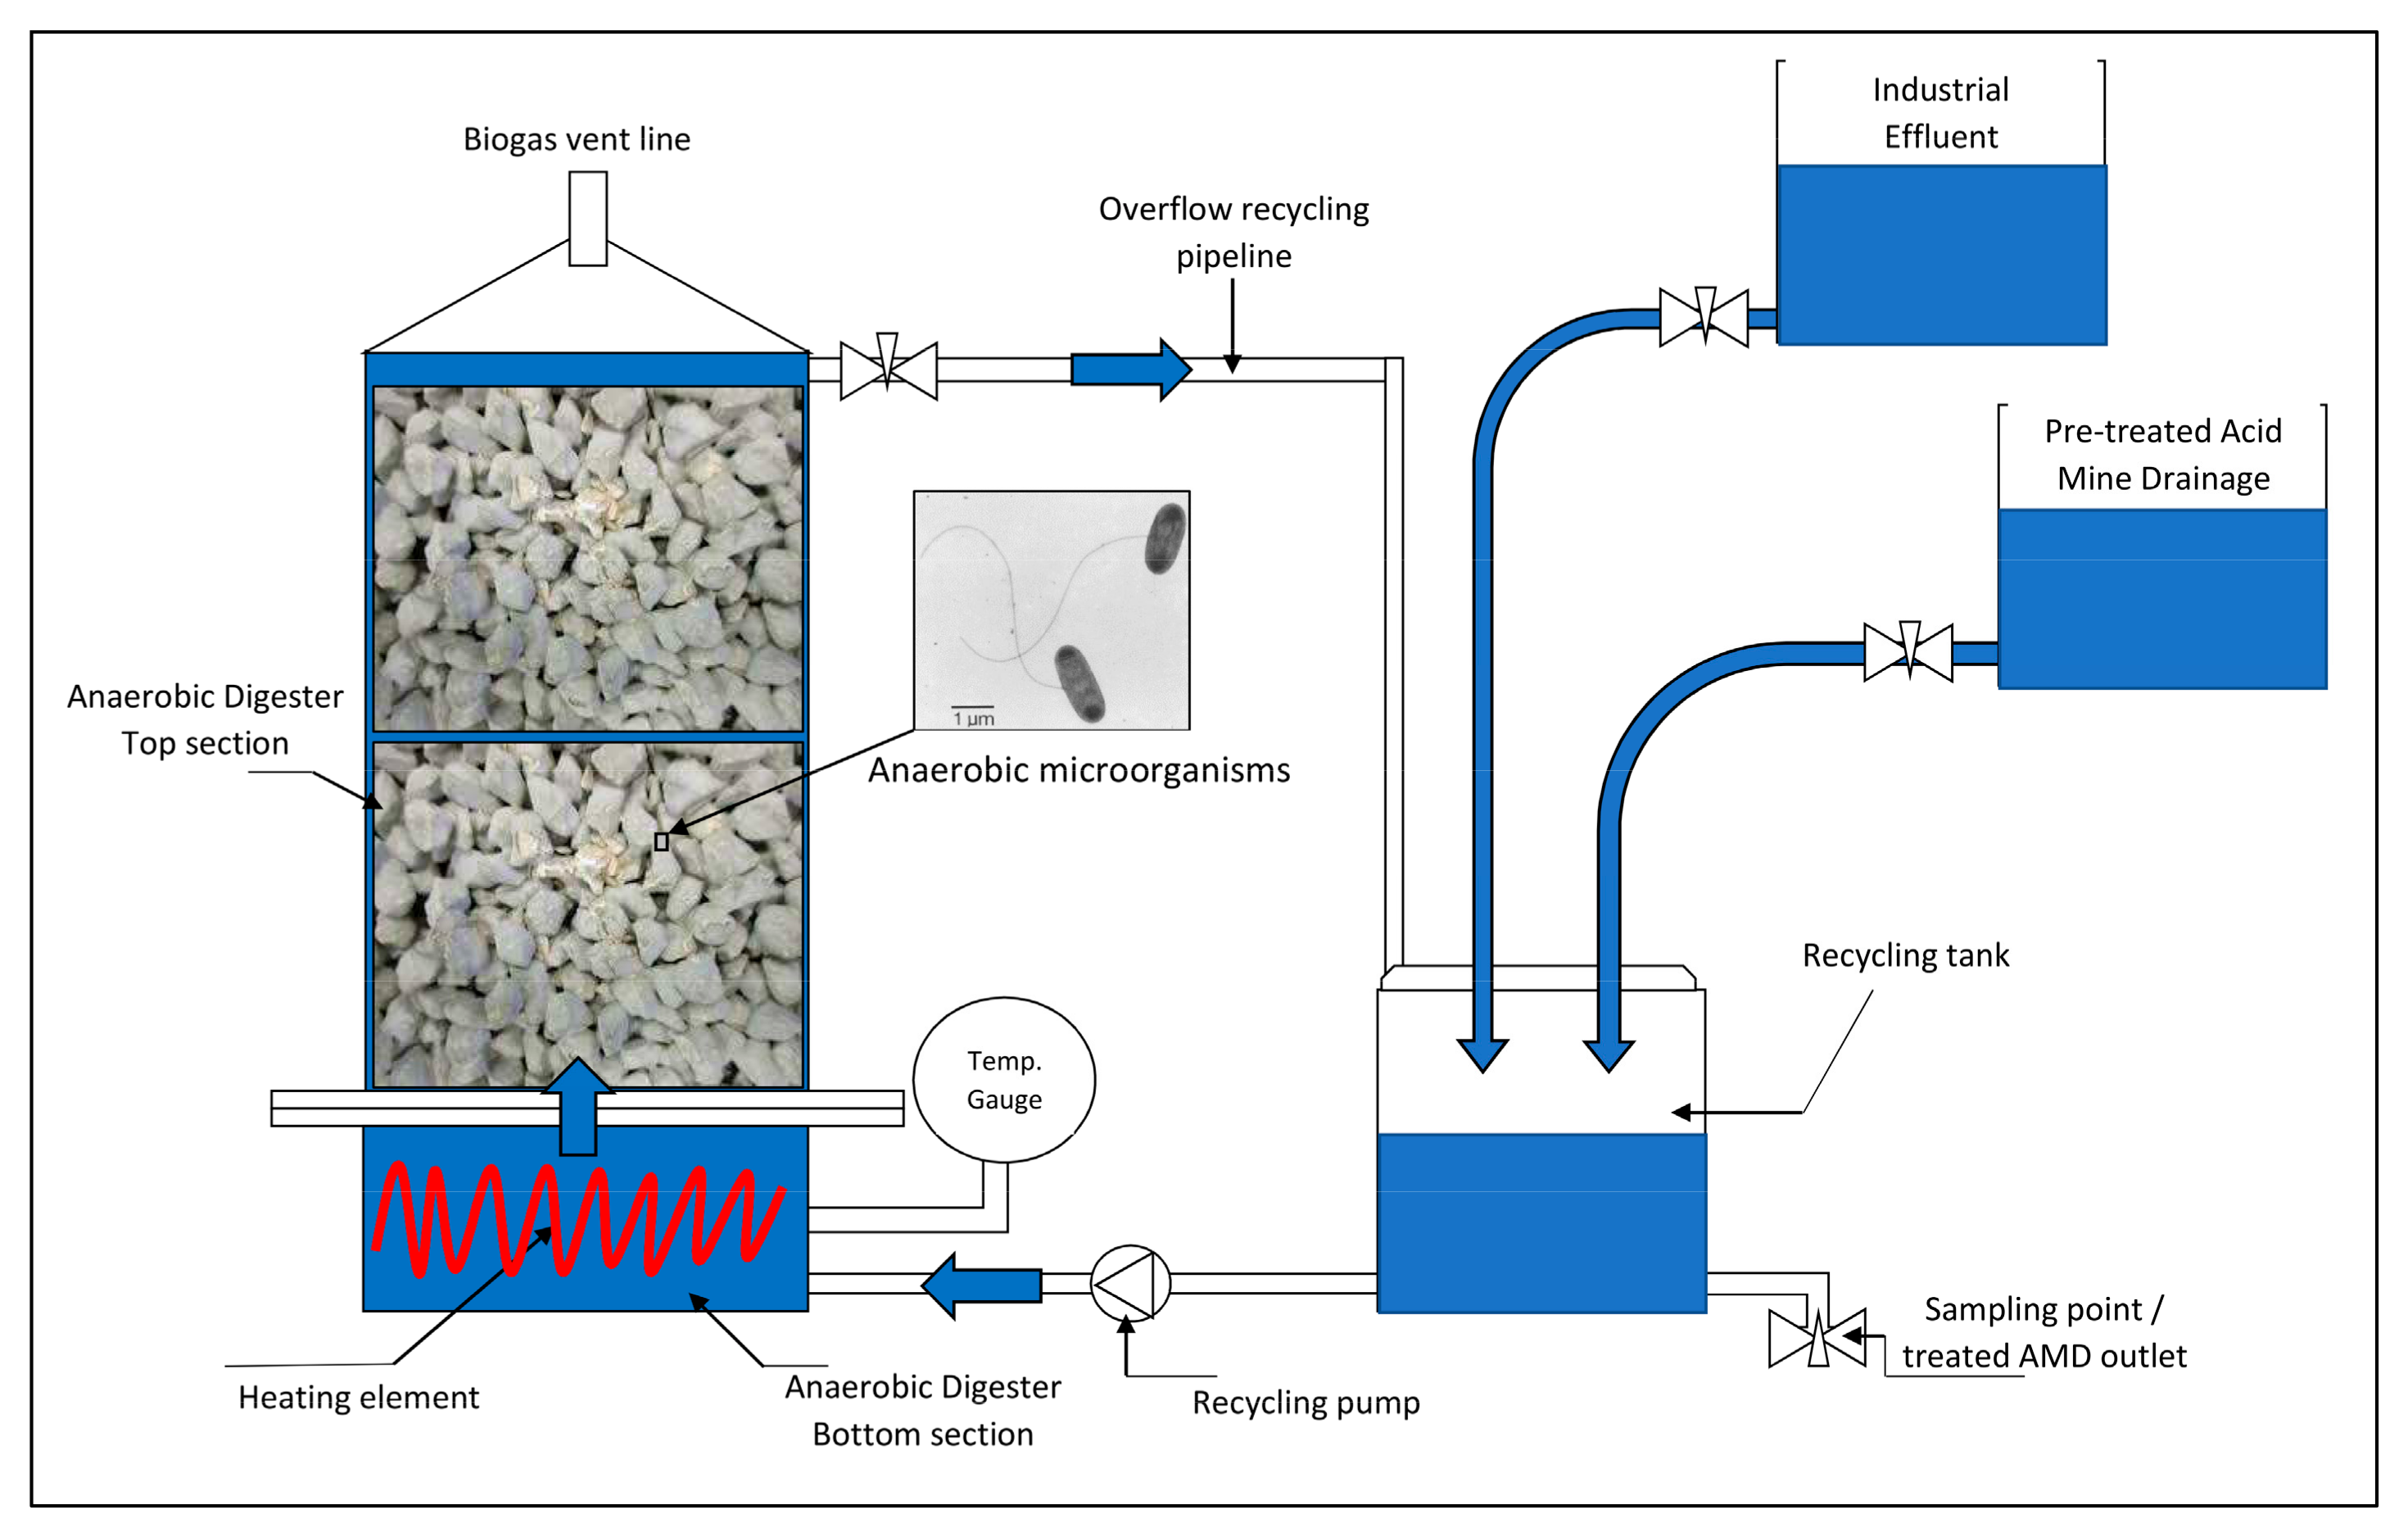
2.2. Process Design and Description

The co-remediation process comprised of an AMD pre-treatment stage to precipitate some of the heavy metals, mainly iron, from solution and a secondary treatment stage for co-bioremediation of AMD with industrial effluent. The pre-treatment utilises pervious concrete as a PRB for pH correction and metal precipitation. The PRB was operated under gravitation flow conditions due to the proven remediation capabilities of this configuration over column flow [23]. Four 150 mm pervious concrete cubes were stacked vertically in a rectangular container constructed from Perspex sheeting. Raw AMD was discharged at the top of the PRB using a peristaltic pump at a flow rate of 800 mL/min. The AMD was allowed to trickle through the pervious concrete’s porous network. The pre-treated AMD was stored in 20 L containers and the precipitated suspended solids allowed to settle. The supernatant was decanted for secondary treatment. A sample of the pre-treated AMD was collected at 5 L intervals of AMD flow. Figure 1 schematically illustrates the AMD pre-treatment process described.
The pre-treated AMD supernatant was bio-remediated with industrial effluent as the carbon source using the fixed bed pervious concrete bioreactor process. The bioreactor process was comprised of two 150 mm × 150 mm × 150 mm pervious concrete cubes, a recycling tank where the AMD and industrial effluent were introduced, and a peristaltic pump to circulate the effluent AMD mixture through the reactor. The porous network of the pervious concrete cubes was used to house seed sludge floc particles. The reactor was fitted with a heating element to maintain the liquid temperature between 37 °C and 38 °C and a vent to release biogas generated during treatment. The recycling tank was fitted with a valve for collection of the treated effluent and sample collection. Figure 2 schematically illustrates the fixed bed pervious concrete co-bioremediation process.

2.3. Equipment and Materials

2.3.1. Pervious Concrete Materials and Construction

Pozzolanic CEM IV and granite stone were used as the cement and aggregate type for the pervious concrete cubes. The CEM IV mix design comprised of Portland CEM I with 4% silica fume CSF-90TM and 8% siliceous fly ash [23]. Granite stone sizes of 13.2 mm and 9.5 mm were selected for the bioreactor and pre-treatment pervious concrete cubes, respectively. Table 3 shows the mix designs for the pervious concrete cubes.

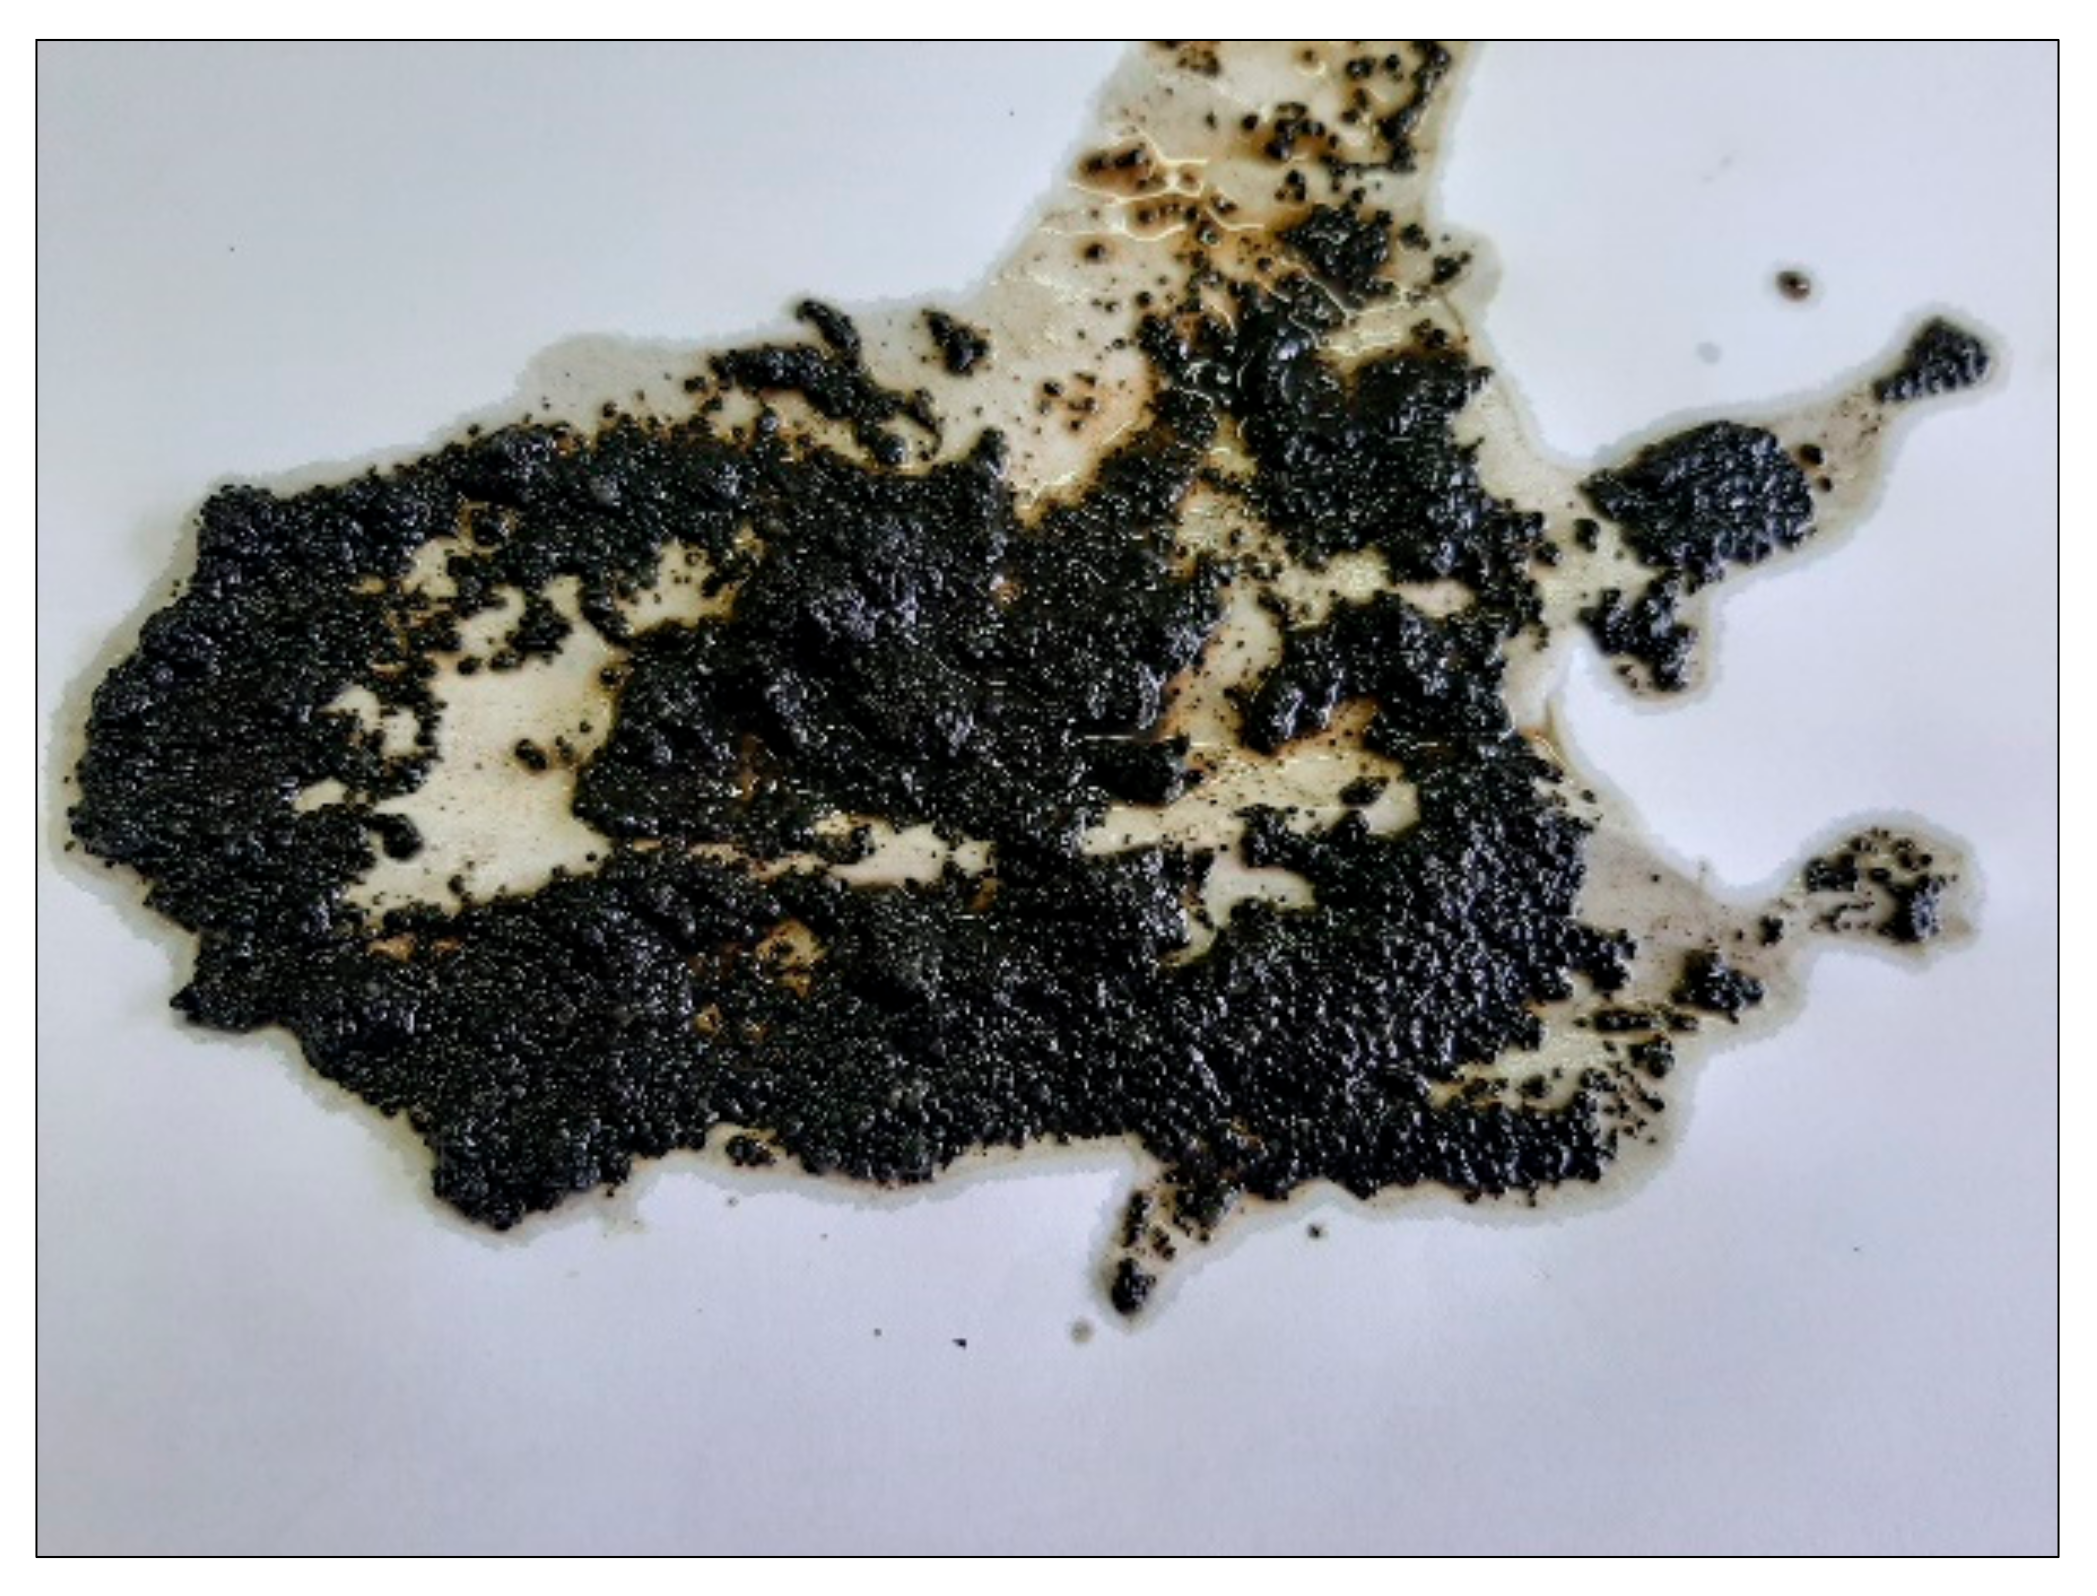
2.3.2. Seed Sludge Collection, Storage and Loading

Granular seed sludge was sourced from an effluent treatment plant (ETP) of a yeast manufacturing company. This seed sludge was sourced due to the consortium of anaerobic microorganisms present including sulphide reducing prokaryotes and methanogens, which are required for AMD and effluent bioremediation. The granular sludge was collected from the anaerobic digester tank of the ETP and stored in a 5 L plastic container. The container was kept closed and refrigerated at 4 °C for 14 days prior to the commencement of the experimentation. A day before the commencement of the experiments, the 5 L container was kept at approximately 21 °C. Prior to the commencement of the experiment, 1.2 L of sludge was poured uniformly over each concrete cube. The sludge was allowed to seep into the porous void network of the concrete cube for 10 min. Figure 3 shows the granular seed sludge used.

2.4. Bioreactor Operational Protocol

Biological co-remediation of pre-treated AMD and industrial effluent was conducted in batch operation in the fixed bed pervious concrete bioreactor over a period of 24 consecutive days. The start-up operation of the bioreactor comprised of a gradual increase in the batch loading rates of AMD SO42− from 0.054 kg SO42−/m3/day on day 1 to 0.89 kg SO42−/m3/day on day 22. The effluent COD batch loading rate was gradually increased from 2.64 kg COD/m3/day on day 1 to 6.6 kg/COD/m3/day on day 18. COD to SO42− ratio was gradually reduced from 164.6:1 to 5.14:1. It has been established in the literature that COD to SO ratios below 5:1 when using an easily biodegradable carbon source can be performance limiting [10]. A hydraulic retention time of 48 h was maintained between each batch loading cycle. The recycling pump flow rate was maintained at 15.4 mL/min. Equations (1) and (2) show the formulae used to determine the SO42− and COD loading rates, respectively. Table 4 shows the SO42− and COD loading rates for the experiment.
SO 4 2   Loading   Rate   kgSO 4 2 / m 3 / day = SO 4 2 mg / L ×   Volume   added   per   day   m 3 / day 1000   g / kg × Reactor   volume   m 3
COD   Loading   Rate   kgCOD / m 3 / day = COD   mg / L ×   Volume   added   per   day   m 3 / day 1000   g / kg × Reactor   volume   m 3
An initial recycling tank sample was collected on day 1 following AD start-up and further samples were collected at 48 h intervals for chemical analyses. Biologically treated effluent samples were extracted from the bioreactor followed by the addition of effluent and AMD at the required loading rates. The liquid volumes in the recycling tank and the bioreactor were measured before loading. Following the loading of AMD and effluent, the new concentrations of COD and SO42− in the process were determined through mass balance calculations. The mass balance was conducted using the known quantities of AMD SO42− and effluent COD added to the process summed up with their volumetric concentrations in the process determined from chemical analysis of the extracted samples. Equations (3) and (4) show the mass balance calculations used to determine the concentrations of SO42− and COD, respectively, post loading.
SO 4 2 post = AMD   load   vol × AMD   SO 4 2 1 , 000 , 000 + water   vol   × water   SO 4 2 1 , 000 , 000 + AD   vol × AD   SO 4 2 1 , 000 , 000 + Eff   load   vol × Eff   SO 4 2 1 , 000 , 000 × 1 , 000 , 000 AMD   load   vol + water   vol + AD   vol + Eff   load   vol
where SO42− post is the SO42− concentration in the bioreactor post loading (mg/L); AMD load vol and Eff load vol are the loading volumes of AMD and effluent added to the recycling tank (litres), respectively; AMD SO42− and Eff SO42− are the concentrations of SO42− in the pre-treated AMD (mg/L) and effluent, respectively; water vol is the volume of dilution water added when applicable (litres); water SO42− is the concentration of SO42− in the dilution water (mg/L); AD vol is the liquid volume in the bioreactor and recycling tank before loading (litres); and AD SO42− is the measured SO42− concentration in the bioreactor before loading (mg/L).
COD   post = Eff   load   vol × Eff   COD 1 , 000 , 000 + water   vol   × water   COD 1 , 000 , 000 + AD   vol × AD   COD 1 , 000 , 000 + AMD   load   vol × AMD   COD 1 , 000 , 000 × 1 , 000 , 000 Eff   load   vol + water   vol + AD   vol + AMD   load   vol
where COD post is the COD concentration in the bioreactor post loading (mg/L); Eff load vol and AMD load vol are the loading volumes of effluent and AMD added to the recycling tank (litres), respectively; Eff COD and AMD COD are the concentration of COD in the effluent and AMD (mg/L), respectively; water vol is the volume of dilution water when applicable (litres); water COD is the concentration of COD in the dilution water (mg/L); AD vol is the liquid volume in the bioreactor and recycling tank before loading (litres); and AD COD is the measured COD concentration in the bioreactor before loading (mg/L).

2.5. Chemical Analysis

Chemical analyses were conducted to assess the treatment performance of the process. The analyses were conducted by a South African commercial laboratory accredited by the South African National Accreditation System (SANAS).
Concentrations of the dissolved metals were determined using the Varian 700-ES inductive coupled plasma atomic emission spectroscopy (ICP-OES) instrument. The samples were prepared by filtering through a 0.45 µm cellulose nitrate filter paper and acidified with trace metal grade nitric acid.
The SO42− concentration was determined using a Thermo Scientific Aquakem 200 selective photometric analyser. The samples were diluted, followed by precipitation of the sulphate ion using a strong acid medium with barium chloride. The resulting turbidity was measured photometrically at 405 nm against calibration standard solutions.
The pH was measured immediately after sample collection using a Hanna Instruments HI9813-6 portable meter. The meter was manually calibrated using pH 7.01 and pH 4.01 buffer solutions before taking each pH reading.
The TSS was determined by agitating the sample and filtering through 2 µm filter paper with the residue retained dried at 105 °C ± 2 °C. The weight of the dried solids was measured to determine the TSS.
COD was determined using a HACH DR3900 spectrophotometer following the reactor digestion method. The organic material in the samples was oxidised using a boiling mixture of sulphuric acid with a known excess of potassium dichromate (K2Cr2O7). Following the digestion, the amount of oxygen consumed was measured against standards at 420 nm for low wavelength ranges and 620 nm for high wavelength ranges using the spectrophotometer.
Alkalinity was determined using a Thermo Scientific Orion 5-Star Plus portable multi-meter following the potentiometric titration method. Samples were titrated to pH 4.00 using standard 0.1 M H2SO4 solution. Titrant was added in increments and the pH recorded for the corresponding titrant volume. The potentiometric titration end-point was detected using a titration curve. On completion of the titration process, the potential difference was measured using the multi-meter electrode. Alkalinity was calculated from the volume of titrate used.
Volatile fatty acids (VFAs) was determined using Thermo Scientific Orion 5-Star Plus portable multi-meters following the potentiometric titration method. Samples were titrated to pH 7.00 using standard 0.10 normality NaOH solution. Titrant was added in increments and the pH recorded for the corresponding titrant volume. The potentiometric titration end-point was detected using a titration curve. On completion of the titration process, the potential difference was measured using the multi-meter electrode. The volatile acid concentration was calculated from the volume of titrate used.

3. Results and Discussions

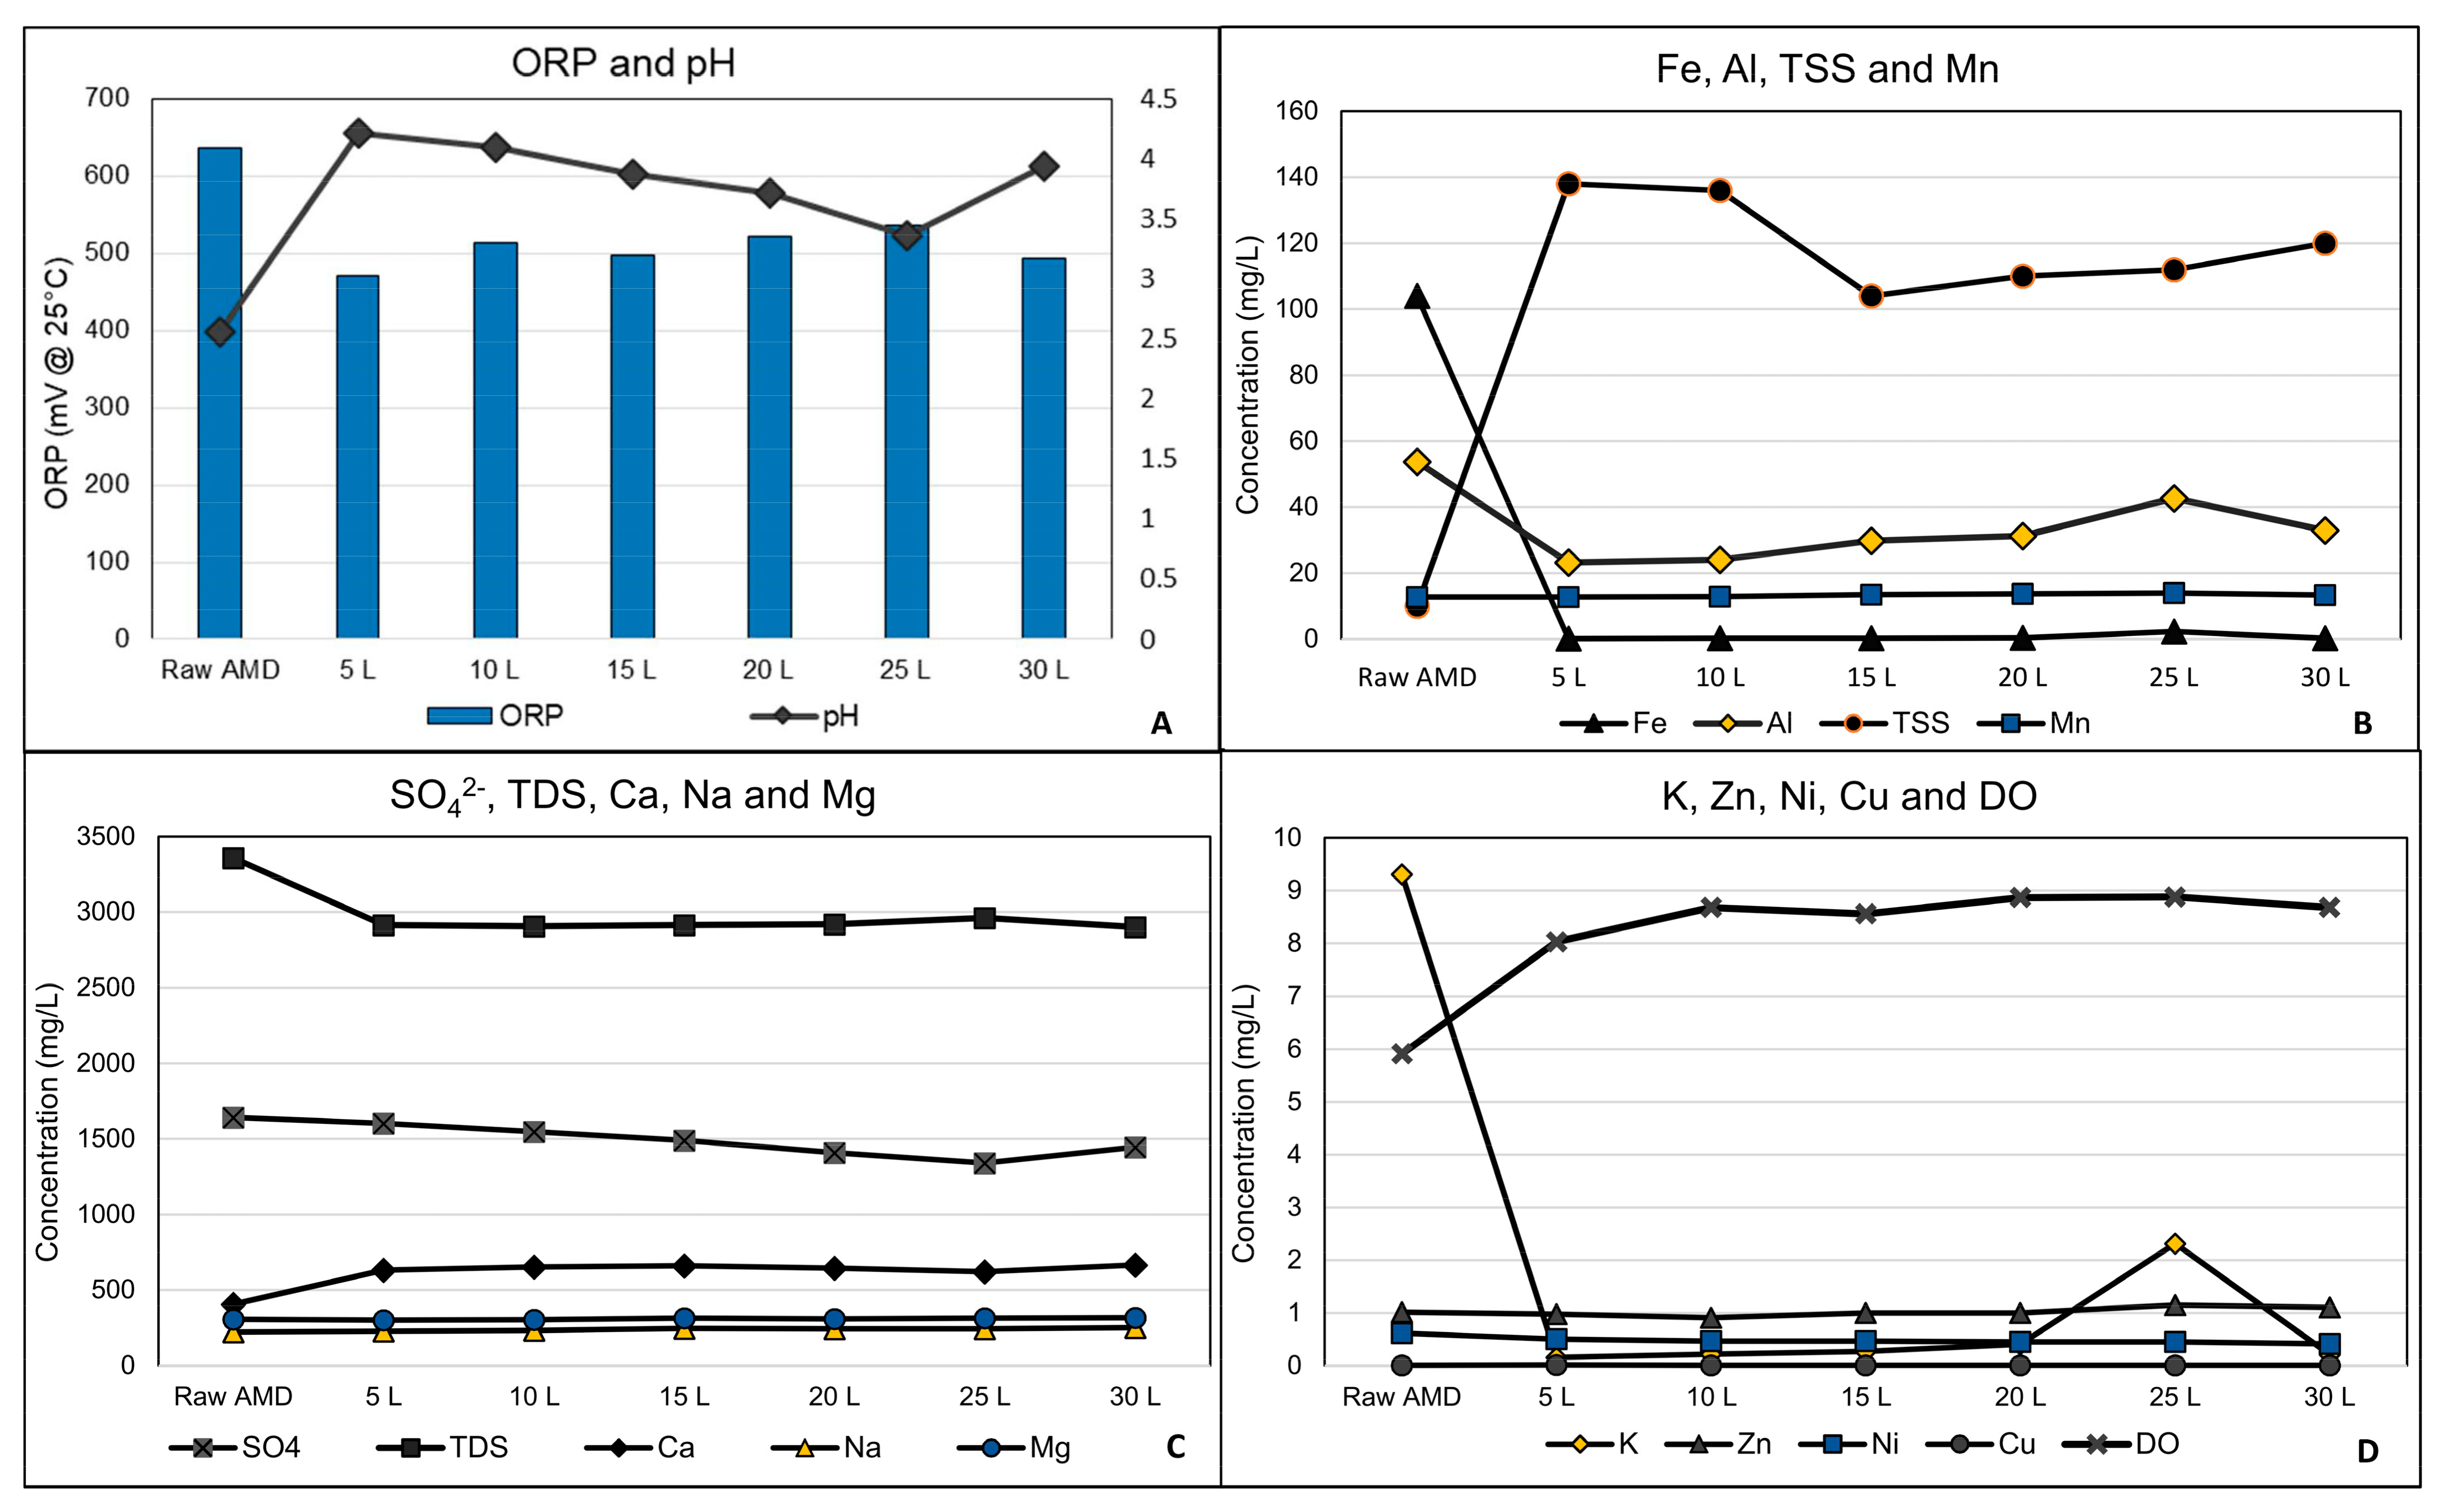
3.1. Acid Mine Drainage Pre-Treatment

The chemical analysis results from the samples collected during the conduct of pervious concrete PRB pre-treatment experiments are graphically illustrated in Figure 4. The raw AMD indicates the initial determinands of the untreated AMD. The 5 L intervals indicate the quality of the pre-treated AMD following each 5 L interval of treatment completed.
The pH increased from 2.56 to an average pH of 3.9, the oxygen reduction potential (ORP) reduced from 636.6 mV to an average of 505.6 mV and the dissolved oxygen (DO) concentration was increased from 5.91 mg/L to an average concentration of 8.62 mg/L post treatment. The change in pH is attributed to the dissolution of Ca ions from the pervious concrete, which was observed through the increase in the pre-treated AMD’s Ca concentration from 408 mg/L to an average concentration of 647 mg/L, refer to Figure 4C. The pre-treatment process was most effective at precipitating Fe and K with average concentration reduction rates of 99% and 94%, respectively. The effective precipitation of Fe can be attributed to the oxygen conditions due to increased DO resulting in the oxidation of Fe2+ to the highly insoluble Fe3+ [24] and precipitation as ferric iron compounds such as FeOOH [24,25]. The effective removal of K may be attributed to ion exchange with Na. This finding is supported by the increase in Na concentration from 224 mg/L to an average treated concentration of 243.3 mg/L.
The Al concentration was reduced by 43% from an initial concentration of 53.8 mg/L to an average concentration of 30.6 mg/L, refer to Figure 4B. The removal of Al from solution may be attributed to the formation of Al(OH)3 [25,26] as well as co-precipitation [27]. The Ni concentration was reduced by 26% to an average pre-treated concentration of 0.46 mg/L. The sorption and co-precipitation of Ni with the solid phase of Fe and Al precipitants may be associated with the reduction in Ni concentration as shown in the findings by Olds et al. (2013), where a linear trend between pH increase and Ni co-precipitation was observed [28]. The SO42− concentration was reduced by 13% from 1642 mg/L to an average concentration of 1446 mg/L (refer to Figure 4C). Shabalala et al. (2017) established that the precipitation of SO42− from AMD when using pozzolanic pervious concrete was attributed to the dissolution of Ca from the reactive surface of the PRB and the formation of gypsum precipitants [25]. The concentrations of Cu, Mg, Mn, Na, and Zn remained relatively unchanged following PRB treatment.
The precipitation of the discussed minerals resulted in an increase in the total suspended solids (TSS) from 10 mg/L to average concentration of 110 mg/L while total dissolved solids (TDS) concentration reduced by 13% from 3357 mg/L to average concentration of 2920 mg/L. Pre-treated AMD was homogenised and tested for settleability of the precipitated suspended solids. Three samples were collected in 50 mL glass beakers of 120 mm height. The suspended solids were allowed to completely settle. The average settling time required for complete sedimentation was 105 min. The settling rate equated to a settling velocity of 1.14 mm/min. Figure 5 shows the settleability test results. The AMD supernatant was further treated in the anaerobic digester.

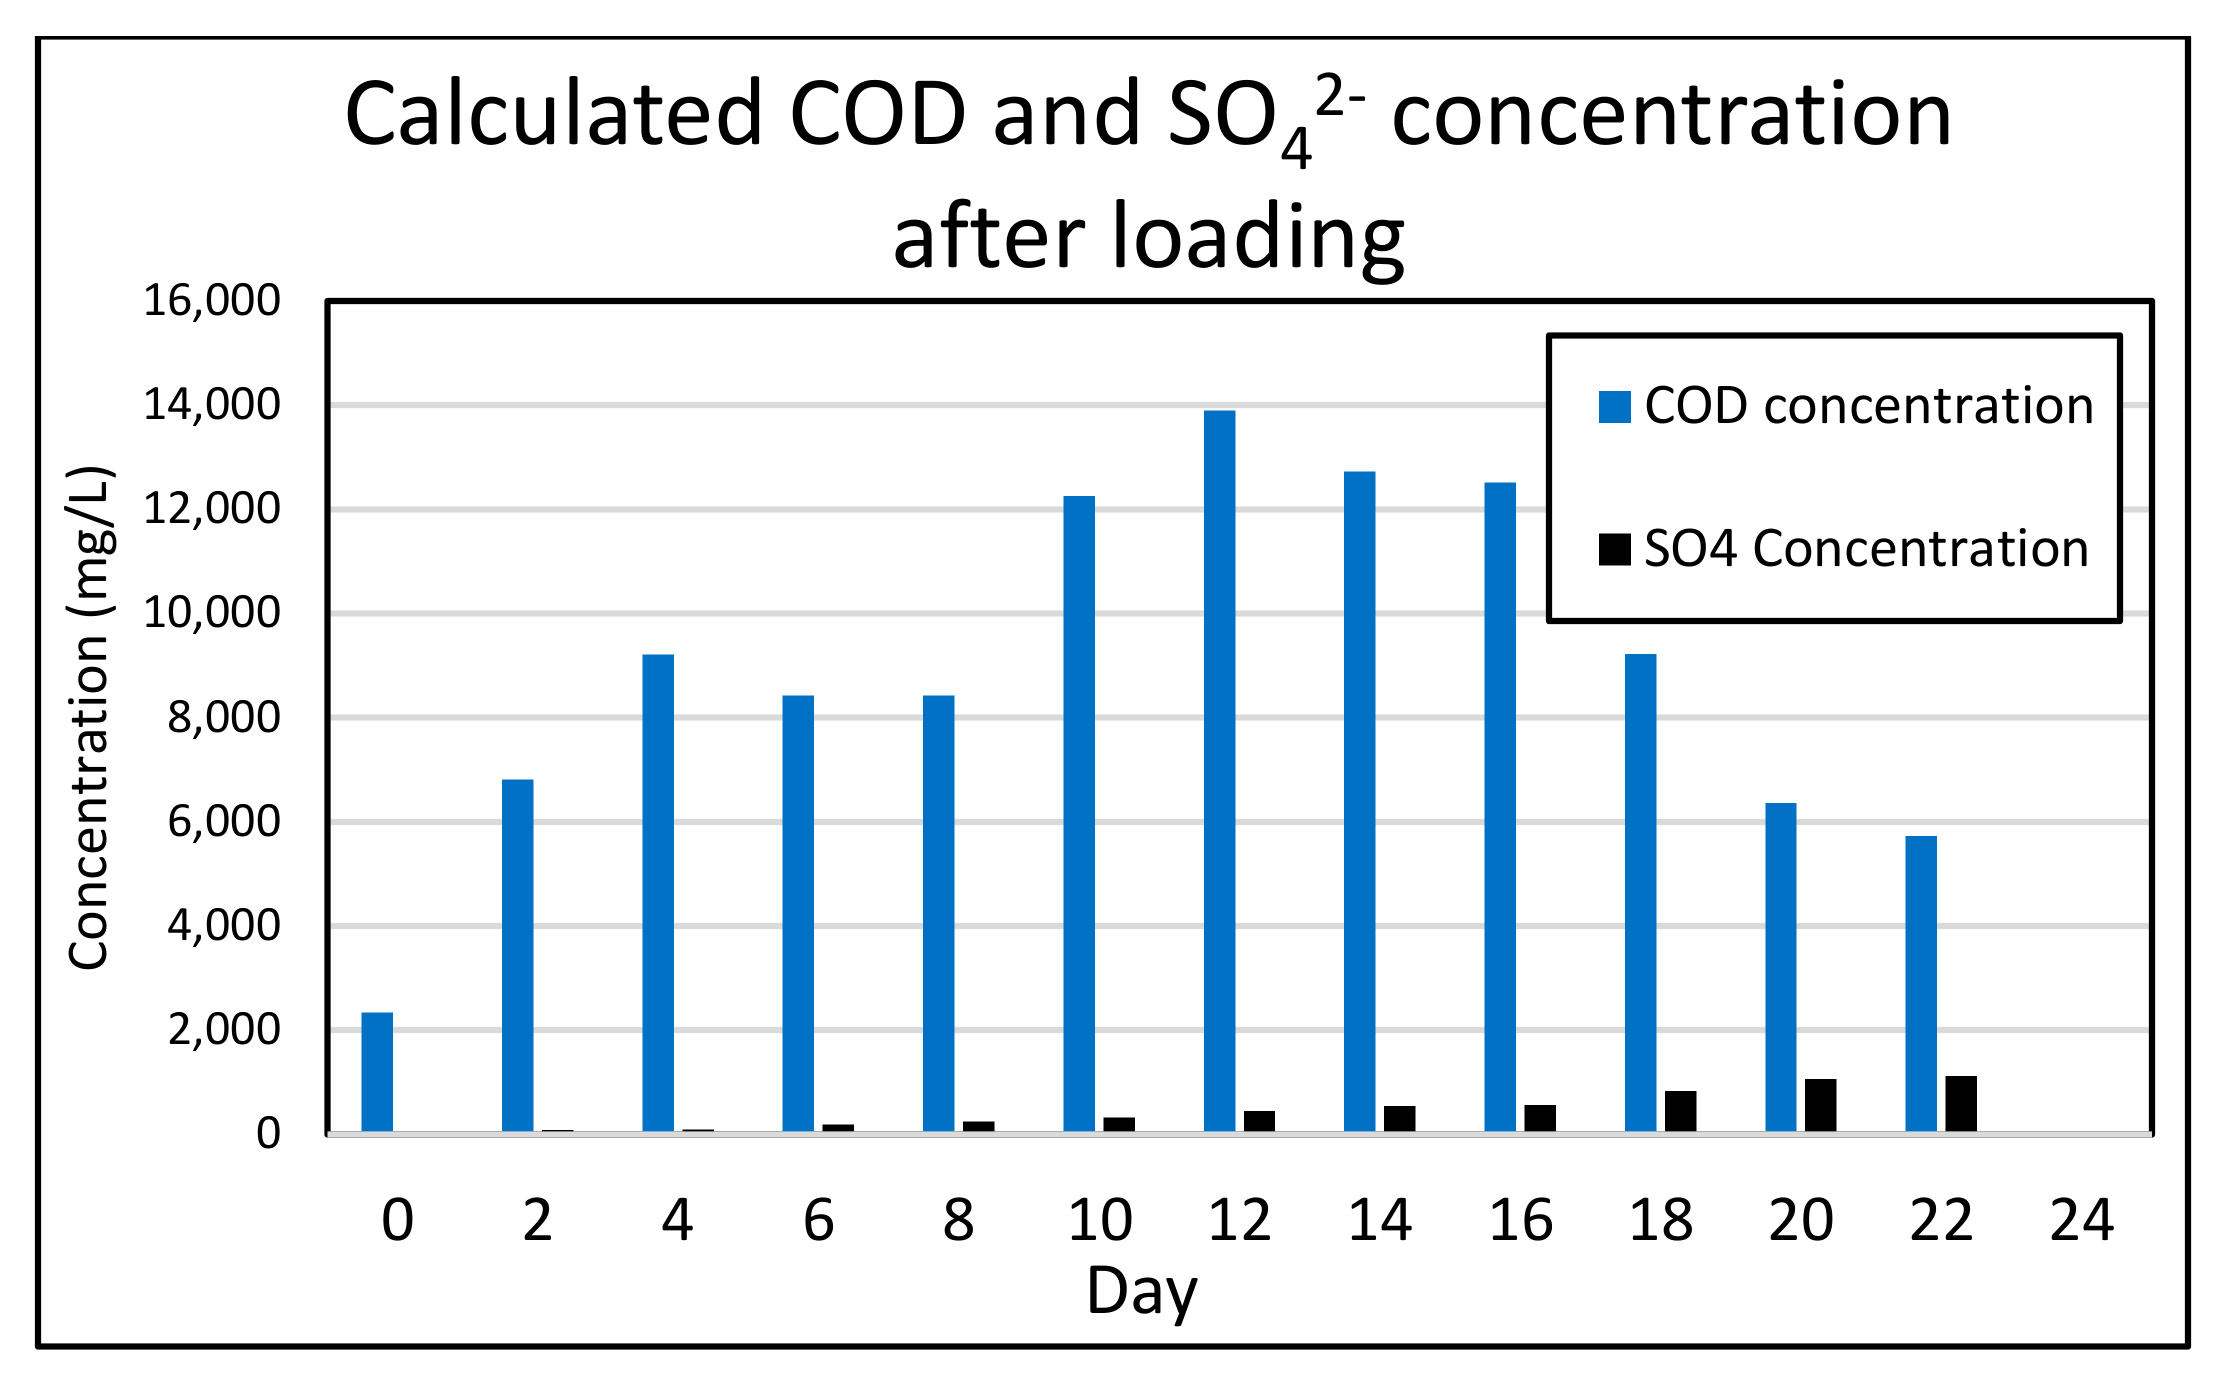
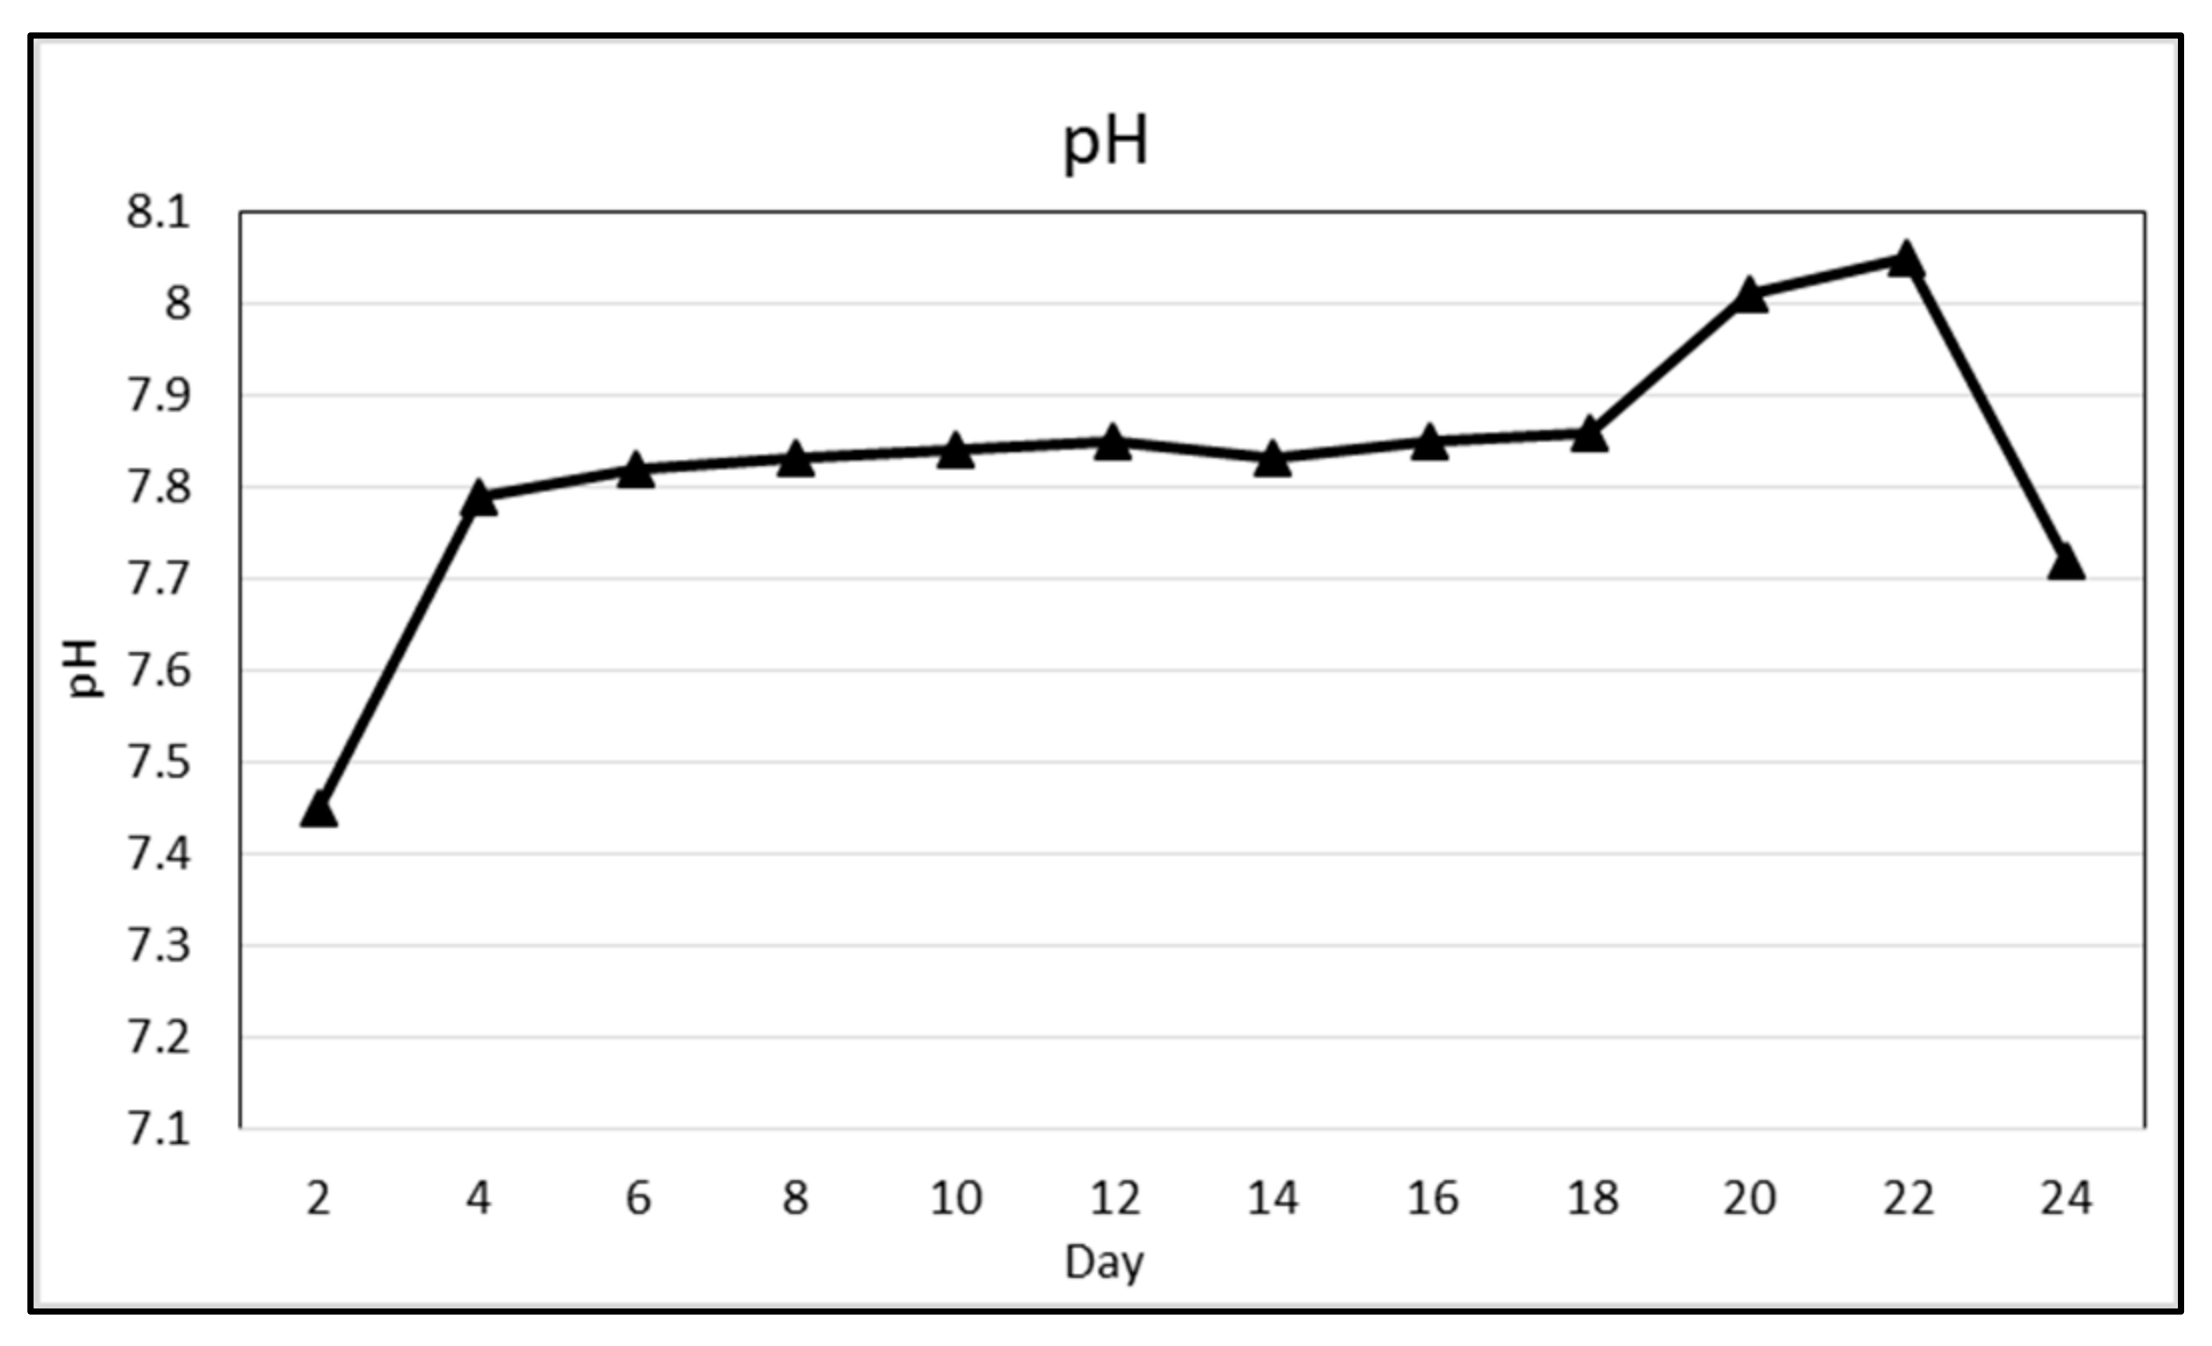
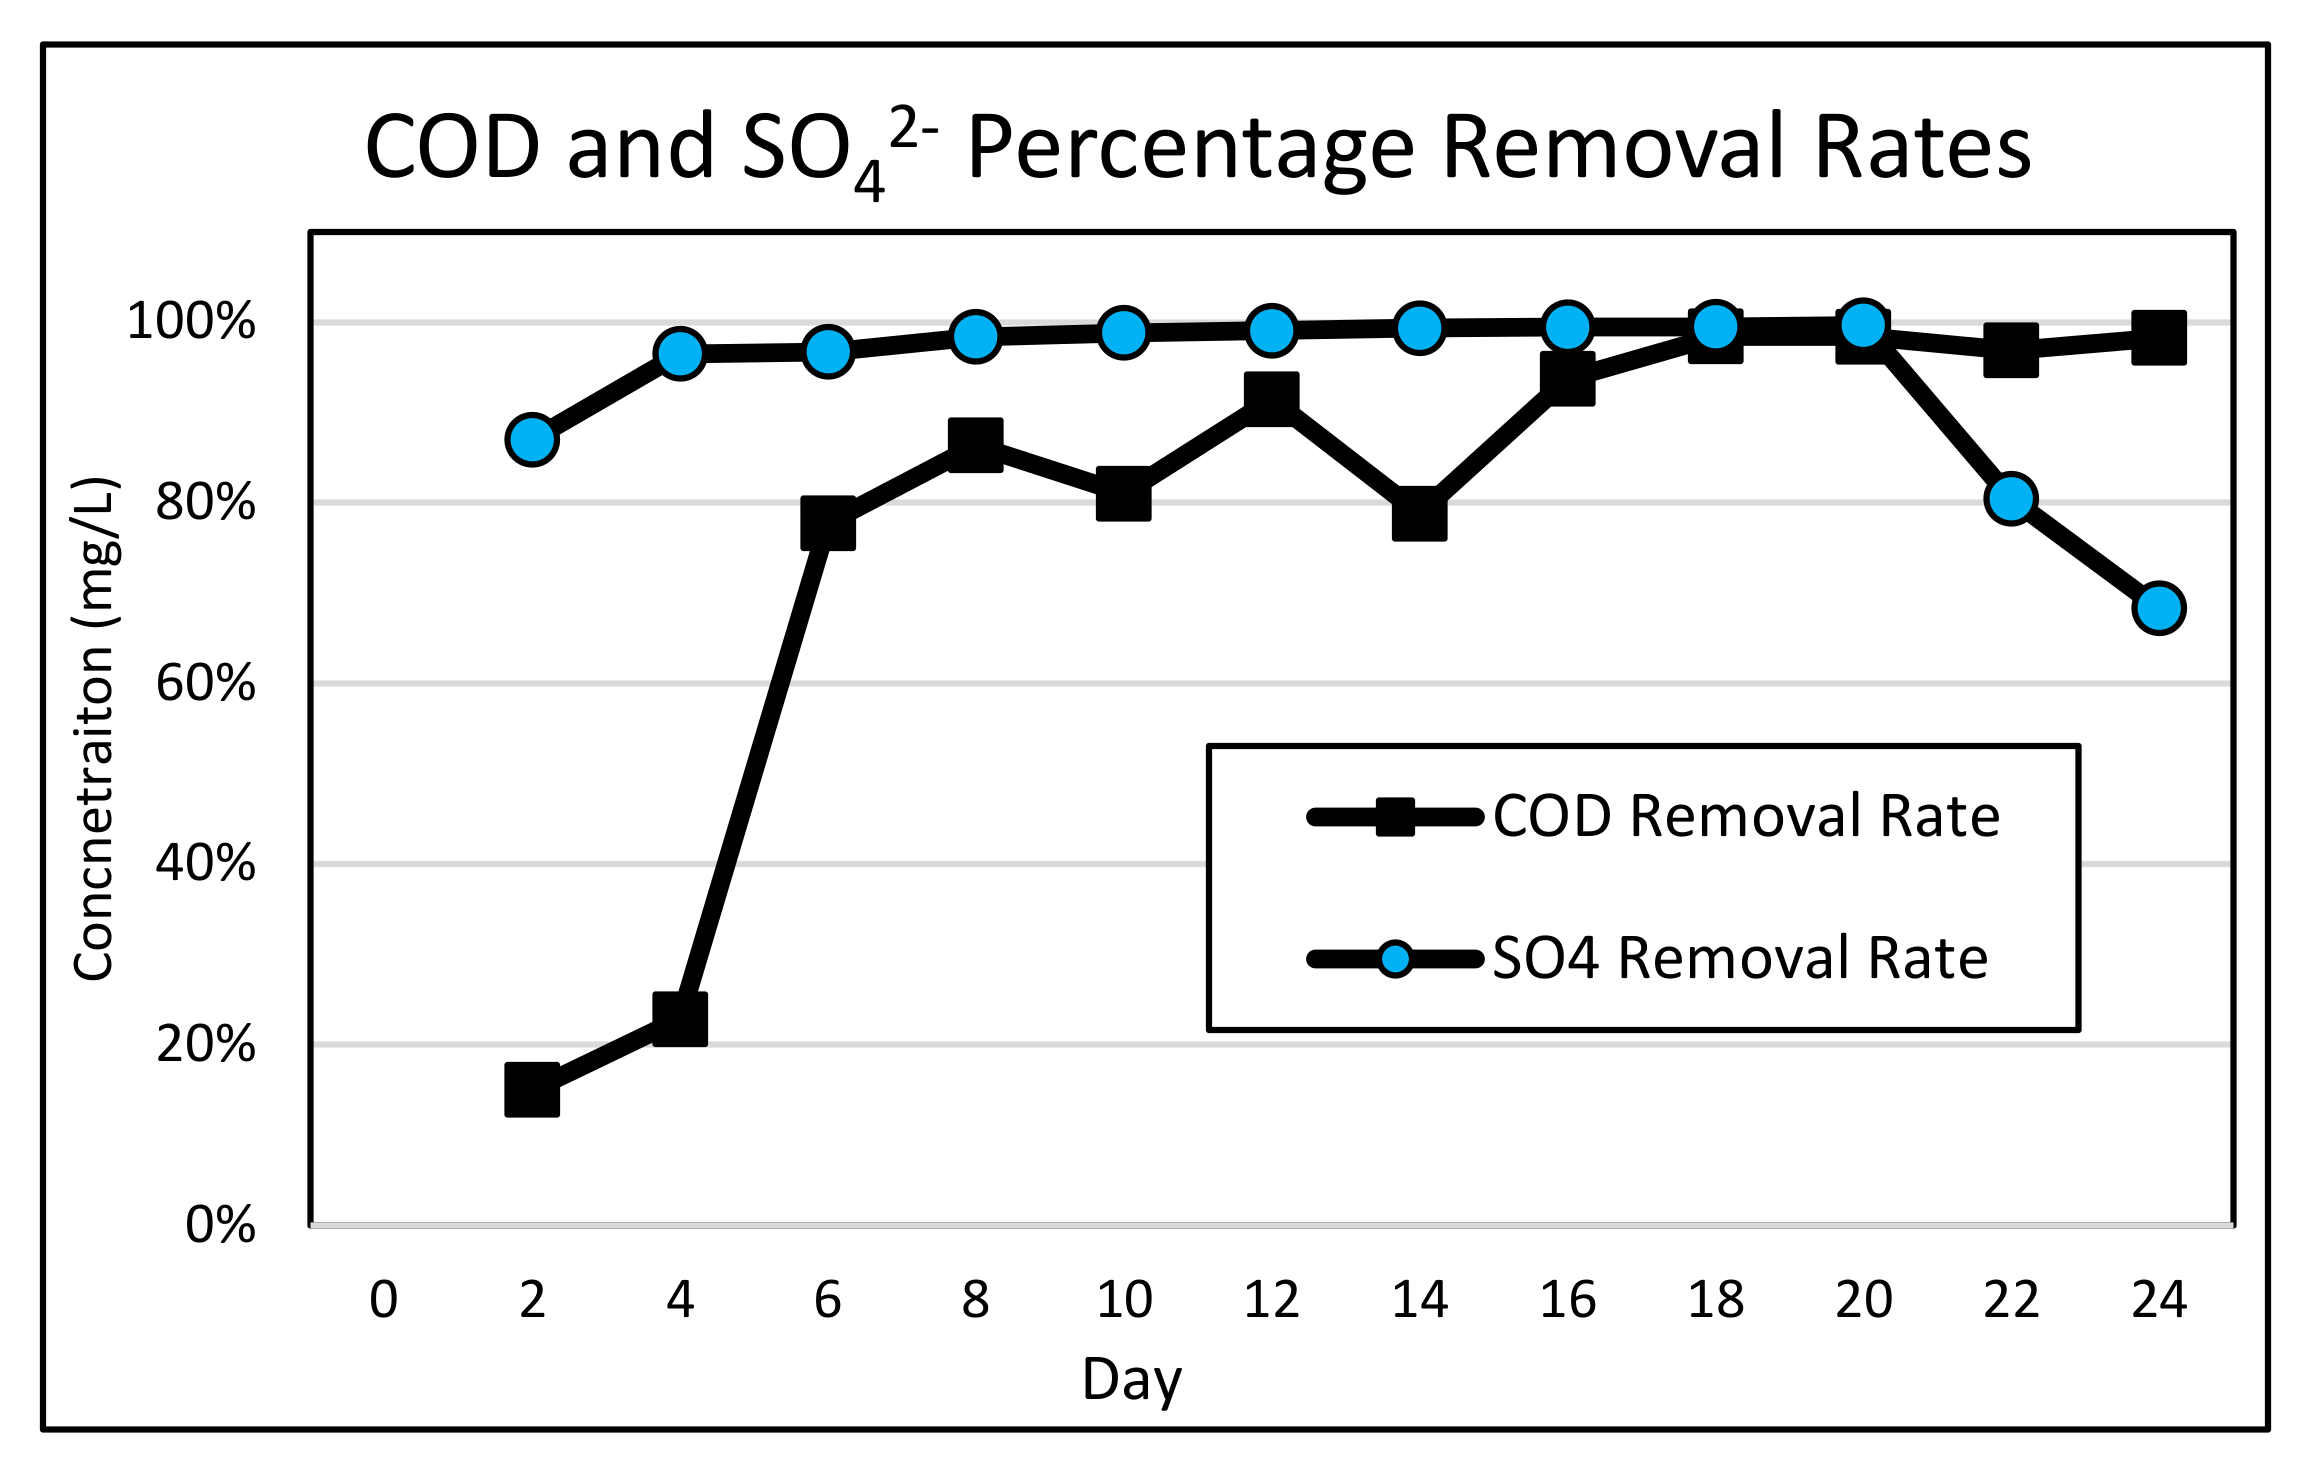
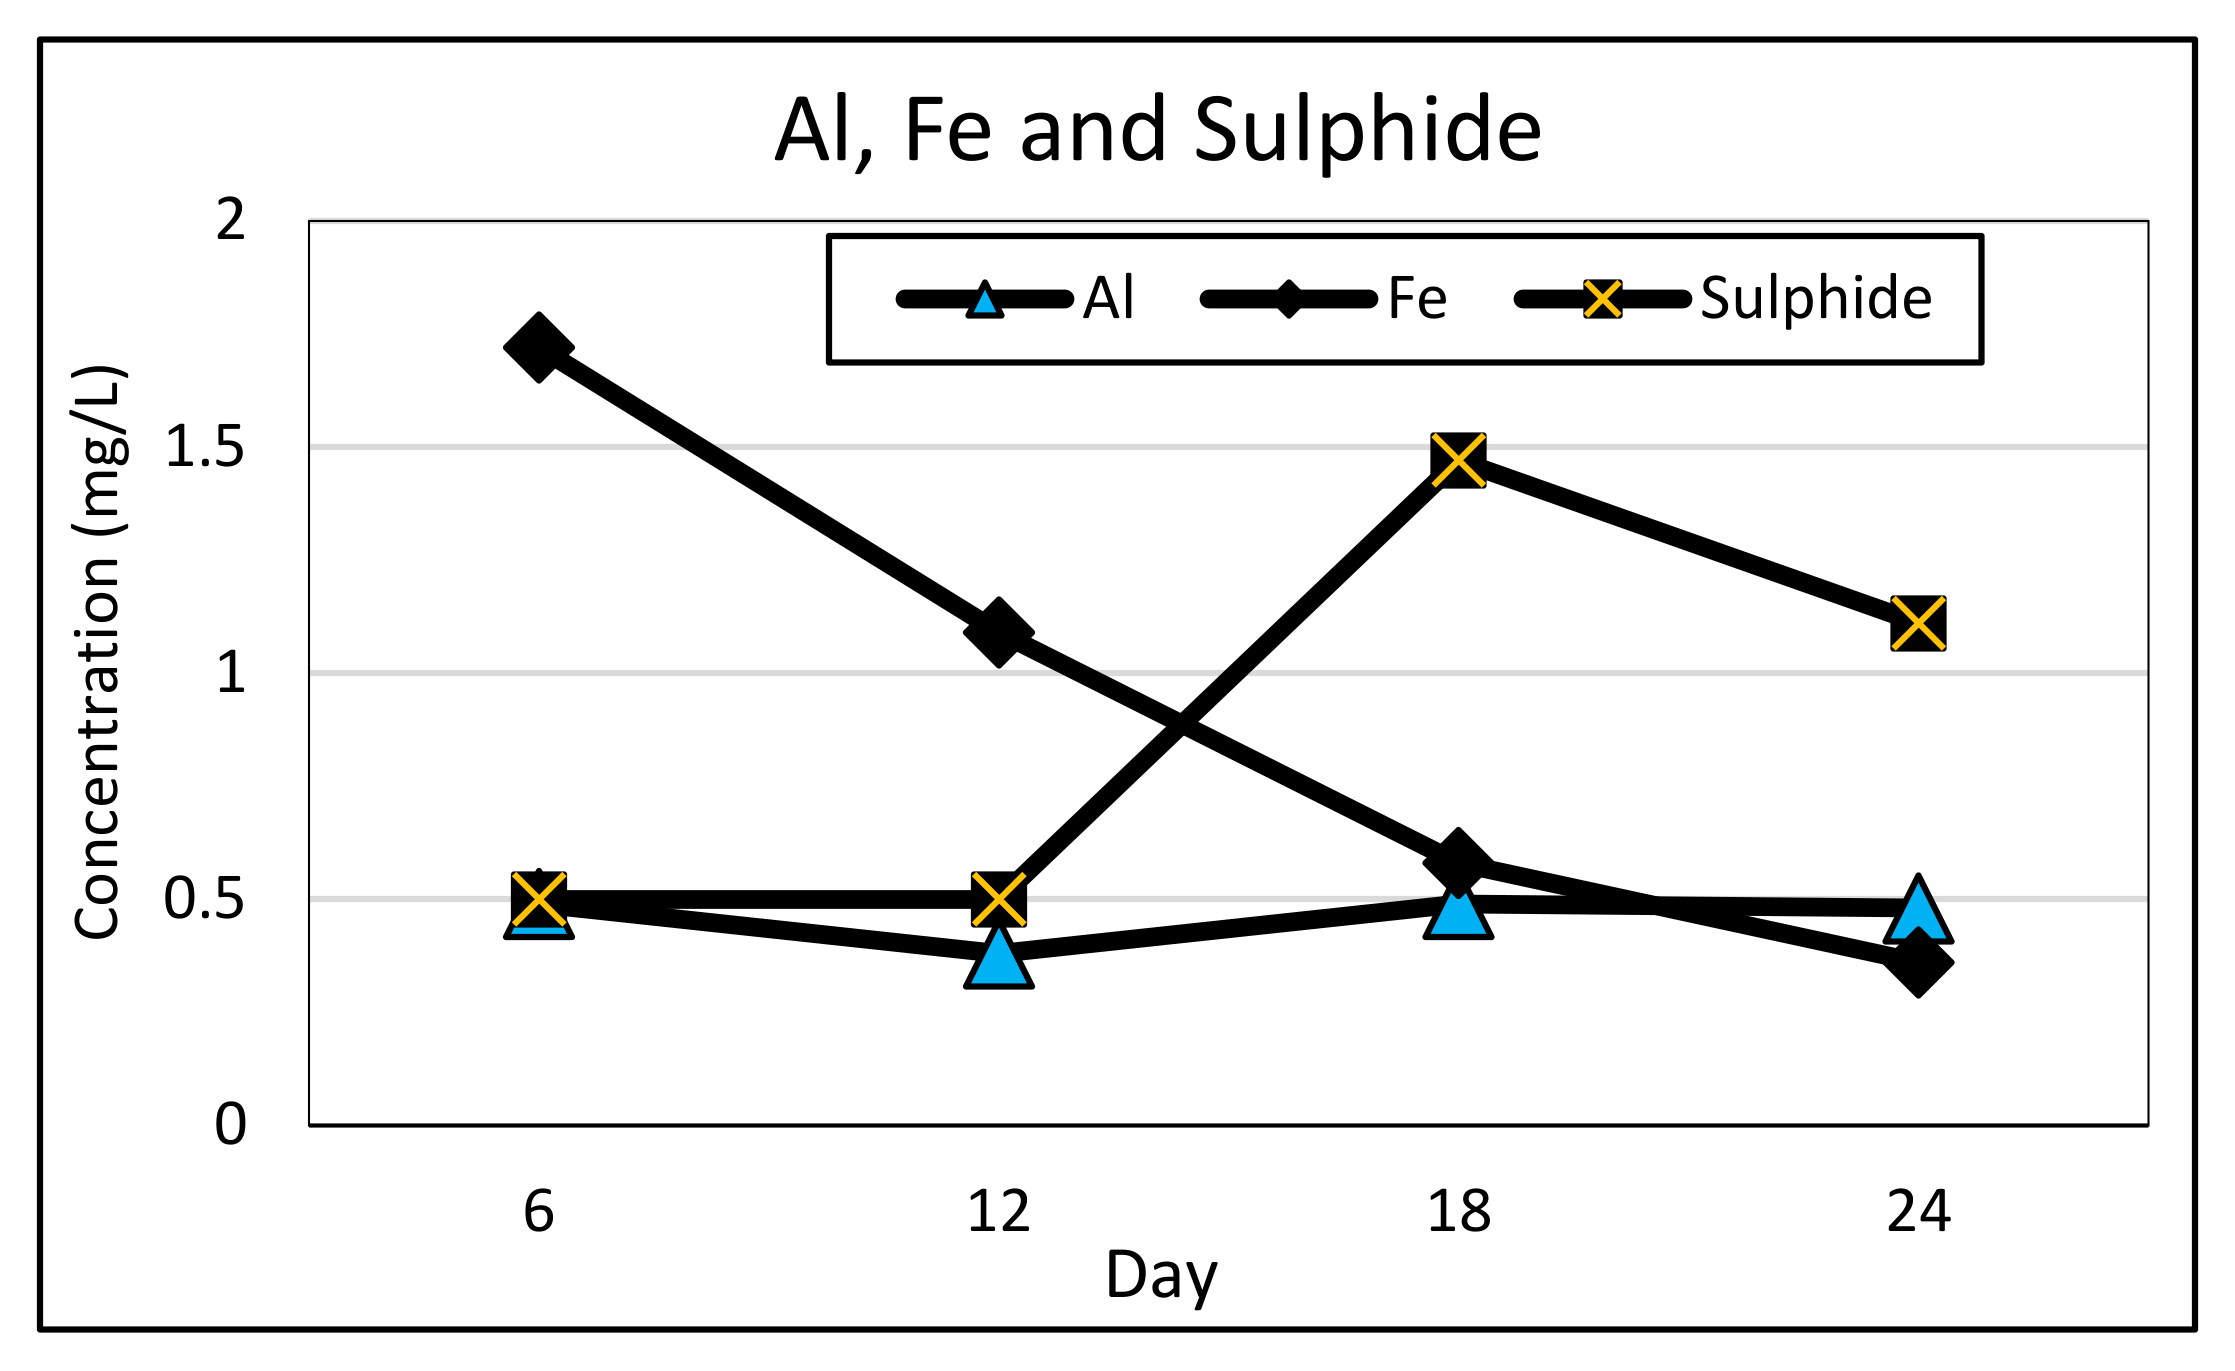
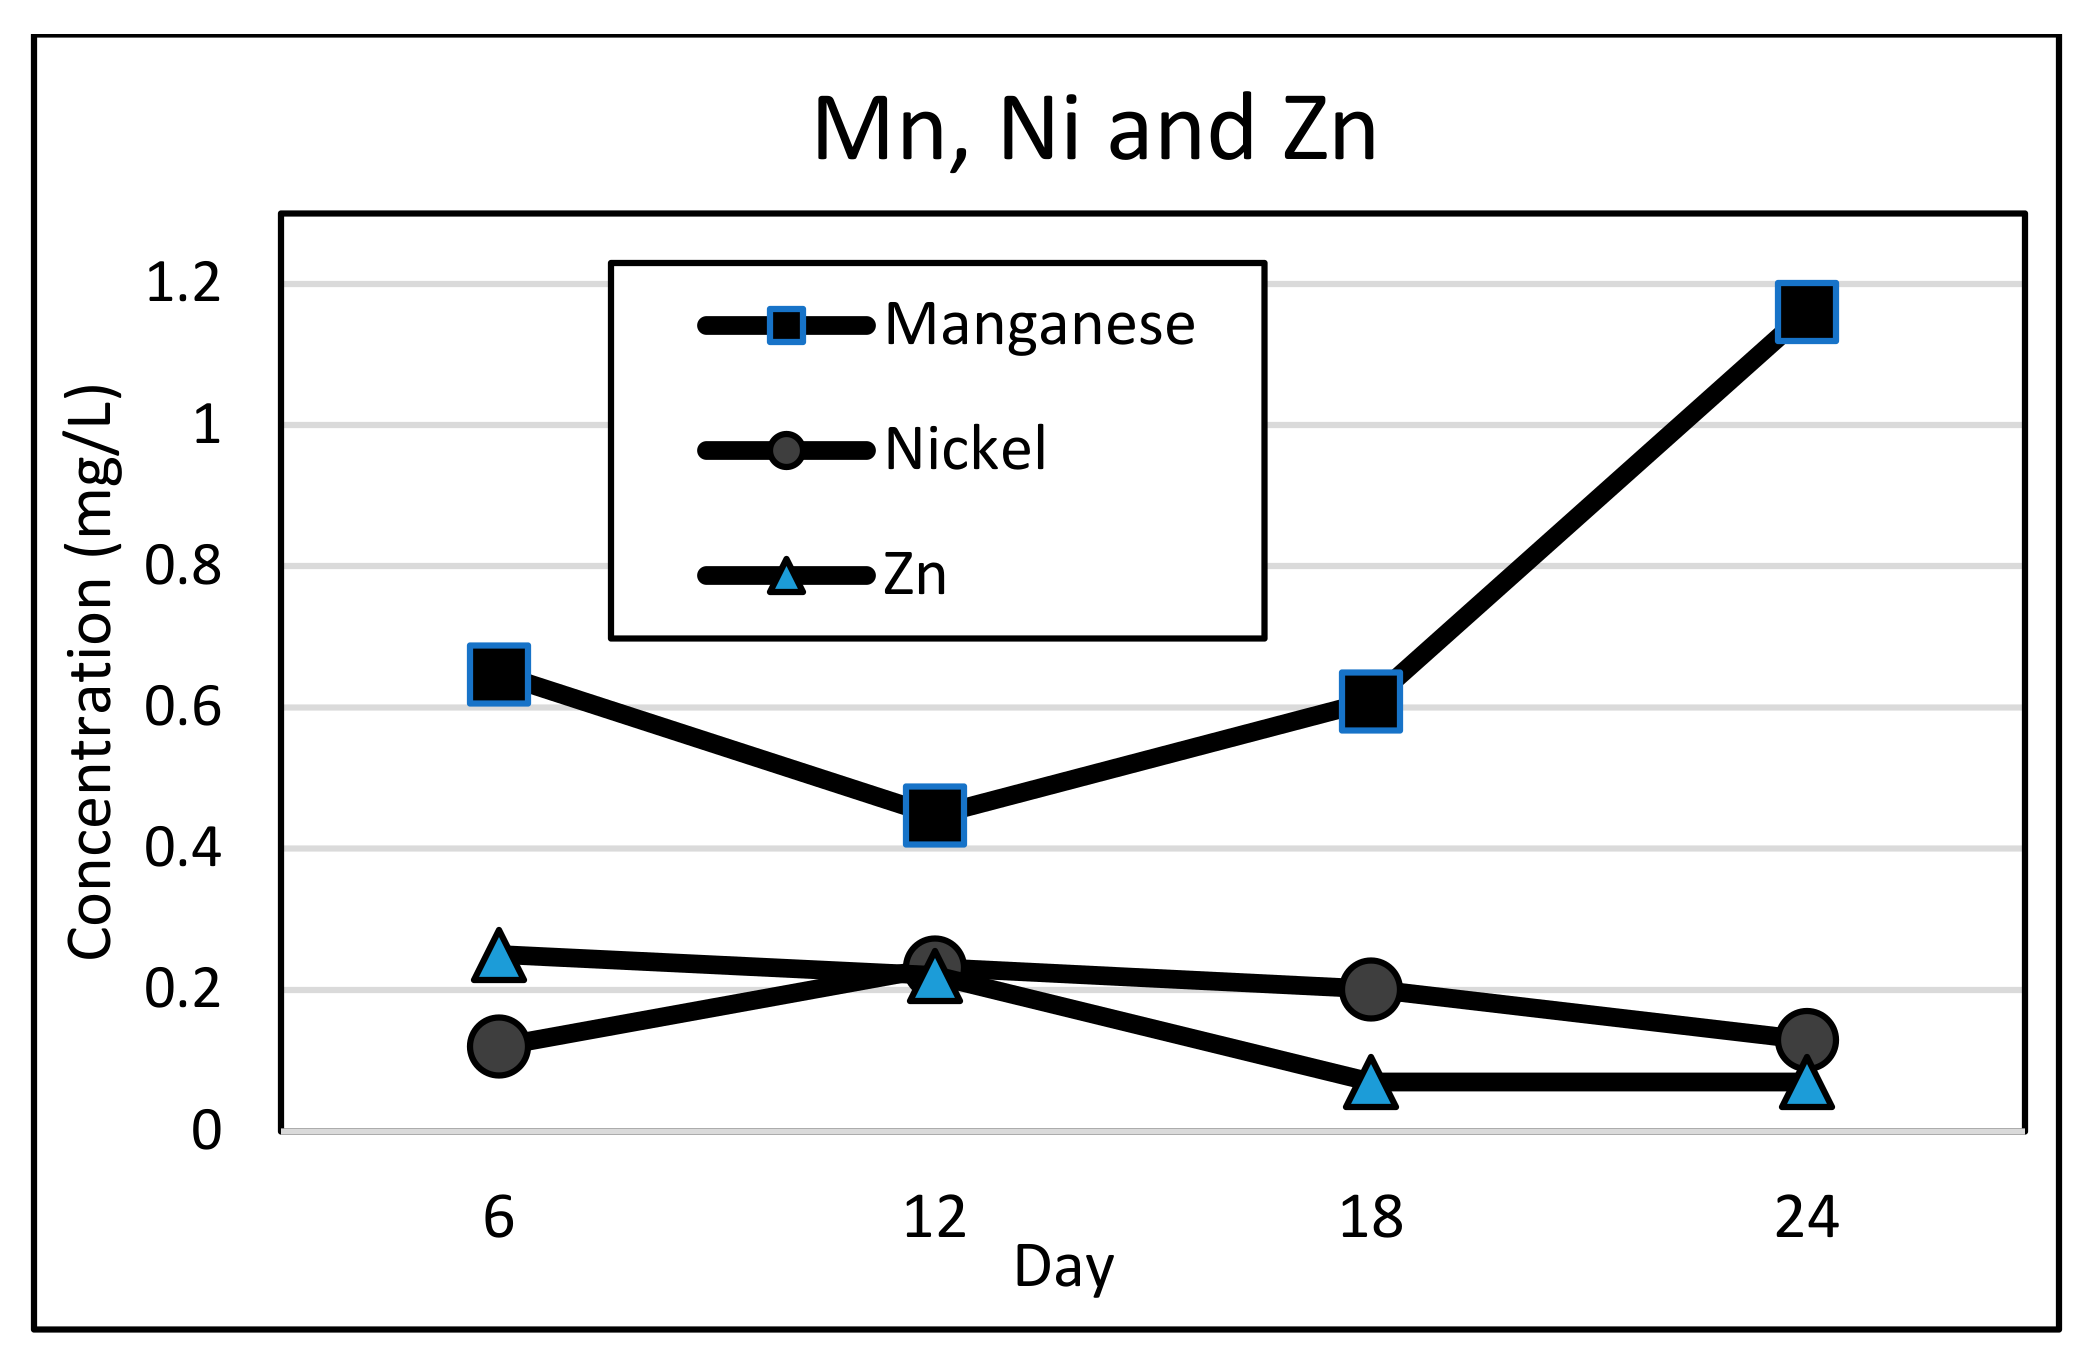
3.2. Biological Co-Remediation

The pre-treated AMD and industrial effluent were batch loaded into the digester for co-remediation in 48 h intervals. Figure 6 shows the calculated concentrations of SO42− from the AMD and COD from the effluent after loading. The calculated loading rates of SO42− and COD were determined using Equations (3) and (4), respectively. The pre-treated AMD and effluent had pH values of 3.68 and 3.43, respectively. Figure 7 shows the pH in 48 h intervals measured before the next batch loading of AMD and effluent. The results show that the process is capable of neutralising the acidity from the AMD and effluent to a pH range between 7.45 and 8.05 without any external chemical dosing. The neutralisation of pH is primarily attributed to the dissolution of Ca ions from the pervious concrete reactive medium [10]. This is supported by the increase in dissolved Ca concentration measured in the treated effluent stream from a concentration of 168 mg/L on day 6 to a final concentration of 480 mg/L on day 24 (refer to Figure 8A). The increase in pH may also be contributed by the alkalising methanogenic bacteria and sulphate reducing prokaryotes (SRP) present in the bioreactor sludge [6]. These microorganisms compete to breakdown volatile fatty acids (VFAs), resulting in the release of methane, hydrogen sulphide, and carbon dioxide.
Figure 8A shows the total acidity, SO42−, and Ca concentrations after 48 h of HRT between each loading regime while Figure 8B shows the COD and total alkalinity concentrations at the same periods. Figure 9 shows the percentage removal of SO42− and COD concentrations after 48 h of HRT between each loading regime. The treated water alkalinity was between 1449 mg/L and 2014 mg/L as a result of the alkalising capabilities of the reactive media while total acidity concentrations were maintained below 120 mg/L throughout the experiment. A high degree of COD bioremediation was achieved in the study with an overall COD removal rate of 78% for the experimental duration and peak removal rates exceeding 90% from days 16 to 20 when COD loading was the highest. At peak loading, exceeding 6 kg COD/m3/day, the bioreactor was capable of treating COD concentrations of 12,512 mg/L to below 300 mg/L. The bioremediation of SO42− was also high with an overall removal rate of 94% for the experimental duration. At peak loading, SO42− concentrations were reduced from 830 mg/L to below 10 mg/L. The high degree of SO42− remediation can be attributed to the rapid biodegradation of the glucose based confectionary effluent, enabling the availability of the VFA intermediaries required for biological sulphate reduction [10]. The use of granular seed sludge has also been attributed to accelerated bioreactor ramp-ups and improved resistance against organic shock loading [29].
Figure 10 shows the concentrations of Al, Fe, and S2− samples taken in six day intervals. The concentrations of Al were below 1 mg/L as a result of the high pH, allowing for the precipitation of aluminium hydroxide. Concentrations of Fe remained below 1 mg/L following biological treatment. An increase in the concentration of S2− was observed, which can be attributed to the biological reduction of SO42− to H2S gas by SRP and some sulphide being dissolved in solution.
Toxic metals Ni, Mn, and Zn were pre-treated to average concentrations of 0.461 mg/L, 13.3 mg/L, and 1.025 mg/L, respectively. Figure 11 shows the concentrations of Mn, Ni, Cu, and Zn following biological treatment. The average concentrations of Ni, Mn, and Zn in the treated effluent were 0.171 mg/L, 0.716 mg/L, and 0.153 mg/L, respectively. The reduction in concentrations of these toxic metals may be primarily attributed to the neutralisation of pH, resulting in precipitation as metal hydroxides and metal sulphides.

4. Discussions

The results for the AMD pre-treatment process found that Fe could be precipitated effectively in a short contact time of 37 s, which can result in small footprint requirements. The high removal of Fe during pre-treatment, which exceeded 99%, and the settleability of the suspended ions presents an opportunity for the recovery of Fe from the settled sludge for reuse. The other major ions present in the precipitant sludge was Al, where a 43% concentration removal was achieved, presenting further mineral recovery opportunity. Table 5 shows the raw and treated wastewater quality and the South African water quality standards for discharge and potable quality. The treated wastewater quality is the average biological treated quality achieved throughout the experimental duration. The raw pH, COD, SO42−, Mn, Ni, Fe, and Al concentrations significantly exceeded the guidelines for discharge. Following co-biological treatment, the treated wastewater determinands pH, SO42−, and Cu were within the discharge and potable water specifications. Concentrations of Fe, Al, Mn, and Zn were marginally higher than the discharge and potable water limit with all concentrations exceeding the limit by less than 0.65 mg/L. The average percentage reduction in the final treated water concentrations of Ni, Zn, Mn, Al, Fe, and SO42− were 74%, 85%, 94%, 99%, 99%, and 96.98%, respectively. Although a high concentration removal efficiency of 89.7% was achieved for the COD throughout the experiment, the average treated wastewater concentration achieved was 3.75 times greater than the discharge limit. During peak COD loading over the final six days of experimental operation, the bioreactor demonstrated capabilities of achieving COD concentrations of 200 mg/L, well below the 400 mg/L discharge limit, with up to 98.9% concentration removal.
Easily biodegradable high COD confectionary effluent was used as the sole carbon source in this study. The major difference in this approach versus the more conventional use of complex organic matter is that the slower biodegradation of complex carbons allows for optimal anaerobic digestion at a low COD to SO42− ratio of typically 2:1 [14]. When using easily biodegradable organic matter, COD to SO42− ratios below 5:1 have been found to be rate limiting [10]. However, the effluent liquid volume used during operation in this study versus the liquid volume required by low COD complex matter was less than 10% due to the high COD concentration of the untreated effluent, which exceeded 19,000 mg/L. In comparison, sewage COD concentrations typically range between 600 and 900 mg/L. The transportation of carbon is a major cost driver in active AMD anaerobic digestion [30,31]. The lower effluent volume requirement for continuous operation when using high COD easily degradable substrates can significantly lower the costs associated with biological sulphate reduction. The added benefit of effective co-remediation of AMD with another toxic industrial wastewater is the increased commercial viability of the process with cost sharing opportunities amongst parties.
Existing bioremediation processes are limited to the remediation of partially oxidised and neutralised AMD with low heavy metal concentrations [16,19,30]. The typical pre-treatment undertaken for conventional bioremediation is chemical neutralisation and sedimentation where metals are precipitated through pH correction and oxidation. The required chemical pre-treatment adds operational cost and supply chain complexity to existing bioremediation solutions. The active–passive process evaluated in this paper, however, is capable of neutralising highly acidic AMD and effluent passively through the dissolution of Ca from the reactive surface of pervious concrete. This research found that the process is capable of self-regulated pH neutralisation at COD loading rates exceeding 6 kg COD/m3/day and SO42− loading rates approaching 1 kg SO42−/m3/day. This pH self-regulating capability can eliminate the need for external chemical dosing, leading to operational cost savings. The main challenge associated with AMD treatment using pervious concrete is the accumulation of metal precipitants in the flow path [25]. The AMD pre-treatment results indicate that approximately 23% of the precipitated solid concentration exit the pervious concrete as suspended solids. The remaining 77% of precipitated solids remain inside the porous network of the pervious concrete, which can lead to clogging of the flow path or armouring of the reactive surface over time. In the fixed bed pervious concrete anaerobic digester, further precipitation of solids was observed and similarly, armouring or clogging may take place over time. The longevity of pervious concrete as a PRB when exposed to solids accumulating is yet to be fully understood and requires further investigation.

5. Conclusions

This study was undertaken to evaluate the remediation capabilities of a hybrid active–passive process on AMD and confectionery effluent treatment. The process comprised of passive PRB pre-treatment of the AMD and co-bioremediation of AMD and confectionery effluent. Over the 24 day operation of the bioreactor, the research findings showed that the process was capable of treating pH, SO42−, Fe, Al, and Cu to within the discharge standards. The COD discharge limit of 400 mg/L was achieved during the final six days of operational under peak COD loading rates exceeding 6 kg COD/m3/day. The treated concentrations of Fe, Al, Ni, Mn, and Zn exceeded the DWA discharge limit by less than 0.65 mg/L. The process was found to be effective for treatment and the limited operational inputs could minimise operational costs, allowing the process to be more financially viable for abandoned mines where AMD discharge is most prevalent. From an operational and cost prospectively, the greatest limitation towards the largescale implementation of the developed process is the transportation of effluent to mine sites. Excessive fluctuations in chemical composition of AMD and effluent may also pose operational challenges when regulating the AMD to effluent ratios. The process possesses great potential for economical and environmentally friendly treatment of AMD and effluent streams. Further evaluation is required to assess the sensitivity of the process to condition changes and the operational longevity of pervious concrete as a fixed bed reactive medium in an anaerobic digestion.

Author Contributions

Conceptualization, S.K.T.; Methodology, S.K.T.; Formal analysis, S.K.T.; Resources, D.V.V.K. and S.K.T.; Writing—original draft preparation, S.K.T.; Writing—review and editing, D.V.V.K. and P.B.; Supervision, D.V.V.K. and P.B.; Funding acquisition, D.V.V.K. All authors have read and agreed to the published version of the manuscript.

Funding

This research was funded by the South African Systems Analysis Centre (SASAC)—Newton Fund. The funding was facilitated by SASAC and the British Council through the South African National Research Foundation (NRF). The open access funding was provided by the University of Johannesburg Library, Doonfontein Campus (DFC), Doonfontein, Johannesburg 2006, South Africa.

Data Availability Statement

Data are contained within the article.

Acknowledgments

We would like to acknowledge the South African Systems Analysis Centre (SASAC)—Newton Fund for funding this research. We would also like to acknowledge the South African National Research Foundation (NRF) and the British Council for facilitating the funding.

Conflicts of Interest

The authors declare no conflict of interest.

References

  1. Byrne, P.; Wood, P.J.; Reid, I. The Impairment of River Systems by Metal Mine Contamination: A Review Including Remediation Options. Crit. Rev. Environ. Sci. Technol. 2012, 42, 2017–2077. [Google Scholar]
  2. Park, I.; Tabelin, C.B.; Jeon, S.; Li, X.; Seno, K.; Ito, M.; Hiroyoshi, N. A review of recent strategies for acid mine drainage prevention and mine tailings recycling. Chemosphere 2019, 219, 588–606. [Google Scholar] [PubMed]
  3. Taylor, J.; Pape, S.; Murphy, N. A Summary of Passive and Active Treatment Technologies for Acid and Metalliferous Drainage (AMD); Earth Systems: Frementle, Australia, 2005. [Google Scholar]
  4. Thisani, S.; Kallon, D.; Byrne, P. Geochemical Classification of Global Mine Water Drainage. Sustainability 2020, 12, 10244. [Google Scholar]
  5. Gunes, B.; Stokes, J.; Davis, P.; Connolly, C.; Lawler, J. Pre-treatments to enhance biogas yield and quality from anaerobic digestion of whiskey distillery and brewery wastes: A review. Renew. Sustain. Energy Rev. 2019, 113, 109281. [Google Scholar]
  6. Opollo, S.O. Integrated Anaerobic Digestion and UV Photocatalytic Treatment of Industrial Wastewater in Fluidized Bed Reactors. Ph.D. Thesis, Vaal University of Technology, Vanderbjilpark, South Africa, 2016. [Google Scholar]
  7. Ahmad, T.; Aadil, R.M.; Ahmed, H.; Rahman, U.U.; Soares, B.C.; DE Souza, S.L.Q.; Pimentel, T.C.; Scudino, H.; Guimarães, J.T.; Esmerino, E.A.; et al. Treatment and utilization of dairy industrial waste: A review. Trends Food Sci. Technol. 2019, 88, 361–372. [Google Scholar]
  8. Li, J.; Luo, G.; He, L.; Xu, J.; Lyu, J. Analytical Approaches for Determining Chemical Oxygen Demand in Water Bodies: A Review. Crit. Rev. Anal. Chem. 2018, 48, 47–65. [Google Scholar]
  9. Papirio, S.; Villa-Gomez, D.K.; Esposito, G.; Pirozzi, F.; Lens, P.N. Acid Mine Drainage Treatment in Fluidized Bed Bioreactors by Sulfate Reducing Bacteria: A Critical Review. Critical Rev. Environ. Sci. Technol. 2013, 43, 2545–2580. [Google Scholar]
  10. Thisani, S.K.; Kallon, D.V.V.; Byrne, P. A fixed bed pervious concrete anaerobic bioreactor for biological sulphate remediation of acid mine drainage using simple organic matter. Sustainability 2021, 13, 6529. [Google Scholar]
  11. Akinpelu, E.A.; Ntwampe, S.K.O.; Fosso-Kankeu, E.; Waanders, F. Comparative analysis of brewing wastewater and lactate as carbon sources for microbial community treating acid mine drainage in anaerobic MBBR systems. Environ. Technol. 2020, 42, 3955–3962. [Google Scholar]
  12. Moodley, I.; Sheridan, C.M.; Kappelmeyer, U.; Akcil, A. Environmentally sustainable acid mine drainage remediation: Research developments with a focus on waste/by-products. Miner. Eng. 2018, 126, 207–220. [Google Scholar]
  13. Novhe, O.; Yibas, B.; Coetzee, H.; Atanasova, M.; Netshitungulwana, R.; Modiba, M.; Mashalane, T. Long-Term Remediation of Acid Mine Drainage from Abandoned Coal Mine Using Integrated (Anaerobic and Aerobic) Passive Treatment System, in South Africa: A Pilot Study. In Proceedings of the International Mine Water Association Conference, Freiberg, Germany, 11–15 July 2016; pp. 668–674. [Google Scholar]
  14. Rose, P. Review: Long-term sustainability in the management of acid mine drainage wastewaters—Development of the Rhodes BioSURE Process. Water SA 2013, 39, 582. [Google Scholar]
  15. Sun, R.; Li, Y.; Lin, N.; Ou, C.; Wang, W.; Zhang, L.; Jiang, F. Removal of heavy metals using a novel sulfidogenic AMD treatment system with sulfur reduction: Configuration, performance, critical parameters and economic analysis. Environ. Int. 2020, 136, 105457. [Google Scholar]
  16. Neda, A.; Whittington-Jones, K.; Rose, P.D. Salinity, Sanitation and Sustainability Vol. 4: The Rhodes BioSURE Process; Water Research Commission: Pretoria, South Africa, 2007; Volume 4. [Google Scholar]
  17. Pionapen, J.; Wentzel, M.C.; Ekama, G.A. Biological sulphate reduction with primary sewage sludge in an upflow anaerobic sludge bed (UASB) reactor—Part 1: Feasibility study. Water SA 2009, 35, 525–534. [Google Scholar]
  18. Thisani, S.; Kallon, D.; Byrne, P. Review of Remediation Solutions for Acid Mine Drainage Using the Modified Hill Framework. Sustainability 2021, 13, 8118. [Google Scholar]
  19. Kaksonen, A.H.; Sahinhaya, E. Review of sulfate reduction based bioprocesses for acid mine drainage treatment and metals recovery. Eng. Life Sci. 2007, 7, 541–564. [Google Scholar]
  20. Opollo, S.; Aoyi, O. Combined anaerobic digestion and photocatalytic treatment of distillery effluent in fluidized bed reactors focusing on energy conservation. Environ. Technol. 2016, 37, 2243–2251. [Google Scholar]
  21. Sánchez, E.; Borja, R.; Travieso, L.; Martín, A.; Colmenarejo, M.F. Effect of organic loading rate on the stability, operational parameters and performance of a secondary upflow anaerobic sludge bed reactor treating piggery waste. Bioresour. Technol. 2005, 3, 335–344. [Google Scholar]
  22. Rosanti, D.; Wibowo, Y.G.; Safri, M.; Maryani, A.T.; Ramadhan, R.S. Bioremediations Technologies on Wastewater Treatment: Opportunities, Challenges and Economic Perspective. Sainmatika J. Ilm. Mat. Ilmu Pengetah. Alam 2020, 17, 142–156. [Google Scholar]
  23. Thisani, S.K.; Von Kallon, D.V.; Byrne, P. Effects of Contact Time and Flow Configuration on the Acid Mine Drainage Remediation Capabilities of Pervious Concrete. Sustainability 2021, 13, 10847. [Google Scholar]
  24. Suponik, T. Ensuring permeable reactive barrier efficacy and longevity. Arch. Environ. Prot. 2010, 36, 59–73. [Google Scholar]
  25. Shabalala, A.N.; Ekolu, S.O.; Diop, S.; Solomon, F. Pervious concrete reactive barrier for removal of heavy metals from acid mine drainage-column study. J. Hazard. Mater. 2017, 323, 641–653. [Google Scholar] [PubMed]
  26. Majersky, G. Metals Recovery from Acid Mine Drainage Using Pervious Concrete; VDM Publishing: Saarbrucken, Germany, 2009; p. 69. [Google Scholar]
  27. Solpuker, U.; Sheets, J.; Kim, Y.; Schwartz, F.W. Leaching potential of pervious concrete and immobilization of Cu, Pb and Zn using pervious concrete. J. Contam. Hydrol. 2014, 161, 35–48. [Google Scholar] [PubMed]
  28. Olds, W.E.; Tsang, D.C.W.; Weber, P.A.; Weisener, C.G. Nickel and Zinc Removal from Acid Mine Drainage: Roles of Sludge Surface Area and Neutralising Agents. J. Min. 2013, 2013, 698031. [Google Scholar]
  29. Rico, C.; Montes, J.A.; Rico, J.L. Evaluation of different types of anaerobic seed sludge for the high rate anaerobic digestion of pig slurry in UASB reactors. Bioresour. Technol. 2017, 238, 147–156. [Google Scholar]
  30. Gilbert, O.; de Pablo, J.; Cortina, J.L.; Ayora, C. Chemical characterization of natural organic substrates for biological mitigation of acid mine drainage. Water Res. 2004, 38, 4186–4196. [Google Scholar]
  31. Zhou, S.; Wang, J.; Peng, S.; Chen, T.; Yue, Z. Anaerobic co-digestion of landfill leachate and acid mine drainage using up-flow anaerobic sludge blanket reactor. Environ. Sci. Pollut. Res. 2021, 28, 8498–8506. [Google Scholar]
Figure 1. Permeable reactive barrier pre-treatment.
Minerals 12 00565 g001
Figure 2. Schematic layout of the bioreactor.
Minerals 12 00565 g002
Figure 3. Granular seed sludge.
Minerals 12 00565 g003
Figure 4. Pre-treatment results: (A) results for ORP and pH, (B) results for Fe, Al, TSS and Mn, (C) results for SO42−, TDS, Ca, Na and Mg, (D) results for K, Zn, Cu and DO.
Minerals 12 00565 g004
Figure 5. Settleability of pre-treated AMD.
Minerals 12 00565 g005
Figure 6. Calculated COD and SO42− concentrations following loading.
Minerals 12 00565 g006
Figure 7. pH readings at 48 h intervals from loading.
Minerals 12 00565 g007
Figure 8. Treated COD, alkalinity, VFA, and SO42−: (A) Results for VFA, SO42−, Ca, (B) Results for COD and total alkalinity.
Minerals 12 00565 g008
Figure 9. COD and SO42− percentage removal rates.
Minerals 12 00565 g009
Figure 10. Treated Al, Fe, S2, and Zn.
Minerals 12 00565 g010
Figure 11. Treated Mn, Ni, and Zn.
Minerals 12 00565 g011
Table 1. Acid mine drainage determinands. DO—Dissolved Oxygen; ORP—Oxygen Reduction Potential.
DO
(mg/L)
ORP
(mV)
pHSO4 (mg/L)TDS (mg/L)TSS (mg/L)Al (mg/L)Ca (mg/L)Cu
(µm/L)
Fe (mg/L)K (mg/L)Mg (mg/L)Mn (mg/L)Na (mg/L)Ni (mg/L)Zn (mg/L)
5.91636.62.56164233571053.840813.11049.3130612.82240.621.02
Table 2. Effluent determinands.
pHChemical Oxygen Demand (mg/L)Total Organic Carbon (mg/L)
3.4319,5005543
Table 3. Pervious concrete mix designs and porosity.
Cube
Description
Mix Proportion (Dry)-kg per m3% ExtenderPorosity
CEM 1Fly AshSilica Fume9.5 mm Granite13.2 mm GraniteOptima 175Water
Pre-treatment1971891462-1.757512.1%21.5%
Fixed Bed AD152147-14681.356012.1%33.2%
Table 4. Operational protocol—sulphate and COD loading rate.
Ramp-up Cycle NoExperimental Duration (h)AMD Loading Volume
(L)
SO42− Loading Rate (kg SO42−/m3/Day)COD
Loading
Volume
(L)
COD Loading Rate
(kg COD/m3/Day)
COD to SO42− Ratio
000.0540.020.722.64164.56
24
1480.10.030.702.5786.39
72
2960.120.041.043.0886.39
120
31440.220.070.843.3050.49
168
41920.30.090.843.3037.03
216
52400.40.121.264.6238.88
264
62880.640.191.605.8730.85
312
73360.90.271.76.2323.31
360
838410.301.86.6022.22
408
943220.591.86.6011.11
456
1048024750.741.24.405.98
504
1152830.891.254.585.14
552
576
Table 5. Raw and treated wastewater quality vs. standards.
Raw AMDRaw Confectionery EffluentTreated Wastewater QualityDWA Discharge
Standards
SANS 241:2015 Potable QualityUnits
pH2.563.437.45–8.055.5–9.55.5–9.5
COD-19,5001493400 mg/L
SO42−1642 49.25 250mg/L
Fe104 0.940.30.3mg/L
Al53.80 0.460.030.3mg/L
Zn1.02 0.150.15mg/L
Cu0.01 0.010.012mg/L
Ni0.662 0.171 0.07mg/L
Mn12.8 0.716 0.1mg/L
Publisher’s Note: MDPI stays neutral with regard to jurisdictional claims in published maps and institutional affiliations.

