Article

Development Law of Water-Conducting Fracture Zone in the Fully Mechanized Caving Face of Gob-Side Entry Driving: A Case Study

1
School of Energy Science and Engineering, Henan Polytechnic University, Jiaozuo 454000, China
2
State Collaborative Innovation Center of Coal Work Safety and Clean-Efficiency Utilization, Henan Polytechnic University, Jiaozuo 454000, China
3
College of Architecture and Transportation, Liaoning Technical University, Fuxin 123000, China
4
College of Energy and Mining Engineering, Shandong University of Science and Technology, Qingdao 266000, China
5
College of Mining Engineering, Taiyuan University of Technology, Taiyuan 030024, China
6
School of Safety Engineering, Chongqing University of Science and Technology, Chongqing 401331, China
7
School of Civil Engineering, Shaoxing University, Shaoxing 312000, China
*
Author to whom correspondence should be addressed.
Minerals 2022, 12(5), 557; https://doi.org/10.3390/min12050557
Submission received: 24 March 2022 / Revised: 14 April 2022 / Accepted: 27 April 2022 / Published: 29 April 2022

Abstract

:
This study is aimed at exploring the influence of narrow coal pillars in gob-side entry driving (GSED) on the development height of the water-conducting fracture zone (WCFZ) in the fully mechanized caving face. In reference to the geological mining conditions of working face 11915 of Gequan (GQ) Coal Mine, the development law of the WCFZ in the GSED fully mechanized caving face was studied by means of formula calculation, on-site measurement, theoretical analysis, and simulation. The research results disclose that the development height of the WCFZ in the GSED fully mechanized caving face is affected by narrow coal pillars of GSED. When the narrow coal pillars lose stability, the overburden failure changes from insufficient mining to sufficient mining, and the WCFZ in the overburden changes from an arch-shaped one to a saddle-shaped one. Additionally, the development height of the WCFZ surges.

1. Introduction

Gob-side entry driving (GSED), a non-pillar mining method, has been widely applied to coal mines in China. Studies and experiments on the non-pillar mining technology in China began in the 1950s [1,2]. Scholars have conducted studies on gob-side entry retaining and yielded fruitful results [1,3,4,5]. In the beginning, the application of gob-side entry retaining was basically limited to thin coal seams. In the 1960s, experiments for gob-side entry retaining were performed in medium and thick coal seams [6]. Recent years have seen the improvement of mechanization and coal mining efficiency; gob-side entry retaining (narrow coal pillars) is gaining popularity in top coal caving in thick coal seams [7,8].
In engineering practice, it is found that disasters such as rib falling, coal pillar instability and water-conducting fracture zone (WCFZ) development often occur in the recovery roadway of GSED due to the breakage of large and small structures [9,10,11]. The development height of the WCFZ, which is the most important parameter for the prevention and control of water disasters in coal mine roofs, serves as an important basis for evaluating the production safety of coal mines [12,13,14]. Moreover, the development height of the WCFZ is of great research significance in coal mine water prevention and control, water-preserved coal mining, gas control in the upper corner of gob and return airway, simultaneous extraction of coal and gas, and coal mining under water [15,16,17].
At present, the determination of the height of water diversion fracture zone mainly includes measurement, simulation and theoretical calculation [18,19,20,21,22]. In addition, relevant studies also reveal the following [16,23,24]: the development height of the WCFZ in fully mechanized caving differs from that in traditional mining in thin coal seams. Empirical formulae of the development height of the WCFZ in fully mechanized caving were given for the first time in the “Code for Coal Pillar Retention and Coal Pressure Mining of Buildings, Water Bodies, Railways and Main Roadways” (Code No. 66 of the General Coal Loading of Safety Supervision and Administration, hereinafter referred to as the “code”) promulgated in 2017. However, the overburden of the working face sample in the empirical formulas is sufficiently mined, and there is a lack of WCFZ sample in the fully mechanized caving face in the case of insufficiently mined overburden. Obviously, the applicability of the empirical formulae to the development height of the WCFZ in the case of insufficiently mined overburden requires further discussion.
Hence, according to the widely adopted technology of the fully mechanized caving of GSED and the specific mining geological conditions, the research on the development law of the WCFZ in fully mechanized caving of GSED not only provide the engineering experience of coal mining under buildings, water bodies, and railways, but also improves the theory of overburden WCFZ. Furthermore, it can provide theoretical support and a reference basis for similar conditions and guarantee the safety of coal mining under bodies of water.

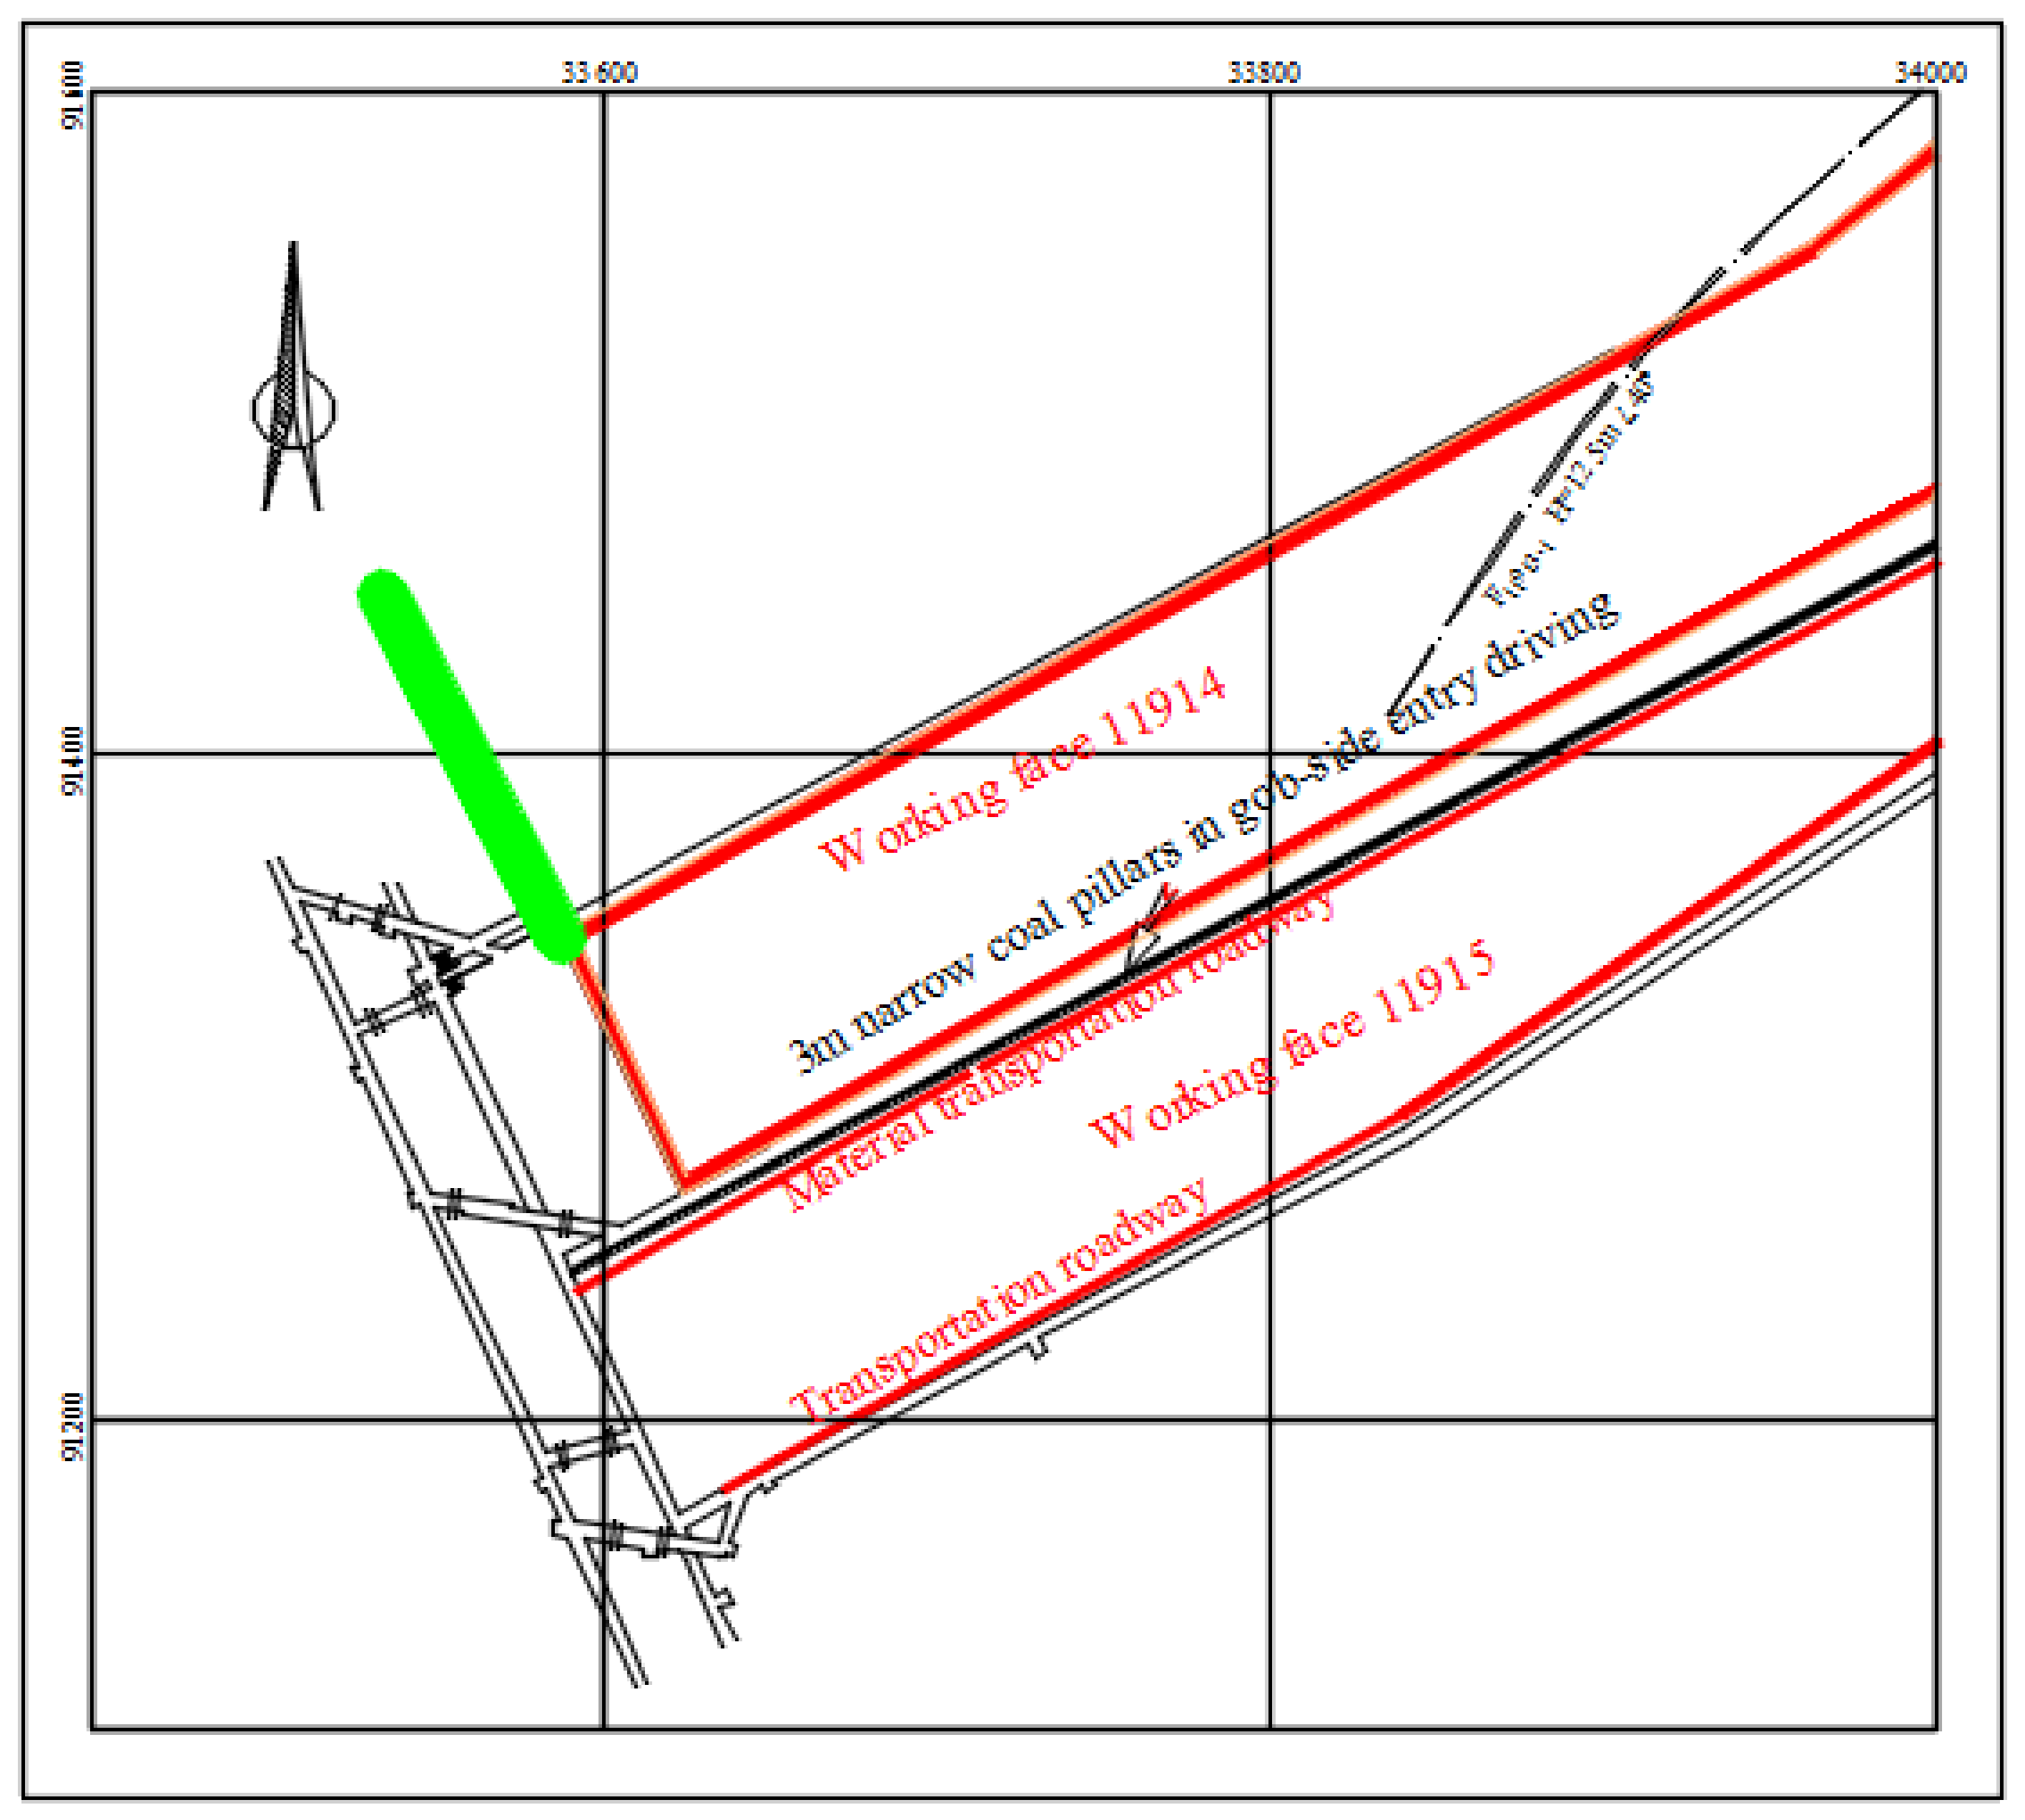
2. Case Analysis: Working Face Profile of Gequan (GQ) Coal Mine

GQ Coal Mine boasts an approved production capacity of 900,000 tons per year and the main minable coal seams in the mine field are No. 2 and No. 9 coal seams. In the mine field, the Shahe River, a seasonal river, after diverting four times, flows through the north-central part of the east mining area. The river bed covers about 20% of the mine field area.
The 11915 working face is located in the east side of the transportation uphill in the east No. 1 mining area, the west is the open-off cut of the 11915 working face, the south is solid coal, and the north is the gob of the 11914 working face. The 11915 working face has an average buried depth of 188 m, an average strike length of 950 m, and a dip length in the range of 49–74 m (74 m in the vicinity of the stopping line). The No. 9 coal seam in the working face has a thickness of 4.2–7.4 m (5.0 m on average) and a dip angle of 10–22° (16° on average). The coal is mined using the longwall inclined backward fully mechanized top coal caving technology, and the roof controlled by the full caving method. The material transportation roadway of the 11915 working face is excavated on the gob side along the transportation roadway of the 11914 working face, and the coal pillar width is 3 m.
The specific layout of the working face is shown in Figure 1.

3. Analysis on the Development Height of WCFZ

3.1. Theoretical Formula Analysis

According to the “code”, the formula to calculate the height of the WCFZ in top coal caving in thick coal seams depends on the comprehensive overburden evaluation coefficient P. The value of P is determined by the lithology and thickness of the overburden, expressed by the following formula [24]:
P = 1 n m i Q i 1 n m i
where mi is the normal thickness of the i-th stratum of overburden, m; and Qi is the lithology evaluation coefficient of the i-th stratum.
According to the position of the 11915 working face, the rock strata nearest to the working face were collected from the G37 borehole and the values of P corresponding to the borehole were calculated (Table 1).
According to Table 1, the overburden evaluation coefficient P can be calculated by:
P = 1 n m i Q i 1 n m i = 126.6 / 170.48 = 0.743
As can be determined from the table illustrating the relationship between the overburden evaluation coefficient P and the influence coefficient of lithology D [24], the influence coefficient D of the overburden lithology in GQ Coal Mine is 2.05.
Hence, it is comprehensively determined that the overburden of the 11915 working face belongs to soft rock which, however, is a little hard (Table 2).
The empirical formulae to calculate the height of the WCFZ in top coal caving in thick coal seams under the soft condition are selected from the “code” [Safety Supervision and Administration, 2017]:
H l i = 100 M 0.31 M + 8.81 ± 8.21
H l i = 10 M + 10
where M is the mining thickness. The calculated heights of the WCFZ in the 11915 working face are 40.1–56.5 m and 60 m, respectively.

3.2. Numerical Simulation Analysis

3.2.1. Model Establishment and Parameter Selection

According to previous studies [25,26], the 3DEC software based on the Lagrange algorithm is suitable for the simulation calculation of multi-block system motion and nonlinear large deformation. The software boasts advantages for simulating the overburden structure and motion law, the stope stress distribution law, and the surrounding rock deformation law under mining disturbance. Therefore, in this study the development of overburden WCFZ after coal mining was simulated and calculated using this software. The constitutive model adopted the Mohr–Coulomb failure criterion, and the joint constitutive model used the regional contact elastoplastic model under the coulomb slip failure. The shear or tensile failure of the joint is determined by cohesion, tension, and the residual value of frictional force [19]. In the process of modeling, different rock layers are represented by different colors to show the differences (Table 3).

3.2.2. Analysis on Numerical Simulation Results

To authentically simulate the overburden failure of the 11915 working face at different advancing distances, the working face advances by 20 m for each simulated recovery based on the actual mining site, and the working face is divided into eight units for recovery. Figure 2 shows the overburden mining failure at different advancing distances along the strike direction, which reflects both the caving failure characteristics and vertical displacement law of the overburden at different advancing distances.
As the working face advances to 40 m (Figure 2a), the immediate roof continues to collapse to the gob with the advancement of the working face. Meanwhile, the overburden failure transfers upward, leading to the collapse and instability of the third stratum. At this time, the overburden failure height develops to 14 m, and the overburden WCFZ presents an arch-shaped distribution.
According to Figure 2b, when the working face advances to 60 m, the overburden failure continues to transfer upward, causing the caving instability of the fourth stratum. Meanwhile, the third stratum forms a masonry beam structure, which belongs to the fracture zone. At this time, the overburden failure height is 24 m. When the 11915 working face advances to 80 m (Figure 2c), the overburden failure remains at the height of 24 m rather than further transfers upward, and the WCFZ displays an arch-shaped distribution.
When the working face continues to advance to 100 m (Figure 2d), obvious separation fractures appear at the position with 46 m stratum height, indicating that the overburden failure has arrived at this stratum, i.e., the height of the WCFZ is 46 m. When the working face advances to 120 m and 140 m (Figure 2e,f), the separation fractures in the 46 m stratum tend to close, and the overburden failure achieves sufficient mining. The overburden failure height ceases developing upward, and the overburden WCFZ presents a saddle-shaped distribution.
Therefore, the numerical simulation structure reveals that the maximum height of the WCFZ in the 11915 working face is about 46 m.

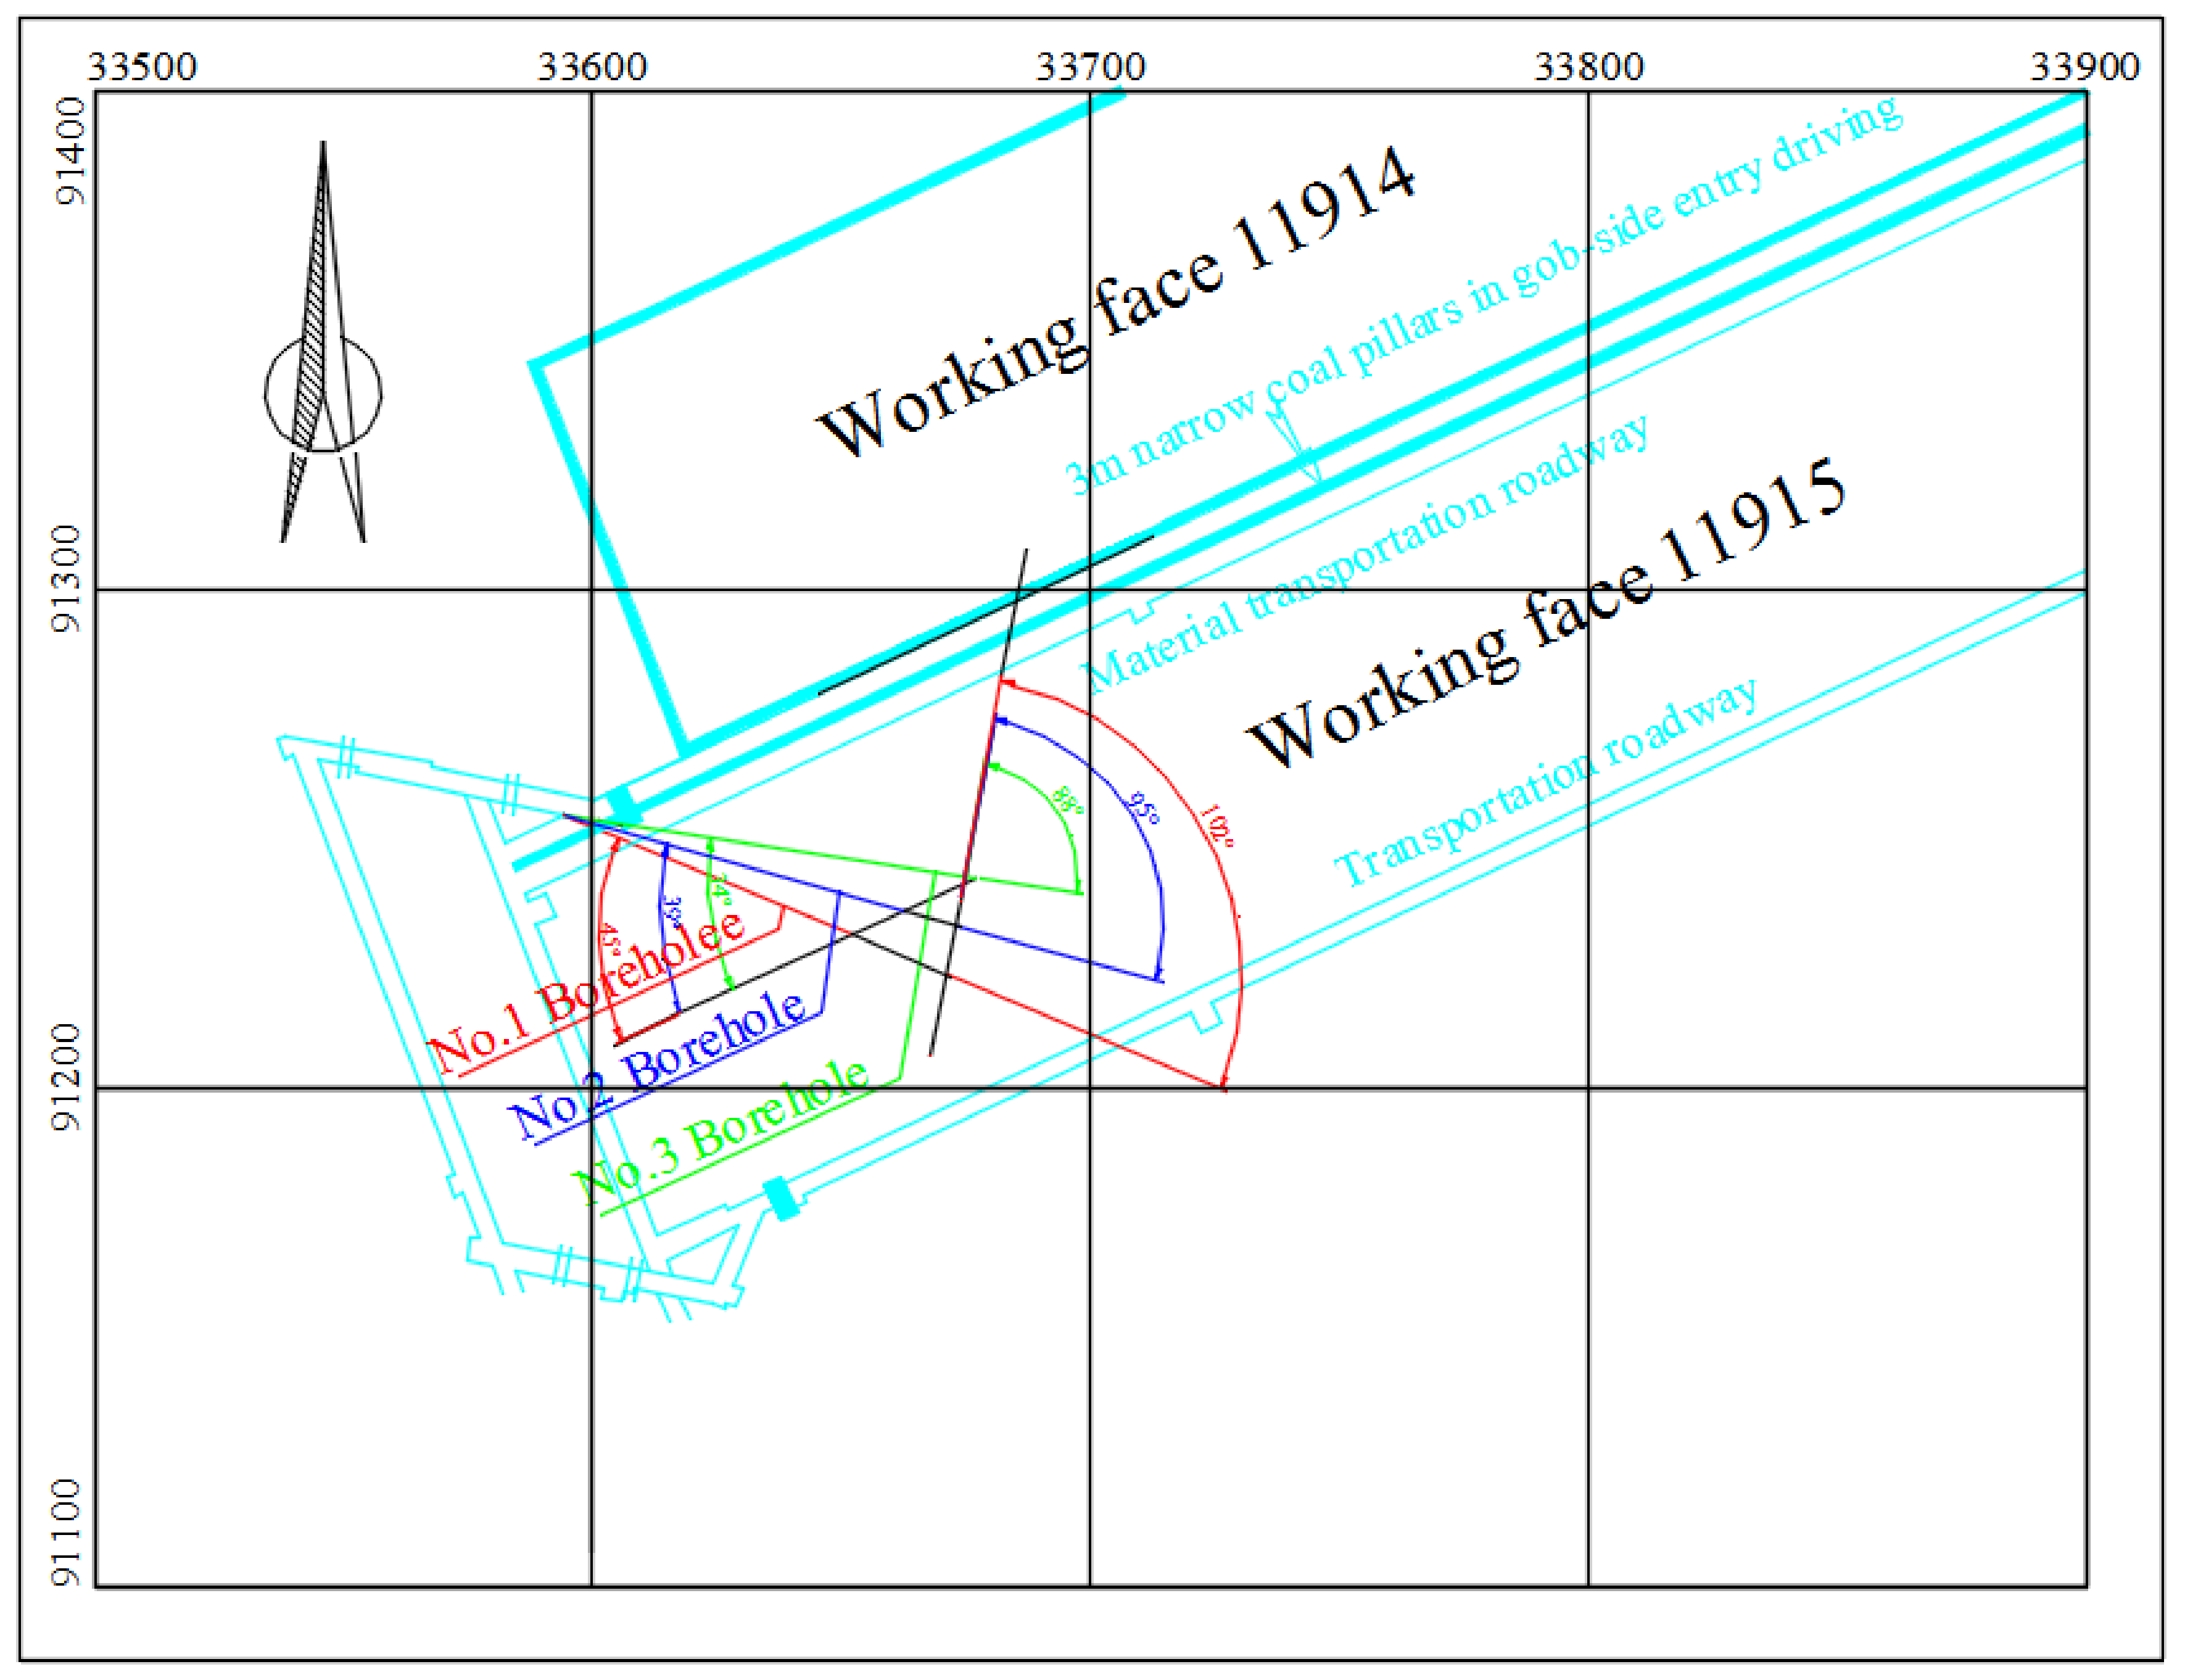
3.3. On-Site Detection Analysis

To ensure a high accuracy of the height of the WCFZ measured on site, on-site detection was conducted using two observation methods, namely borehole imager observation and fluid leakage observation. The installation information and drilling results of the three boreholes are shown in Figure 3 and Figure 4, and Table 4.

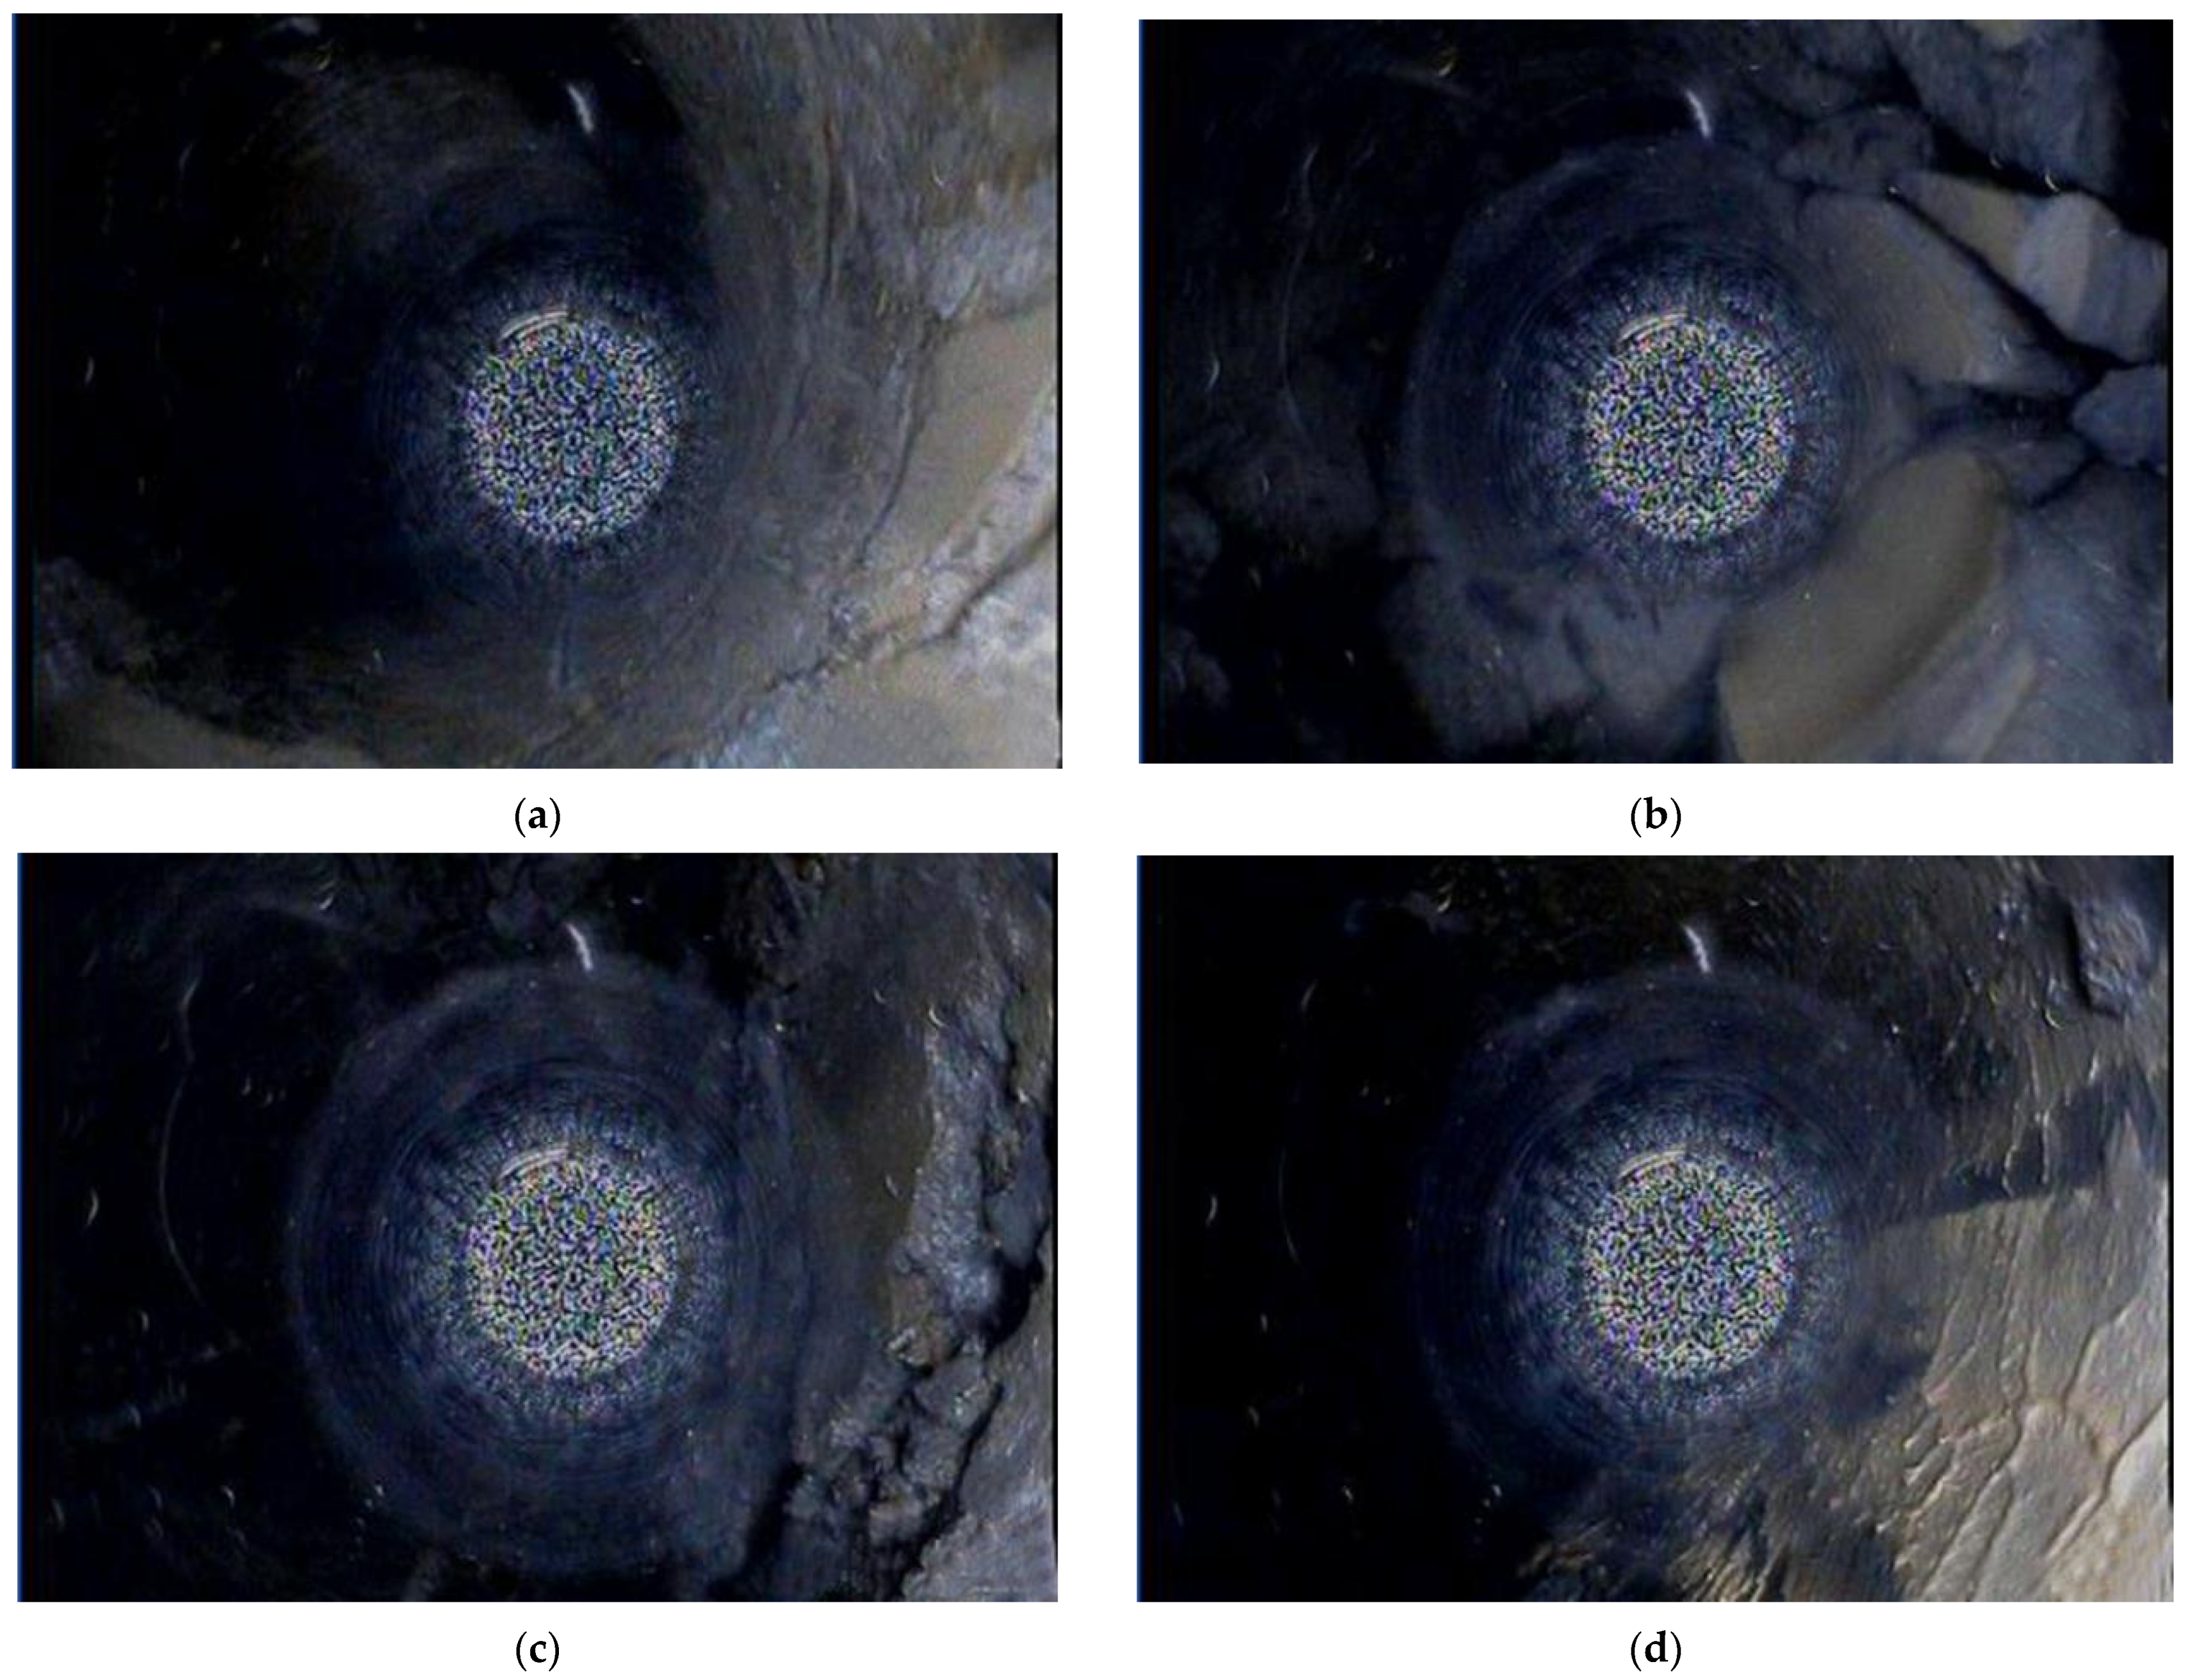
3.3.1. Analysis on the Borehole Imager Observation Results

To better understand the roof lithology, stratification, and drilling effect, the No. 3 post-mining borehole was observed by a borehole imager. Fractures were locally distributed on the borehole wall. The horizontal fractures indicated that the roof has a tendency of separation, while the vertical ones indicated that the borehole wall breaks under the influence of front abutment pressure. The No. 3 post-mining borehole was observed with a borehole imager. The borehole imager mainly includes an imager, a camera, a depth detector, and an extension rod (signal line). During the detection, the camera was sent into the borehole by the extension rod, and the fracture distribution of different strata in the borehole was observed via the imager. Using this process, photos and videos were taken. Figure 5 shows the observation system of the borehole imager.
For Figure 5, because there are objects such as liquid in the lower hole, obvious reflection will occur when taking photos, and this part will be displayed as an obvious bright area on the photo. Other areas outside the bright area are the hole wall imaging area. Due to the imaging angle of the camera, the imaging of the left hole wall in the bright area is not clear, but the imaging of the right hole wall in the bright area is clear. Therefore, the imaging area of hole wall on the right of bright area is selected to study the damage degree of the overburden.
Figure 5a–c are the photos of overburden fractures within the vertical depth range 8.43–25.33 m. Accordingly, obvious deformation and failure occur in the rock stratum, indicating that this range is exactly the overburden failure area and that the corresponding rate of borehole water injection leakage increases.
Figure 5d–f are photos of overburden fractures within vertical depth range 29.20–45.54 m. Accordingly, deformation and failure occur in the rock stratum, which is slighter than those in Figure 5a–c. This suggests that with an increase in the overburden stratum, the overburden failure becomes milder and the overburden fractures become smaller. Poorly developed horizontal fractures can be observed at the upper left part in Figure 5f.
Figure 5g,h give photos of overburden fractures within the vertical depth range 46.40–52.99 m. Fractures of the rock stratum can hardly be found in these photos. When the borehole depth continues to increase, all the strata are intact without fractures.
Therefore, the development height of the WCFZ determined through borehole imager observation is about 81.45 × sin34° = 45.54 m.

3.3.2. Analysis on the Fluid Leakage Observation Results

The effective leakage rates of underground observation boreholes calculated according to the above methods and underground observation data are listed in Table 5.
According to Table 5 and Figure 6, before the recovery of the working face, the fractures were not developed since the overburden had not been affected by mining. The rate of water injection leakage for the No. 1 pre-mining borehole varied insignificantly, but water mainly flows into the primary fractures of the overburden. The water flow of the No. 1 pre-mining borehole varied in the range of 3.45–7.15 L/min, with an average of about 4.75 L/min.
After the mining of the working face, the overburden is affected by mining and produces a large number of new fractures. For the No. 2 post-mining borehole (observation date: October 2), when the borehole depth is in the rage of 75–87 m (vertical height 47.20–54.75 m), the rate of water injection leakage fluctuates in the range of 6.06–7.98 L/min. When the borehole depth is 75 m (vertical height 47.20 m), the rate of water injection leakage surges, reaching 19.75–25.85 L/min, much larger than the previous section. For the No. 3 post-mining borehole (observation date: November 3), when the borehole depth is in the range of 81–91.5 m (vertical height 46.40–52.41 m), it corresponds to a fluctuating rate of water injection leakage in the range of 4.97–9.92 L/min. When the borehole depth is 81 m (vertical height 46.40 m), the rate of water injection leakage jumps, reaching 19.75–25.85 L/min. This is because the primary fractures tend to close with the passage of time. The rate of water injection leakage and WCFZ height of the later-observed No. 3 post-mining borehole are less than those of the No. 2 post-mining borehole. The maximum heights of the WCFZ of the No. 2 and No. 3 post-mining boreholes are 47.20 m and 46.4 m, respectively.
According to the above analysis, the maximum development height of the WCFZ measured on site in the 11915 working face is in the range of 46.4–47.2 m.

4. Theoretical Analysis on the Development Law of WCFZ in Fully Mechanized Caving of GSED

4.1. Comprehensive Detection Results of WCFZ and Reliability Analysis

As mentioned above, maximum height and development position of the WCFZ in top coal caving in the soft overburden thick coal seam of the 11915 working face were comprehensively analyzed by means of theoretical calculation, numerical simulation, and on-site detection (borehole imager observation and fluid leakage observation). The analysis results are given in Table 6.
According to Table 6, the heights of the WCFZ of the 11915 working face calculated by the above three methods are 48.3–60 m, 46 m, 45.54 m and 46.4–47.2 m, respectively. The maximum height of WCFZ of on-site detection and numerical simulation is within the value range of theoretical calculation.
Studies [27,28,29] also show that the actual maximum height of the WCFZ in the working face can be accurately detected and reflected by means of on-site detection (i.e., borehole imager observation and fluid leakage observation) and numerical simulation. The maximum heights of the WCFZ by on-site observation and numerical simulation differ slightly, which verifies the accuracy and applicability of the methods.
With reference to the data in Table 6, the maximum length of the 11915 working face was 74 m. In the numerical simulation, when the working face width is 80 m (larger than 74 m), the development height of the WCFZ is just 24 m, which differs greatly from the maximum height of the WCFZ (45.54 m and 46.4–47.2 m) obtained by on-site observation (i.e., borehole imager observation and fluid leakage observation).
Studies [30,31] have demonstrated that when the adjacent coal pillars of the working face lose stability, increasing the size of the working face can change the mining degree of the overburden, thereby changing the structural characteristics of the overburden and promoting the development height of the WCFZ. Thus, it is necessary to analyze the insufficient mining instability of the narrow coal pillars and the movement law of overburden.

4.2. Theoretical Analysis on the Instability of Narrow Coal Pillars and the Overburden Height in Fully Mechanized Caving of GSED

When the height of the WCFZ reaches the maximum under the geological mining conditions and the height no longer rises with the increase in the working face size, it is defined as the sufficient mining of overburden failure [31]. It is found that the shape of the WCFZ is an arch rather than a saddle under the sufficient mining state (Figure 7). A sufficiently mined face corresponds to a larger WCFZ height than an insufficiently mined face [32]. Whether the overburden reaches sufficient mining can be determined with reference to sample data [31,33]. The recommended value of the critical size for the working face is (0.5–0.9) H, i.e., when the length of the working face reaches (0.5–0.9) H, the overburden failure reaches sufficient mining.
As illustrated in Figure 1, the dip length of the 11915 working face L is 74 m, and the north is the 11914 gob. GSED narrow coal pillars of about 3 m are reserved between the 11914 gob and the 11915 working face. Apparently, the 11915 working face is insufficiently mined in the dip direction (L < (0.5–0.9) H). Studies [10,11,33,34] also show that narrow coal pillars in GSED experience instability and failure after the recovery of the adjacent working face. Due to the instability of narrow coal pillars in GSED, the mining size of the working face increases, which changes the mining degree, thus changing the structural characteristics of overburden and raising the development height of the WCFZ. The height of the WCFZ in the overburden rises from 24 m to 46 m and the overburden failure transforms from insufficient mining to sufficient mining. The height of the WCFZ under insufficient mining is 52.17% that under sufficient mining.

5. Conclusions

(1)
This study takes the working face 11915 in Coal Mine GQ as the research object. The development height of the WCFZ in fully mechanized caving of GSED was studied by means of theoretical calculation, numerical simulation, and on-site detection (i.e., borehole imager observation and fluid leakage observation). The obtained values are 48.3–60 m, 46 m, 45.54 m, and 46.4–47.2 m, respectively.
(2)
A structural model of WCFZ development caused by the instability of narrow coal pillars in fully mechanized caving of GSED was established. The difference between WCFZ heights in the working face 11915 by numerical simulation and on-site detection was analyzed, and the accuracy of on-site detection and numerical simulation data was verified.
(3)
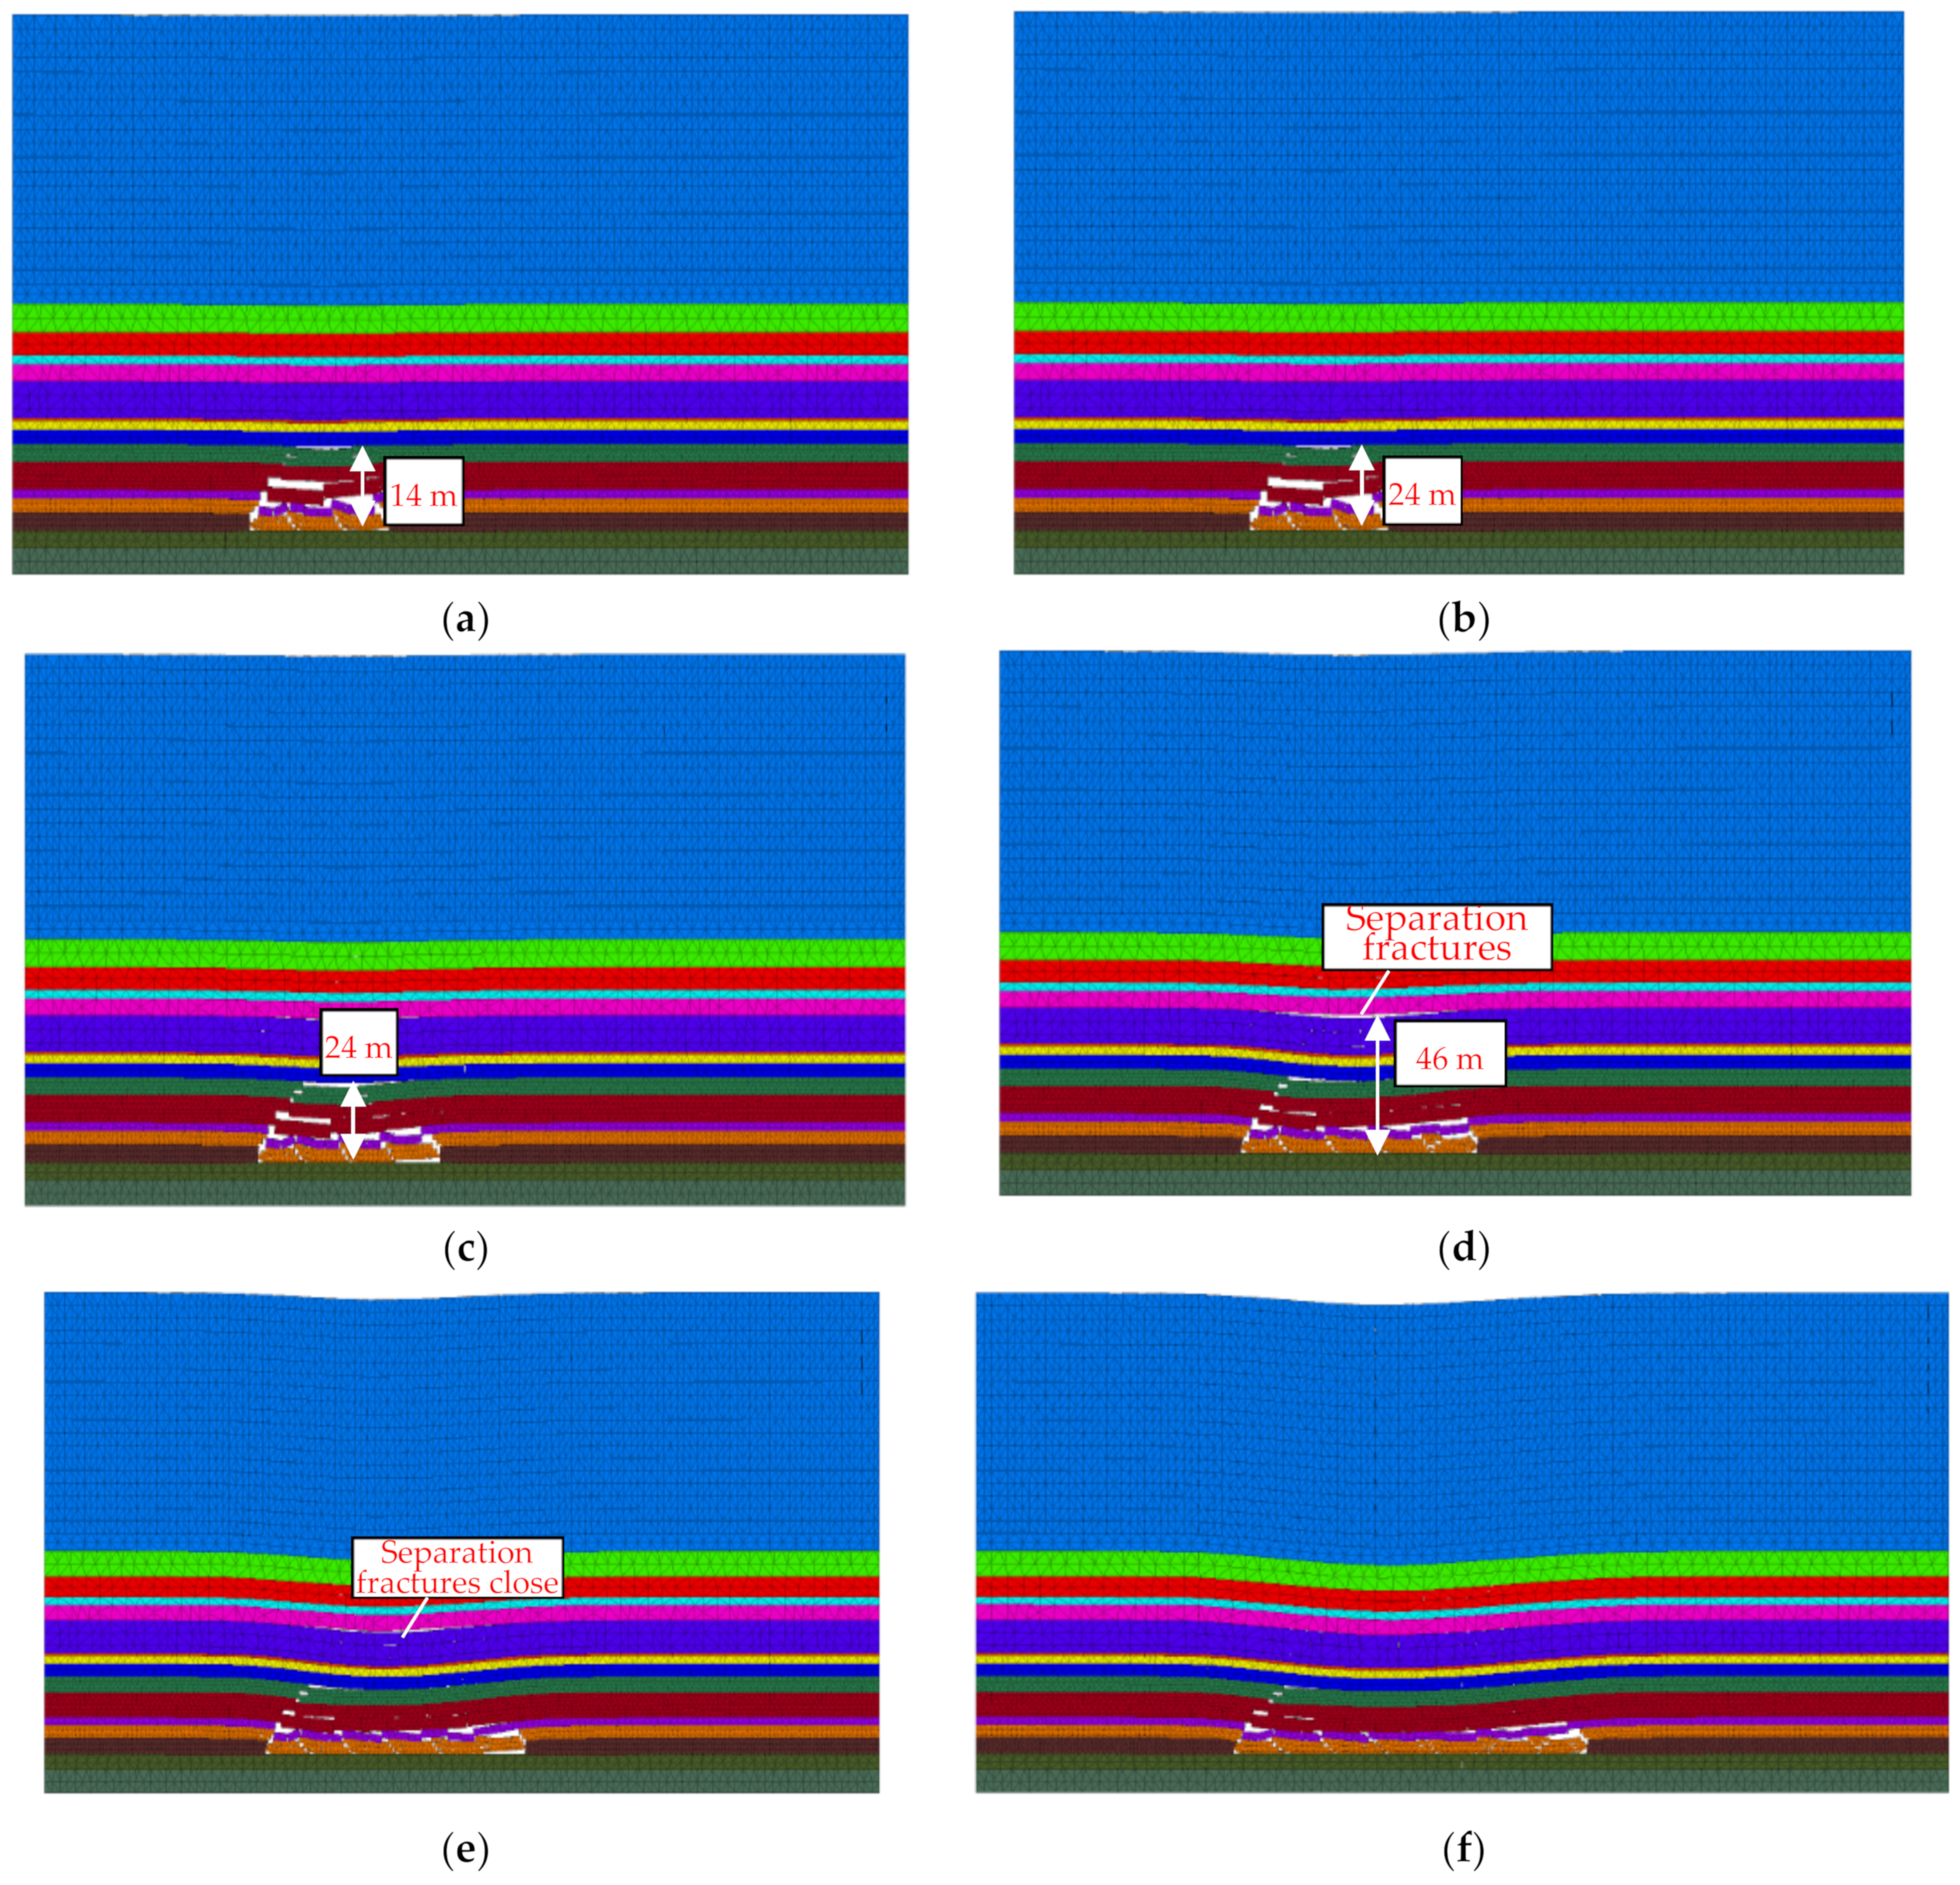
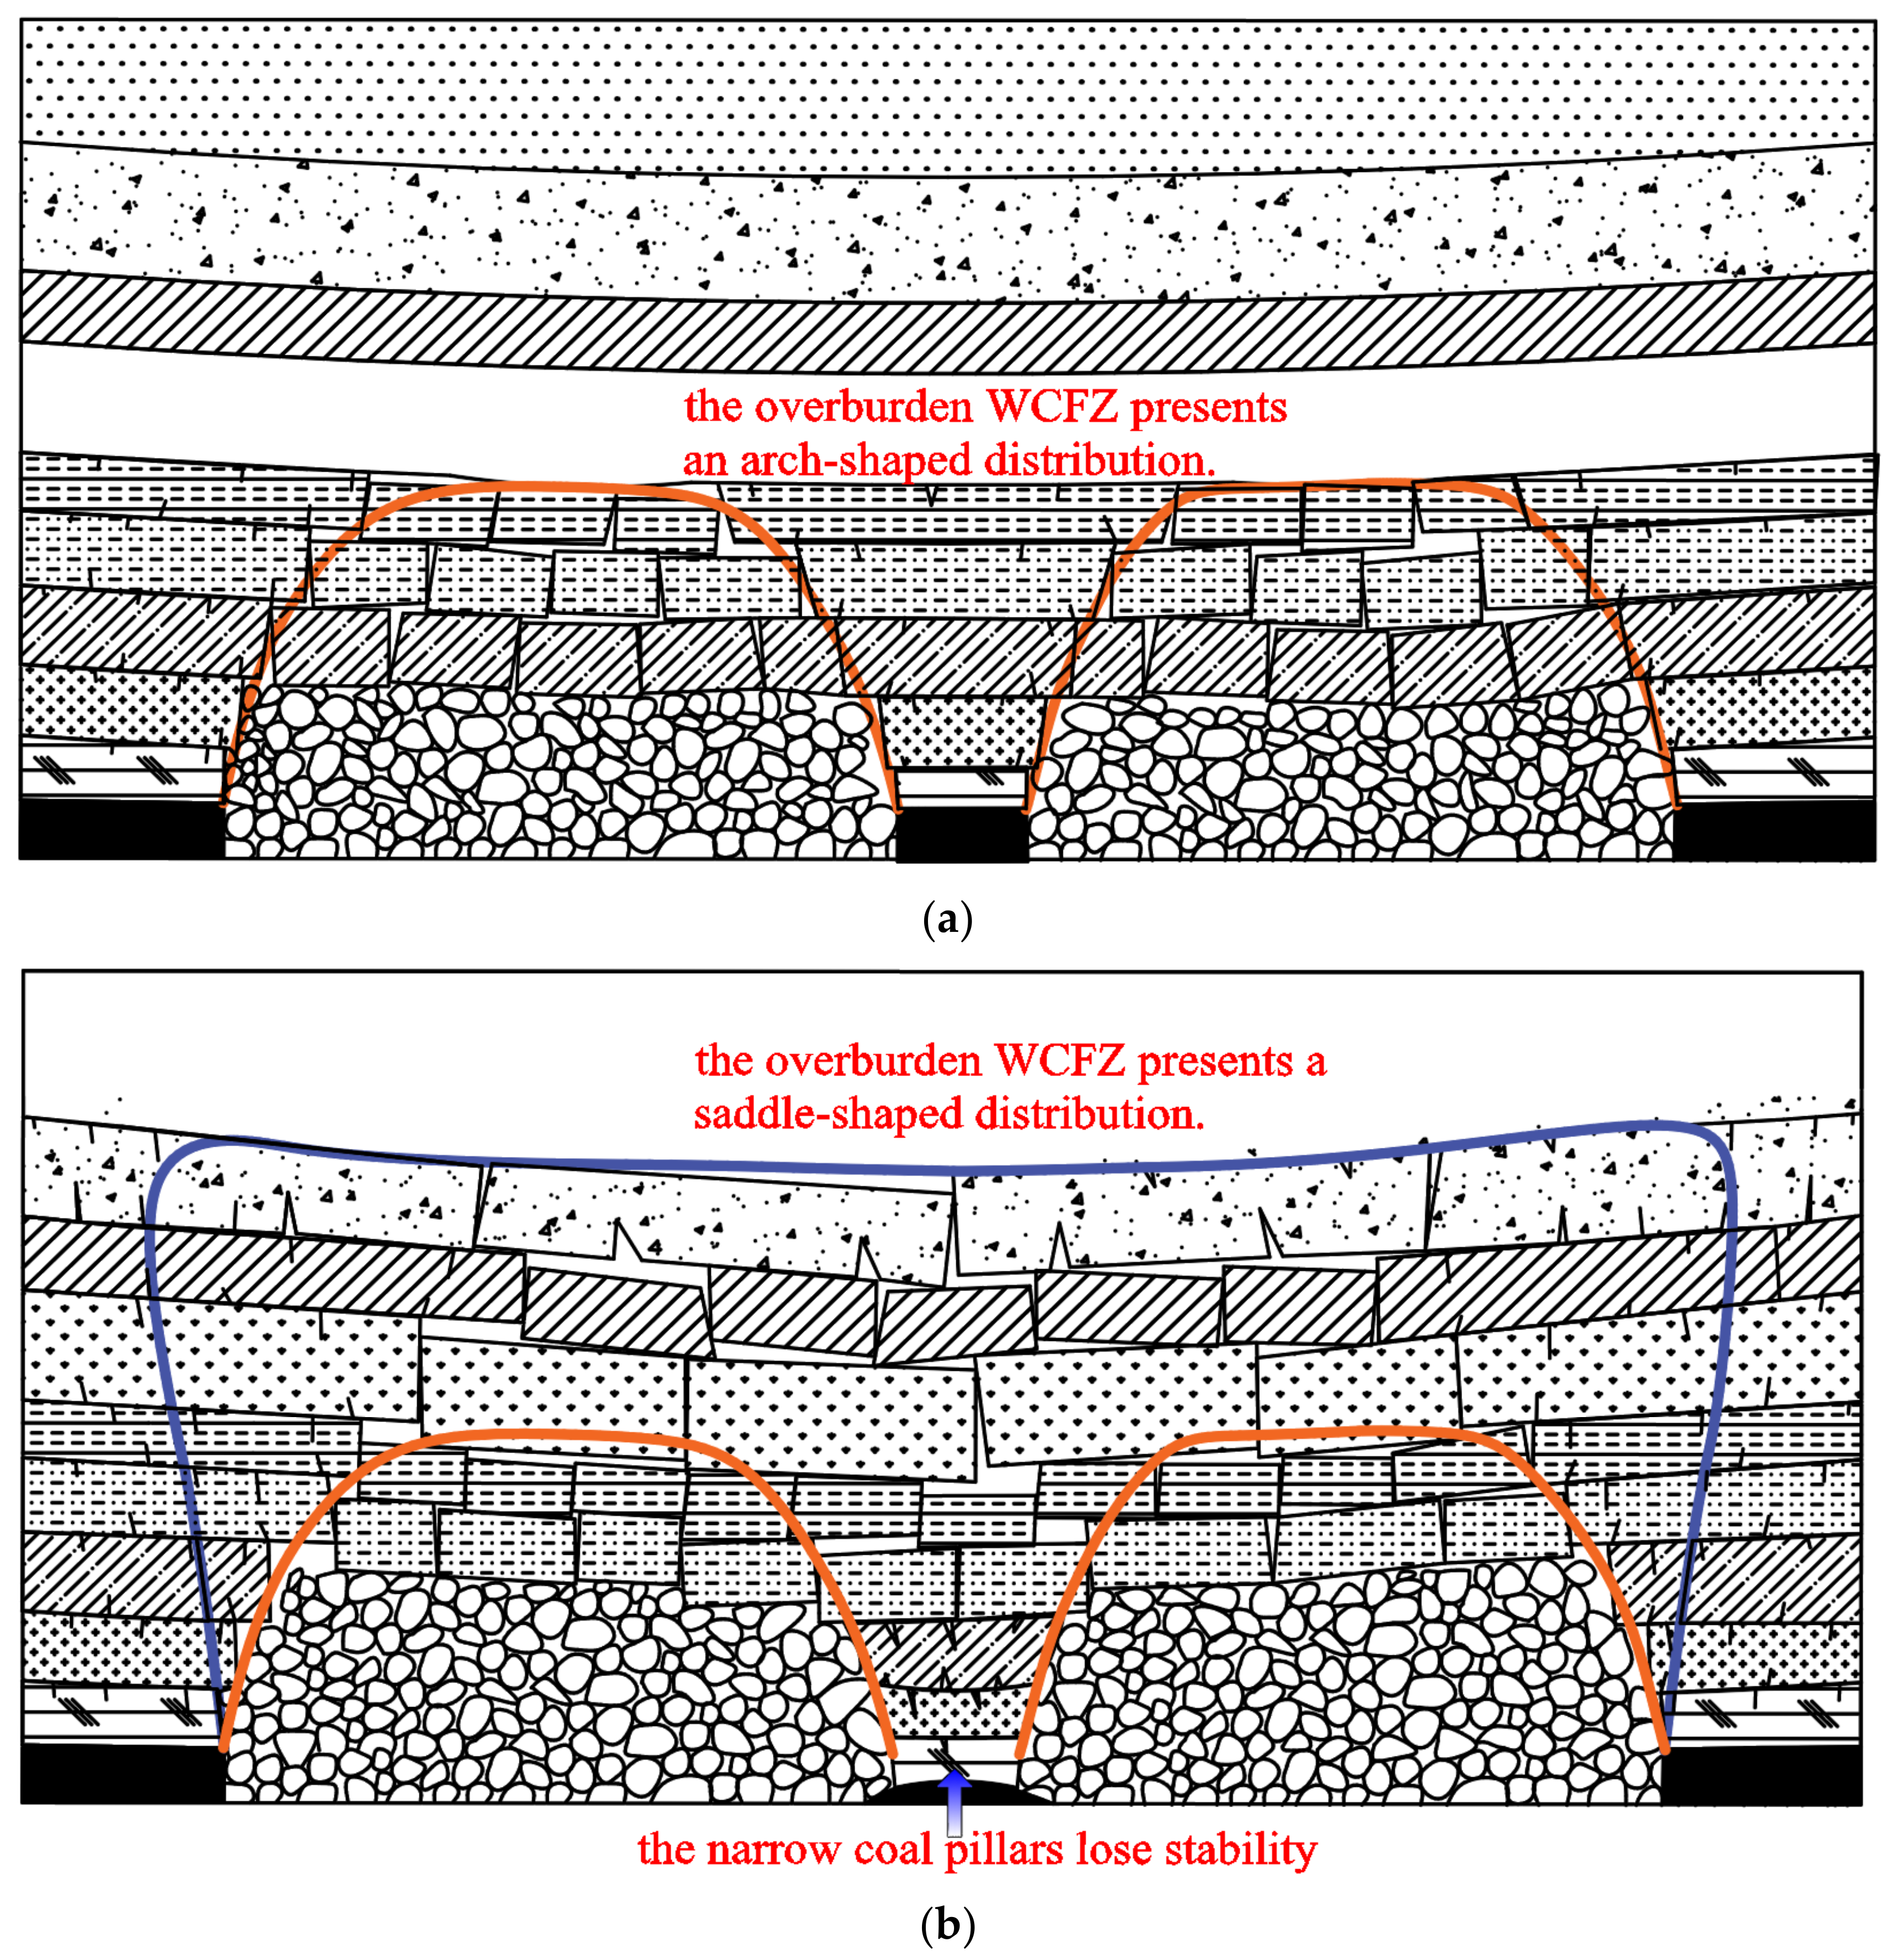
The overburden failure degree in fully mechanized caving of GSED transforms from insufficient mining to sufficient mining. The shape of the WCFZ in the overburden changes from an arch to a saddle, and the development height of WCFZ jumps. It is found that the height (24 m) of overburden WCFZ in the working face 11915 under insufficient mining is 52.17% of that (46 m) under sufficient mining.

Author Contributions

Conceptualization, Y.T. and H.X.; methodology, W.Y.; software, X.Z. and Y.Z.; validation, W.Y.; formal analysis, X.J.; investigation, X.L. (Xiaoshuang Li); resources, S.W.; data curation, X.L. (Xiao Liu); writing—original draft preparation, Y.T.; writing—review and editing, W.Y.; visualization, W.G.; supervision, Q.S.; project administration, D.Y.; funding acquisition, Y.T. All authors have read and agreed to the published version of the manuscript.

Funding

This work was financially supported by National Natural Science Foundation of China (U21A20108, 52174108, and 51974105), Support Plan for Science & Technology Innovation Talents in Universities of Henan Province (21HASTIT024), State Key Laboratory of Coal Resources in Western China (SKLCRKF1912), Scientific and technological innovation research team of Henan Polytechnic University (T2021-5), Henan Excellent Youth Science Foundation(222300420045), Henan Science and Technology Research Project (212102310012).

Acknowledgments

The authors gratefully acknowledge the editor and reviewers for their helpful comments.

Conflicts of Interest

The authors declare no conflict of interest.

References

  1. Hou, C. Ground Control of Roadways; China University of Mining and Technology Press: Xuzhou, China, 2013. [Google Scholar]
  2. Hua, X. Development status and improved proposals on gob side entry retaining support technology in China. Coal Sci. Technol. 2006, 34, 78–81. [Google Scholar]
  3. Ding, K.; Tong, Y. Development and Prospect of pillar free mining in China(first). Coal Eng. 1984, 03, 11–16. [Google Scholar]
  4. He, M.; Gao, Y.; Yang, J. The energy-gathered roof cutting technique in non-pillar mining and its impact on stress evolution of surrounding rocks. Chin. J. Rock Mech. Eng. 2017, 36, 314–325. [Google Scholar]
  5. Sun, H.; Zhao, B. Theory and Practice of Retaining Roadway along Goaf; China Coal Industry Publishing House: Beijing, China, 1993. [Google Scholar]
  6. Guo, Y.; Bai, J.; Hou, C. Study on the main parameters of gateside packs in gateways maintained along gob- edges. J. China Univ. Min. Technol. 1992, 21, 1–11. [Google Scholar]
  7. Jia, Y. State of art and future of new techno1ogy in back filling a1ong roadway sides in China coal mines. Coal Sci. Technol. 1993, 3, 2–6. [Google Scholar]
  8. Kang, H.; Zhang, X.; Wang, D.; Tian, J.; Yi, Z.; Jiang, W. Strata control technology and applications of non⁃pillar coal mining. J. China Coal Soc. 2022, 47, 16–44. [Google Scholar]
  9. Hou, C.; Li, X. Stability principle of big and small structures of rock surrounding roadway driven along goaf in fully mechanized top coal caving face. J. China Coal Soc. 2001, 26, 1–7. [Google Scholar]
  10. Zhang, W.; Zhang, D.; Chen, J.; Xu, M. Control of surrounding rock deformation for gob-side entry driving in narrow coal pillar of island coalface. J. China Univ. Min. Technol. 2014, 43, 36–42. [Google Scholar]
  11. Liu, T. Influences of mining activities on mine rockmass and control engineering. J. China Coal Soc. 1995, 20, 1–5. [Google Scholar]
  12. Qian, M.; Miao, X. Theoretical analysis on the structural form and stability of overlying strata in longwall mining. Chin. J. Rock Mech. Eng. 1995, 14, 97–106. [Google Scholar]
  13. Xu, J.; Zhu, W.; Wang, X. New method to predict the height of fractured water-conducting zone by location of key strata. J. China Coal Soc. 2012, 37, 762–769. [Google Scholar]
  14. Fan, L. The scientific problems faced by water-preserving coalmining. J. China Coal Soc. 2019, 44, 667–674. [Google Scholar]
  15. Yi, T.; Han, X.; Weitao, Y.; Wenbing, G.; Erhu, B.; Tingye, Q.; Dawei, Y.; Bingyuan, H.; Hao, C.; Minghao, S. Study on the Overburden Failure Law of High-Intensity Mining in Gully Areas with Exposed Bedrock. Front. Earth Sci. 2022, 10, 833384. [Google Scholar] [CrossRef]
  16. Yuan, L. Strategic thinking on the co-excavation of coal and gasin my country. J. China Coal Soc. 2016, 41, 1–6. [Google Scholar]
  17. Yi, T.; Hao, C.; Shuang, G. Field Study on the Law of Surface Subsidence in the High-Intensity Fully Mechanized Caving Mining Working Face with Shallow Thick Bedrock and Thin Epipedon in Hilly Areas. Adv. Mater. Sci. Eng. 2021, 2021, 6515245. [Google Scholar]
  18. Yang, D.; Guo, W.; Zhao, G. Height of water-conducting zone in longwall top-coal caving mining under thick alluvium and soft overburden. J. China Coal Soc. 2019, 44, 3308–3316. [Google Scholar]
  19. Cao, Z.; Wang, Q. Development characteristics of water-conducting fracture zone based on the structural effect of overlyingstrata. Coal Geol. Prospect. 2020, 48, 145–151. [Google Scholar]
  20. Mallı, T.; Yetkin, M.E.; Özfırat, M.K.; Kahraman, B. Numerical analysis of underground space and pillar design in metalliferous mine. J. Afr. Earth Sci. 2017, 134, 365–372. [Google Scholar] [CrossRef]
  21. Yetkin, M.E.; Arslan, A.T.; Zfrat, M.K.; Kahraman, B.; Yenice, H. Numerical Modelling of Stress-strain Analysis in Underground thick coal mining. Int. J. Eng. Res. Technol. 2018, 7, 199–204. [Google Scholar]
  22. He, C.; Lu, W.; Zha, W.; Wang, F. A geomechanical method for predicting the height of a water-flowing fractured zone in a layered overburden of longwall coal mining. Int. J. Rock Mech. Min. Sci. 2021, 143, 104798. [Google Scholar] [CrossRef]
  23. Li, T.; Gao, Y. Research on the impactof large-scale coal mining in desert shoals on the impact of diving. Min. Res. Dev. 2019, 39, 100–103. [Google Scholar]
  24. Safety Supervision and Administration. Code for Coal Pillar Retention and Coal Pressure Mining of Buildings, Water Bodies, Railways and Main Roadways; China Coal Industry Publishing House: Beijing, China, 2017. [Google Scholar]
  25. Wu, X.; Bo, Z.; Yang, K.; Yang, J. Application of 3DEC Numerical Simulation Method in Roadway Support Optimization Design. Min. Saf. Environ. Prot. 2013, 40, 73–76. [Google Scholar]
  26. Liu, C. Numerical simulation study with 3DEC on impacted movement of hard roof in manless working face extraction. Rock Soil Mech. 2004, 285–288. [Google Scholar]
  27. Zhai, Z.; Meng, X.; Wu, Z.; Xu, S. Height determination of water flowing fractured zone based on borehole imaging observation. Coal Eng. 2020, 52, 89–93. [Google Scholar]
  28. Yao, Q.; Li, X.; Zhu, L.; Yan, K.; Yang, P.; Xia, Z. Development and application of in-situ testing system for geomechanical parameters of coal and rock mass. J. China Univ. Min. Technol. 2019, 48, 1169–1176. [Google Scholar]
  29. Liu, Y. Research on Panoramic Drilling Imaging Measurement System for Coal Mines. Coal Technol. 2020, 39, 61–65. [Google Scholar]
  30. Li, X.; Huang, Q. High development characteristics of water flowing fractured zone in fully-mechanized top-caving mining of extremely thick coal seam under water. J. Min. Saf. Eng. 2022, 39, 54–61. [Google Scholar]
  31. Guo, W.; Lou, G. Definition and distinguishing method of critical mining degree of overburden failure. J. China Coal Soc. 2019, 44, 755–766. [Google Scholar]
  32. Liu, G.; Zhang, H.; Liu, Z. Observation and simulation research on development features of overlying strata failure in conditions of fully-mechanized top-coal caving mining under river. J. China Coal Soc. 2013, 38, 987–993. [Google Scholar]
  33. Tan, Y.; Guo, W.; Yang, D. Analysis on height of “two zones” under subcritical mining in shallow coal seam with hard roof. J. Min. Saf. Eng. 2017, 34, 845–851. [Google Scholar]
  34. Lu, S.; Liu, S.; Wan, Z.; Zhang, H.; Xing, K.; Ta, X. Deformation and Control Measures of Narrow Coal Pillar in Gob-Side Entry. Min. Res. Dev. 2020, 40, 28–31. [Google Scholar]
Figure 1. Layout of the 11915 working face.
Minerals 12 00557 g001
Figure 2. Caving characteristics. (a) The working face advances to 40 m. (b) The working face advances to 60 m. (c) The working face advances to 80 m. (d) The working face advances to 100 m. (e) The working face advances to 120 m. (f) The working face advances to 140 m.
Minerals 12 00557 g002
Figure 3. Borehole layout.
Minerals 12 00557 g003
Figure 4. Field installation of monitoring equipment. (a) Hole position. (b) Worker’s operation.
Minerals 12 00557 g004
Figure 5. Photos of overburden fractures at different positions in the No. 3 post-mining borehole. (a) Vertical depth 8.43 m. (b) Vertical depth 16.09 m. (c) Vertical depth 25.33 m. (d) Vertical depth 29.20 m. (e) Vertical depth 42.70 m. (f) Vertical depth 45.54 m. (g) Vertical depth 46.4 m. (h) Vertical depth 52.99 m. Note: for the No. 3 post-mining borehole, the bottom right corner of the photo shows the borehole depth.
Minerals 12 00557 g005aMinerals 12 00557 g005b
Figure 6. Contrast of fluid leakage in pre−mining and post−mining boreholes.
Minerals 12 00557 g006
Figure 7. Distribution of WCFZ during overburden mining degree transformation. (a) Arch-shaped distribution. (b) Saddle-shaped distribution.
Minerals 12 00557 g007
Table 1. Calculated values of the comprehensive evaluation coefficient P from the G37 borehole.
LithologyThickness mi
(m)
Evaluation
Coefficient Qi
mi × Qi
Limestone5.370.10.537
Mudstone3.390.82.712
Limestone0.40.10.04
Siltstone10.150.55.075
Inter-bedded siltstone and fine sandstone5.80.63.48
Medium fine sandstone5.270.42.108
Coreless section2.770.61.662
No. 7 Coal1.411.4
Muddy siltstone8.80.65.28
Medium sandstone5.50.42.2
Limestone2.50.10.25
Siltstone7.80.53.9
Medium fine sandstone10.320.44.128
Pebble16.850.813.48
Clay sand64.58164.58
Pebble18.980.815.184
Topsoil layer0.610.6
Total170.48 126.6
Table 2. Correspondence between P and D [24].
LithologyIndexCorrespondence
HardP0.000.030.070.110.150.190.230.270.3
D0.760.820.880.951.011.081.141.201.25
Moderate HardP0.30.350.400.450.500.550.600.650.70
D1.261.351.451.541.641.731.821.912.00
SoftP0.70.750.800.850.900.951.001.051.10
D2.002.102.202.302.402.502.602.702.80
Table 3. Rock parameters and contact surface parameters of the 11915 working face.
No.LithologyThickness/mBulk
Density/kg•m−3
Bulk
Modulus/
GPa
Shear
Modulus/
GPa
Tensile Strength/MPaCohesion/
MPa
Angle of Internal Friction/°Normal
Elasticity Moduluss/ GPa
Tangential Elasticity Modulus/GPa
1Medium fine sandstone9239028.4518.828.58.8320.50.5
2Siltstone15241028.3318.29.09.6320.40.4
3No. 9 coal seam6.513003.711.911.81.0240.10.1
4Limestone528002.451.312.71.1290.030.03
5Mudstone324304.002.12.21.7280.040.04
6Siltstone1024109.335.23.82.6310.090.09
7Inter-bedded siltstone and fine sandstone625007.333.31.31.0320.030.03
8Medium fine sandstone5241012.457.114.22.5360.090.09
9Muddy siltstone324107.334.22.21.5310.060.06
10No. 7 coal seam113003.711.911.11.0240.010.01
11Muddy siltstone1324107.334.22.11.5310.060.06
12Medium sandstone6241016.459.815.94.5340.100.10
13Limestone3280014.458.916.55.2350.100.10
14Siltstone824106.334.23.02.6320.040.04
15Medium fine sandstone10241015.458.816.24.5360.100.10
16Topsoil Layer10216003.711.511.20.92180.010.01
Table 4. Borehole construction information.
Construction LocationBorehole No.Borehole
Size/mm
Elevation
Angle/°
Azimuth
Angle/°
Borehole Length/mVertical Depth/m
11915
Track roadway
1 (pre-mining)8945N1028360
2 (post-mining)8939N959260
3 (post-mining)8934N8810360
Table 5. Underground borehole observation data and effective leakage rates.
No. 1 Pre-Mining Borehole (45°)No. 2 Post-Mining Borehole (39°)No. 3 Post-Mining Borehole (34°)
Borehole depth
/m
Vertical height
/m
Flow rate L/minBorehole depth/mVertical height/mFlow rate L/minBorehole depth
/m
Vertical height
/m
Flow rate L/min
Measured datumEffective datumMeasured datumEffective datumMeasured datumEffective datum
4531.824.544.155735.8721.6921.36939.5415.4815.09
Table 6. Summary of analysis results of WCFZ.
No.Calculation MethodMaximum Height of WCFZ/mAnalysis on the Occurrence Position
1Theoretical calculationEquation (1)40.1–56.5The maximum heights of the WCFZ were calculated by the empirical formulae under the mining geological conditions; the values are merely for reference because they vary in a large range.
Equation (2)60
2Numerical simulation46When the working face advanced to 80 m (74 m inclined length of the GQ 11915 working face), the height of the WCFZ remained 24 m. When the working face advanced to 100 m, the height of the WCFZ developed to a maximum of 46 m.
3On-site
detection
Borehole
imager observation
45.54The 11915 working face with the width of 74 m
Fluid leakage
observation
46.4–47.2
Publisher’s Note: MDPI stays neutral with regard to jurisdictional claims in published maps and institutional affiliations.

