1. Introduction
Atmospheric Fe and other trace metals are nutrients that contribute to phytoplankton growth in the ocean, which can control the carbon cycle at the Earth’s surface through the regulation of marine primary productivity (e.g., [
1,
2]). Consequently, nutrient supply can change the global climate through various processes. Many studies have investigated atmospheric Fe, but the chemical process of Fe during its deposition to surface seawater occurring through the interactions of atmosphere and ocean remains poorly understood. The contribution of atmospheric Fe to dissolved Fe concentration in surface ocean is controlled by the Fe fractional solubility in aerosols along with its deposition amount, but its dependence on the chemical species of Fe in aerosol remains to be elucidated. Under oxic conditions such as those in the atmosphere, Fe is not readily dissolved into water [
3]. Fe speciation and solubility in aerosols are also influenced by some factors, such as particle size [
4,
5], aerosol mineralogy [
6], and heterogeneous reactions with acids in the atmosphere [
7,
8]. Fe speciation and solubility in aerosols must be investigated to understand the carbon cycle at the Earth’s surface through aerosols.
X-ray absorption fine structure (XAFS) spectroscopy has been frequently employed to analyze Fe speciation in aerosols (e.g., [
9,
10,
11,
12,
13,
14,
15]). XAFS for a bulk sample can provide direct information on average Fe speciation, which should be related to Fe fractional solubility. XAFS consists of X-ray absorption near-edge structure (XANES) and extended X-ray absorption fine structure (EXAFS) [
16,
17]. However, the latter technique requires precise measurement of the relative change in the degree of X-ray absorption better than 10
−3 order. Thus, EXAFS is usually unavailable for aerosol samples because the amount of aerosol collected on filters is limited, resulting in weak signals. Consequently, many studies preferred XANES spectroscopy over EXAFS spectroscopy for Fe speciation in aerosols, which is relatively easy to measure compared with EXAFS.
Speciation is generally determined by the least squares fitting (LCF) of the analyzed spectrum, with a model spectrum obtained through the linear combination of the spectra of endmembers that can be present in the sample. In this case, the accuracy of the fitting depends on the choice of endmembers and the quality of spectra. In addition, the spectra of endmembers must be mutually different; otherwise, the ratio of these endmembers cannot be determined. For this reason, fine structures in XANES should have variations to some degree with different features among the possible Fe species, which is not always the case for various Fe species (e.g., ferrihydrite, goethite, and Fe(III)-bearing smectite) present in aerosols.
A recent study has found that XANES with high energy resolution can be obtained through high-energy-resolution fluorescence X-ray detection, if (i) the lifetime broadening of the excited state is smaller than the ground state and (ii) the energy resolution of the detection system is better than the natural width caused by the lifetime broadening. Consequently, high-energy-resolution fluorescence X-ray detected (HERFD-XANES) produces many peculiar features appearing in the XANES region [
18]. However, speciation based on HERFD-XANES has not been tested for aerosol samples. Thus, the present study aims to clarify the advantage of Fe K-edge HERFD-XANES in Fe speciation in aerosols.
2. Materials and Methods
2.1. Samples
Various Fe species (ferrihydrite, goethite, hematite, magnetite, smectite (montmorillonite), biotite, and Fe(III) sulfate) were prepared for XANES analysis. Ferrihydrite and goethite were prepared as previously described [
19]. Fe(III) sulfate (Fe
2(SO
4)
3·5H
2O) and magnetite were purchased from Wako Pure Chem. Ltd., Osaka, Japan. As a reference, Fe(III)-bearing montmorillonite (SWy-1) issued by The Clay Minerals Society with all Fe located in the octahedral layer [
20] and Fe(III)/ΣFe
total {= Fe(III)/(Fe(II)+Fe(III))} = 93% [
21] were employed in this study. Fe(II)-bearing biotite from the Nellore District of Andhra Pradesh, India (Nichika-Biotite) was also employed, and its composition is K
0.83Na
0.04(Al
0.57Mg
0.50Fe
2+1.57Fe
3+0.05)(Si
2.68Al
1.32)O
10(OH)
2 with Fe(III)/ΣFe
total = 3% as determined through potassium dichromate titration.
An aerosol sample denoted as MT21 was collected from 16 March to 19 March 2021 at the roof top of Faculty of Science Building No. 1 in the Hongo campus of the University of Tokyo in Bunkyo-ku, Tokyo, Japan. The site is in the central part of Tokyo (latitude: 34.40° N, longitude: 132.71° E), and its height is 67 m above sea level. The aerosol sample was collected within 76 h with a high-volume air sampler (Kimoto, MODEL-123SL, Osaka, Japan) equipped with a cascade impactor (Tisch Environmental Inc., Series 230, Cleves, OH, USA). The aerosol was separated into 7 size fractions by a cascade impactor (Stage 1: >10.2 μm; Stage 2: 4.2–10.2 μm; Stage 3: 2.1–4.2 μm; Stage 4: 1.3–2.1 μm; Stage 5: 0.69–1.3 μm; Stage 6: 0.39–0.69 μm; Stage 7 (Backup Filter: BF): <0.39 μm). Washed PTFE filters (PF050, ADVANTEC, Japan) were used for the sampling [
22]. In this study, the Stage 2 (S2) sample of MT21 (MT21-S2) was employed as the aerosol sample mainly consisting of mineral dust considering its particle size.
2.2. XANES Analysis
HERFD-XANES spectra were obtained through the wavelength dispersive fluorescence yield (FY) XANES measurement at Fe K-edge at BL39XU, SPring-8, Hyogo, Japan. The incident X-ray was obtained with a Si (111) double-crystal monochromator for X-ray by using a linear undulator at BL39XU. Higher harmonics were rejected by a horizontally reflected mirror coated with rhodium. The energy resolution of the incident X-ray in this system was estimated to be 0.4 eV at 7 keV. For the HERFD-XANES measurement, Fe K
α1 emission was determined using five Ge 440 spherically bent crystals (diameter: 40 mm) and a PILATUS 100 K detector mounted on a Rowland circle 820 mm in diameter. The measurement was conducted under ambient conditions. Details of the set-up were also reported in previous papers [
23,
24]. Before measuring HERFD-XANES, the X-ray emission spectrum must be obtained, which requires more measuring time than the normal XANES method. The measuring time for HERFD-XANES itself depends on the concentration of the targeted element and photon flux. The measurement time using the HERFD-XANES system at BL39XU is similar to normal XANES when applied to the same sample. Given that the signal-to-background ratio is much higher for HERFD-XANES, the detection limit of this method is much lower than that for conventional fluorescence XANES [
18,
24]. HERFD-XANES spectra of the Fe reference materials, including ferrihydrite, goethite, hematite, magnetite, montmorillonite (SWy-2), and biotite were obtained for the tablet sample of each reference material with Fe concentration lower than 0.1 wt.% diluted by boron nitride to prevent the thickness effect that causes attenuation of XANES peaks [
16]. The effect of beam damage on each spectrum by the incident X-ray was negligible for the samples employed here, since repeated scans gave similar spectra for them. Fe speciation in the sample was conducted on the basis of the LCF for the XANES spectrum of MT21-S2 fitted by a model spectrum from the linear combination of the spectra of possible Fe species in the aerosol sample.
Normal XANES spectra for the same reference samples and MT21-S2 were also obtained at BL-12C in the transmission and FY modes, respectively. The FY spectrum was obtained using a 7-element silicon-drift detector equipped at the beamline. LCF was conducted for the sample using the reference samples measured in the same beamline, because the energy resolution of each beamline can be different.
2.3. Selective Extraction Experiment
Ferrihydrite and goethite in the aerosol samples were extracted as previously described by [
25] as follows. The fraction containing ferrihydrite (Fraction A) was determined as follows: a part of the aerosol filter (ca. 0.05 g) was soaked in a falcon tube containing 10 mL of 1 M hydroxylamine–HCl solution in 25%
v/
v acetic acid and left in a shaker for 48 h. The fraction including both goethite and ferrihydrite (Fraction B) was independently determined as follows: a part of the aerosol filter (ca. 0.05 g) was soaked in a falcon tube containing 10 mL of sodium dithionite solution (50 g/L) buffered to pH 4.8 with 0.35 M acetic acid/0.2 M sodium and left in a shaker for 2 h. The extracted solution in each fraction was passed through a 0.2 µm PTFE filter (ADVANTEC) and diluted with 2% HNO
3. The concentration of Fe was determined via ICP-MS (ICP-MS: Agilent 7700). Ferrihydrite (54.7%) was extracted in Fraction B [
25], and the goethite fraction was determined by subtracting the ferrihydrite faction from Fe dissolved in Fraction B. The total Fe in each filter was determined by Fe decomposed in HF-HClO
4 solution using the ICP-MS.
3. Results and Discussion
3.1. XANES and First Derivative Spectra
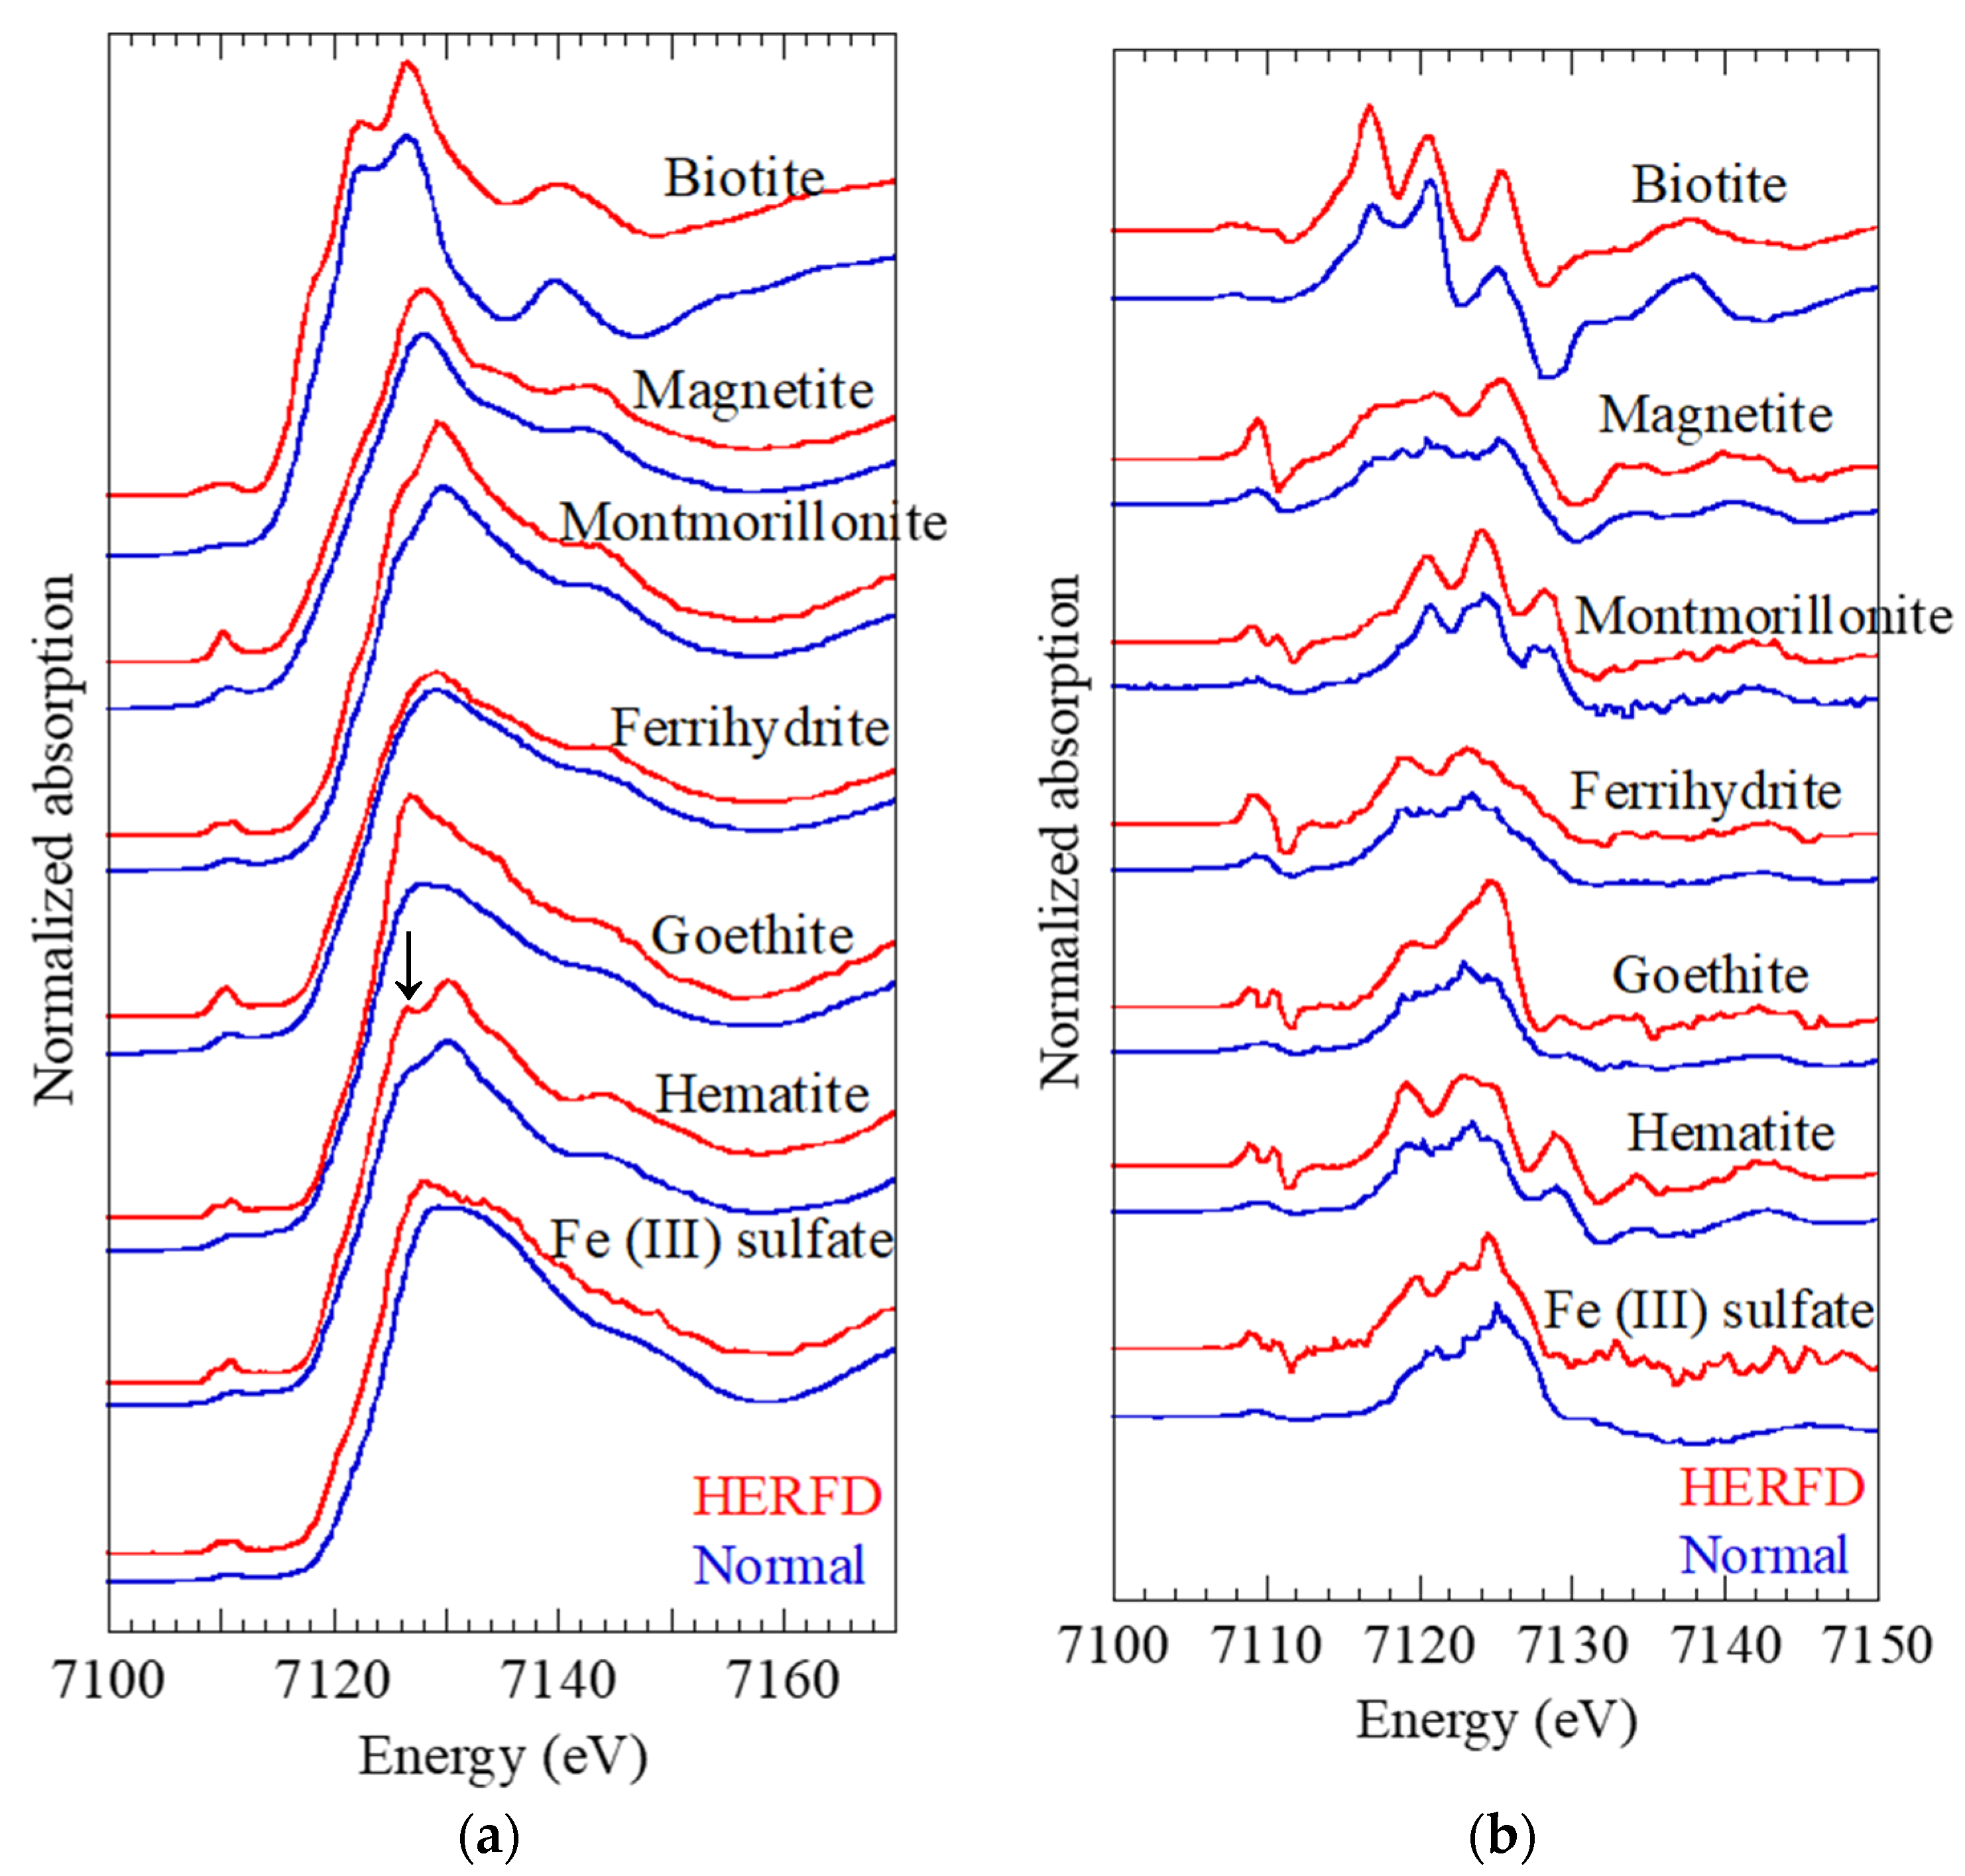
This study analyzed the HERFD-XANES spectra of various Fe species that can be found in aerosol samples, including ferrihydrite, goethite, hematite, magnetite, smectite, biotite, and Fe(III) sulfate (
Figure 1a). Comparison of HERFD-XANES spectra with normal XANES spectra obtained in transmission mode revealed that the spectra in the main XANES region from 7114 eV to 7160 eV were not significantly different from the HERFD- and normal XANES spectra. However, some peaks and shoulders within each spectrum became clearer, such as the peak at 7126.5 eV in hematite.
In various geochemical and mineralogical studies, speciation of various elements in target samples have been conducted based on the LCF for the XANES spectrum obtained for the element in the samples (LCF-XANES method). Practically, LCF tries to minimize the difference between the sample and model spectra obtained through the linear combination of the spectra of endmembers which are supposed to be present in the sample. In this case, if their spectra are similar, the endmembers cannot be identified using the LCF-XANES method. Thus, the distinctive features in the XANES spectra improve the accuracy of the ratios of the species (endmembers) determined by LCF-XANES.
The characteristic shapes of some shoulders were clearly visible in the first derivative spectra, and this tendency was emphasized in the pre-edge region (
Figure 1b). The overall structure became clearer in the HERFD-XANES spectra compared with that in the normal XANES spectra, which reflect the high energy resolution of HERFD-XANES. These features could be useful in identifying each Fe species. For example, the first derivative spectra of ferrihydrite and goethite were similar in the normal XANES spectra but showed distinctive shapes in the HERFD-XANES spectra at the pre-edge and main regions. For the LCF analysis, the first derivative of XANES can be also employed to increase the accuracy for the speciation analysis.
3.2. Pre-Edge Region
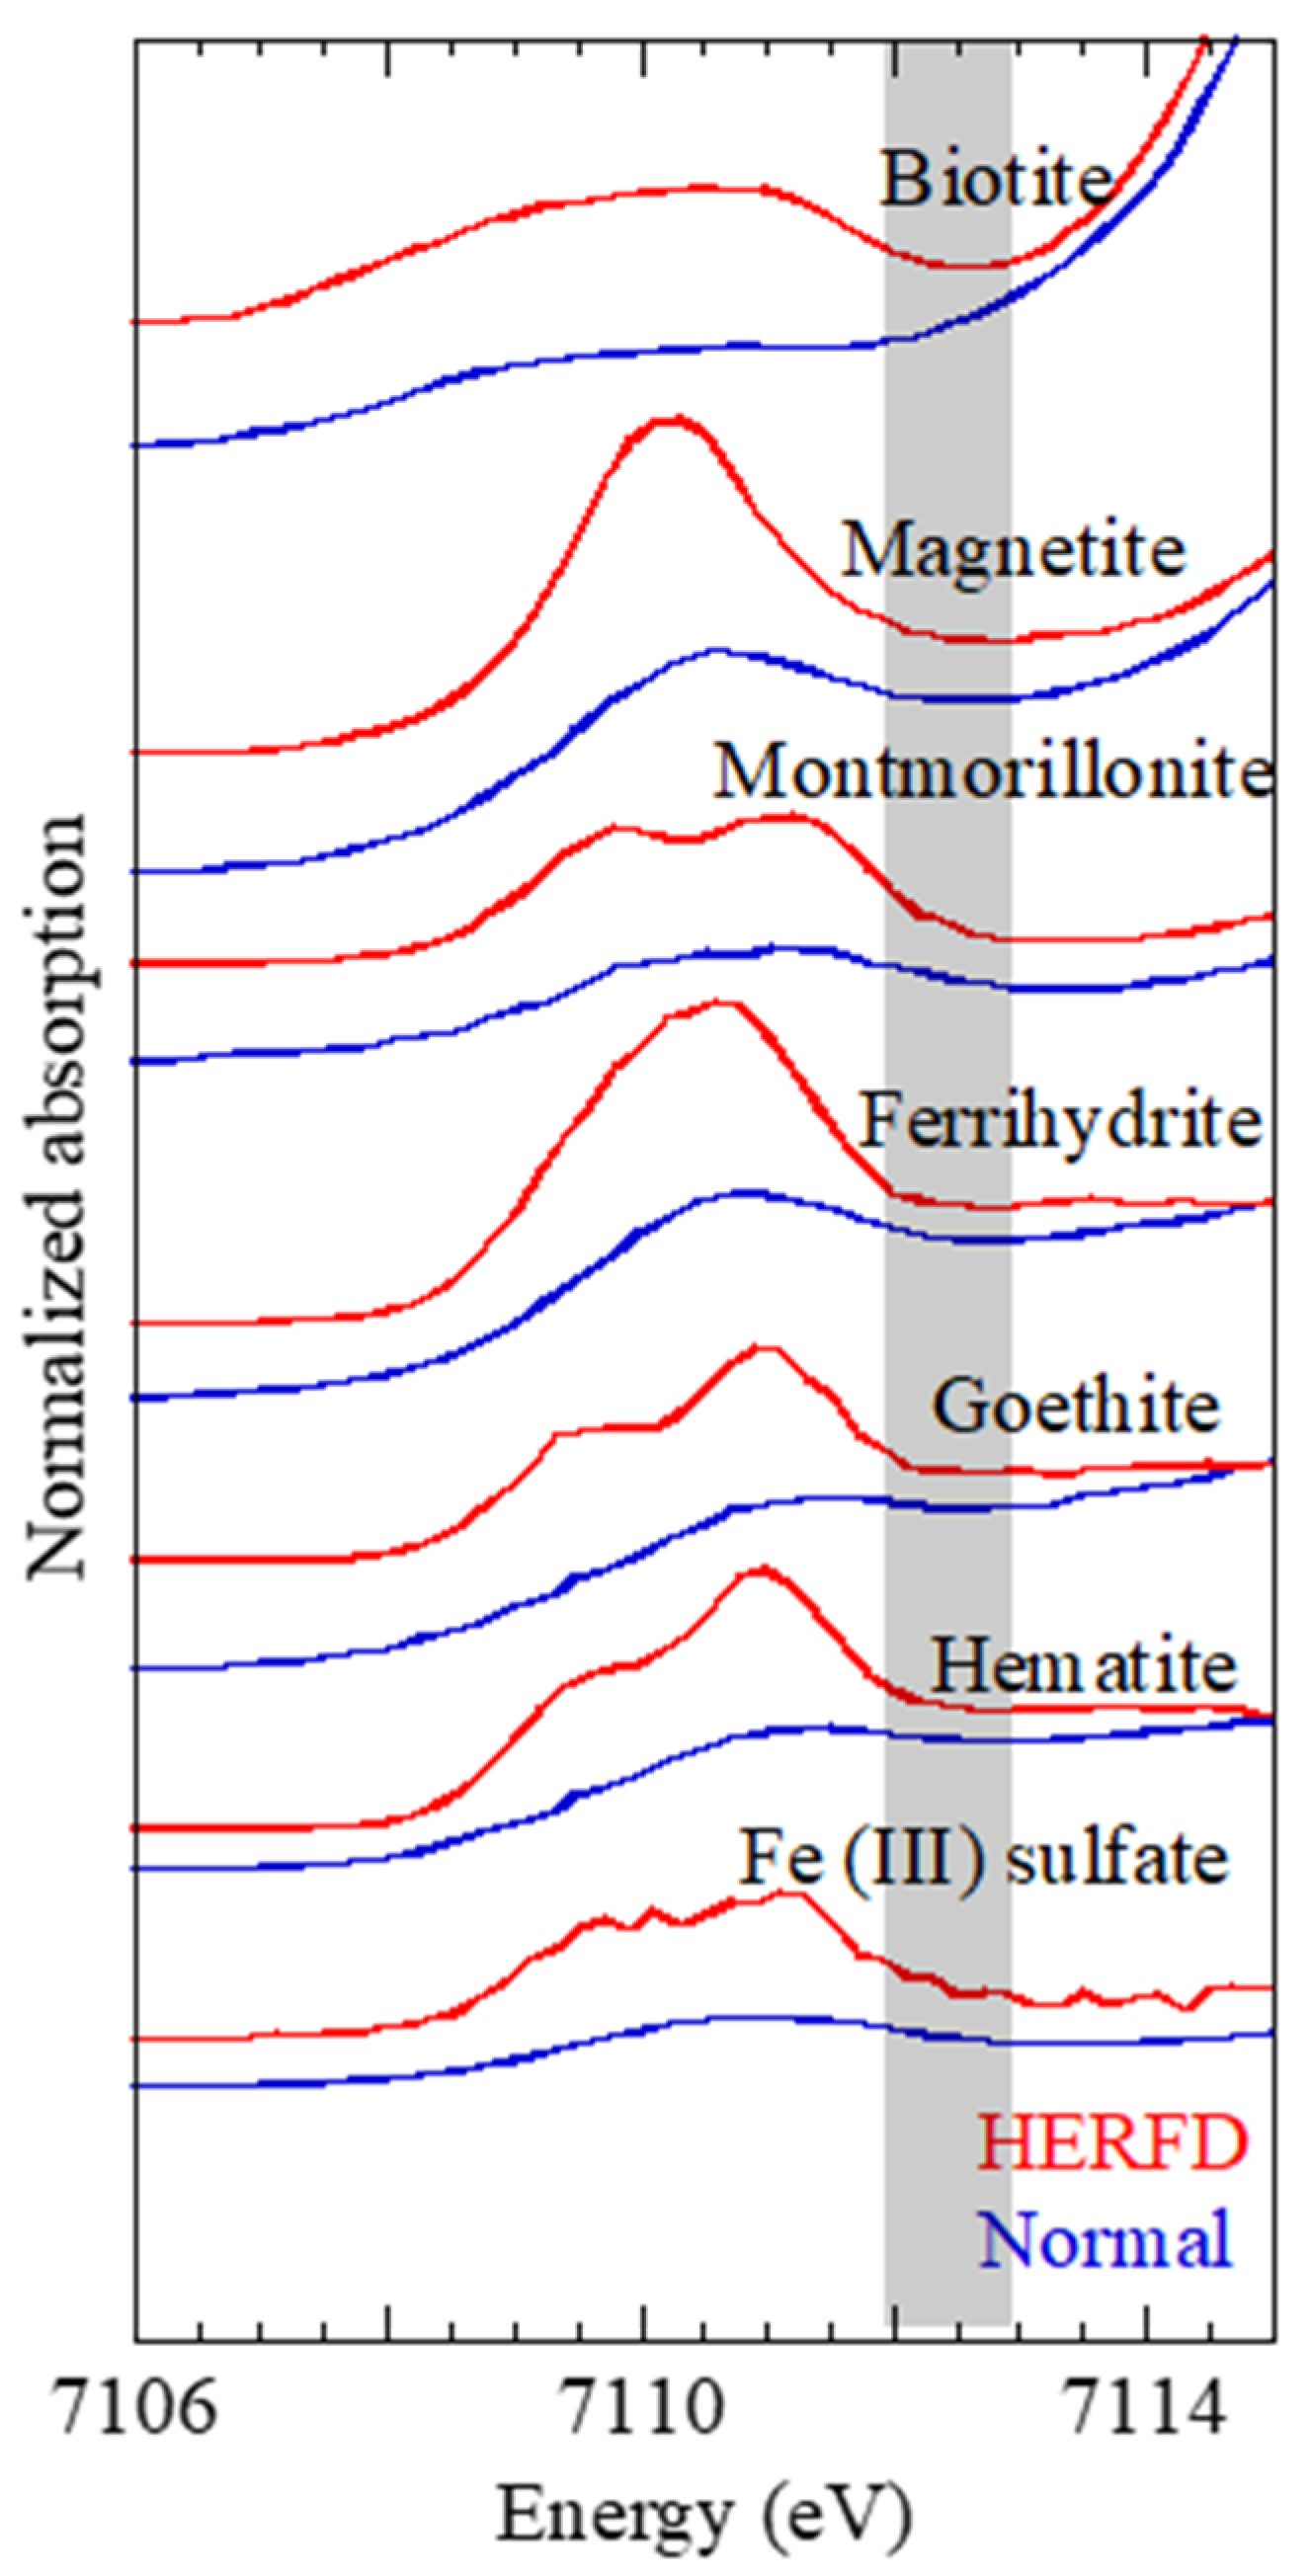
The difference between the normal XANES and HERFD-XANES spectra was more distinctive in the pre-edge region (7108–7114 eV). Enlarged spectra in the pre-edge region (
Figure 2) showed that the pre-edge structure of HERFD-XANES was distinct from that of normal XANES to a much larger degree than that in the main XANES region. The difference among the three common Fe(III) (hydr)oxides (hematite, goethite, and ferrihydrite) was subtle in the normal XANES spectra. However, the difference was more evident in the HERFD-XANES spectra than in the normal XANES spectra.
The pre-edge structure of Fe K-edge XANES has been studied from various aspects. The peak is related to 1s → 3d (quadrupolar) and/or 1s → 4p (dipolar) electronic transitions [
26,
27]. The pre-edge has been highlighted in terms of the analysis of oxidation state [
28,
29] and coordination number [
28,
30] of Fe in various compounds. The pre-edge feature is different among the three Fe(III) (hydr)oxides, although the valence is identical among them. Wilke et al. [
27] showed that when the octahedron of oxygen atoms around Fe
3+ is slightly distorted, many Gaussian components are included within the pre-edge peak. Moreover, it was pointed out that one to three extra components are identified in the higher-energy part (7112–7113 keV) of the pre-edge region (
Figure 2) in the normal XANES spectra. Wilke et al. [
28] reported that (i) these extra components have yet to be theoretically predicted, (ii) they have different shapes compared to the other Gaussian peaks in the pre-edge region, and (iii) their intensity increases with the degree of Fe(O,OH)
6-octahedral polymerization [
27]. In the HERFD-XANES spectra, the dipolar and quadrupolar transition peaks in the lower-energy part of the pre-edge region were clearly enhanced, which is not the case for the extra components. Consequently, the pre-edge features of HERFD-XANES were very different from those of normal XANES.
3.3. Application to Aerosol Samples
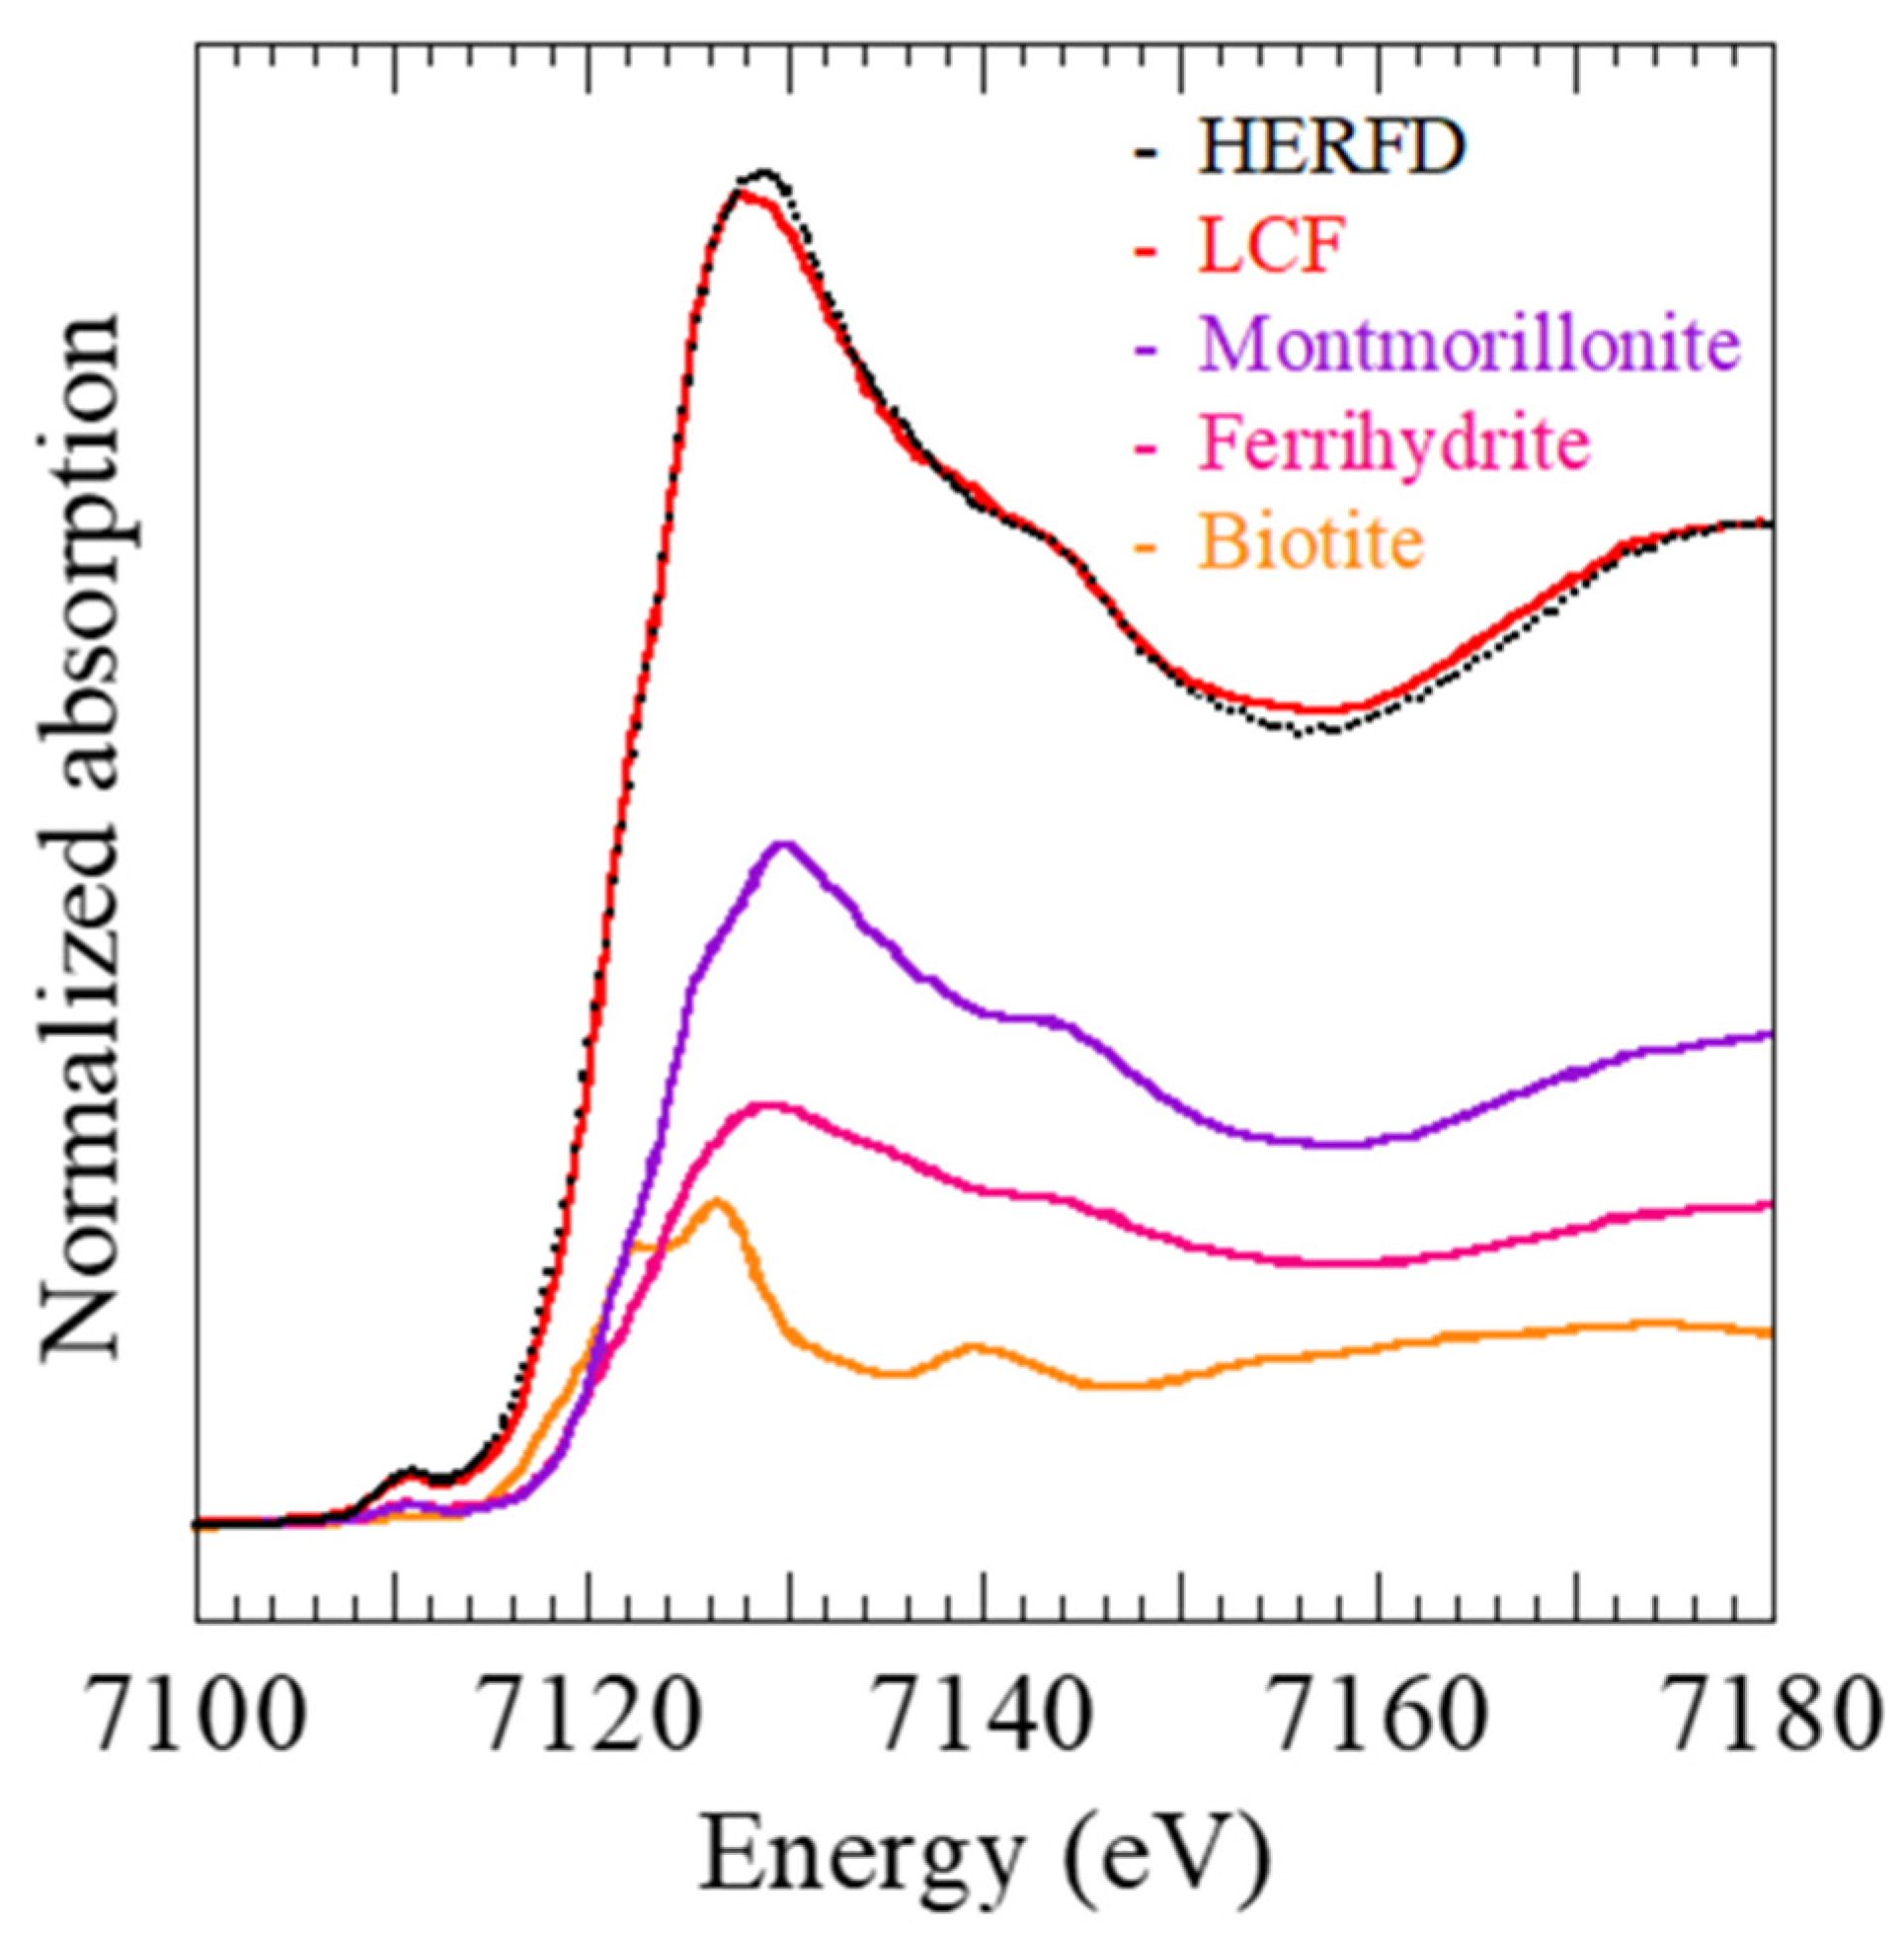
Application of HERFD-XANES was conducted for an aerosol sample on the filter (MT21-S2) collected in Tokyo, Japan. The S-2 fraction of the impactor, classified as mineral aerosol because of its 4.2–10.2 µm size range, was employed in this study. According to Takahashi et al. and Kurisu et al. [
10,
12], ferrihydrite, biotite, and montmorillonite can be main Fe species in such mineral aerosols. Thus, normal XANES was fitted by the three species (
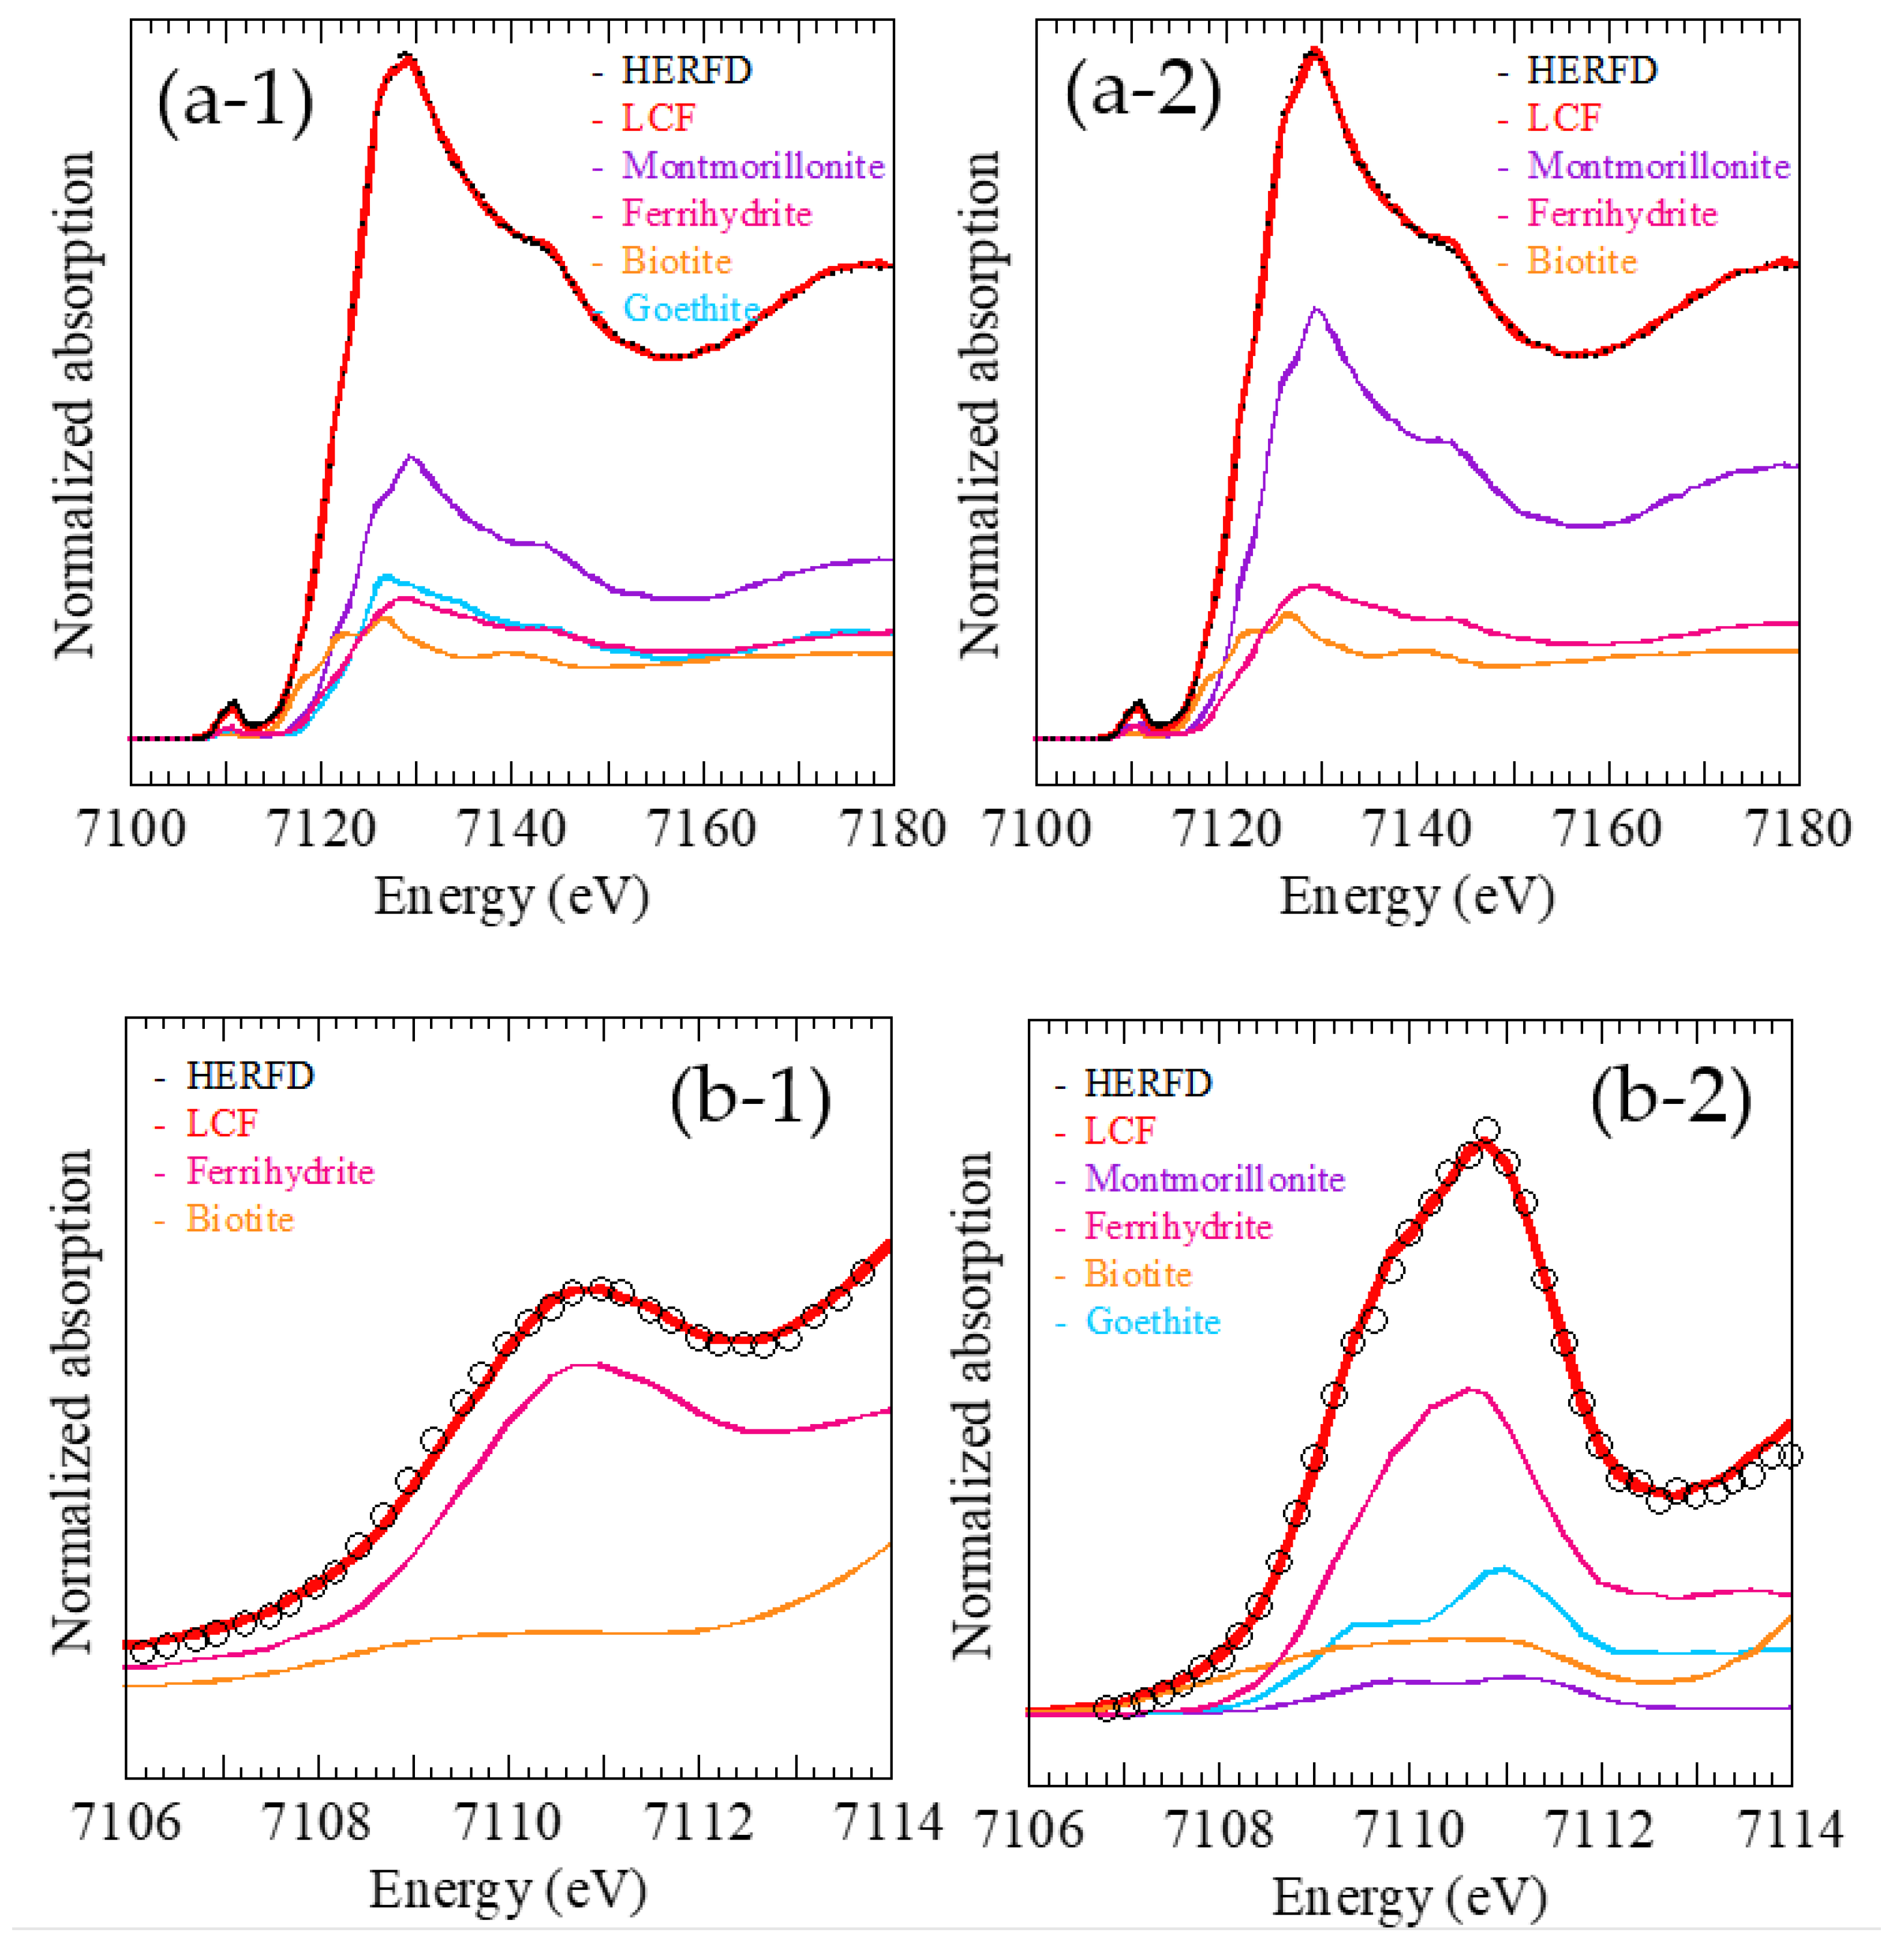
Figure 3), showing that the speciation estimated was ferrihydrite: biotite: montmorillonite = 33 ± 4: 19 ± 1: 48 ± 3. However, the three components for the fitting were not sufficient to fit the sample spectra of HERFD-XANES, suggesting the need for another reference sample in the LCF to fit the aerosol sample. HERFD-XANES was successfully fit by including goethite as a fourth component (
Figure 4(a-1,a-2)), showing the relative percentages of ferrihydrite: biotite: montmorillonite: goethite as 22 ± 2: 18 ± 1: 38 ± 2: 22 ± 2. It must be noted that the combined fraction of ferrihydrite and goethite (19% + 23% = 42%) in this LCF was similar to that of ferrihydrite in the three-component LCF (=33%). This result suggests that normal XANES cannot distinguish between ferrihydrite and goethite, as suggested in
Section 3.1. When goethite was included as a fourth endmember for the LCF of normal XANES, the fraction of goethite calculated by the LCF method became negative, indicating that the presence of goethite cannot be suggested by the LCF of normal XANES.
A similar phenomenon was more obvious in the LCF of the pre-edge region. When the pre-edge region of normal XANES was employed for LCF, the Fe species could not be easily identified in the aerosol samples because the spectra in the pre-edge region were similar and featureless (blue curves in
Figure 2), with only one peak shape for ferrihydrite, goethite, biotite, and smectite. In this case, the ratios of these Fe species are impossible to determine. In contrast, the pre-edge structures obtained by HERFD-XANES were considerably different among ferrihydrite, goethite, biotite, and montmorillonite, allowing the more accurate identification of Fe species than normal XANES alone. The speciation result based on the LCF of the pre-edge region by HERFD-XANES (
Figure 4(b-2)) was ferrihydrite: biotite: montmorillonite: goethite = 39 ± 2: 25 ± 2: 10 ± 3: 27 ± 3.
4. Discussion
4.1. Validity of the LCF Method to Estimate Fe Species
Results of this study emphasized the better accuracy of HERFD-XANES for LCF analysis for Fe speciation than normal XANES. As shown above, the presence of goethite can be assessed using HERFD-XANES but not using normal XANES because of the more complex spectral features detected in the former method. This discussion was reinforced using the selective extraction method described by Poulton and Canfield [
25], which was carefully developed to identify various Fe (oxy)hydroxides. The present study focused on ferrihydrite, goethite, and residual phases, and the most important difference between the normal XANES and HERFD-XANES methods was the ferrihydrite and goethite fractions. The fractions estimated with the method showed that the first and second fractions corresponding to ferrihydrite and ferrihydrite + goethite were 21 ± 3% and 40 ± 6%, respectively. The extraction efficiency of the two species in the first fraction was estimated to be 54% and 5%, respectively, and in the second fraction, estimated to be 55% and 63%, respectively [
25]. Based on the efficiencies, the ferrihydrite and goethite fractions in MT21-S2 were estimated to be 35 ± 5% and 32 ± 11%, respectively (
Table 1). The results of HERFD-XANES clearly revealed that a considerable amount of goethite was present in the sample.
The two sets of speciation data obtained for MT21-S2 using LCF of HERFD-XANES for the whole XANES and pre-edge regions were ferrihydrite: biotite: montmorillonite: goethite = 22: 18: 38: 22 and 39: 25: 10: 27, respectively. The ferrihydrite and goethite fractions obtained by HERFD-XANES were generally consistent with the selective extraction results of ferrihydrite: residue (biotite + montmorillonite): goethite = 35: 33: 32.
The Fe speciation based on the LCF of the two regions in HERFD-XANES was somewhat different (
Table 1), as evidenced by the increase and decrease of ferrihydrite and montmorillonite, respectively, in the LCF for the pre-edge region. In this case, pre-edge results should be more reliable because the spectra of goethite and montmorillonite are more different in the pre-edge region than in the main XANES region (
Figure 2).
4.2. LCF Applied to a Specific Energy Region of XANES
When we use the whole XANES region for the LCF, the contribution of the pre-edge region in the LCF is low, though the pre-edge region is included in the energy range. It means that the speciation via LCF in the main XANES region is dominated by the structure in the whole XANES region. Thus, LCF of the pre-edge and main regions should be considered as independent methods. Speciation must be conducted by a better one depending on each system. In the aerosol systems, as exemplified above, most of the Fe species were Fe(III)-bearing oxygen-coordinated species. In this case, the present study reveals that LCF for the pre-edge region is better. Conversely, when both oxygen- and sulfur-coordinated Fe species are present in the system, LCF of the main XANES region is effective because of the much different structures in the energy range between the two series of the species [
31].
LCF fitting of a specific region in XANES has been also conducted before, such as speciation of sulfur in aerosol [
32,
33]. In aerosols, sulfur is almost completely oxidized to sulfate, at least for inorganic sulfur species. Although the peak energy of sulfur K-edge XANES shifts greatly depending on the oxidation state of sulfur, the sensitivity to the oxidation state does not contribute to further speciation of sulfur in aerosols. However, the post-edge structure after the prominent peak of sulfate in the sulfur K-edge region is sensitive to the sulfate counter cation in aerosols, which is important for understanding the chemical processes in the formation of sulfate aerosols. Similarly, LCF fitting focusing on the pre-edge region rather than the whole XANES region in HERFD-XANES can be a new tool for the better speciation of Fe in aerosols because Fe(III)-bearing oxygen-coordinated species are the main possible Fe species.
5. Conclusions
The LCF analysis of conventional Fe K-edge XANES has been used for Fe speciation in various natural samples. In particular, Fe speciation in aerosol is important because of its strong link to its water solubility, which is consequently related to its bioproductivity in the ocean. Compared with X-ray diffraction (XRD) and Mössbauer spectroscopy, XANES is a more powerful method because it can be applied to a small number of samples. However, the accuracy of LCF-XANES is not always high, especially when the XANES spectra of possible species are similar. In this case, HERFD-XANES has an advantage over normal XANES to increase detection accuracy because its spectrum has a much higher energy resolution with more characteristic features due to suppressed broadening of XANES caused by the core–hole lifetime effect. Consequently, LCF-HERFD-XANES is superior to normal LCF-XANES because HERFD-XANES has a lower detection limit due to high signal-to-noise ratio and high accuracy based on the more distinctive features in the spectra. The latter aspect was confirmed by selective extraction, revealing that Fe speciation in aerosols via LCF-XANES can be improved using HERFD-XANES. In particular, LCF-HERFD-XANES in the pre-edge region is effective for Fe speciation in aerosol samples because fine structures in the region are more distinctive among Fe(III) species, including ferrihydrite, goethite, and Fe(III)-bearing montmorillonite, which are the main Fe species in aerosols, although LCF for the whole XANES energy region can be accurate for the system containing oxygen- and sulfur-coordinated Fe species. The present method is especially advantageous over other techniques, such as XRD and Mössbauer spectroscopy, because (i) the available amount of aerosol samples is limited for other speciation methods and (ii) ferrihydrite, which is an important Fe species in aerosols, cannot be detected by XRD due to its amorphous nature. At present, the beamtime of the HERFD-XANES is more limited than conventional XANES. Thus, further experiments are needed in future to validate these conclusions by measuring synthetic compounds and to benchmark the concentration ratio for standard model systems which represent the aerosol samples.
Author Contributions
Conceptualization, S.N., M.K. and Y.T.; methodology, N.K.; validation, M.K. and N.K.; writing—review and editing, S.N. and Y.T.; project administration, Y.T.; funding acquisition, Y.T. All authors have read and agreed to the published version of the manuscript.
Funding
This research was funded by Grant-in-Aid for Scientific Research from the Japan Society for Promotion of Science (nos. 21H03585, 21K17886, 21H00162, 21K18649, 21J11420, 20K23369, 19K21893, 21K18917, 19H01960, 18H04134, and 18KK0296).
Acknowledgments
HERFD-XANES analysis was conducted at SPring-8 (proposal Nos.: 2022A1507, 2021B0180, 2021B0174, 2021B1625, 2021A2072, and 2021B2090) and Photon Factory (2021G123, 2020G670, 2020G081, and 2018G089).
Conflicts of Interest
The authors declare no conflict of interest.
References
- Martin, J.H.; Fitzwater, S.E. Iron Deficiency Limits Phytoplankton Growth in the North-East Pacific Subarctic. Nature 1988, 331, 341–343. [Google Scholar] [CrossRef]
- Myriokefalitakis, S.; Ito, A.; Kanakidou, M.; Nenes, A.; Krol, M.C.; Mahowald, N.M.; Scanza, R.A.; Hamilton, D.S.; Johnson, M.S.; Meskhidze, N.; et al. Reviews and Syntheses: The GESAMP Atmospheric Iron Deposition Model Intercomparison Study. Biogeosciences 2018, 15, 6659–6684. [Google Scholar] [CrossRef] [Green Version]
- Croot, P.L.; Johansson, M. Determination of Iron Speciation by Cathodic Stripping Voltammetry in Seawater Using the Competing Ligand 2-(2-Thiazolylazo)-p-Cresol (TAC). Electroanalysis 2000, 12, 565–576. [Google Scholar] [CrossRef]
- Baker, A.R.; Jickells, T.D. Mineral Particle Size as a Control on Aerosol Iron Solubility. Geophys. Res. Lett. 2006, 33, 1–4. [Google Scholar] [CrossRef]
- Ooki, A.; Nishioka, J.; Ono, T.; Noriki, S. Size Dependence of Iron Solubility of Asian Mineral Dust Particles. J. Geophys. Res. Atmos. 2009, 114, 1–8. [Google Scholar] [CrossRef]
- Journet, E.; Desboeufs, K.V.; Caquineau, S.; Colin, J.L. Mineralogy as a Critical Factor of Dust Iron Solubility. Geophys. Res. Lett. 2008, 35, 3–7. [Google Scholar] [CrossRef] [Green Version]
- Mackie, D.S.; Boyd, P.W.; Hunter, K.A.; McTainsh, G.H. Simulating the Cloud Processing of Iron in Australian Dust: PH and Dust Concentration. Geophys. Res. Lett. 2005, 32, 1–4. [Google Scholar] [CrossRef]
- Shi, Z.; Krom, M.D.; Bonneville, S.; Baker, A.R.; Jickells, T.D.; Benning, L.G. Formation of Iron Nanoparticles and Increase in Iron Reactivity in Mineral Dust during Simulated Cloud Processing. Environ. Sci. Technol. 2009, 43, 6592–6596. [Google Scholar] [CrossRef]
- Majestic, B.J.; Schauer, J.J.; Shafer, M.M. Application of Synchrotron Radiation for Measurement of Iron Red-Ox Speciation in Atmospherically Processed Aerosols. Atmos. Chem. Phys. 2007, 7, 2475–2487. [Google Scholar] [CrossRef] [Green Version]
- Takahashi, Y.; Higashi, M.; Furukawa, T.; Mitsunobu, S. Change of Iron Species and Iron Solubility in Asian Dust during the Long-Range Transport from Western China to Japan. Atmos. Chem. Phys. 2011, 11, 11237–11252. [Google Scholar] [CrossRef] [Green Version]
- Schroth, A.W.; Crusius, J.; Sholkovitz, E.R.; Bostick, B.C. Iron Solubility Driven by Speciation in Dust Sources to the Ocean. Nat. Geosci. 2009, 2, 337–340. [Google Scholar] [CrossRef]
- Kurisu, M.; Takahashi, Y.; Iizuka, T.; Uematsu, M. Very Low Isotope Ratio of Iron in Fine Aerosols Related to Its Contribution to the Surface Ocean. J. Geophys. Res. 2016, 121, 11119–11136. [Google Scholar] [CrossRef]
- Petroselli, C.; Moroni, B.; Crocchianti, S.; Selvaggi, R.; Vivani, R.; Soggia, F.; Grotti, M.; d’Acapito, F.; Cappelletti, D. Iron Speciation of Natural and Anthropogenic Dust by Spectroscopic and Chemical Methods. Atmosphere 2018, 10, 8. [Google Scholar] [CrossRef] [Green Version]
- Salazar, J.R.; Pfotenhauer, D.J.; Leresche, F.; Rosario-Ortiz, F.L.; Hannigan, M.P.; Fakra, S.C.; Majestic, B.J. Iron Speciation in PM 2.5 From Urban, Agriculture, and Mixed Environments in Colorado, USA. Earth Space Sci. 2020, 7, e2020EA001262. [Google Scholar] [CrossRef]
- Fan, S.; Gao, Y.; Lai, B.; Elzinga, E.J.; Yu, S. Aerosol Iron Speciation and Seasonal Variation of Iron Oxidation State over the Western Antarctic Peninsula. Sci. Total Environ. 2022, 824, 153890. [Google Scholar] [CrossRef]
- Manceau, A.; Marcus, M.A.; Tamura, N. Quantitative Speciation of Heavy Metals in Soils and Sediments by Synchrotron X-ray Techniques. Rev. Mineral. Geochem. 2002, 49, 341–428. [Google Scholar] [CrossRef]
- Newville, M. Fundamentals of XAFS. Rev. Mineral. Geochem. 2014, 78, 33–74. [Google Scholar] [CrossRef]
- Proux, O.; Lahera, E.; Del Net, W.; Kieffer, I.; Rovezzi, M.; Testemale, D.; Irar, M.; Thomas, S.; Aguilar-Tapia, A.; Bazarkina, E.F.; et al. High-Energy Resolution Fluorescence Detected X-ray Absorption Spectroscopy: A Powerful New Structural Tool in Environmental Biogeochemistry Sciences. J. Environ. Qual. 2017, 46, 1146–1157. [Google Scholar] [CrossRef]
- Schwertmann, U.; Cornell, R.M. Iron Oxides in the Laboratory: Preparation and Characterization; John Wiley & Sons: Hoboken, NJ, USA, 2008. [Google Scholar]
- Bishop, J.; Madejová, J.; Komadel, P.; Fröschl, H. The Influence of Structural Fe, Al and Mg on the Infrared OH Bands in Spectra of Dioctahedral Smectites. Clay Miner. 2002, 37, 607–616. [Google Scholar] [CrossRef]
- Gournis, D.; Mantaka-Marketou, A.E.; Karakassides, M.A.; Petridis, D. Effect of c -Irradiation on Clays and Organoclays: È Ssbauer and XRD Study a Mo. Phys. Chem. Miner. 2000, 27, 514–521. [Google Scholar] [CrossRef]
- Sakata, K.; Kurisu, M.; Tanimoto, H.; Sakaguchi, A.; Uematsu, M.; Miyamoto, C.; Takahashi, Y. Custom-Made PTFE Filters for Ultra-Clean Size-Fractionated Aerosol Sampling for Trace Metals. Mar. Chem. 2018, 206, 100–108. [Google Scholar] [CrossRef]
- Shimokasa, R.; Kawamura, N.; Matsumoto, T.; Kawakami, K.; Kawabata, T.; Isumi, G.; Uozumi, T.; Mitsuda, A.; Wada, H.; Mizumaki, M.; et al. Temperature-Induced Valence Transition in EuNi2(Si1–XGex)2 Investigated by High-Energy Resolution Fluorescence Detection X-ray Absorption Spectroscopy. Radiat. Phys. Chem. 2020, 175, 2018–2021. [Google Scholar] [CrossRef]
- Konagaya, R.; Kawamura, N.; Yamaguchi, A.; Takahashi, Y. Highly-Sensitive Analysis of Fluorescence XANES at Europium (Eu) L III -Edge for the Determination of Oxidation State for Trace Amount of Eu in Natural Samples by Bragg-Type Crystal Analyzer System. Chem. Lett. 2021, 50, 1570–1572. [Google Scholar] [CrossRef]
- Poulton, S.W.; Canfield, D.E. Development of a Sequential Extraction Procedure for Iron: Implications for Iron Partitioning in Continentally Derived Particulates. Chem. Geol. 2005, 214, 209–221. [Google Scholar] [CrossRef]
- Westre, T.E.; Kennepohl, P.; DeWitt, J.G.; Hedman, B.; Hodgson, K.O.; Solomon, E.I. A Multiplet Analysis of Fe K-Edge 1s → 3d Pre-Edge Features of Iron Complexes. J. Am. Chem. Soc. 1997, 119, 6297–6314. [Google Scholar] [CrossRef]
- Dräger, G.; Frahm, R.; Materlik, G.; Brümmer, O. On the Multipole Character of the X-ray Transitions in the Pre-Edge Structure of Fe K Absorption Spectra. An Experimental Study. Phys. Status Solidi 1988, 146, 287–294. [Google Scholar] [CrossRef]
- Wilke, M.; Farges, F.; Petit, P.-E.; Brown, G.E.; Martin, F. Oxidation State and Coordination of Fe in Minerals: An Fe K-XANES Spectroscopic Study. Am. Mineral. 2001, 86, 714–730. [Google Scholar] [CrossRef]
- Farges, F.; Lefrère, Y.; Rossano, S.; Berthereau, A.; Calas, G.; Brown, G.E. The Effect of Redox State on the Local Structural Environment of Iron in Silicate Glasses: A Combined XAFS Spectroscopy, Molecular Dynamics, and Bond Valence Study. J. Non. Cryst. Solids 2004, 344, 176–188. [Google Scholar] [CrossRef]
- Cutsail, G.E.; Blaesi, E.J.; Pollock, C.J.; Bollinger, J.M.; Krebs, C.; DeBeer, S. High-Resolution Iron X-ray Absorption Spectroscopic and Computational Studies of Non-Heme Diiron Peroxo Intermediates. J. Inorg. Biochem. 2020, 203, 110877. [Google Scholar] [CrossRef] [PubMed]
- Prietzel, J.; Thieme, J.; Eusterhues, K.; Eichert, D. Iron Speciation in Soils and Soil Aggregates by Synchrotron-Based X-ray Microspectroscopy (XANES, μ-XANES). Eur. J. Soil Sci. 2007, 58, 1027–1041. [Google Scholar] [CrossRef]
- Takahashi, Y.; Kanai, Y.; Kamioka, H.; Ohta, A.; Maruyama, H.; Song, Z.; Shimizu, H. Speciation of Sulfate in Size-Fractionated Aerosol Particles Using Sulfur K-Edge X-ray Absorption near-Edge Structure. Environ. Sci. Technol. 2006, 40, 5052–5057. [Google Scholar] [CrossRef] [PubMed]
- Miyamoto, C.; Sakata, K.; Yamakawa, Y.; Takahashi, Y. Determination of Calcium and Sulfate Species in Aerosols Associated with the Conversion of Its Species through Reaction Processes in the Atmosphere and Its Influence on Cloud Condensation Nuclei Activation. Atmos. Environ. 2020, 223, 117193. [Google Scholar] [CrossRef]
| Publisher’s Note: MDPI stays neutral with regard to jurisdictional claims in published maps and institutional affiliations. |
© 2022 by the authors. Licensee MDPI, Basel, Switzerland. This article is an open access article distributed under the terms and conditions of the Creative Commons Attribution (CC BY) license (https://creativecommons.org/licenses/by/4.0/).


