Article

Rapid Exploration Using pXRF Combined with Geological Connotation Method (GCM): A Case Study of the Nuocang Cu Polymetallic District, Tibet

1
School of Earth Sciences and Resources, China University of Geosciences (Beijing), Beijing 100083, China
2
Tibet Xinhu Mining Limited Company, Lhasa 850000, China
3
The Faculty of Earth Resources, China University of Geosciences (Wuhan), Wuhan 430074, China
4
Tibet Huayu Mining Limited Company, Lhasa 850000, China
*
Author to whom correspondence should be addressed.
Minerals 2022, 12(5), 514; https://doi.org/10.3390/min12050514
Submission received: 30 March 2022 / Revised: 18 April 2022 / Accepted: 19 April 2022 / Published: 21 April 2022
(This article belongs to the Section Mineral Exploration Methods and Applications)

Abstract

:
The Nuocang Cu polymetallic district is located in western Gangdese, close to the south of the Luobadui–Milashan fault zone. A large number of metal deposits with the potential to be prospected, such as Chagele, Zhalong, Longgen, and Sangmola, have been found near this district. To further isolate the target prospecting area, we used a portable X-ray fluorescence spectrometer (pXRF) to conduct an in situ 1:10,000 soil pedogeochemical survey. The results show that the use of a pXRF combined with the geological connotation method (GCM) can accurately delineate the anomalies related to mineralization and highlight “weak” and “small” anomalies. It was also shown to effectively shorten the working cycle and ensure the continuity and timeliness of field work. Through sizing tests, the analysis of −10~+60 mesh soil samples achieved the best anomaly delineation effect. By studying the supra-ore, near-ore, sub-ore halo, and Th/U, the degree of denudation and the oxidation-reduction environment of the deposit were judged to be moderate. Ultimately, depending on the target area delineated by the pXRF, six Cu-Pb-Zn orebodies were uncapped by five exploratory trenches, which proved the potentiality of the Cu-Pb-Zn polymetallic epithermal deposit controlled by minor faults in Central Nuocang.

1. Introduction

The Gangdese belt is one of the most richly endowed copper provinces in the Alpine–Himalayan orogen [1,2,3]. A series of large–giant cooper polymetallic deposits, such as Qulong, Jiama, and Xiongcun have been discovered in eastern Gangdese [4,5,6,7,8]. However, due to complex tectonic settings, difficult working conditions, and volcanic float rock cover, the genetic type and ore prospecting potential of the western Gangdese are uncertain and controversial [9]. According to the previous small-scale remote sensing and geochemical exploration, the Nuocang district in western Gangdese is located at the intersection of linear structure and shows good copper, lead, and zinc anomalies. The Nuocang district consists of three closely distributed deposits (i.e., South, North, and Central Nuocang). In the previous 1:50,000 mapping, we have found mineralization in Central Nuocang. However, the Central Nuocang deposit has an average elevation of 4700 m and the highest elevation of 6100 m, with a steep slope. Due to heavy snowfall and rising rivers in this area, field work can only be carried out in June and July, making a pXRF a good choice for a tool.
The pXRF was the first analytical tool capable of providing relevant information on-site to geochemists, and in so doing broke the time barrier between sampling, results, and decisions, first in environmental investigations and then in mineral exploration [10]. Since the 1980s in China, pXRFs have been gradually applied in field in situ primary halo and secondary halo prospecting, and some concealed Au deposits have been found [11,12]. Due to the continuous improvement of pXRFs, the detection ability of pXRFs has been continuously strengthened, and they have gradually become competent tools in the quantitative analysis of ore prospecting. Lemière, B et al. [13] conducted a pXRF test on the Vendean antimony deposit in France and proposed that a composite signature search is more effective in mineralization detection than single Sb maps. Han et al. [14] carried out an investigation using a pXRF and other multi-scale explorations of the Qulong porphyry copper deposit and suggested that pXRF test results should be studied in combination with the geological background. It can be seen that successful geochemical prospecting not only concerns the testing method, but also how to use them. So, we introduced the geological connotation method (GCM) to process pXRF data, trying to offset the adverse effect caused by the high detection limit and finally find orebodies.

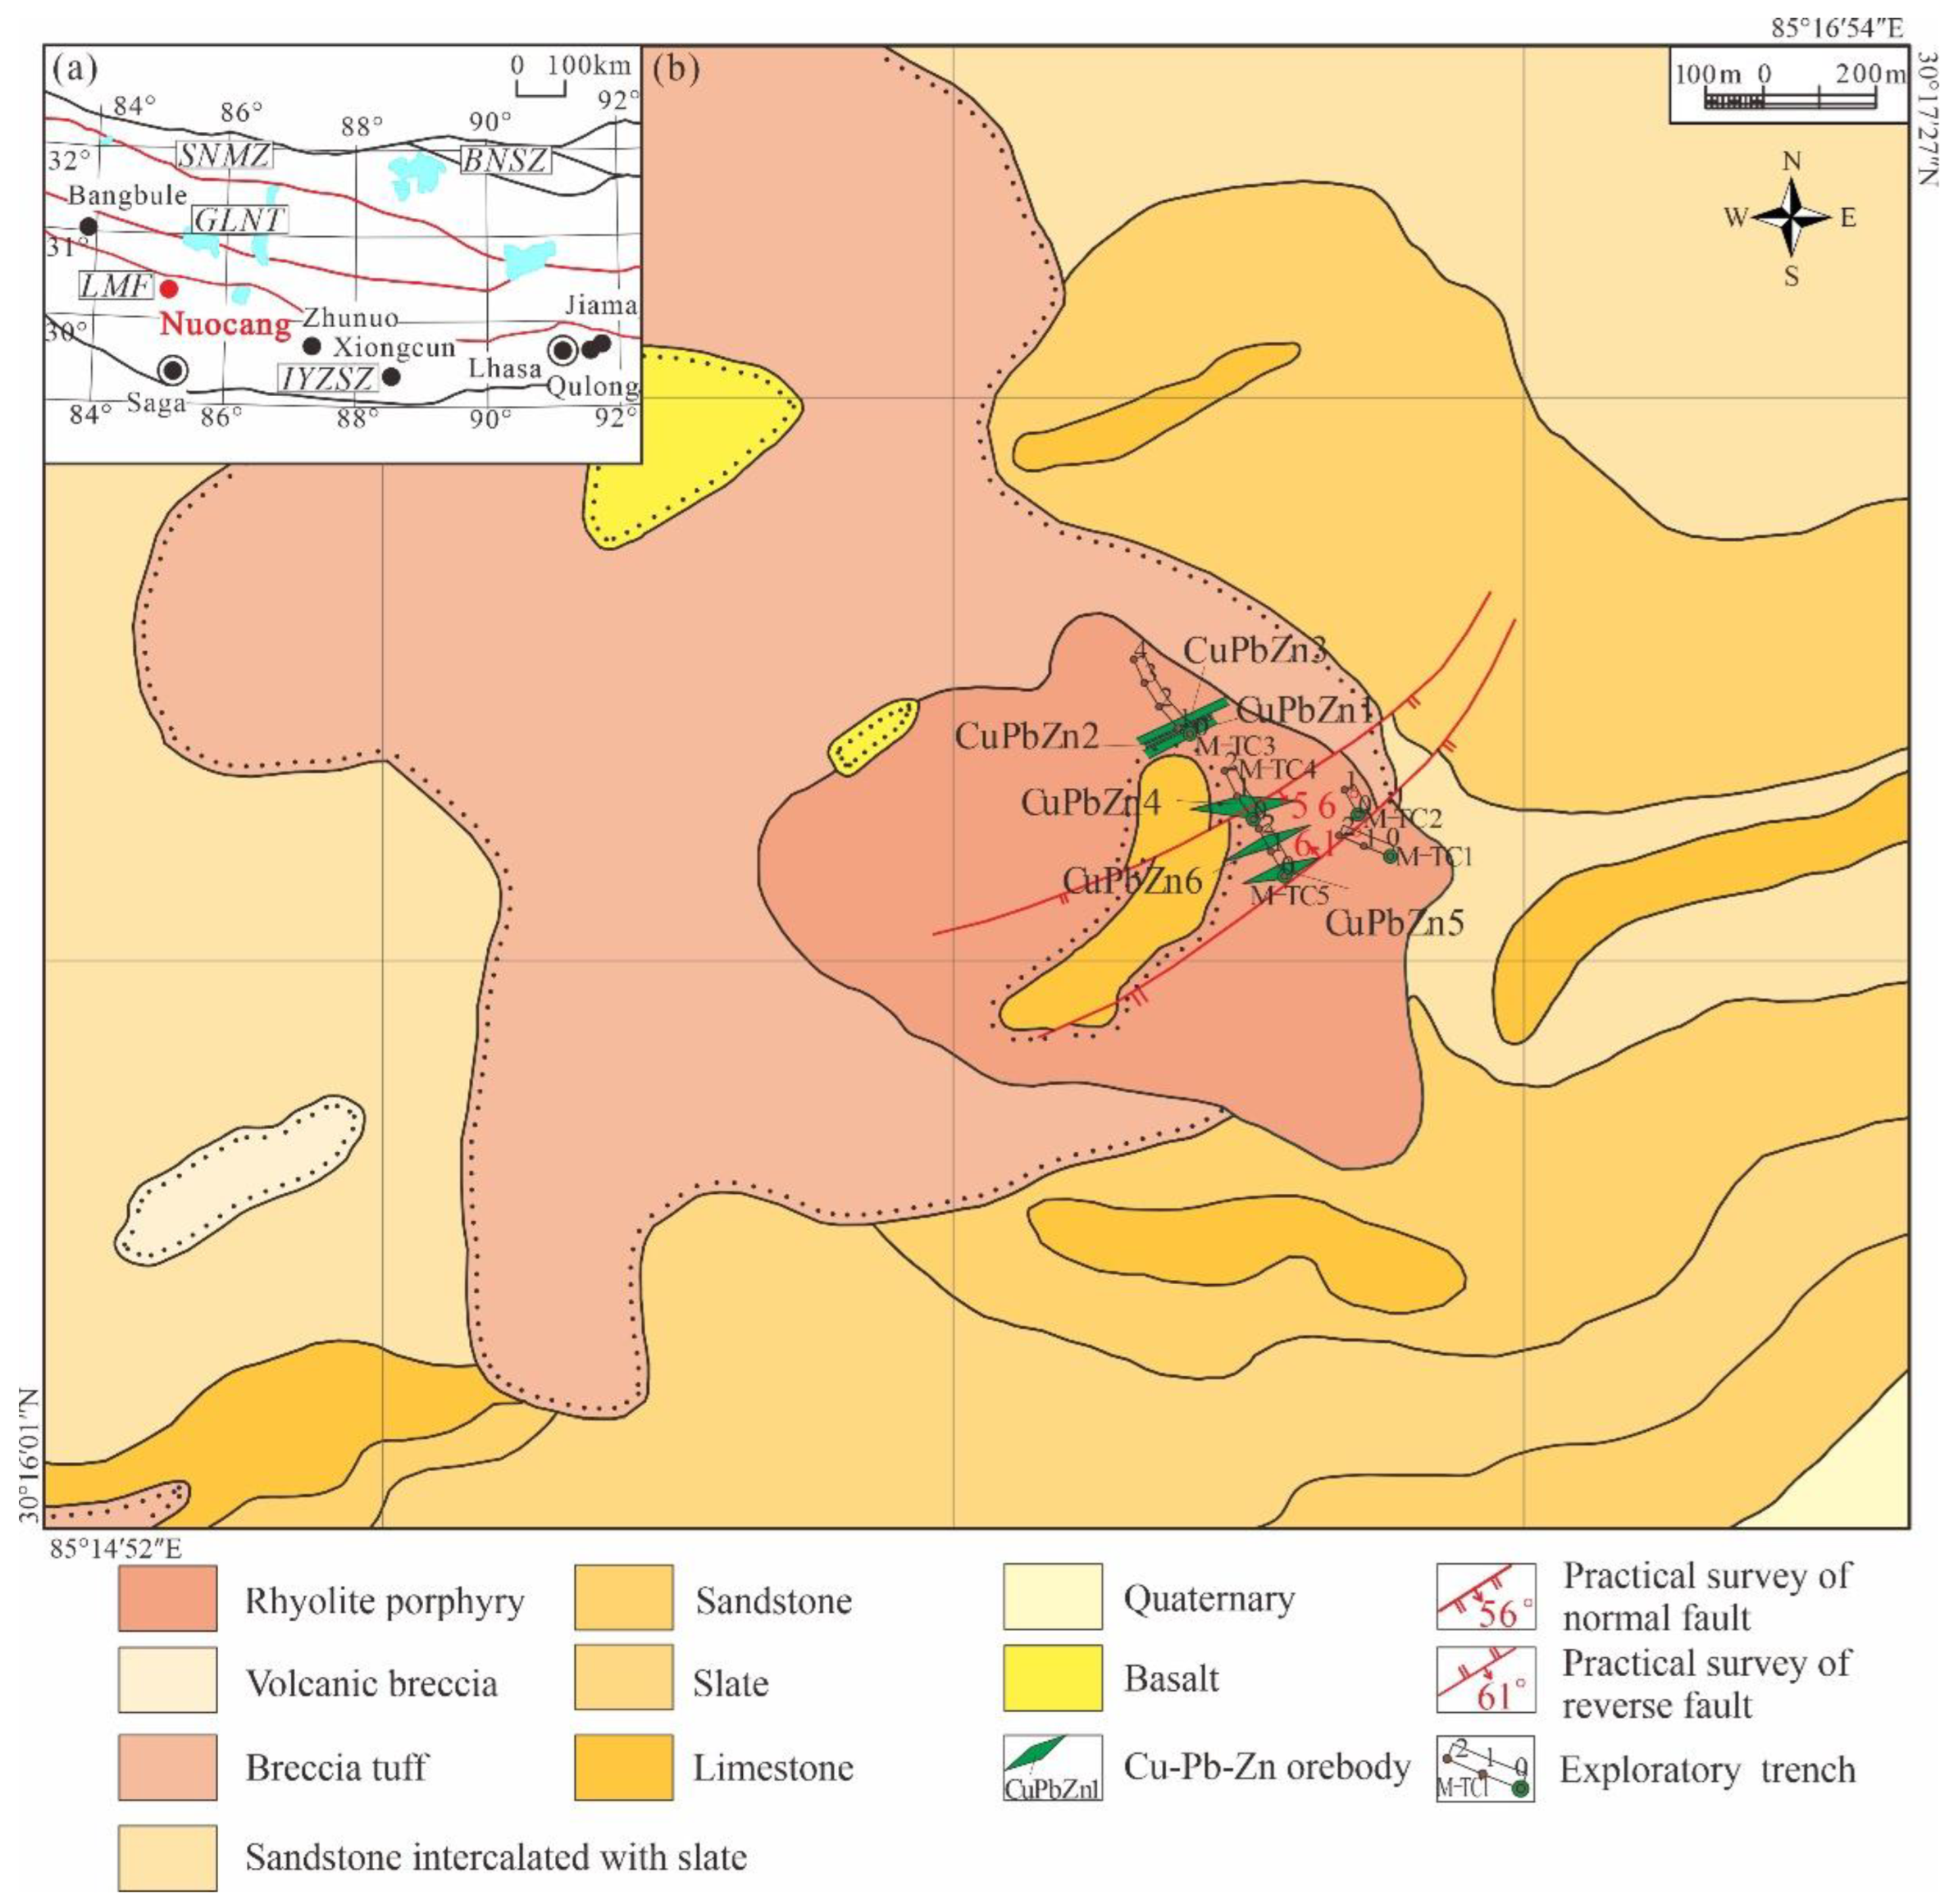
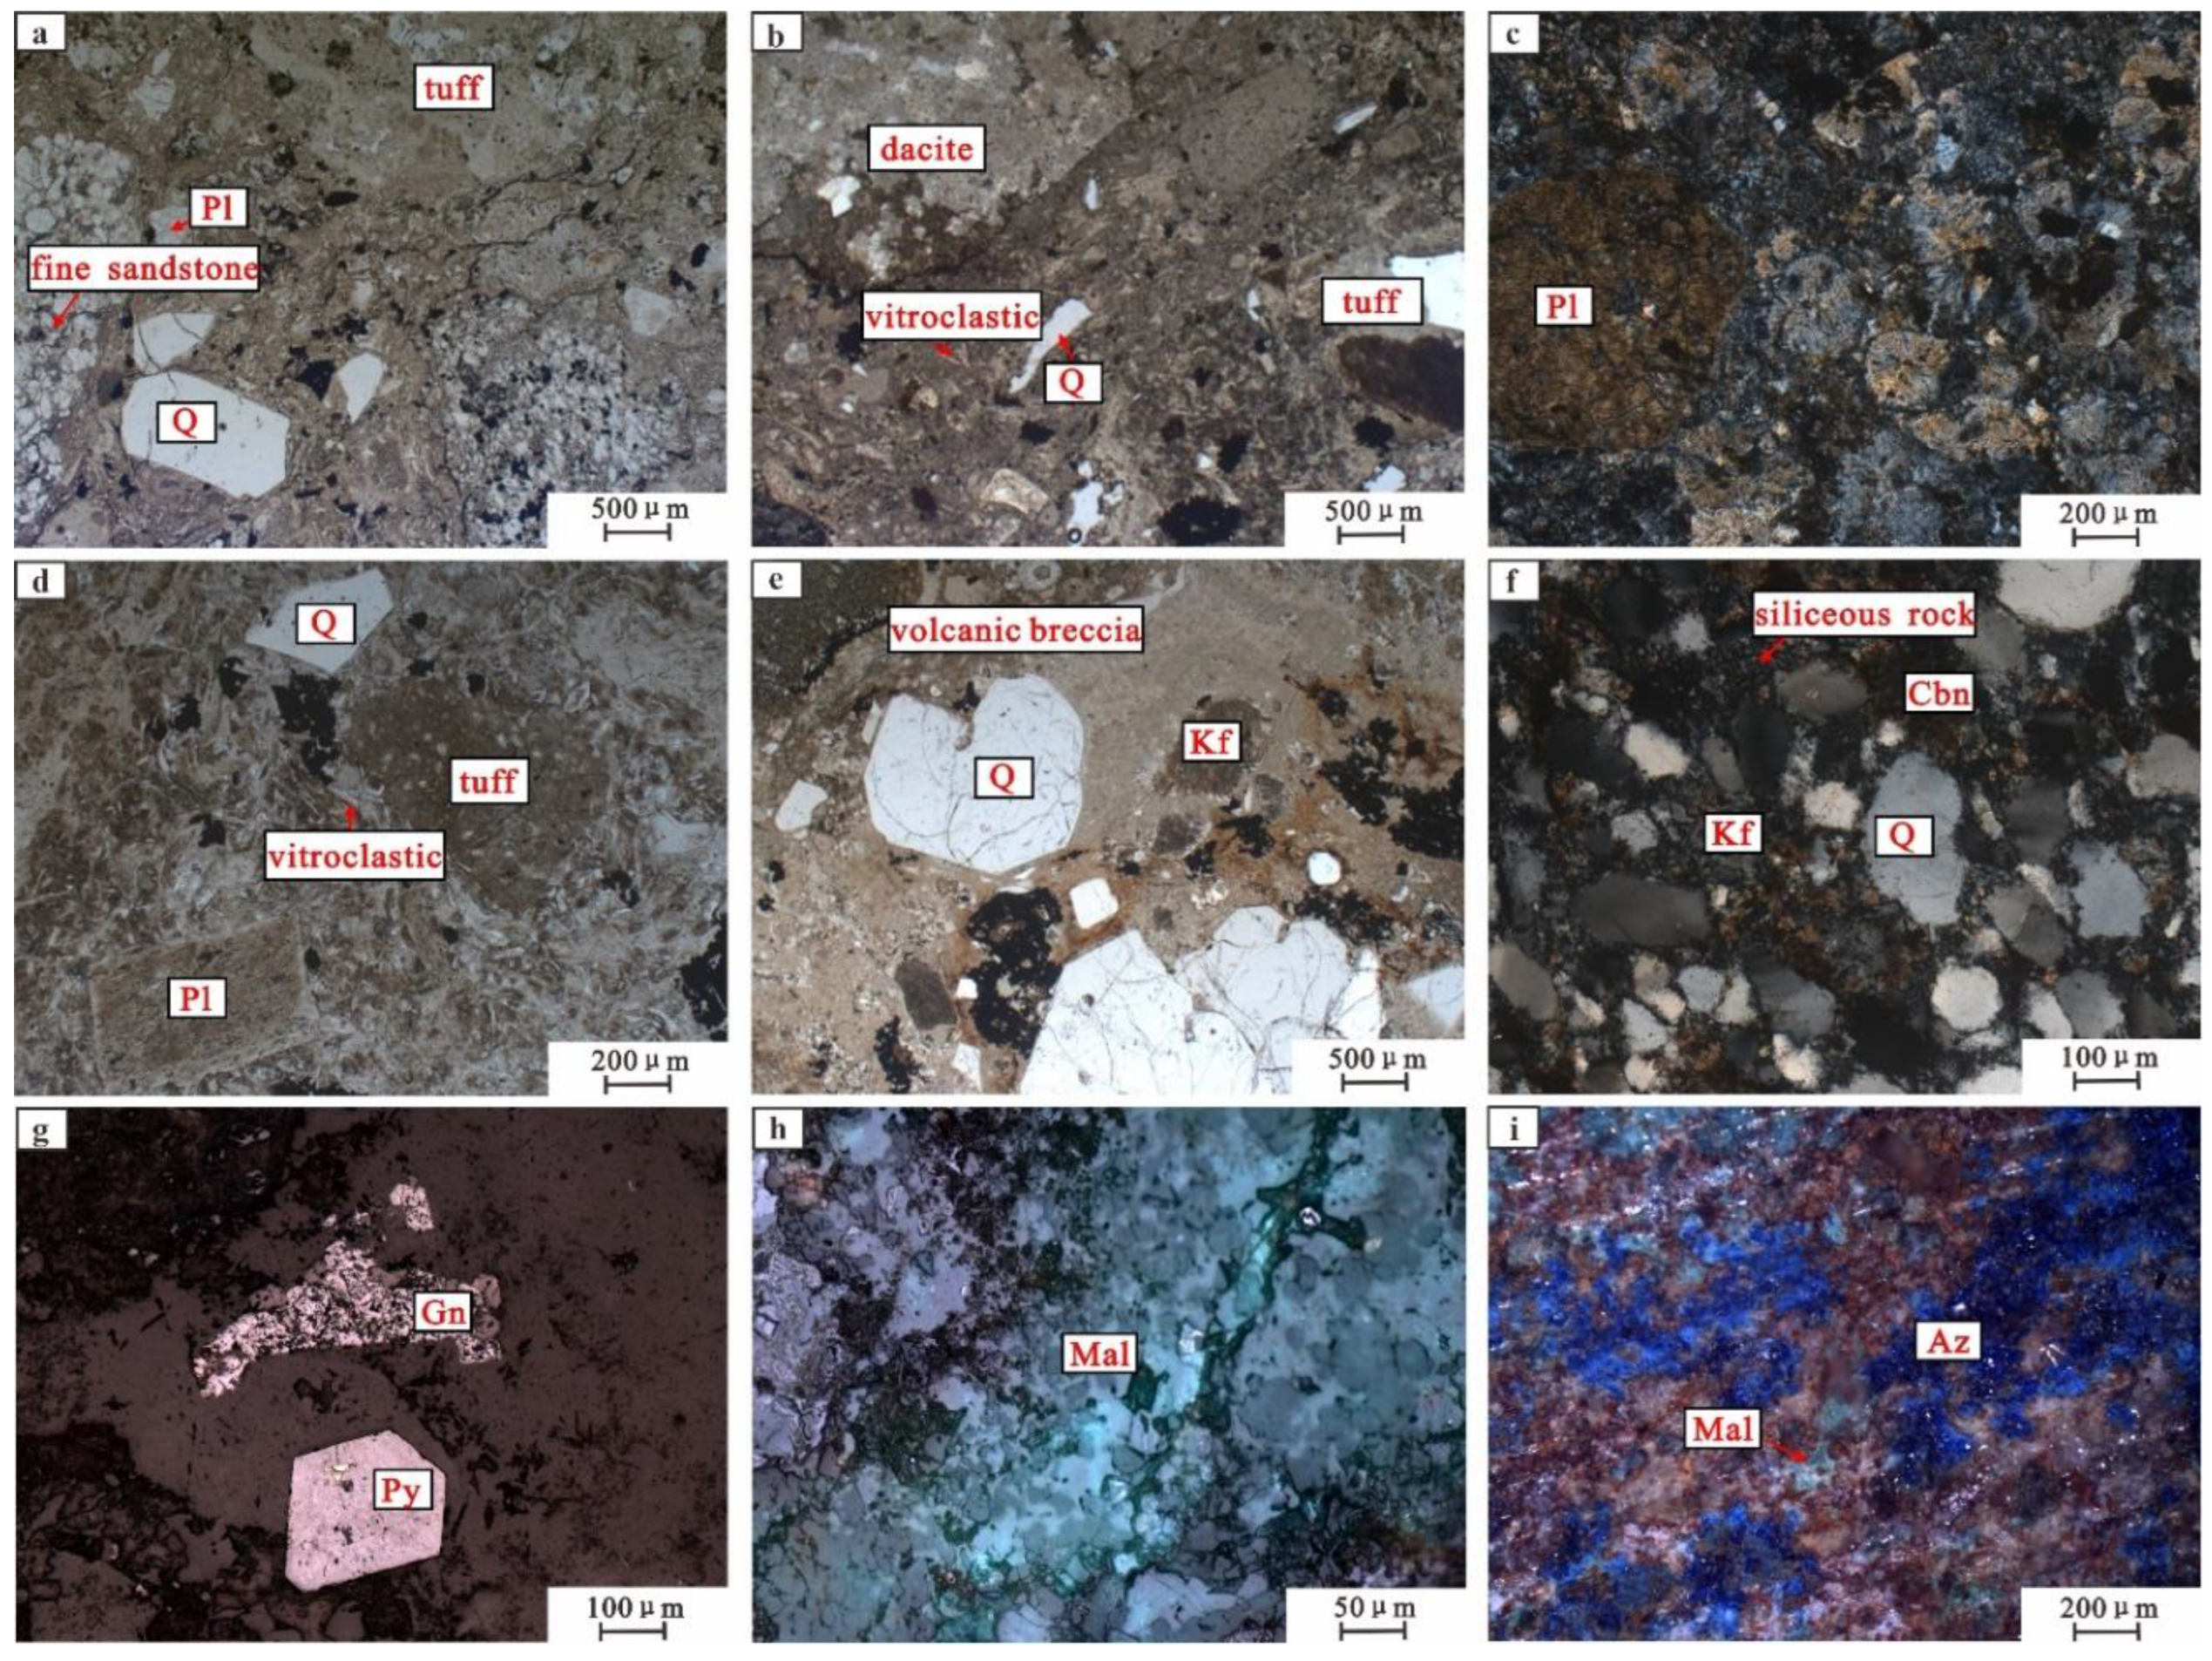
2. Deposit Geology and Structure

Central Nuocang is mainly distributed in the western Gangdese volcanic magmatic arc, adjacent to the Xigaze forearc basin to the south [9]. The southern part of Central Nuocang mainly covers the Lower Permian Angjie Formation and Quaternary; the northern part covers a large area of the Linzizong Group volcanic rocks, part of which are basalt from the Bugasi Formation. Dianzhong Formation rhyolite porphyry and breccia tuff drape the Angjie Formation, presenting an angular discordance (Figure 1). The Angjie Formation strikes NNE, consisting of interlayered slates and sandstones, and the thickness of the slate interlayer is about 0.5~5 m. They are easily cracked along the slab jointings, and stellate pyrite can be seen. The rhyolite porphyry has strong sericitization, limonitization, or carbonation and disseminated sulfide mineralization such as pyritization, chalcopyrite, and lead–zinc. We also found a lot of secondary minerals after oxidation, such as malachite and azurite (Figure 2).
In Central Nuocang, there are two NE-SE thrust reverse faults, about 1 km long, which developed near the contact zone between the Dianzhong Formation and the Angjie Formation (Figure 1). Cu-Pb-Zn mineralization controlled by faults can be seen nearby. It is speculated that the faults and fracture zones have changed the migration conditions of the ore-bearing hydrothermal fluid, which is conducive to the enrichment of elements. In view of the prospecting potential of the epithermal deposit controlled by faults in Central Nuocang, we decided to focus on this area.

3. pXRF

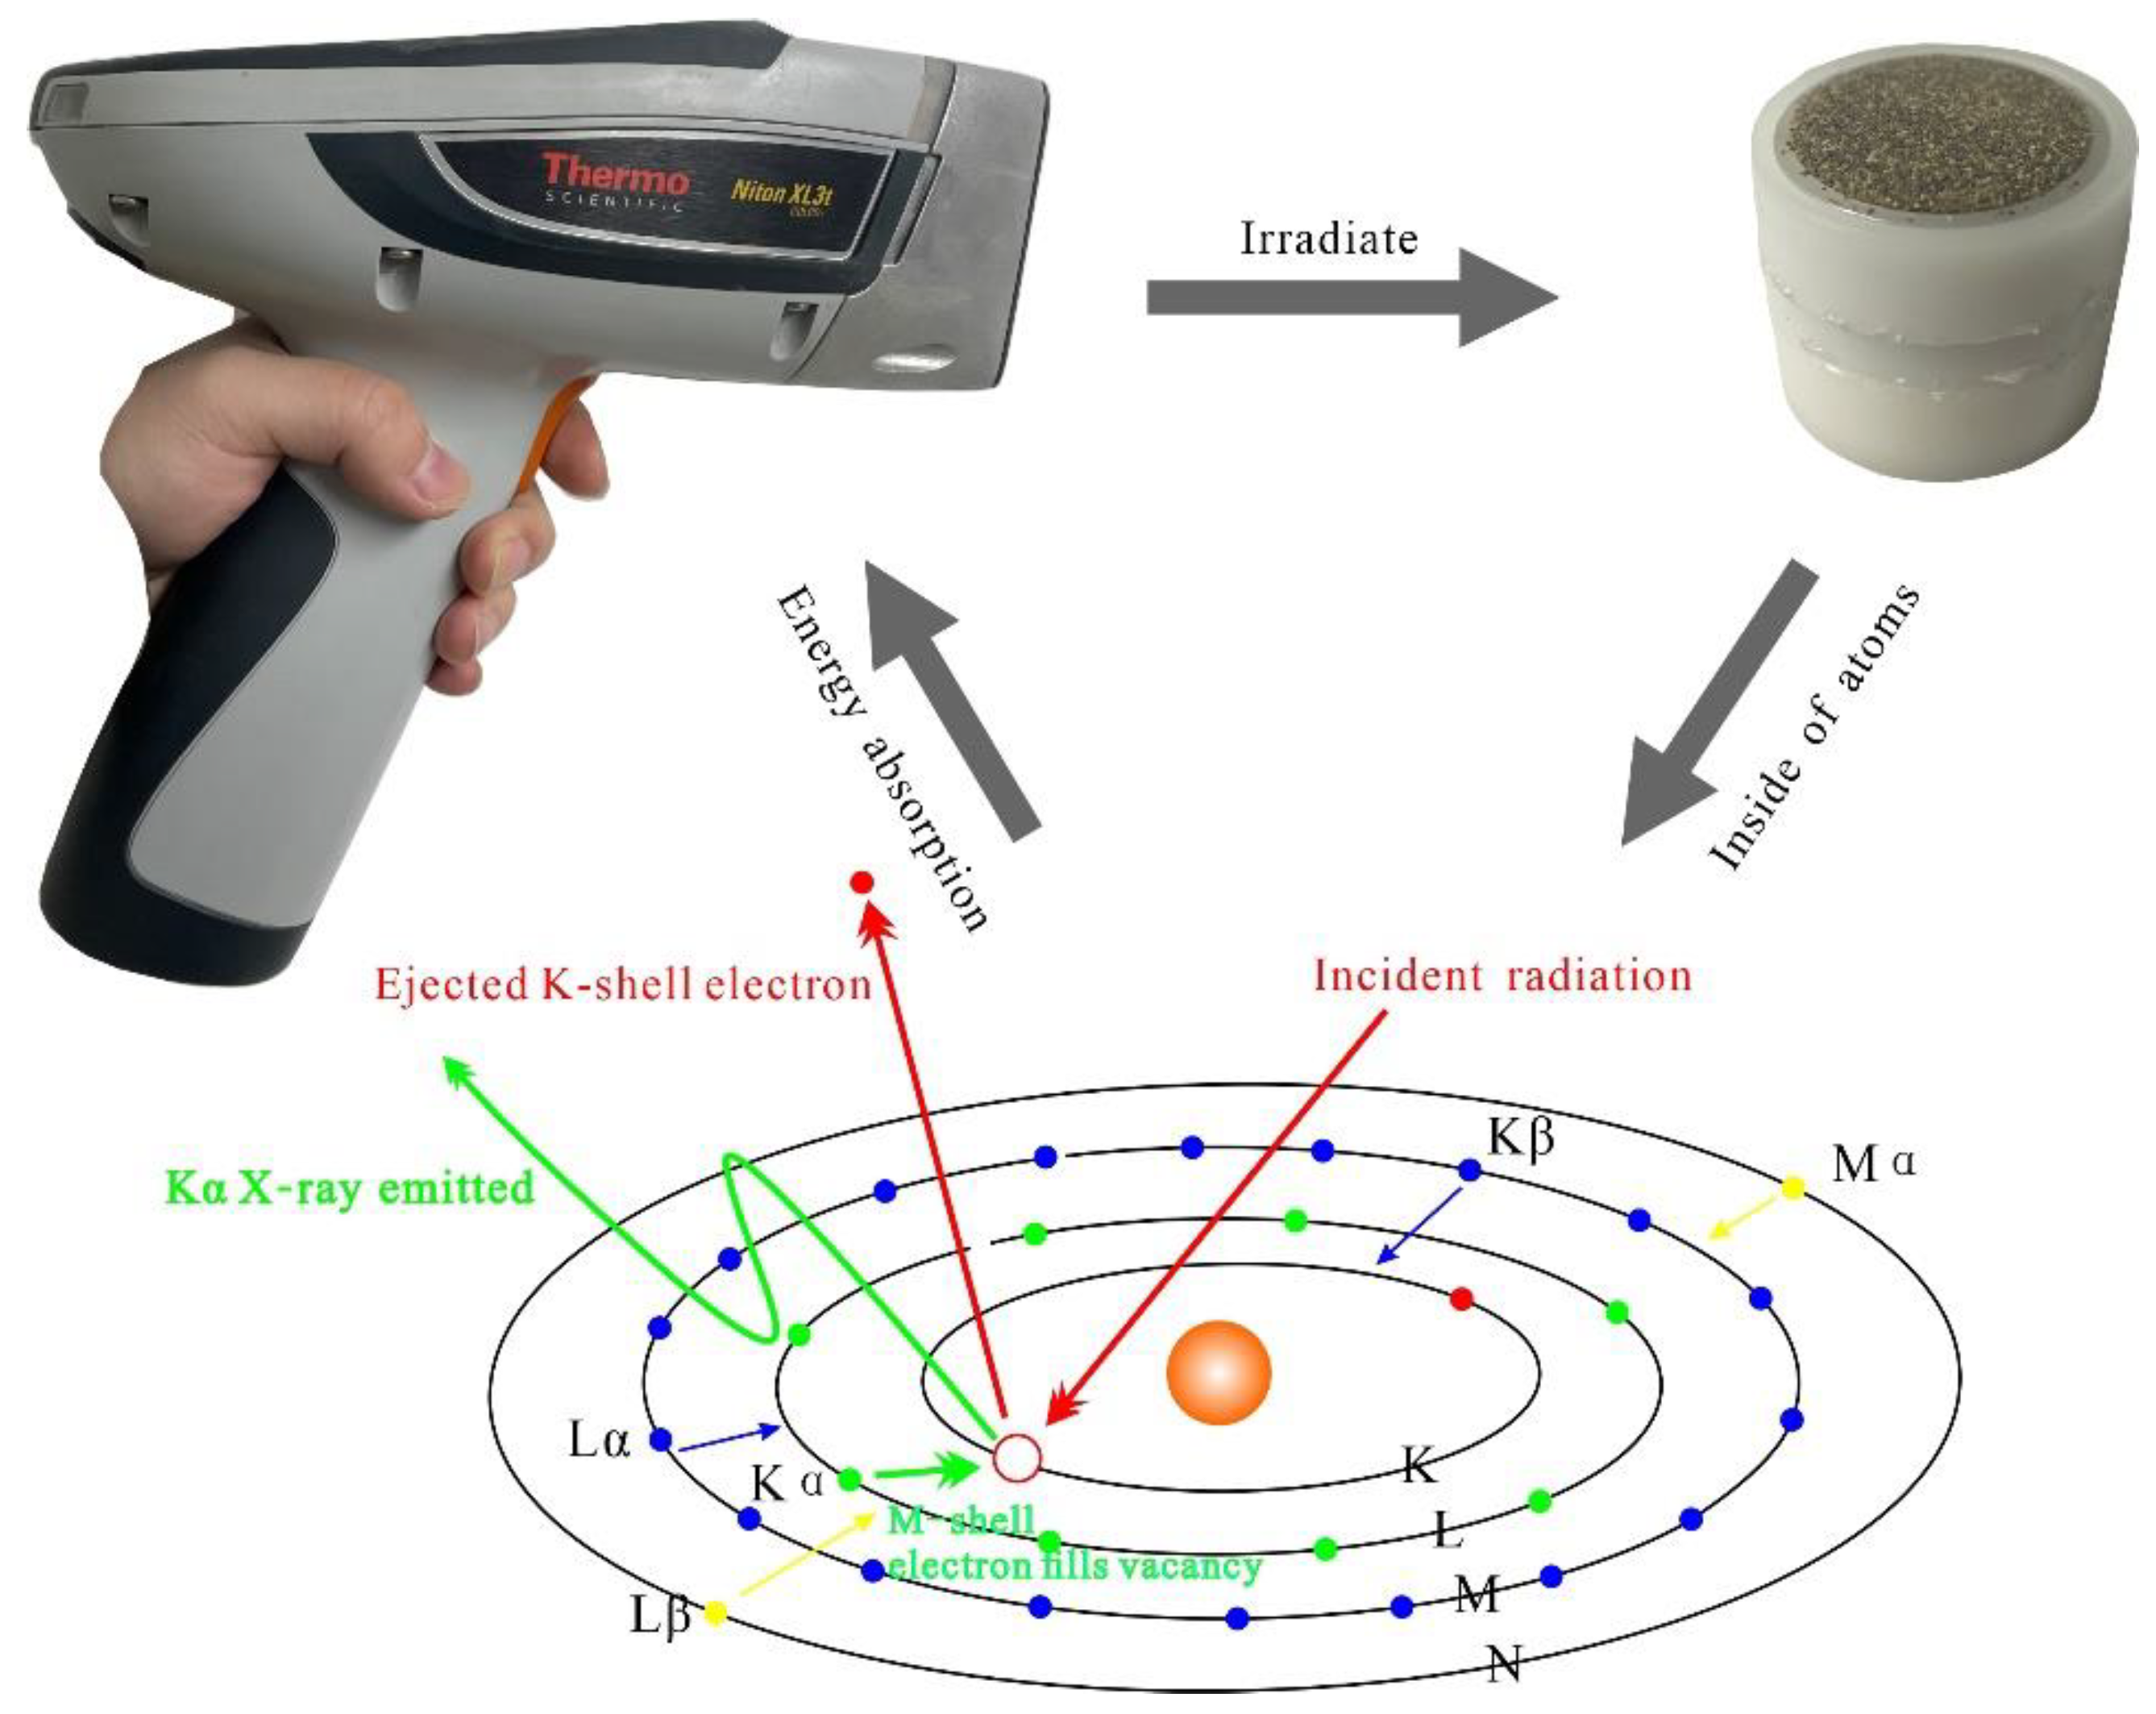
3.1. Instrument Principle

When a sample is exposed to short-wavelength (high-energy) X-rays, the inner electrons gain energy and break away from the nucleus to become free electrons. Then, the vacancies will be supplemented by electrons in the outer orbitals. Since the energy carried by the electrons is higher than the inner electrons, when they jump to the vacancy, their excess energy will be released in the form of X-rays. This secondary X-ray is called X-ray fluorescence (Figure 3). Each element exhibits characteristic XRF, and the intensity of each characteristic radiation is proportional to the amount of each element, making a pXRF useful for the identification and quantification of specific elements in a sample [15].
The NitonTM XL3t GOLDD+ portable X-ray fluorescence spectrometer is a dispersive fluorescence analyzer (ED-XRF). It uses a 6~50 kV Ag anode tube and a large silicon drift detector. It is suitable for −20~50 °C environments, equipped with an 8 h rechargeable battery and a lab stand, and can test 33 elements from S to U (soil mode). In addition, the pXRF does not destroy samples and can analyze outcrops, drill cores, soil, or slice samples without causing crushing, grinding, melting, or dissolution [16].

3.2. QA/QC

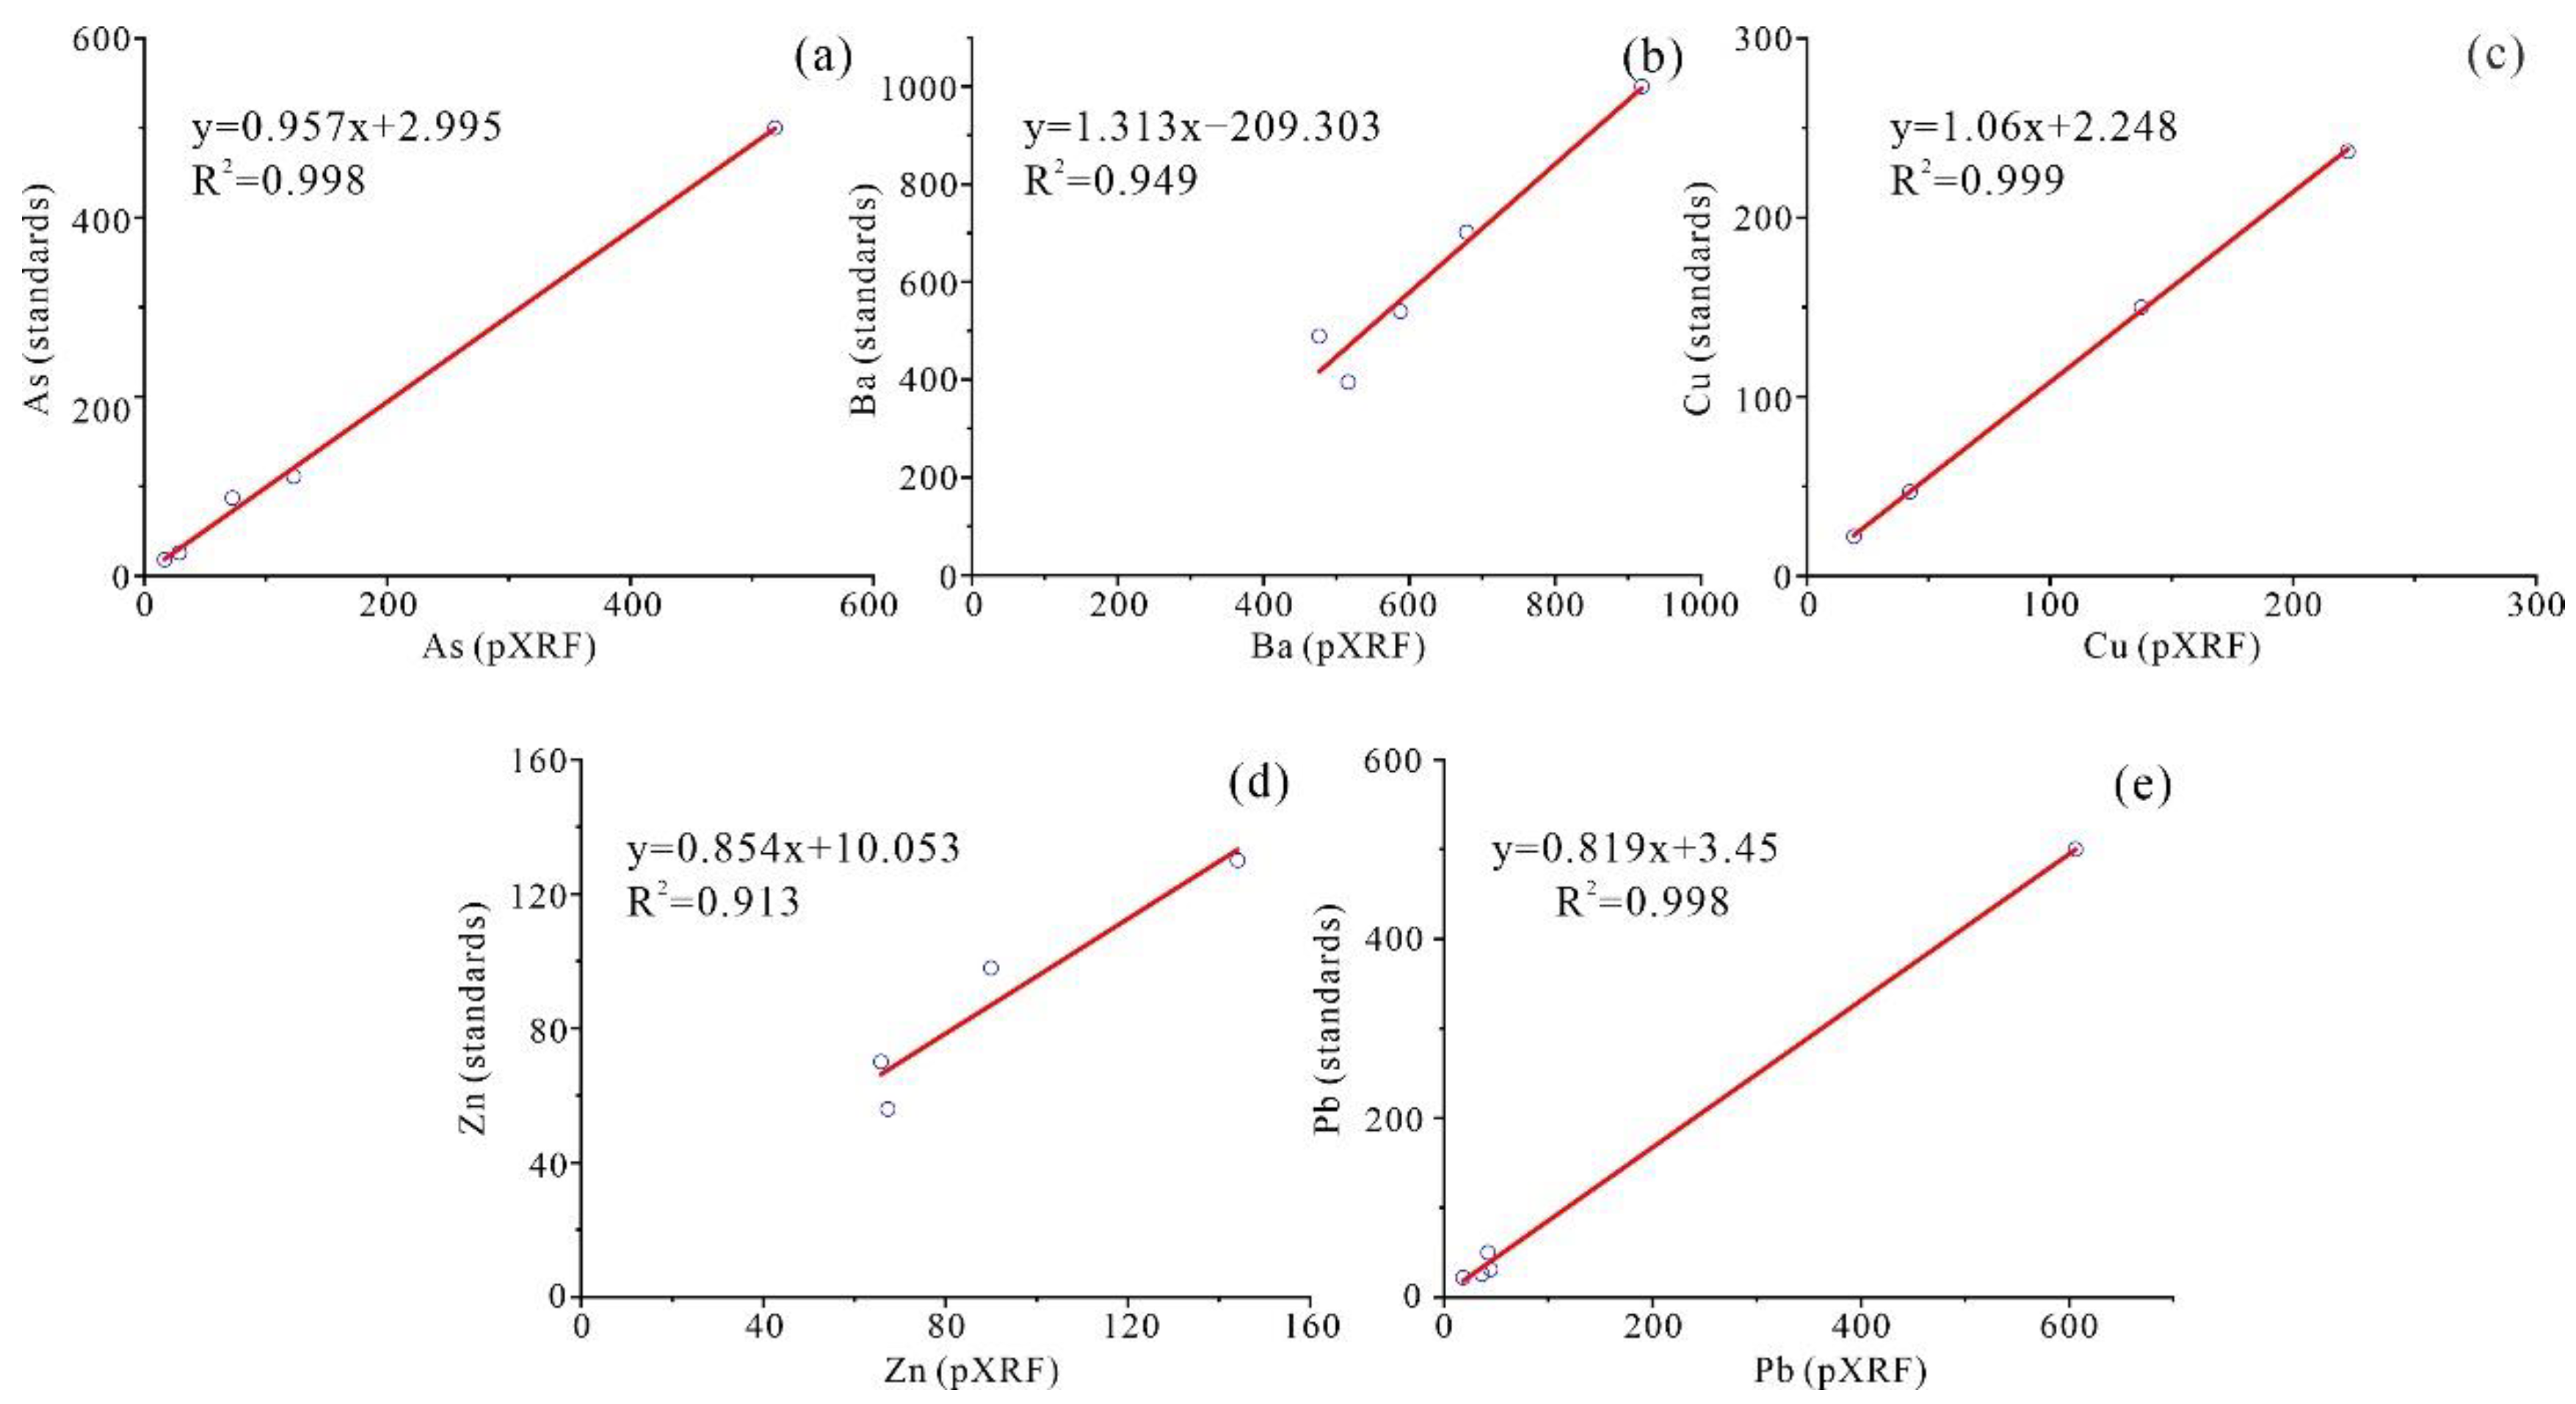
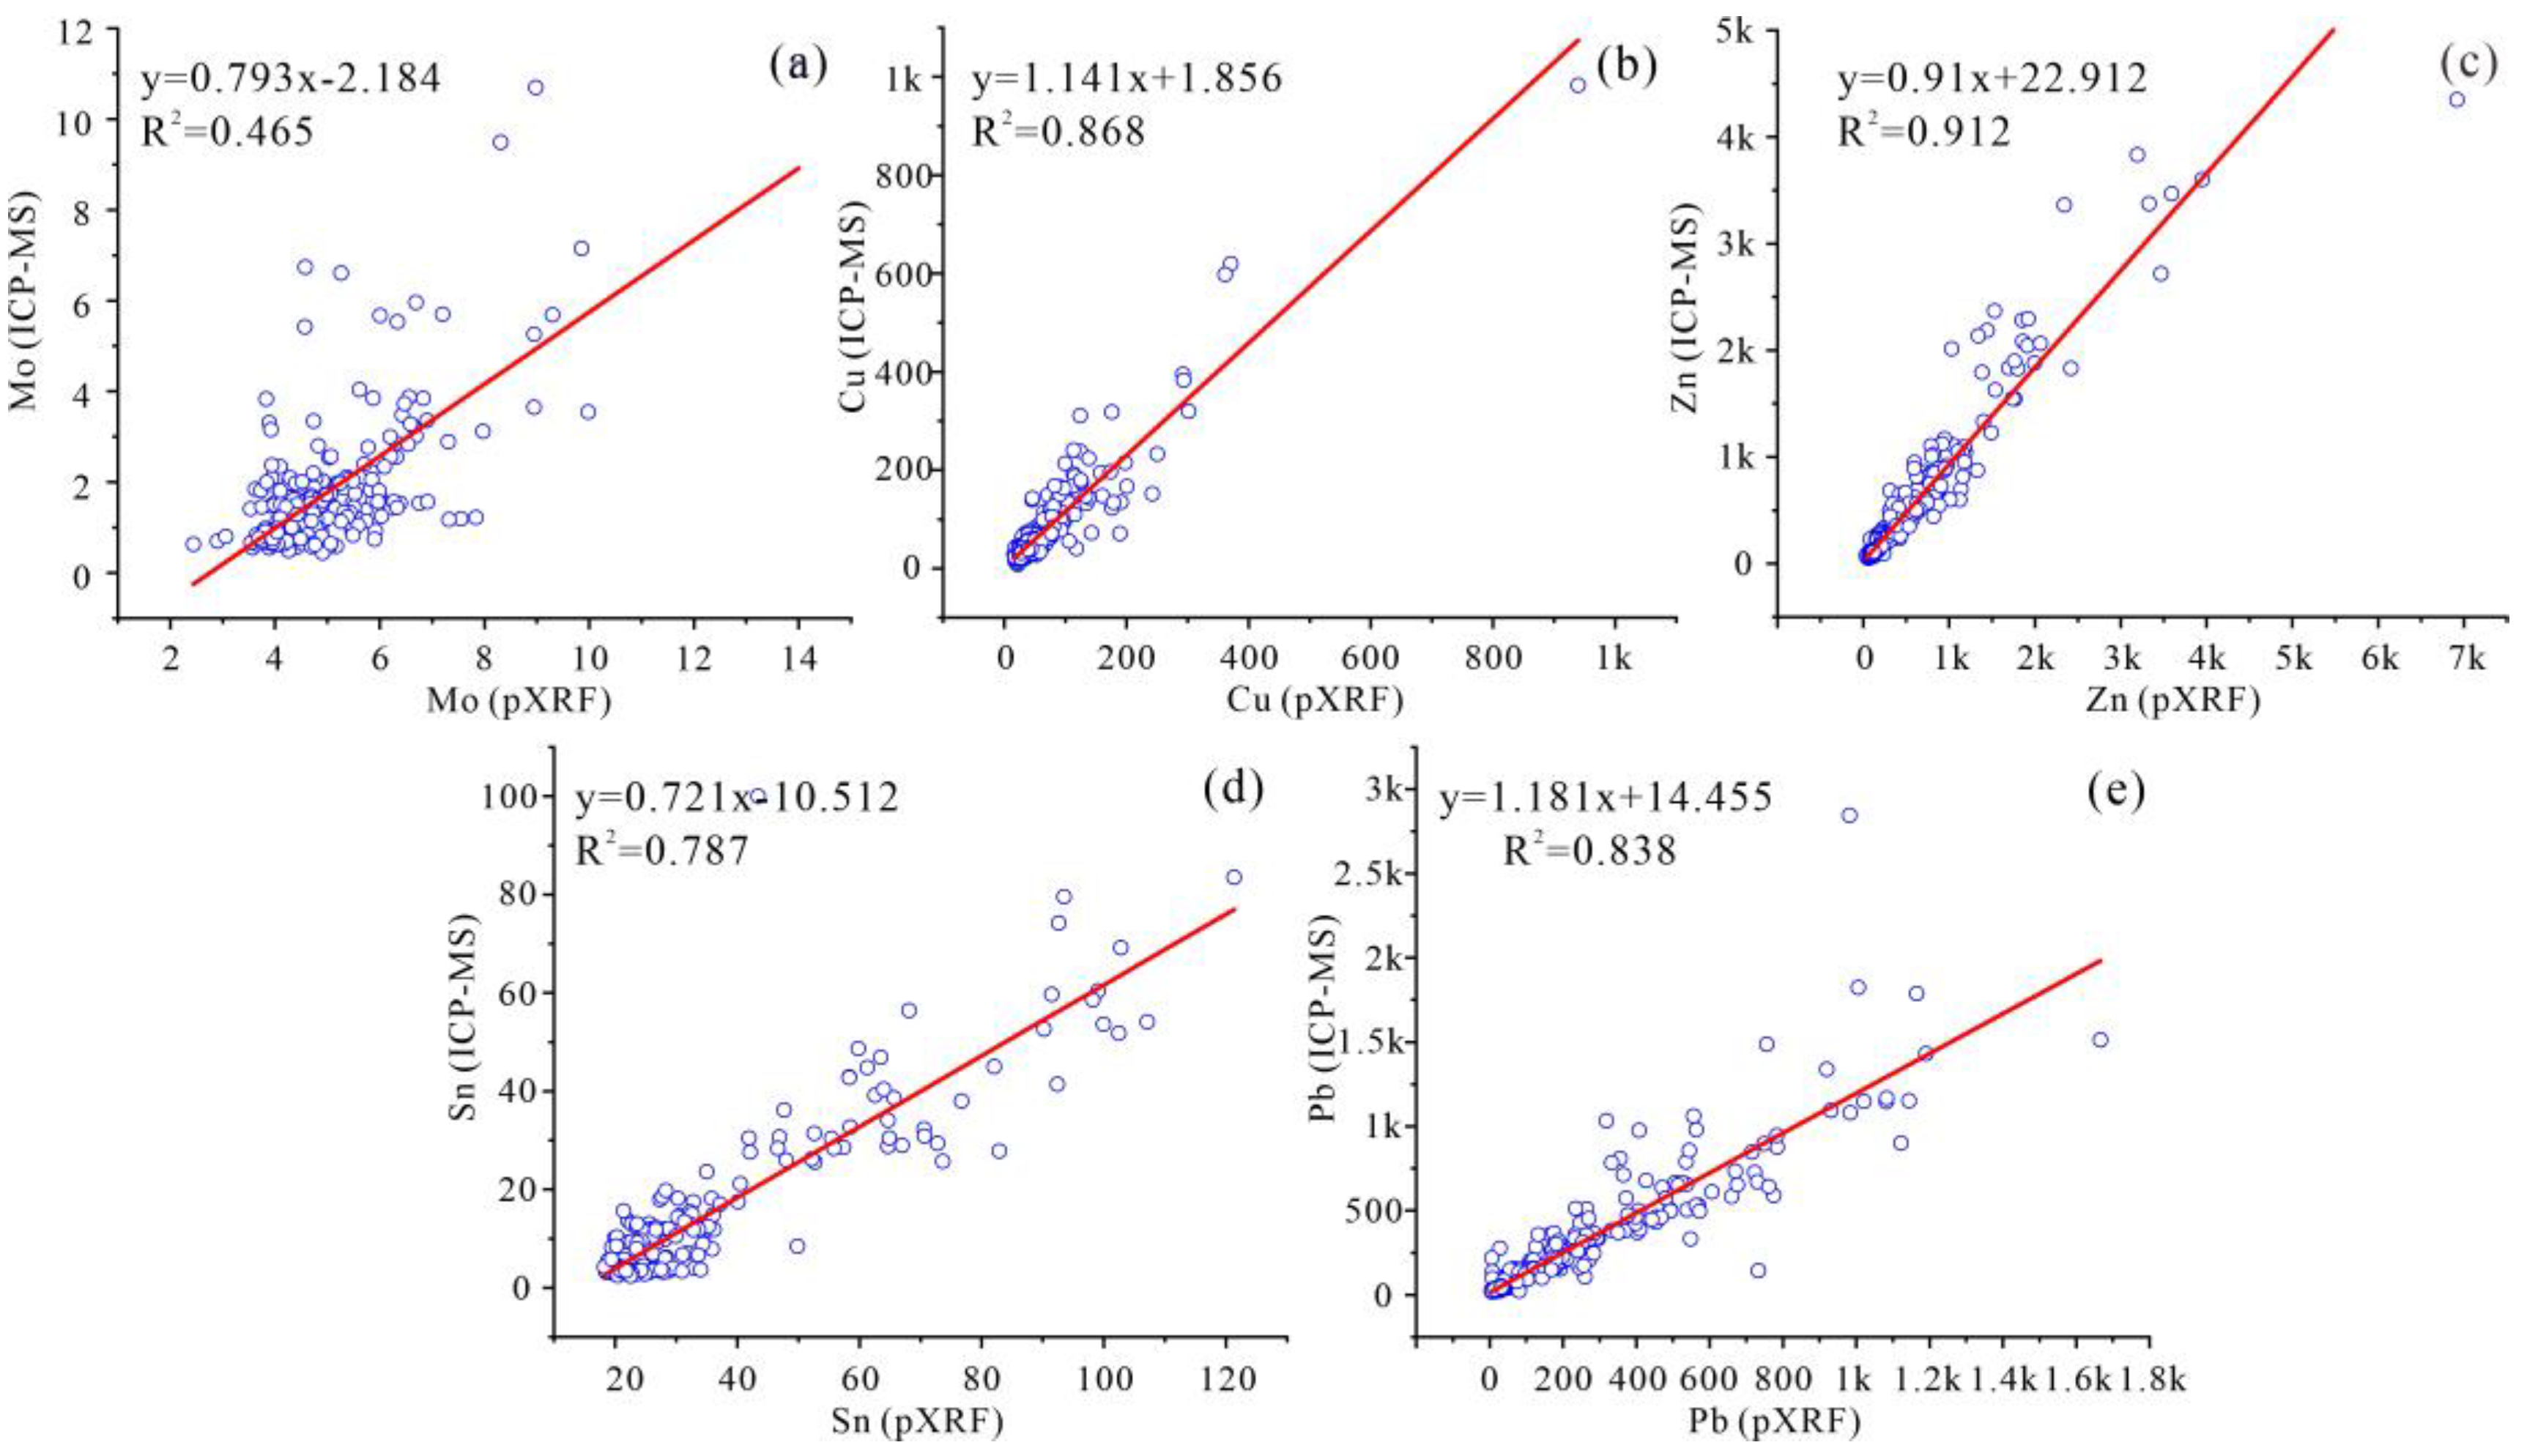
3.2.1. Accuracy and Precision

The pXRF test window and the bottom of the sample cups (including cups, rings, and caps) are covered with thin polypropylene films (thickness of 4 μm) and the test distance is about 2 mm on the lab stand. To minimize the influence of the matrix elements on a particular, we use the CCRMP (Canadian certified reference materials project) soil standard samples TILL-1, TILL-2, TILL-3, TILL-4, and RCRA (resource conservation and recovery act) standard samples to calibrate the pXRF [17]. Each TILL and RCRA sample are tested for 120 s and take an average of three consecutive tests. After making calibration curves between the pXRF results and standards (Figure 4), we input the correction factors (slope and intercept) of each element into the pXRF settings and ensure the system self-check is performed before each startup. However, due to the matrix interferences on the elements, the interferences from the REE on transition elements cannot be completely corrected [17]. In that situation, it is necessary to increase the sampling density and perform sample preparation. After, the TILL-4 sample was put into the lab stand, and the test time was set as 90 s for 12 continuous tests. This was performed to calculate the average logarithm deviation ( Δ l g C ¯ ) and relative standard deviation (RSD) of each element, and the combined results are listed in Table 1. It can be seen that the pXRF results were in good agreement with the standard material results. The Δ l g C ¯ of Zr, Sr, Rb, Pb, As, Zn, W, Cu, Mn, Ti, and other detectable elements were all less than 0.11, indicating the good accuracy of the instrument. All of the RSD values, except that for W, were less than 10%; the difference in the W value is presumed to have been caused by the failure of the pXRF to drop to the specified temperature.

3.2.2. Stability

In situ testing tests the stability of a pXRF. We inserted one TILL-4 standard material and one duplicate sample as monitored samples. A total of 732 original soil samples and 22 duplicated soil samples were tested in Central Nuocang (see Supplementary Materials). By calculating the relative deviation (RD) between the original data and the duplicated data (Table 2), it was found that the qualified rate of each element was greater than 90%, which means the pXRF was reliable.
After the laboratory ICP-MS results were released, they were combined with the pXRF results (>LOD) and analyzed using unary linear regression (Figure 5). The results show that the coefficients of determination of Cu, Zn, Sn, and Pb were all close to or greater than eight, which means the results were significantly correlated with ICP-MS. Most Mo data were near the limit of detection, which led to poor stability. In a case such as this, the pXRF test time should be increased to reduce the number of errors.

4. Discussion

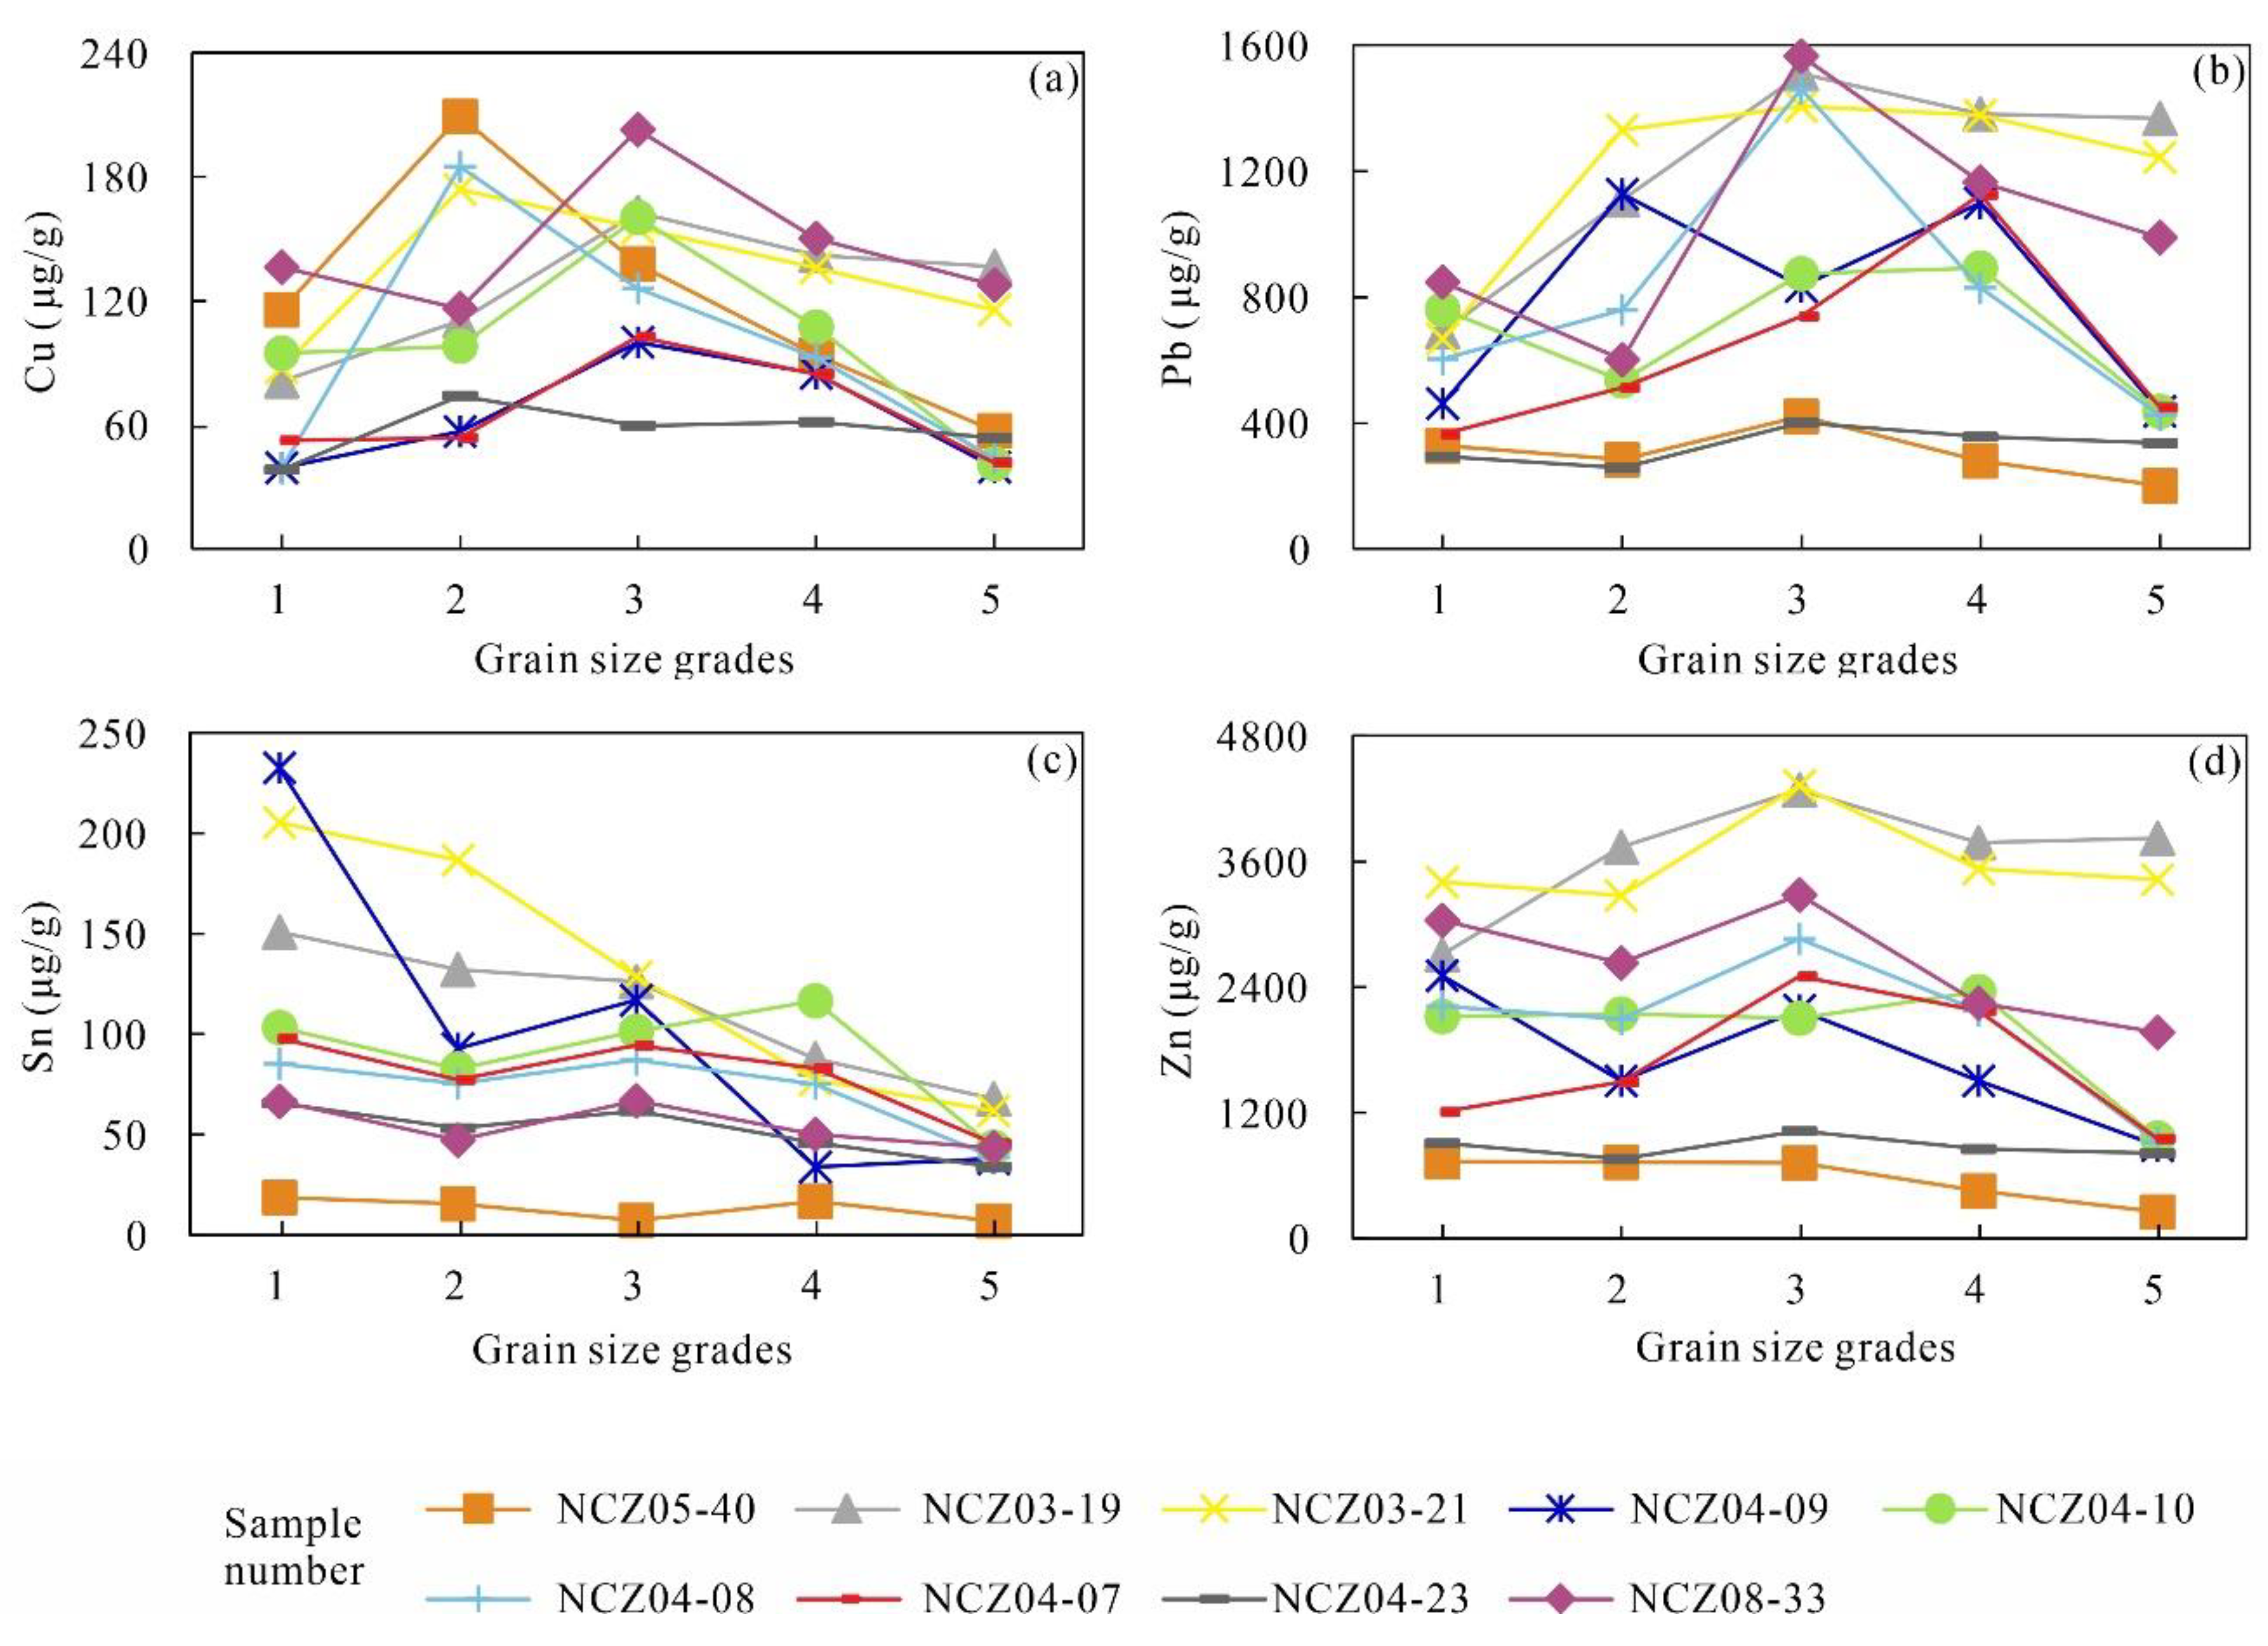
4.1. Enrichment Granularity

The enrichment granularity of elements in the same soil layer is different. The oxides of Cu, Sn, W belong to resistant minerals, and they often exist in the form of primary mineral debris, mostly enriched in coarser granularities. However, sulfides of Cu, Zn, Pb, Ni, and Co exist in the form of adions and generally enriched in fine granularities [18]. We randomly screened nine pre-collected samples into five grain size grades: −10~+20 mesh (0.9~2 mm), −20~+40 mesh (0.45~0.9 mm), −40~+60 mesh (0.3~0.45 mm), −60~+80 mesh (0.18~0.3 mm), and less than 80 mesh (<0.18 mm). They were placed into a sample cup and compacted, and then into a lab stand. The pXRF test time was set to 90 s, and the average of each sample in three consecutive tests was recorded.
As shown in the line chart (Figure 6), in most of the samples, Cu and Pb increased with the grade at first and reached the highest value in the third grain size grade and then decreased sharply in the fourth and fifth grade. Zn displayed little difference between each grade but also showed signs of being highest in the third grade. This may be due to the high solubility of ZnS, meaning it flows to a lower grade after being eroded by rain and snow. Then, thin and dense Zn2(OH)2CO3 oxidation films were formed on its surface, which made its value tend to be stable. Sn reached its highest value in the first grade, then decreased gradually and reached its lowest value in the fifth grade. Sn exists in resistant minerals, mostly through mechanical migration. SnS2 and SnO2 are also insoluble in water, so Sn is enriched in coarser grains.
In conclusion, −10~+60 mesh was found to be the best sampling grain size for geochemical exploration in Central Nuocang. This mesh can not only meet the requirement of sampling weight but also reduce the interference caused by weathering to ore-forming elements.

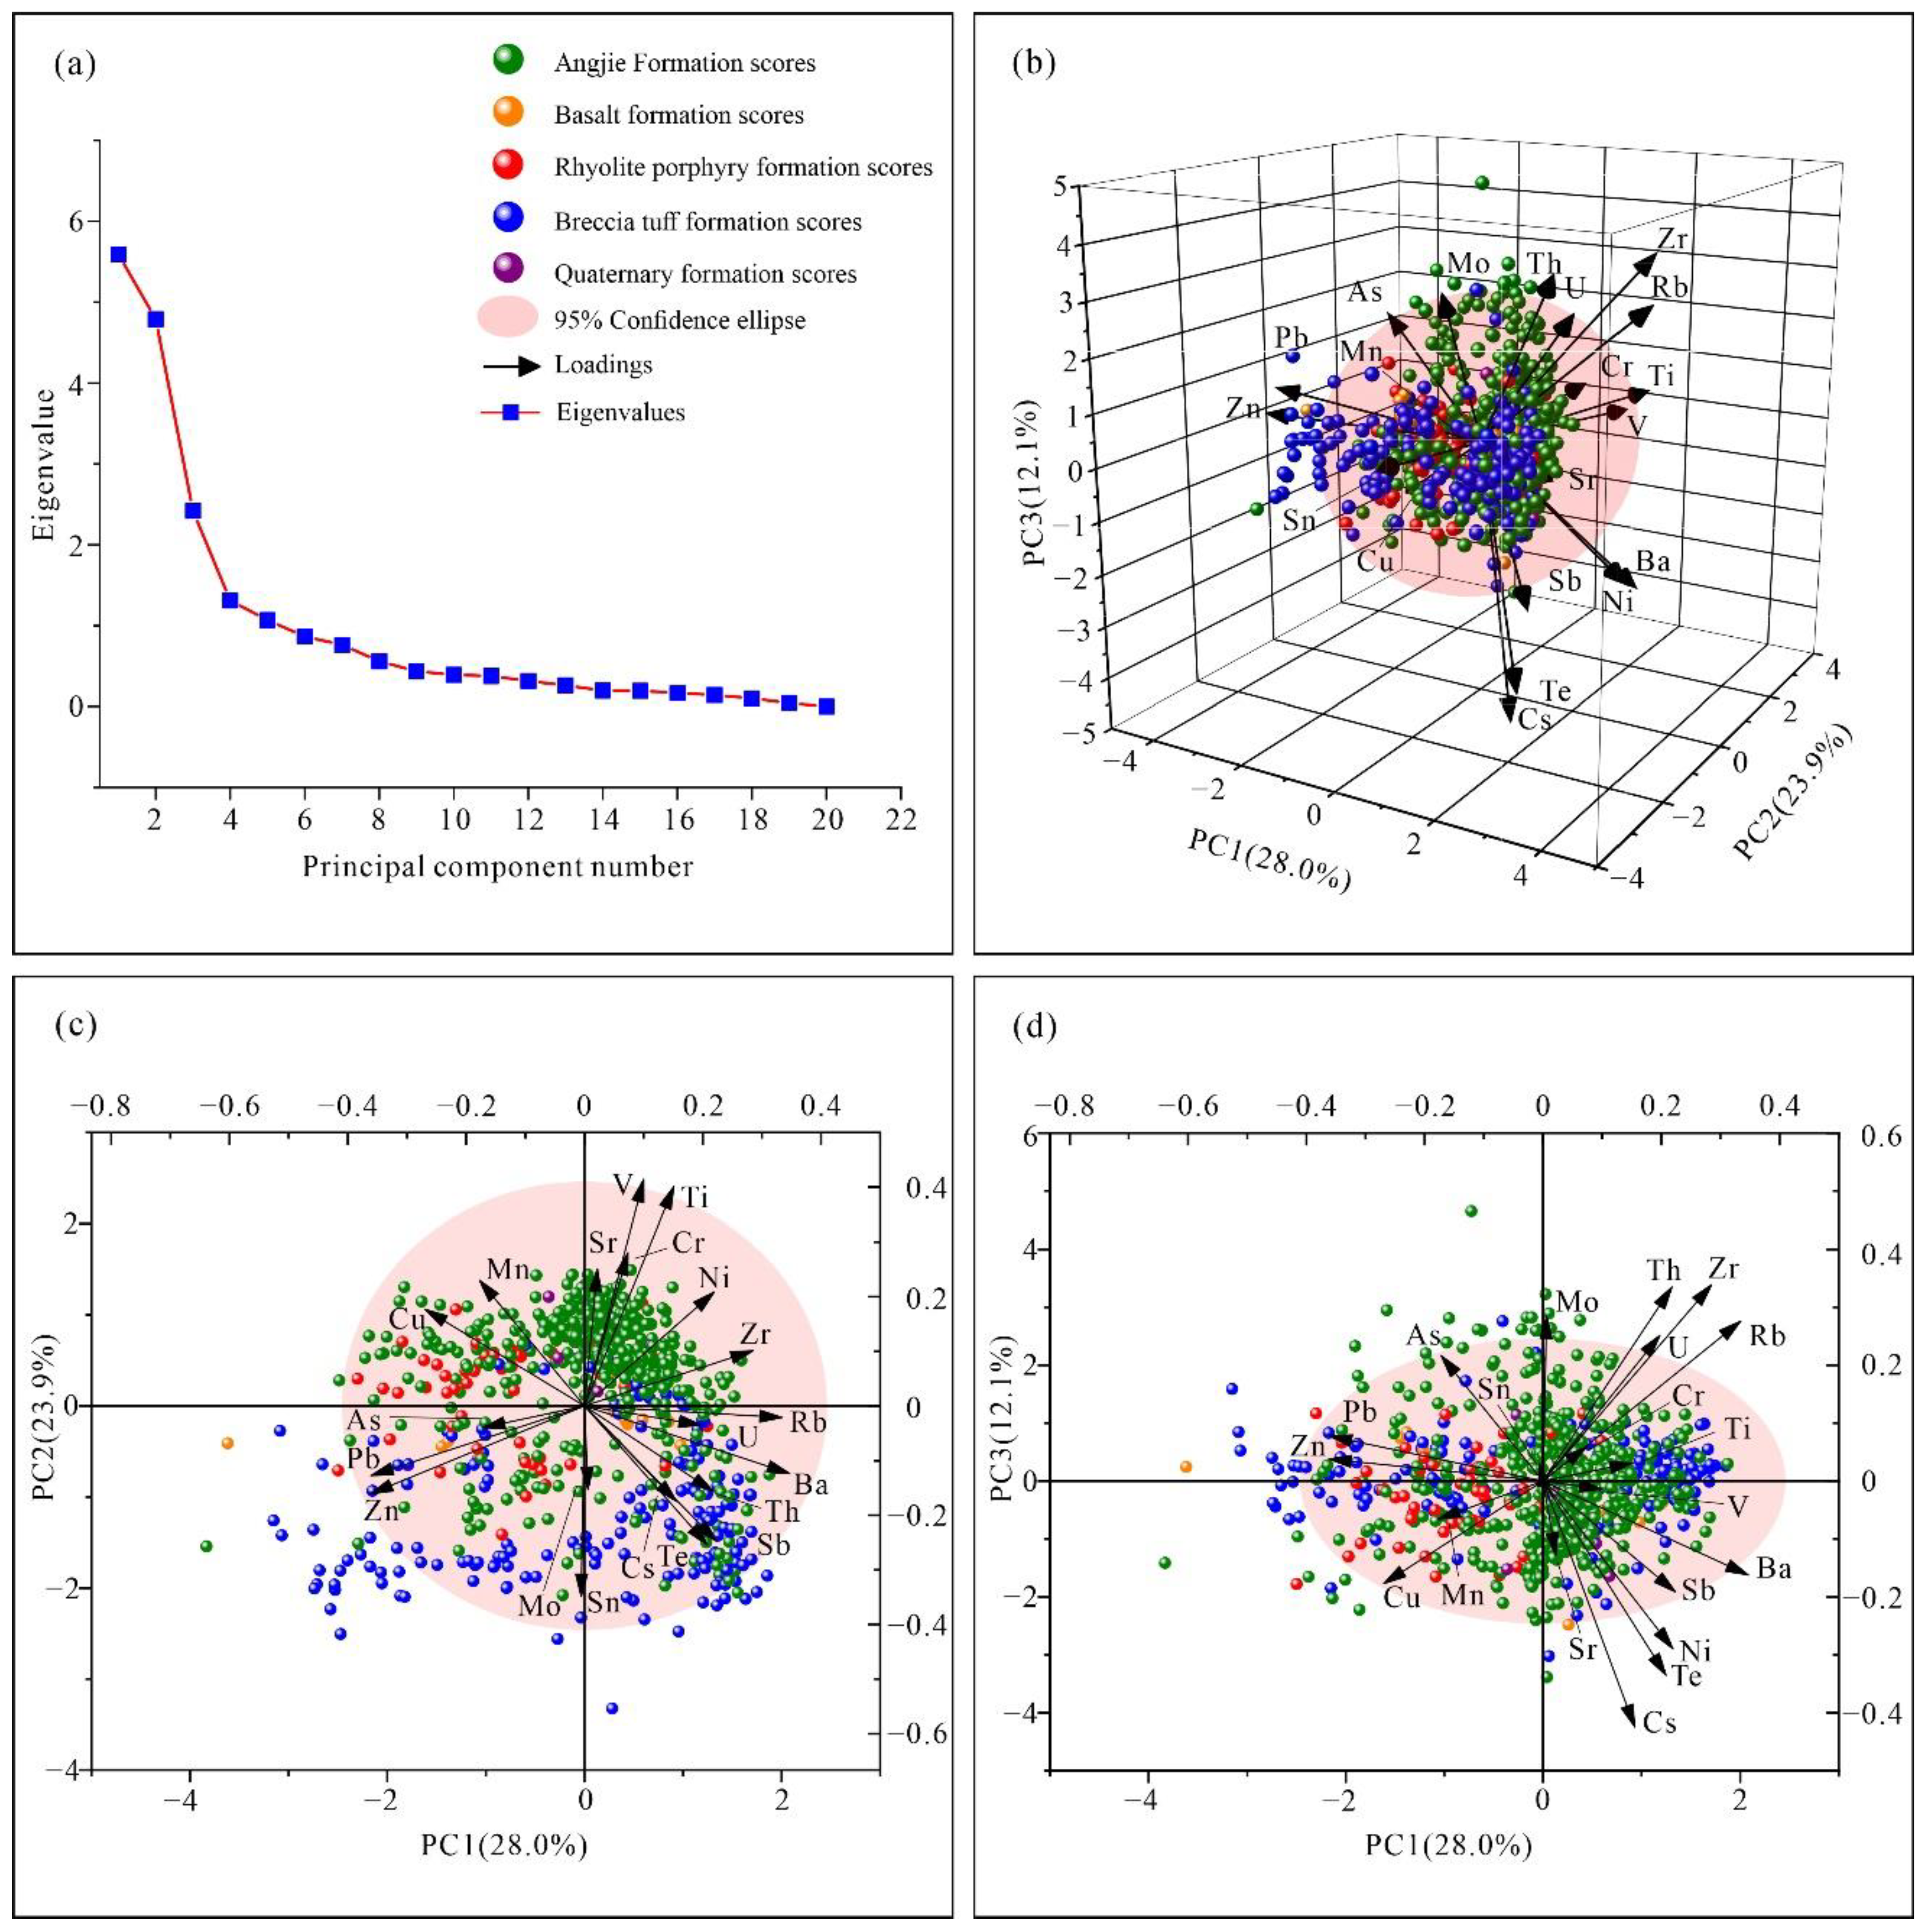
4.2. Principal Component Analysis

When studying more than three variables, the structure and groups of data cannot be identified using graphical methods [19]. Principal component analysis (PCA) is a dimensionality reduction method designed to transform huge datasets into real number space to overcome this complexity [20]. In addition, geochemical data are typical compositional data, and the closure effect may cause false correlations [21]. To weaken the closure effect, the geochemical data need to be “opened” [22,23]. Therefore, we used a centered log-ratio (clr) transformation approach on pXRF element data (except Ca, K, Fe, and other petrogenic elements) and obtained PCA biplots (Figure 7).
According to the inflection point of the scree plot (Figure 7a), we extracted three principal components with larger eigenvalues. Principal component 1 (PC1) explained 28% of the total variances and showed negative loadings of Pb, Zn, As, Cu, Sn, and Mn and positive loadings of Sr, Cr, V, Ti, Ni, Zr, Rb, U, Ba, Th, Cs, Sb, Te, and Mo (Table 3). PC1 showed the association of ore-forming elements, reflecting the mineralization of Cu, Pb, and Zn in the pyroclastic rocks of the Dianzhong Formation. Combined with the coordinates, the samples close to faults showed higher levels of Cu, Pb, and Zn, indicating the potential of fault-controlled epithermal deposits. PC2 contained 23.9% of the total components, which distinguished the samples from the Dianzhong Formation and Angjie Formation (Figure 7c). We interpreted PC2 to reflect that breccia tuff and rhyolite porphyry are ore shoots. PC3 corresponded to 12.1% of the dataset variance, displaying positive loadings of U, Zr, Mo, and As and negative loadings of Ba, Sb, Ni, Te, and Cs (Figure 7d). PC3 was representative of differences between high field strength elements (HFSEs) and large ionic lithophile elements (LILEs), which may have reflected the denudation degree. Accordingly, the combination of Cu, Pb, Zn, As, Sn, and Mn represented the mineralization in Central Nuocang.

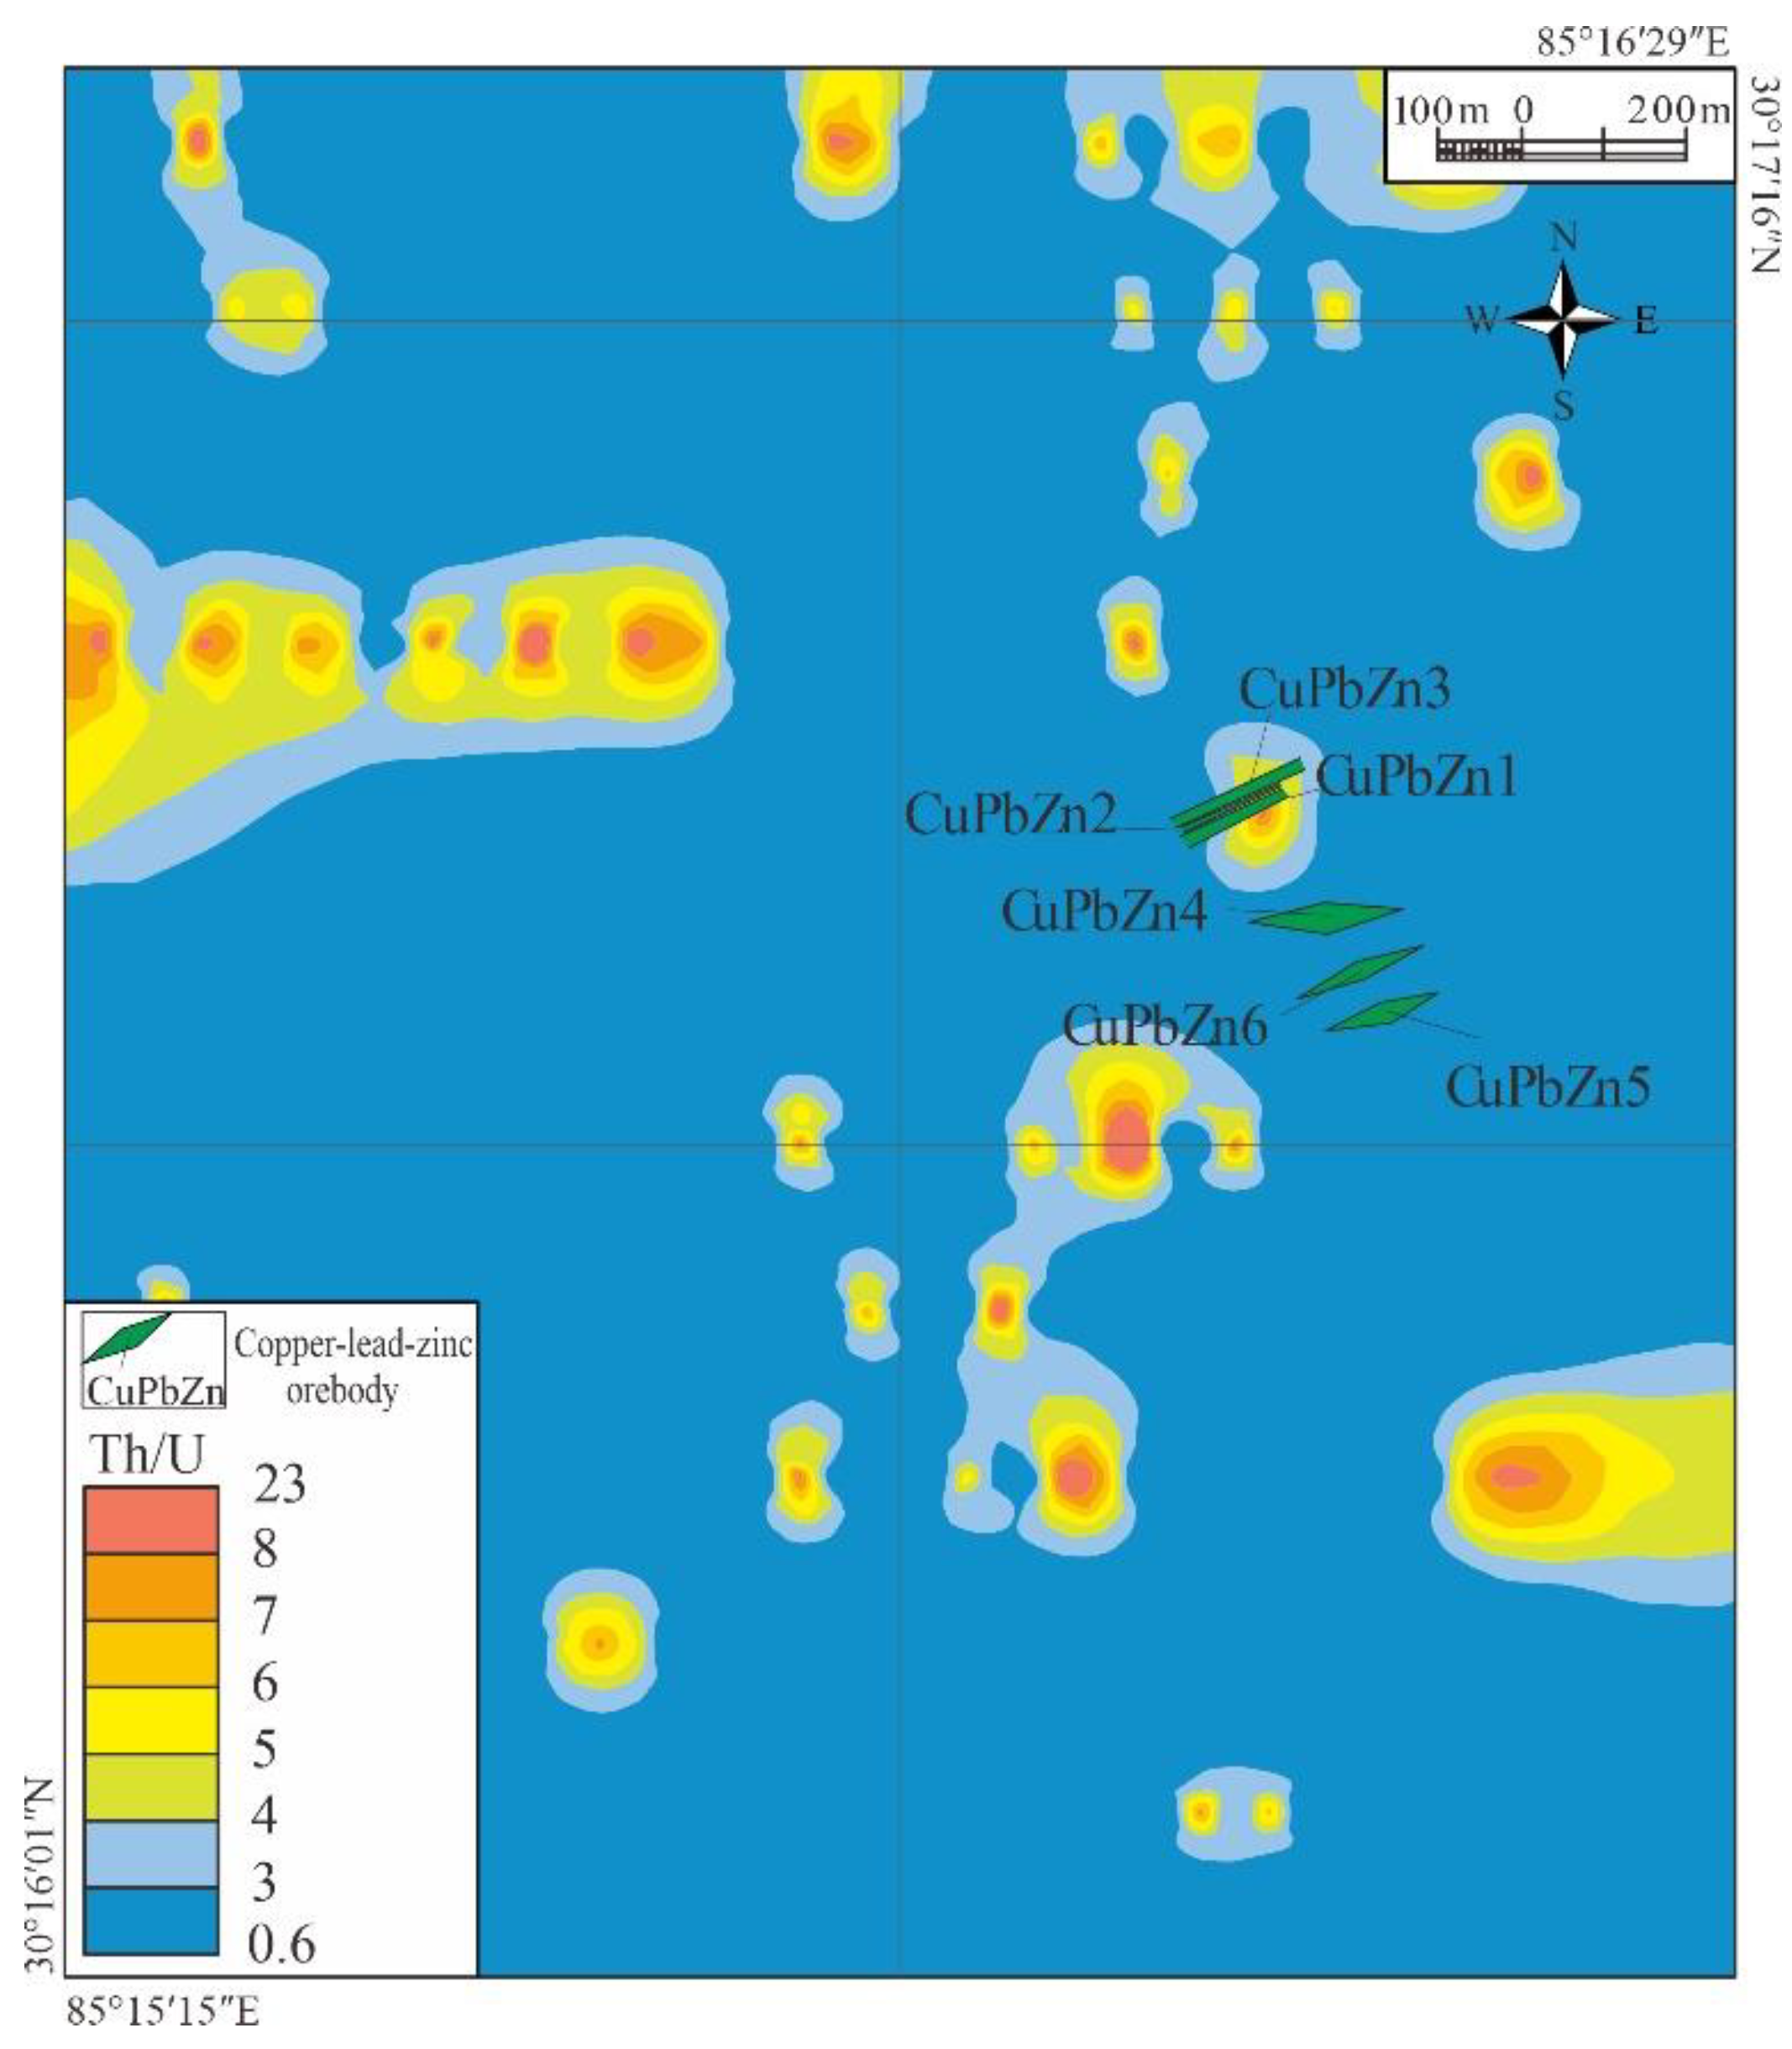
4.3. Denudation Degree

The evaluation of ore bodies’ denudation degree is usually based on the ratio of primary halo elements such as the chemical index of alteration (CIA), the chemical index of weathering (CIW), and the weathering index of Parker (WIP) [24,25,26]. Soil is the residual loose material after bedrock weathering, which has a good inheritance of the geochemical characteristics (primary halo characteristics), and many geologists have applied the method of primary halo prospecting to secondary halos with good results [27,28]. After hydrothermal transformation, different minerals are precipitated under different pressures and temperatures, forming different combinations of minerals and elements. Therefore, we can analyze the denudation degree by studying the element zoning of hydrothermal deposits [29]. According to the horizontal distribution characteristics of secondary halos and the low-temperature to high-temperature element zoning model, the elements were divided into the supra-ore halo (As, Sb, and Sr), the near-ore halo (Pb, Zn, and Cu), and the sub-ore halo (Sn, Ni, the V). All data were divided by the threshold to remove the dimension and accumulated according to the above combination. Finally, these data were normalized and used to create ternary plots (Figure 8). The closer to the sub-ore halo, the higher the degree of denudation, and the closer to the supra-ore halo, the lower the degree of denudation. The denudation degree is represented by the denudation coefficient: if the supra-ore halo denudation coefficient was >0.5, this indicated that the location suffered from weak denudation; a near-ore halo denudation coefficient > 0.5 indicated medium denudation; the sub-ore halo denudation coefficient > 0.5 indicated strong denudation.
As can be seen from the ternary plots, the basic eruptive rocks in the northern part have poor denudation resistance. They are mostly close to the endmember of the supra-ore halo and suffer from strong denudation. Acid eruptive rocks such as rhyolite porphyry and tuff have strong resistance to denudation, and most of them have a near-ore halo denudation coefficient > 0.5, which indicates medium denudation. However, some soil samples of the breccia tuff formation near the northwest (north slope), which have a sub-ore halo denudation coefficient > 0.5, show strong denudation. This also showed that the samples near the fault zone are close to the near-ore halo, showing medium denudation.
In general, large-scale geochemical exploration will not test some non-ore-forming or associated elements. A pXRF can test these elements and turn waste into wealth, such as Th and U. Th remains insoluble as Th4+ no matter whether it is in oxidizing or reducing environments, while U remains insoluble as U4+ in a reducing environment and dissolves as U6+ in an oxidizing environment. Therefore, Th/U can be used as an indicator of the redox environment of the deposit: it varies from 0 to 2 in anoxic environments and to 8 in strongly oxidizing environments [30]. According to the Th/U redox environment geochemical map of Central Nuocang (Figure 9), there is an evolving trend of high-temperature oxidation environments to low-temperature reduction environments from NW to SE. Moreover, there is a strong oxidation environment in the northwest of Central Nuocang, which is consistent with the denudation degree regionally. After trenching, the paragenesis characteristics of chalcopyrite and its oxide malachite and azurite were shown.

5. Geological Connotation Method (GCM)

Statistics-based geochemical data processing methods such as the mean standard deviation method, the Q–Q plot method, and fractal-based methods such as the spectrum–area (S–A) and the concentration–area multifractal methods (C–A) have achieved outstanding prospecting results [31,32]. However, different geologists have obtained different evaluation results for the same batch of geochemical data. This is mainly due to the subjectivity and multiple interpretations of different geologists’ understanding of the geological settings. In addition, the geochemical data of secondary halos are restricted by endogenic and supergene processes. Simply processed epigenetic samples are used to reflect endogenic ore deposits, resulting in a low percentage of ore-occurrence [33]. Therefore, answering the question of how to evaluate anomalies in real geological settings has become a direction in geochemical data processing research. The geological connotation method (GCM) is a geochemical data processing method based on metallogenic regularity and geological settings in a region [34]. First, it divides all of the geochemical data ( x i ) by thresholds ( T i ) of each subregion to obtain the ore-concentration coefficient ( C i ), where C i is the i-th component of a sample (some elements below the limit of detection are represented by half the limit of detection of the pXRF in calculation):
C i = x i T i
The metallogenic-type anomalous value ( A d ) of each sample is equal to the sum of the ore-concentration coefficients, where n represents the indicator element of a certain deposit type:
A d = i = 1 n C i
According to the results of PCA, combined with the typical metallogenic element combination in epithermal deposits, we took Pb-Zn-Cu-As-Sn-Mn as the characteristic metallogenic element combination in Central Nuocang and obtained the metallogenic-type anomalous map (Figure 10a). The figure shows three concentration centers extending along the W-E, N-S directions, located on both sides of the fault zone.
For endogenic ore deposits, to form large–superlarge ore deposits, they must be located in areas that have experienced multiple periods of metallogenic exchange and superimposed metallogenic processes. This will inevitably cause a large number of elements to migrate and become enriched, forming complex anomaly characteristics, resulting in high metallogenic intensity [35]. We assigned 1 to all elements whose ore-concentration coefficient was greater than 1, and the rest were assigned 0. After summation, we could obtain the metallogenic intensity value ( A m ):
A m = i = 1 n f ( C i )      f ( x ) = { 0 ,     x < 1 1 ,     x 1
where n is the n-th element tested using a pXRF. As can be seen from Figure 10b, the position with the highest metallogenic intensity is also the position with the most prominent anomaly.
The HT-1 anomaly has the largest area, but the degree of denudation is also greater. The HT-3 anomaly is located below HT-2 anomaly and close to the fault zone. In order to find primary high-grade orebodies, we choose HT-2 as the best anomaly, which has a lower denudation degree and located at a higher position. Finally, indicated by these maps, we dug five trenches in Central Nuocang, and six copper–lead–zinc orebodies with burial depths of about 2.5 m were uncapped. M-TC3 trench uncapped the best orebodies, which have no obvious pinching trend (Figure 11). The orebodies extend N-E, presenting disseminated, bedding, and parallel vein-hosted mineralization, mainly developed within the rhyolite porphyry and NNE-trending shattered fault zones. The ore minerals present are mainly chalcopyrite, malachite, galena, sphalerite, a small amount of azurite, and scheelite in a float. Gangue minerals are mainly pyrite and quartz. Ore tenors are as follows: Cu (0.36–1.41 wt%), Pb (0.21–2.47 wt%), Zn (0.12–10.05 wt%), and Ag (0.42–28.1 g/t).
There is a large area of Sn anomaly in the northwest of Central Nuocang, but no Sn-containing ore was found. Combined with the denudation degree of soil, the Sn orebody may have been denuded. Due to the steep hillside at this location, trenching was not carried out, so further verification is still required in a later stage.

6. Conclusions

The purpose of this work was to explore the applicability of a pXRF in large-scale geochemical exploration and find a corresponding geochemical data processing method. We discussed the accuracy and precision of the pXRF, setting up duplicate samples to ensure its stability. Finally, we concluded that:
  • Using a pXRF to carry out large-scale soil geochemical exploration can greatly shorten the abnormal verification time while ensuring high accuracy and precision. This method ensures the continuity and stability of field work and meets the needs of primary and secondary halo geochemical exploration. However, due to its high limit of detection, it is not suitable for small-scale geochemical exploration such as the RGNR (Regional Geochemistry-National Reconnaissance Program).
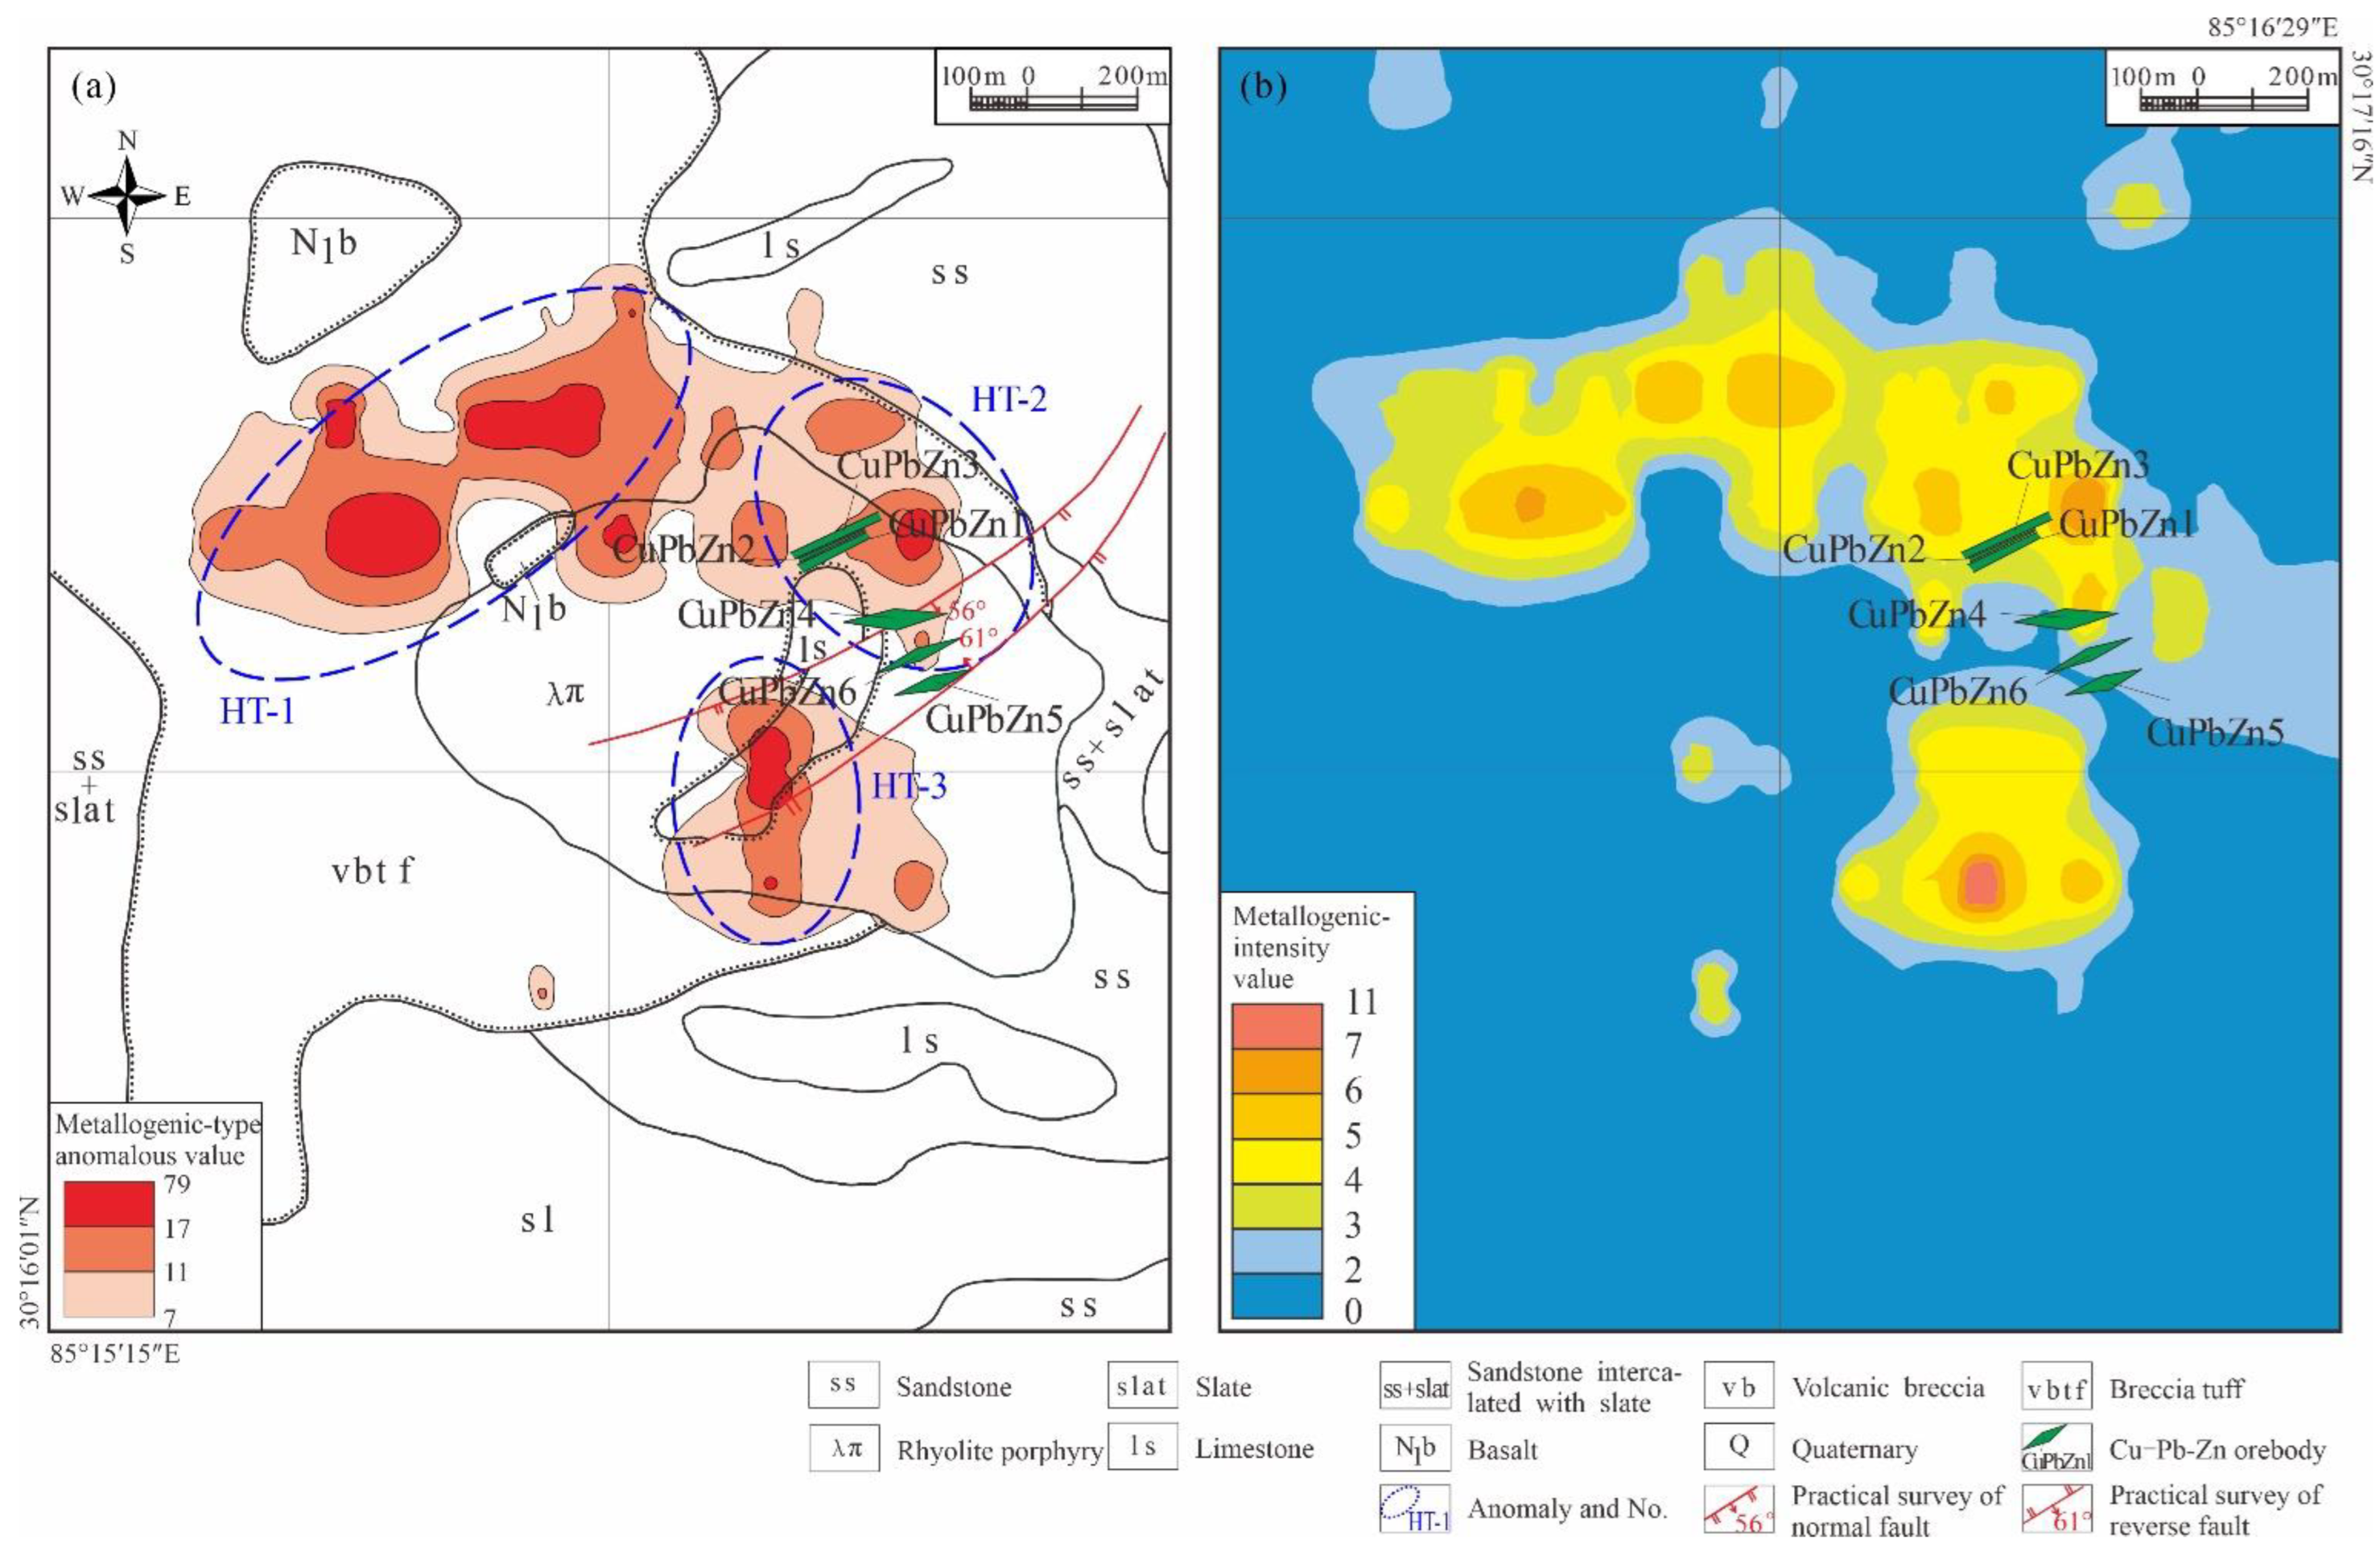
  • We suggest combining the pXRF with the geological connotation method, which can ensure the anomalies related to mineralization are highlighted and avoid interference. This method can make full use of the massive element data of the pXRF to highlight “weak” and “small” anomalies. The area and location of secondary halos are different for different elements, which undoubtedly increases the multi-solution of geochemical exploration. Therefore, when we focus on the element combination of a certain metallogenic type or an area with the highest metallogenic intensity, we do not have to waste time comparing the anomalies of each element.
  • It is not appropriate to obtain a lot of data below the limit of detection, so it is necessary to conduct a grain size test before sampling. The best sampling granularity in Nuocang is −10~+60 mesh, which can be used as a reference for the same formation in western Gangdese.
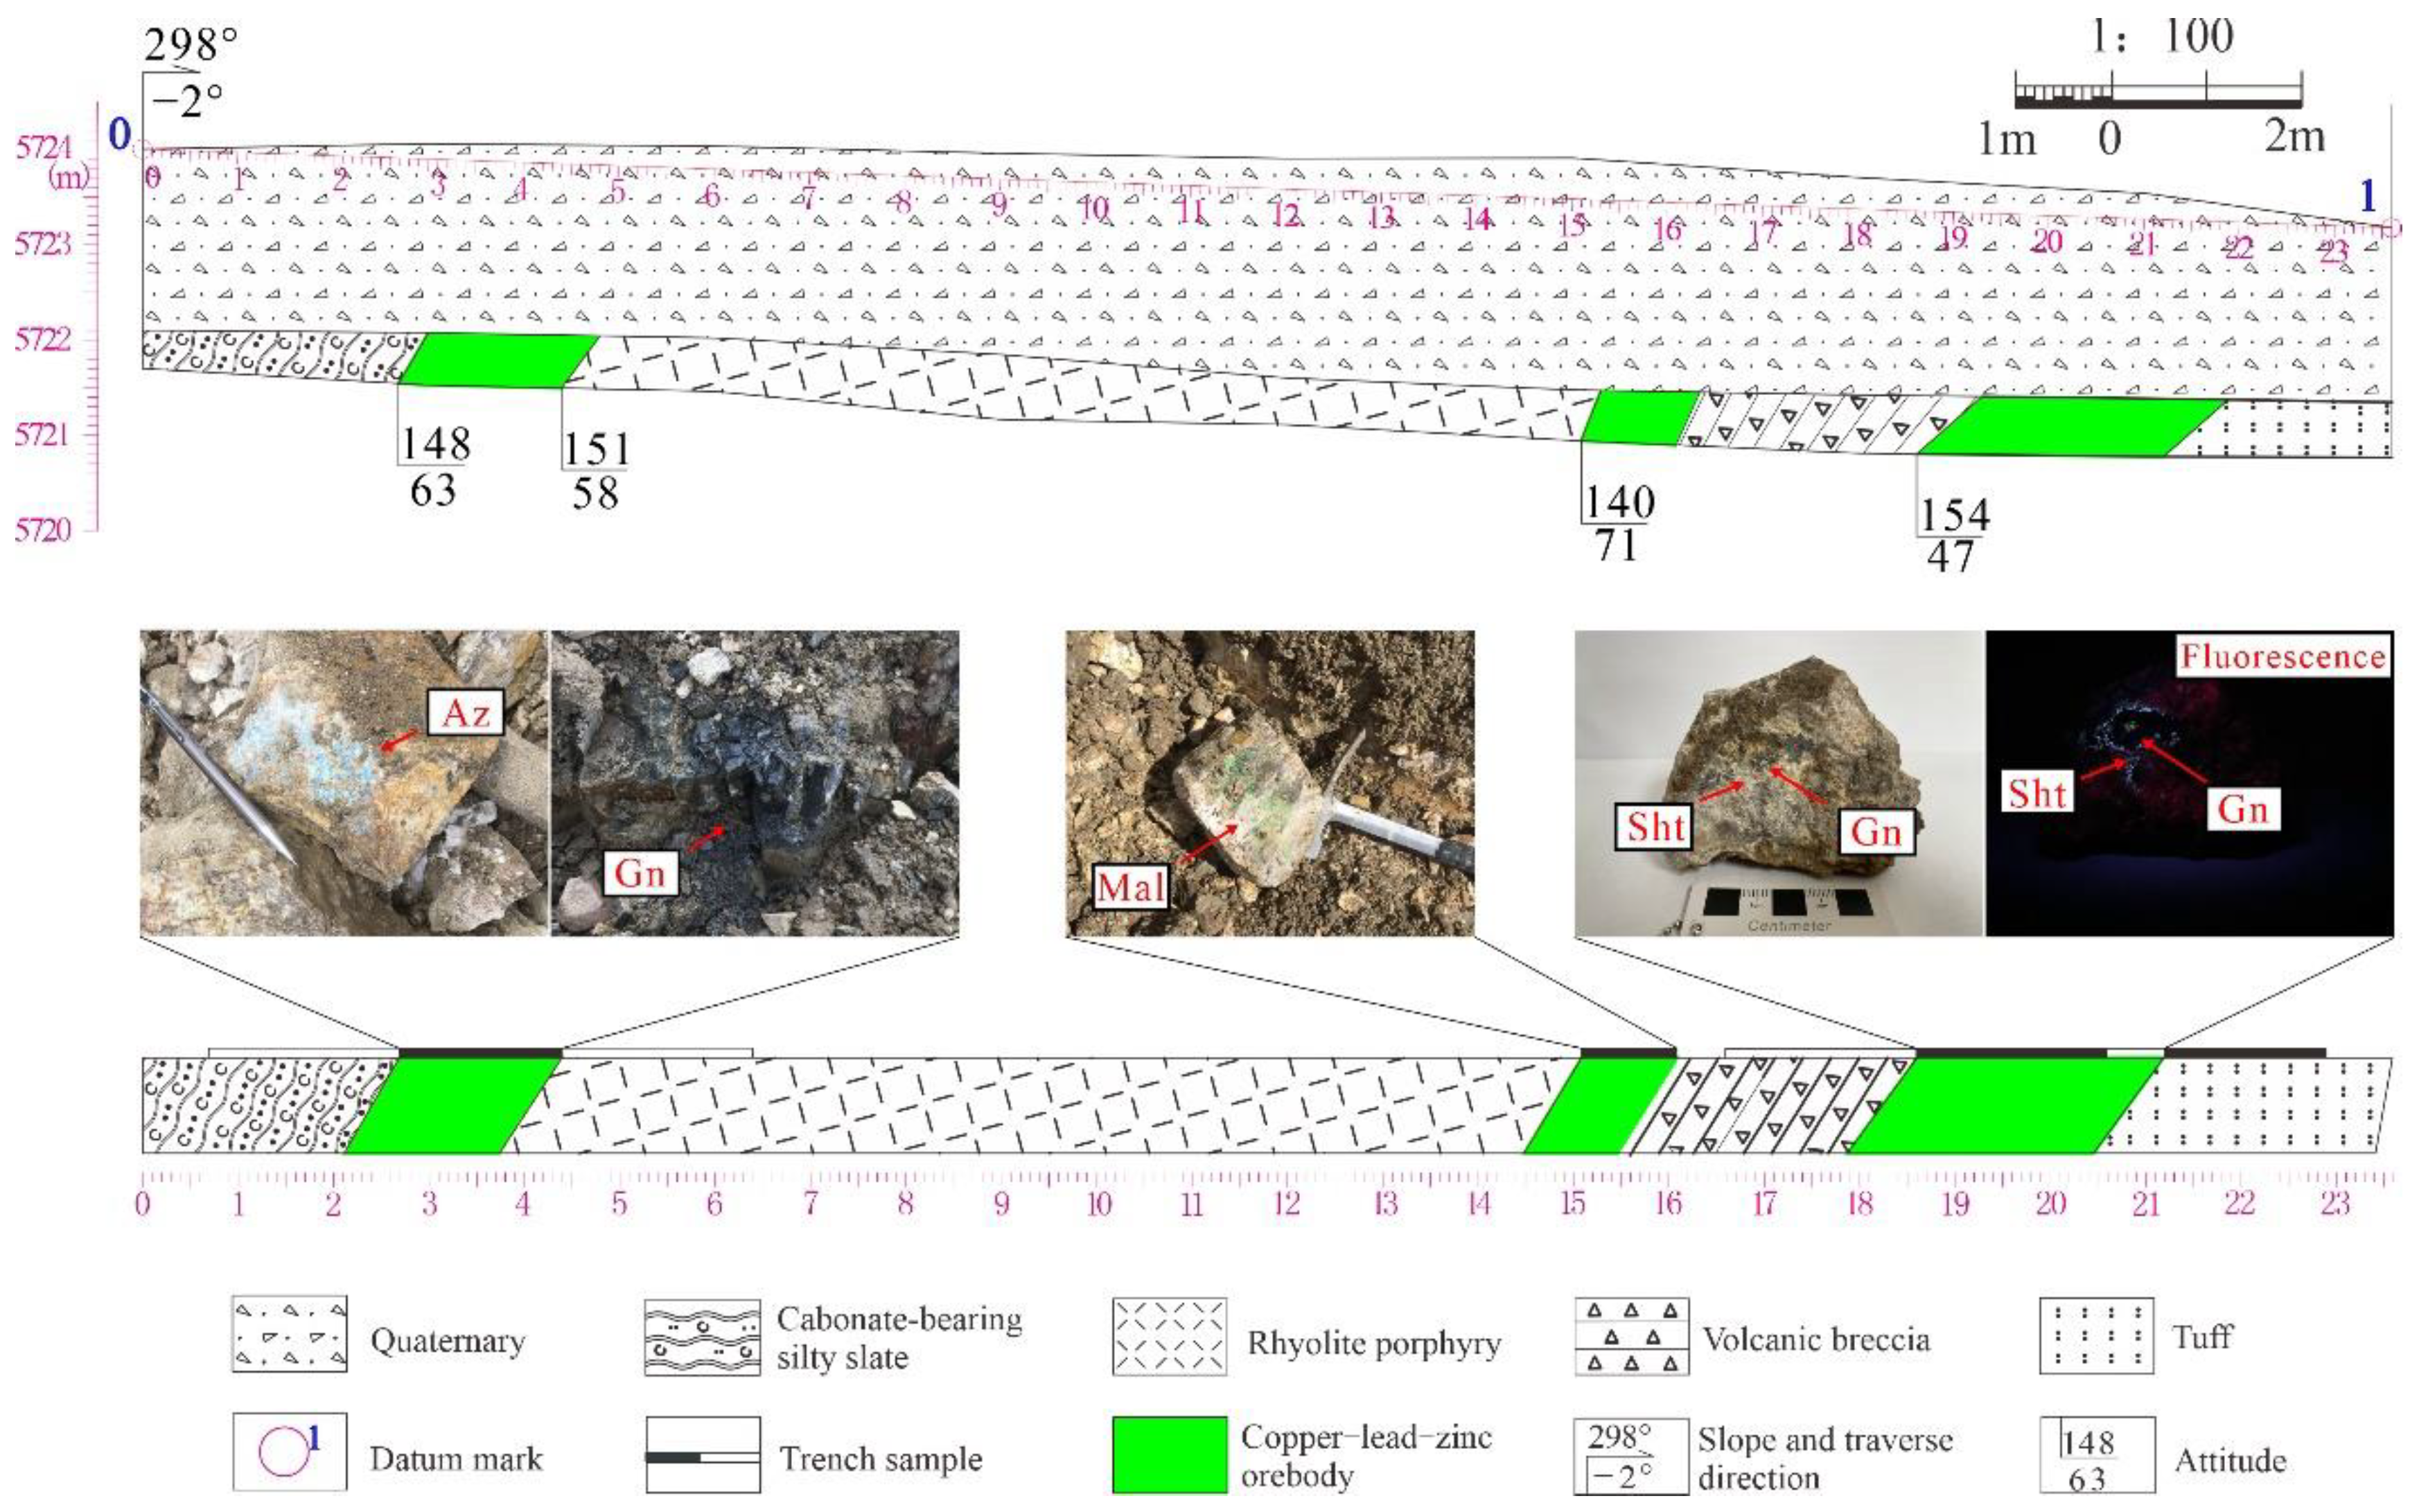
  • Before trenching, we recommend investigating the denudation degree in advance, so as not to only find oxidized or low-grade orebodies. The copper–lead–zinc orebodies produced in the rhyolite porphyry of the Dianzhong Formation were successfully uncapped using trenches, indicating that the main types of the deposit are closely related to volcanic activity. Central Nuocang should have the prospecting potential of epithermal deposits, and future studies can be arranged accordingly.

Supplementary Materials

The following supporting information can be downloaded at: https://doi.org/10.5281/zenodo.6384041, https://www.mdpi.com/article/10.3390/min12050514/s1, Table S1: Soil geochemical test data with pXRF.

Author Contributions

Writing—original draft, B.P.; writing—review and editing, S.W. and L.Z.; visualization, B.P., H.C.; investigation, B.P., Z.Y., Y.L., J.L. and L.Z.; methodology, L.Z., S.W.; project administration, X.L., G.S.; supervision, S.W. All authors have read and agreed to the published version of the manuscript.

Funding

This study was financially supported by the National Natural Science Foundation of China (42072109), and Fundamental Research Funds for the Central Universities (2652019060).

Data Availability Statement

The data from the soil geochemical test with pXRF used in this study are available from the supplementary materials.

Acknowledgments

We are grateful to three anonymous reviewers for their guidance and suggestions, which have significantly improved this manuscript.

Conflicts of Interest

The authors declare no conflict of interest.

References

  1. Mao, J.; Pirajno, F.; Lehmann, B.; Luo, M.; Berzina, A. Distribution of porphyry deposits in the Eurasian continent and their corresponding tectonic settings. J. Asian Earth Sci. 2014, 79, 576–584. [Google Scholar] [CrossRef]
  2. Wu, S.; Zheng, Y.; Wang, D.; Chang, H.; Tan, M. Variation of copper isotopes in chalcopyrite from Dabu porphyry Cu-Mo deposit in Tibet and implications for mineral exploration. Ore Geol. Rev. 2017, 90, 14–24. [Google Scholar] [CrossRef]
  3. Zheng, Y.; Sun, X.; Gao, S.; Wu, S.; Xu, J.; Jiang, J.; Chen, X.; Zhao, Z.; Liu, Y. Metallogenesis and the minerogenetic series in the Gangdese polymetallic copper belt. J. Asian Earth Sci. 2015, 103, 23–39. [Google Scholar] [CrossRef]
  4. Wu, S.; Zheng, Y.; Sun, X. Subduction metasomatism and collision-related metamorphic dehydration controls on the fertility of porphyry copper ore-forming high Sr/Y magma in Tibet. Ore Geol. Rev. 2016, 73, 83–103. [Google Scholar] [CrossRef]
  5. Wu, S.; Zheng, Y.; Xu, B.; Jiang, G.; Yi, J.; Liu, X.; Zheng, S.; Li, L. Heterogeneous mantle associated with asthenosphere and Indian slab metasomatism: Constraints on fertilization of porphyry Cu mineralization in Tibetan orogen. Ore Geol. Rev. 2022, 140. [Google Scholar] [CrossRef]
  6. Yang, Z.; Hou, Z.; White, N.C.; Chang, Z.; Li, Z.; Song, Y. Geology of the post-collisional porphyry copper–molybdenum deposit at Qulong, Tibet. Ore Geol. Rev. 2009, 36, 133–159. [Google Scholar] [CrossRef]
  7. Tang, J.X.; Wang, D.H.; Wang, X.W.; Zhong, K.H.; Ying, L.J.; Zheng, W.B.; Li, F.G.; Guo, N.; Qin, Z.P. Geological features and metallogenic model of the Jiama copper-polymetallic deposit in Tibet. Diqiu Xuebao (Acta Geosci. Sin.) 2010, 31, 495–506. (In Chinese) [Google Scholar]
  8. Xu, B.; Hou, Z.; Zheng, Y.; Wang, R.; He, M.; Zhou, L.; Wang, Z.; He, W.; Zhou, Y.; Yang, Y. In situ elemental and isotopic study of diorite intrusions: Implication for Jurassic arc magmatism and porphyry Cu-Au mineralisation in southern Tibet. Ore Geol. Rev. 2017, 90, 1063–1077. [Google Scholar] [CrossRef]
  9. Zheng, Y.; Ci, Q.; Gao, S.; Wu, S.; Jiang, X.; Chen, X. The Ag-Sn-Cu polymetallic minerogenetic series and prospecting direction in the western Gangdese belt, Tibet. Earth Sci. Front. 2021, 28, 379–402. (In Chinese) [Google Scholar] [CrossRef]
  10. Lemière, B. A review of pXRF (field portable X-ray fluorescence) applications for applied geochemistry. J. Geochem. Explor. 2018, 188, 350–363. [Google Scholar] [CrossRef] [Green Version]
  11. Ge, L.; Lai, W.; Zhou, S.; Xie, T.; Zhang, Y. X radiation sampling technique for in situ rapid determination of ore grade. Met. Mine 1997, 26, 12–17. (In Chinese) [Google Scholar]
  12. Zhang, Y.; Xie, T.; Zhou, S.; Ge, L.; Lai, W. A study of X-ray fluorescence technique in the in situ prospecting for gold deposits in Shandong area. Geophys. Geochem. Explor. 1990, 14, 69–72. (In Chinese) [Google Scholar]
  13. Lemière, B.; Melleton, J.; Auger, P.; Derycke, V.; Gloaguen, E.; Bouat, L.; Mikšová, D.; Filzmoser, P.; Middleton, M. pXRF measurements on soil samples for the exploration of an antimony deposit: Example from the Vendean Antimony District (France). Minerals 2020, 10, 724. [Google Scholar] [CrossRef]
  14. Han, Z.; Wang, R.; Tong, X.; Sun, F.; Li, Y.; Liu, S.; Xue, Q. Multi-scale exploration of giant Qulong porphyry deposit in a collisional setting. Ore Geol. Rev. 2021, 139, 104455. [Google Scholar] [CrossRef]
  15. Bosco, G.L. Development and application of portable, hand-held X-ray fluorescence spectrometers. TrAC Trends Anal. Chem. 2013, 45, 121–134. [Google Scholar] [CrossRef]
  16. Gray, C.; Van Rythoven, A. A comparative study of porphyry-type copper deposit mineralogies by portable X-ray fluorescence and optical petrography. Minerals 2020, 10, 431. [Google Scholar] [CrossRef]
  17. Balaram, V.; Sawant, S.S. Indicator minerals, pathfinder elements, and portable analytical instruments in mineral exploration studies. Minerals 2022, 12, 394. [Google Scholar] [CrossRef]
  18. Wang, C. Basics of Exploration Geochemistry; Geological Publishing House: Beijing, China, 1987. (In Chinese) [Google Scholar]
  19. Iwamori, H.; Yoshida, K.; Nakamura, H.; Kuwatani, T.; Hamada, M.; Haraguchi, S.; Ueki, K. Classification of geochemical data based on multivariate statistical analyses: Complementary roles of cluster, principal component, and independent component analyses. Geochem. Geophys. Geosyst. 2017, 18, 994–1012. [Google Scholar] [CrossRef]
  20. Heidarian, H.; Lentz, D.R.; Thorne, K.; Rogers, N. Application of portable X-ray and micro-X-ray fluorescence spectrometry to characterize alteration and mineralization within various gold deposits hosted in southern New Brunswick, Canada. J. Geochem. Explor. 2021, 229, 106847. [Google Scholar] [CrossRef]
  21. Aitchison, J. The statistical analysis of compositional data. J. R. Stat. Soc. Ser. B (Methodol.) 1986, 44, 139–177. [Google Scholar] [CrossRef]
  22. Jiang, X.; Chen, X.; Zheng, Y.; Gao, S.; Ouyang, S.; Zhang, Y.; Zheng, L.; Huang, J. The recognition and extraction of Au, Cu geochemical composite anomalies: A case study of the east of Laji Mountains. Geophys. Geochem. Explor. 2017, 41, 459–467. (In Chinese) [Google Scholar] [CrossRef]
  23. Jiang, X.; Chen, X.; Gao, S.; Zheng, Y.; Ren, H.; Han, D.; Yan, C.; Jiang, J. A new discovery of Ag-Pb-Zn mineralization via modern portable analytical technology and stream sediment data processing methods in Dajiacuo area, western Tibet (China). J. Earth Sci. 2020, 31, 668–682. [Google Scholar] [CrossRef]
  24. Nesbitt, H.W.; Young, G.M. Early Proterozoic climates and plate motions inferred from major element chemistry of lutites. Nature 1982, 299, 715–717. [Google Scholar] [CrossRef]
  25. Harnois, L. The CIW index: A new chemical index of weathering. Sediment. Geol. 1988, 55, 319–322. [Google Scholar] [CrossRef]
  26. Parker, A. An index of weathering for silicate rocks. Geol. Mag. 1970, 107, 501–504. [Google Scholar] [CrossRef]
  27. Li, S.; Jiao, X.; Hao, H.; Han, T.; Sun, Z.; Li, B.; Li, Z.; Xing, H.; Han, Y. An analysis of the denudation degree of Pb-Zn-Ag polymetallic deposits in the north of Zhangjiakou area. Diqiu Xuebao (Acta Geosci. Sin.) 2021, 42, 537–544. (In Chinese) [Google Scholar]
  28. Gong, Q.; Deng, J.; Wang, C.; Wang, Z.; Zhou, L. Element behaviors due to rock weathering and its implication to geochemical anomaly recognition: A case study on Linglong biotite granite in Jiaodong peninsula, China. J. Geochem. Explor. 2013, 128, 14–24. [Google Scholar] [CrossRef]
  29. Shao, Y. Research on primary zoning of ore deposits and its application in geochemical prospecting. Geol. Prospect. 1984, 2, 47–55. [Google Scholar]
  30. Kimura, H.; Watanabe, Y. Oceanic anoxia at the Precambrian-Cambrian boundary. Geol. Prospect. 2001, 29, 995–998. [Google Scholar] [CrossRef]
  31. Cheng, Q.; Agterberg, F.P.; Ballantyne, S.B. The separation of geochemical anomalies from background by fractal methods. J. Geochem. Explor. 1994, 51, 109–130. [Google Scholar] [CrossRef]
  32. Cheng, Q.; Xu, Y.; Grunsky, E. Integrated spatial and spectrum method for geochemical anomaly separation. Nat. Resour. Res. 2000, 9, 43–52. [Google Scholar] [CrossRef]
  33. Tian, L. Geochemical Data Processing and Targets Optimization in Eastern Kunlun Orogenic Belt, Qinghai Province, China; China University of Geosciences: Wuhan, China, 2017. (In Chinese) [Google Scholar]
  34. Zheng, Y.; Gao, S.; Xue, Z.; Sun, X.; Zheng, H.; Ke, Z.; Liu, M. A Method for Identifying and Evaluating Anomalies in Geochemical Exploration Based on Geological Connotation. CN Patent 103345566A, 9 October 2013. (In Chinese). [Google Scholar]
  35. Zheng, Y.; Chen, R.; Pang, Y.; Shi, J.; Gao, S.; Zuo, R.; Xie, Y. Metallogenic prediction method: Theoretical exploration and practice. Earth Sci. 2009, 34, 511–524. (In Chinese) [Google Scholar]
Figure 1. (a) Simplified geologic map of the Lhasa terrane showing the distribution of main deposits (modified after Wu et al., 2017) [2]; (b) geological map of Central Nuocang. Abbreviations: IYZSZ, Indus–Yarlung Zangbo suture zone; LMF, Luobadui–Milashan fault; GLNT, Geer–Longgeer–Cuoqin fault; SNMZ, Shiquan River–NamTsoMélange zone; BNSZ, Bangong–Nujiang suture zone.
Minerals 12 00514 g001
Figure 2. Photomicrographs of typical rocks in Central Nuocang. (a) Dacitic breccia; (b) intermediate–acidic volcanic breccia; (c) rhyolite porphyry; (d) dacitic breccia tuff; (e) rhyolitic breccia tuff; (f) debris quartz sandstone; (g) galena and pyrite in rhyolite porphyry; (h) disseminated malachite in alteration zone; (i) intergrown malachite and azurite in rhyolite porphyry. Abbreviations: Pl, plagioclase; Q, quartz; Kf, potassium feldspar; Cbn, carbonatite; Gn, galena; Py, pyrite; Mal, malachite; Az, azurite.
Minerals 12 00514 g002
Figure 3. Principle of pXRF instrument.
Minerals 12 00514 g003
Figure 4. Calibration curve between pXRF results and certified values (the TILL and RCRA standards). (a) As; (b) Ba; (c) Cu; (d) Zn; (e) Pb.
Minerals 12 00514 g004
Figure 5. Regression analysis of pXRF and ICP-MS, in μg/g. (a) Mo; (b) Cu; (c) Zn; (d) Sn; (e) Pb.
Minerals 12 00514 g005
Figure 6. Values of different elements in different grain size grades. (a) Cu; (b) Pb; (c) Sn; (d) Zn.
Minerals 12 00514 g006
Figure 7. (a) Scree plot of eigenvalues of principal components. (b) Three-dimensional biplot of principal components for different formations. The formation information is derived from the previous mapping. (c) Biplot of principal components (PC1 vs. PC2). (d) Biplot of principal components (PC1 vs. PC3) for different formations.
Minerals 12 00514 g007
Figure 8. (a) Ternary plot of denudation degree for magmatic rock formations. (b) Ternary plot of denudation degree for Angjie Formation and quaternary.
Minerals 12 00514 g008
Figure 9. Th/U redox environment geochemical map of Central Nuocang.
Minerals 12 00514 g009
Figure 10. (a) Metallogenic-type (Pb-Zn-Cu-As-Sn-Mn) anomalous map in Central Nuocang. (b) Metallogenic-intensity (all elements tested using a pXRF) map in Central Nuocang.
Minerals 12 00514 g010
Figure 11. M-TC3 (0–1 traverse) trench cross-section and typical ore. Abbreviations: Gn, galena; Mal, malachite; Az, azurite; Sht, scheelite.
Minerals 12 00514 g011
Table 1. Accuracy and precision of the pXRF.
ElementsZrSrRbPbAsZnWCuMnTi
TILL-438510916150111702042374904840
pXRF400.54101.48174.4441.97120.5665.7176.31223.03510.624905.94
Δ l g C ¯ 0.0170.0310.0350.0760.0360.0280.0630.0260.0350.006
RSD4.30%7.38%8.85%7.85%9.54%9.22%15.92%8.42%8.83%1.77%
Table 2. Qualification rate of duplicate samples.
Sample
Number
Relative Deviation (RD)/%
ZrSrRbThPbAsZnCuMnTiSn
NCZ02-05C0.110.361.368.240.351.561.875.080.580.33<LOD *
NCZ03-14C0.650.470.213.620.393.730.738.480.701.100.03
NCZ04-19C0.741.771.281.18<LOD<LOD0.77<LOD2.800.20<LOD
NCZ07-10C0.920.350.032.60<LOD2.980.58<LOD2.061.640.13
NCZ08-14C0.860.030.188.155.7110.575.11<LOD0.520.310.05
NCZ09-18C20.1520.1619.3916.2020.3814.1722.40<LOD19.551.040.15
NCZ10-22C0.160.210.170.344.6011.661.347.360.240.15<LOD
NCZ11-26C0.290.330.503.642.561.840.16<LOD0.920.19<LOD
NCZ12-30C0.130.610.131.381.532.452.004.252.910.18<LOD
NCZ14-02C0.460.510.344.570.552.550.416.290.460.47<LOD
NCZ15-13C0.560.790.810.688.913.183.86<LOD2.490.480.05
NCZ16-24C0.720.120.262.48<LOD8.944.513.851.780.180.05
NCZ17-35C0.381.540.765.730.588.730.274.390.390.080.09
NCZ19-07C0.500.170.608.94<LOD<LOD5.074.460.090.27<LOD
NCZ19-39C0.280.620.230.490.870.280.3014.010.570.220.01
NCZ10-13C0.490.031.070.321.260.431.58<LOD0.550.32<LOD
NCZ11-09C0.040.830.131.120.107.832.433.310.570.58<LOD
NCZ12-14C19.6420.4019.7316.7629.8111.9320.0514.8120.310.32<LOD
NCZ13-32C0.230.770.344.060.770.250.813.021.230.51<LOD
NCZ15-05C1.190.041.100.532.600.785.741.251.110.62<LOD
NCZ16-25C0.660.141.0010.5017.193.663.02<LOD1.240.11<LOD
NCZ18-11C0.310.420.147.160.041.050.710.090.210.07<LOD
Qualification
rate
10010010010095.45100100100100100100
* <LOD means below the limit of detection.
Table 3. Component matrix for pXRF soil data after clr transformation.
ComponentMoZrSrURbThPbAsZnCu
PC10.0060.2850.0220.1980.3340.218−0.361−0.172−0.362−0.269
PC2−0.1530.1010.251−0.035−0.021−0.156−0.128−0.04−0.1610.177
PC30.2850.339−0.1280.2510.2760.3350.0780.2160.038−0.177
ComponentNiMnCrVTiBaCsTeSbSn
PC10.22−0.1780.0740.10.1510.3470.1550.2080.224−0.005
PC20.2090.230.2810.4140.401−0.124−0.175−0.255−0.248−0.349
PC3−0.29−0.0660.059−0.0140.031−0.162−0.425−0.336−0.1910.03
Publisher’s Note: MDPI stays neutral with regard to jurisdictional claims in published maps and institutional affiliations.

