Article

Lithofacies and Source Rock Quality of Organic-Rich Shales in the Cretaceous Qingshankou Formation, Songliao Basin, NE China

1
Research Institute of Petroleum Exploration and Development (RIPED), China National Petroleum Corporation (CNPC), Beijing 100083, China
2
Key Lab of Oil and Gas Reservoir of PetroChina, Beijing 100083, China
3
National Energy Tight Oil and Gas R&D Center, Beijing 100083, China
4
Exploration and Development Research Institute of Daqing Oilfield Co., Ltd., Daqing 163712, China
5
Heilongjiang Provincial Key Laboratory of Shale Oil & Tight Oil Accumulation, Daqing 163712, China
6
Institute of Energy, School of Earth and Space Sciences, Peking University, Beijing 100871, China
*
Authors to whom correspondence should be addressed.
Minerals 2022, 12(4), 465; https://doi.org/10.3390/min12040465
Submission received: 3 February 2022 / Revised: 4 March 2022 / Accepted: 19 March 2022 / Published: 11 April 2022

Abstract

:
The organic-rich shale of the Qingshankou Formation (K2qn) is the most important target in the Songliao Basin. The relationship between lithofacies and source rock quality, however, is still controversial. Core observation, thin section identification, X-ray diffraction, organic geochemistry, and other analytical methods were adopted to investigate the petrology and its effects on hydrocarbon potential of the Qingshankou shale. Based on the differences in minerals, bioclastic, and fabric of laminae, four main lithofacies were defined as: (i) felsic shale (FS), (ii) clay shale (CS), (iii) bio-bearing shale (BS), and (iv) mixed shale (MS). The clay minerals content in the CS (average: 46.72 wt%) and MS (average: 41.11 wt%) was higher than that in FS (average: 39.97 wt%) and BS (average: 35.48 wt%). This classification allows the following comparative quantification of total organic carbon (TOC) content to be differentiated: CS > BS > MS > FS. Geochemical analysis indicated that the oil generation potential of the CS was the best, and the hydrocarbons generated from CS might migrate and accumulate in other lithofacies. All this knowledge could shed light on the lithofacies classification in shale systems with high clay mineral content, and may provide references for sweet spotting of the Qingshankou Formation in the Songliao Basin.

1. Introduction

Lithofacies is the basic unit of shale reservoir, which reflects the collection of all important lithologic characteristics of sedimentary rock, such as mineral composition, organic matter content, fabric, texture, color, etc., and is the research basis for evaluating the fluidity and mechanical properties of oil and gas reservoirs in shale oil exploration and development [1,2].
Before the success of exploration and development of Barnett shale in Texas in the United States [3,4,5,6], lithofacies research mainly focused on sandstone and carbonate rocks. A lot of works have been conducted with the lithofacies classification, prediction, and discussion on the relationships between the reservoir quality and lithofacies developed in sandstone and carbonate rocks in previous researches [7,8,9,10,11,12]. The lithofacies of mudstones and shales, however, have been shown little attention, with focus only on the core category and description of those fine-grained sedimentary rocks [13,14,15]. To most researchers, little variation seems to occur in the mudstones generated in a specific sequence [16]. What’s more, such terms as “fissility” or “platiness”, based on either their weathering or compaction characteristics, are not effective enough upon implying the deposition processes [17].
However, with the rapid development of the global shale oil and gas industries, shale and mudstone lithofacies analysis is increasingly valued [18,19,20]. Therefore, as an important target of unconventional oil and gas, there developed a series of machine learning methods to predict the identification and classification of shales and mudstones lithofacies [21,22,23]. In fact, apart from marine shales, lacustrine shales also have great potential for hydrocarbon exploration. For example, the lacustrine shale oil in the Green River Formation in the Uinta Basin has indicated more than 215 billion tons of resource potential since 2010 [24,25,26,27,28]. Furthermore, three types of shale, including marine shales, marine-lacustrine transitional shales, and lacustrine shales are widespread in China and there are abundant shale oil and gas resources [29].
A big breakthrough, recently, has been achieved in the deep lacustrine shale of the first and second members of the Qingshankou Formation, Songliao Basin. A single well daily production rate of more than 30 tons has been obtained [30]. However, the sedimentary environment of lacustrine shale changes frequently, resulting in complex and changeable lithofacies types. Although there existed several lithofacies divisions in the study area [31,32], it was still difficult to estimate source rock quality of shale according to these lithofacies classifications. Due to the important representativeness of the Qingshankou Formation, core description, thin section observation, and rock pyrolysis were used to study its lithofacies and source rock quality. The main purpose of this study is to (1) define and describe the shale lithofacies and its related sedimentary characteristics of the Qingshankou Formation, and (2) analyze the quality of source rocks for the exploration and development of shale oil in the Qingshankou Formation.

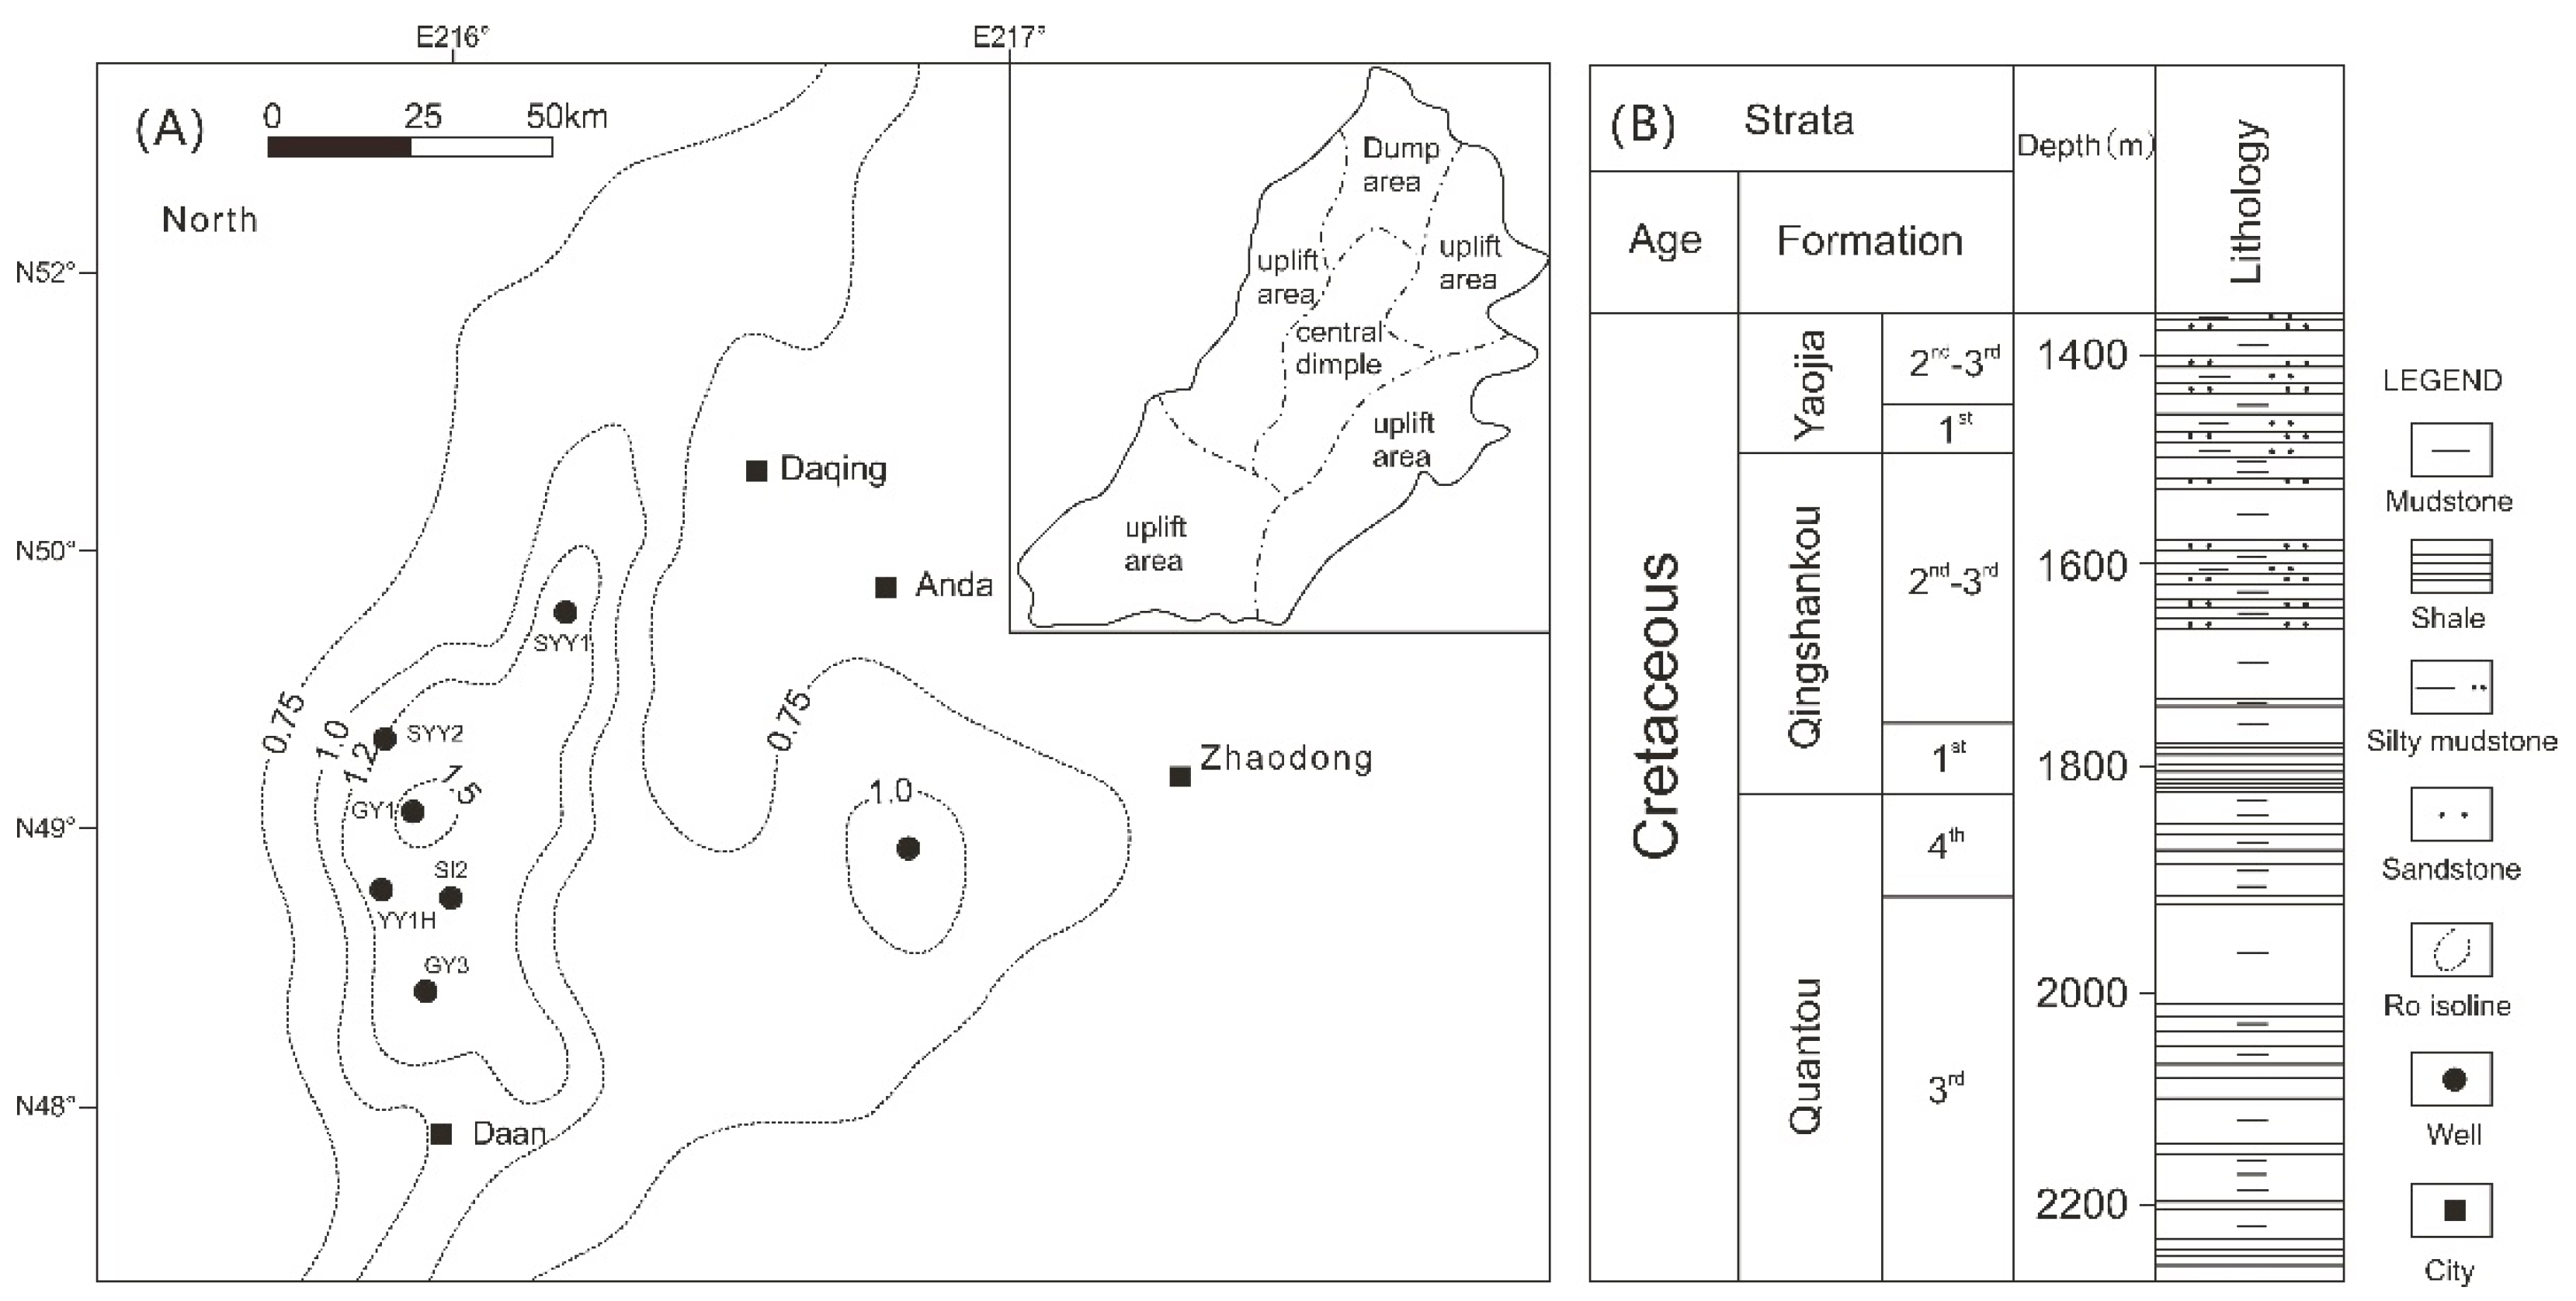
2. Geological Settings

The Songliao Basin is a superimposed basin in northeastern China. It is a Mesozoic and Cenozoic continental petroliferous basin, with faulted deposits at the bottom and depressions in the upper parts. The basin extends north-east, about 800 km long, 400 km wide, and covers an area of about 2.6 × 10⁵ km2 [33]. It is a world-class representative large-scale lacustrine sedimentary basin. Based on the types of basements, the Songliao Basin can be roughly divided into six primary structural units, namely the western slope area, the southwest uplift area, the southeast uplift area, the northeast uplift area, the central depression area, and the northern slope area. Based on regional structure, the basin can further be subdivided into ten secondary structural units, including Sanzhao Sag, Qijia-Gulong Sag, Changling Sag, Fuyu Uplift, Daqing Placanticline, etc. [34]. The Qingshankou Formation’s sedimentary period was a large-scale lacustrine flooding period. It was lacustrine deposit formed in a warm and humid paleoclimate environment. It developed a set of black organic-rich shale with thin layers of fine sandstone, siltstone and ostracods limestone, dolomite, and thin tuff. There are many types of organisms, including ostracods and leaf limbs [35]. From bottom to top, the Qingshankou Formation can be divided into three members, which are Qing 1 member, Qing 2 member, and Qing 3 member. The Qingshankou Formation was deposited in a strongly reducing environment during the maximum lacustrine transgression period, forming a set of deep lacustrine shale, which is the main source rock strata of the basin. From the uplift zone in the eastern part of the basin to the central sag, the organic matter is mainly of type I-II1, with high abundance (TOC ranging from 0.9% to 3.8%), and medium to high maturity (Ro ranging from 0.7% to 2.0%), the thickness is between 80 and 450 m [29] (Figure 1).

3. Materials and Methods

The GY3 well was used as the research well to focus on the shale properties of the Qingshankou Formation. The burial depths of the Qingshankou Formation range from 2369 to 2511 m. The overall thickness is about 142 m. While performing core description, a hand-held XRF was used to scan the entire well section sequentially by points. Based on the difference of lithology and element distribution, 74 samples were selected for thin section observation, bulk rock mineralogy, and Rock-Eval pyrolysis.
The elemental scanning uses a Thermo Scientific Niton XL handheld ED-XRF analyzer (Niton XL2t 950, Thermo Scientific, Waltham, MA, USA) with a spatial resolution of 3–5 cm [36]. The instrument has a built-in calibration system, and the unit of measurement is ppm. In this paper, the XRF spotting interval is 10 cm/point, and the continuous spotting scans 2370–2510 m to obtain a total of 1357 spots.
Thin sections are prepared by polishing the rock to a thickness of about 0.03 mm and observed using a transmission microscope. This approach is used for micro-feature analysis (whether there is a laminar layer, type of laminae, etc.), and an Olympus BX51 polarizing microscope (Olympus, Tokyo, Japan) is used.
X-ray diffraction (XRD) is a general method to determine mineralogical composition of rocks. The main principle is that each mineral crystal has a specific X-ray diffraction pattern, and the characteristic peak intensity in the pattern is positively correlated with the mineral content in the sample to identify the characteristics. The spectrum can be used to determine the type of mineral, and the intensity of the characteristic peak can be calculated to obtain the mineral content. According to the industry standard SY/T 5163-2018, the experimental analysis was performed, and the TTR X-ray diffractometer was used.
Total organic carbon content was determined using a LECO CS-230 carbon and sulfur analyzer (LECO, St. Joseph, MI, USA) followed the national standard GB/T 19145-2003. The sample is pulverized into powder with a particle size of less than 0.2 mm. After the inorganic carbon in the sample is digested with chemical reagents, the sample is completely burned by a high-temperature oxygen stream to obtain converted carbon dioxide. The TOC value is detected. All the above-mentioned experiments were conducted in the Central Laboratory of Geological Sciences at the Research Institute of Petroleum Exploration and Development.

4. Results

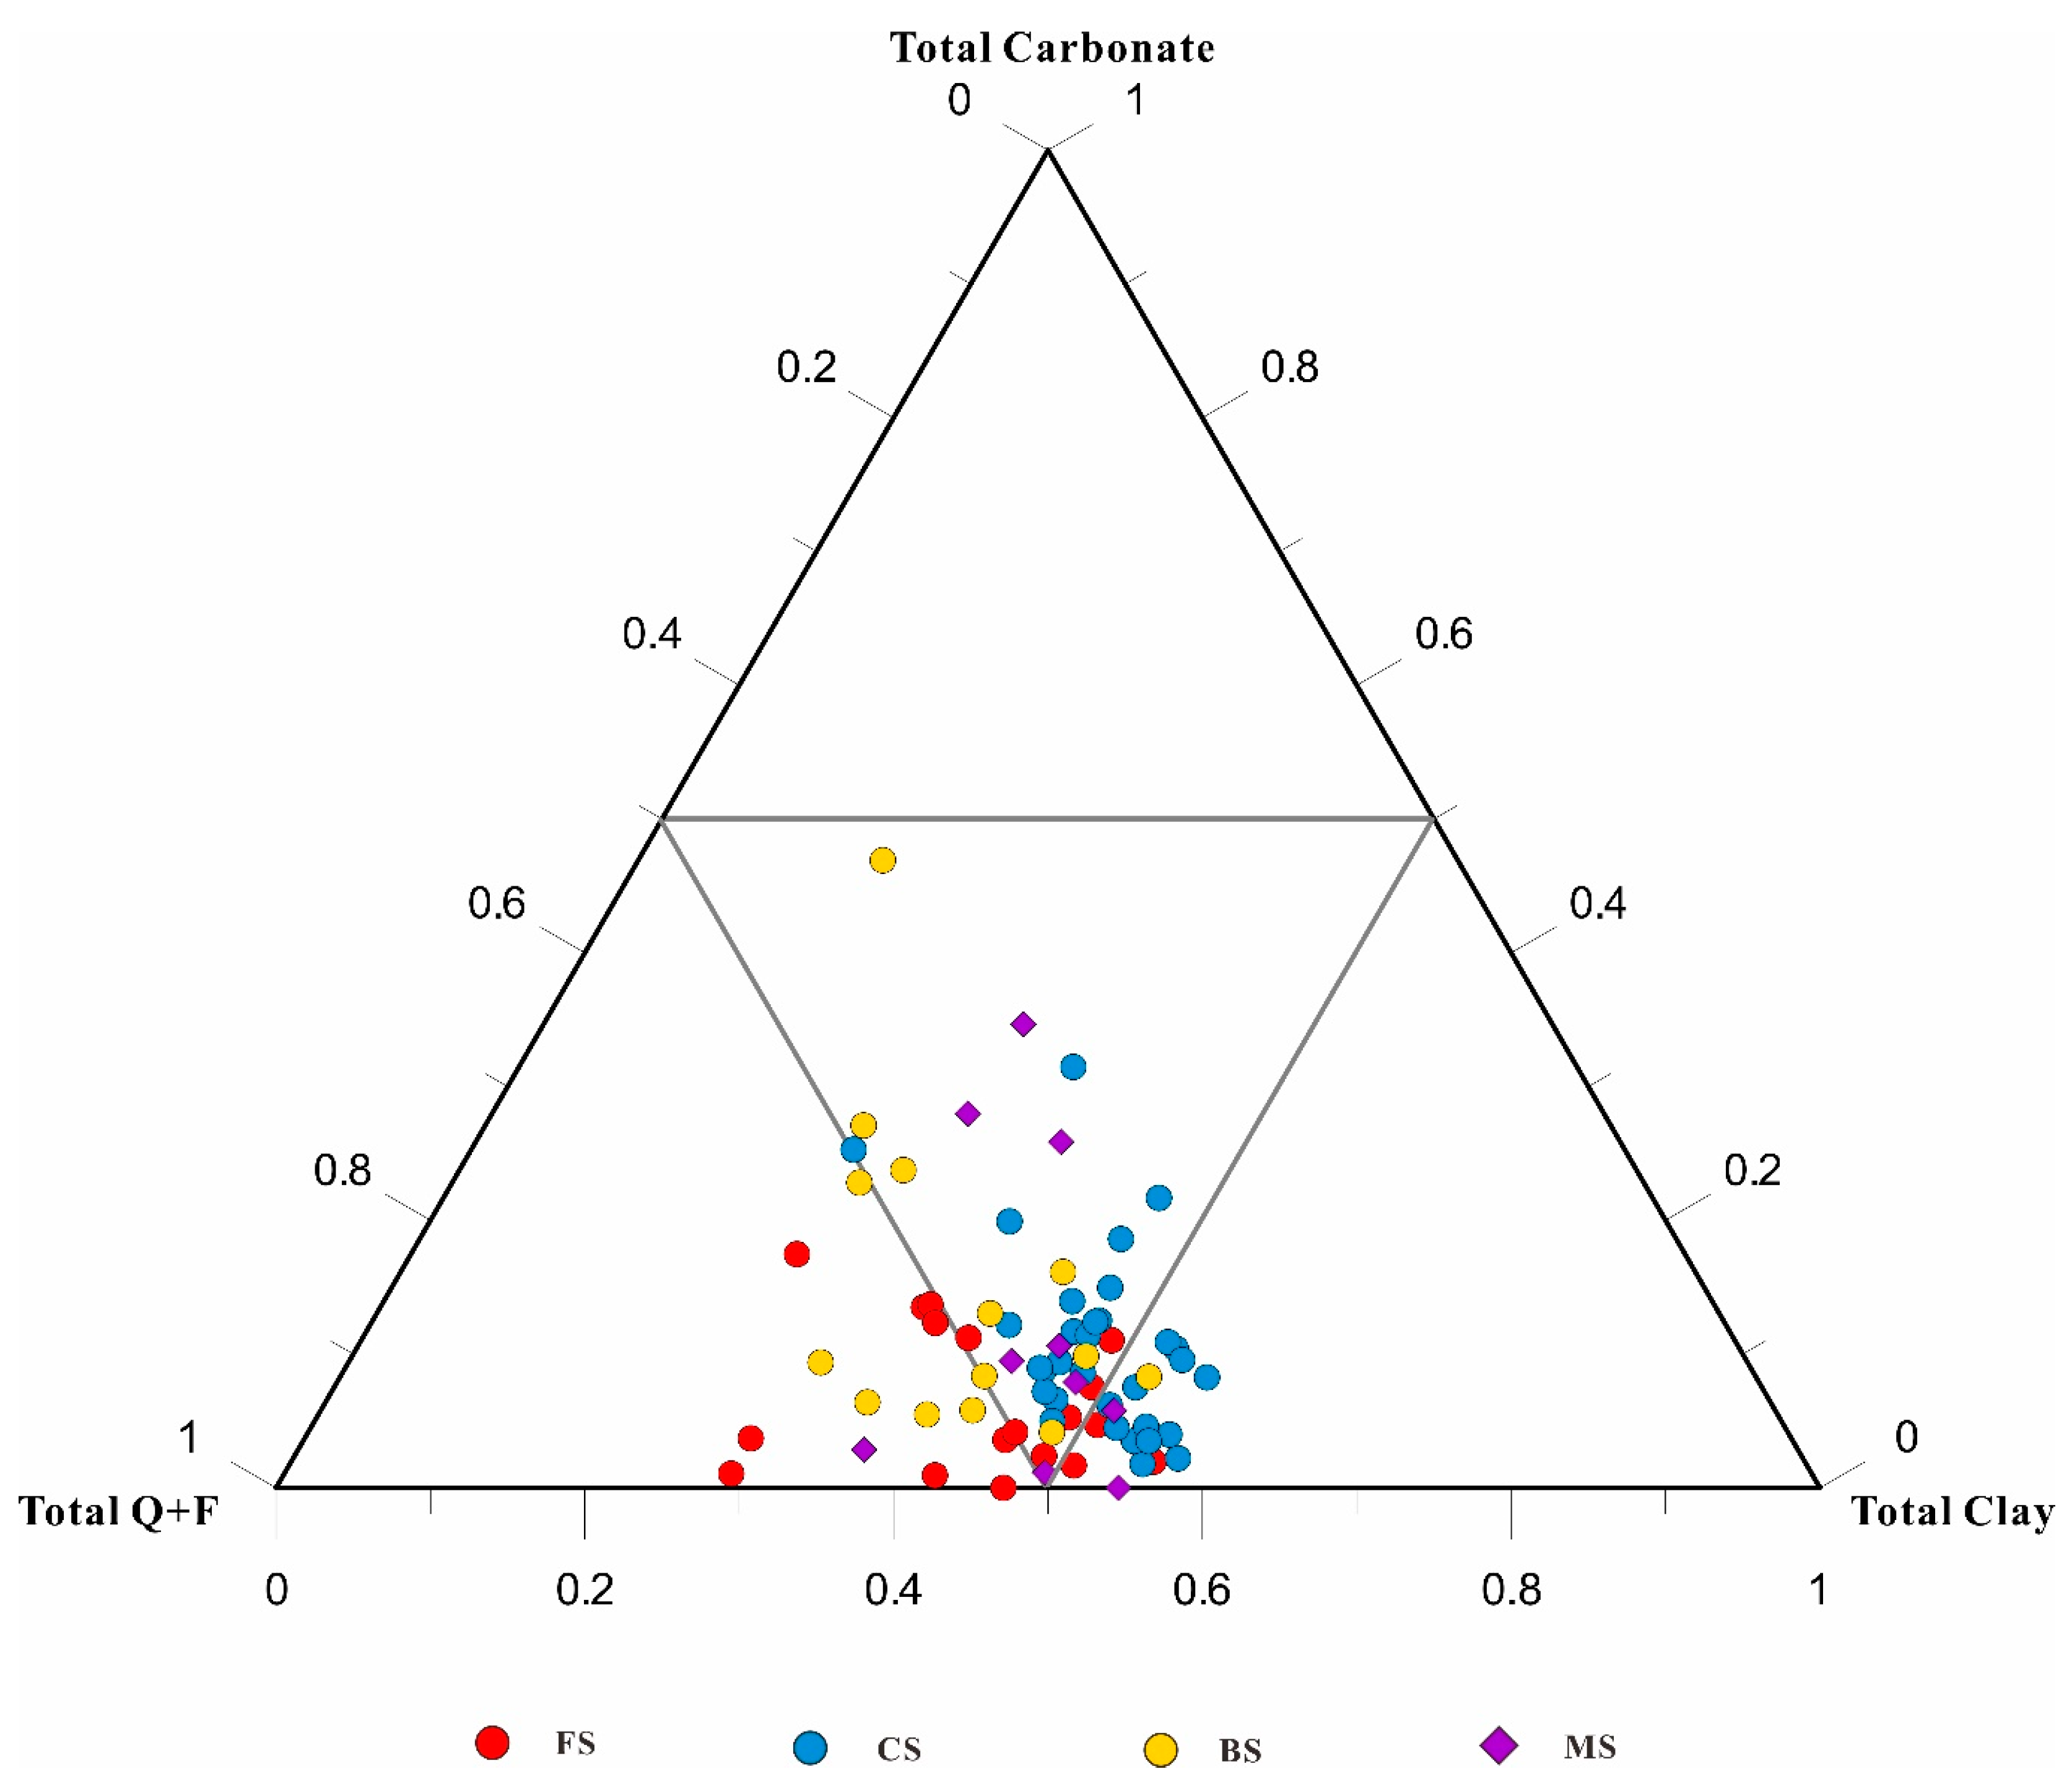
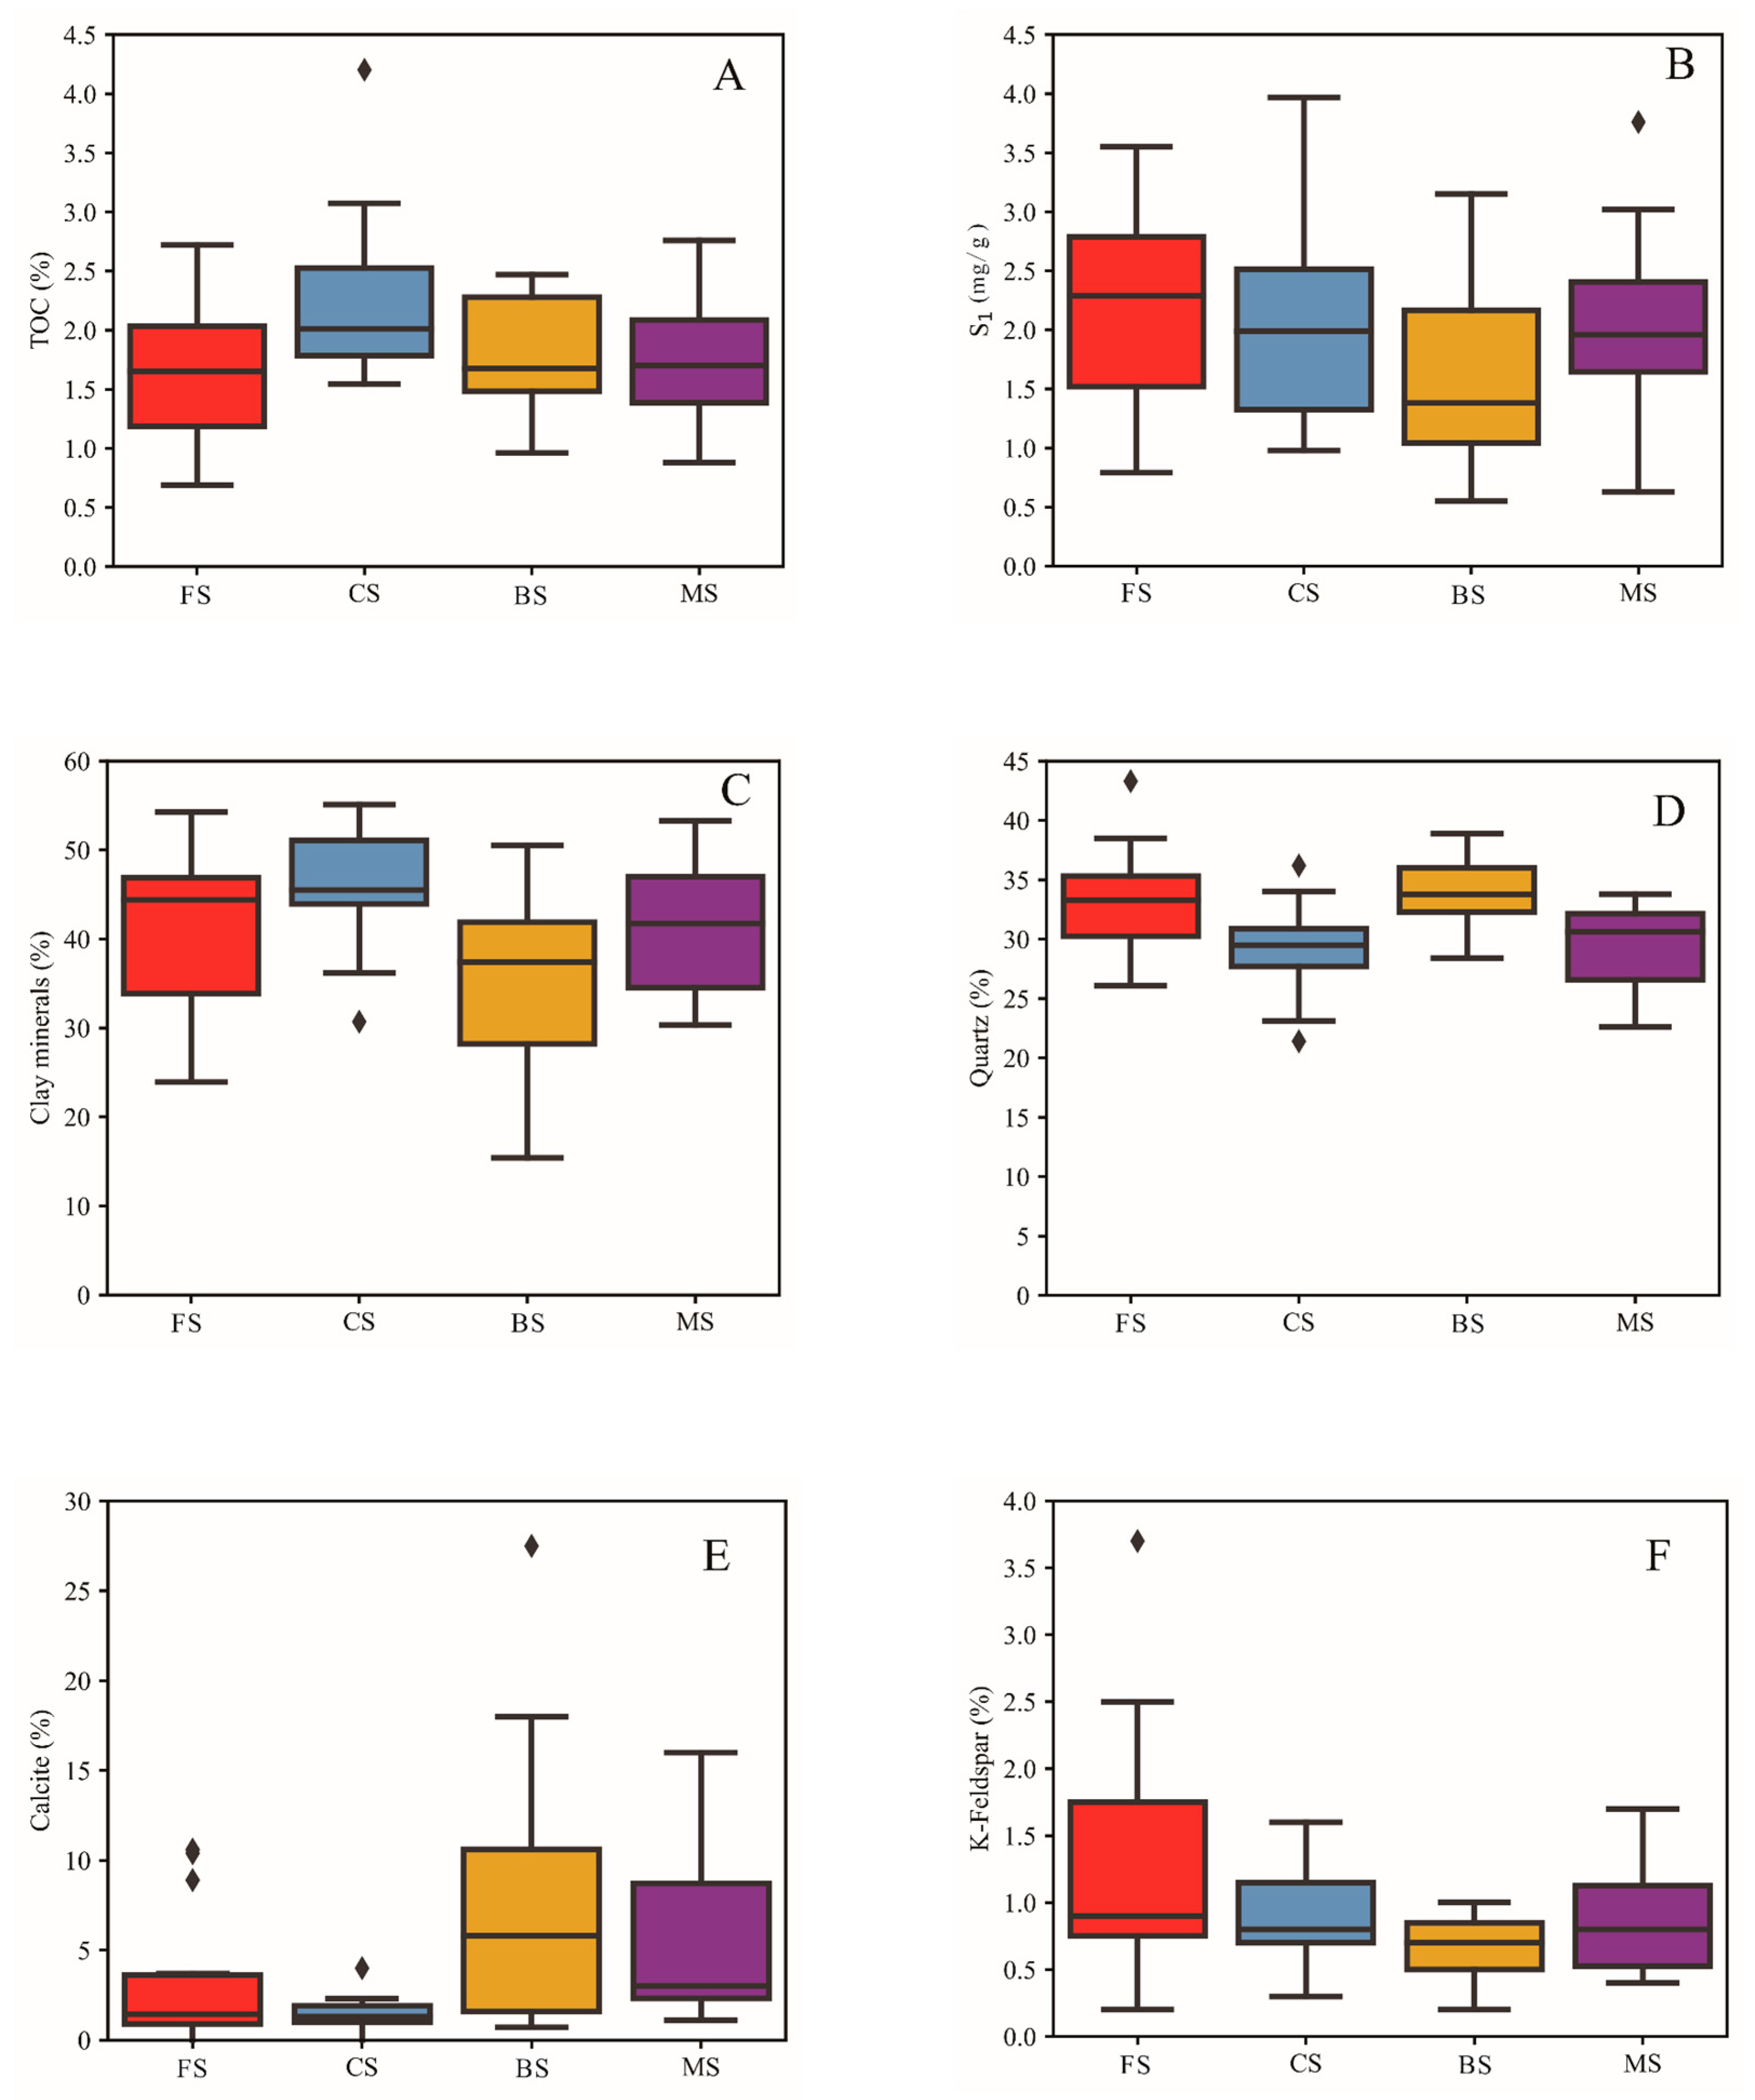
4.1. Element and Mineral Composition

Elemental analysis shows that the content of Si and Al in the Qingshankou Formation shale is relatively high, followed by Ca, Fe, and K; Mg and Mn make up small proportions (Table 1). The content of each element at different depths changes dramatically about the average value from the bottom to the top.
The mineral composition of shale in the Qingshankou Formation was dominated by clays (the content variation range is from the maximum 55.1 wt% to the minimum of 2.5 wt%, with an average value of 39.2 wt%), followed by quartz (the content variation range is from the maximum 48.4 wt% to the minimum 1.3 wt%, the average value is 29.5 wt%), and plagioclase (the content variation range is from the maximum 32.9 wt% to the minimum value 2.6 wt%, and the average value is 11.3 wt%); the carbonate mineral content varied greatly (the content variation range is the maximum 93.1 wt% to the minimum value of 0 wt%, the average value is 16.6 wt%), dolomite and iron dolomite were the main ones, and they contained a small amount of potassium feldspar, apatite, and pyrite. Clay minerals were dominated by illite (the content variation range is from the maximum value of 77 wt% to the minimum value of 27 wt%, and the average value is 57.8 wt%), followed by the illite-smectite mixed layer (the content variation range is from the maximum value of 58 wt% to the minimum value of 16 wt%, and the average value is 37.8 wt%), and it contained a small amount of chlorite (the content varies from the maximum 70 wt% to the minimum 1 wt%, and the average is 7.2 wt%).

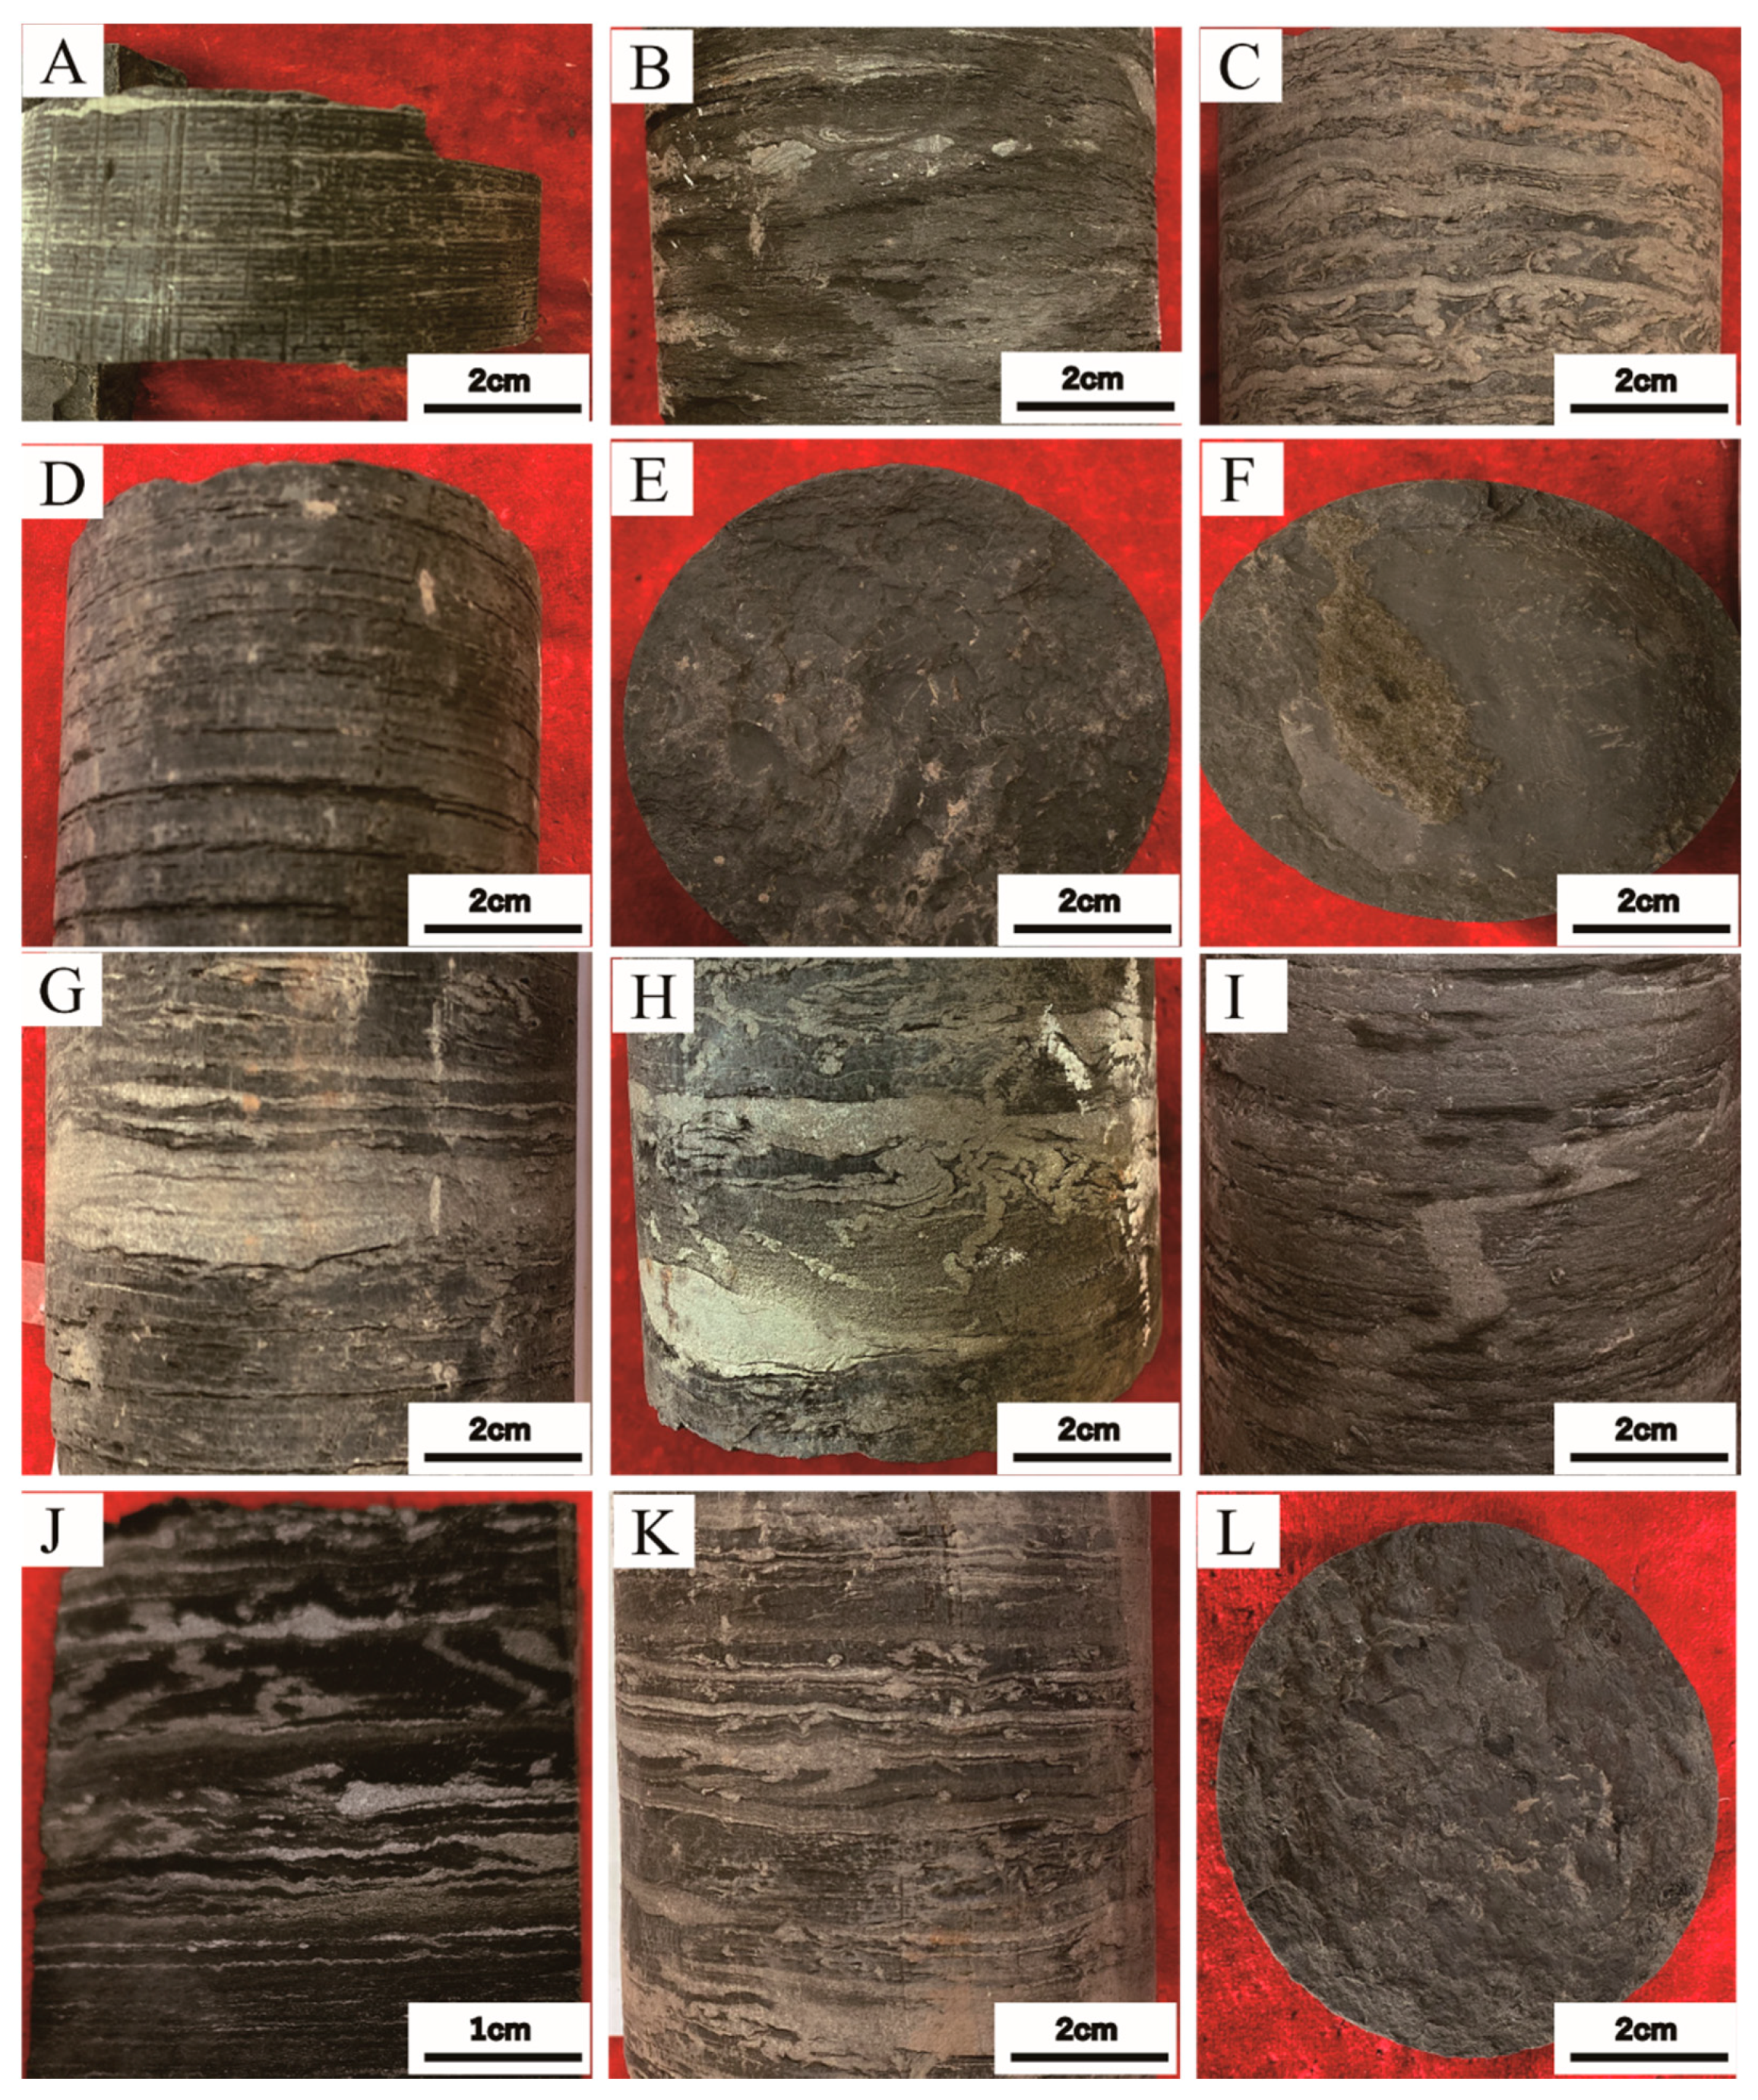
4.2. Lithofacies Divison

Based on the differences in minerals, bioclastic, and fabric of laminae [3,6], four main types of shale lithofacies were identified in the Qingshankou Formation, which are: (1) felsic shale (FS), (2) clay shale (CS), (3) bio-bearing shale (BS), and (4) mixed shale (MS) (Table 2).

4.2.1. Felsic Shale (FS)

Felsic shale mainly developed at the upper Qingshankou Formation. In hand specimens, felsic shale was grayish-black or dark gray (Figure 2A–C). The laminae that make up this lithofacies were generally contorted and sometimes straight. Lighter laminae were mainly silt–clay size quartz and feldspar, while dark laminae were mainly clay minerals. Microscopic observation showed that the debris particals account for 20 wt% to 30 wt% (also showed in Figure 3), and quartz were mainly floating among clay minerals, which were medium in roundness and sorting. The black materials were mainly clay minerals, rich in organic matter, which, mixed with clay minerals, were difficult to distinguish from each other under a microscope. The TOC values ranged from 0.69 wt% to 2.72 wt%, and the average value was 1.62 wt% (Table 2; Figure 4).

4.2.2. Clay Shale (CS)

In hand specimens, clay shale was grayish black or completely black (Figure 2D–F), and some samples comprised thin laminae with clear boundaries that consist of light organic poor but quartz rich clay laminae as well as laminae composed of dark organic-rich clay. This lithofacies had a high clay minerals content (average: 46.72 wt%) and a low quartz content (average: 29.11 wt%) (Figure 3 and Figure 4). The organic matter in this lithofacies was mainly sapropelite-rich in dark laminae, mixed with difficult to distinguish clay minerals, with the average TOC value of 2.22 wt% (ranging from 1.55 wt% to 4.20 wt%). See Table 2 and Figure 4.

4.2.3. Bio-Bearing Shale (BS)

The bio-bearing shale lithofacies was rich in fragments of ostracods. In hand specimens, this lithofacies was grayish black or dark gray (Figure 2G–I), characterized by a high calcite content between 0.70 wt% and 27.50 wt% (average: 8.17 wt%) and rare clay minerals and silts (Table 2; Figure 3 and Figure 4). Laminae were well developed and horizontal or wavy (Figure 2G), while somewhat deformed laminae and lenticular bedding were also present (Figure 2H,I). Cores and thin sections showed clear laminar boundaries, comprising pure components. Light laminae were mainly fragments of ostracods with subordinate silts, while their darker counterparts were mainly clay and organic matter. Ostracods laminae were mainly fragments of ostracods; the shape of fragments were imbricated or aligned because of early compaction. The TOC in this lithofacies ranged from 0.96 wt% to 2.47 wt%, and the average value was 1.78 wt% (Table 2; Figure 4).

4.2.4. Mixed Shale (MS)

The mixed shale particularly developed in the middle Qingshankou Formation. It was gray to black, poorly to well laminated (thick average 4.02 mm, range 2.5–4.8 mm), and the laminae had a sharp boundary (Figure 2J–L). The remarkable feature of these lithofacies was the mixing of particles (Figure 3). Among them, the allochthonous components mainly derived from weathering materials, mainly including clay-size to silt-size quartz and feldspar particles, terrestrial clay minerals, and organic matter; intrabasinal grains mainly include biogenic carbonate and apatite, and the organic matter produced by algae blooming in the lake basin; other components including ostracods fragments. The TOC values ranged from 0.88 wt% to 2.76 wt%, and the average TOC content was 1.75 wt% (Table 2; Figure 4).

4.3. Organic Geochemical Characteristics

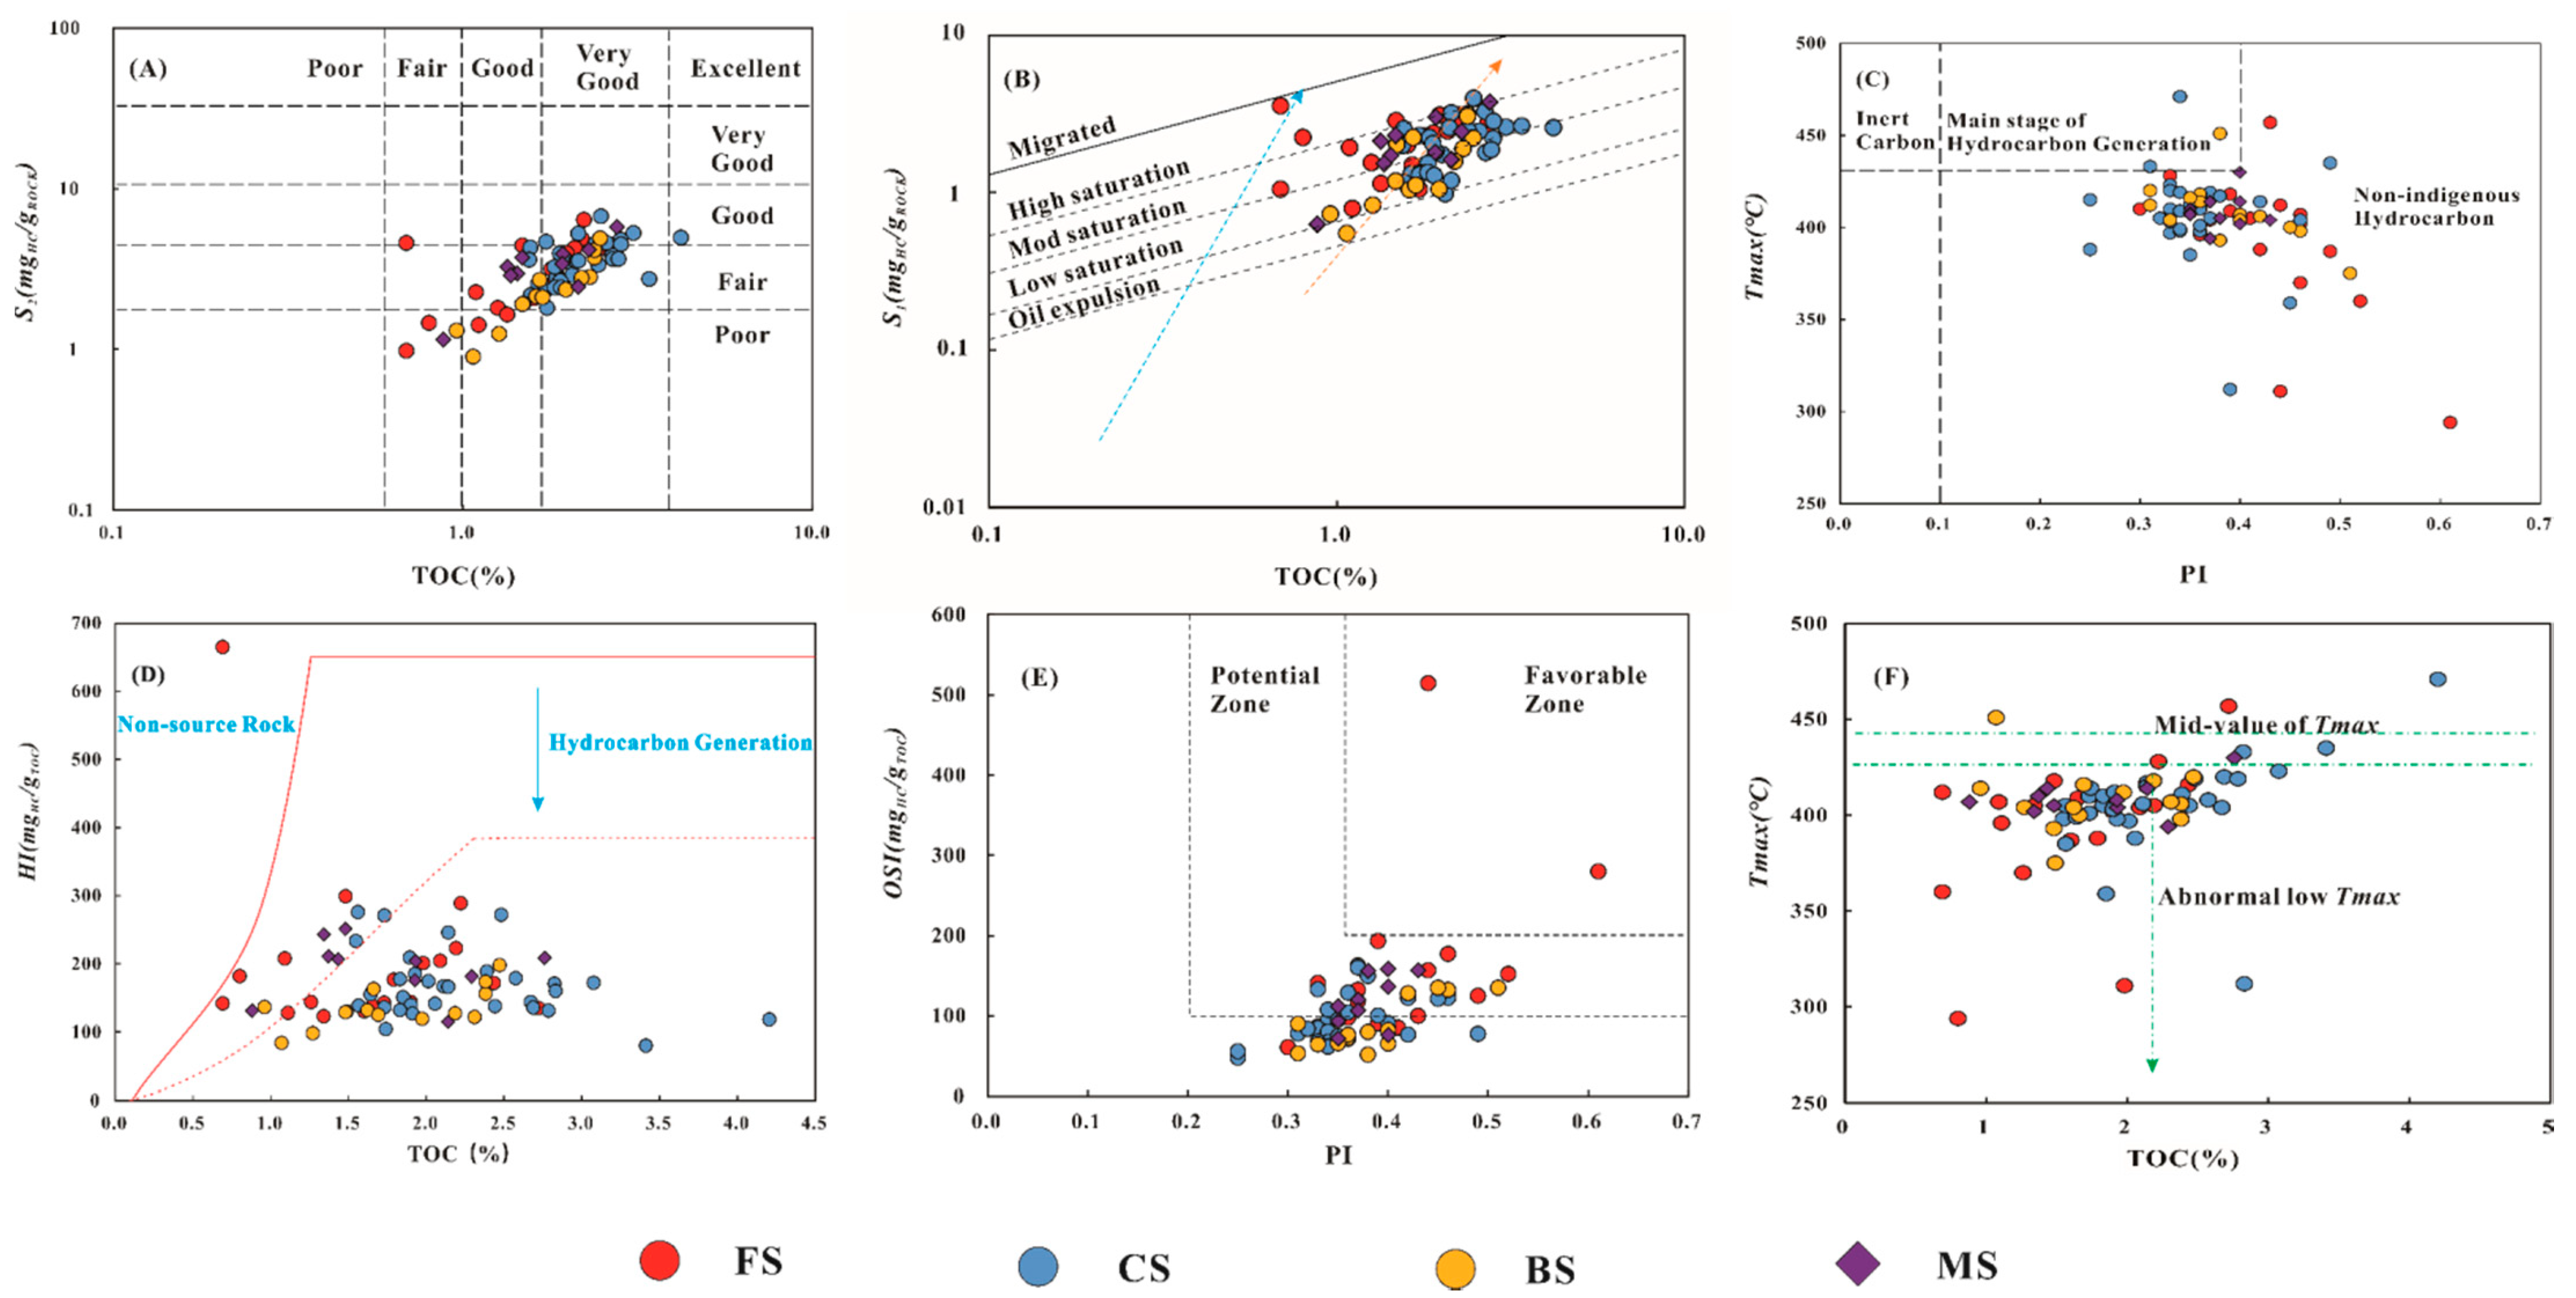
4.3.1. TOC Content and Rock-Eval Pyrolysis

The abundance of organic matter in the shales of Qingshankou Formation is relatively high. The TOC content of the samples varies from 0.17 wt% to 4.20 wt%, with an average value of 1.86 wt%, which is more concentrated in the range of 1.00 wt% to 3.00 wt%. Thermovaporized hydrocarbos (S1) content of the sample varies from 0.05 mg/g to 3.97 mg/g, with an average value of 1.87 mg/g; Thermally cracked hydrocarbons (S2) content of the sample varies from 0.15 mg/g to 7.42 mg/g, with an average value of 3.11 mg/g. The value of hydrocarbon generation potential (S1 + S2) varies from 0.2 mg/g to 10.74 mg/g, with an average value of 4.98 mg/g. The production index (PI) was calculated as PI = S1/(S1 + S2) and fluctuates between 0.17 and 0.61 with an average value of 0.37 (Figure 5).

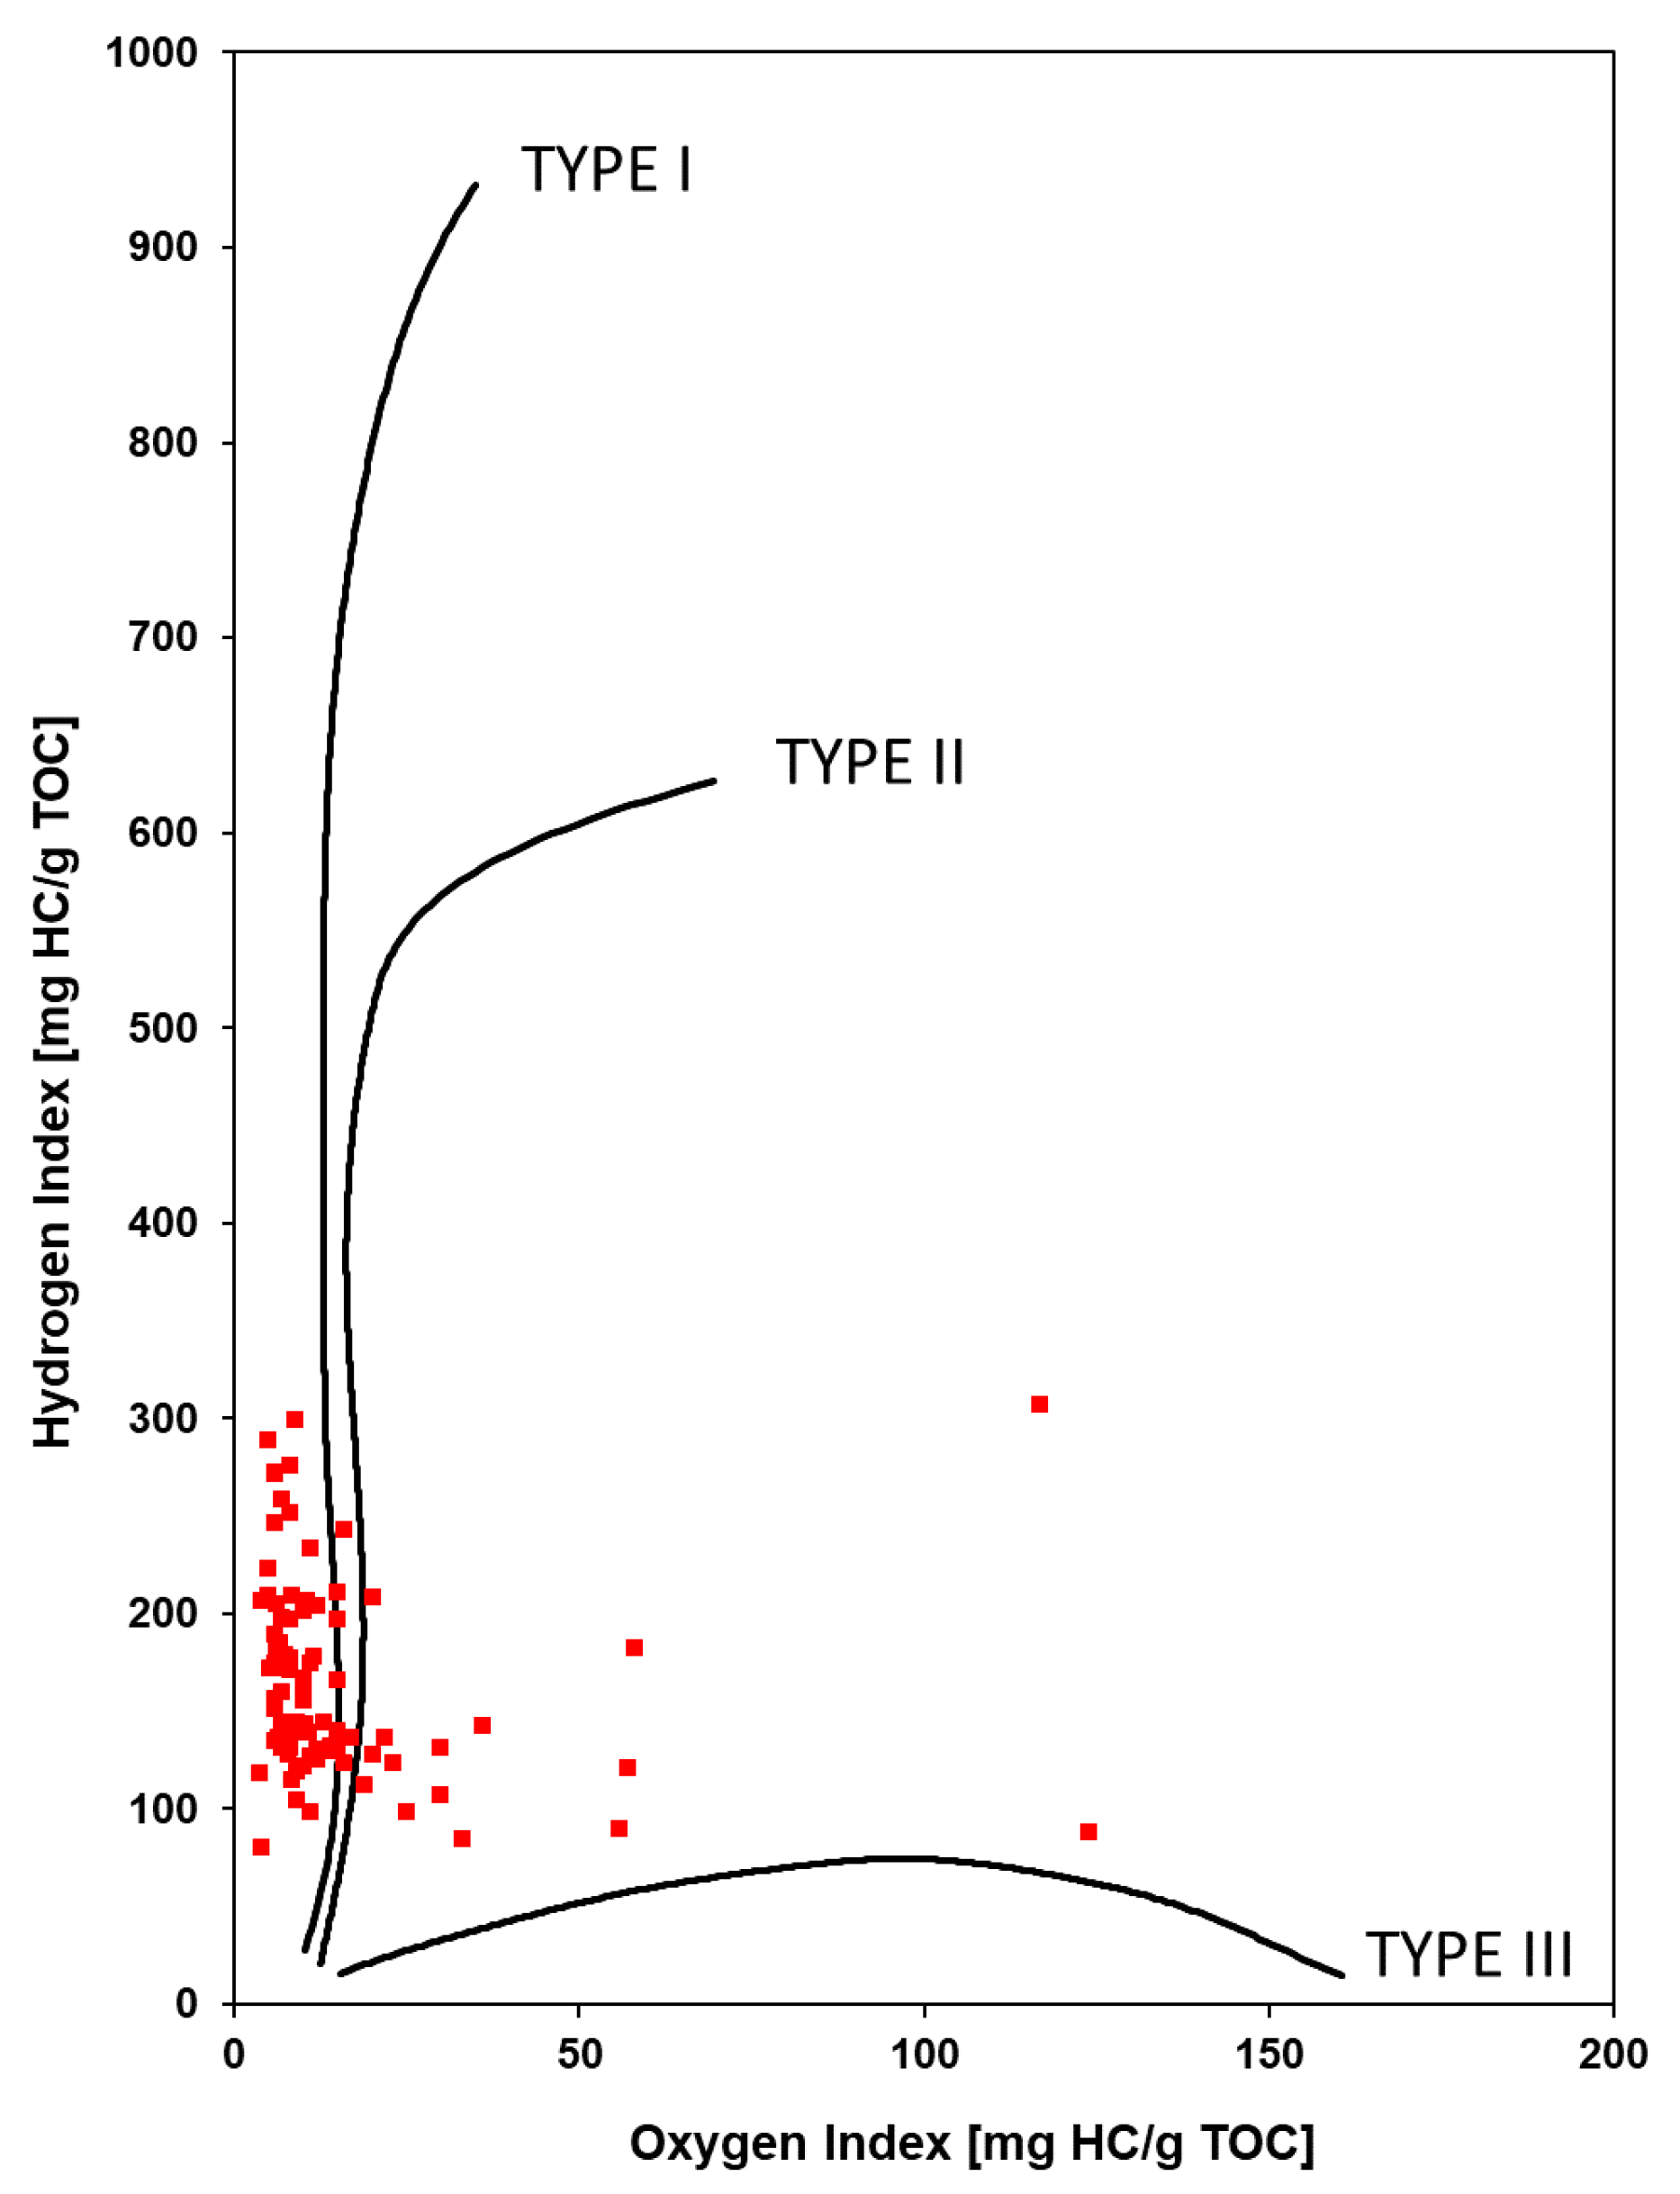
4.3.2. Organic Matter Types

In addition, Rock-Eval shows that the hydrogen index (HI) values, calculated as HI = S2/TOC, primarily ranges from 80 to 307 mg/g and oxygen index (OI) values, calculated as OI = S3/TOC, with values varying between 3.8 and 124 mg/g. Due to the oil retention in our samples, the temperature of maximum pyrolysis yield (Tmax) measured here can’t serve as a maturity parameter. Then, a scatter analysis of HI versus OI was used to determine the organic matter types, and the diagram showed the primary presence category of type I kerogens (Figure 6).

5. Discussion

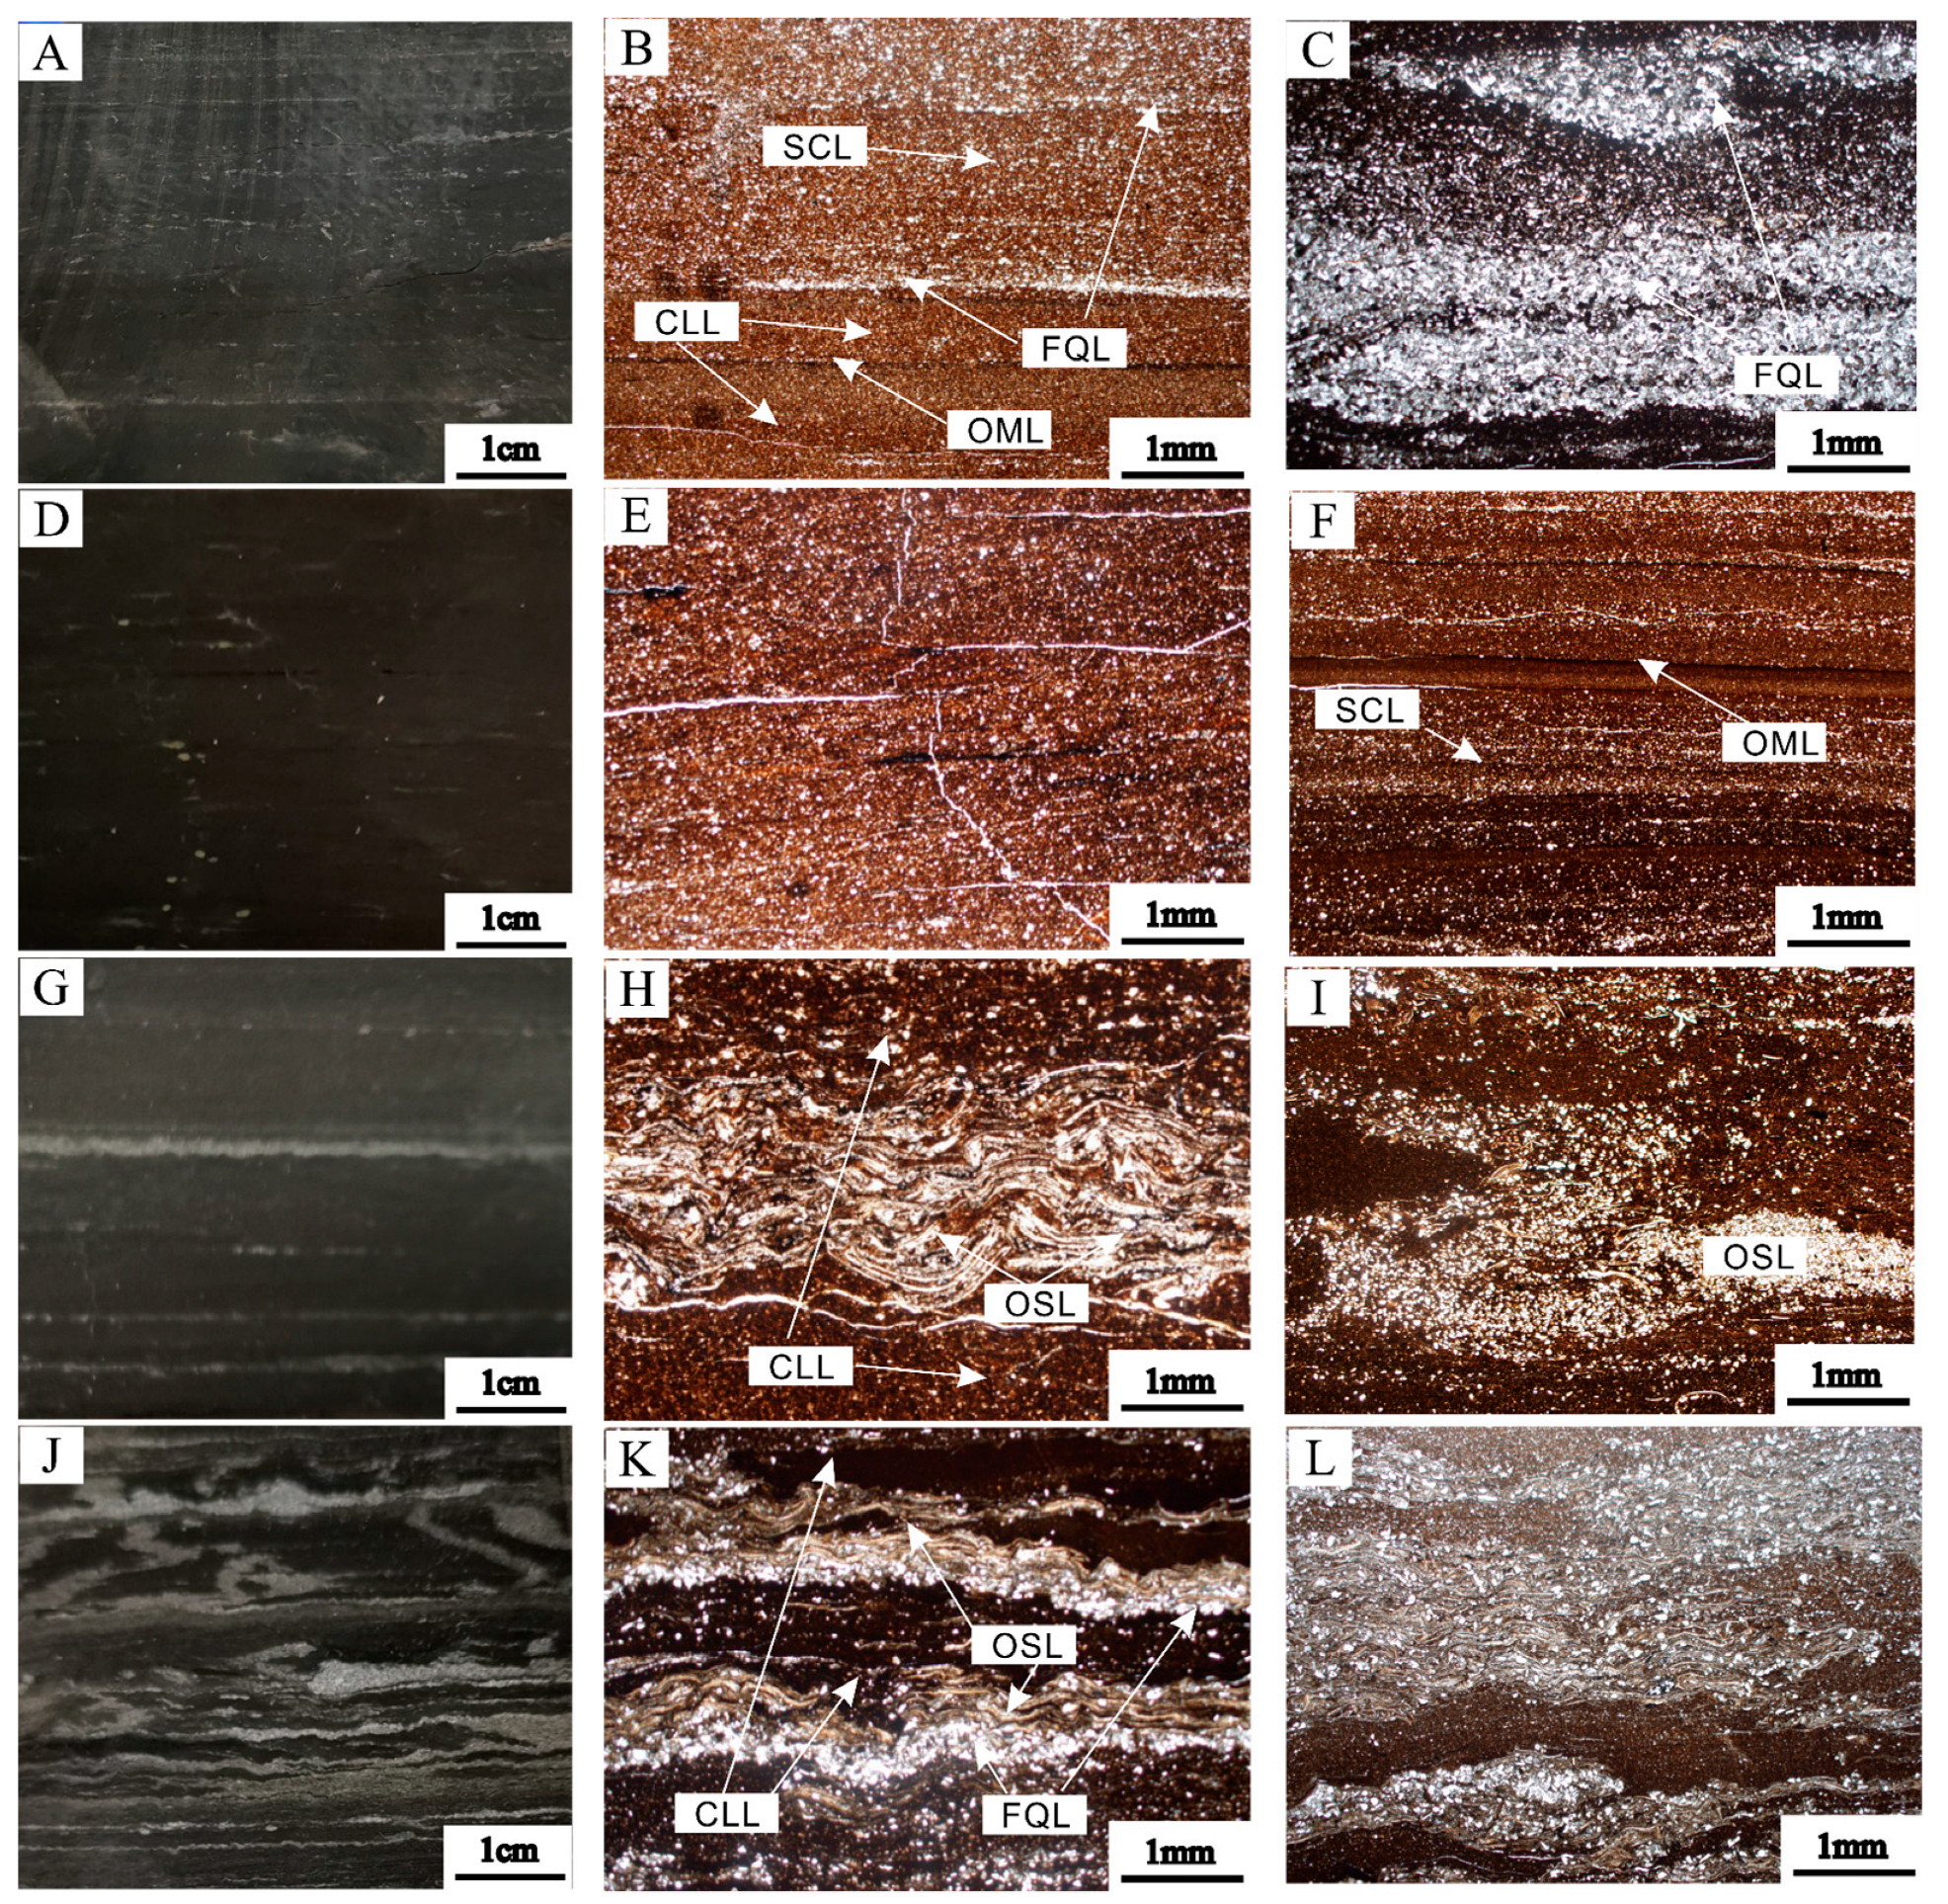
5.1. Laminae Associations in Different Lithofacies

In general, a layer with a single thickness of less than 1 cm is defined as lamina, a thickness between 1 and 10 cm is defined as bedding, and a thickness greater than 10 cm is defined as massive [37,38,39,40,41]. Lamina in shale is the most indicative sedimentary feature, indicating the deposition process of shales [42]. It is divided into horizontal, lenticular, and wavy from the thickness and shape; and divided into continuous and discontinuous according to the lateral continuity [43,44].
Based on the composition and structure of shale, the Qingshankou Formation can be divided into Feldspar and Quartz Lamination (FQL), Clay Lamination (CLL), Siliceous Clay Lamination (SCL), Ostracods Lamination (OSL), and Organic Matter Lamination (OML). The thickness is between 0.5 and 10 mm, with 2–4 mm as the main distribution interval. The laminar interface is relatively flat until microwave-like, and micron-level scouring and filling structures can be seen.
The particles of the FQL are mainly coarse silt grade, strongly cemented, and the color is bright observed under microscope; and the lamina interface is relatively straight, with medium continuity, mostly parallel distribution, and lenticular shapes can be seen locally, as well as micron-level down-cut filling structures, bio-disturbed structures, and seismic liquefaction deformation structures (Figure 7A–C).
The CLL is dominated by concentrated aggregation of clay minerals. When observed under a single-polarized microscope, the color is reddish-brown; the lamina interface is straight and has good continuity (Figure 7B,H,K).
It is worth emphasizing that the SCL, as an intermediate transition type between the FQL and the CLL, is characterized by a horizontal line of fine silt-size siliceous particles and clay minerals are mixed, and some of them show an up-finning order. The laminar interface is relatively straight, weak in continuity, and distributed mostly in parallel (Figure 7B,F).
The OSL is dominated by ostracod biological fragments, which are mixed with silt particles and clay minerals. When observed under a single-polarized microscope, the color is a pale yellow to golden. The laminar interface is microwave-like to wavy, medium continuity, and mostly parallel distribution (Figure 7H,I).
The OML is rare in the Qingshankou shale. Observed under a single-polarization microscope, the color is dark black. The lamina interface is straight, continuous, and distributed in parallel, and the thickness is generally thin (less than 100 um on average) (Figure 7B,F).
Furthermore, there are different laminar assemblages in different lithofacies. To be specific, the dual combinations of SCL and CLL are mainly developed in the FS; the dual associations of OSL and CLL are primarily found in the BS; and the ternary assemblages of FQL, OSL, and CLL can usually be seen in the MS, while the ternary assemblages of SCL, OML, and CLL can sometimes be seen in the CS. (Figure 7).

5.2. Potential for Hydrocarbon Production

TOC contents obtained here are little lower than source rocks in other areas, such as the Chang 7 shale (TOC: 2 wt%–20 wt%), and Lucaogou Formation shale (TOC: 2 wt%–16 wt%), but similar to the Uteland Butte Member shale (TOC: 2 wt%–5 wt%) [45]. The volume of hydrocarbons generated and kept determines the charge of shale oil within the source rock. FS and CS samples have a good potential for oil generation and emplacement, based on TOC and Rock-Eval S2 values. The BS and MS samples have a fair to good potential for petroleum generation (Figure 8A). The Rock-Eval S1, OSI, and PI are geochemical characteristics that have been used to assess the presence of mobile oil and provide advice to shale oil exploration. The relationship between S1 and TOC is considered to be a valuable proxy for determining whether hydrocarbons are native or have been migrated [46]. FS has different positive S1 vs. TOC correlation trends from BS, MS, and CS, as illustrated in Figure 8B. This could be the fact that these two lithofacies groupings have different sedimentary fabrics. It was discovered that FS, CS, and MS samples had very high S1 values, indicating that these rocks have a larger free hydrocarbon content. The pyrolysis Tmax vs PI plot (Figure 8C) inferred that hydrocarbons moved into these lithofacies after being generated in nearby source rocks in almost all tested samples. Furthermore, the influence of pyrolyzed migrating bitumen as the numerator results in greater HI values as well as HI and TOC trends that differ significantly from those observed in the source rocks (Figure 8D). Most FS, MS, and some CS samples had large free shale oil concentrations, as seen by the scatter plot of OSI vs PI (Figure 8E). OSI levels of up to 200 mgHC/g TOC and PI values of up to 0.5 have been found in some samples. Samples with lower estimated Tmax values had lower TOC values as a result (Figure 8F).

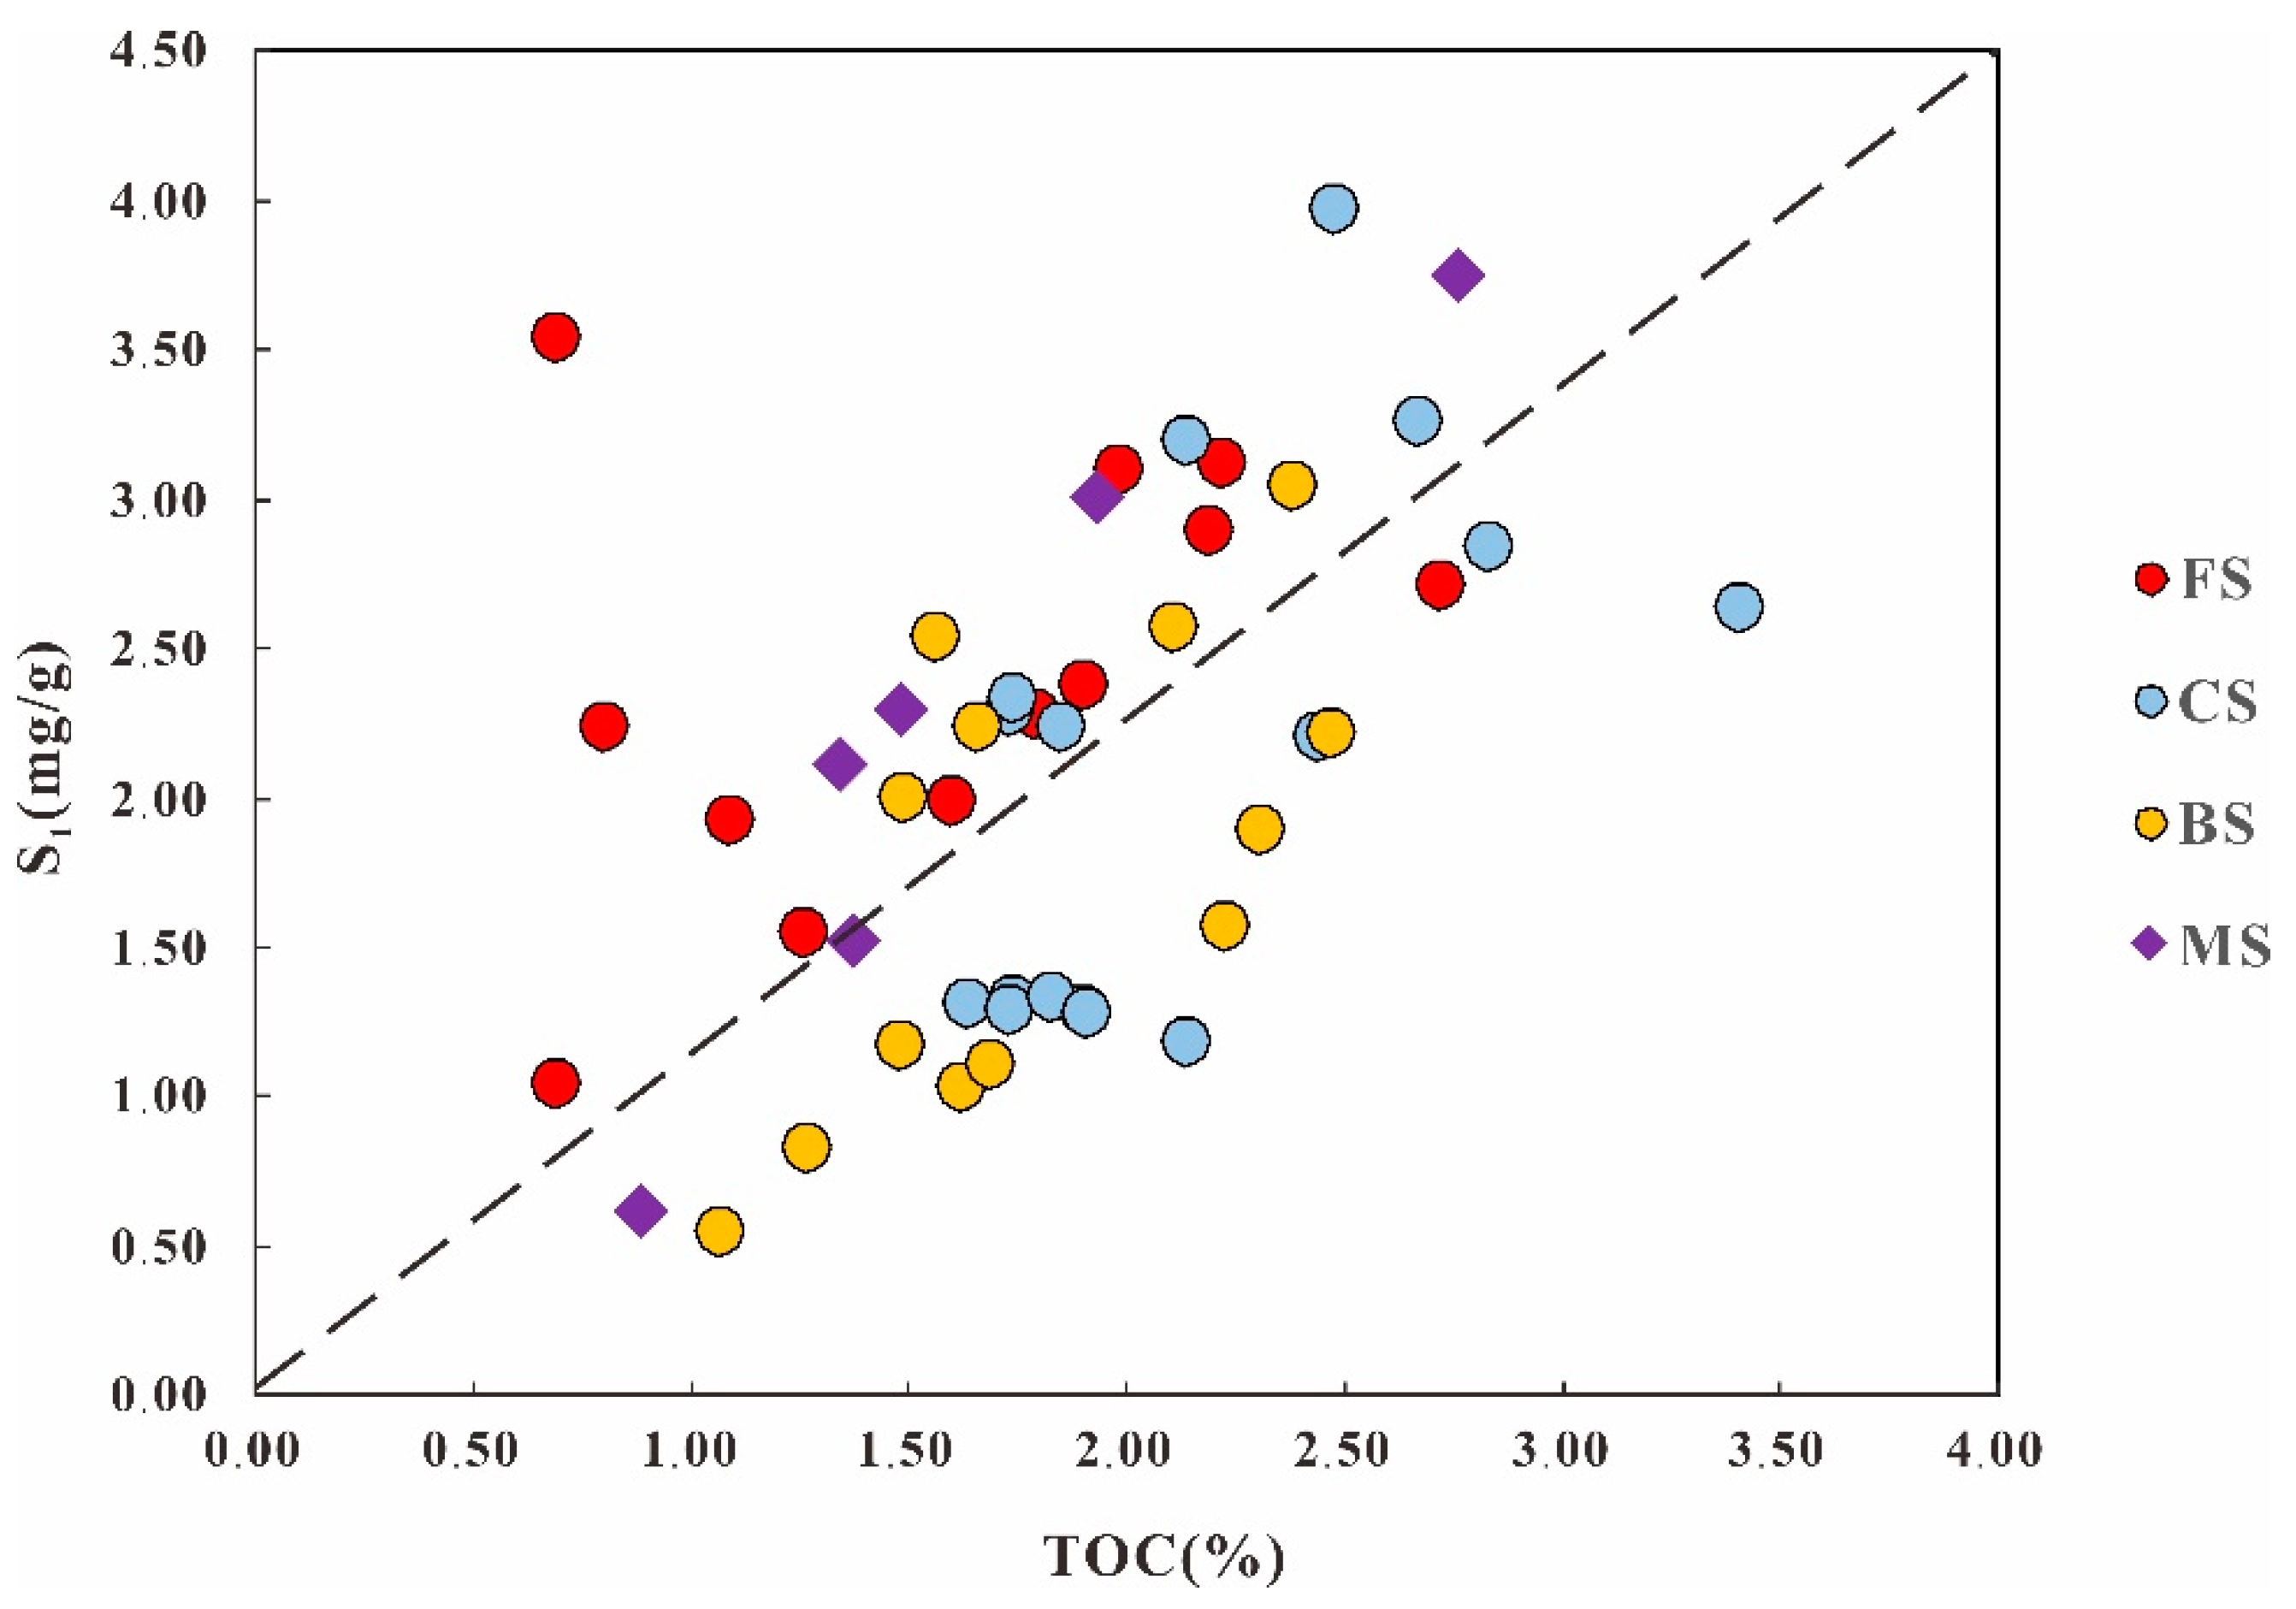
5.3. The Crossover Effect

Before the adsorption threshold is exceeded, the flow of crude oil will encounter resistance. Therefore, the characteristic of the hydrocarbon with standby flow that exceeds the adsorption capacity of organic matter (beyond the threshold) is called the crossover effect [47,48,49]. According to the profile of Eagle Ford, Marcellus, etc., in North America, high S1/TOC is an important productive character of shale oil resources, and when S1/TOC > 100 mg/g, the layer has good oil production capacity [50].
On the whole, the S1 of the samples in this study increases with the TOC value, showing a good positive correlation. It can be roughly divided into three stages: (1) stable low-value stage, rustic whose TOC is mostly below 1.0%, and S1 is generally less than 0.8 mg/g, resulting in fewer hydrocarbons produced, and most of them are adsorbed in kerogen network, so it is difficult to be effective development; (2) the rapid rise stage, TOC is 1.0–2.5 wt%. With the continuous increase of organic matter content, a large amount of storage space will be filled after the adsorption is satisfied; and (3) the stable high-value stage, TOC is generally greater than 2.5 wt%. After the corresponding S1 reaches the highest 3.97 mg/g, it begins to stabilize, which means that the shale strata have met their retention requirements, and then they begin to be discharged and migrated.
For different lithofacies types, however, their OSI variation trends are quite different. Almost all samples of FS and MS are plotted above the bisecting line, and the FS samples show a faster ascent rate than the MS samples. It is worth paying attention to the characteristics of BS and CS. The two lithofacies behave similarly, and both occupy half of the upper and lower bisectors. However, the OSI value of CS is generally higher than that of BS (Figure 9).
Considering the great oil generation potential, high free oil content (average:2.02 mg HC/g TOC, ranging from 0.98 mg HC/g TOC to 3.97 mg HC/g TOC) and the ternary lamination fabric feature of CS, it is believed that the CS may be sweet spotting lithofacies of the Qingshankou Formation in the Songliao Basin.

6. Conclusions

Four lithofacies types were identified in this study: (1) felsic shale (FS), (2) clay shale (CS), (3) bio-bearing shale (BS), and (4) mixed shale (MS). Furthermore, five types of lamination were defined: (1) Feldspar and Quartz Lamination (FQL), (2) Clay Lamination (CLL), (3) Siliceous Clay Lamination (SCL), (4) Ostracods Lamination (OSL), and (5) Organic Matter Lamination (OML). Moreover, the dual combinations of SCL and CLL are mainly developed in the FS; the dual associations of OSL and CLL are primarily found in the BS; and the ternary assemblages of FQL, OSL, and CLL can usually be seen in the MS; while the ternary assemblages of SQL, OML, and CLL can sometimes be seen in the CS.
The clay minerals content in the CS (average: 46.72 wt%) and MS (average: 41.11 wt%) was higher than that in FS (average: 39.97 wt%) and BS (average: 35.48 wt%). The lithofacies that had the highest TOC content was CS, which was followed by BS, MS, and FS. This phenomenon had something to do with the varied contents of clay minerals in different lithofacies, because of the better adsorption of organic matter with clay minerals.
It was discovered that FS, CS, and MS samples had very high S1 values, indicating that these rocks have larger free hydrocarbon contents. And FS has different positive S1 with TOC correlation trend from BS, MS, and CS, may resulted from these two lithofacies groups different laminae combinations. As to the hydrocarbon generation potential, CS was the best among these four lithofacies, and geochemical analysis showed that the micro-migration possibly existed within the source rocks. However, more evidences were needed to support that.

Author Contributions

Conceptualization, R.Z. and Z.L.; methodology, S.W.; formal analysis, Y.C. and C.L.; investigation, Y.C. and T.Z.; resources Y.W., S.M. and H.W.; data curation, J.Z.; writing—original draft preparation, Y.C., S.W. and Q.Z.; writing—review and editing, S.W.; visualization, J.Z.; supervision, S.W., R.Z. and Z.L.; project administration, R.Z. and S.W.; funding acquisition, R.Z. All authors have read and agreed to the published version of the manuscript.

Funding

This research was funded by National Natural Science Foundation of China (No. 42090025) and Major Science and Technology Project of China National Petroleum Corporation [Grant No. 2021DQ0405].

Data Availability Statement

Data will be made available upon request.

Acknowledgments

We would like to thank CNPC for the permission for the release of this study, and show our great gratitude to He Liu, China Engineering Society, and Wenyuan He, Daqing Oilfield, for their support and scientific guidance. We appreciate Zhengwu Liu, Fazi Chen, Shan Li, and Yongqiang Cao from China University of Geosciences, Beijing, China, for their help during the XRF data collection; and Lihua Ding, Fulin Zhai, Modi Guan, Ganlin Hua, and Xiaohua Jiang from RIPED, CNPC, Beijing, China, for their help during the sample analysis. We appreciate the valuable comments from the editors and anonymous reviewers.

Conflicts of Interest

The authors declare no conflict of interest.

References

  1. Hickey, J.J.; Henk, B. Lithofacies Summary of the Mississippian Barnett Shale, Mitchell 2 T.P. Sims Well, Wise County, Texas. Bulletin 2007, 91, 437–443. [Google Scholar] [CrossRef]
  2. Macquaker, J.H.S. A Lithofacies Study of the Peterborough Member, Oxford Clay Formation (Jurassic), UK: An Example of Sediment Bypass in a Mudstone Succession. J. Geol. Soc. 1994, 151, 161–172. [Google Scholar] [CrossRef]
  3. Abouelresh, M.O.; Slatt, R.M. Lithofacies and Sequence Stratigraphy of the Barnett Shale in East-Central Fort Worth Basin, TexasGeohorizon. AAPG Bull. 2012, 96, 1–22. [Google Scholar] [CrossRef]
  4. Zou, C.; Pan, S.; Horsfield, B.; Yang, Z.; Hao, S.; Liu, E.; Zhang, L. Oil Retention and Intrasource Migration in the Organic-Rich Lacustrine Chang 7 Shale of the Upper Triassic Yanchang Formation, Ordos Basin, Central China. Bulletin 2019, 103, 2627–2663. [Google Scholar] [CrossRef]
  5. Pan, S.; Zou, C.; Li, J.; Yang, Z.; Liu, E.; Han, Y. Unconventional Shale Systems: A Comparative Study of the “in-Source Sweet Spot” Developed in the Lacustrine Chang 7 Shale and the Marine Barnett Shale. Mar. Pet. Geol. 2019, 100, 540–550. [Google Scholar] [CrossRef]
  6. Loucks Robert, G.; Ruppel Stephen, C. Mississippian Barnett Shale: Lithofacies and Depositional Setting of a Deep-Water Shale-Gas Succession in the Fort Worth Basin, Texas. AAPG Bull. 2007, 91, 579–601. [Google Scholar] [CrossRef] [Green Version]
  7. Doyle, J.D.; Sweet, M.L. Three-Dimensional Distribution of Lithofacies, Bounding Surfaces, Porosity, and Permeability in a Fluvial Sandstone—Gypsy Sandstone of Northern Oklahoma. AAPG Bull. 1995, 79, 70–95. [Google Scholar] [CrossRef]
  8. Beydoun, Z.R.; Bamahmoud, M.O.; Nani, A.S.O. The Qishn Formation, Yemen: Lithofacies and Hydrocarbon Habitat. Mar. Pet. Geol. 1993, 10, 364–372. [Google Scholar] [CrossRef]
  9. Dapples, E.C. General Lithofacies Relationship of St. Peter Sandstone and Simpson Group1. AAPG Bull. 1955, 39, 444–467. [Google Scholar] [CrossRef]
  10. Okoro, A.U.; Igwe, E.O. Lithofacies and Depositional Environment of the Amasiri Sandstone, Southern Benue Trough, Nigeria. J. Afr. Earth Sci. 2014, 100, 179–190. [Google Scholar] [CrossRef]
  11. Southgate, P.N. A Model for the Development of Phosphatic and Calcareous Lithofacies in the Middle Cambrian Thorntonia Limestone, Northeast Georgina Basin, Australia. Aust. J. Earth Sci. 1988, 35, 111–130. [Google Scholar] [CrossRef]
  12. Scasso, R.A.; Aberhan, M.; Ruiz, L.; Weidemeyer, S.; Medina, F.A.; Kiessling, W. Integrated Bio- and Lithofacies Analysis of Coarse-Grained, Tide-Dominated Deltaic Environments across the Cretaceous/Paleogene Boundary in Patagonia, Argentina. Cretac. Res. 2012, 36, 37–57. [Google Scholar] [CrossRef]
  13. Zhang, T.; Fu, Q.; Sun, X.; Hackley, P.C.; Ko, L.T.; Shao, D. Meter-Scale Lithofacies Cycle and Controls on Variations in Oil Saturation, Wolfcamp A, Delaware and Midland Basins. AAPG Bull. 2021, 105, 1821–1846. [Google Scholar] [CrossRef]
  14. Ou, C.; Li, C.; Rui, Z.; Ma, Q. Lithofacies Distribution and Gas-Controlling Characteristics of the Wufeng–Longmaxi Black Shales in the Southeastern Region of the Sichuan Basin, China. J. Pet. Sci. Eng. 2018, 165, 269–283. [Google Scholar] [CrossRef]
  15. Qiu, Z.; Tao, H.; Zou, C.; Wang, H.; Ji, H.; Zhou, S. Lithofacies and Organic Geochemistry of the Middle Permian Lucaogou Formation in the Jimusar Sag of the Junggar Basin, NW China. J. Pet. Sci. Eng. 2016, 140, 97–107. [Google Scholar] [CrossRef]
  16. Macquaker, J.H.S.; Taylor, K.G. A Sequence-Stratigraphic Interpretation of a Mudstone-Dominated Succession: The Lower Jurassic Cleveland Ironstone Formation, UK. J. Geol. Soc. 1996, 153, 759–770. [Google Scholar] [CrossRef]
  17. Macquaker, J.H.S.; Gawthorpe, R.L. Mudstone Lithofacies in the Kimmeridge Clay Formation, Wessex Basin, Southern England: Implications for the Origin and Controls of the Distribution of Mudstones. J. Sediment. Res. 1993, 63, 1129–1143. [Google Scholar] [CrossRef]
  18. Williams, T.S.; Bhattacharya, S.; Song, L.; Agrawal, V.; Sharma, S. Petrophysical Analysis and Mudstone Lithofacies Classification of the HRZ Shale, North Slope, Alaska. J. Pet. Sci. Eng. 2022, 208, 109454. [Google Scholar] [CrossRef]
  19. Song, Z.; Li, J.; Li, X.; Chen, K.; Wang, C.; Li, P.; Wei, Y.; Zhao, R.; Wang, X.; Zhang, S.; et al. Coupling Relationship between Lithofacies and Brittleness of the Shale Oil Reservoir: A Case Study of the Shahejie Formation in the Raoyang Sag. Geofluids 2022, 2022, 1–17. [Google Scholar] [CrossRef]
  20. Hou, H.; Shao, L.; Li, Y.; Liu, L.; Liang, G.; Zhang, W.; Wang, X.; Wang, W. Effect of Paleoclimate and Paleoenvironment on Organic Matter Accumulation in Lacustrine Shale: Constraints from Lithofacies and Element Geochemistry in the Northern Qaidam Basin, NW China. J. Pet. Sci. Eng. 2022, 208, 109350. [Google Scholar] [CrossRef]
  21. Tewari, S.; Dwivedi, U.D. A Comparative Study of Heterogeneous Ensemble Methods for the Identification of Geological Lithofacies. J. Petrol. Explor. Prod. Technol. 2020, 10, 1849–1868. [Google Scholar] [CrossRef] [Green Version]
  22. Liu, X.Y.; Zhou, L.; Chen, X.H.; Li, J.Y. Lithofacies Identification Using Support Vector Machine Based on Local Deep Multi-Kernel Learning. Pet. Sci. 2020, 17, 954–966. [Google Scholar] [CrossRef]
  23. Bhattacharya, S.; Carr, T.R.; Pal, M. Comparison of Supervised and Unsupervised Approaches for Mudstone Lithofacies Classification: Case Studies from the Bakken and Mahantango-Marcellus Shale, USA. J. Nat. Gas Sci. Eng. 2016, 33, 1119–1133. [Google Scholar] [CrossRef] [Green Version]
  24. Buchheim, H.P.; Awramik, S.M. Stevensite, Oolite, and Microbialites in the Eocene Green River Formation, Sanpete Valley, Uinta Basin, Utah. In Proceedings of the AAPG Annual Convention and Exhibition, Houston, TX, USA, 6–9 April 2014; p. 31. [Google Scholar]
  25. Birdwell, J.E.; Berg, M.D.V.; Johnson, R.C.; Mercier, T.J.; Boehlke, A.R.; Brownfield, M.E. Geological, Geochemical, and Reservoir Characterization of the Uteland Butte Member of the Green River Formation, Uinta Basin, Utah. In Hydrocarbon Source Rocks in Unconventional Plays, Rocky Mountain Region; Rocky Mountain Association of Geologists: Denver, CO, USA, 2016; p. 28. [Google Scholar]
  26. Johnson, R.C. Petroleum Generation and Migration from the Oil Shale Interval of the Eocene Green River Formation, Uinta Basin, Utah. In Proceedings of the AAPG Pacific Section and Rocky Mountain Section Joint Meeting, Las Vegas, NV, USA, 2 October 2016; p. 62. [Google Scholar]
  27. Keighley, D.; Flint, S.; Howell, J.; Moscariello, A. Sequence Stratigraphy in Lacustrine Basins: A Model for Part of the Green River Formation (Eocene), Southwest Uinta Basin, Utah, U.S.A. J. Sediment. Res. 2003, 73, 987–1006. [Google Scholar] [CrossRef]
  28. Navsuu-Milkeviciene, K.T.; Sarg, J.F.; Bartov, Y. Depositional Cycles and Sequences In An Organic-Rich Lake Basin: Eocene Green River Formation, Lake Uinta, Colorado and Utah, U.S.A. J. Sediment. Res. 2017, 87, 210–229. [Google Scholar] [CrossRef]
  29. Zou, C.; Zhu, R.; Chen, Z.-Q.; Ogg, J.G.; Wu, S.; Dong, D.; Qiu, Z.; Wang, Y.; Wang, L.; Lin, S.; et al. Organic-Matter-Rich Shales of China. Earth-Sci. Rev. 2019, 189, 51–78. [Google Scholar] [CrossRef]
  30. Sun, L.; Liu, H.; He, W.; Li, G.; Zhang, S.; Zhu, R.; Jin, X.; Meng, S.; Jiang, H. An Analysis of Major Scientific Problems and Research Paths of Gulong Shale Oil in Daqing Oilfield, NE China. Pet. Explor. Dev. 2021, 48, 527–540. [Google Scholar] [CrossRef]
  31. Liu, B.; Wang, H.; Fu, X.; Bai, Y.; Bai, L.; Jia, M.; He, B. Lithofacies and Depositional Setting of a Highly Prospective Lacustrine Shale Oil Succession from the Upper Cretaceous Qingshankou Formation in the Gulong Sag, Northern Songliao Basin, Northeast China. AAPG Bulletin 2019, 103, 405–432. [Google Scholar] [CrossRef] [Green Version]
  32. Liu, C.; Wang, Z.; Guo, Z.; Hong, W.; Dun, C.; Zhang, X.; Li, B.; Wu, L. Enrichment and Distribution of Shale Oil in the Cretaceous Qingshankou Formation, Songliao Basin, Northeast China. Mar. Pet. Geol. 2017, 86, 751–770. [Google Scholar] [CrossRef]
  33. Wang, P.-J.; Mattern, F.; Didenko, N.A.; Zhu, D.-F.; Singer, B.; Sun, X.-M. Tectonics and Cycle System of the Cretaceous Songliao Basin: An Inverted Active Continental Margin Basin. Earth-Sci. Rev. 2016, 159, 82–102. [Google Scholar] [CrossRef] [Green Version]
  34. Zhang, J.; Guo, J.; Li, Y.; Sun, Z. 3D-Basin Modeling of the Changling Depression, NE China: Exploring Petroleum Evolution in Deep Tight Sandstone Reservoirs. Energies 2019, 12, 1043. [Google Scholar] [CrossRef] [Green Version]
  35. Wu, H.; Zhang, S.; Jiang, G.; Huang, Q. The Floating Astronomical Time Scale for the Terrestrial Late Cretaceous Qingshankou Formation from the Songliao Basin of Northeast China and Its Stratigraphic and Paleoclimate Implications. Earth Planet. Sci. Lett. 2009, 278, 308–323. [Google Scholar] [CrossRef]
  36. Dean, W.E.; Gardner, J.V.; Piper, D.Z. Inorganic Geochemical Indicators of Glacial-Interglacial Changes in Productivity and Anoxia on the California Continental Margin. Geochim. Cosmochim. Acta 1997, 61, 4507–4518. [Google Scholar] [CrossRef]
  37. Folk, R.L. Petrology of Sedimentary Rocks; Hemphill Publishing Company: Austin, TX, USA, 1980; ISBN 978-0-914696-14-8. [Google Scholar]
  38. Ingram, R.L. Fissility of mudrocks. GSA Bull. 1953, 64, 869–878. [Google Scholar] [CrossRef]
  39. O’Brien, N.R.; Slatt, R.M. Argillaceous Rock Atlas; Springer Science & Business Media: Berlin/Heidelberg, Germany, 2012; ISBN 978-1-4612-3422-7. [Google Scholar]
  40. Potter, P.E.; Maynard, J.B.; Depetris, P.J. Mud and Mudstones: Introduction and Overview; Springer Science & Business Media: Berlin/Heidelberg, Germany, 2005; ISBN 978-3-540-27082-9. [Google Scholar]
  41. Stow, D.A.V. Sedimentary Rocks in the Field: A Color Guide; Gulf Professional Publishing: Houston, TX, USA, 2005; ISBN 978-0-12-369451-5. [Google Scholar]
  42. Schieber, J.; Zimmerle, W.; Sethi, P.S. Shales and Mudstones, Vol. 1: Basin Studies, Sedimentology, and Palentology; E. Schweizerbart’sche: Stuttgart, Germany, 1998; ISBN 978-3-510-65181-8. [Google Scholar]
  43. Lazar, O.R.; Bohacs, K.M.; Macquaker, J.H.S.; Schieber, J.; Demko, T.M. Capturing Key Attributes of Fine-Grained Sedimentary Rocks In Outcrops, Cores, and Thin Sections: Nomenclature and Description Guidelines. J. Sediment. Res. 2015, 85, 230–246. [Google Scholar] [CrossRef] [Green Version]
  44. Li, M.; Wu, S.; Hu, S.; Zhu, R.; Meng, S.; Yang, J. Lamination Texture and Its Effects on Reservoir and Geochemical Properties of the Palaeogene Kongdian Formation in the Cangdong Sag, Bohai Bay Basin, China. Minerals 2021, 11, 1360. [Google Scholar] [CrossRef]
  45. Li, M.; Chen, X. A Comparison of Geological Characteristics of the Main Continental Shale Oil in China and the U.S. Lithosphere 2021, 2021, 3377705. [Google Scholar] [CrossRef]
  46. Espitalie, J.; Madec, M.; Tissot, B.; Mennig, J.J.; Leplat, P. Source Rock Characterization Method for Petroleum Exploration. In Proceedings of the Offshore Technology Conference, Houston, TX, USA, 2 May 1977; Offshore Technology Conference: Houston, TX, USA, 1977. [Google Scholar]
  47. Wu, S.; Li, S.; Yuan, X.; Yang, Z.; Li, A.; Cui, J.; Pan, S.; Mao, Z.; Su, L.; Zhou, Y. Fluid Mobility Evaluation of Tight Sandstones in Chang 7 member of Yanchang Formation, Ordos Basin. J. Earth Sci. 2021, 32, 850–862. [Google Scholar] [CrossRef]
  48. Guan, M.; Wu, S.; Hou, L.; Jiang, X.; Ba, D.; Hua, G. Paleoenvironment and Chemostratigraphy Heterogenity of the Cretaceous Organic-Rich Shales. Adv. Geo-Energy Res. 2021, 5, 444–455. [Google Scholar] [CrossRef]
  49. Jiang, X.; Wu, S.; Hou, L.; Zhang, J.; Guan, M.; Zhai, F.; Guo, J.; Su, L.; Liao, F.; Ding, L. Porosity Evolution in Lacustrine Organic-Matter-Rich Shales with High Claly Minerals Content. Front. Earth Sci. 2021, 9, 7660936. [Google Scholar] [CrossRef]
  50. Jarvie, D.M. Shale Resource Systems for Oil and GasPart 2𒀔Shale-Oil Resource Systems. In Shale Reservoirs—Giant Resources for the 21st Century; American Association of Petroleum Geologists: Tulsa, OK, USA, 2012; ISBN 978-1-62981-011-9. [Google Scholar]
Figure 1. (A) Tectonic sketch map of Songliao Basin and adjacent areas. (B) Stratigraphic column of Upper Cretaceous Qingshankou Formation (modified from [30]).
Minerals 12 00465 g001
Figure 2. Photographs of cores to show the characteristics of different lithofacies. (AC) Felsic shale, (DF) clay shale, (GI) bio-bearing shale, and (JL) mixed shale.
Minerals 12 00465 g002
Figure 3. Ternary plot to show the whole-rock mineral composition of different lithofacies in study area (Q = quartz; F = feldspar).
Minerals 12 00465 g003
Figure 4. Total organic carbon (TOC), Thermovaporized hydrocarbos (S1) and mineralogy distinctions among different lithofacies. Red: felsic shale (FS). Blue: clay shale (CS). Yellow: bio-bearing shale (BS). Purple: mixed shale (MS). Black rhombs: outlier data points. (A) TOC content differences among different lithofacies. (B) S1 content differences among different lithofacies. (C) Clay minerals content differences among different lithofacies. (D) Quartz content differences among different lithofacies. (E) Calcite content differences among different lithofacies. (F) K-feldspar content differences among different lithofacies.
Minerals 12 00465 g004
Figure 5. Vertical variation of mineral composition and geochemical parameters in Qingshankou Formation.
Minerals 12 00465 g005
Figure 6. HI vs. OI diagram of Qingshankou Formation. HC = hydrocarbon; TOC = total organic carbon.
Minerals 12 00465 g006
Figure 7. Core and single polarized microscope images of laminae associations differences in four lithofacies: (AC) Felsic shale, (DF) clay shale, (GI) bio-bearing shale, and (JL) mixed shale. FQL—Feldspar and Quartz Lamination; CLL—Clay Lamination; SCL—Siliceous Clay Lamina-tion; OSL—Ostracods Lamination; OML—Organic Matter Lamination.
Minerals 12 00465 g007
Figure 8. (A) S2 vs. TOC plot showing generative source-rock potential. (B) S1 vs. TOC above the black line indicates migrated hydrocarbons, whereas values below the black line indicate indigenous hydrocarbons. The blue dotted and orange dotted lines represent the linear relationship between the two types of S1 and TOC, respectively. (C) The plot of Tmax and PI. (D) The plot of HI and TOC. (E) The plot of oil saturation index (OSI) and PI. (F) The plot of Tmax and TOC.
Minerals 12 00465 g008
Figure 9. The plot of TOC and S1 of Qingshankou Formation.
Minerals 12 00465 g009
Table 1. Average value of elements composition of the Qingshankou Formation.
ElementsSi (wt%)Al (wt%)Ca (wt%)Fe (wt%)
1.00–32.10
24.00
0.20–9.00
5.20
0.40–38.80
3.80
0.30–33.40
3.70
K (wt%)Mg (wt%)Mn (wt%)
0.04–6.10
3.00
0.40–7.70
1.20
0.00–0.50
0.10
Table 2. Average value of mineral composition of different shale lithofacies.
LithofaciesTOC
(wt%)
Clay
(wt%)
Quartz
(wt%)
K-Feldspar
(wt%)
Calcite
(wt%)
FS(19)0.69–2.72
1.62
23.90–54.30
39.97
26.10–43.30
33.05
0.20–3.70
1.28
0.00–10.6
3.11
CS(31)1.55–4.20
2.22
30.70–55.10
46.72
21.40–36.20
29.11
0.30–1.60
0.90
0.00–4.00
1.29
BS(14)0.96–2.47
1.78
15.40–50.50
35.48
28.40–38.90
33.87
0.20–1.00
0.65
0.70–27.50
8.17
MS(10)0.88–2.76
1.75
30.30–53.30
41.11
22.60–33.80
29.21
0.40–1.70
0.87
1.10–27.10
7.60
Publisher’s Note: MDPI stays neutral with regard to jurisdictional claims in published maps and institutional affiliations.

