Abstract
Widespread hexavalent chromium (Cr (VI)) in the environment has become a worldwide problem, and economical and efficient treatment is urgently needed. In this paper, the treatment method of Cr (VI) by microorganisms and iron minerals (pyrite and magnetite) under anaerobic conditions was investigated. Furthermore, the influence of Cr (VI) on the microbial community structure was explored. The reduction test demonstrated that the removal rate of Cr (VI) in a single biological group was 54.96%; however, in the pyrite and biological groups and magnetite and biological groups, the removal rates of Cr (VI) increased to 83.06% and 78.23%, respectively. Microorganisms and iron minerals work together to produce a better removal effect on the removal rate of Cr (VI). Mechanistic studies have found that in the process of Cr (VI) reduction, a passivation layer is formed on the surface of the mineral that hinders the progress of the reaction. The addition of bacteria can reduce the negative impact of the passivation layer. At the same time, iron minerals have better electron-receiving and -conducting ability and can be used as electron carriers for bacteria to reduce Cr (VI). In addition, iron minerals and the disappearance of Cr (VI) will change the structure of the community and affect the expression of its functions, which is more conducive to reducing Cr (VI). This work sheds new light on the treatment of heavy metal pollution and the understanding of the synergistic reduction mechanism of Cr (VI).
1. Introduction
With the development of industry, serious heavy metal pollution frequently appears worldwide and seriously threatens human health. Hexavalent chromium (Cr (VI)), as a heavy metal, possesses high mobility, toxicity, and carcinogenicity properties. It widely exists in industrial wastewaters such as plating, leather tanning, and dyeing [1]. However, the improper treatment of industrial wastewater causes Cr (VI) leaks and polluted environments. [2,3]. Therefore, the treatment of heavy metal ion pollution is critical. Cr (VI) usually precipitates in the forms of Cr (OH)3 or Fe (III)/Cr (III) composites [4,5,6] and causes a significant decrease in their cytotoxic activity [7,8]. Therefore, the conversion of Cr(VI) to Cr(III) is usually considered an efficient method for Cr(VI) treatment [9].
Many natural reductants, such as Fe (II) and Fe (II)-bearing solids, have the ability to reduce and transform Cr (VI) to Cr (III). Fe (II/III)-bearing clay minerals are ubiquitous in subsurface systems. Iron-containing minerals, due to their huge reserves, low cost, and high reactivity, have attracted increasing attention in the field of reduce Cr (VI) [10,11]. Microorganisms are important drivers of the geochemical element cycle and participate in various geochemical processes, such as C, N, Fe, S, and heavy metal element migration and transformation [12]. A large variety of bacteria that can reduce and transform hexavalent chromium to trivalent chromium under aerobic and anaerobic conditions have been reported.
Recently, extracellular respiratory bacteria (ERB), as a new type of energy metabolizing microorganism, were discovered, which has opened a new chapter in the study of the surface material cycle. Extracellular electron transfer is defined as the process in which electrons derived from the oxidation of electron donors are transferred to the outer surface of the cell to reduce an extracellular terminal electron acceptor [13]. ERB can generate electrons by oxidizing organic matter and then transfer electrons to extracellular electron acceptors through the electron transport chain to obtain energy. It has two significant differences from traditional intracellular anaerobic respiration: (1) Electrons must eventually be transferred to the outside of the cell. Unlike soluble electron acceptors such as NO3− and SO42−, the electron acceptors of extracellular respiration are solids (such as iron/manganese oxides and graphite electrodes) or macromolecular organics (such as humic substances), which cannot enter cells. The electrons generated by the oxidation process must therefore manage to pass through the non-conductive cell wall to be delivered to extracellular receptors. (2) The electron transport pathways are different. In contrast to the conventional electron transport chain, electrons generated by extracellular respiration must travel through periplasmic components to reach the outer cell membrane. Then, they are transmitted to the outside of the cell by means of heme cytochrome-c, nanowires, or electron shuttles on the outer membrane, so the difficulty of delivery is also significantly increased [14]. Therefore, ERB can play a critical role in Cr (VI) reduction by transferring electrons during this process under anaerobic conditions [15,16]. It has been found that ERBs use their own external protein-electron receptor channels and use solid conductive materials as electronic shuttle carriers to realize long-distance electron transfer and promote interspecies electron transfer. For example, Souichiro Kato et al. [17] found that adding conductor minerals can promote electron transfer between G. sulfurreducens and T. denitrificans. In addition, they also demonstrated that the addition of minerals into microbial fuel cells increased the current strength by 30 times, while the addition of dissolved Fe (II) and Fe (III) ions increased the current by only 10 times. This further illustrates the role of solid iron ore in the electron transfer process. Moreover, the addition of conductive minerals can change the microbial community structure and improve the Cr(VI) reduction rate [18]. In recent years, research on sulfide ore has become increasingly prominent. Pyrite is a typical iron sulfide ore that has inherent reducibility and can provide energy for microorganism growth [6].
This work simulates the synergistic reduction of hexavalent chromium by microbial flora and iron-containing minerals in a naturally anaerobic environment. We attempted to investigate the role of conductor/semiconductor minerals in the microbial reduction of Cr (VI) and to explore the synergy and mechanism between microorganisms and minerals in the Cr (VI) reduction process. This work provides methods and ideas for the remediation of Cr (VI) pollution in the complex environment of soil and water.
2. Materials and Methods
2.1. Microorganism and Medium
Enrichment communities were collected at the Changsha chromate plant (E 112.962771, N 28.269057). A 1 g sample of wet soil and 10 mL of chromium solution were added to flask shakes containing 100 mL medium under anaerobic conditions, 200 rpm, and 30 °C culture. The soil particles in the medium were removed by centrifugal filtration when the microbial culture reached a logarithmic period. During the transfer, the bacterial solution of each medium was mixed by the same amount and then enriched by 10%. The culture was maintained at a constant temperature until the culture solution was turbid.
One milliliter of culture medium was transferred to a 100 mL fresh culture medium with 1% inoculation. To minimize the loss of microbial diversity, the medium used in this experiment was a medium with a nutrient-rich environment (LB). The composition of the medium was as follows: 10 g/L peptone, 5 g/L yeast extract, and 10 g/L NaCl, and the pH was adjusted to 7.0 with HCl and NaOH.
The pure minerals (magnetite and pyrite) used in the experiment were purchased. Then, the minerals were ground and screened for 95 μm and reserved for later use.
2.2. Experiment
Reduction tests of Cr (VI) were carried out in a 100 mL system, and all tests were conducted under anaerobic conditions. To protect the anaerobic environment, N2 was aerated into the medium for 5 min to completely discharge the air inside the bottle before sterilization. First, each 0.1 g mineral (magnetite and pyrite) was added to an anaerobic bottle containing 100 mL culture liquid, and the enriched microbial flora was added with 1 mL inoculation. Then, potassium bichromate (K2Cr2O7) solution and organic sodium acetate (CH3COONa) were added to the sterilized medium to ensure a Cr(VI) concentration of 50 mg/L and a CH3COO− concentration of 10 mmol/L. Next, the co-reduction of Cr (VI) in minerals was carried out. The entire operation was performed in the anaerobic operation box. Their culture conditions were set to 30 °C and 200 rpm. Each group was set to 3 in parallel.
The culture medium was taken at different time intervals within 82 h to detect the change in Cr (VI) content. Ten milliliters of each sample was taken, and the same volume of pure medium was added as supplement after sampling. Thus, the entire cultural system remains in a neutral environment. After an incubation time of 32 h, 100 mL was taken from each sample for DNA sequencing. Final microbial samples were also collected after 77 h, as described above.
2.3. Electrochemical Experiments
Open circuit potential (OCP), electrochemical impedance spectroscopy (EIS), and Tafel and cyclic voltammetry (CV) electrochemical experiments were performed on a CHI 760E electrochemical workstation (CH Instruments, Inc., Shanghai, China) at 25 °C. A conventional three-electrode electrolytic cell was used for electrochemical analysis. The electrochemical experiments were carried out in an electrolyte of 0.1 M KNO3 with 10 mM CH3COONa and 50 mg/L K2Cr2O7. The working electrode was prepared as follows: 0.01 g of sample was dispersed in 1 mL of water, and 70 μL of this solution was mixed with 30 μL of Nafion D520. Next, 5 μL of the mixed solution was added dropwise to the electrode surface and dried. The counter electrode was a platinum electrode, and the reference electrode was Hg/Hg2Cl2.
Before EIS, Tafel, and CV measurements, the working electrode was equilibrated at the OCP. Equilibrations occurred when the value of OCP did not change by more than 5 mV within a span of 60 s [19].
2.4. Analytical Methods
The sample was centrifuged at 10,000 rpm for 5 min. After that, the Cr(VI) concentration in the supernatant was determined by diphenylcarbonydraide (DPCI). The minerals of the experimental system were collected to analyze the surface topography and element composition by SEM, X-ray photoelectron spectroscopy (XPS) (FEI company, Shanghai, China), Raman microscopy, and Fourier transform infrared spectroscopy (FTIR) (Shimadzu company, Beijing, China).
Microbial community DNA was extracted using an E.Z.N. ATM mag-bind Soil DNA Kit (OMEGA). The V4 segments of the 16S rRNA were amplified using 515F and 806R. The amplification system was as follows: 515F: GTGCCAGCMGCCGCGGTAA; 806R: GGACTACHVGGGTWTCTAAT (Table 1).

Table 1.
DNA amplification system of the microbial community [20].
After amplification, the PCR product was electrophoresed by agarose gel electrophoresis, and then the DNA was purified and recovered using 0.6-fold Agencourt AMPure XP. A Qubit 2.0 A DNA detection kit was used to accurately quantify DNA. The DNA of each sample was mixed in a 1:1 ratio (10 ng per sample), and the final sequencing concentration was 20 pmoL. The sequencing platform was an Illumina MiSeq sequencing instrument (Illumina company, Shanghai, China).
Initial demultiplexing and trimming (removal of primer sequences and indices) were performed with the default Illumina MiSeq Control Software (2.6.2.1) installed on the sequencer. Down-stream quality control, trimming, filtering, merging of forward and reverse reads, chimera removal, and identification of amplicon sequence variants was performed with the R software version 3.2. Statistical analysis of Operational Taxonomic Units (OTU) information was performed using the software Usearch version 5.2.236. R software version 3.2 was used to create the plot. The aipher diversity index was analyzed using mothur software version 1.30.1. Microbial diversity was studied in community ecology, mainly through diversity analysis of a single sample. Alpha diversity can reflect the abundance and diversity of microbial communities, including a series of statistical analysis indices to estimate species abundance and diversity of environmental communities. It includes Ace Index, Chao1 Index, Shannon Index, and Simpson Index. The Ace index and Chao1 index are used to estimate the number of OTUs in the sample. The Shannon index and Simpson index reflect community diversity, and they are affected by species abundance and species evenness of the sample community.
3. Results and Analysis
3.1. Cr (VI) Reduction Kinetics
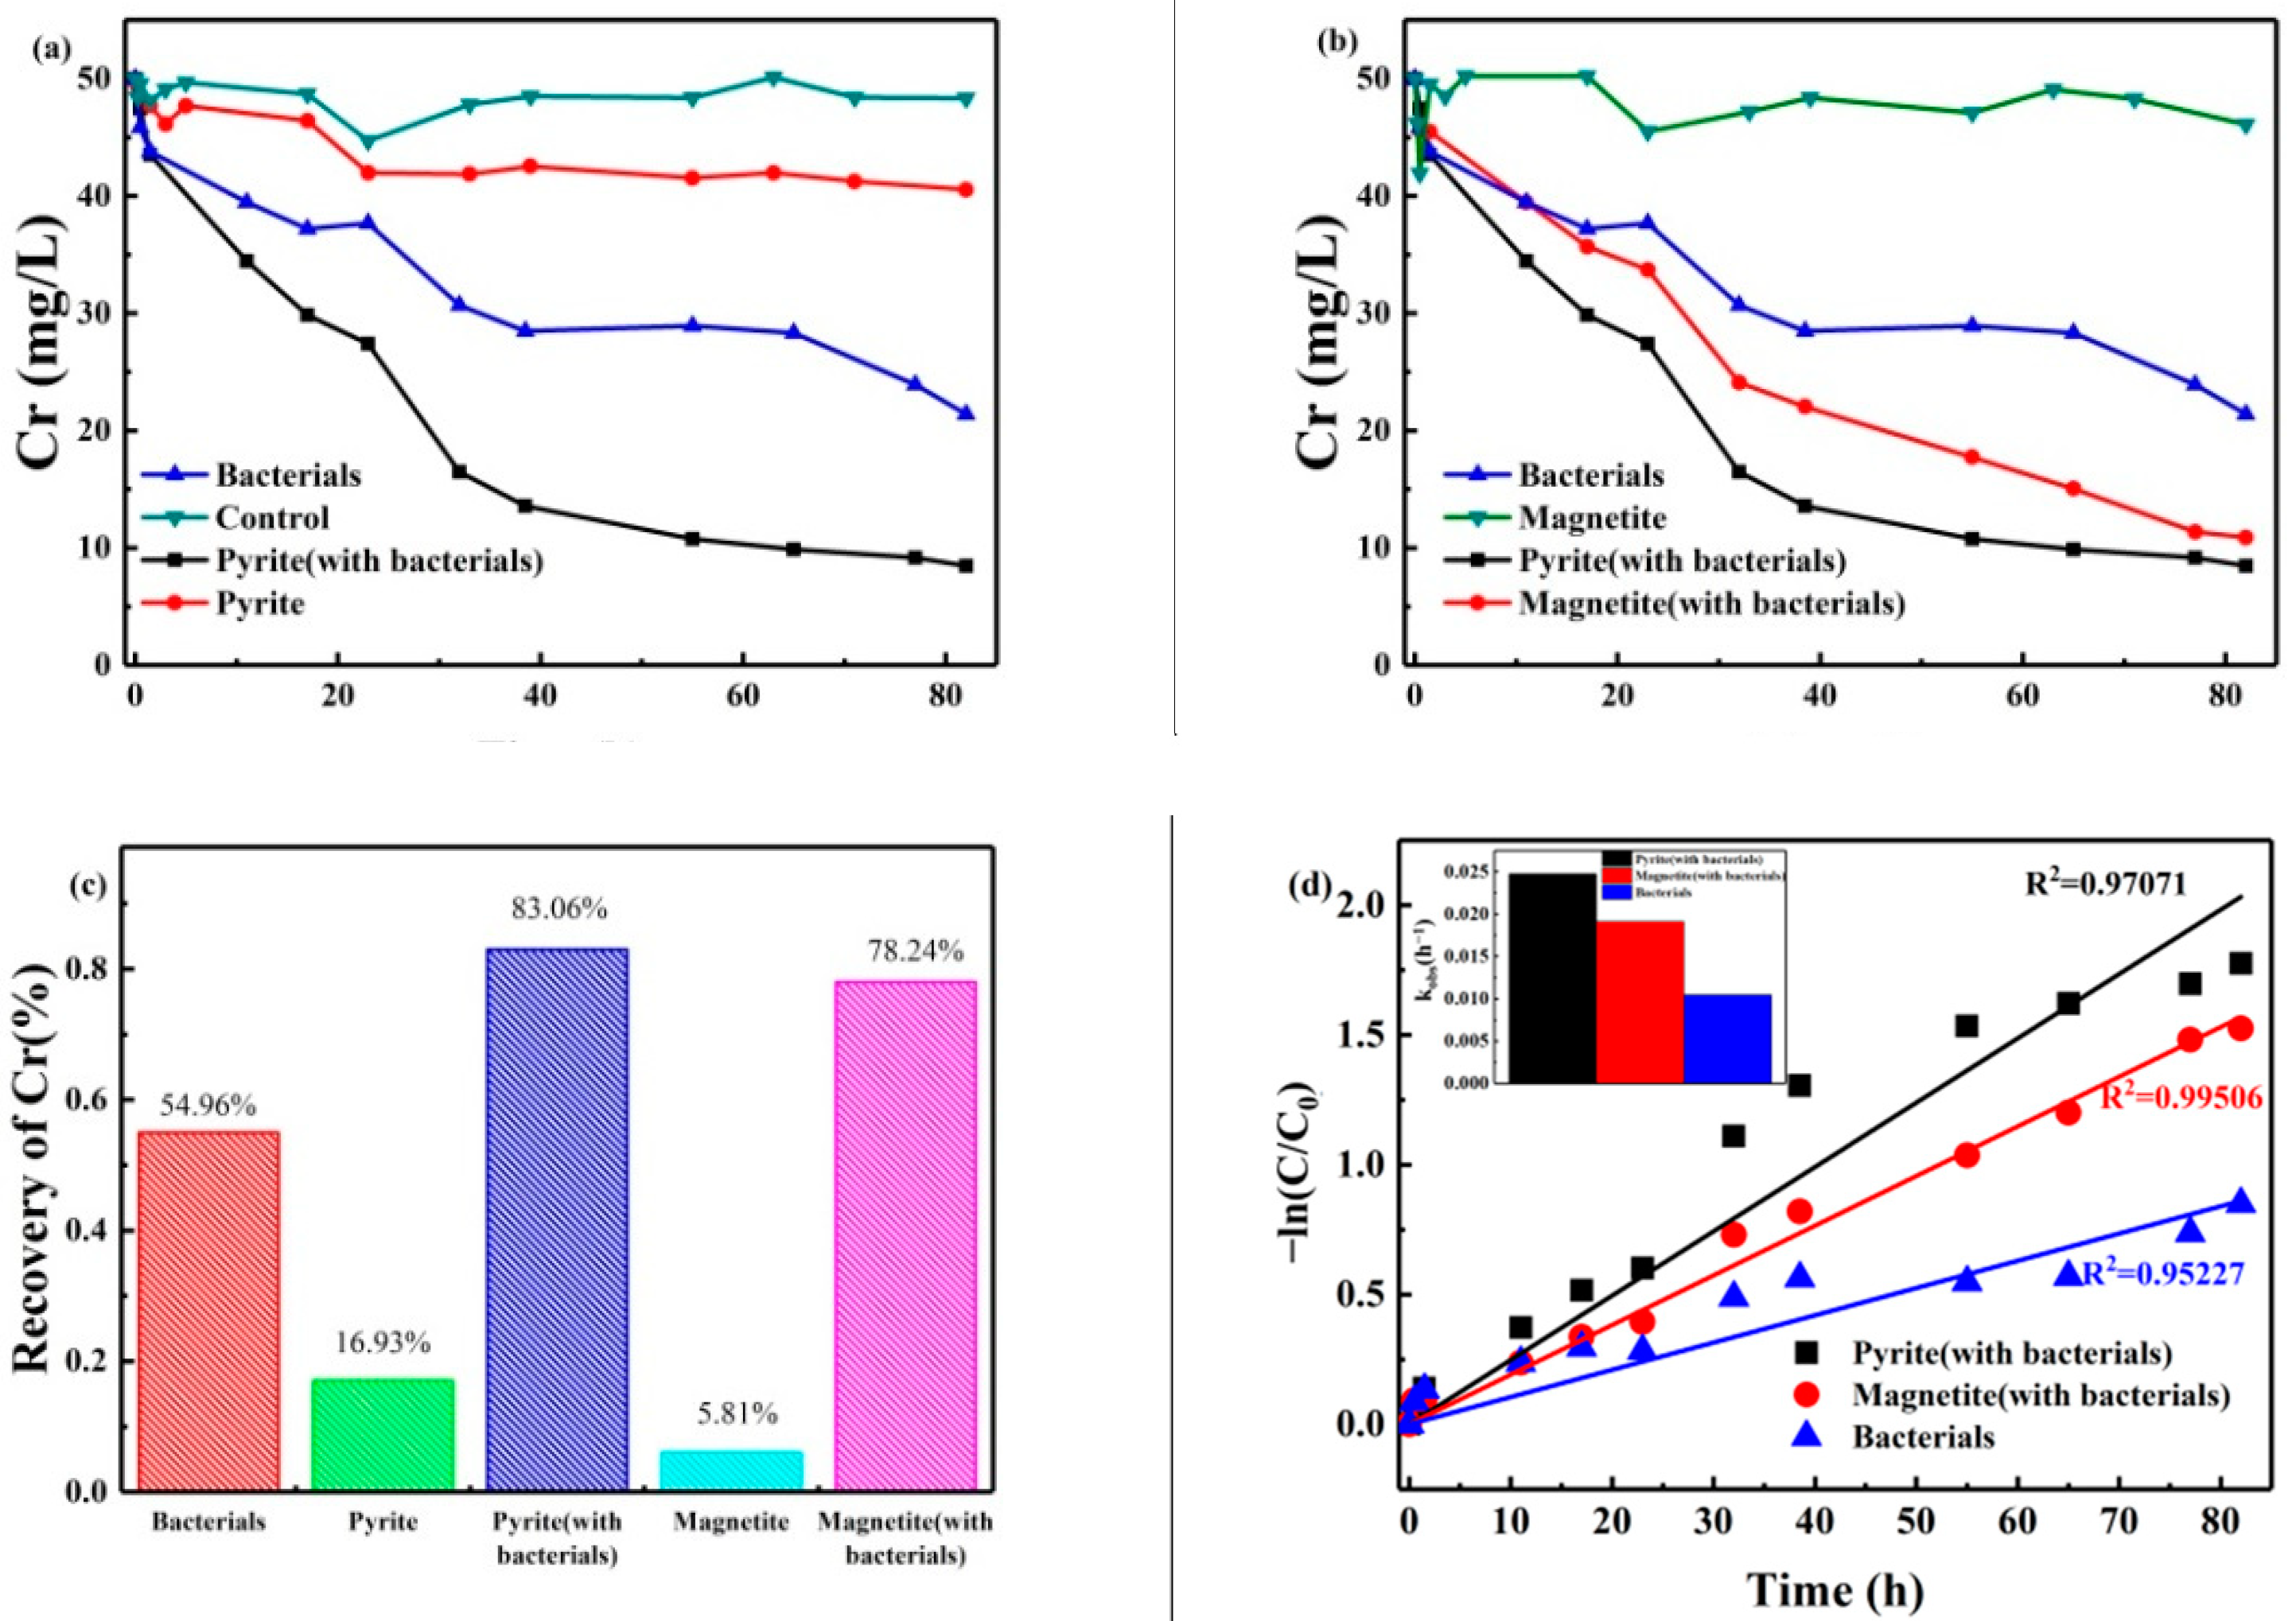
The change in Cr (VI) concentration ifn the reaction system was detected by DPCI [21]. Results for four groups (bank group/pyrite group/bacterial group/bacterial and pyrite group) are shown in Figure 1a. The Cr (VI) concentration in the bank group showed no significant change. In the pyrite group, the concentration of Cr (VI) slightly decreased with increasing treatment time. This indicates that pyrite can be reduced by its chemical reduction of Cr (VI) within a certain range. This is consistent with the findings of A.M. Graham et al. [22]. In the bacterial group, the concentration of Cr (VI) decreased sharply in the first 40 h, followed by relatively little subsequent change. However, in the bacterial and pyrite group, the concentration of Cr (VI) in the reaction system showed a considerable decrease; after 38.5 h of reaction time, the concentration of Cr (VI) reached 15 mg/L, and the removal efficiency reached 83.06%. Subsequently, the concentration of Cr (VI) barely changed with any further increase in the treatment time. This could be responsible for the pyrite surface generating a Cr (III) hydroxide precipitate that covers the mineral surface and prevents the active site from reducing the remaining Cr (VI). Based on these results, we concluded that the bacterial and pyrite groups showed a better effect on Cr (VI) removal than the bacterial and pyrite groups. Bacteria and pyrite have a synergistic effect on the reduction of Cr (VI). In addition, bacteria were revealed to play a major role in Cr (VI) reduction.

Figure 1.
Changes in concentration of Cr (VI) with minerals: (a) pyrite with or without ERB, (b) magnetite with or without ERB, (c) recovery rates of Cr (VI) at 82 h, and (d) the kinetics of the Cr (VI) reduction process.
The concentrations of Cr (VI) in the bacterial group, bacterial and pyrite group, magnetite group, and bacterial and magnetite group are shown in Figure 1b. The results obtained for all four groups show the same trend, and the concentrations of Cr (VI) decreased with time. The bacterial and magnetite group had lower Cr (VI) concentrations than the magnetite group during the whole period, indicating that microorganisms play an important role in Cr (VI) reduction and can cooperate with minerals to reduce Cr (VI). It was found that Cr (VI) concentrations in the bacterial and magnetite group reached 22 mg/L at 38.5 h and that the reduction rate reached 55.92%. The bacterial and pyrite group and bacterial and magnetite group were also compared. At 82 h, the reduction efficiencies of the bacterial and pyrite group and bacterial and magnetite group to Cr (VI) were 83.06% and 78.23%, respectively. Figure 1c shows that the Cr (VI) reduction efficiency in the coexistence system of minerals and microorganisms was much higher than that in a single mineral or biological. Moreover, the reduction effect of the bacterial and pyrite group is better than that of the bacterial and magnetite group, which proves that minerals play a synergistic role in the microbial reduction process of Cr (VI).
The reaction of minerals with a Cr (VI) solution is a heterogeneous reaction on the mineral surface. Most surface reaction processes can be described by the Langmuir–Hinshelwood kinetic model:
In the equation, K represents the reaction rate constant of the solid surface, and b represents the adsorption constant. When the reactant concentration is very low (bc 1), Formula (1) can be simplified as:
At this time, the reaction is simplified to a pseudo-first-order reaction. Integrating Equation (2) leads to
where k is the apparent rate constant (kobs). It can be seen from Figure 1d that the three groups’ curves were observed to have good linearity (R2 > 0.95), which indicates that the reduction processes of Cr (VI) by the magnetite and bacterial, pyrite and bacterial, and bacterial groups fit a pseudo-first-order reaction kinetics model. The apparent rate constants of the pyrite and bacterial group, magnetite and bacterial group, and bacterial group were 0.02478 h−1 (R2 = 0.97071), 0.019130 h−1 (R2 = 0.99506), and 0105 h−1 (R2 = 0.95227), respectively.
3.2. SEM and EDS Analyses of Surface Morphology
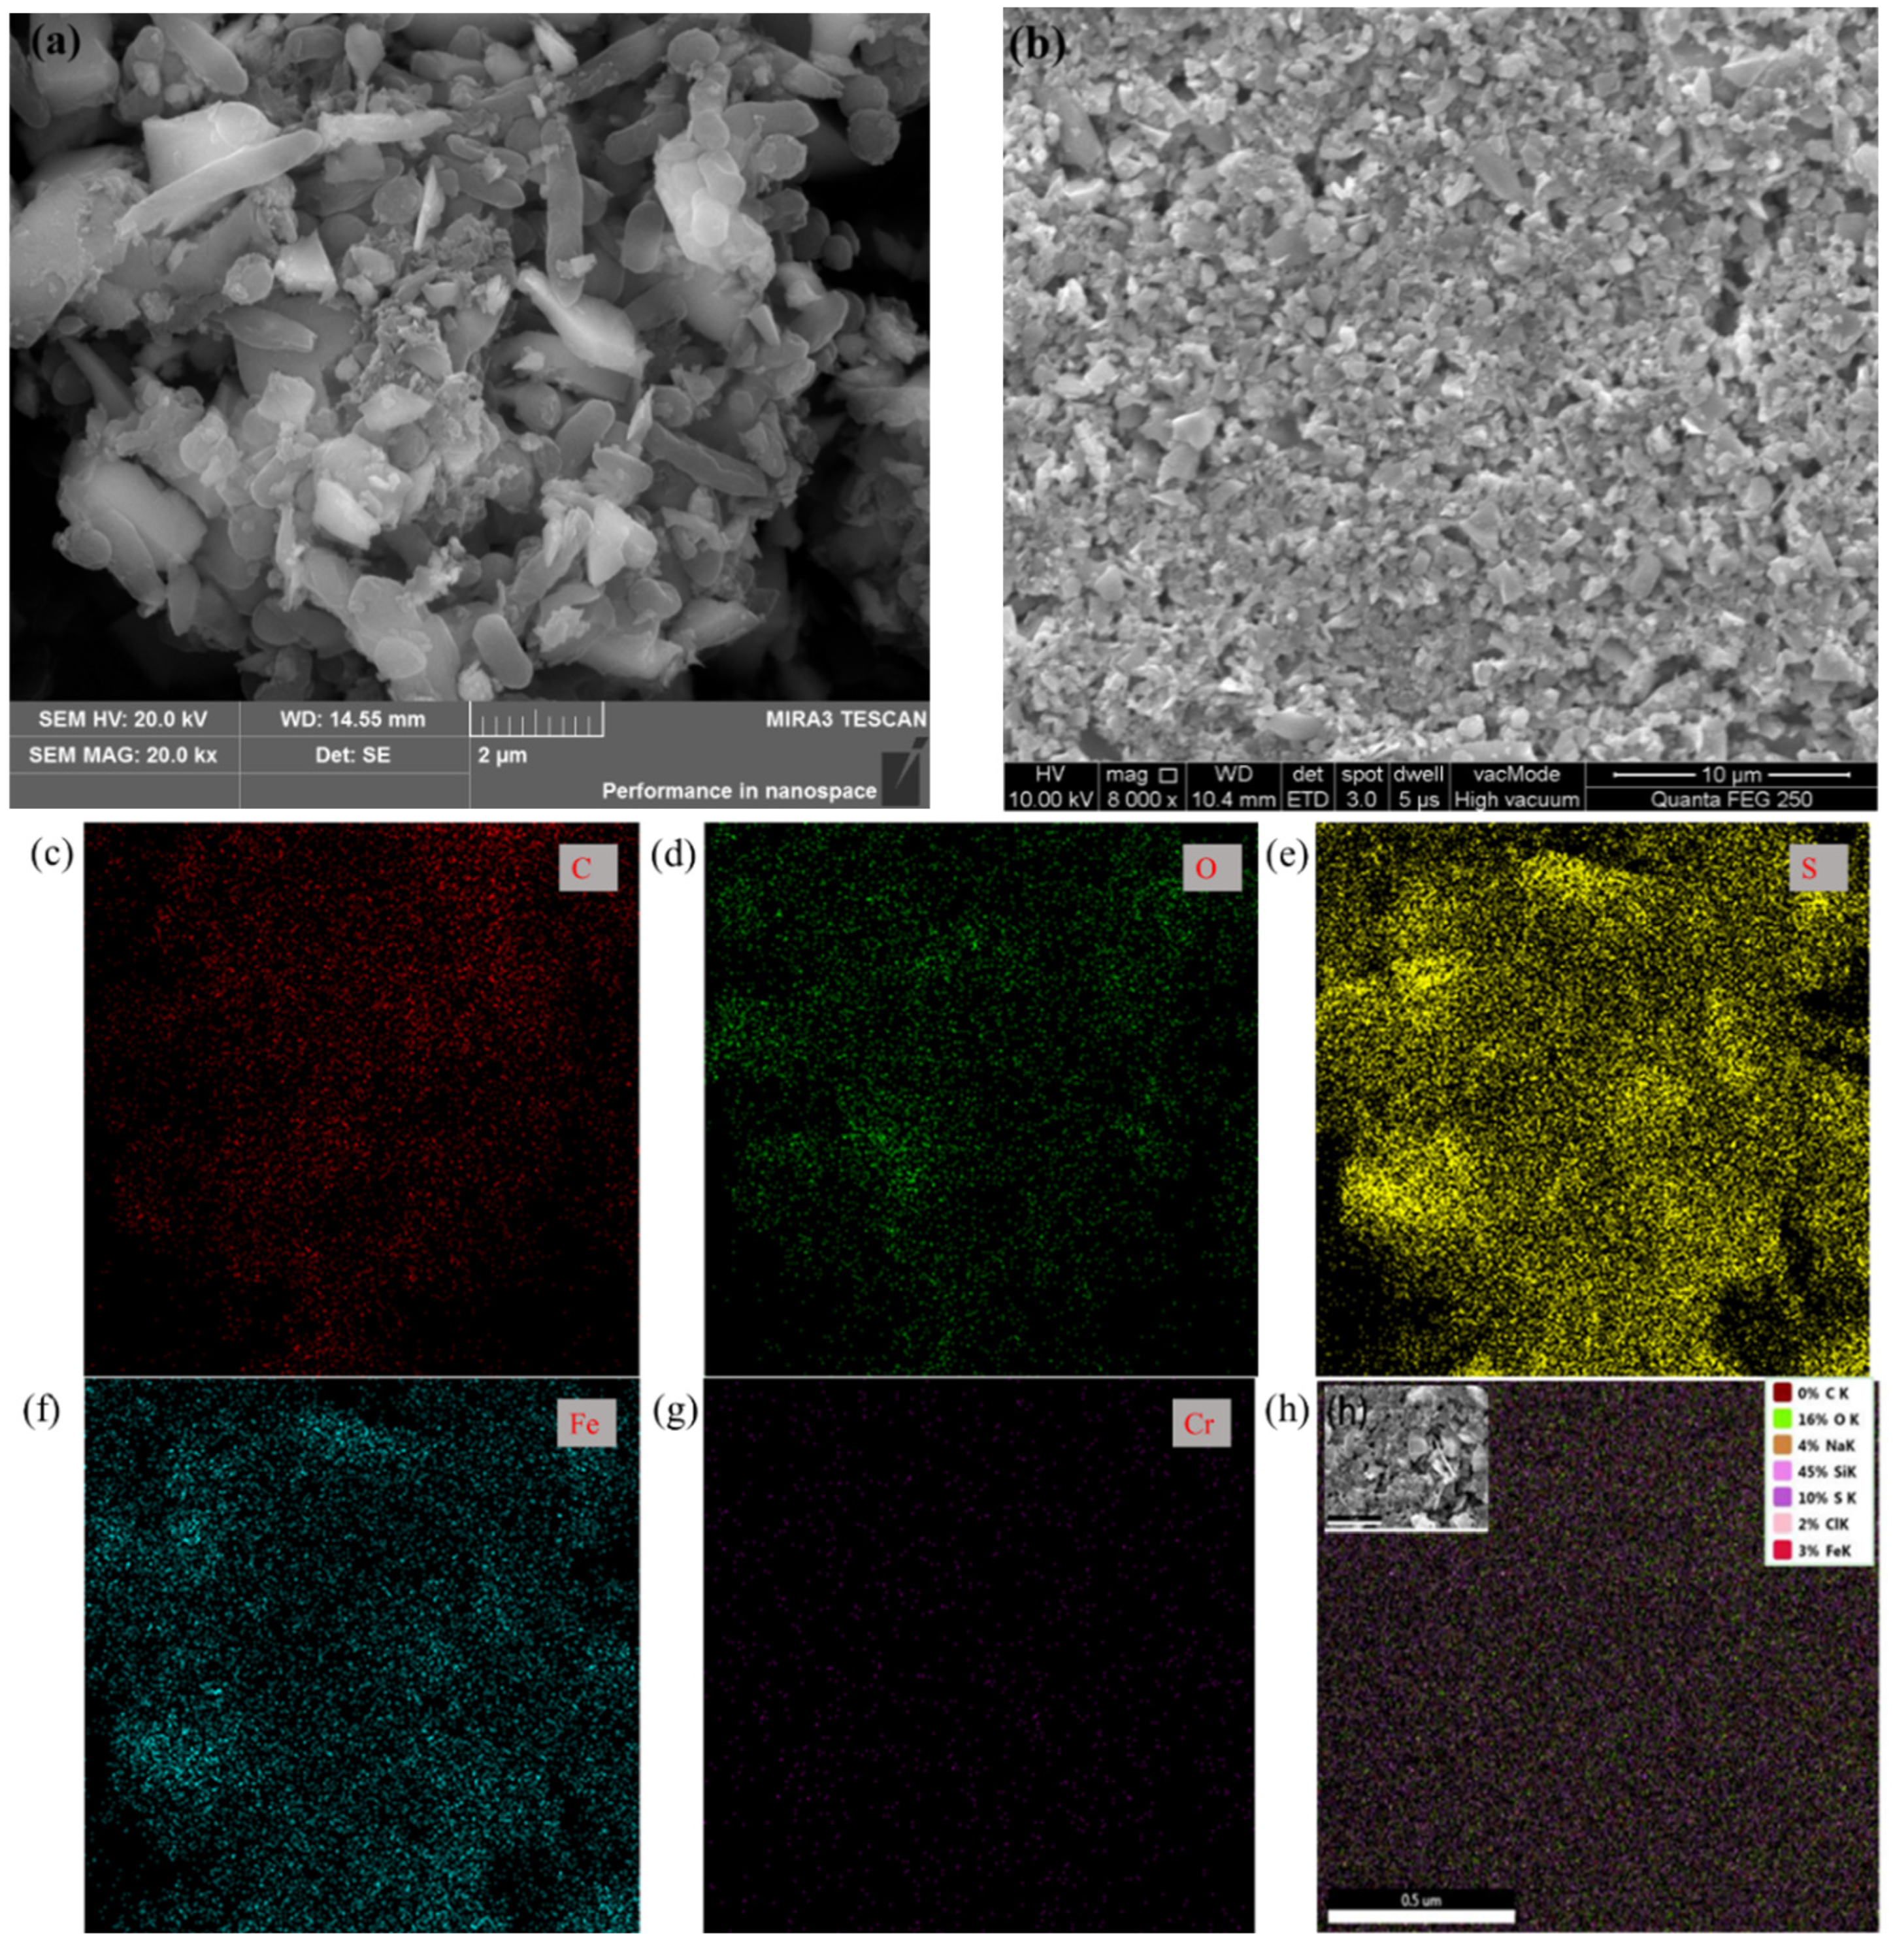
Figure 2 shows the surface morphology and element distribution of the minerals after reacting for 82 h in the group with or without bacteria, which directly reflects the interaction between microorganisms and minerals. Microbial adhesion exists on the pyrite surface in the bacterial and pyrite group, and flocculating metabolites appear on the surface of the microorganism, which may be an extracellular polymeric substance of bacteria. According to the EDS analysis of the mineral surface (Table 2), it was found that the S content on the surface of pyrite in the present microorganisms was 66%, while that without microorganisms was only 10%. In addition, the Fe content on the surface of pyrite treated with microorganisms was 21%, while that without was only 3%. The S and Fe contents on the pyrite surface of the pyrite group were significantly lower than those of the bacterial and pyrite groups. We speculated that in the process of Cr (VI) reduction, a passivation layer of Cr (III) oxide forms on the surface of the pyrite, which masks the active site on the surface of the pyrite and thus hinders the reduction. The action of microorganisms can reduce the coverage of the passivation layer on the surface of the mineral.

Figure 2.
SEM images of the pyrite surfaces in the group (a) with bacteria or (b) without bacteria at 82 h, (c–g) surface element distribution of pyrite in the group with bacteria, and (h) surface element distribution of pyrite in the group without bacteria.
Table 2.
EDS spectrum analysis of pyrite surface in different conditions.
3.3. XPS Analysis of Different Iron Ore Surfaces
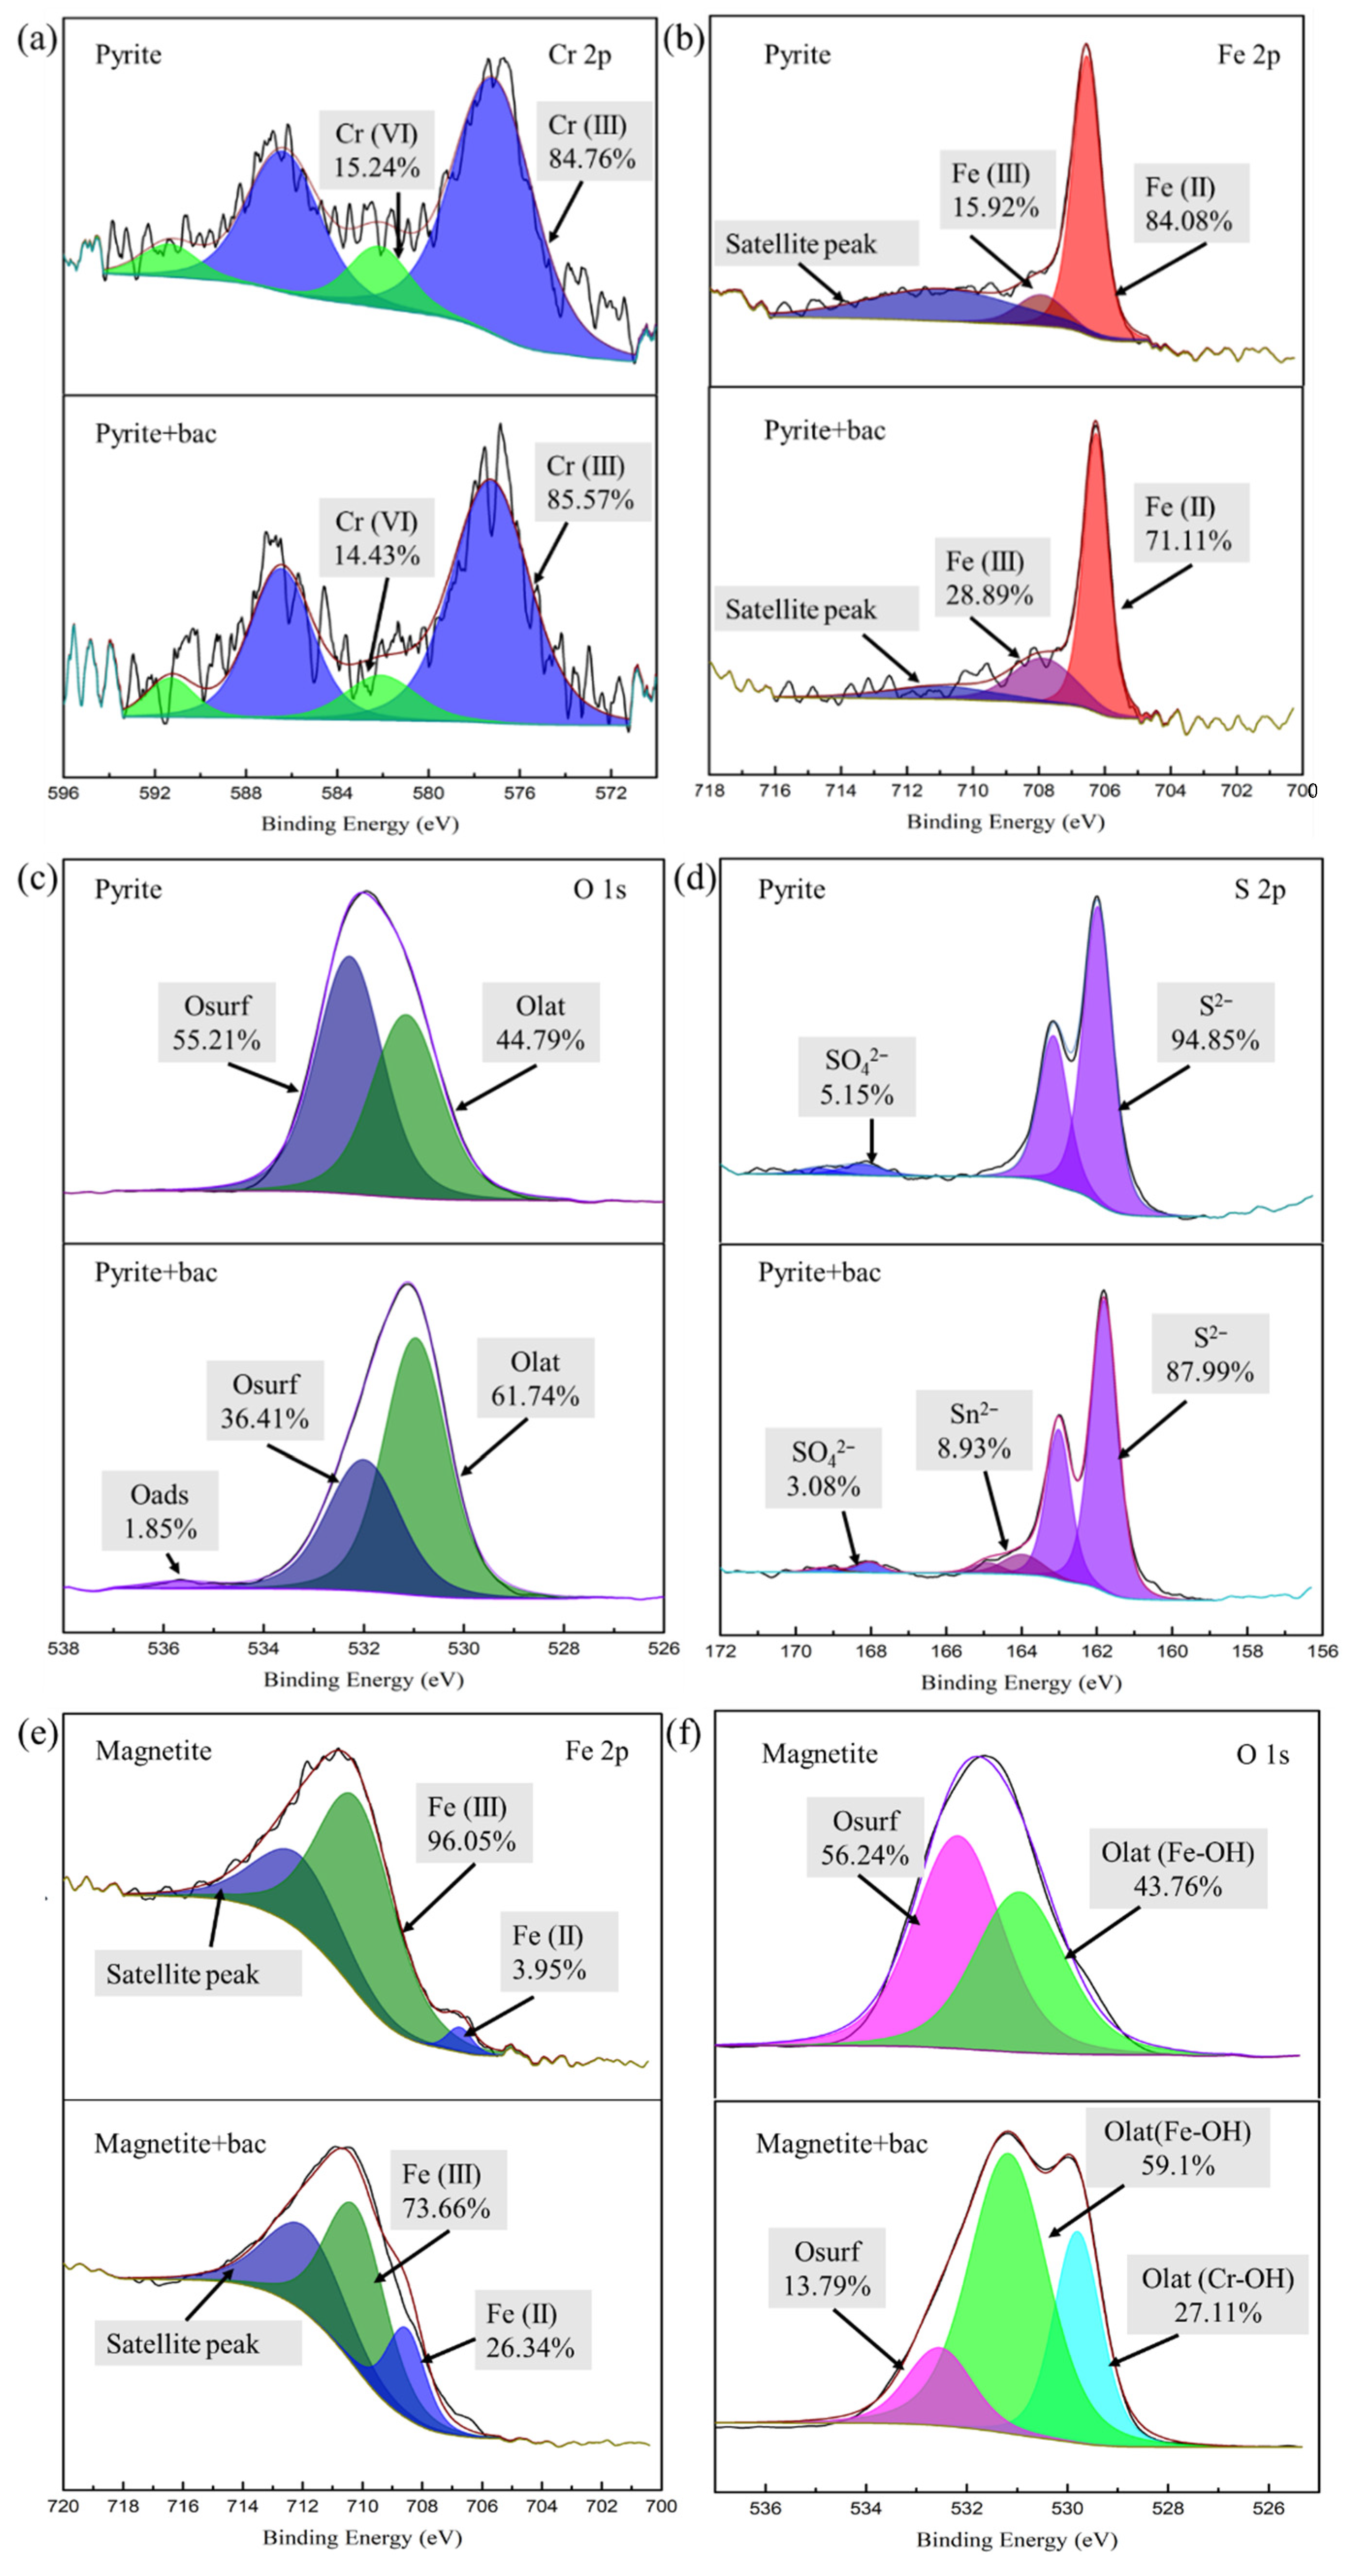
The XPS analysis is shown in Figure 3. The content changes of the elements Cr, Fe, O, and S in different conductive minerals were determined. As shown in Figure 3a, the peaks present at 576.5 eV and 586.5 eV were assigned to Cr (III), and the peaks at 581 eV and 588 eV were attributed to Cr (VI) [23]. In the pyrite and pyrite and microbial groups, four peaks were observed, which were attributed to Cr (III) and Cr (VI), respectively. These results indicate that after the microorganisms adsorb Cr (VI) in the solution, they adhere to the surface of the minerals. In the presence of microbes, no new peaks appeared, but the ratio between the intensities of the Cr (III) and Cr (VI) peaks changed. With the addition of microbes, the percentage of Cr (III) increased, while the percentage of Cr (VI) decreased. These results indicate that microbes can promote the reduction of Cr (VI) on the surface of pyrite.

Figure 3.
XPS key elements of Cr, Fe, O, and S in different Cr (VI) reduction systems: (a) XPS spectra of Cr 2p in pyrite system. (b) XPS spectra of Fe 2p in pyrite system. (c) XPS spectra of O 1s in pyrite system. (d) XPS spectra of S 2p in pyrite system. (e) XPS spectra of Fe 2p in magnetite system. (f) XPS spectra of O 1s in magnetite system.
The Fe2p3/2 spectrum of pyrite is shown in Figure 3b. The peak corresponds to Fe(II)-S at 707 eV [24]. The characteristic peaks of pyrite in the pyrite and biological groups are exhibited at binding energies of 708 eV, 710 eV, and 712.8 eV [25]. The peak at 708 eV corresponds to Fe (II)-S or F e(II)-O, the peak at 710 eV corresponds to Fe (III)-OH or Fe (II)-SO4, and the peak at 712.8 eV is assigned to Fe (III)-SO4. This result indicates that microorganisms can reduce Fe (III) to Fe (II) under anaerobic conditions (Equation (7)). At the same time, the generated Sn2− also reduces Fe (III) to form S0 and Fe (II) (Equation (8)). This agrees with the previous S(2p) spectral analysis.
In addition, Figure 3c shows the O 1s spectrum for pyrite in different systems, which was fitted by two main O 1s peaks at 530.8 eV and 532.1 eV, corresponding to lattice oxygen (M-O, Olat) and surface adsorbed species (M-OH, Osurf). After treatment with bacteria, a new peak appeared at 535.8 eV, which was caused by adsorbed molecular water (Oads) (Xu et al., 2019). These results show that the biological and pyrite group has a higher Olat content than the group without biological properties because microorganisms reduced the formation of Cr (III) (oxy)hydroxide and/or FexCr(1−x)(OH)3 on the surface.
The S(2p) spectrum is shown in Figure 3d. According to previous studies, the bands of S2 p3/2 and S2 p1/2 are separated by 1.18 eV, and the intensity of the lower-binding-energy band (S 2p3/2) is twice that of the band at a higher binding energy (S 2p1/2) [26]. The peaks at 160.70 eV and 161.88 eV were assigned to S2−, and the peaks at 168.40 eV and 169.58 eV were derived from SO42−, indicating that the pyrite surface was oxidized. The simple pyrite group exhibited four peaks, attributed to S2− and SO42−. However, the S 2p spectra of pyrite in the pyrite and microbial groups present six peaks. The peaks at 164.29 eV and 165.47 eV were attributed to Sn2− (n > 2). This is due to the reaction of Cr (VI) with pyrite in solution (Equation (4)) [24].
The pyrite group formed a Fe (III)/Cr (III) hydroxide passivation film on the surface as the reaction progressed, preventing the reaction from proceeding, which is the same as that in the previous SEM analysis. In the biological and pyrite group, microorganisms can transfer electrons in sodium acetate to S0 to form reduced S(Sn2−) under anaerobic conditions [27] (Equation (5)). The reduced sulfur formed on the surface of the mineral can continue to reduce Cr (VI) to Cr (III) and accelerate the reaction of pyrite with Cr (VI) (Equation (6)).
The Fe2p3/2 spectra of magnetite at different conductivities are shown in Figure 3e. The Fe2p3/2 spectrum for magnetite was deconvoluted into two peaks at 709.9 eV and 711.5 eV, which correspond to Fe (II) and Fe (III) [28]. In the group of magnetite without biologicals, the contents of Fe (II) and Fe (III) were 3.95 and 96.05%, respectively. However, in the presence of biological compounds, the contents of Fe (II) and Fe (III) were 26.34 and 73.66%, respectively. The content of Fe (II) in the experiments with magnetite and biological material was higher than that with magnetite alone. This might be because microorganisms can reduce Fe (III) to Fe (II) under anaerobic conditions.
Figure 3f shows the O 1s spectrum for the magnetite treated with or without microorganisms. After magnetite was treated with Cr (VI), the O 1s peaks at 531.2 eV and 532.1 eV corresponded to Fe-OH (Olat) and Fe-O (Osurf), respectively. The group of magnetite in the presence of bacteria showed a new peak at 529.4 eV, which may be caused by Cr-OH. After the microorganisms adsorbed Cr, they attached to the mineral surface, as with the previous test.
3.4. FTIR Spectroscopy
FTIR analysis of the minerals at the end of the experiment was carried out. The results are shown in Figure 4. There is a significant difference in the absorption peaks of minerals between the groups in the presence and absence of bacteria. As shown in Figure 4, the peak at 1100 cm−1 is a characteristic peak of sulfate (sulfate has a very strong absorption band at 1130–1080 cm−1) [29]. The sulfate absorption peak of pyrite with bacteria is significantly stronger than that without, proving that the bacteria can promote more sulfur in pyrite to participate in the reduction reaction [30]. The peak at 3440 cm−1 is the absorption of the hydroxyl group. Compared with pyrite without bacteria, pyrite with bacteria added has a stronger absorption peak of hydroxyl groups, indicating that in the process of Cr (VI) reduction, Fe-(OH)n and Cr-(OH)n will be produced and attached to the surface of minerals. The bacteria accelerated the reduction of Cr (VI), leading to an increase in the hydroxyl groups on the mineral surface [31].
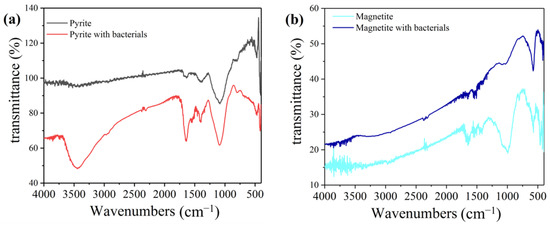
Figure 4.
FTIR analysis of pyrite and magnetite in different Cr (VI) reduction systems: (a) pyrite group, (b) magnetite group.
In the magnetite system, the peak of sulfate may be caused by impurities in the ore. The sulfate absorption peak of the magnetite with bacteria is significantly stronger than that of the magnetite group. This is because microorganisms reduce the surface coverage of magnetite and expose more mineral surfaces, which is conducive to the reduction reaction. These results correspond to the previous XPS analysis.
3.5. Raman Spectroscopy
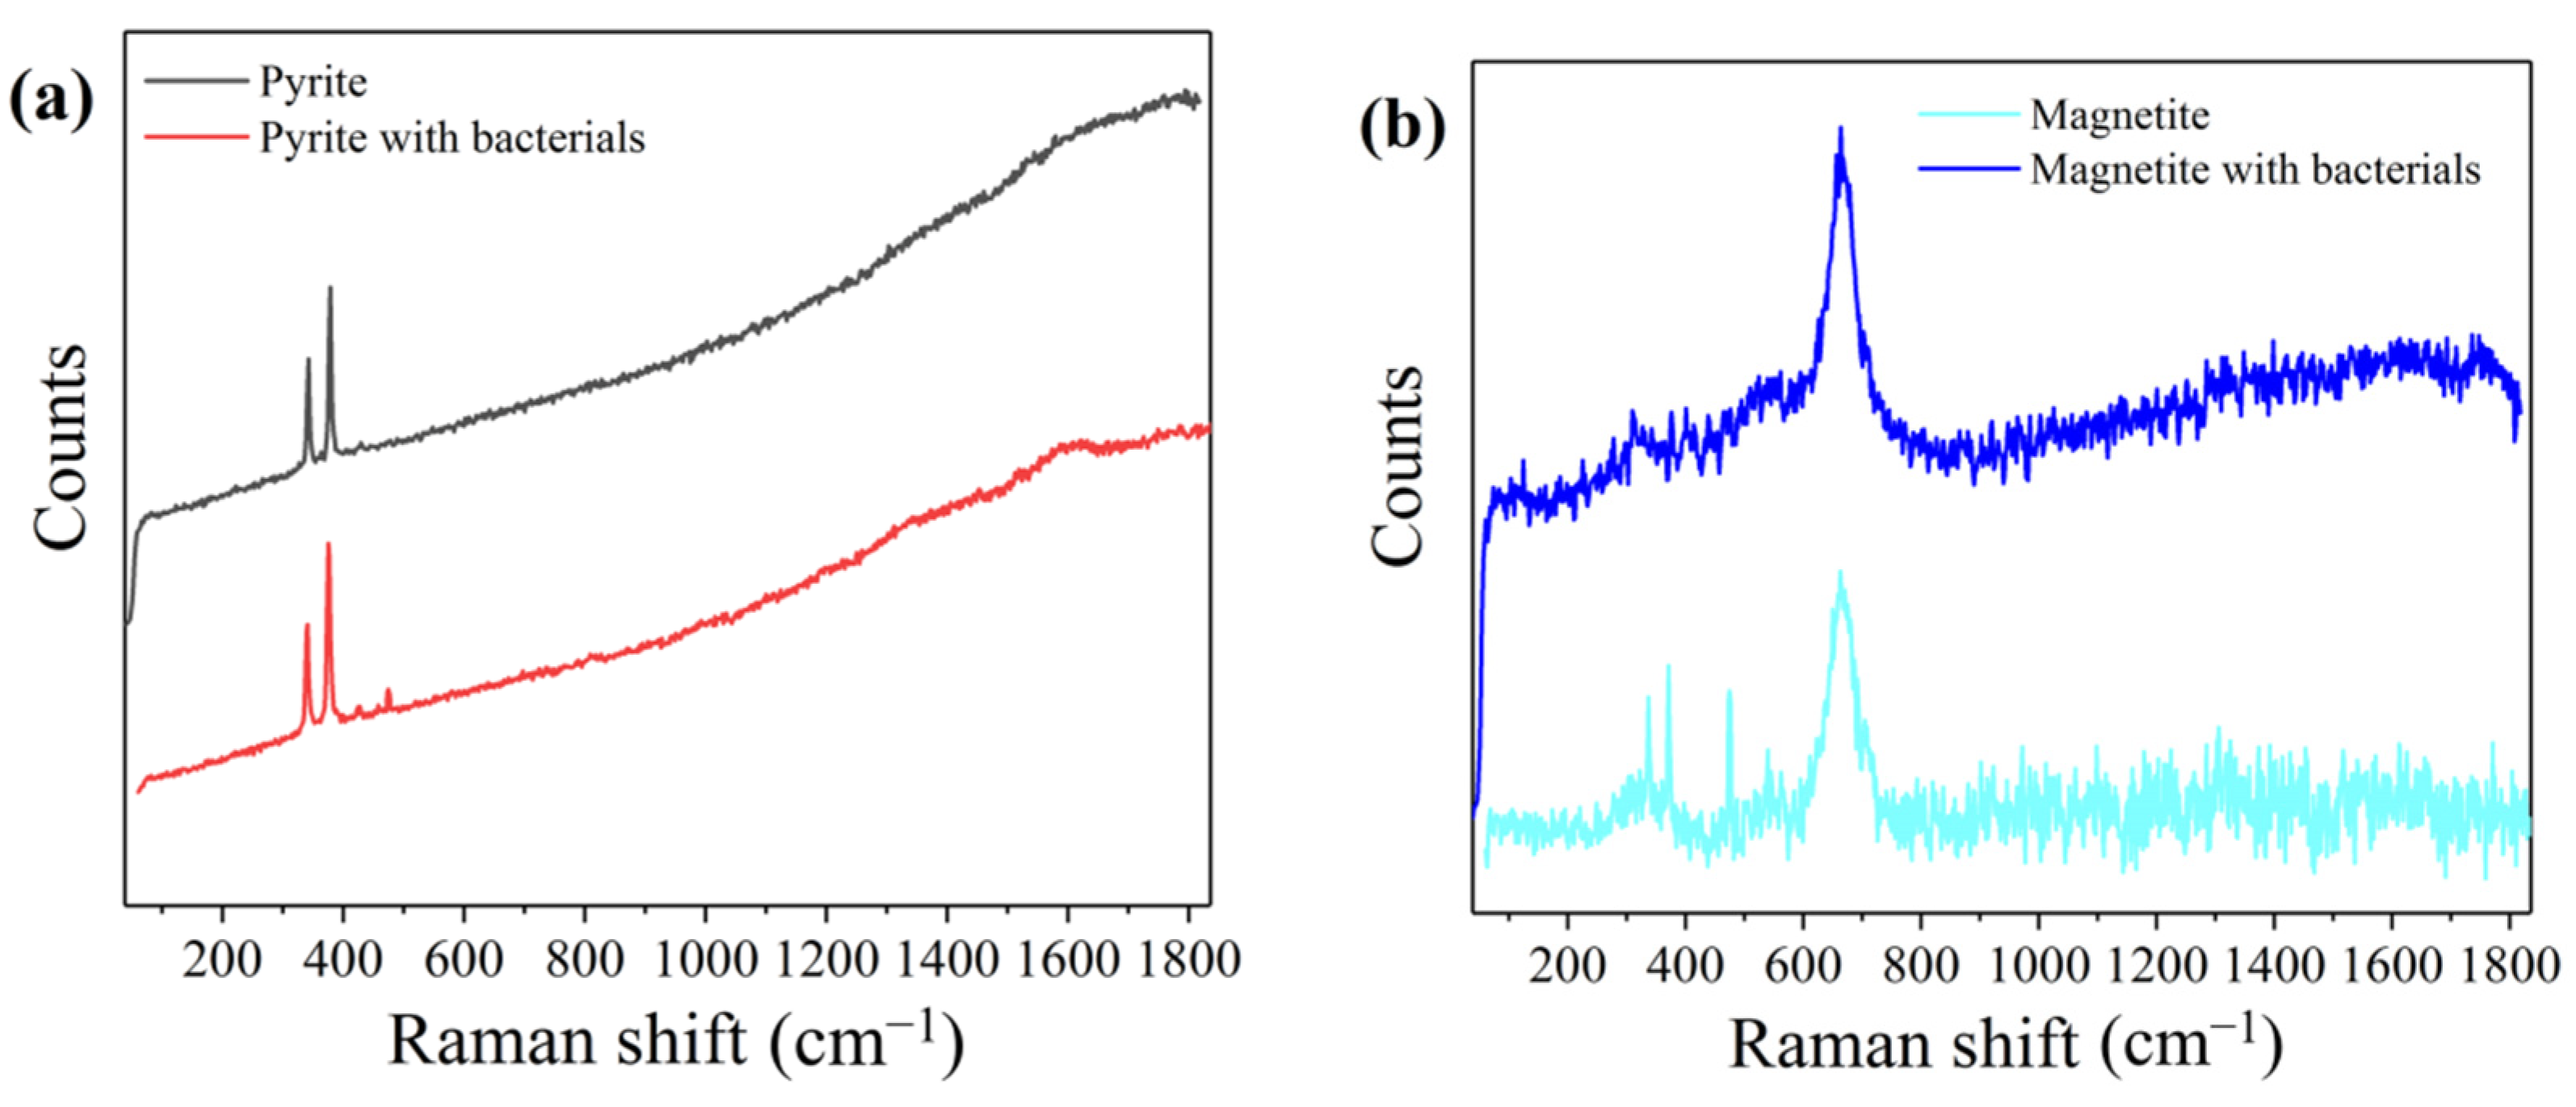
To further study the role of minerals in the Cr (VI) reduction system, we analyzed the minerals in the mineral and bacteria group and the single mineral group by Raman spectroscopy. The results are shown in Figure 5. In the pyrite system, the group in the presence of bacteria and that in the absence of bacteria peak at 342.22 cm−1 and 378.22 cm−1, respectively, which are the characteristic peaks of pyrite. However, the mineral and bacteria group had a peak at 473 cm−1, but not the single-mineral group in which the peak represents polysulfide. This can be attributed to microbes being responsible for the formation of polysulfides [32].
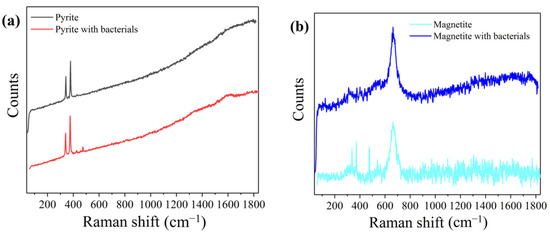
Figure 5.
Raman spectra of pyrite and magnetite in different Cr (VI) reduction systems: (a) pyrite group, (b) magnetite group.
The peak at 662 cm−1 of the Raman spectrum in the magnetite system is a characteristic peak of magnetite. The single mineral group has peaks at 302 cm−1, 380 cm−1, 497 cm−1, 534 cm−1, and 662 cm−1, which represent Fe3O4 (302, 513, 534, 663 cm−1), FeOOH (252, 380, 526, 650, 1307 cm−1), and Fe2O3 (227, 246, 293, 411, 497, 612, 1320 cm−1) [33]. However, these peaks were absent in the mineral and bacteria group, indicating that a large amount of Fe (III) was reduced by the microorganisms.
3.6. Electrochemical Analysis
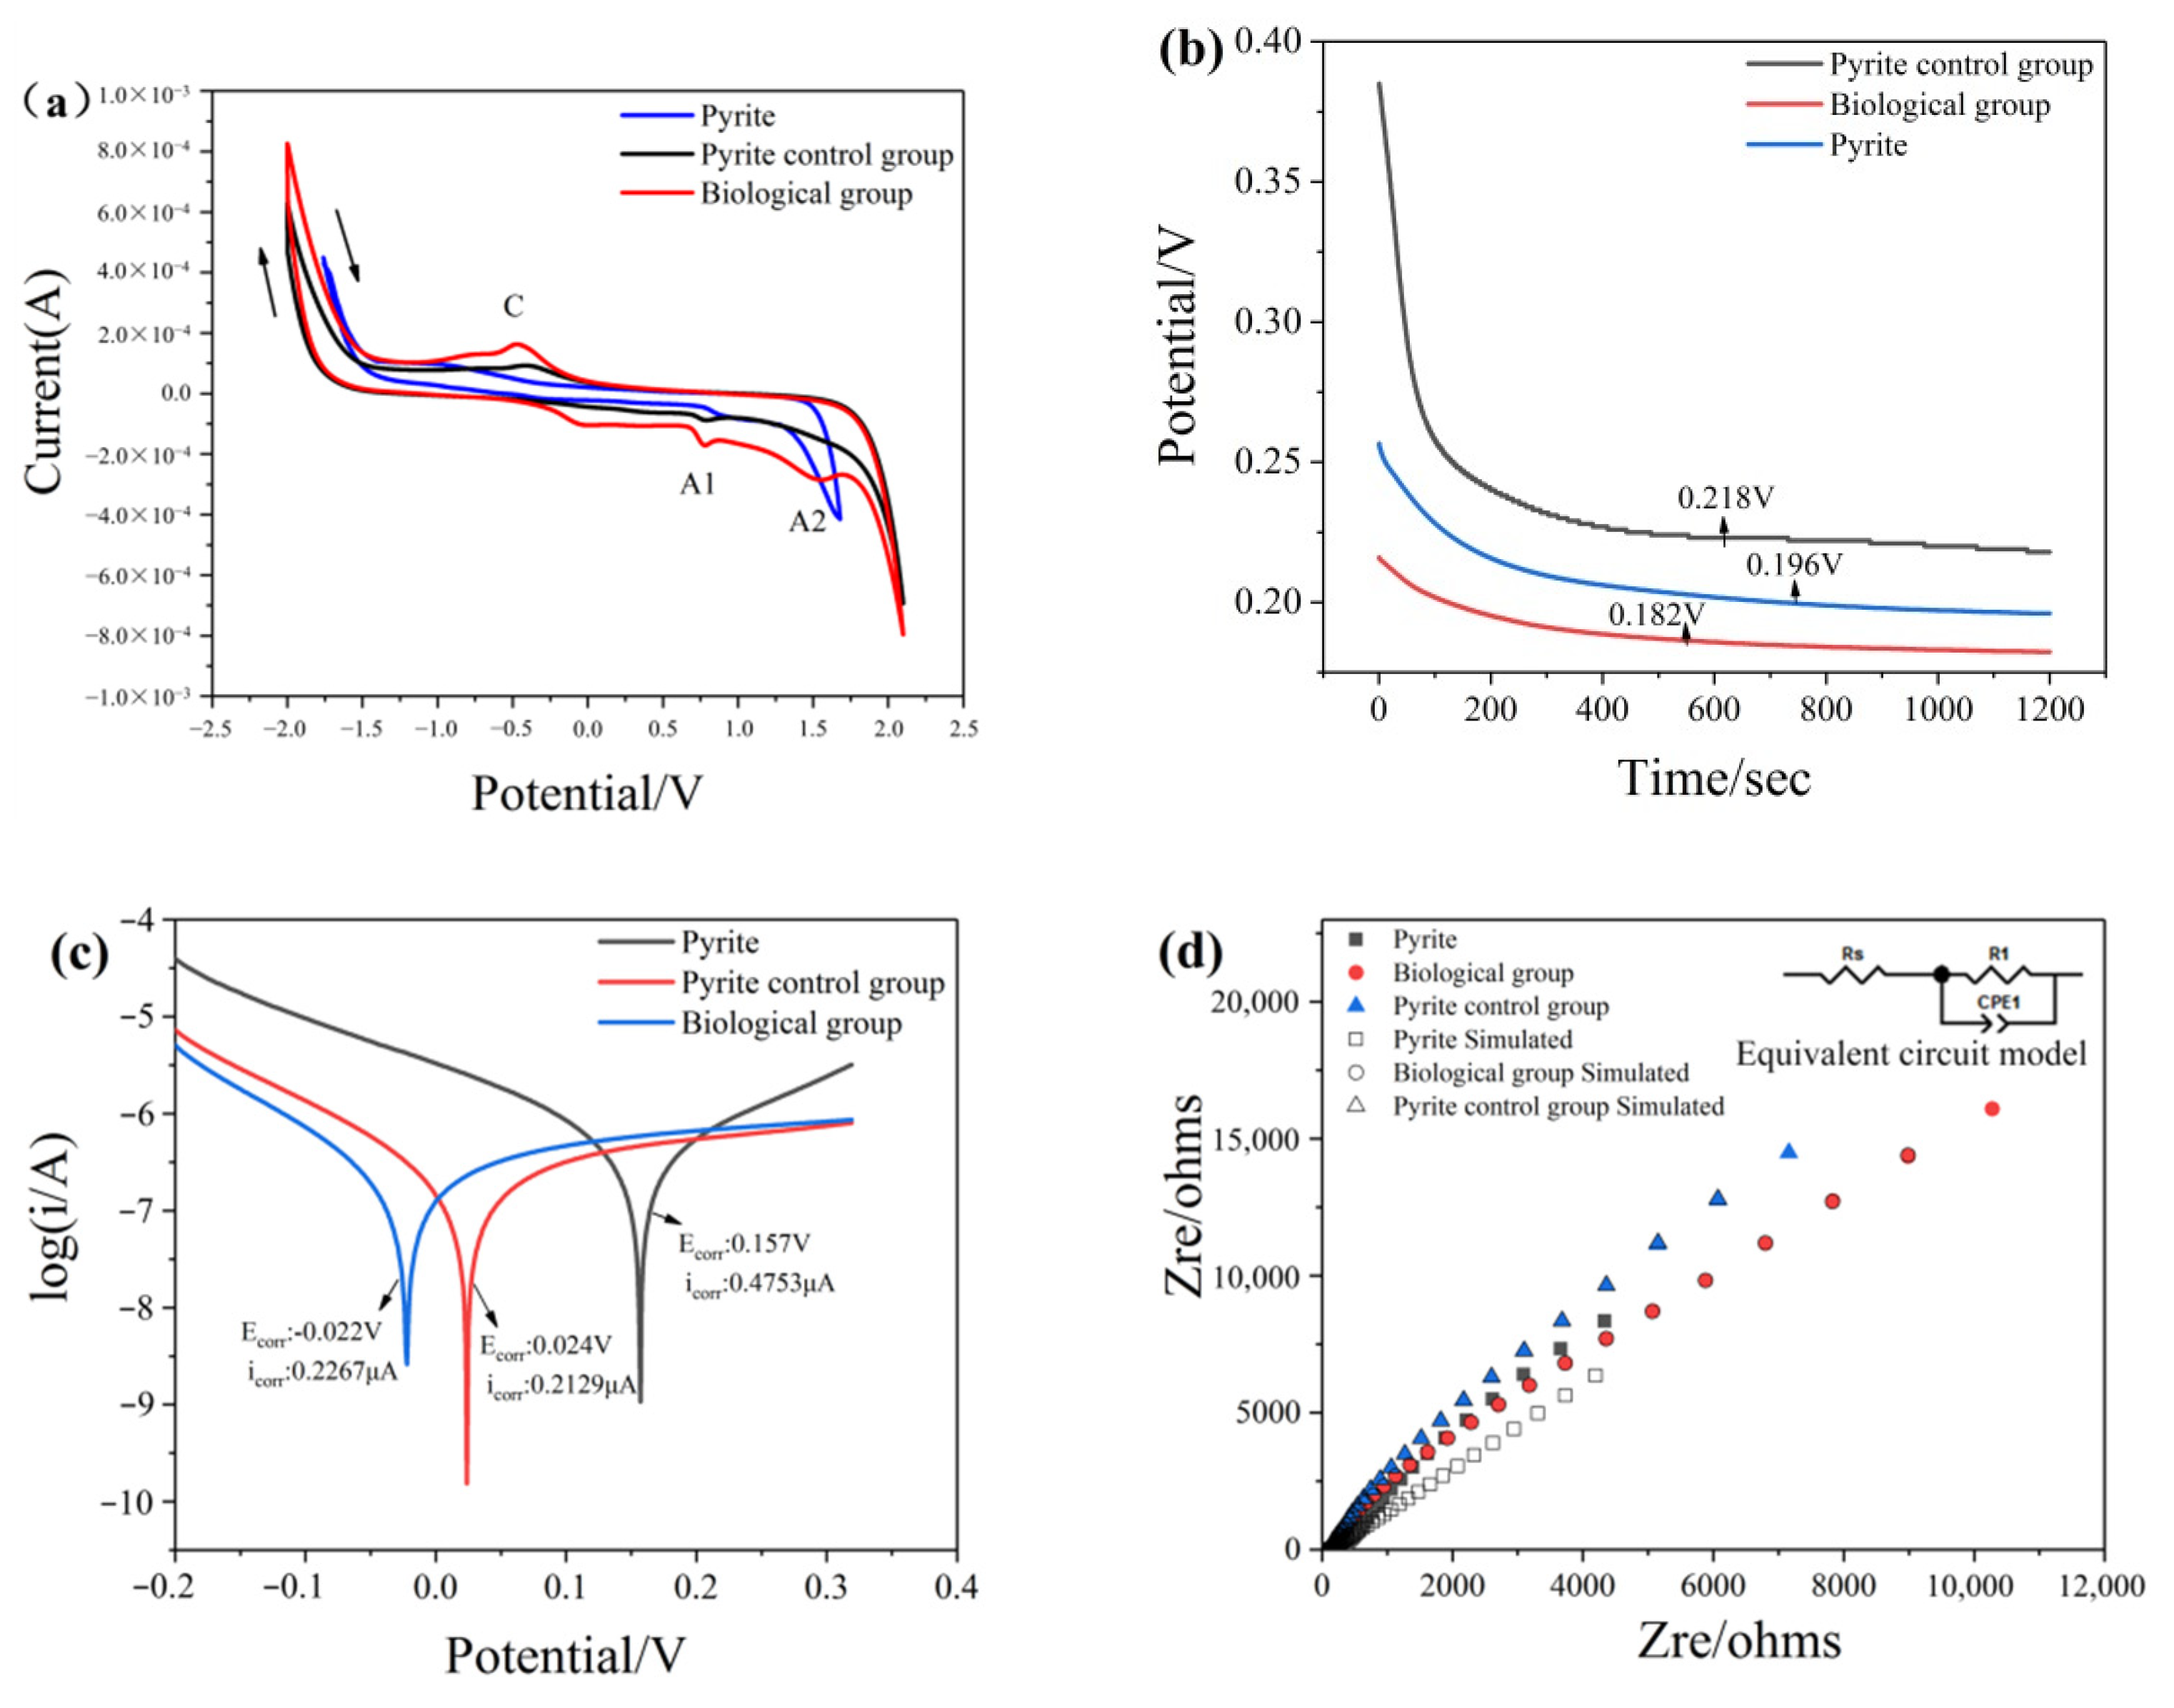
Electrochemical experiments are used to reveal the possible reactions of mineral surfaces and the ability of minerals to conduct electrons. Cyclic voltammetry (CV) reflects the kinetics and thermodynamics of the electrochemical dissolution process of minerals under various conditions. The results measured by CV are shown in Figure 6a and Figure 7a, which are directly related to the redox reactions occurring on the mineral surface. The corresponding reactions of anodic-cathodic peaks (C–A2) are shown in Equations (9)–(11) [34].

Figure 6.
Electrochemical analysis of pyrite before and after treatment with or without chromium solution: (a) Cyclic voltammetry curves; (b) Open circuit potential; (c) Tafel curves; (d) Nyquist impedance spectra.
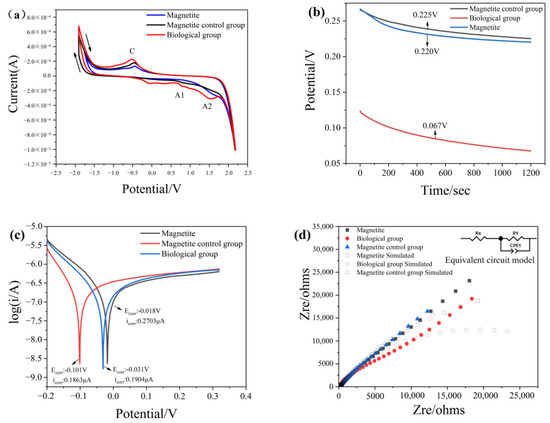
Figure 7.
Electrochemical analysis of magnetite before and after treatment with or without chromium solution: (a) Cyclic voltammetry curves; (b) Open circuit potential; (c) Tafel curves; (d) Nyquist impedance spectra.
Figure 6a and Figure 7a show that the peak of minerals treated with bacteria and chromium solution becomes more pronounced and that the peak current is larger than that of the group without bacteria, which indicates that the addition of bacteria can promote electron transfer on the mineral surface. At the same time, the low current density of the group in the absence of bacteria proved that the passivation layer generated on the surface hindered the reaction from continuing.
The open-circuit potential (OCP) is a thermodynamic parameter reflecting the corrosion resistance of materials [19]. A low OCP value indicates that materials are more easily corroded or oxidized. Conversely, a high OCP value means that materials need a higher redox potential to be oxidized. Figure 6b and Figure 7b show the OCP of the minerals in different treatments. The result indicates that the OCP of minerals treated with bacteria and chromium solution is lower than that treated with chromium solution alone. This means that in the presence of microorganisms, the surface of the mineral has strong redox reaction activity, and minerals more easily receive and conduct electrons. Microorganisms increase the reactivity of mineral surfaces.
The Tafel polarization curves of marmatite electrodes pretreated with different conditions were measured. The oxidative corrosion potential (Ecorr) is a thermodynamic parameter, and the corrosion current density (icorr) is a kinetic parameter. In the Tafel curves, the corrosion current density (i0) can be obtained from the slope of the cathode or anode curve. Figure 6c and Figure 7c show the oxidative corrosion potential (0.024 V and 0.101 V) of the minerals treated with a bacteria and chromium solution, which was significantly increased compared with that of the minerals treated with the chromium solution alone (0.022 V and 0.031 V). The corrosion current density (0.2129 μA and 0.1863 μA) of the group with only the addition of chromium solution was lower than that of the group in the presence of bacteria and chromium solution (0.2267 μA and 0.1904 μA). This result indicates that minerals with bacteria are more likely to receive and conduct electrons than those without bacteria, thus resulting in the oxidation of the mineral surface. This may be because the microbial anaerobic reduction treatment can enhance the activity of electron transference on the surface of minerals.
To elucidate the reaction rate and charge transfer abilities of mineral surfaces, electrochemical impedance spectroscopy (EIS) measurements were performed on electrodes prepared under different conditions in the frequency range of 1 Hz to 105 Hz (Supplementary Materials Figures S1 and S2). Figure 6d and Figure 7d show an equivalent circuit where Rs and R1 represent the solution resistance and charge transfer resistance, respectively. The CPE component corresponds to the influence of the passivation layer–electrolyte interface. The parameters can be obtained by fitting the equivalent circuit, and Table 3 summarizes the values of Rs and R1. The charge transfer resistance can be obtained with Equation (12).
Table 3.
Impedance parameters for the equivalent circuit.
The value of i0 represents the exchange current density of the electrochemical reaction. Rs is a characteristic amount indicating the electron transfer rate in the process of mineral dissolution, which reflects the inherent velocity of the electrochemical reaction. All the values of R1 were much larger than those of RS, revealing that the charge transfer resistance was the main limiting factor of mineral dissolution. The high value of Rs generally indicates that the electrochemical reaction kinetics are slow. Moreover, the Rs of the single mineral group was larger than that of the mineral and bacterial groups, demonstrating that the electrochemical reaction was hindered in the absence of bacteria. Conversely, in the presence of bacteria, iron-based minerals have better electronic conductivity, which is beneficial to the reduction of Cr (VI).
3.7. Changes in Microbial Community Structure
Microbial community structure information was obtained by Illumina MiSeq sequencing. Table 4 shows the diversity and abundance of microbial communities during the reaction of the two groups of samples. A coverage >99.8% indicates that the sequencing data were reliable. The ACE and Chao1 values indicate the abundance of microbial community species, revealing that the total microbial content of pyrite (P) decreased in the later stage of the experiment and showed a downward trend compared to the initial bacteria. In contrast, the trend of the total content of microbes in magnetite (M) decreased first and then increased, exceeding the initial bacterial content in the later period. Notably, the abundance of the pyrite group is significantly lower than that of the magnetite addition group. The Shannon and Simpson indices were used to estimate the microbial diversity of the two groups. It was found that the microbial diversity index of the magnetite group and the pyrite group showed an increasing trend with the reduction process, and both were higher than the initial bacteria. Bonaglia, S et al. [35] also found a similar situation in anaerobic culture. This may be due to a decrease in the Cr (VI) content in the later stage and a decrease in the toxic effect on microorganisms, resulting in an increase in microbial activity, thereby promoting microbial growth and reproduction.
Table 4.
Alpha diversity index of the magnetite and pyrite systems during Cr (VI) reduction.
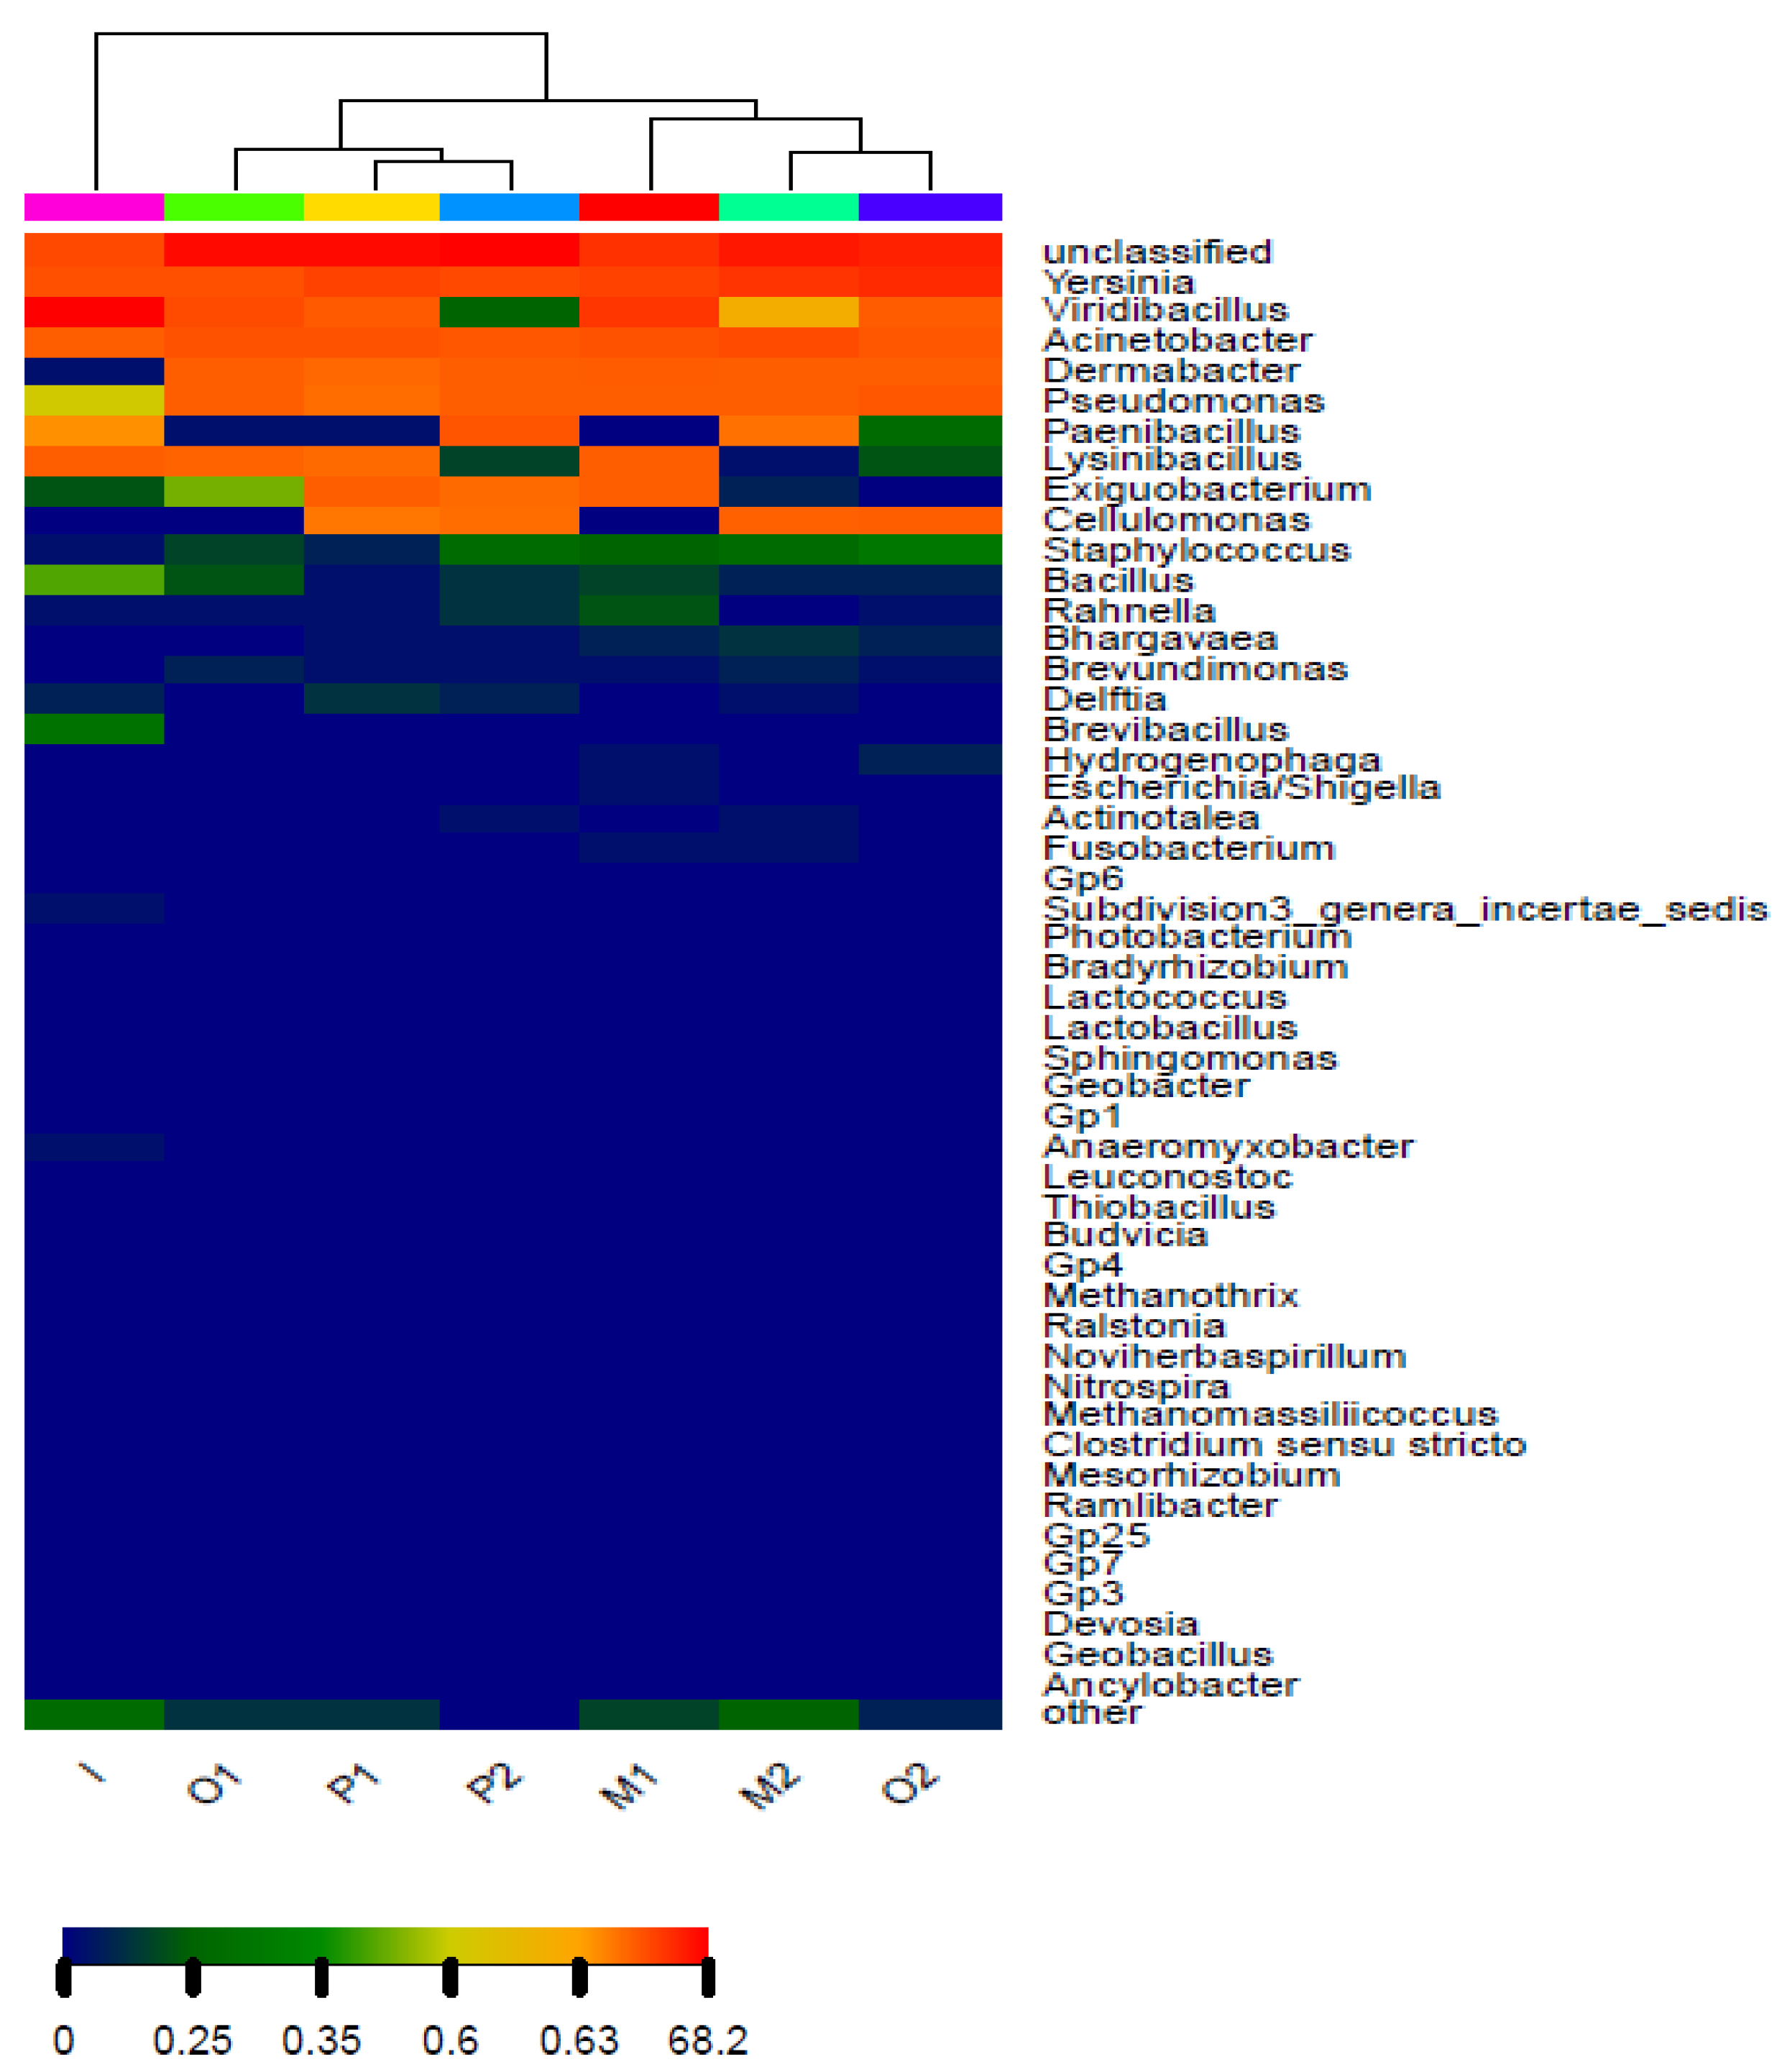
In the process of Cr (VI) reduction, the microbial community structure changed with the change in environmental factors. At the phylum level, as the experiment progressed, the relative content of Proteobacteria and Actinobacteria increased, while the relative content of Anaerolineae decreased, as shown in Supplementary Materials Figure S3. This may be because Cr (VI) can play a directional screening role so that the content of dominant bacteria gradually increases, resulting in changes in the microbial community structure in the system. At the genus level, cluster analysis was performed on different sample groups. As shown in Figure 8, the contents of Yersinia and Acinetobacter in the pyrite group and the magnetite group are very rich. The unclassified genus is most likely a new genus; its proportion is very high in each sample group, and the content ranges from 12.36% to 40.28%. Among them, the unknown genus accounts for the largest proportion of the pyrite group.

Figure 8.
Hierarchical cluster analysis of different Cr (VI) reduction groups based on the relative abundance of the genus.
The process of anaerobic reduction of Cr (VI) greatly changed the community structure. Among the initial bacteria, Viridibacillus accounted for 68.07%. In the subsequent process of anaerobic reduction of Cr (VI), the content of Viridibacillus decreased significantly, and the proportion was reduced to 0.06–3.40%. The proportion of unclassified, Yersinia, and Acinetobacter showed an increasing trend. It shows that in the process of anaerobic reduction of Cr (VI), unclassified, Yersinia, and Acinetobacter make a great contribution to the reduction of Cr (VI) and promote the dissolution of Fe ions.
3.8. PICRUSt Function Prediction
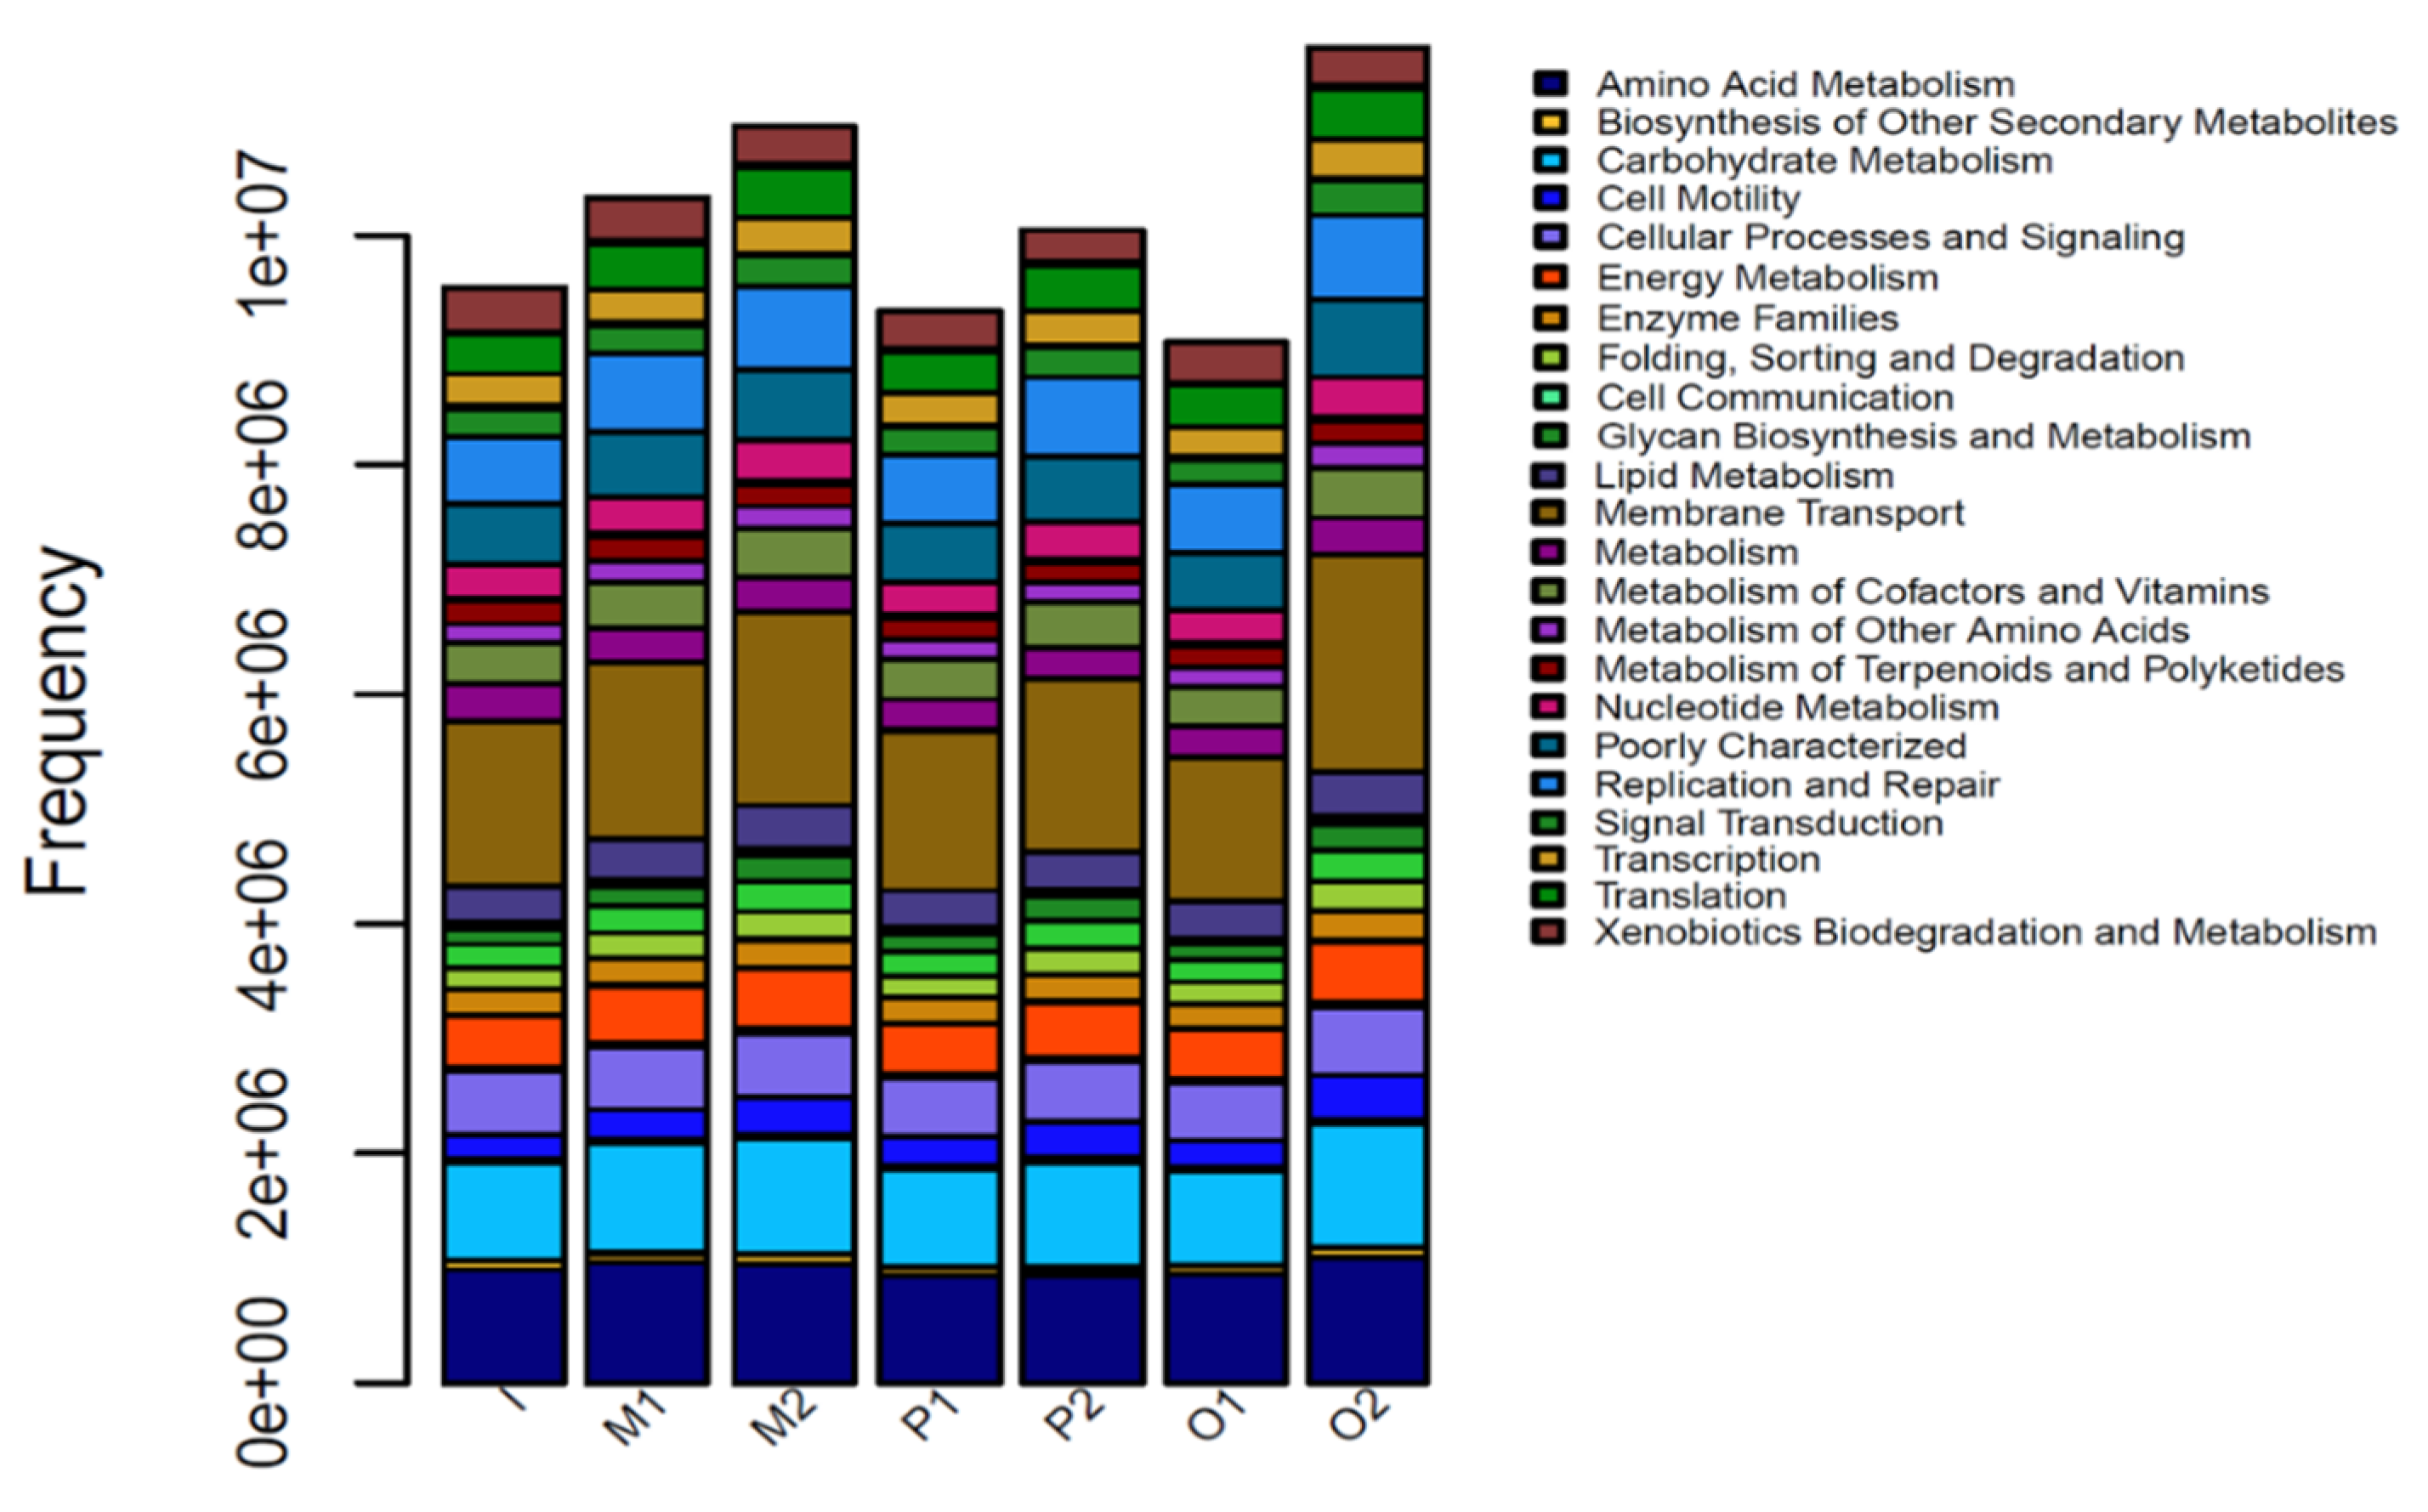
The functional gene composition of the 16S sequencing community can be inferred from the function of the sequenced microbial gene. This is beneficial for understanding the functional composition of different samples and the functional differences between groups. Figure 9 is a functional structure distribution diagram of different experimental systems based on the PICRUSt function’s prediction. Among them, Membrane Transport has the highest proportion of genes, followed by Amino Acid Metabolism and Carbohydrate Metabolism. According to the literature, extracellular respiratory bacteria generate electrons by oxidizing organic substances under anaerobic conditions and then transfer electrons to extracellular electron acceptors via an electron transport chain to complete anaerobic respiration. If extracellular respiratory bacteria complete extracellular electron transfer and high-valent metal reduction, such as Cr (VI) and Fe (III), and then the cell membrane mediation is essential, so organic metabolism and membrane transport functions are important functional components.
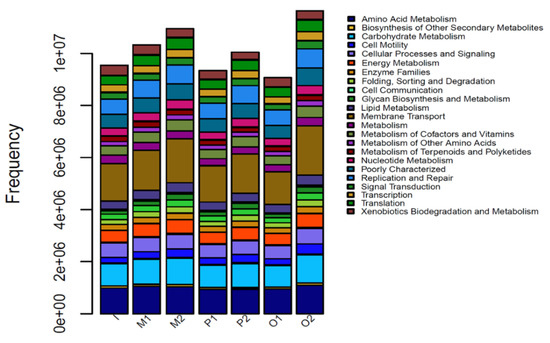
Figure 9.
Distribution of functional structure based on KEGG.
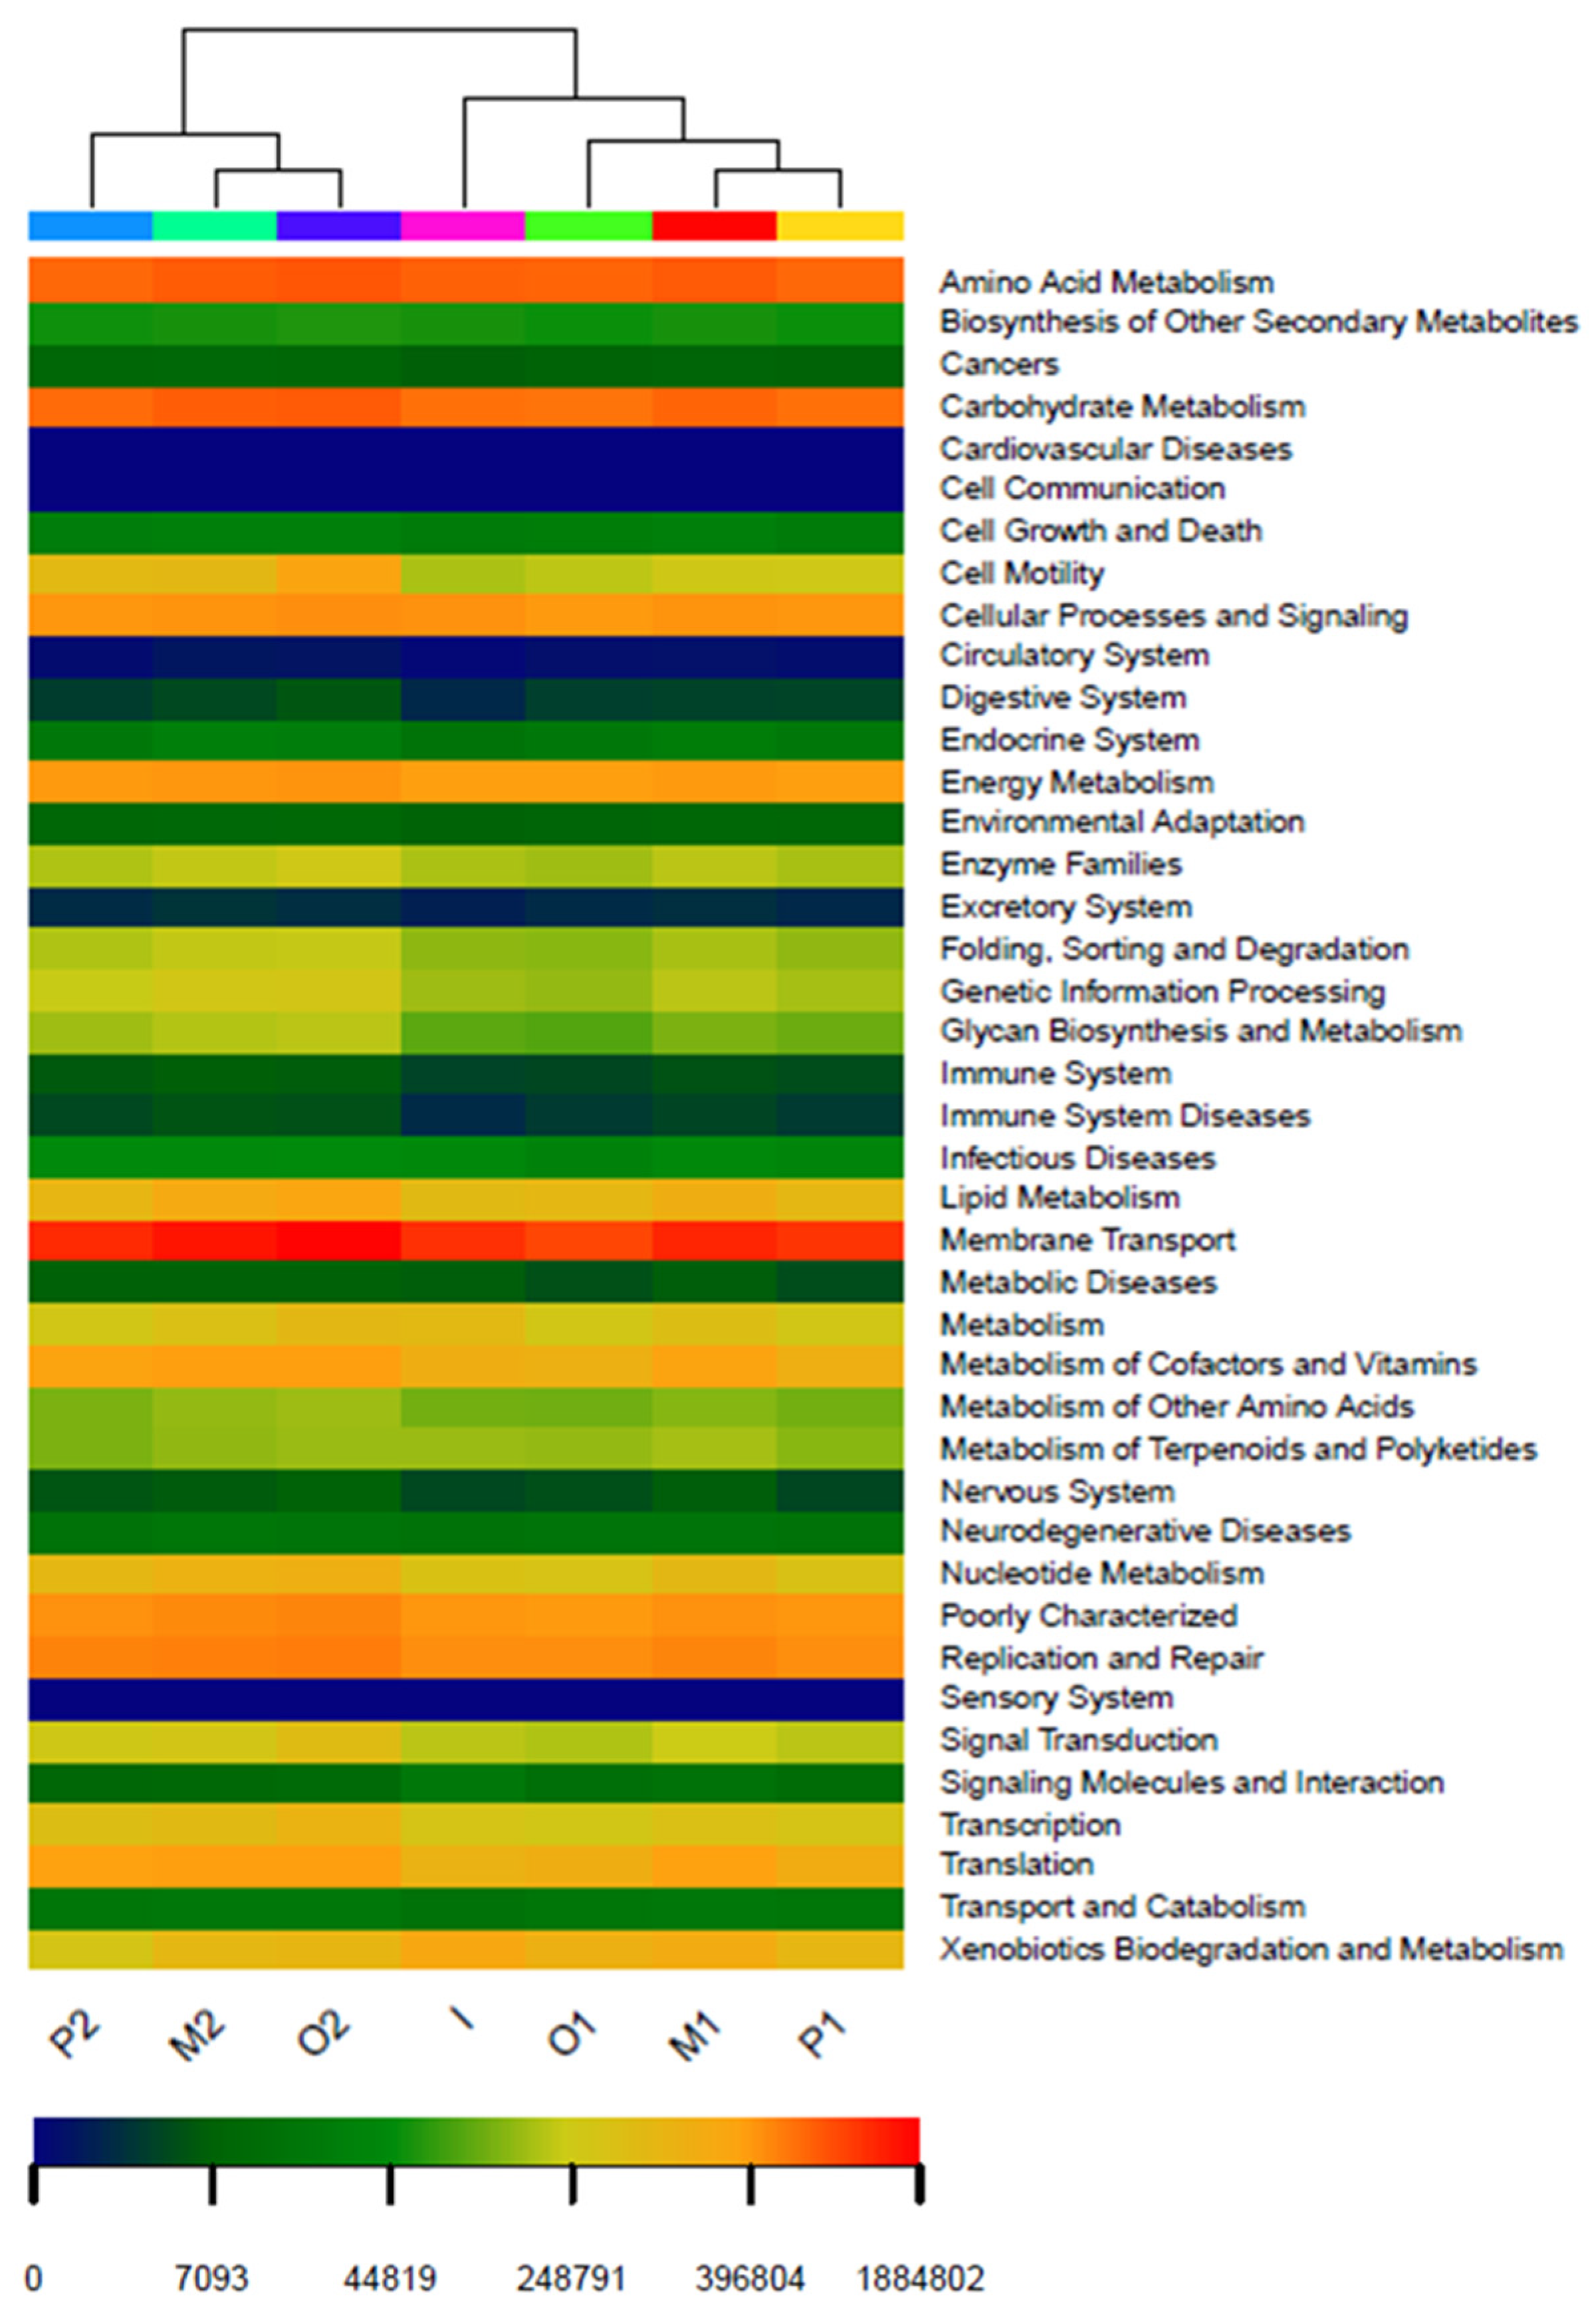
To more clearly distinguish the functional structure differences between samples, the similarity analysis of different iron ore systems was carried out using a hierarchical cluster analysis (Figure 10). The results show that the sample groups at the same time are close to each other and that their similarity is high. The sample groups at different times were far away, indicating that the function of the microbial community was more correlated with time. The addition of iron ore also affects the function of the microbial community.
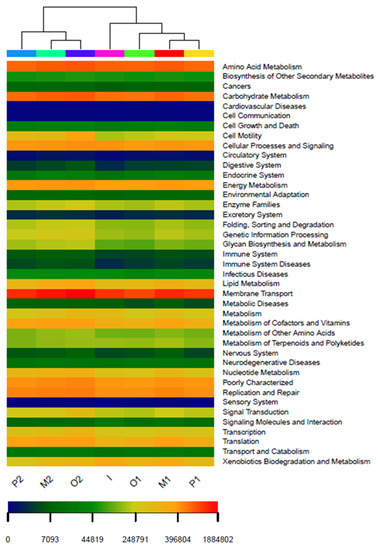
Figure 10.
Hierarchical cluster analysis of the relative abundance of functions based on KEGG.
4. Conclusions
Unlike the single reduction system of a single iron-based mineral, we considered the influence of microorganisms on the reduction of Cr (VI) by iron-based minerals. We investigated the performance of different minerals in cooperating with anaerobic bacteria to remove Cr (VI) and the effect of this process on the structure of the microbial community. The results showed that the synergistic effect of microorganisms and minerals can greatly promote the reduction efficiency of Cr (VI). Mechanistic studies found that the presence of microorganisms can reduce the passivation layer formed in the mineral reaction process and promote electron transfer in the redox process. For the function of the microbial community, both the dissolution of Fe ions and the disappearance of Cr (VI) changed the community structure and affected the expression of its functions. Consequently, our work provides a reference for investigating the change in the mineral morphology and the evolution mechanism of community adaptability in the process of the synergistic restoration of pollutants by microbial flora.
Supplementary Materials
The following supporting information can be downloaded at: https://www.mdpi.com/article/10.3390/min12040460/s1, Figure S1: Bode plots of pyrite before and after treatment with or without chromium solution; Figure S2: Bode plots of magnetite before and after treatment with or without chromium solution; Figure S3: Relative abundance of phyla in different Cr(VI) reduction systems.
Author Contributions
Conceptualization, M.G. and P.L.; methodology, J.Z. (Jinglei Zhu); software, P.H.; validation, M.L.; formal analysis, Y.C.; investigation J.Z. (Jinglei Zhu); resources, J.Z. (Jianyu Zhu); data curation, P.L.; writing—original draft preparation, P.L.; writing—review and editing, J.Z. (Jinglei Zhu); visualization, M.L.; supervision, M.G.; project administration, J.Z. (Jianyu Zhu). All authors have read and agreed to the published version of the manuscript.
Funding
This research was funded by the National Natural Science Foundation of China (41773089) and the science and technology innovation Program of Hunan Province, China (2021RC1001).
Acknowledgments
This research was supported by the National Natural Science Foundation of China (41773089) and the science and technology innovation Program of Hunan Province, China (2021RC1001).
Conflicts of Interest
The authors declare no conflict of interest.
References
- Locq, D.; Caron, P.; Ramusat, C.; Mevrel, R. Quaternary chromium-based alloys strengthened by Heusler phase precipitation. Mater. Sci. Eng. A 2015, 647, 322–332. [Google Scholar] [CrossRef]
- Wang, X. Research Progress of Chromium Pollution in Soil Remediation Technology. Environ. Sustain. Dev. 2014, 39, 210–212. [Google Scholar]
- Yao, J.J.; Wang, M.R.; Zhang, H.X.; Peng, L.J.; Zhou, Y.X.; Tian, Y.I. Research Advances on Remediation Technology of Chromium Pollution in Nature Water. Mod. Agric. Sci. Technol. 2016, 23, 177–178. [Google Scholar]
- Mandal, S.; Sarkar, B.; Bolan, N.; Ok, Y.S.; Naidu, R. Enhancement of chromate reduction in soils by surface modified biochar. J. Environ. Manag. 2017, 186, 277–284. [Google Scholar] [CrossRef] [PubMed]
- Thorgersen, M.P.; Andrew, L.W.; Ge, X.; Zane, G.M.; Wetmore, K.M.; Vaccaro, B.J.; Poole, F.L.; Younkin, A.D.; Deutschbauer, A.M.; Arkin, A.P. Mechanisms of Chromium and Uranium Toxicity in Pseudomonas stutzeri RCH2 Grown under Anaerobic Nitrate-Reducing Conditions. Front. Microbiol. 2017, 8, 1529. [Google Scholar] [CrossRef]
- Gan, M.; Li, J.; Sun, S.; Ding, J.; Zhu, J.; Liu, X.; Qiu, G. Synergistic effect between sulfide mineral and acidophilic bacteria significantly promoted Cr(Ⅵ) reduction. J. Environ. Manag. 2018, 219, 84–94. [Google Scholar] [CrossRef]
- Barrera-Diaz, C.E.; Lugo-Lugo, V.; Bilyeu, B. A review of chemical, electrochemical and biological methods for aqueous Cr(VI) reduction. J. Hazard. Mater. 2012, 223–224, 1–12. [Google Scholar] [CrossRef]
- Shang, J.; Zong, M.; Yu, Y.; Kong, X.; Du, Q.; Liao, Q. Removal of chromium (VI) from water using nanoscale zerovalent iron particles supported on herb-residue biochar. J. Environ. Manag. 2017, 197, 331–337. [Google Scholar] [CrossRef]
- Liang, J.; Tang, D.; Wu, H.; Wang, L. Environment corrosion behavior of cargo oil tank deck made of Cr-contained low-alloy steel. J. Southeast Univ. 2013, 43, 152–157. [Google Scholar]
- Joe-Wong, C.; Brown, G.E., Jr.; Maher, K. Kinetics and Products of Chromium(VI) Reduction by Iron(II/III)-Bearing Clay Minerals. Environ. Sci. Technol. 2017, 51, 9817–9825. [Google Scholar] [CrossRef] [Green Version]
- Lin, Y.T.; Huang, C.P. Reduction of chromium(VI) by pyrite in dilute aqueous solutions. Sep. Purif. Technol. 2008, 63, 191–199. [Google Scholar] [CrossRef]
- Thavamani, P.; Samkumar, R.A.; Satheesh, V.; Subashchandrabose, S.R.; Ramadass, K.; Naidu, R.; Venkateswarlu, K.; Megharaj, M. Microbes from mined sites: Harnessing their potential for reclamation of derelict mine sites. Environ. Pollut. 2017, 230, 495–505. [Google Scholar] [CrossRef] [PubMed]
- Lovley, D.R. Extracellular electron transfer: Wires, capacitors, iron lungs, and more. Geobiology 2008, 6, 225–231. [Google Scholar] [CrossRef] [PubMed]
- Gralnick, J.A.; Newman, D.K. Extracellular respiration. Mol. Microbiol. 2007, 65, 1–11. [Google Scholar] [CrossRef] [Green Version]
- Zhou, B.-J.; Chen, T.-H. Biodegradation of phenol with chromium (VI) reduction by the Pseudomonas sp strain JF122. Desalination Water Treat. 2016, 57, 3544–3551. [Google Scholar] [CrossRef]
- Xafenias, N.; Zhang, Y.; Banks, C.J. Enhanced Performance of Hexavalent Chromium Reducing Cathodes in the Presence of Shewanella oneidensis MR-1 and Lactate. Environ. Sci. Technol. 2013, 47, 4512–4520. [Google Scholar] [CrossRef] [Green Version]
- Kato, S.; Nakamura, R.; Kai, F.; Watanabe, K.; Hashimoto, K. Respiratory interactions of soil bacteria with (semi)conductive iron-oxide minerals. Environ. Microbiol. 2010, 12, 3114–3123. [Google Scholar] [CrossRef]
- Rotaru, A.E.; Calabrese, A.F.; Stryhanyuk, B.H.; Musat, B.F.; Shrestha, B.P.M. Conductive Particles Enable Syntrophic Acetate Oxidation between Geobacter and Methanosarcina from Coastal Sediments. Mbio 2018, 9, e00218–e00226. [Google Scholar] [CrossRef] [Green Version]
- Meng, X.; Zhao, H.; Sun, M.; Zhang, Y.; Qiu, G. The role of cupric ions in the oxidative dissolution process of marmatite: A dependence on Cu2+ concentration. Sci. Total Environ. 2019, 675, 213–223. [Google Scholar] [CrossRef]
- Wu, J.; Gao, W.; Zhang, W.; Meldrum, D.R. Optimization of whole-transcriptome amplification from low cell density deep-sea microbial samples for metatranscriptomic analysis. J. Microbiol. Methods 2011, 84, 88–93. [Google Scholar] [CrossRef]
- Gan, M.; Song, Z.; Jie, S.; Zhu, J.; Zhu, Y.; Liu, X. Biosynthesis of bifunctional iron oxyhydrosulfate by Acidithiobacillus ferroxidans and their application to coagulation and adsorption. Mater. Sci. Eng. C 2016, 59, 990–997. [Google Scholar] [CrossRef] [PubMed]
- Graham, A.M.; Bouwer, E.J. Oxidative dissolution of pyrite surfaces by hexavalent chromium: Surface site saturation and surface renewal. Geochim. Et Cosmochim. Acta 2012, 83, 379–396. [Google Scholar] [CrossRef]
- Jung, Y.; Choi, J.; Lee, W. Spectroscopic investigation of magnetite surface for the reduction of hexavalent chromium. Chemosphere 2007, 68, 1968–1975. [Google Scholar] [CrossRef] [PubMed]
- Li, Y.; Liang, J.; Yang, Z.; Wang, H.; Liu, Y. Reduction and immobilization of hexavalent chromium in chromite ore processing residue using amorphous FeS2. Sci. Total Environ. 2018, 685, 315–323. [Google Scholar] [CrossRef]
- Derycke, V.; Kongolo, M.; Benzaazoua, M.; Mallet, M.; Barres, O.; De Donato, P.; Bussiere, B.; Mermillod-Blondin, R. Surface chemical characterization of different pyrite size fractions for flotation purposes. Int. J. Miner. Process. 2013, 118, 1–14. [Google Scholar] [CrossRef]
- Tu, Z.; Guo, C.; Zhang, T.; Lu, G.; Wan, J.; Liao, C.; Dang, Z. Investigation of intermediate sulfur species during pyrite oxidation in the presence and absence of Acidithiobacillus ferrooxidans. Hydrometallurgy 2017, 167, 58–65. [Google Scholar] [CrossRef]
- Wang, X.-N.; Sun, G.-X.; Zhu, Y.-G. Thermodynamic energy of anaerobic microbial redox reactions couples elemental biogeochemical cycles. J. Soils Sediments 2017, 106, 37–47. [Google Scholar] [CrossRef]
- Xu, X.; Yang, Y.; Jia, Y.; Lian, X.; Zhang, Y.; Feng, F.; Liu, Q.; Xi, B.; Jiang, Y. Heterogeneous catalytic degradation of 2,4-dinitrotoluene by the combined persulfate and hydrogen peroxide activated by the as-synthesized Fe-Mn binary oxides. Chem. Eng. J. 2019, 374, 776–786. [Google Scholar] [CrossRef]
- Moses, C.O.; Nordstrom, D.K.; Herman, J.S.; Mills, A.L. Aqueous pyrite oxidation by dissolved oxygen and by ferric iron. Geochim. Et Cosmochim. Acta 1987, 51, 1561–1571. [Google Scholar] [CrossRef]
- Vedavathi, A.; Reddy, Y.M.; Reddy, K. Effect of Precursor Concentration on Structural and Morphological Properties of Iron Pyrite Thin Films. Procedia Mater. Sci. 2015, 10, 279–284. [Google Scholar] [CrossRef] [Green Version]
- Wang, C.L.; Zhang, P.; Chen, Y.H.; Pan, J.Y.; Wang, J.; Qi, J.Y.; Li, X.P.; Liu, J. Study on the purification property of pyrite and its spectra on the processing of metal-bearing wastewater. Environ. Earth Sci. 2010, 61, 939–945. [Google Scholar] [CrossRef]
- Fleischer, K.; Caffrey, D.; Farrell, L.; Norton, E.; Mullarkey, D.; Arca, E.; Shvets, I.V. Raman spectra of p-type transparent semiconducting Cr2O3:Mg. Thin Solid Film 2015, 594, 245–249. [Google Scholar] [CrossRef] [Green Version]
- Lazor, S.P. Raman spectroscopic study of magnetite (FeFe2O4): A new assignment for the vibrational spectrum. J. Solid State Chem. 2003, 174, 424–430. [Google Scholar]
- Chen, G.; Yang, H. Electrochemical study on Surface Oxidation of Natural Pyrite in Ferric Sulfate Solution. Int. J. Electrochem. Sci. 2019, 14, 7047–7061. [Google Scholar] [CrossRef]
- Bonaglia, S.; Broman, E.; Brindefalk, B.; Hedlund, E.; Hjorth, T.; Rolff, C.; Nascimento, F.J.A.; Udekwu, K.; Gunnarsson, J.S. Activated carbon stimulates microbial diversity and PAH biodegradation under anaerobic conditions in oil-polluted sediments. Chemosphere 2020, 248, 126023. [Google Scholar] [CrossRef] [PubMed]


Publisher’s Note: MDPI stays neutral with regard to jurisdictional claims in published maps and institutional affiliations. |
© 2022 by the authors. Licensee MDPI, Basel, Switzerland. This article is an open access article distributed under the terms and conditions of the Creative Commons Attribution (CC BY) license (https://creativecommons.org/licenses/by/4.0/).