Article

Prediction and Potential Treatment of Underground Contaminated Water Based on Monitoring of pH and Salinity in a Coal Mine Waste Heap, Southern Poland

1
Department of Geoengineering and Raw Materials Extraction, Faculty of Mining, Safety Engineering and Industrial Automation, Silesian University of Technology (SUT), 2 Akademicka Street, 44-100 Gliwice, Poland
2
Research Institute on Mines and Environment (RIME), University of Quebec in Abitibi-Témiscamingue (UQAT), 445 University Boulevard, Rouyn-Noranda, QC J9X 5E4, Canada
3
Geology and Mine Surveying Department, Tauron Wydobycie SA, ul. Grunwaldzka 37, 43-600 Jaworzno, Poland
*
Author to whom correspondence should be addressed.
Minerals 2022, 12(4), 391; https://doi.org/10.3390/min12040391
Submission received: 24 February 2022 / Revised: 13 March 2022 / Accepted: 21 March 2022 / Published: 23 March 2022
(This article belongs to the Section Environmental Mineralogy and Biogeochemistry)

Abstract

:
This study presents a potential treatment method for contaminated groundwater from a waste heap in southern Poland. The method is based on the continuous monitoring of two parameters: pH and electrical conductivity (EC). Four years of historical monitoring data (2007–2010) were modeled using a Visual MODFLOW based numerical model of groundwater flow and migration of pollutants for low and high precipitation periods. Mapping the natural conditions in the numerical model allowed for the direction of contaminant migration in the aquifer to be identified. Groundwater treatment via injection of a nano zerovalent iron (nZVI) suspension into the aquifer was then designed; the target contaminant was Zn(II) because of its high concentrations and relatively high toxicity. Online monitoring for mining waste heaps is proposed to record sudden outflows of contaminants into the groundwater related to climate change and to take remedial action via nZVI injection. EC is the variable to be introduced into the contaminant migration model, which allows to determine the nZVI injection locations. As a result, the aquatic environment would be effectively and economically protected. The optimal use of nZVI, without intensively interfering with the environment, is ensured. This method is a convenient tool when making decisions to treat mining-impacted groundwater.

1. Introduction

Mining is an important contributing factor to the economy of several countries, but also a source of long-term environmental issues, especially due to the generation of large volumes of solid and liquid residual materials. Contaminated mine water (drainage, process water, pumped water from underground and surface mining, working water from road deicing or dust removal) can have a detrimental impact on natural receiving streams, traditionally due to the acidity and metal/metalloid load; more recently, the impact of secondary salinization and high sulfate concentrations has also been documented [1,2,3,4]. In fact, secondary salinization of natural water streams (from irrigation, mining, deicing salts for roads) is of emerging concern worldwide and the issue may be amplified by climate change [1]. The mines in the Upper Silesian Coal Basin, southern Poland are known for their characteristic feature of highly saline mine water, with electrical conductivity (EC) up to 74 mS/cm and chloride concentrations averaging 38 g/L [5]. Moreover, the mining industry in Poland is in a process of intensive transition, while the impact of climate change, especially the extreme weather events (e.g., increased precipitation, sudden and heavy rainfall, atmospheric pressure drops, and increased temperature), on industrial activities such as mining is still barely documented [6].
EC and total dissolved solids (TDS) are widely used physicochemical parameters of water quality to characterize the salinity level [7]. They are correlated through a simple equation: TDS = k × EC. The correlation constant (k) is easy to determine for freshwater but more complex for variable chemistry, such as in the case of mine water, including mine drainage. This is because the relationship between EC and TDS is not linear and depends on the activity of dissolved species and the ionic strength of the solution [8]. Moreover, while TDS needs to be analyzed gravimetrically in the laboratory, EC is easy and inexpensive to measure online for all types of water.
Mine drainage is considered saline if the TDS concentration exceeds 10 g/L [9]. Sulfate typically represents up to 70% of the TDS [10] and can be generated naturally through sulfide oxidation and dissolution of sulfur-bearable soluble compounds or as a result of mining operations (ore extraction and processing, deicing agents, pumping seawater in coastal areas). In addition to potential direct toxicity, high sulfate concentrations, similar to nitrates, have been reported to increase phosphate availability and mobility from sediments, and thus enhance eutrophication of the impacted water [11,12]. In one study, elevated concentrations of sulfate, sodium, and magnesium in mine water induced important changes in the biogeochemistry of a shallow sandy aquifer in a wet-dry tropical environment and detrimentally impacted the groundwater ecosystem below the tropical stream [13]. Hence, sulfate and EC are useful indicators for tracing acid mine drainage (AMD) contamination, as they are both extremely sensitive to AMD even when large dilutions occur [14]. However, sulfate analysis is more difficult in the field, because it is not removed to any great extent by sorption and precipitation processes since it is unaffected by fluctuations in pH [14].
A thorough review paper is available on the pertinence of continuous monitoring for the evaluation of the magnitude and impact of AMD at affected mine sites, and the determination of appropriate remedial actions [15]. The monitoring of mine drainage over time via the measurement of EC was also previously reported to be promising for various purposes, such as the evolution of AMD treatment efficiency by sulfate-reducing bacteria [16] and analysis of contaminant mixing and dilution in a river influenced by mine water discharges [4]. In addition, based on regression analysis, the most accurate predictions were achieved for sulfate concentrations by using equations for specific EC ranges or AMD sources, as well as the prediction of approximate concentrations of key metals when the pH of the water was within their respective solubilities [14]. Therefore, accurate and reliable monitoring methods are still necessary for proper long-term evaluation of the contaminant load in natural waters, following the mixing and dilution by mine drainage, under dry and wet conditions, including extreme precipitation events caused by climate change [4]. This timely information is crucial to define periods of necessary action on water treatment by addition of green and efficient materials, such as nano zerovalent iron (nZVI) [17,18].
Within this context, this study aims to develop a model calibrated on historical data for the prediction and treatment of contaminated groundwater based on the monitoring of pH and EC for a waste heap at a coal mine in southern Poland.
In this study, based on the conducted research, an inexpensive and effective method of minimizing the impact of leachate from the heap on the aquatic environment was proposed in the event of excessive atmospheric precipitation. It consists of on-line monitoring of groundwater, data transfer to a numerical model and, if necessary, remediation activities concentrated in a specific place and time. This method can only be used for mine waste, which contains a large amount of sulfidic waste in the heap, with a small amount of neutralizing minerals, especially carbonates, and in the presence of potentially leachable metal-bearing minerals.

2. Methodology

2.1. Case Study Description

Numerical models for groundwater flow and pollution migration were built to simulate and assess the impact of climate change on the quality and volume of leachate from the heap, and its impact on the aquatic environment. The coal heap for which the models were prepared is located in southern Poland, in the Lesser Poland Voivodeship (Figure 1). The multi-year groundwater monitoring (January 2004 to June 2020) carried out for the waste heap area showed that several years of heavy precipitation had an impact on groundwater contamination from leachate and the level of the groundwater table [19]. Leakage from the waste heap caused important changes in the groundwater during these periods. As a result, the groundwater table rose as much as 2 m, and contained several dissolved species that caused an increase in EC from 300 µS/cm to over 1 mS/cm, along with a drop in pH below 5. The monitoring results also showed that short-term heavy rainfall and drought had little effect on the level of groundwater pollution in the waste heap area [19]. These findings indicate that in the case of long-term heavy precipitation, remediation measures should be carried out related to the treatment of groundwater, such as the injection of a nZVI suspension into the aquifer. Such measures should be taken when the contamination level determined by EC and thus by TDS is significantly exceeded.
Changes in hydrological conditions in the aquifer under the heap, caused by a significant increase in precipitation and the associated increased pollution of groundwater, were presented and simulated in a model prepared with the use of Visual MODFLOW produced by Waterloo Hydrogeologic—Waterloo Ontario Canada—supplier GAMBIT C.O. Krakow Poland. This software and its modules were chosen for these purposes as it allows the user to perform the following [20]:
  • Model the hydrodynamic field for the analyzed area under conditions of different evapotranspiration and different precipitation;
  • Simulate the distribution of chemicals in the model of the analyzed area;
  • Calculate, with the Zone Budget module, the amount of water flowing through the specific area;
  • Determine the direction of groundwater flow using the Modpath module;
  • Simulate the sorption process for nZVI using the Freundlich and Langmuir isotherm in the MT3DMS module.

2.2. Assessment of the Chemical and Phase Composition of the Deposited Waste

Coarse- and fine-grained waste deposited on the heap originated from coal mining and processing. Fine-grained waste was stored in the northern part of the heap in a settling pond, while coarse-grained waste was stored in the southern and southwestern part of the heap. Drainage from the storage area is collected in the southern part and drained south towards the Vistula River, 1.9 km away (Figure 1b) [19]. Groundwater also flows south towards the Vistula.
The aim of this part of the study was to assess the concentration of trace elements in the waste. The location of waste sampling is shown in Figure 1a. The waste was collected in accordance with the PN-ISO 13909-3: 2005 standard from a depth of approximately 0.5 m below the ground level. The samples were then prepared for testing (by mixing, crushing, grinding, reducing) in accordance with ISO 13909-4: 2001. Elemental concentrations were determined by inductively coupled plasma atomic emission spectroscopy (ICP-AES) using the JY2000 Optical Emission Spectrometer (by Jobin Yvon). The source of the induction was a plasma torch coupled with a 40.68 MHz frequency generator; the samples were previously digested. The results of this characterization are presented in Table 1.
The elements with the highest average concentrations, exceeding 100 ppm, were Zn (208 ppm), Mn (171 ppm), Ba (142 ppm), and Pb (105 ppm), while Cu (82 ppm), Co (49 ppm), Sr (47 ppm), Cr (41 ppm), and Ni (37 ppm) were also characterized by high average concentrations. The remaining elements were characterized by average concentrations of about 10 ppm (As, Sn) or close to 1 ppm (Mo, Cd, Hg). It is worth noting that usually higher metal contents were found in fine particle waste.
The assessed waste contained relatively large amounts of sulfide minerals. The predominant sulfides in mine waste are pyrite and marcasite, but other minerals may also be found (covellite, chalcopyrite, sphalerite, and galena). When these minerals are exposed to water and air, they are oxidized, and acidic, sulfate-rich drainage is created. The leachate was characterized by low concentrations of dissolved oxygen (DO), low pH, high TDS, and high concentrations of dissolved metals and sulfates, as observed in the monitoring results (Figure 2 and Figure 3). The leachate contained various elements that may cause a risk to the environment.

2.3. Groundwater Monitoring Results

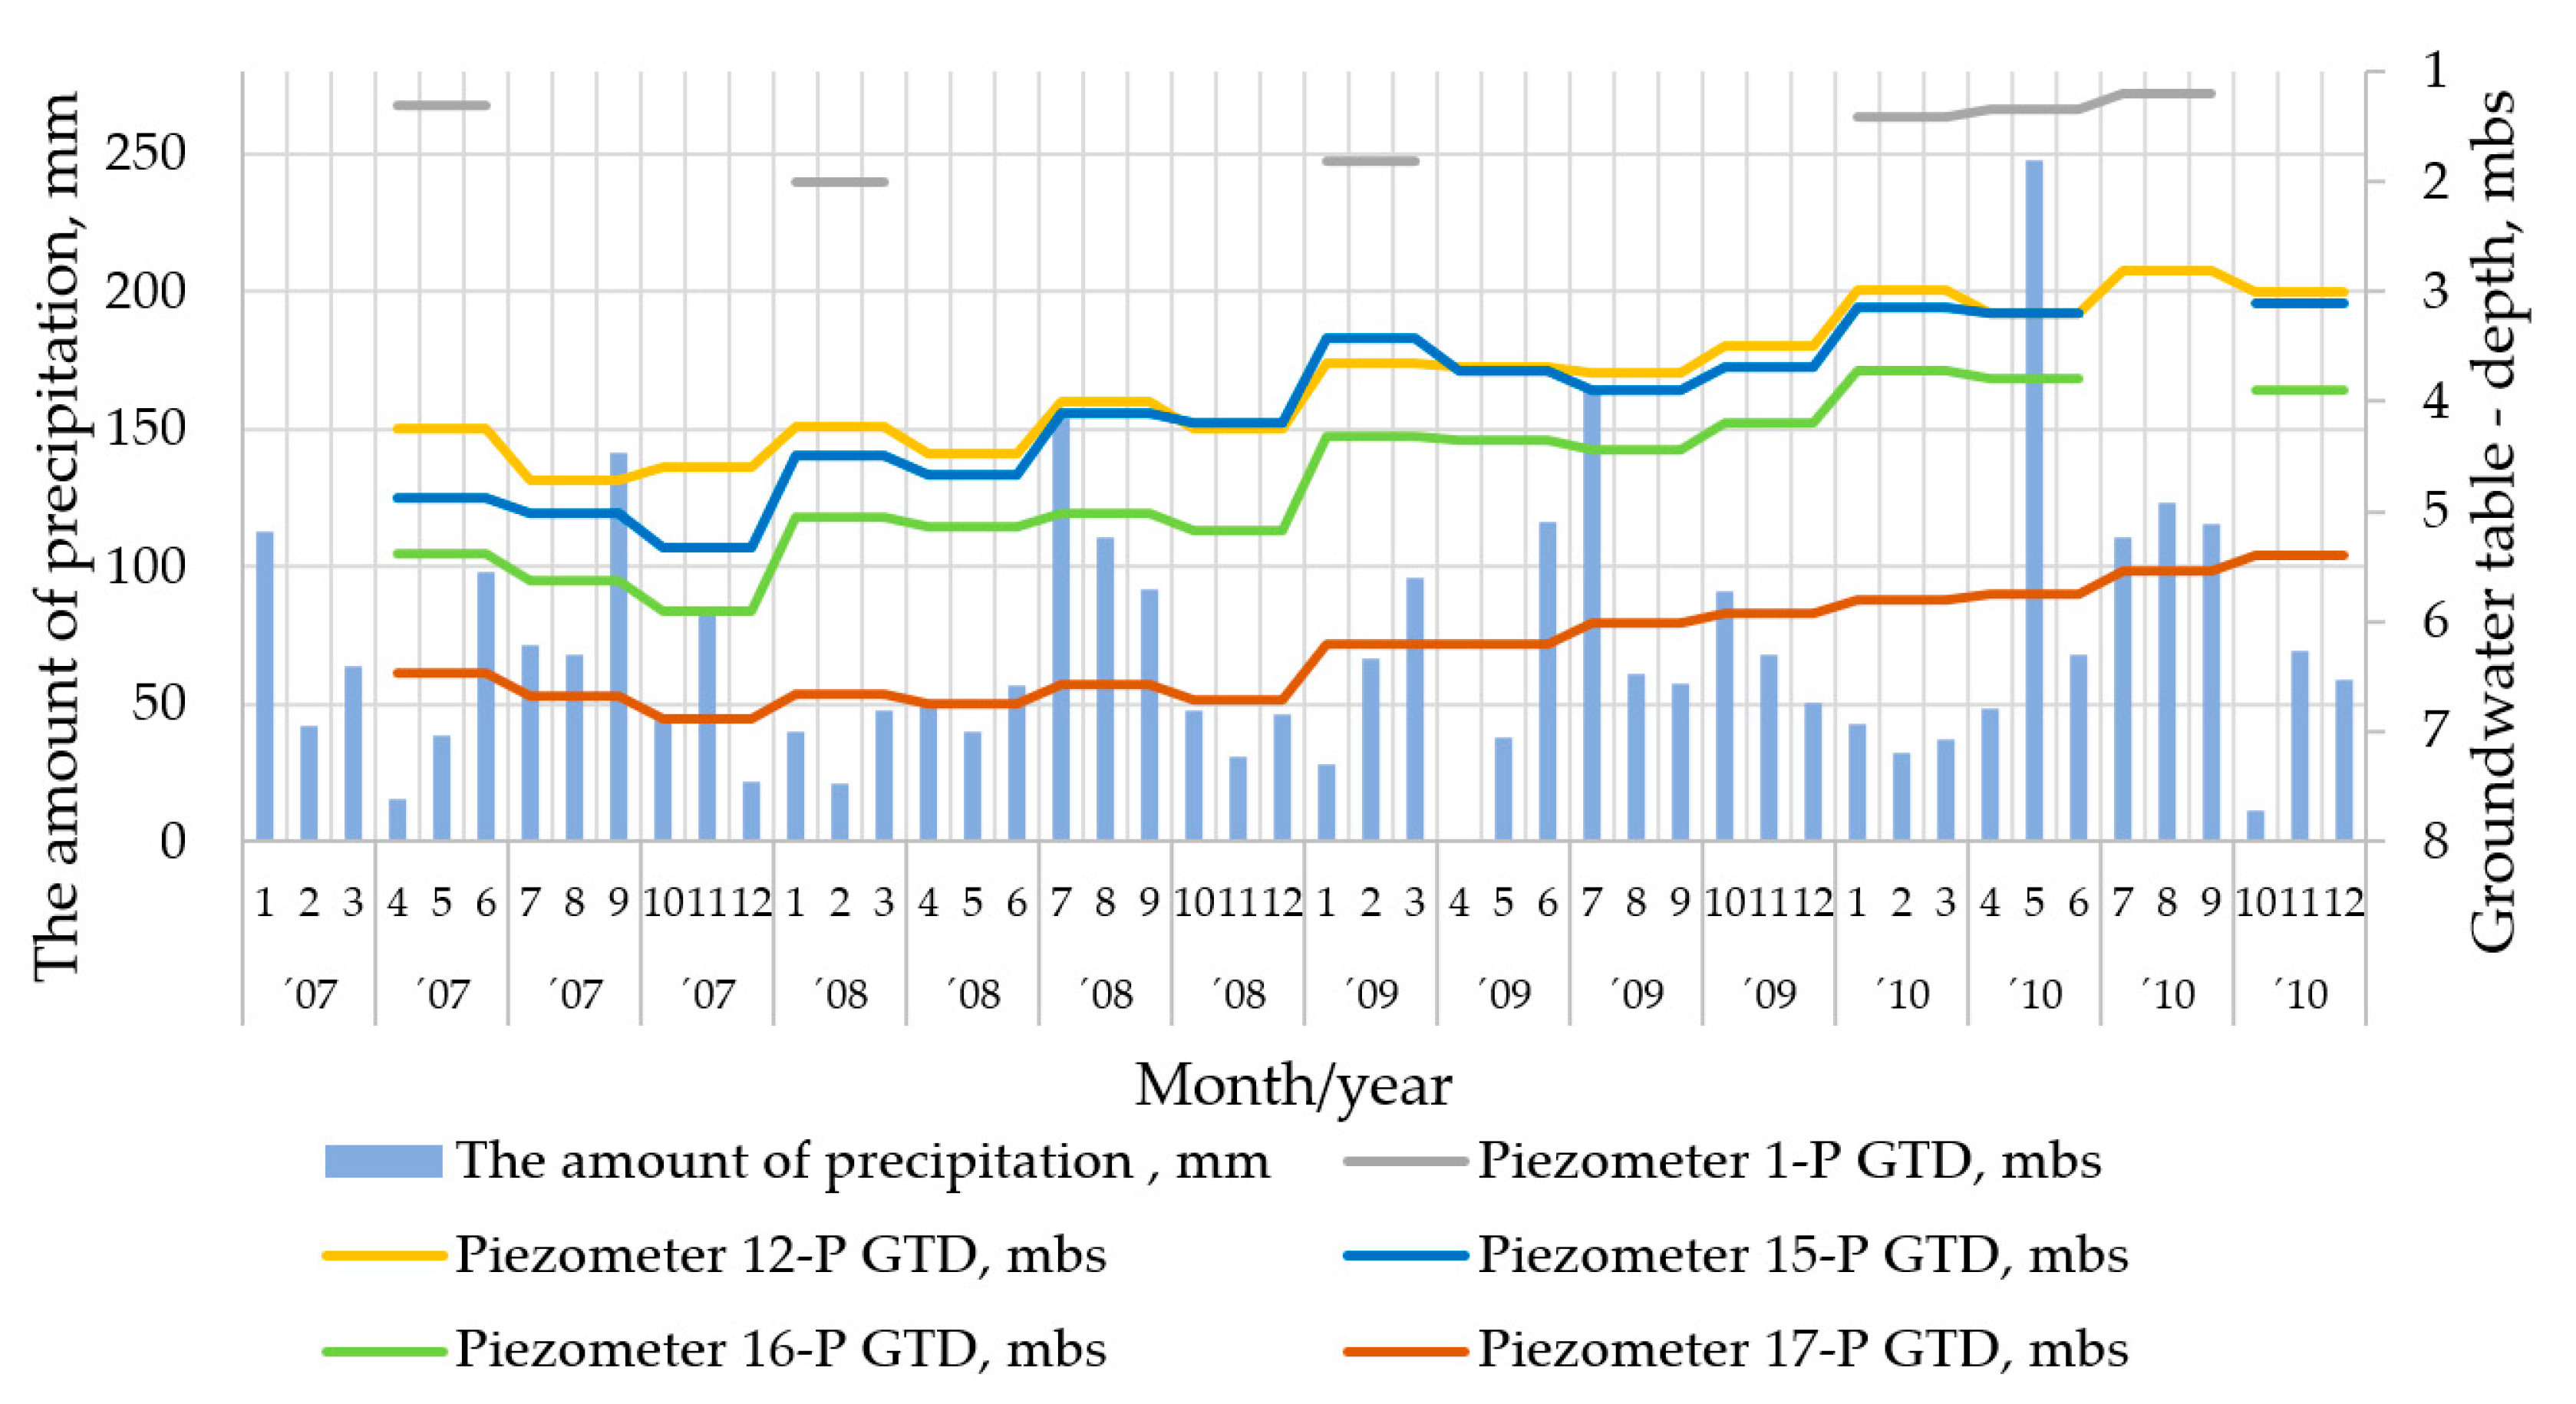
To prepare models of groundwater flow and contaminant migration and to assess the impact of climate change on the quality and quantity of leachate from the heap, a four-year groundwater monitoring period (April 2007 to December 2010) was selected, during which, after a drought period (2003–2004; annual precipitation was 584 and 651 mm/m2, respectively) and two years of average rainfall (2005–2006; annual precipitation was 722 and 743 mm/m2, respectively), there was a several yearlong increase in precipitation. The increase in precipitation caused the groundwater table to rise by more than 1 m for the modeled period (Figure 4). Thus, this paper presents two modeling results: the first for the period of long-term drought (2nd quarter of 2007; Q2 2007), and the second for the period of long-term precipitation (4th quarter of 2010; Q4 2010). A large amount of precipitation also resulted in the intensification of leaching of inorganic pollutants to the groundwater (Figure 3).
The leachates from the heap affect the groundwater in the southern part of the study area. To illustrate the impact of the heap during the studied period (April 2007 to December 2010), Figure 2 and Figure 3 show the average EC and pH, as well as the concentrations of selected species, for piezometers located in the southern part of the heap. As the groundwater flows south, the heap does not affect the water in the vicinity of the 18P and 1P piezometers. The results of measurements obtained from all piezometers (some of them shown in Figure 2, Figure 3 and Figure 4) were used to create numerical models.
In the pollutant migration model, Zn(II) was selected as an indicator of groundwater pollution (only one substance can be used in the numerical model created with Visual MODFLOW). Zinc ions (among other substances) were selected for their high concentrations and relatively high toxicity.
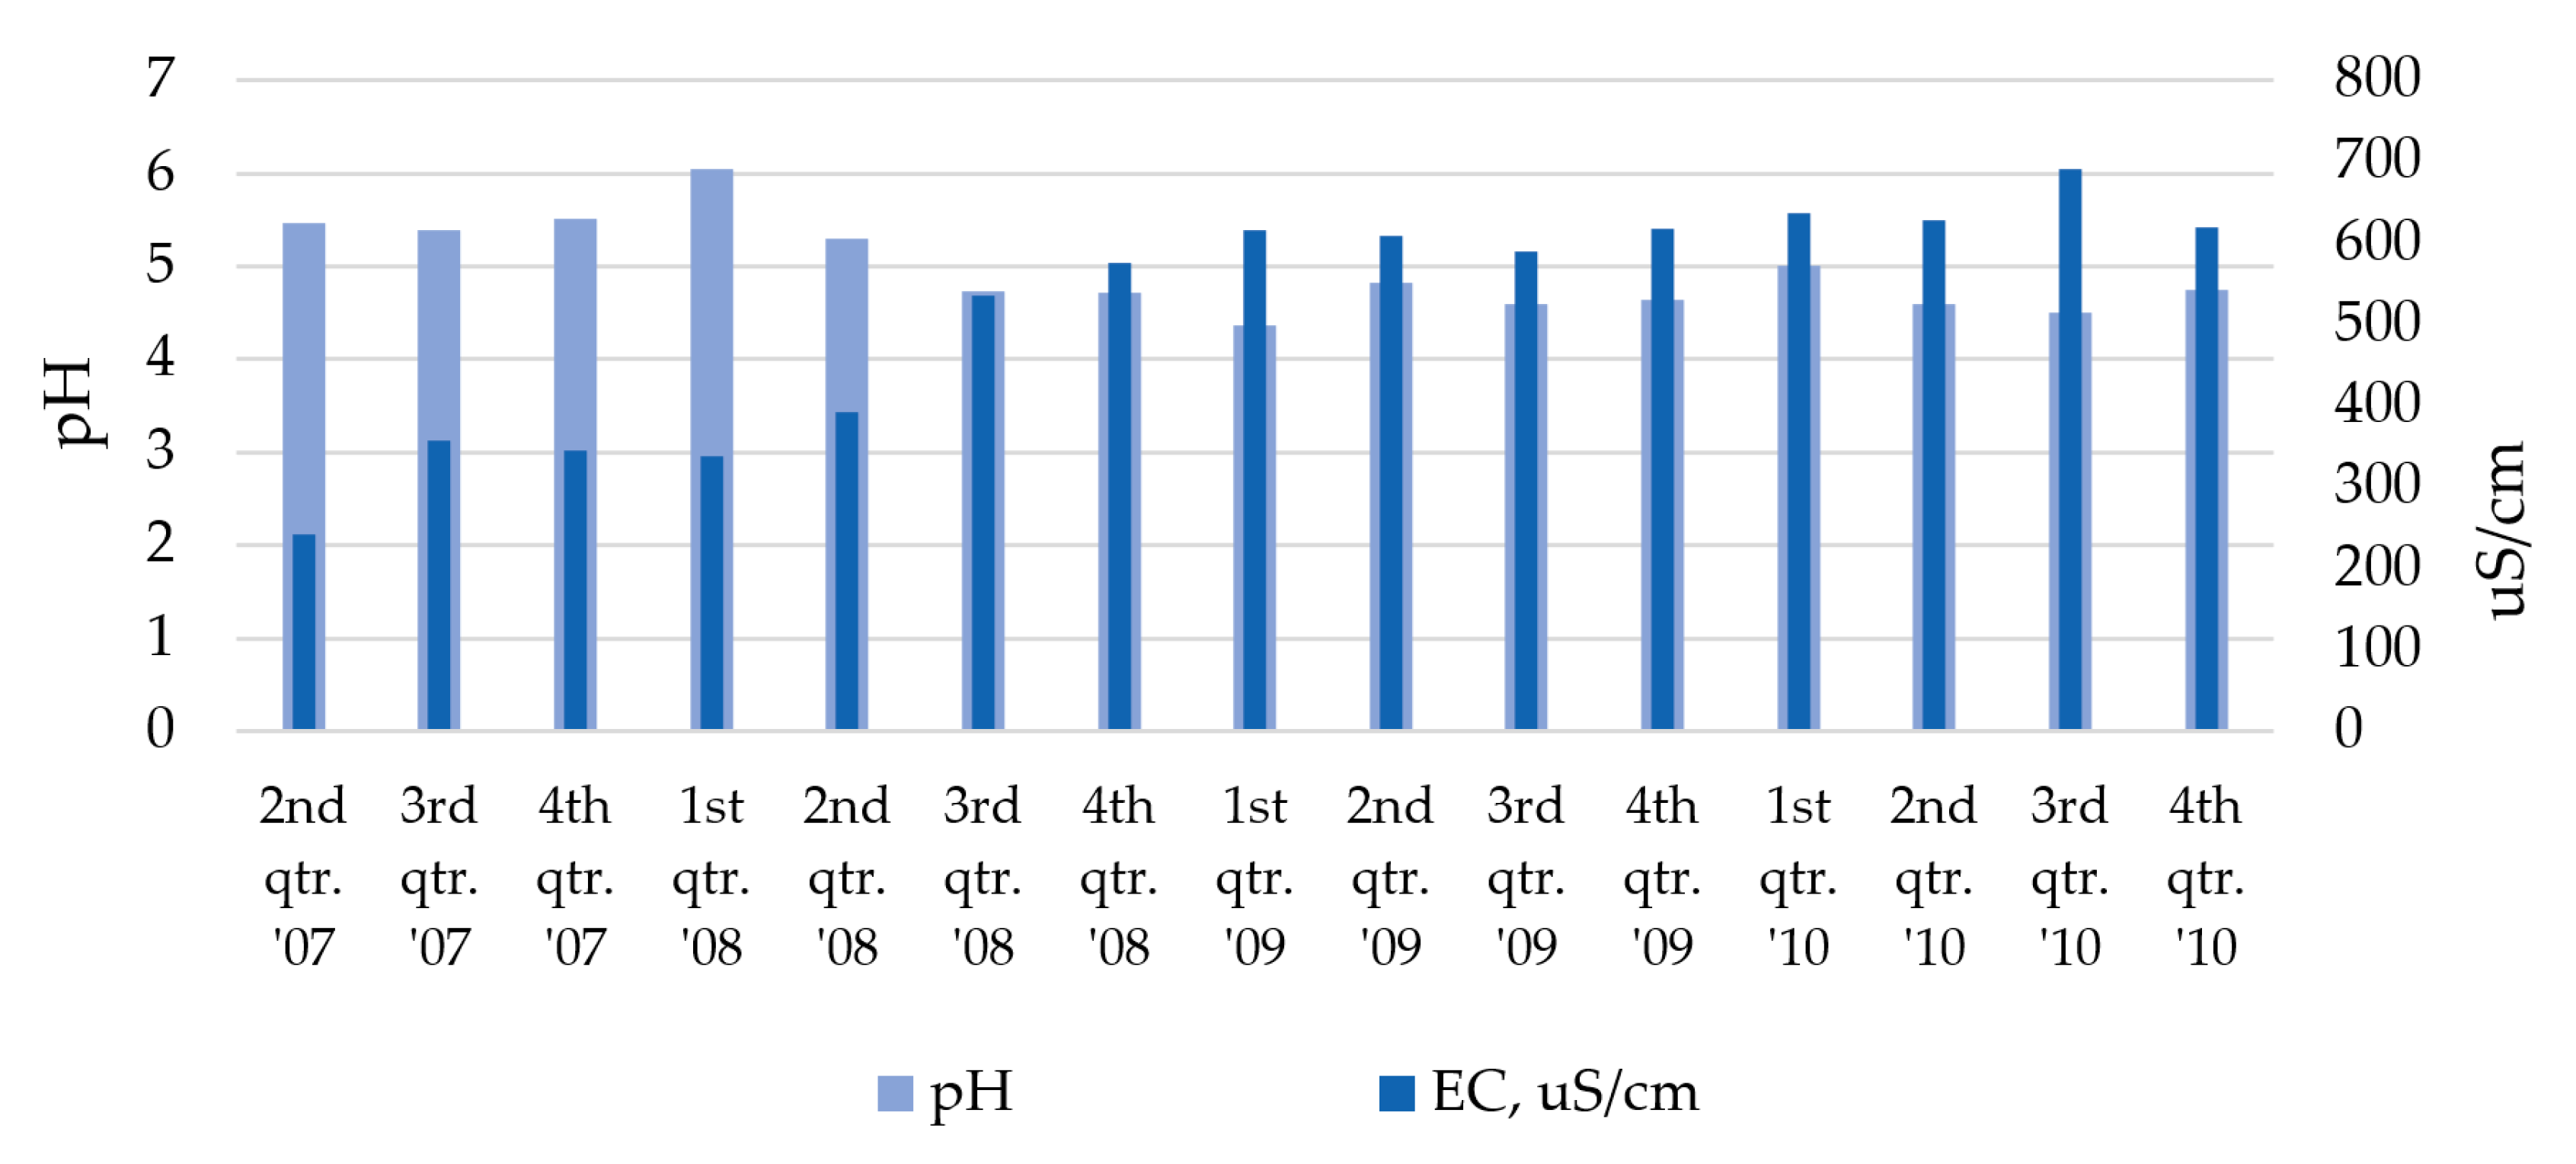
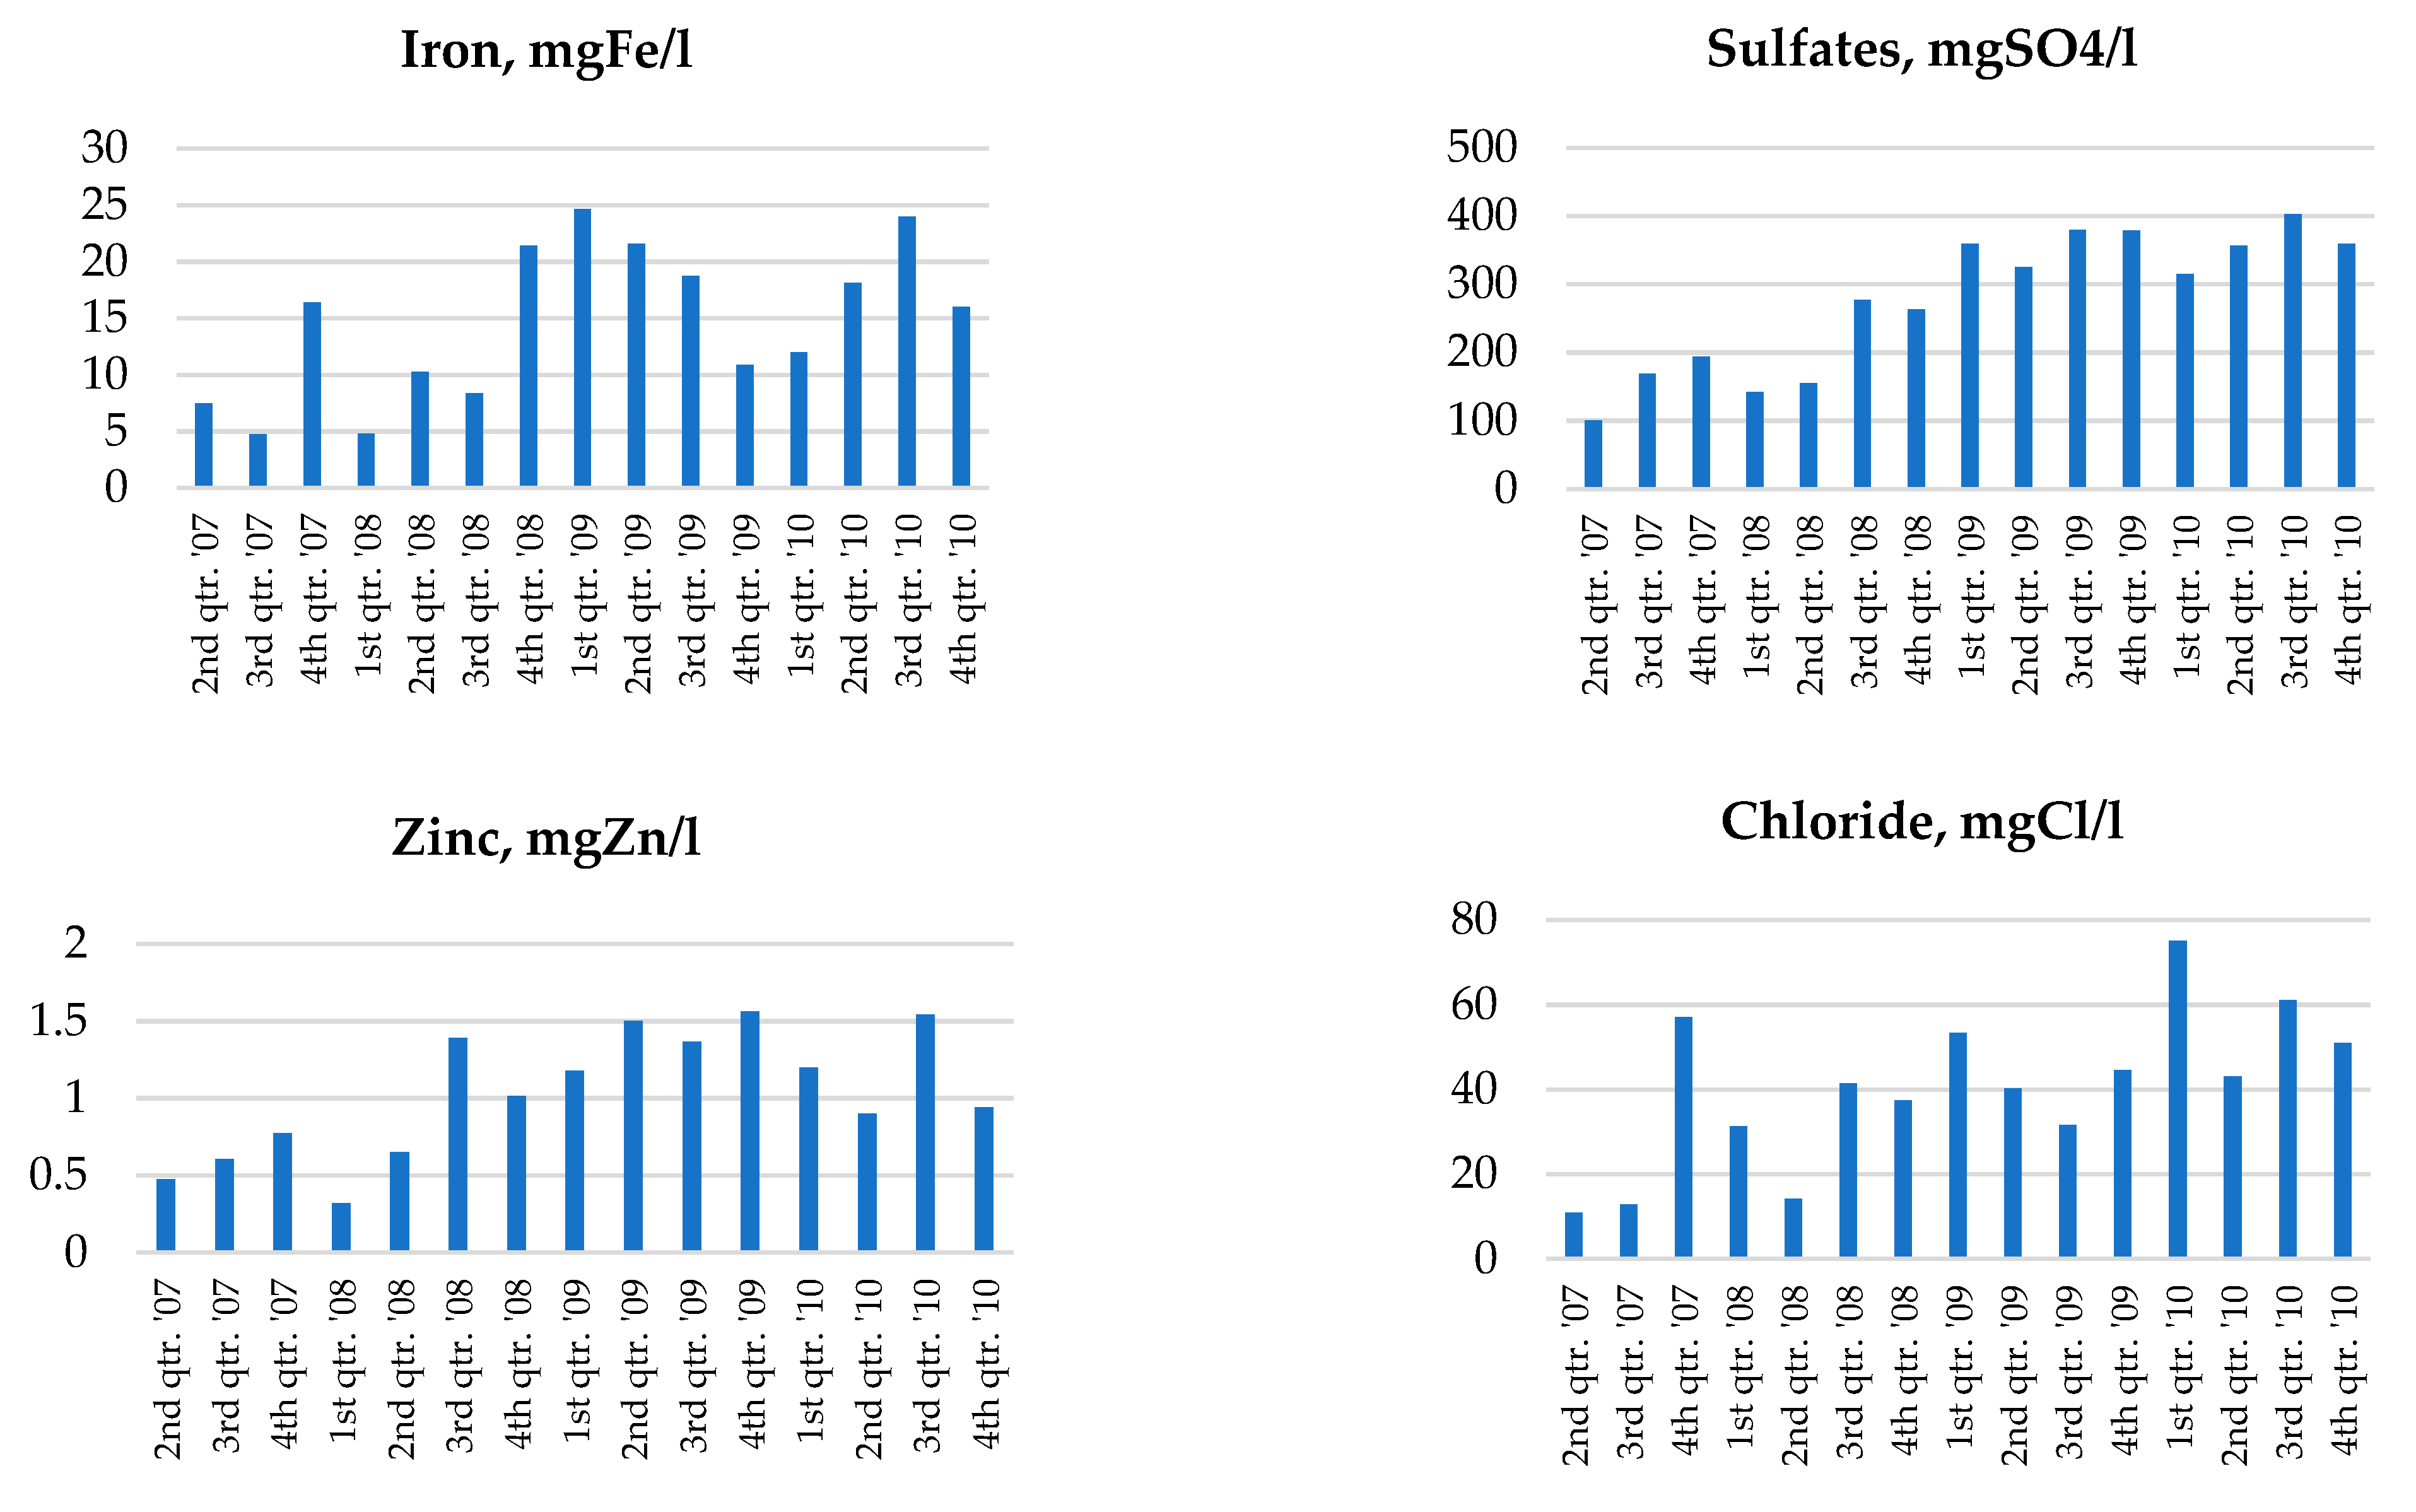
EC of the groundwater in the southern part of the heap increased during the analyzed period, from 242 µS/cm in Q2 2007 to an average of approximately 650 µS/cm by December 2010. This is due to the increased leaching of dissolved contaminants with meteorological precipitation. Previously, in the period prior to 2007, the EC was around 250 µS/cm. The amount of precipitation during that time was low or very low. As can be seen in Figure 2, the pH decreased from 5.4 to 4.3 during the analyzed period. The concentrations of almost all substances shown in Figure 3 more than doubled: Zn, sulfate, and Fe increased from 0.5, 100, and 5 mg/L to 1.5, 400, and 25 mg/L, respectively. This clearly indicates the impact of the AMD.
It can be assumed that for the same hydrochemical background of groundwater, with the presence of mainly sulfide minerals in the waste and the resulting decrease in pH, and also due to the lack of other pollution sources (e.g., carbonates), the increase in EC was caused by the release of sulfates and metal ions into the water environment, including the observed toxic metals such as Zn, Pb, Cu, Ni, Cr, etc. In connection with the above, the increase in EC (and thus TDS) and the decrease in pH in such cases can be unequivocally equated with the release of heavy metals and sulfates into the aquatic environment. Therefore, online monitoring of pH and EC (and the resulting TDS) was proposed for mining heaps in which sulfide minerals and small amounts of carbonate and other minerals that release large amounts of dissolved species were stored, and the effect of AMD was observed. These parameters, which are easy to measure online, indicate a sudden outflow of pollutants into the groundwater and the need for prompt remediation action.

2.4. Geological, Hydrogeological, and Meteorological Conditions

The heap is located on the Quaternary, Neogenic, Triassic, and Carboniferous formations. The Quaternary sediments are mainly developed in the inter-valley areas in the form of glacial sands, and in the river valleys in the form of sands, clays, and organic sediments. The occurrence of the Quaternary deposits, mainly as fine, medium sands and clay sands, were confirmed by drilling. The Neogene deposits occur under the entire waste heap area, where they form a continuous layer with a thickness of 10.0–30.0 m. The Neogene is represented by the Miocene formations developed mainly in the form of silt and clay shales, sometimes with interbedding of sandstone, sands, or silt. Due to the high clay content, these sediments are impermeable. Triassic deposits are generally located north of the waste heap area, where they build parts of morphological, highly fragmented elevations. The Triassic aquifer is associated with fractured and caverned limestones and dolomites of Muschelkalk and Roethian.
The Quaternary aquifer is related to the layer of sandy deposits lying on the impermeable deposits of the older bedrock. It was identified by a network of piezometers made for the purposes of monitoring and archival documentation. The thickness of the Quaternary sediments generally increases towards the south, from 4.0 m to a maximum of about 20.0 m in the southern part of the waste heap area. The aquifer is represented by fine sands and medium sands with interlaying clay sands, locally transforming into coarse sands or gravel in the bottom sections.
The water table is a free type, fed by the direct infiltration of atmospheric precipitation. The groundwater flows from the north to the south, towards the Vistula valley. The free groundwater table ranges from 1.5 m BGL (below ground level) in the northwest to 8.8 m BGL in the southeast. The range of changes in the groundwater table does not exceed 1.0 m based on the measurements made in the piezometers. The hydrogeological parameters used in the model are presented in Table 2.
A detailed model necessary to simulate climate changes within the heap and to analyze the degree of removal of pollutants from groundwater was developed using the large catchment model. The detailed model contained the southern part of the heap and the area adjacent to the heap towards the south (i.e., the area of groundwater runoff towards the Vistula River). In the large catchment model, third-order boundary conditions were applied on the border (i.e., no inflow or outflow, except for the Vistula and Przemsza Rivers, for which second-order boundary conditions were assumed, resulting from the water table level in this river). Therefore, in the detailed model (Figure 5 and Figure 6), third-order boundary conditions were used with specific hydraulic conductivities (m2/day) obtained from the large catchment model for given climatic conditions (for Q2 2007 and Q4 2010). For both models, the condition of constant water supply (for the analyzed period) was assumed, resulting from infiltration reduced by the evapotranspiration index. In the case of the migration of pollutants (Zn(II) ions) in groundwater, the models simulated a two-year migration period for steady-state conditions. Such an assumption allowed the model to simulate changes in leaching of contaminants from the heap under the conditions of hydrological drought until 2007 (resulting from climate change) and excessive precipitation in the period 2007–2010.
The amount of precipitation and evapotranspiration (for the heap and adjacent area) was assumed based on meteorological data for a given period and the type of soil and plants, temperature, and porosity of waste and ground adjacent to the heap. For effective water resource management, the assessment of evapotranspiration is crucial, and its omission will result in an incorrect water balance. For this purpose, many methods have been developed to calculate the evapotranspiration depending on the data available and the intended use. One of the most common is the Penman–Monteith method, recommended by the United Nations Food and Agriculture Organization (FAO-56 Method), which allows for the successful calculation of evapotranspiration using meteorological data for the relevant area [21,22].
For the studied area, the reference evapotranspiration was calculated based on the FAO-56 Method (Equation (1)) using the following monthly meteorological data from the station located in Kraków, Poland: minimum, maximum, and average temperature; wind speed; atmospheric pressure; and relative humidity. Due to the lack of solar radiation data, the average sunshine for Kraków in the period 1884–2014 was used [23].
ET o = 0.408 Δ ( R n G ) + γ 9000 T + 273 u 2 ( e s e a ) Δ + γ ( 1 + 0.34 u 2 )
where:
ET o —reference evapotranspiration [mm·day−1].
Δ —slope vapor pressure curve [kPa·°C−1].
R n —net radiation at the crop surface [MJ·m−2·day−1].
G —soil heat flux density [MJ·m−2·day−1].
γ —psychrometric constant [kPa·°C−1].
T —air temperature at 2 m height [°C].
u 2 —wind speed at 2 m height [m·s−1].
e s —saturation vapor pressure.
e a —actual vapor pressure [kPa].
Reference evapotranspiration was adapted to the terrain conditions and calculated separately for the heap and adjacent areas using the landscape coefficient (Equation (2)):
ETl = kl × ETo
where:
ETl—landscape evapotranspiration [mm·day−1]
ETo—reference evapotranspiration [mm·day−1]
kl—landscape coefficient
The adjustment of kl depends mainly on the plant species present in the area, their density, and the prevailing microclimate [24]. For the given area, other parameters were also considered, i.e., meadows, free-standing trees, bushes, roads, and single-family houses. Due to the presence of vegetation in the adjacent areas, the value of kl was assumed for these areas depending on the vegetation seasons of plants. The average values of kl for various phases of plant growth occurring in Poland were adapted based on previous studies [25,26,27,28,29]. The landscape coefficient in the initial period (January–April) was 0.35; in the later period (May–September) it was 0.9; and in the final period (October–December) it was 0.4. In the case of a heap, the landscape coefficient depends on the type of soil (mainly its permeability), the level of the groundwater table, and the precipitation, especially the intensity and frequency. The average annual kl coefficient was adapted for the bare soil in a heap based on previous studies [30,31,32]. In the present case, the kl value of 0.4 was applied for the entire year.
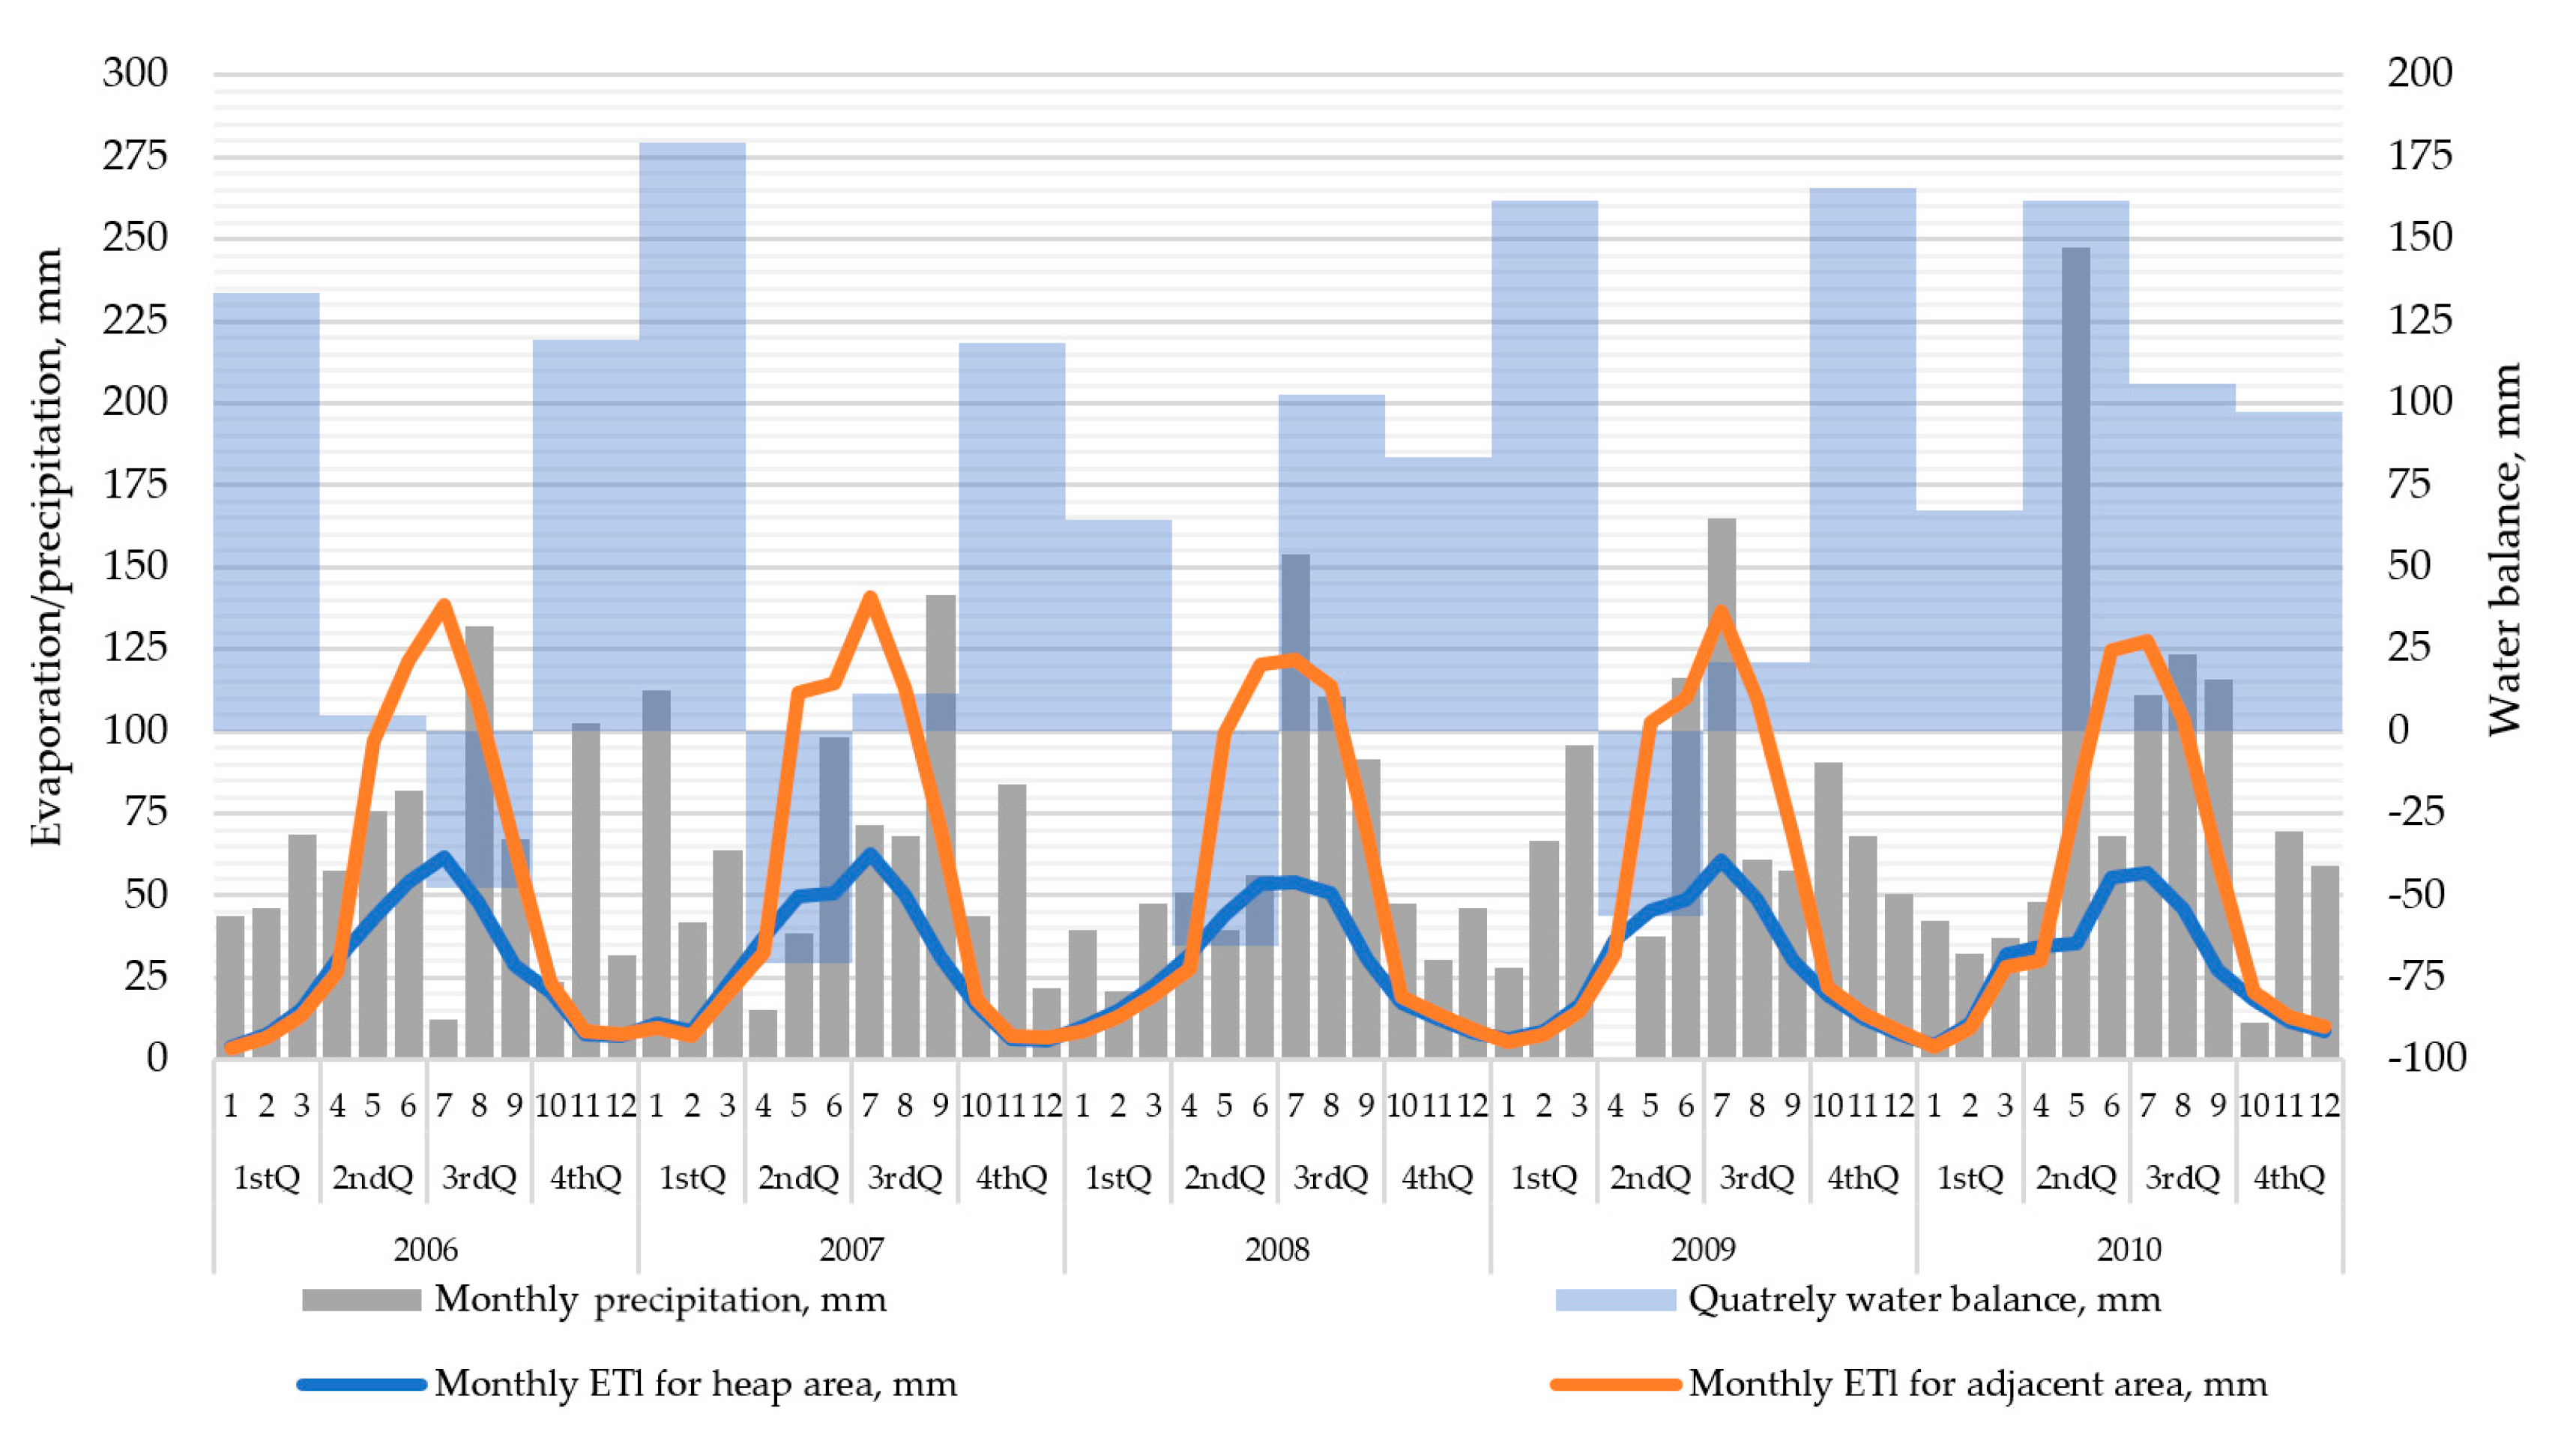
The amount of precipitation in Q2 2007 and Q4 2010 was 740 mm (annually, from Q3 2006 to Q2 2007) and 965 mm (from Q1 2010 to Q4 2010), respectively. Evapotranspiration for a heap without soil and plants, where waste porosity was greater than 0.5, for these periods was 354 and 342 mm annually, respectively (Figure 7), while for the remaining area covered with vegetation in the form of dense grasses, shrubs and stand-alone trees located on soils with a thickness of about 0.5 m, amounted to 647 and 613 mm, annually, respectively (Figure 7). These findings indicate that water infiltration through the heap increased in 2010. This infiltration supplies groundwater, but also contaminates it.
The highest and the lowest values of landscape evapotranspiration for the analyzed period occurred in 2006 and 2010, respectively. As can be seen, this has had a significant influence on the water balance of the studied area (Figure 7), which was calculated as the difference in quarterly precipitation and evapotranspiration, assuming that 30% of the studied area is a heap. In general, the water balance at the turn of the 2nd and 3rd quarters is negative due to relatively low rainfall and high demand from plants for water, and thus high evapotranspiration. However, in the 2nd and 3rd quarters of 2010 and the 3rd quarter of 2008, there was a lot of precipitation, which contributed to a positive water balance for the entire season.

3. Results and Interpretation

3.1. Modeling the Removal of Pollutants from Groundwater

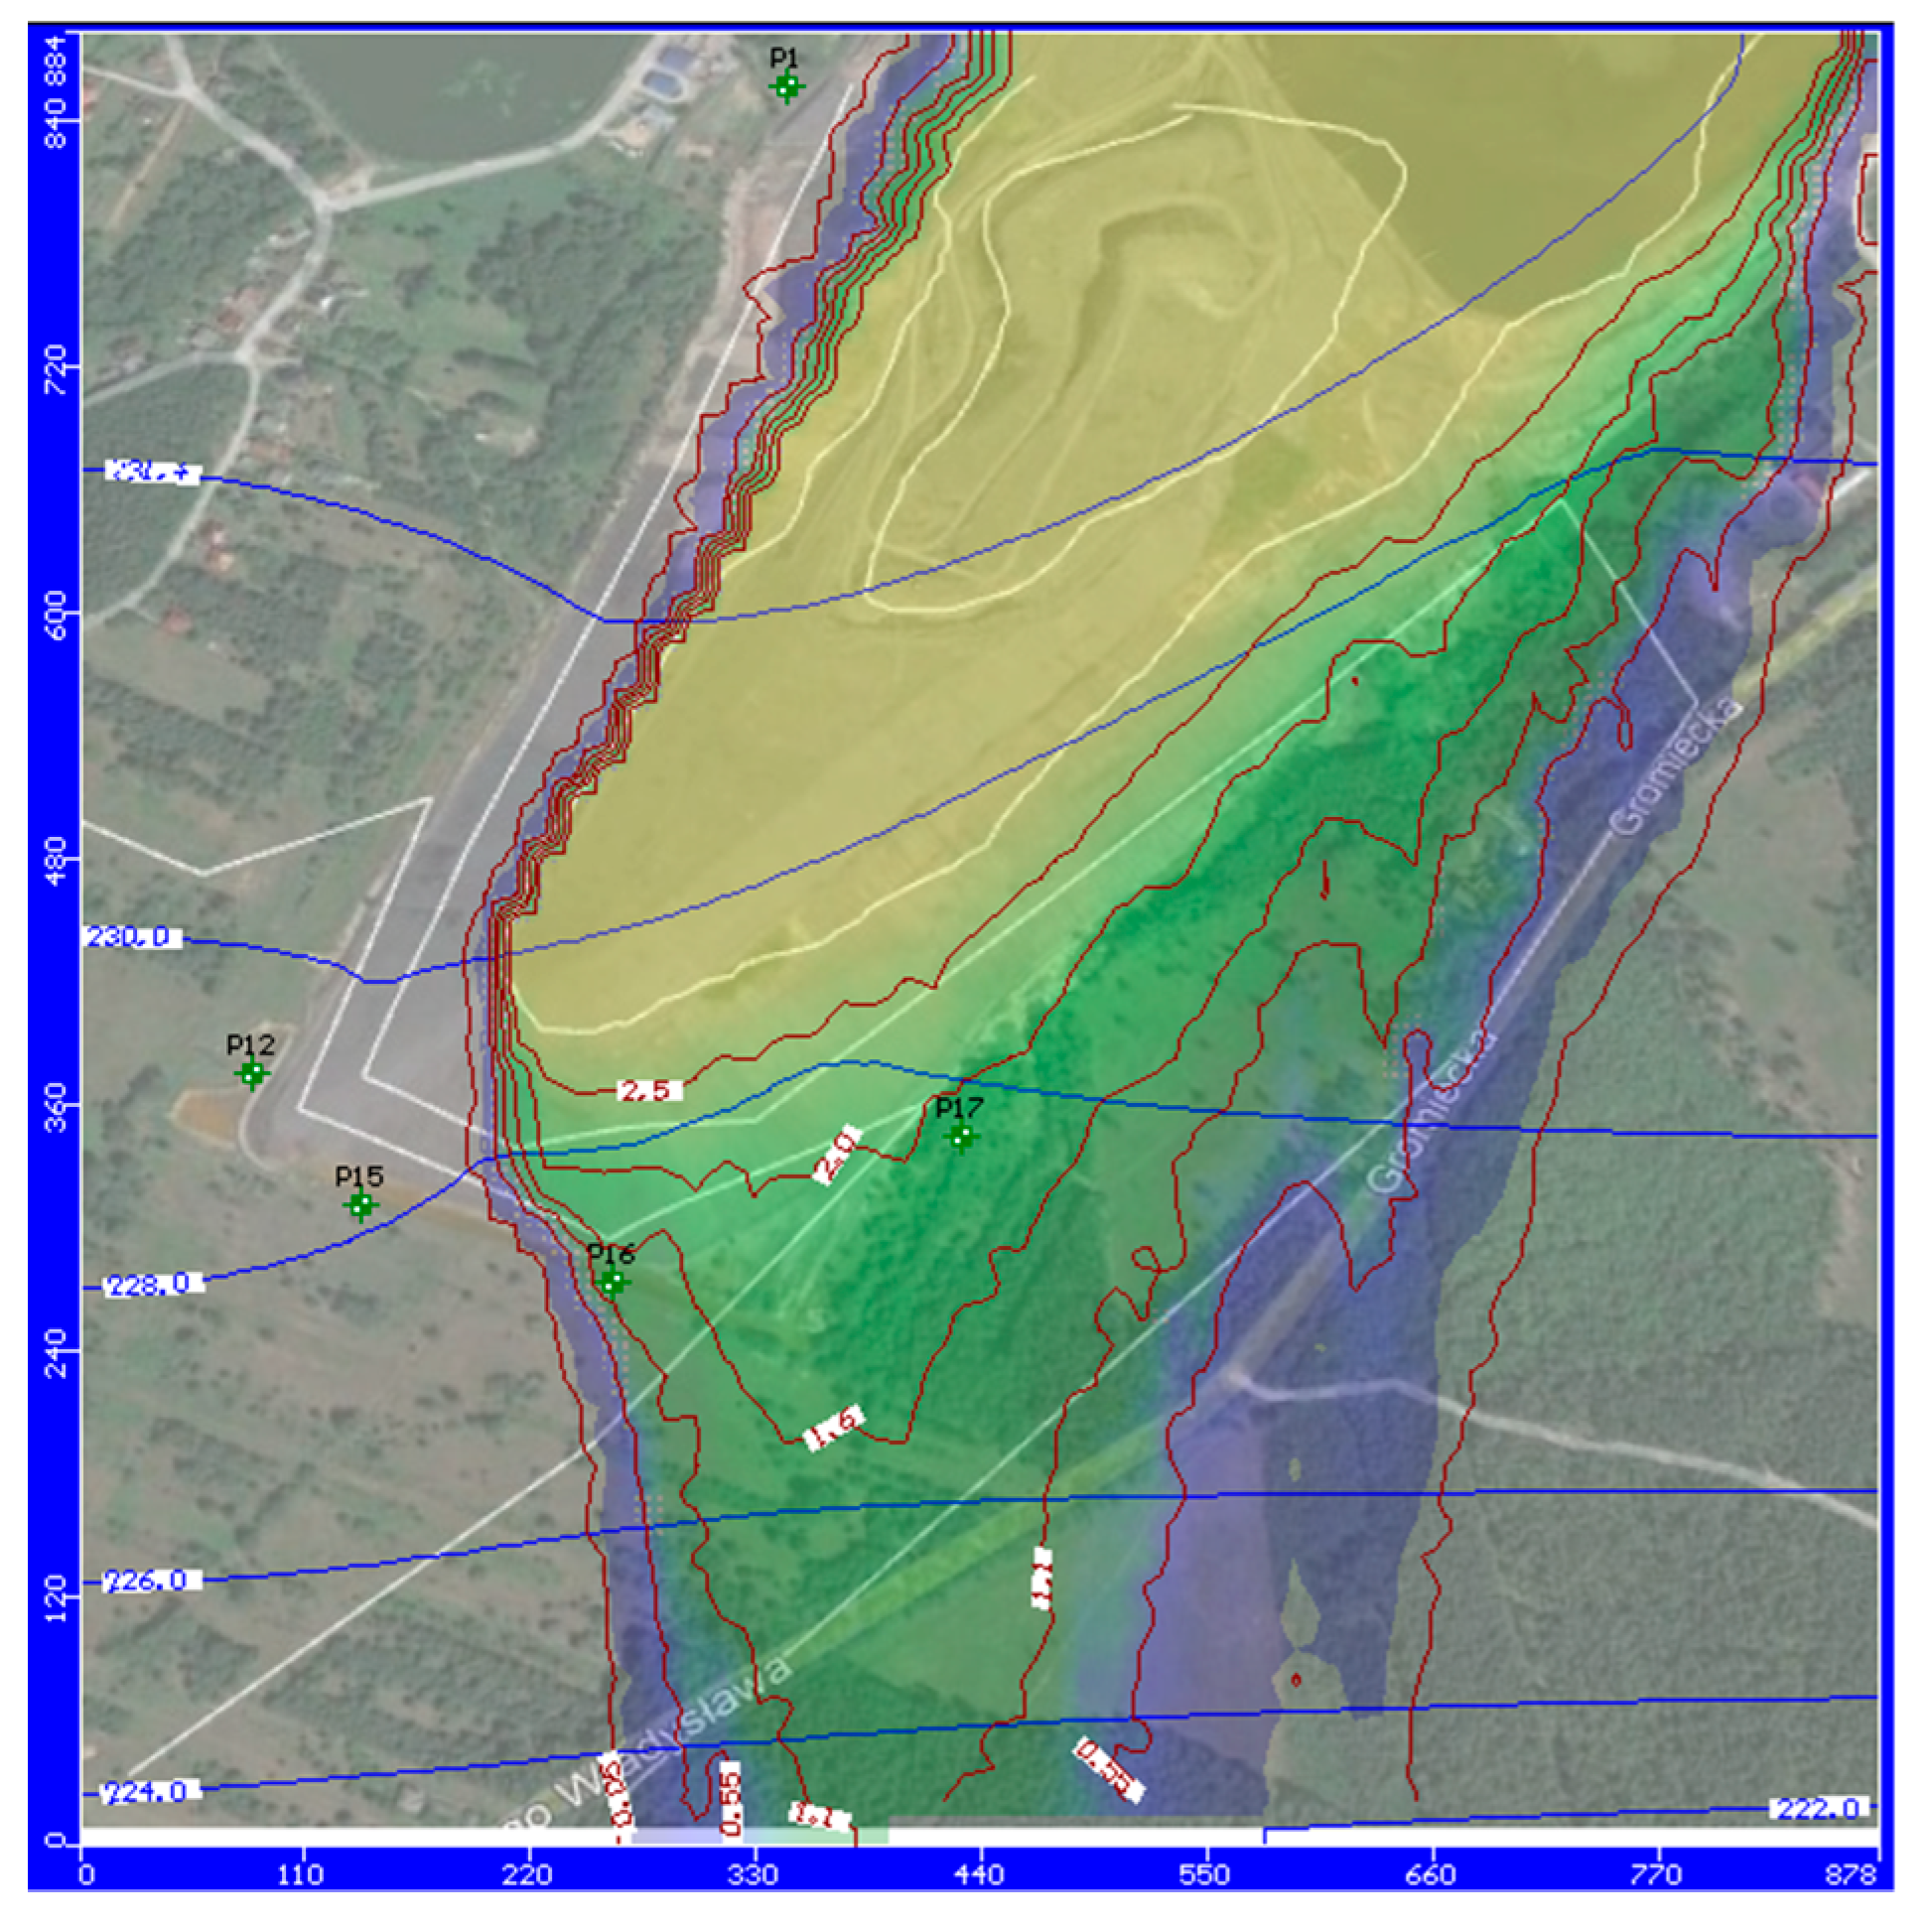
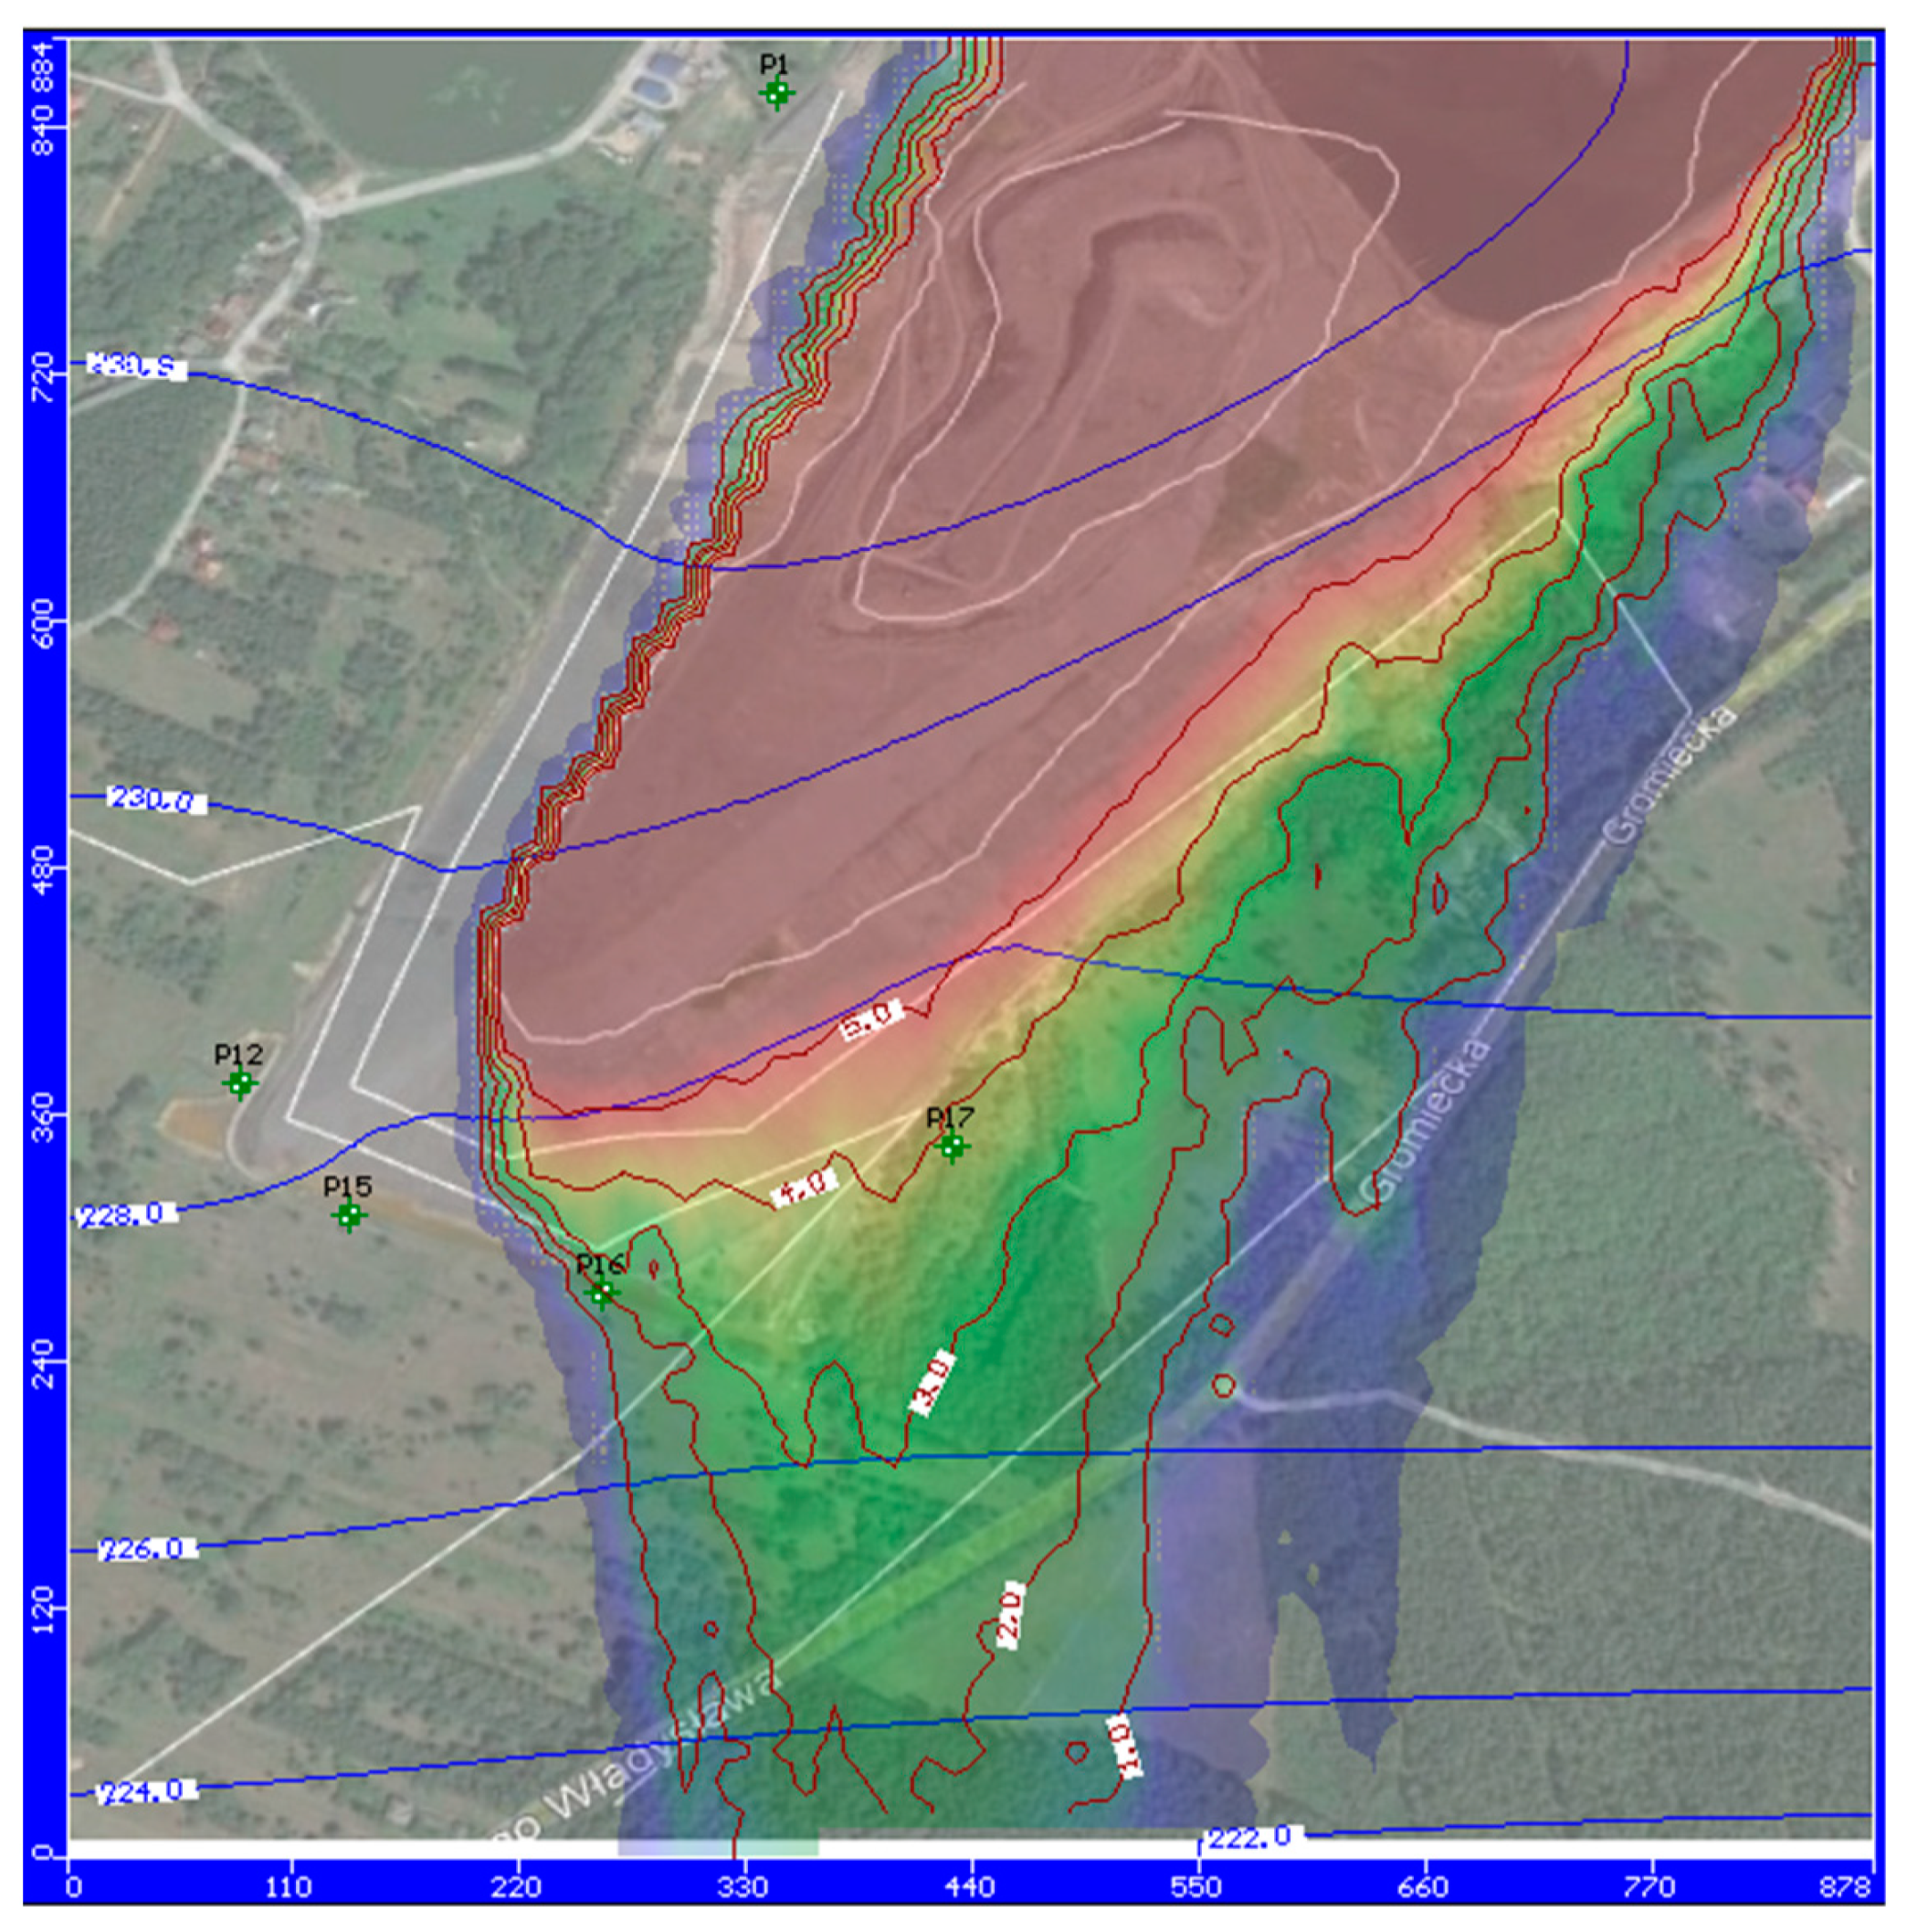
The results of modeling groundwater flow and Zn ion migration are presented for the periods of Q2 2007 and Q4 2010 in Figure 5 and Figure 6, respectively. Groundwater flows south-southeast; it is influenced by the Vistula River, but also the variable thickness of the aquifer in the vicinity of the heap. As a result, in the southern part of the heap, near piezometer 17, a greater flow of groundwater is observed.
The groundwater table in Q4 2010 increased by approximately 1.5 m as compared to Q2 2007. As shown in Figure 5, for Q2 2007, lower infiltration of precipitation (greater evapotranspiration) resulted in a decreased migration of pollutants to the groundwater than in Q4 2010: leaching of Zn ions (representing pollutants) was lower. The influence of infiltration on the groundwater was smaller and consistent with the volume of meteorological precipitates discharged into it: the hydroisohypse slightly bends under the heap. The situation was completely different in Q4 2010, when more precipitation was discharged into the groundwater: the hydroisohypse under the heap curved more to the south compared to Q2 2007. Precipitation in 2010 was higher by 225 mm/m2 (annually), and evapotranspiration lower by 34 mm (annually). Based on the balance calculations performed in the Zone Budget module of the Visual MODFLOW software, it was also found that about 25% more water flowed through the heap in Q4 2010 than in Q2 2007, leaching more contaminants into the groundwater. It should be noted that the contaminant plume was mainly located around piezometer 17, and it was here that the nZVI injection wells were placed in the model to remove contaminants from the groundwater for Q4 2010.
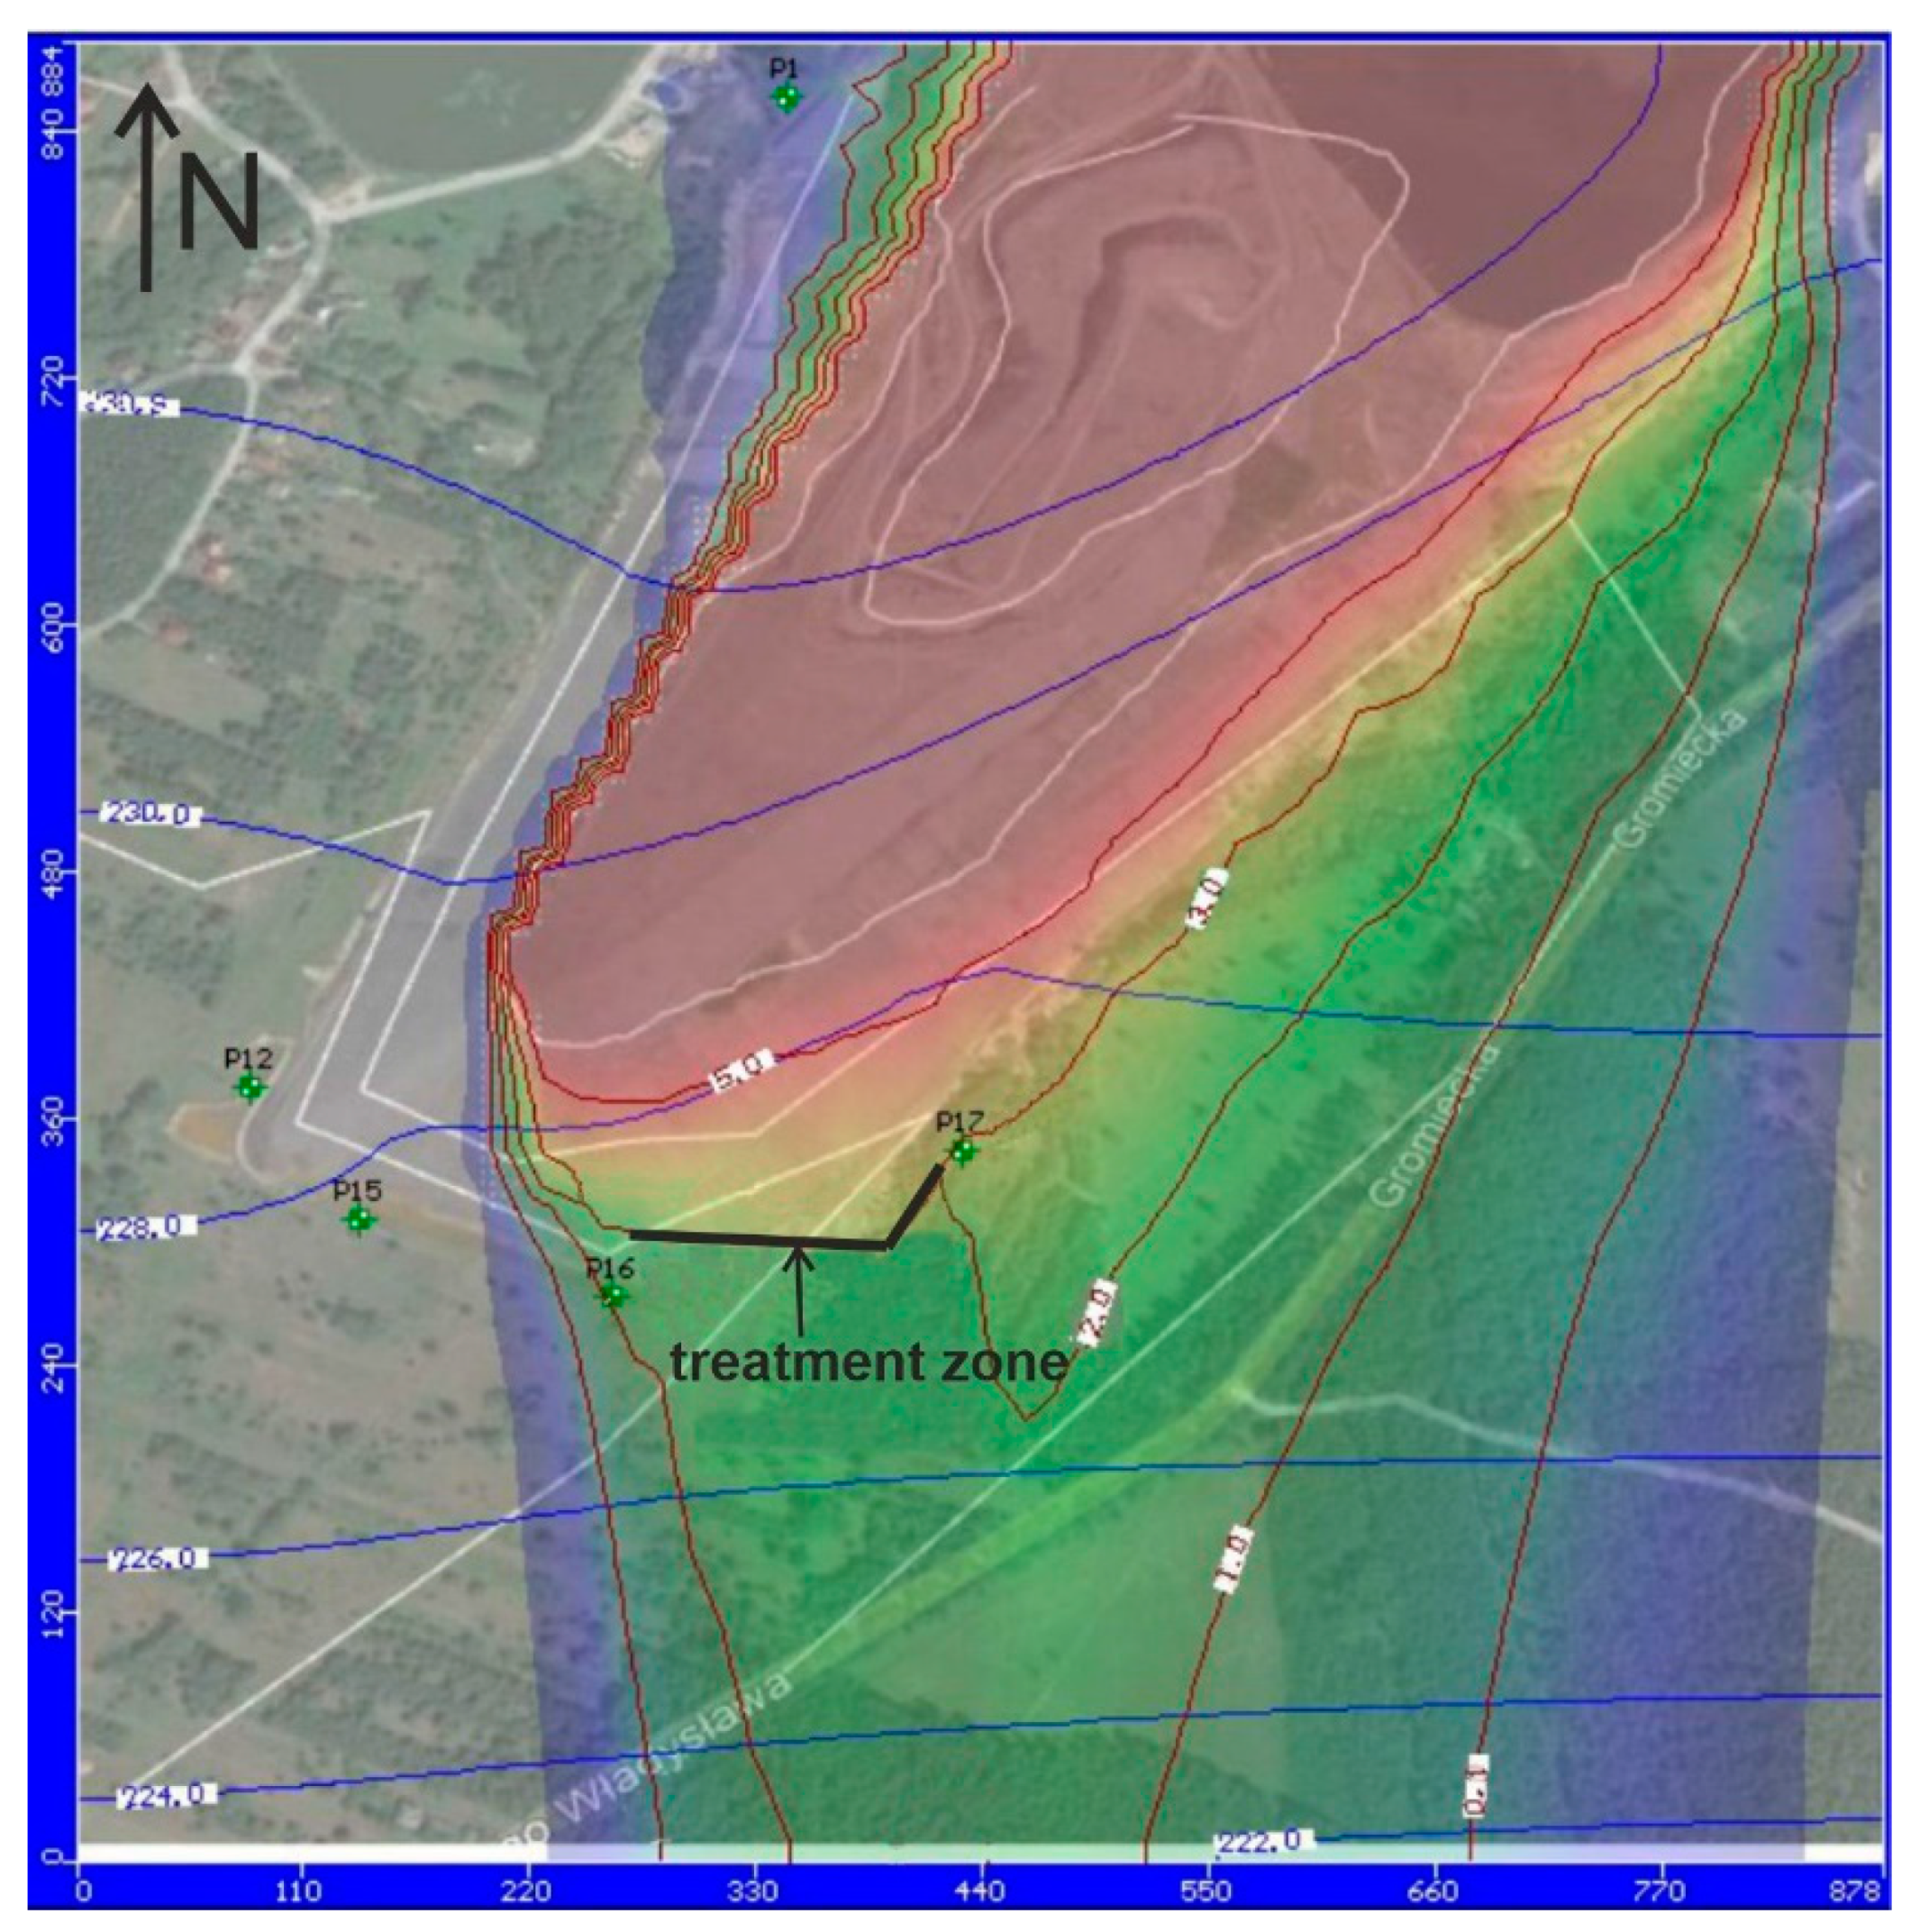
Langmuir isotherm parameters used in the model for Zn(II) removal from groundwater by nZVI were KL = 0.0471 dm3/mg and qmaxL = 142.7 mg/g [17]. The results of modeling groundwater treatment for this period are shown in Figure 8. The MT3DMS module of the Visual MODFLOW software was used in the model. Various treatment options were modeled; different numbers and locations of injection wells were investigated. Efforts have been made to minimize the number of wells. The aim was to reduce the migration in the area of pollutant leakage to the level of 2 mg Zn(II)/L, which results from the ordinance on substances discharged into water or soil (Journal of Laws of 2019 item 1311). The best option, with the optimal number and location of the injection wells, is shown in Figure 8. In the model, ten injection wells were applied to form a zone approximately 140 m long. The results showed that on the east side of piezometer 17, there was still a visible leakage of the contaminant plume with a zinc ion concentration slightly above 2 mg/L. This is because some pollutants migrated, mainly by transverse dispersion, from the southeastern part of the heap. The creation of a 400 m-long barrier in this location would be too costly in view of the results obtained, as a significant part of the leachate flows from the southern part of the heap to the treatment zone located in the model.
The occurrence of drought in Poland is not unusual and, based on historical data since the fourteenth century, it occurs on average every 4–5 years [33]. The frequency of droughts and the increase in the duration of dry years may be caused by progressive global warming [33]. According to the report covering the years 1966 to 2008, contemporary atmospheric droughts observed in Poland occurred in the years 1969, 1972, 1974–1976, 1982, 1984, 1988, 1994, 1996–1999, 2000, 2003, and 2005–2006. The droughts in 1989–1994 and 2003–2005 had a significant impact on lowering the level of the groundwater table [34]. The latter period caused a decrease in the groundwater level also observed in the model for Q2 2007 (Figure 5). Based on previous studies [34,35], hydrological droughts are significantly affected by longer periods without precipitation.

3.2. General Discussion

The presented research results indicate that the tested waste collected from the heap contains large amounts of sulfide minerals and relatively high concentrations of metals in the ionic state. Under given conditions, in the worst-case scenario, these substances can affect the aquatic environment.
In the view of geoethics and the circular economy, the development of sustainable practices in the management of mining waste is a long-term and expensive commitment [36,37]. As climate change is nowadays a reality, its impact is expected to affect, among others, the groundwater quality (and load) by altering recharge, water table elevation, groundwater flow, and land use [19,38]. Recently, a review paper summarized the applications and opportunities for employing and deploying various tools (e.g., hydrological, geochemical, isotopic) as guidance for more integrated approaches to evaluate the sustainability of mining projects [39].
After a long period of low precipitation resulting in the formation of water-soluble secondary minerals, high amounts of precipitation will cause the intensification of leaching of inorganic contaminants from the mine waste, requiring proper remediation measures. To coordinate the timing and location of those remediation measures, continuous groundwater monitoring should be carried out to accurately assess their magnitude and impact, as previously recommended [15]. The lack of randomness and entailed bias in data interpretation when collected in punctual monitoring (such as peaks and sudden variations related to climate change) were offered as pertinent justification for the continuous monitoring in this last integrative study [15].
On the basis of the presented observations, it can be concluded that in the case of the presence of a large amount of sulfidic waste in the heap and a small amount of neutralizing minerals, especially carbonates, it is proposed that three parameters be monitored: EC, pH, and the level of the groundwater table below the surface. This approach is in line with the measurement method presented in study [40]. Parameters pH and EC belong to the primary indicators. Effort and processing time, as well as the cost of analysis per sample, increase when additional, advanced parameters are to be measured.
The proposed parameters are to be sent online to the e-cloud (and from here to the model of groundwater flow and pollution migration), based on which it will be possible to obtain quick information about the need to carry out remediation works and perform additional environmental analyses, if necessary. This is an inexpensive and rapid way to control the impact of a mining heap on groundwater in the event of an intensification of precipitation related to climate change. Note that while pH is a useful indicator of AMD contamination, variations in pH can also result from other causes, including forestry activity, acid precipitation, or leaching of natural fulvic and humic acids [14]. Moreover, EC was already deemed to be an ideal parameter for monitoring of mine drainage in a study on AMD generation and the impact on the environment at the Avoca mines in County Wicklow, Ireland [14].
For optimal precision, evaluation criteria for continuous monitoring equipment were also established, including the following [41]: (i) satisfactory performance under extreme climatic and acidic/alkaline conditions; (ii) high precision and suitable detection limits; (iii) flexibility in energy sources (especially for remote mine sites); (iv) minimum calibration and maintenance requirements; (v) good mechanical availability (at least 95%); and (vi) limited extent and magnitude of interference problems.
The issue of modeling the transport of pollutants in groundwater in industrial and mining areas has already been described numerous times [18,42]. Over decades of different fields observations there is a lot of geochemical, mineralogical, and hydrological information available on the generation of acid mine drainage in the world. In each case, the purpose of hydrodynamic and hydrogeochemical modeling is to simulate the actual environmental conditions. Many factors contribute to the discrepancies between the field observations and simulation results, including geochemical and hydrogeological complexities as well as necessary model simplifications. These include fluctuations in the groundwater table related to atmospheric phenomena, which have been presented in this study. For example, water level variations observed in the Copper Cliff tailings disposal area near Copper Cliff, Ontario were modeled by averaging and described using a steady-state flow system [43]. Groundwater flow modeling also allows a contaminant to be tracked under the hypothesis of pure advective flow. The code calculates the forward and backward path of the particles, identifying possible sensitive receptors downgradient of the source or the more probable source areas including mining areas [44]. The application of this method allows the extent of the impact of pollution in an aquifer to be determined using the tool for investigating the contaminant plume. This, in turn, makes it possible to decide on the location and timing of remedial actions.
In order to facilitate remediation techniques, it is important to understand the oxidation of sulfidic minerals and the hydrolysis of the oxidation products that result in the production of AMD. However, the occurrence of these processes depends, on factors such as rapid climate changes and may lead to significant changes in the quality of groundwater in mining regions. Therefore, in this study some attempts were made to include the effects of hydrological, seasonal, and climatic changes on the composition of AMD, contaminant transport in watersheds, and restoration of mining sites. In the article [45], a comparative discussion is made regarding a few most applicable and widely used reactive transport models that can be applied to simulate the effect of climate change on sulfide oxidation and AMD production from mining waste, and contaminant transport in surface and groundwater systems.
To sum up, the model applied in this study, which was created with the help of the Visual MODFLOW software, allowed for modeling of the hydrodynamic field under the conditions of different evapotranspiration and different precipitation resulting from climate change. With the help of the Zone Budget module, it was possible to calculate the amount of leachate polluting the groundwater, while using the MT3DMS module it was possible to set nZVI treatment parameters in the program.
In the present study case, the modeling of the provided monitoring data (hydrological, hydrochemical, and meteorological) allowed for a good prediction of the peak occurrences of high contamination levels in groundwater and the need for action, such as addition of a fast kinetics reagent (e.g., nZVI), for prompt remediation. This treatment process allows for rapid dosing of the reactive material at the site(s) identified by online monitoring and numerical modeling. In this way, the process takes place at a specific time and place, without unnecessarily wasting the treatment material. As a result, the aquatic environment will be effectively and economically protected. Therefore, the optimal use of nZVI suspensions, without interfering too intensively with the environment, is ensured. The nZVI, due to its reduced size, much smaller than the pores of aquifers, can be dispersed in aqueous suspensions and directly injected into the substrate [46], allowing direct targeting of pollutants near the contamination source [47]. Further upscaling research is deemed necessary for a better understanding of the evolution of groundwater levels and contamination in correlation with influence factors, such as climate change, and the reliability of data collected with online monitoring equipment for mixed underground-mine water as well as with small- and medium-scale pilot testing before full-scale implementation of a continuous monitoring and nZVI-based treatment system.

4. Conclusions

This study aimed to develop a model calibrated on historical data for the prediction and treatment of underground contaminated water based on the monitoring of pH and EC for a waste heap at a coal mine in southern Poland.
The main findings are as follows:
  • Based on geological, hydrogeological, and meteorological data, as well as the monitoring of the groundwater table and the physicochemical parameters of this water and the concentrations of dissolved inorganic substances, models of groundwater flow and migration of pollutants can be prepared by applying the Visual MODFLOW software. Using these models, it is possible to observe detrimental changes in the aquatic environment and use this information to make decisions regarding the need for active remediation of groundwater. In the case of using a reactive material in the form of nZVI, the place and time of injection of this material can be determined. The adverse environmental changes may be related to excessive precipitation, which, after a long period of low precipitation, causes the intensification of leaching of inorganic contaminants from the mine waste.
  • In the case of the presence of a large amount of sulfidic waste in the heap, and a small amount of neutralizing minerals, especially carbonates, it was proposed that three parameters (EC, pH, and the level of the groundwater table) be monitored and used to create a model of pollutant flow in the groundwater. These parameters are to be sent online to the e-cloud, and from there, to the model of groundwater flow and pollution migration. Based on these results it will be possible to obtain quick information regarding the need to carry out remediation works and perform additional environmental analyses, if necessary.
Further studies are required to collect relevant data on the influence factors in a pilot- and full-scale field setting before the full-scale implementation of a continuous monitoring and nZVI-based treatment system.

Author Contributions

T.S.: Conceptualization, methodology, validation, formal analysis, investigation, writing—original draft preparation, editing, funding acquisition. D.M.F.: collecting and calculating meteorological data, methodology, investigation, writing—original draft preparation. C.M.N.: conceptualization, writing—reviewing and editing. T.M.: geological and hydrogeological data collection, modeling, validation. R.F.: geological and hydrogeological data collection, groundwater analysis, investigation, writing—original draft preparation. All authors have read and agreed to the published version of the manuscript.

Funding

This study was performed as part of the TEXMIN Project (The impact of extreme weather events on mining operations), which received funding from the Research Fund for Coal and Steel of the European Commission, under Grant Agreement no 847250, and from the Polish Ministry of Science and Higher Education under Contract No 5009/FBWiS/2019/2.

Institutional Review Board Statement

Not applicable.

Informed Consent Statement

Not applicable.

Data Availability Statement

Data sharing not applicable.

Acknowledgments

This study was funded by the Research Fund for Coal and Steel of the European Commission via the TEXMIN Project and by the Polish Ministry of Science and Higher Education. The authors acknowledge the support of the Natural Sciences and Engineering Research Council of Canada (NSERC) via Canada Research Chairs Program. They also gratefully thank the TAURON Wydobycie S.A., for providing the samples and historical data used in the project.

Conflicts of Interest

The authors declare no conflict of interest. The founders had no role in the design of the study, in the collection, analyses, or interpretation of data, in the writing of the manuscript; or in the decision to publish the results.

References

  1. Cañedo-Argüelles, M.; Kefford, B.J.; Piscart, C.; Prat, N.; Schafer, R.B.; Schulz, C.J. Salinization of rivers: An urgent ecological issue. Environ. Pollut. 2013, 173, 157–167. [Google Scholar] [CrossRef]
  2. Van Dam, R.A.; Harford, A.J.; Lunn, S.A.; Gagnon, M.M. Identifying the cause of toxicity of a saline mine water. PLoS ONE 2014, 9, e106857. [Google Scholar] [CrossRef]
  3. Zhao, Q.; Guo, F.; Zhang, Y.; Ma, S.; Jia, X.; Meng, W. How sulfate-rich mine drainage affected aquatic ecosystem degradation in norteastern China, and potential ecological risk. Sci. Total Environ. 2017, 609, 1093–1102. [Google Scholar] [CrossRef]
  4. Turunen, K.; Räsänen, T.; Hämäläinen, E.; Hämäläinen, M.; Pajula, P.; Nieminen, S.P. Analysing contaminant mixing and dilution in river waters influenced by mine water discharges. Water Air Soil Pollut. 2020, 231, 317. [Google Scholar] [CrossRef]
  5. Molenda, T. Impact of a saline mine water discharge on the development of a meromictic pond, the Rontok Wielki Reservoir, Poland. Mine Water Environ. 2018, 37, 807–814. [Google Scholar] [CrossRef] [Green Version]
  6. Janson, E.; Markowska, M.; Labaj, P.; Wrana, A.; Zawartka, P. A preliminary assessment of climate change impacts: Implications for mining activity in Polish coal regions. Arch. Min. Sci. 2020, 3, 703–717. [Google Scholar] [CrossRef]
  7. Rusydi, A.F. Correlation between conductivity and total dissolved solid in various type of water: A review. IOP Conf. Ser. Earth Environ. Sci. 2018, 118, 012019. [Google Scholar] [CrossRef]
  8. Hem, D. Study and Interpretation the Chemical of Natural of Characteristics Natural Water, 3rd ed.; USGS Water Supply Paper; US Government Printing Office: Washington, DC, USA, 1985; Volume 2254, pp. 66–69. [Google Scholar]
  9. Nordstrom, D.K.; Blowes, D.W.; Ptacek, C.J. Hydrogeochemistry and microbiology of mine drainage: An update. Appl. Geochem. 2015, 57, 3–16. [Google Scholar] [CrossRef]
  10. Pérez-Ostalé, E.; Grande, J.A.; Valente, T.; De La Torre, M.L.; Santisteban, M.; Fernández, P.; Diaz-Curiel, J. Relationships between sources of acid mine drainage and the hydrochemistry of acid effluents during rainy season in the Iberian Pyrite Belt. Water Sci. Tech. 2016, 73, 345–354. [Google Scholar] [CrossRef]
  11. Chlot, S.; Widerlund, A.; Husson, A.; Ohlander, B.; Ecke, F. Effects on nutrient regime in two recipients of nitrogen-rich mine effluents in northern Sweden. Appl. Geochem. 2013, 31, 12–24. [Google Scholar] [CrossRef]
  12. Meays, C.; Nordin, R. Ambient Water Quality Guidelines for Sulphate. Technical Appendix; Water Protection and Sustainability Branch, Environmental Sustainability and Strategic Policy Division, Ministry of Environment: Smithers, BC, Canada, 2013; 55p. [Google Scholar]
  13. Chandler, L.; Harford, A.J.; Hose, G.C.; Humphrey, C.L.; Chariton, A.; Greenfield, P.; Davis, J. Saline mine-water alters the structure and function of prokaryote communities in shallow groundwater below a tropical stream. Environ. Pollut. 2021, 284, 117318. [Google Scholar] [CrossRef]
  14. Gray, N.F. Field assessment of acid mine drainage contamination in surface and ground water. Environ. Geol. 1996, 27, 358–361. [Google Scholar] [CrossRef]
  15. Fytas, K.; Hadjigeorgiou, J. An assessment of acid rock drainage continuous monitoring technology. Environ. Geol. 1995, 25, 36–42. [Google Scholar] [CrossRef]
  16. Lyew, D.; Sheppard, J. Use of conductivity to monitor the treatment of acid mine drainage by sulphate-reducing bacteria. Water Res. 2001, 35, 2081–2086. [Google Scholar] [CrossRef]
  17. Suponik, T.; Neculita, C.M. Reactivity of nZVI in the removal of Cu(II) and Zn(II) from synthetic mine drainage. Environ. Prot. Eng. 2021, 47, 93–108. [Google Scholar] [CrossRef]
  18. Suponik, T. Optmization of the PRB (Permeable Reactive Barriers) Parameters for Selected Area of Dumping Site; Publishing House of the Silesian University of Technology: Gliwice, Poland, 2011; ISBN 978-83-7335-833-1. [Google Scholar]
  19. Suponik, T.; Franke, D.; Frączek, R.; Nowińska, K.; Pierzyna, P.; Różański, Z.; Wrona, P. The impact of precipitation on the groundwater of coal waste dump. J. Sustain. Min. 2021, 20, 13–19. [Google Scholar] [CrossRef]
  20. Hydrogeologic, W. Visual MODFLOW Flex 7.0 Integrated Conceptual & Numerical Groundwater Modeling Software, Conceptual Modeling Tutorial. 2021. 47p. Available online: https://www.waterloohydrogeologic.com/wp-content/uploads/2021/01/VMODFlex_ConceptualModeling_Tutorial.pdf (accessed on 24 February 2022).
  21. Allen, R.G.; Pereira, L.S.; Raes, D.; Smith, M. Crop Evapotranspiration: Guidelines for Computing Crop Water Requirements—FAO Irrigation and Drainage Paper 56; Food and Agriculture Organization of the United Nations: Rome, Italy, 1998; ISBN 92-5-104219-5. [Google Scholar]
  22. Xu, C.-Y.; Singh, V.P. Evaluation of three complementary relationship evapotranspiration models by water balance approach to estimate actual regional evapotranspiration in different climatic regions. J. Hydrol. 2005, 308, 105–121. [Google Scholar] [CrossRef]
  23. Matuszko, D.; Celiński-Mysław, D. Warunki solarne krakowa i możliwości ich wykorzystania w helioenergetyce. Acta Sci. Pol. Form. Circumiectus 2016, 15, 103–111. [Google Scholar] [CrossRef]
  24. Costello, L.R.; Jones, K.S. A Guide to Estimating Irrigation Water Needs of Landscape Plantings in California; University of California Cooperative Extension, California Department of Water Resources: Sacramento, CA, USA, 2000. [Google Scholar]
  25. Koniarski, M.; Matysiak, B.; Treder, W. Ewapotranspiracja i współczynniki roślinne (k) dla czterech odmian różanecznika przy zastosowaniu regulowanego deficytu nawadniania. Zesz. Nauk. Inst. Ogrod. 2016, 24, 71–80. [Google Scholar]
  26. Kuźniar, A.; Twardy, S.; Kowalczyk, A.; Kostuch, M. An assessment of the water requirements of a mountain pasture sward in the Polish Western Carpathians. J. Water Land Dev. 2011, 15, 193–208. [Google Scholar] [CrossRef]
  27. Szwed, M. Projections of changes of areal evapotranspiration for different land-use units in the Wielkopolska Region (Poland). Theor. Appl. Climatol. 2017, 130, 291–304. [Google Scholar] [CrossRef] [Green Version]
  28. Treder, J.; Treder, W.; Klamkowski, K. Determination of irrigation requirements and crop coefficients using weighing lysimeters in perennial plants. Infrastucture Ecol. Rural Areas 2017, 1213–1228. [Google Scholar] [CrossRef]
  29. Zyromski, A.; Biniak-Pieróg, M.; Szulczewski, W.; Kordas, L.; Kabala, C.; Galka, B. Mathematical Modeling of Evapotranspiration of Selected Energy Crops; Wydawnictwo Uniwersytetu Przyrodniczego We Wroclawiu: Wroclaw, Poland, 2016; ISBN 978-83-7717-253-7. [Google Scholar]
  30. Allen, R.G.; Pruitt, W.O.; Raes, D.; Smith, M.; Pereira, L.S. Estimating evaporation from bare soil and the crop coefficient for the initial period using common soils information. J. Irrig. Drain. Eng. 2005, 131, 14–23. [Google Scholar] [CrossRef]
  31. Quinn, R.; Parker, A.; Rushton, K. Evaporation from bare soil: Lysimeter experiments in sand dams interpreted using conceptual and numerical models. J. Hydrol. 2018, 564, 909–915. [Google Scholar] [CrossRef]
  32. Snyder, R.L.; Geng, S.; Orang, M.; Sarreshteh, S. Calculation and simulation of evapotranspiration of applied water. J. Integr. Agric. 2012, 11, 489–501. [Google Scholar] [CrossRef]
  33. Lorenc, H. Susze i Opady Maksymalne w Polsce. Prezentacja na Seminarium PK GWP. 16 December. 2011. Available online: http://gwppl.org/data/uploads/prezentacje/Susze%20i%20opady%20maksymalne%20w%20Polsce.pdf (accessed on 6 December 2021).
  34. Opis Susz w Okresie 1996–2005. Available online: http://posucha.imgw.pl/index.php?option=com_content&view=article&id=25&Itemid=59 (accessed on 6 December 2021).
  35. Staśko, S.; Tarka, R.; Buczyński, S. Ekstremalne zdarzenia meteorologiczne i ich odzwierciedlenie w stanach wód. Przegląd Geol. 2017, 65, 5. [Google Scholar]
  36. Lèbre, E.; Corder, G.D.; Golev, A. Sustainable practices in the management of mining waste: A focus on the mineral resource. Miner. Eng. 2017, 107, 34–42. [Google Scholar] [CrossRef]
  37. Nikitina, N. Geoethics: Theory, Principles, Problems, 2nd ed.; Geoinformmark, Ltd.: Moscow, Russia, 2016; 256p, ISBN 978-5-98877-061-9. [Google Scholar]
  38. Bondu, R.; Cloutier, V.; Rosa, E.; Benzaazoua, M. A review and evaluation of the impacts of climate change on geogenic arsenic in groundwater from fractured bedrock aquifers. Water Air Soil Pollut. 2016, 227, 296. [Google Scholar] [CrossRef]
  39. Wolkersdorfer, C.; Nordstrom, D.K.; Beckie, R.D.; Cicerone, D.S.; Elliot, T.; Edraki, M.; Valente, T.; Alves França, S.C.; Kumar, P.; Oyarzún Lucero, R.A.; et al. Guidance for the integrated use of hydrological, geochemical, and isotopic tools in mining operations. Mine Water Environ. 2020, 39, 204–228. [Google Scholar] [CrossRef] [Green Version]
  40. Kurukulasuriya, D.; Howcroft, W.; Moon, E.; Meredith, K.; Timms, W. Selecting environmental water tracers to understand groundwater around mines: Opportunities and limitations. Mine Water Environ. 2022, 1–13. [Google Scholar] [CrossRef]
  41. Fytas, K. Développement de la Surveillance en Continu Pour le Drainage Minier Acide. Phase I; Department of Mining and Metallurgy, Laval University: Quebec City, QC, Canada; 180p.
  42. Garrick, H.; Digges La Touche, G.; Plimmer, B.; Hybert, D. Assessing the hydraulic performance of tailings management facilities. In Proceedings of the 17th Extractive Industry Geology Conference, Ormskirk, UK, 5–8 September 2012; Extractive Industry Geology Conferences Ltd.: Witney, UK, 2014. [Google Scholar]
  43. Brookfield, A.E.; Blowes, D.W.; Mayer, K.U. Integration of field measurements and reactive transport modelling to evaluate contaminant transport at a sulfide mine tailings impoundment. J. Contam. Hydrol. 2006, 88, 1–22. [Google Scholar] [CrossRef] [PubMed]
  44. Colombo, L.; Gzyl, G.; Mazzon, P.; Łabaj, P.; Frączek, R.; Alberti, L. Stochastic Particle Tracking Application in Different Urban Areas in Central Europe: The Milano (IT) and Jaworzno (PL) Case Study to Secure the Drinking Water Resources. Sustainability 2021, 13, 10291. [Google Scholar] [CrossRef]
  45. Anawar, H.M. Impact of climate change on acid mine drainage generation and contaminant transport in water ecosystems of semi-arid and arid mining areas. Phys. Chem. Earth Parts A/B/C 2013, 58–60, 13–21. [Google Scholar] [CrossRef]
  46. Varadhi, S.N.; Gill, H.; Apoldo, L.J.; Liao, K.; Blackman, R.A.; Wittman, W.K. Full-scale nanoiron injection for treatment of groundwater contaminated with chlorinated hydrocarbons. In Proceedings of the Natural Gas Technologies 2005 Conference, Orlando, FL, USA, 30 January–2 February 2005. [Google Scholar]
  47. Tiraferri, A.; Chen, K.L.; Sethi, R.; Elimelech, M. Reduced aggregation and sedimentation of zero-valent iron nanoparticles in the presence of guar gum. J. Colloid Interface Sci. 2008, 324, 71–79. [Google Scholar] [CrossRef]
Figure 1. Images of: (a) the coal waste heap; (b) the location of the Vistula and piezometers near the heap [19].
Minerals 12 00391 g001
Figure 2. Average EC and pH values for groundwater collected from piezometers: P 1, P 12, P 15, P 16, P 17 (April 2007 to December 2010).
Minerals 12 00391 g002
Figure 3. Average values of metallic elements in water collected from piezometers P 12, P 15, P 16, P 17 (April 2007 to December 2010).
Minerals 12 00391 g003aMinerals 12 00391 g003b
Figure 4. Free groundwater table depth (GTD) below the surface level (in meters below surface, mbs) for piezometers: P1, P12, P15, P16, P17. The location of piezometers in the vicinity of waste heap is shown in Figure 1b.
Minerals 12 00391 g004
Figure 5. Results of modeling groundwater flow and migration of zinc ions for Q2 2007 (modeling of Zn(II) migration for the steady-state conditions lasted two years). P1, P12, P15, P16, P17—piezometers; numbers in the two blue axes—distance in meters; blue numbers—the height of the groundwater table; red numbers—concentration of Zn(II).
Minerals 12 00391 g005
Figure 6. Results of modeling groundwater flow and migration of zinc ions for Q4 2010 (modeling of Zn(II) migration for the steady-state conditions lasted two years). P1, P12, P15, P16, P17—piezometers; numbers in the two blue axes—distance in meters; blue numbers—the height of the groundwater table; red numbers—concentration of Zn(II).
Minerals 12 00391 g006
Figure 7. Landscape evapotranspiration and water balance for heap and adjacent areas in the period 2006–2010.
Minerals 12 00391 g007
Figure 8. Results of modeling groundwater treatment using nZVI suspension for Q4 2010. P1, P12, P15, P16, P17—piezometers; numbers in the two blue axes—distance in meters; blue numbers—the height of the groundwater table; red numbers—concentration of Zn(II).
Minerals 12 00391 g008
Table 1. Concentrations of Trace Elements in Waste (ICP-AES).
ElementUnitConcentration in Sample No.
1234567Average
Asppm16.328.89.8014.94.2819.90.8413.5
Snppm7.1731.82.6318.83.800.491.419.44
Cdppm1.612.78<0.0021.240.98<0.0020.081.34
Coppm16859.819.589.64.410.872.0149.3
Moppm7.072.871.110.87<0.0061.890.142.33
Hgppm<0.0170.0450.0870.484<0.0170.084<0.0170.181
Nippm52.358.10.485.8478.255.110.637.3
Cuppm42.41996.4779.488.510559.483.0
Znppm27819531.2423256120155208
Srppm1011051.4834.44.7080.74.0747.5
Pbppm16055.855.594.7107102163105
Bappm2885101564.710.9812.525.7142
Crppm5.461011.2397.14.7845.433.241.2
Mnppm325110124169125189155171
Table 2. The hydrogeological parameters used in the large and detailed models.
Layers in the ModelEffective Porosity *
[-]
Filtration Coefficient **
k [m/s]
Longitudinal Dispersion ***
[m2/d]
Transverse Dispersion ***
[m2/d]
coarse-grained coal waste0.553.82 × 10−52.50.25
fine-grained coal waste0.353.42 × 10−71.00.1
sand0.252.8 × 10−55.00.5
clay0.011.0 × 10−90.10.01
*—data obtained from laboratory tests. **—data obtained from modeling. ***—data obtained from literature research.
Publisher’s Note: MDPI stays neutral with regard to jurisdictional claims in published maps and institutional affiliations.