
Colours of Gemmy Phosphates from the Gavà Neolithic Mines (Catalonia, Spain): Origin and Archaeological Significance

 , ,
, ,  ,
,  ,
,  , , , ,
Abstract
1. Introduction
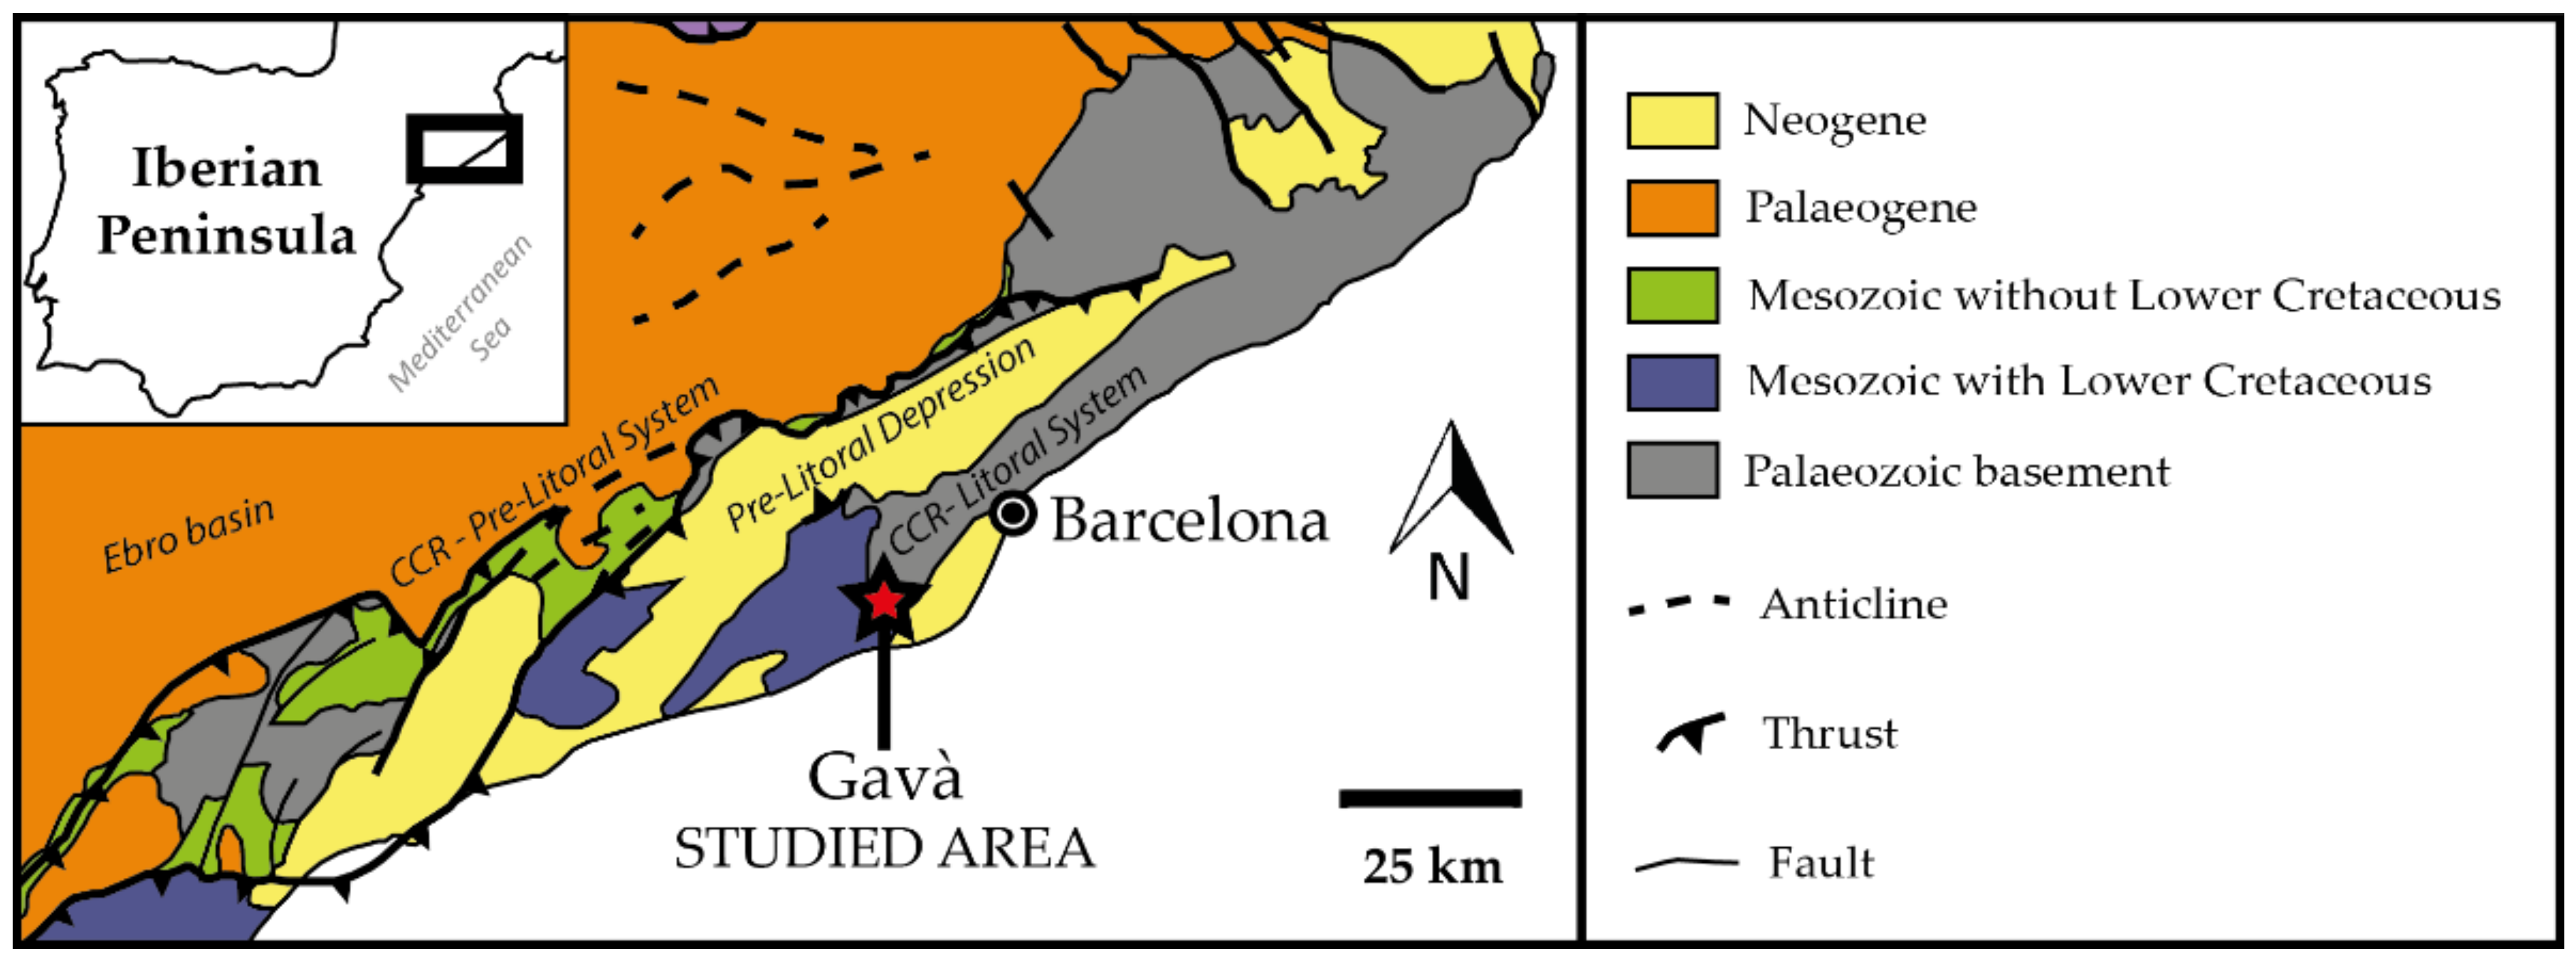
2. Geological Settings
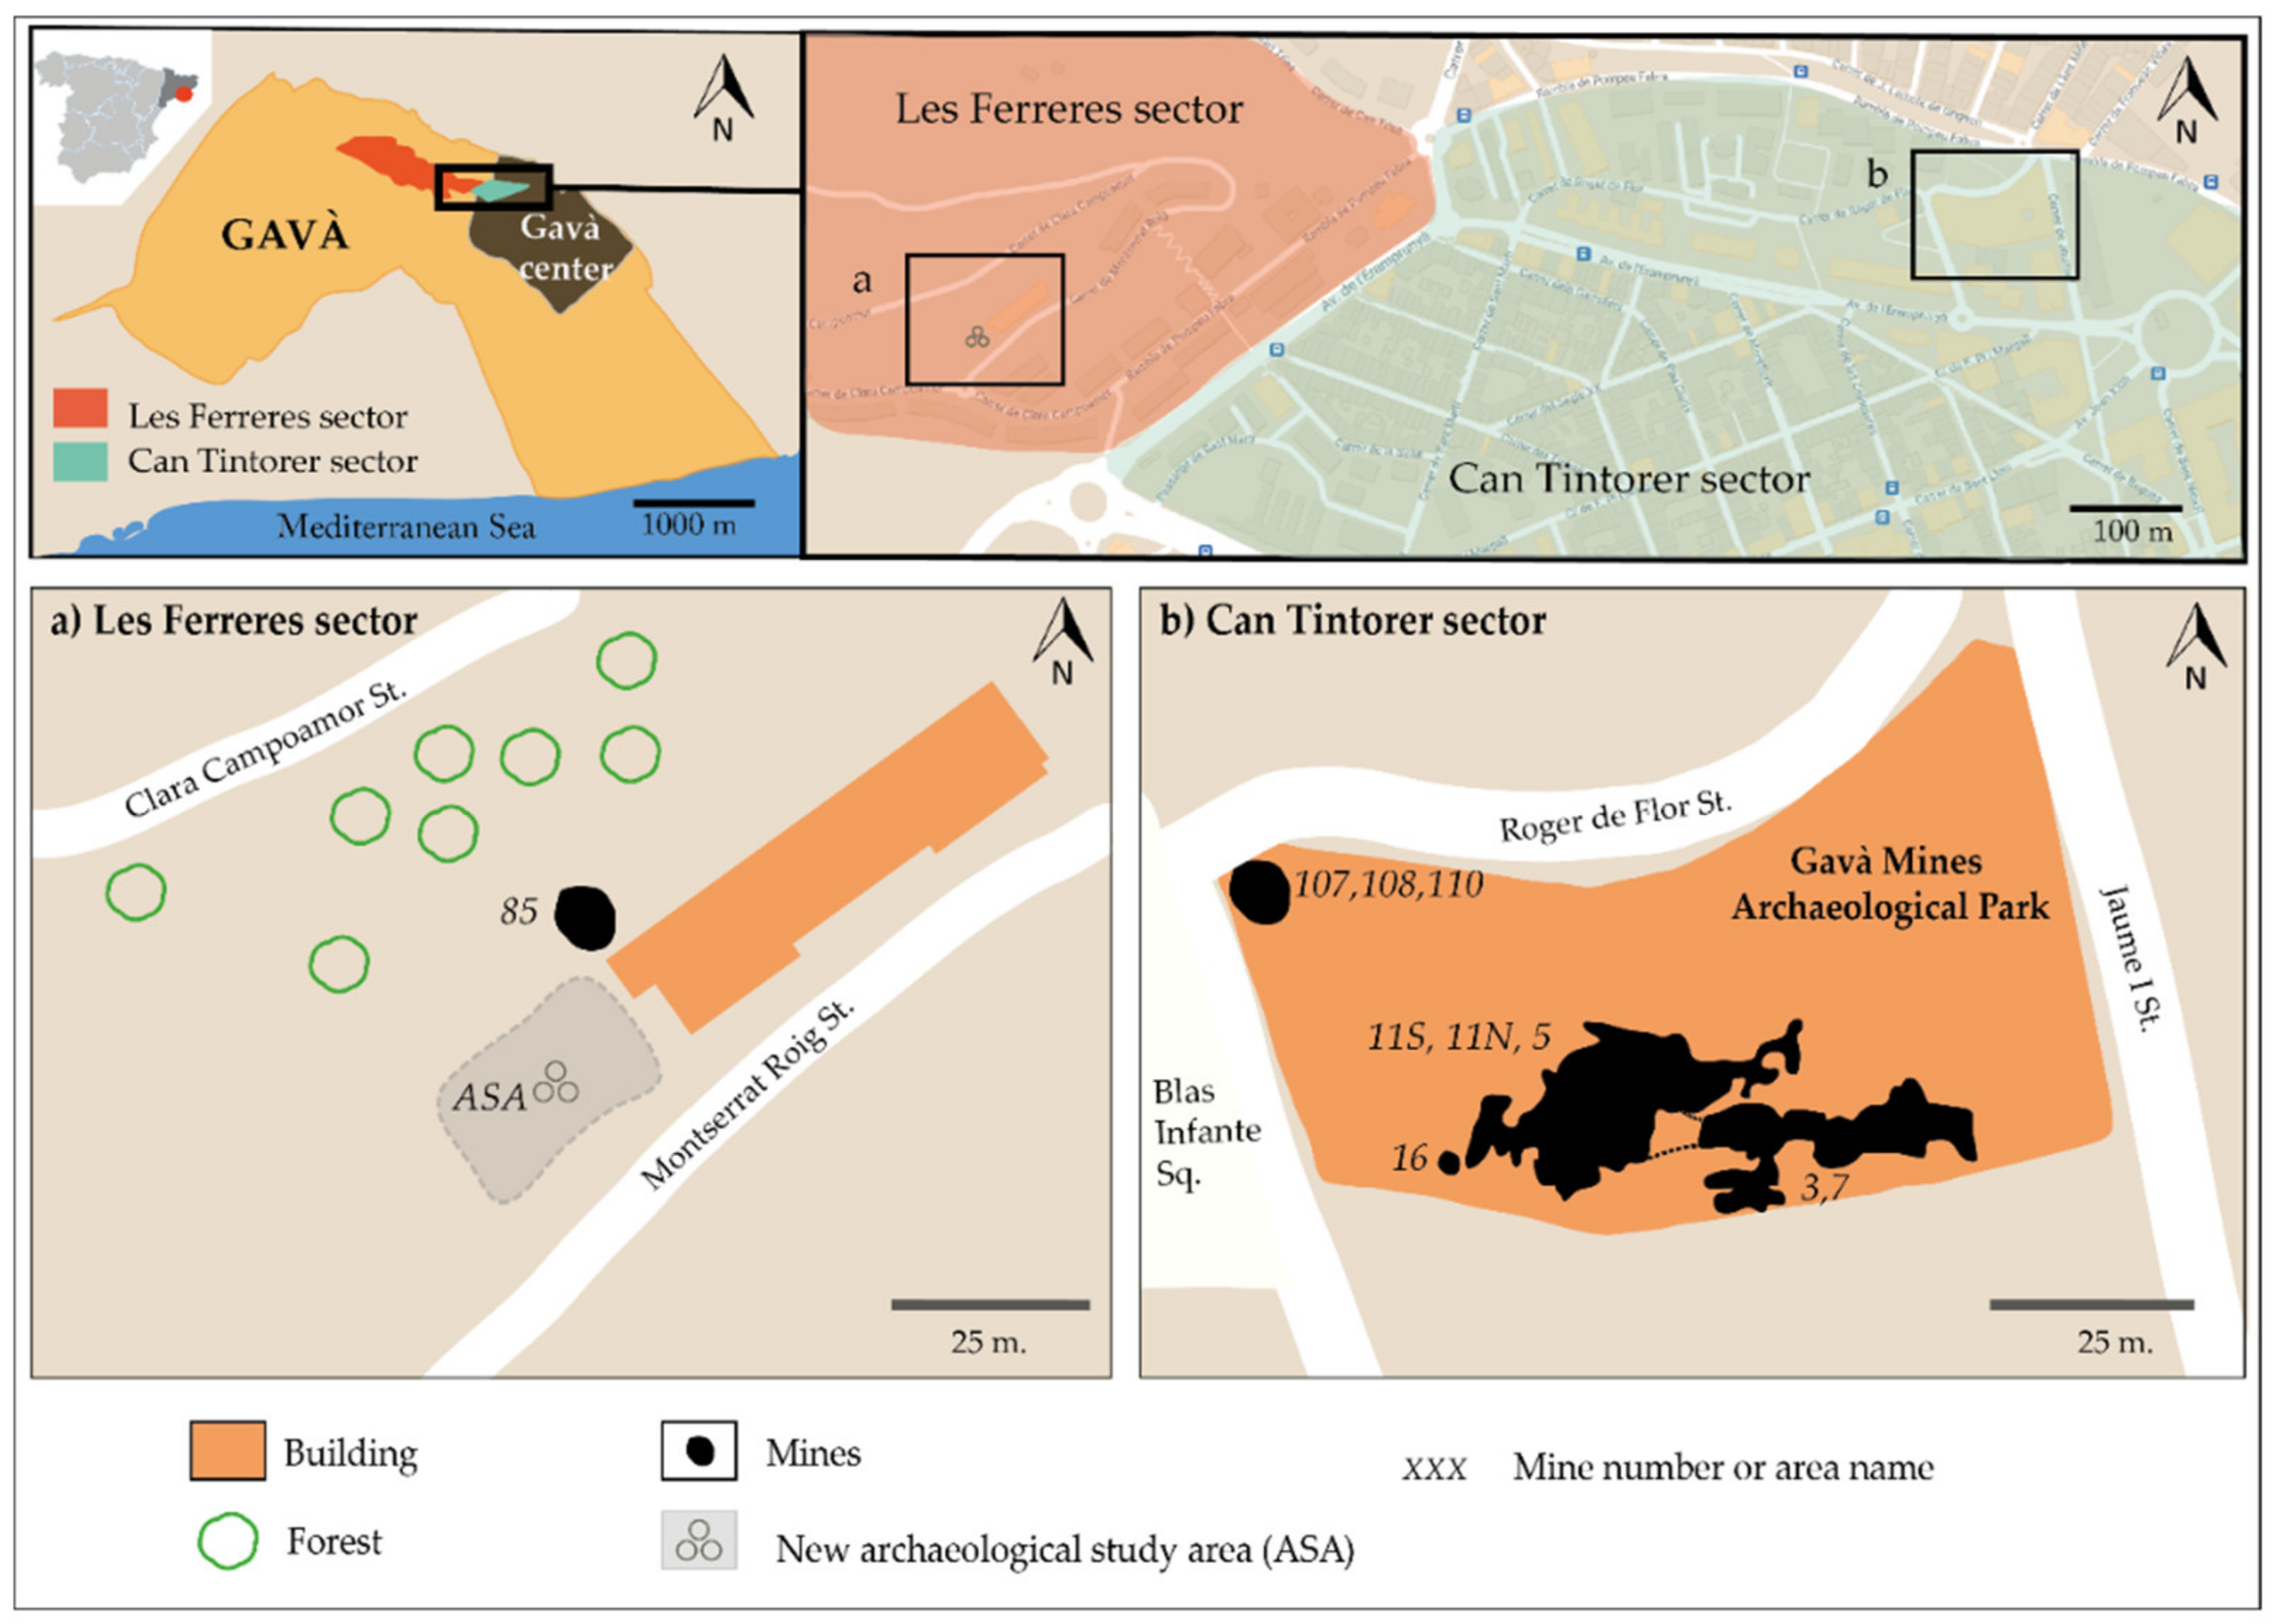
3. Study Area
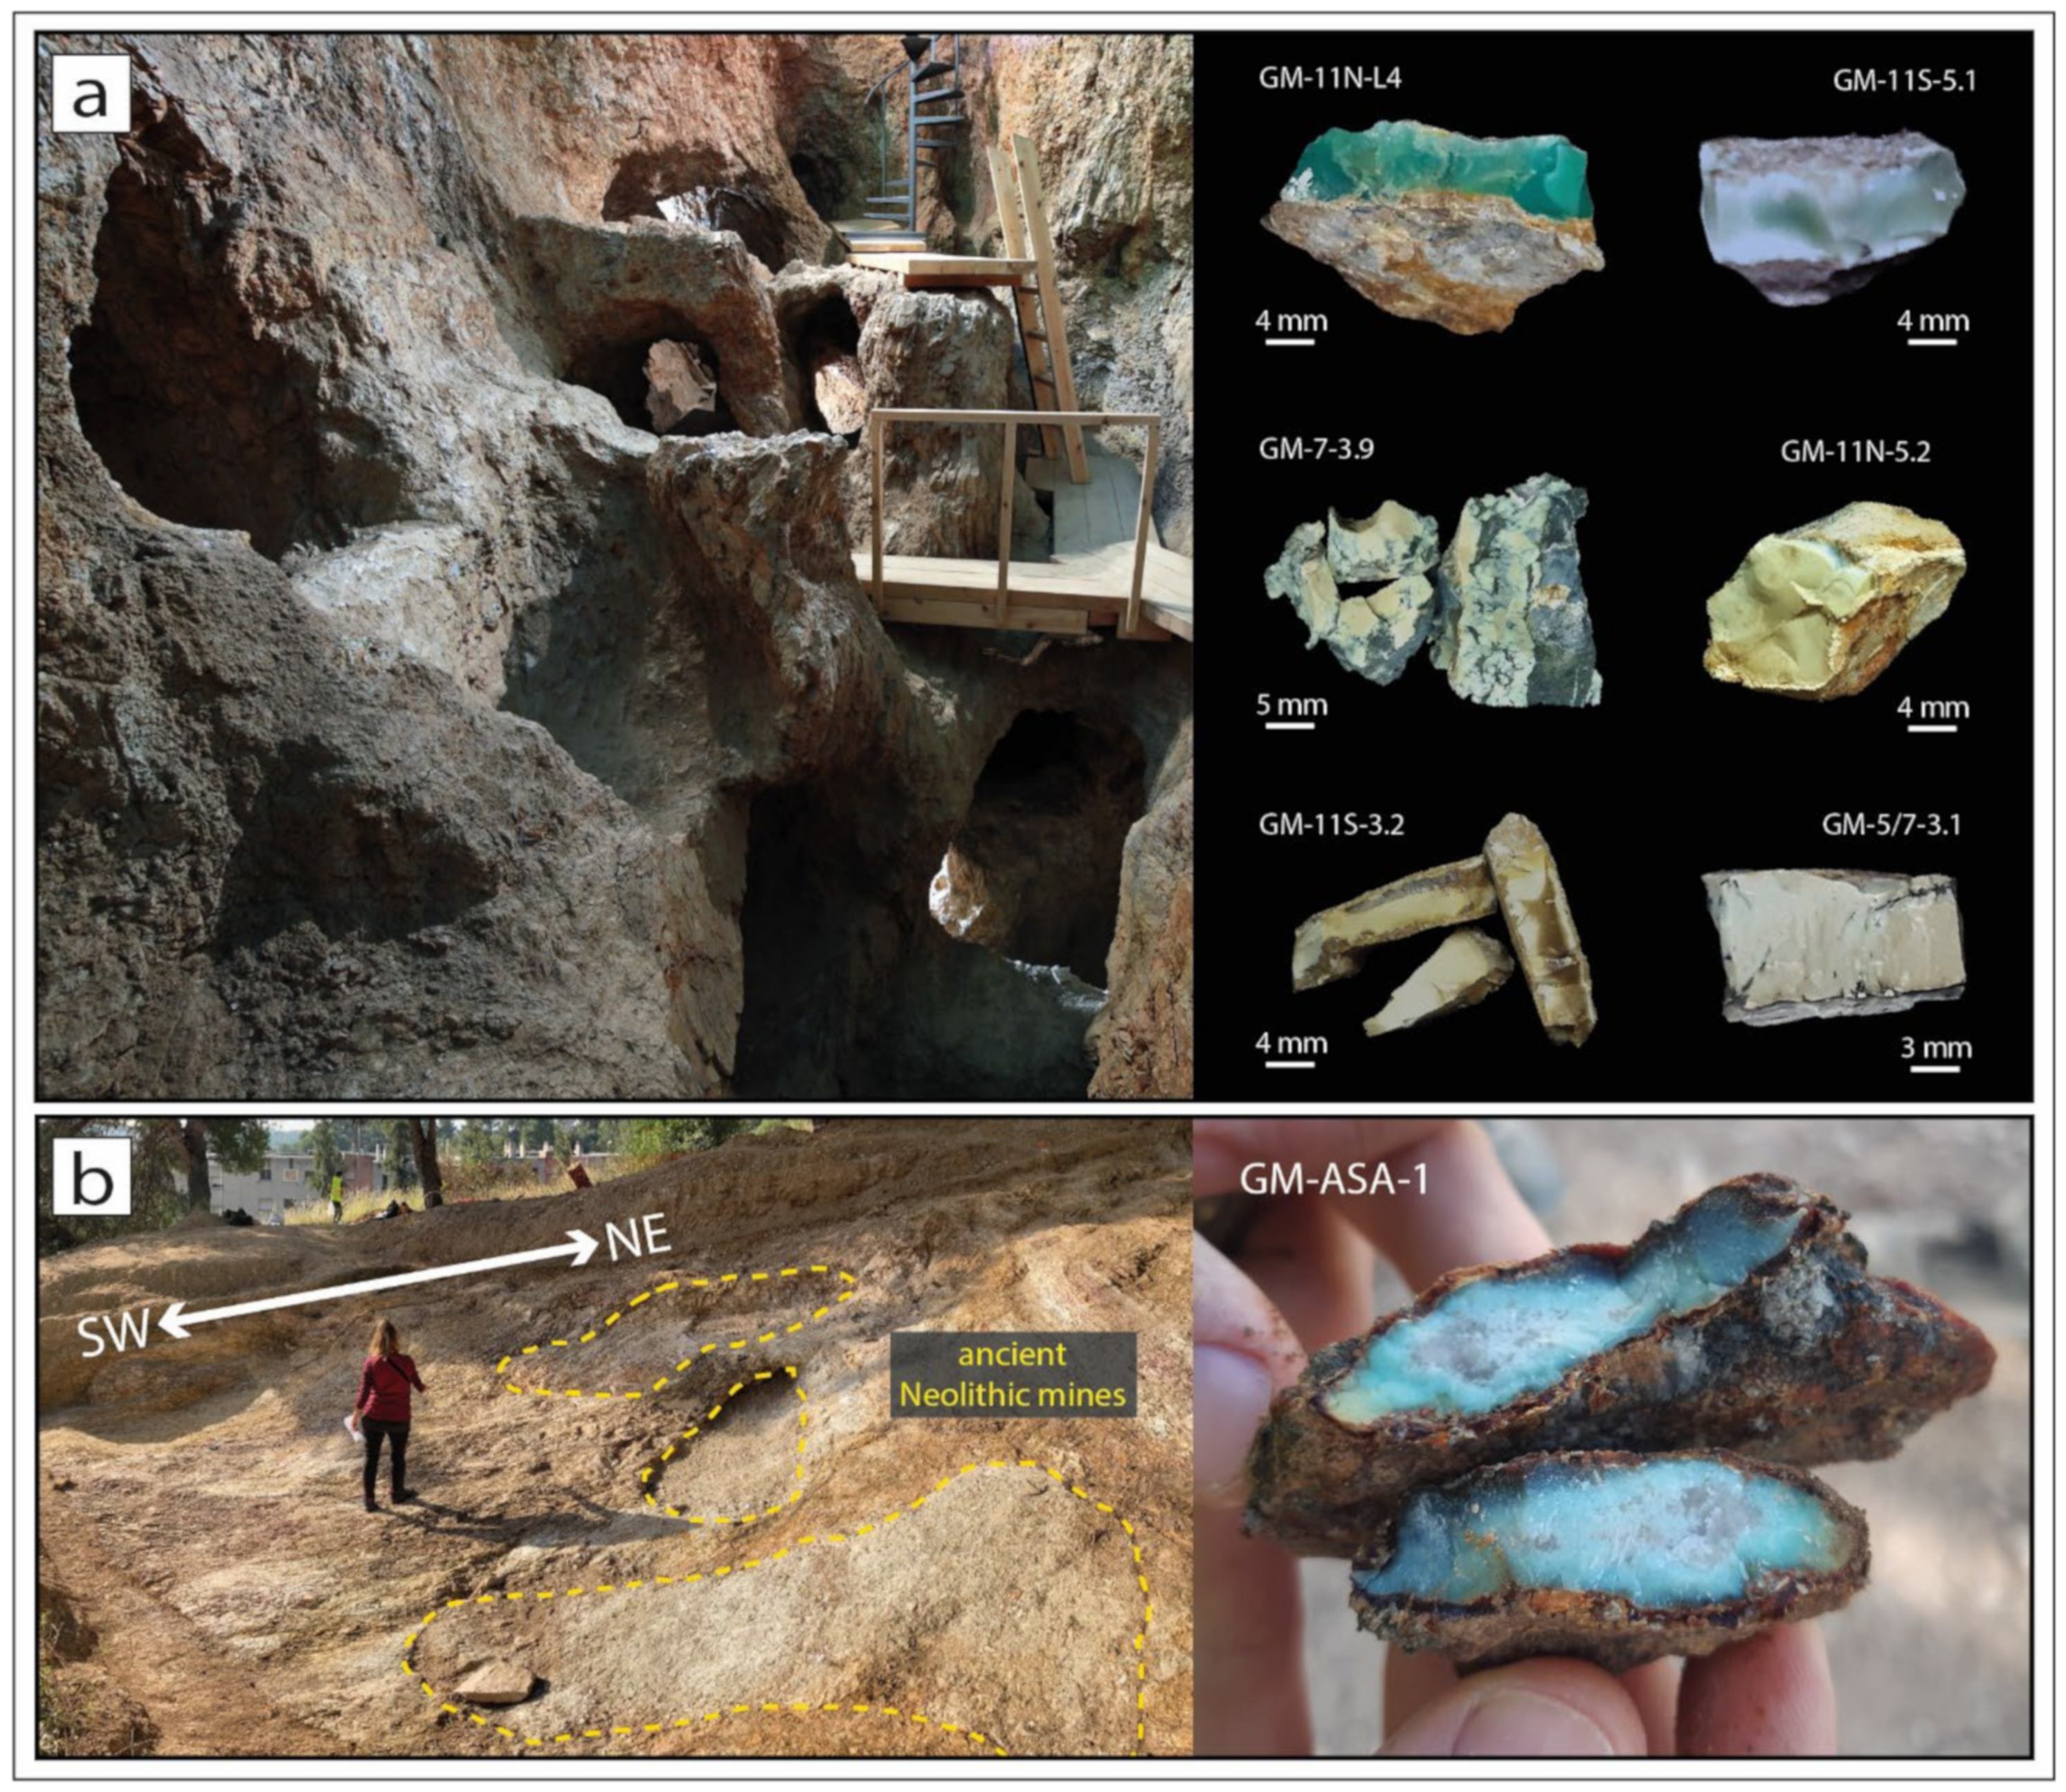
3.1. Can Tintorer Sector

3.2. Les Ferreres Sector
4. Materials and Methods
4.1. Samples
4.1.1. Mineral Samples
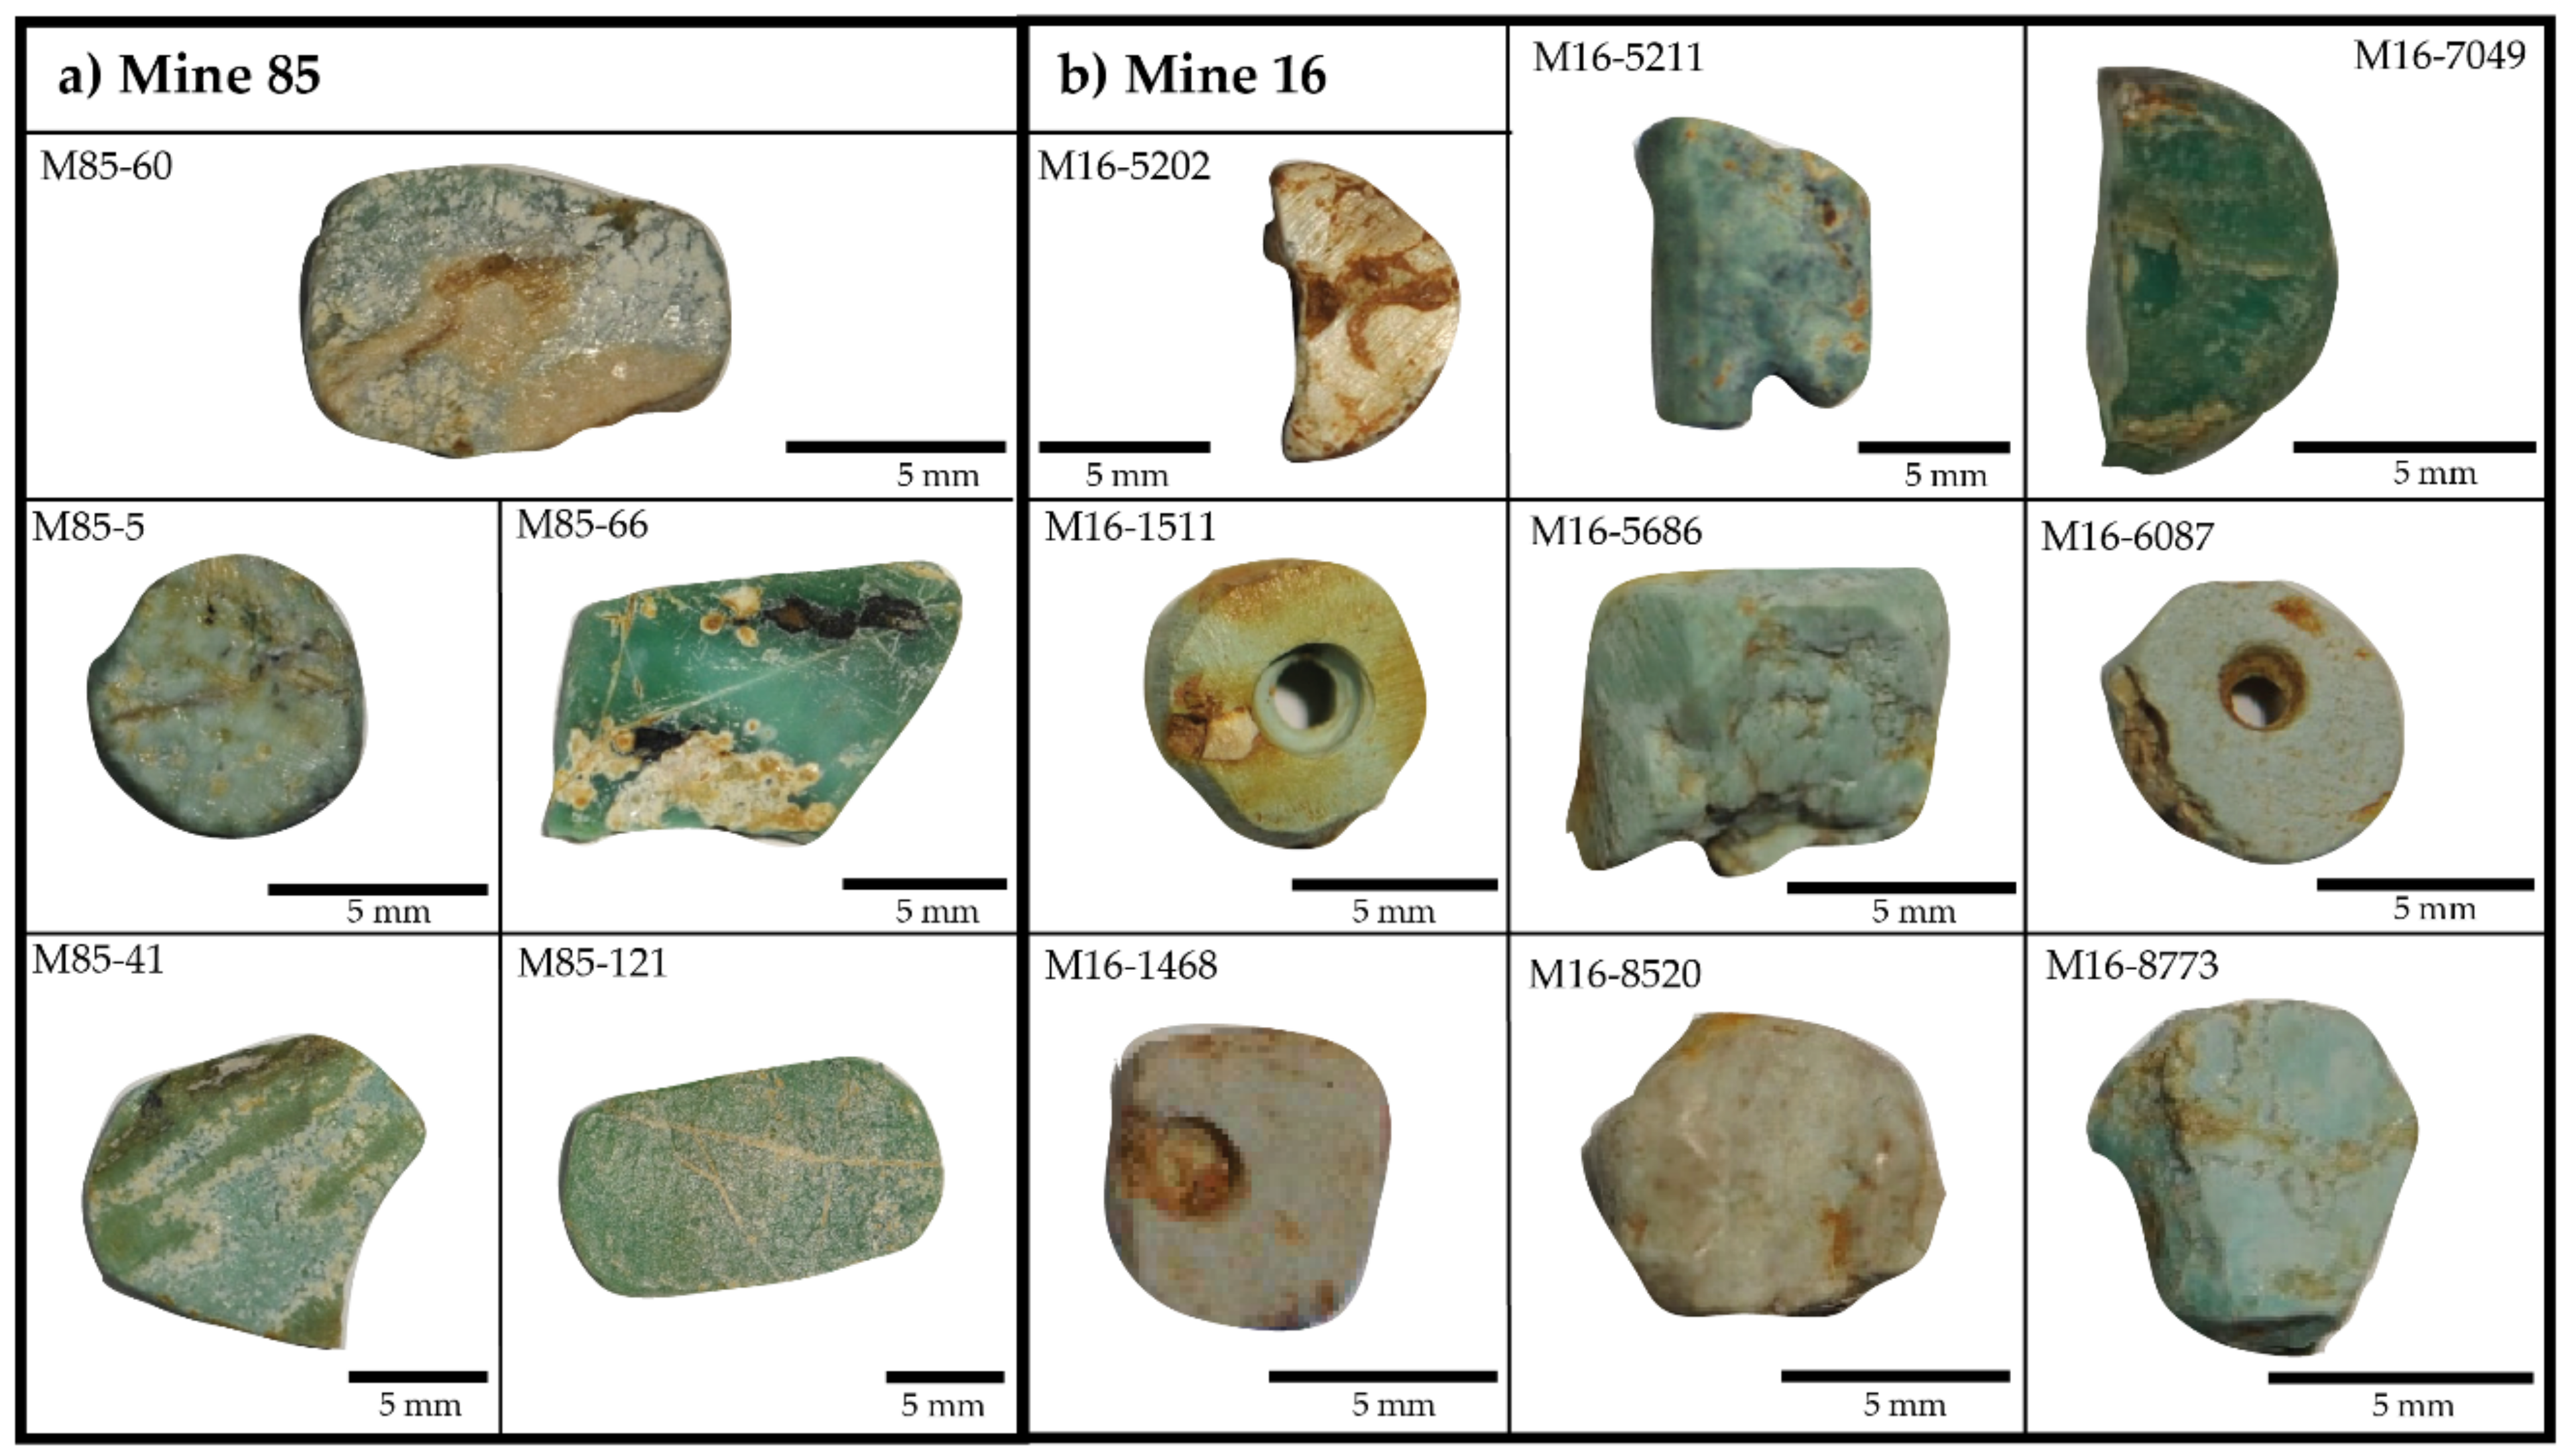
4.1.2. Archaeological Samples
4.2. Analytical Methods
4.2.1. Colourimetry
4.2.2. X-ray Diffraction (XRD)
4.2.3. Scanning Electron Microscopy (SEM)
4.2.4. Electron Probe Microanalysis (EPMA)
4.2.5. Raman Spectroscopy
4.3. 57Fe Mössbauer Spectrometry
5. Results
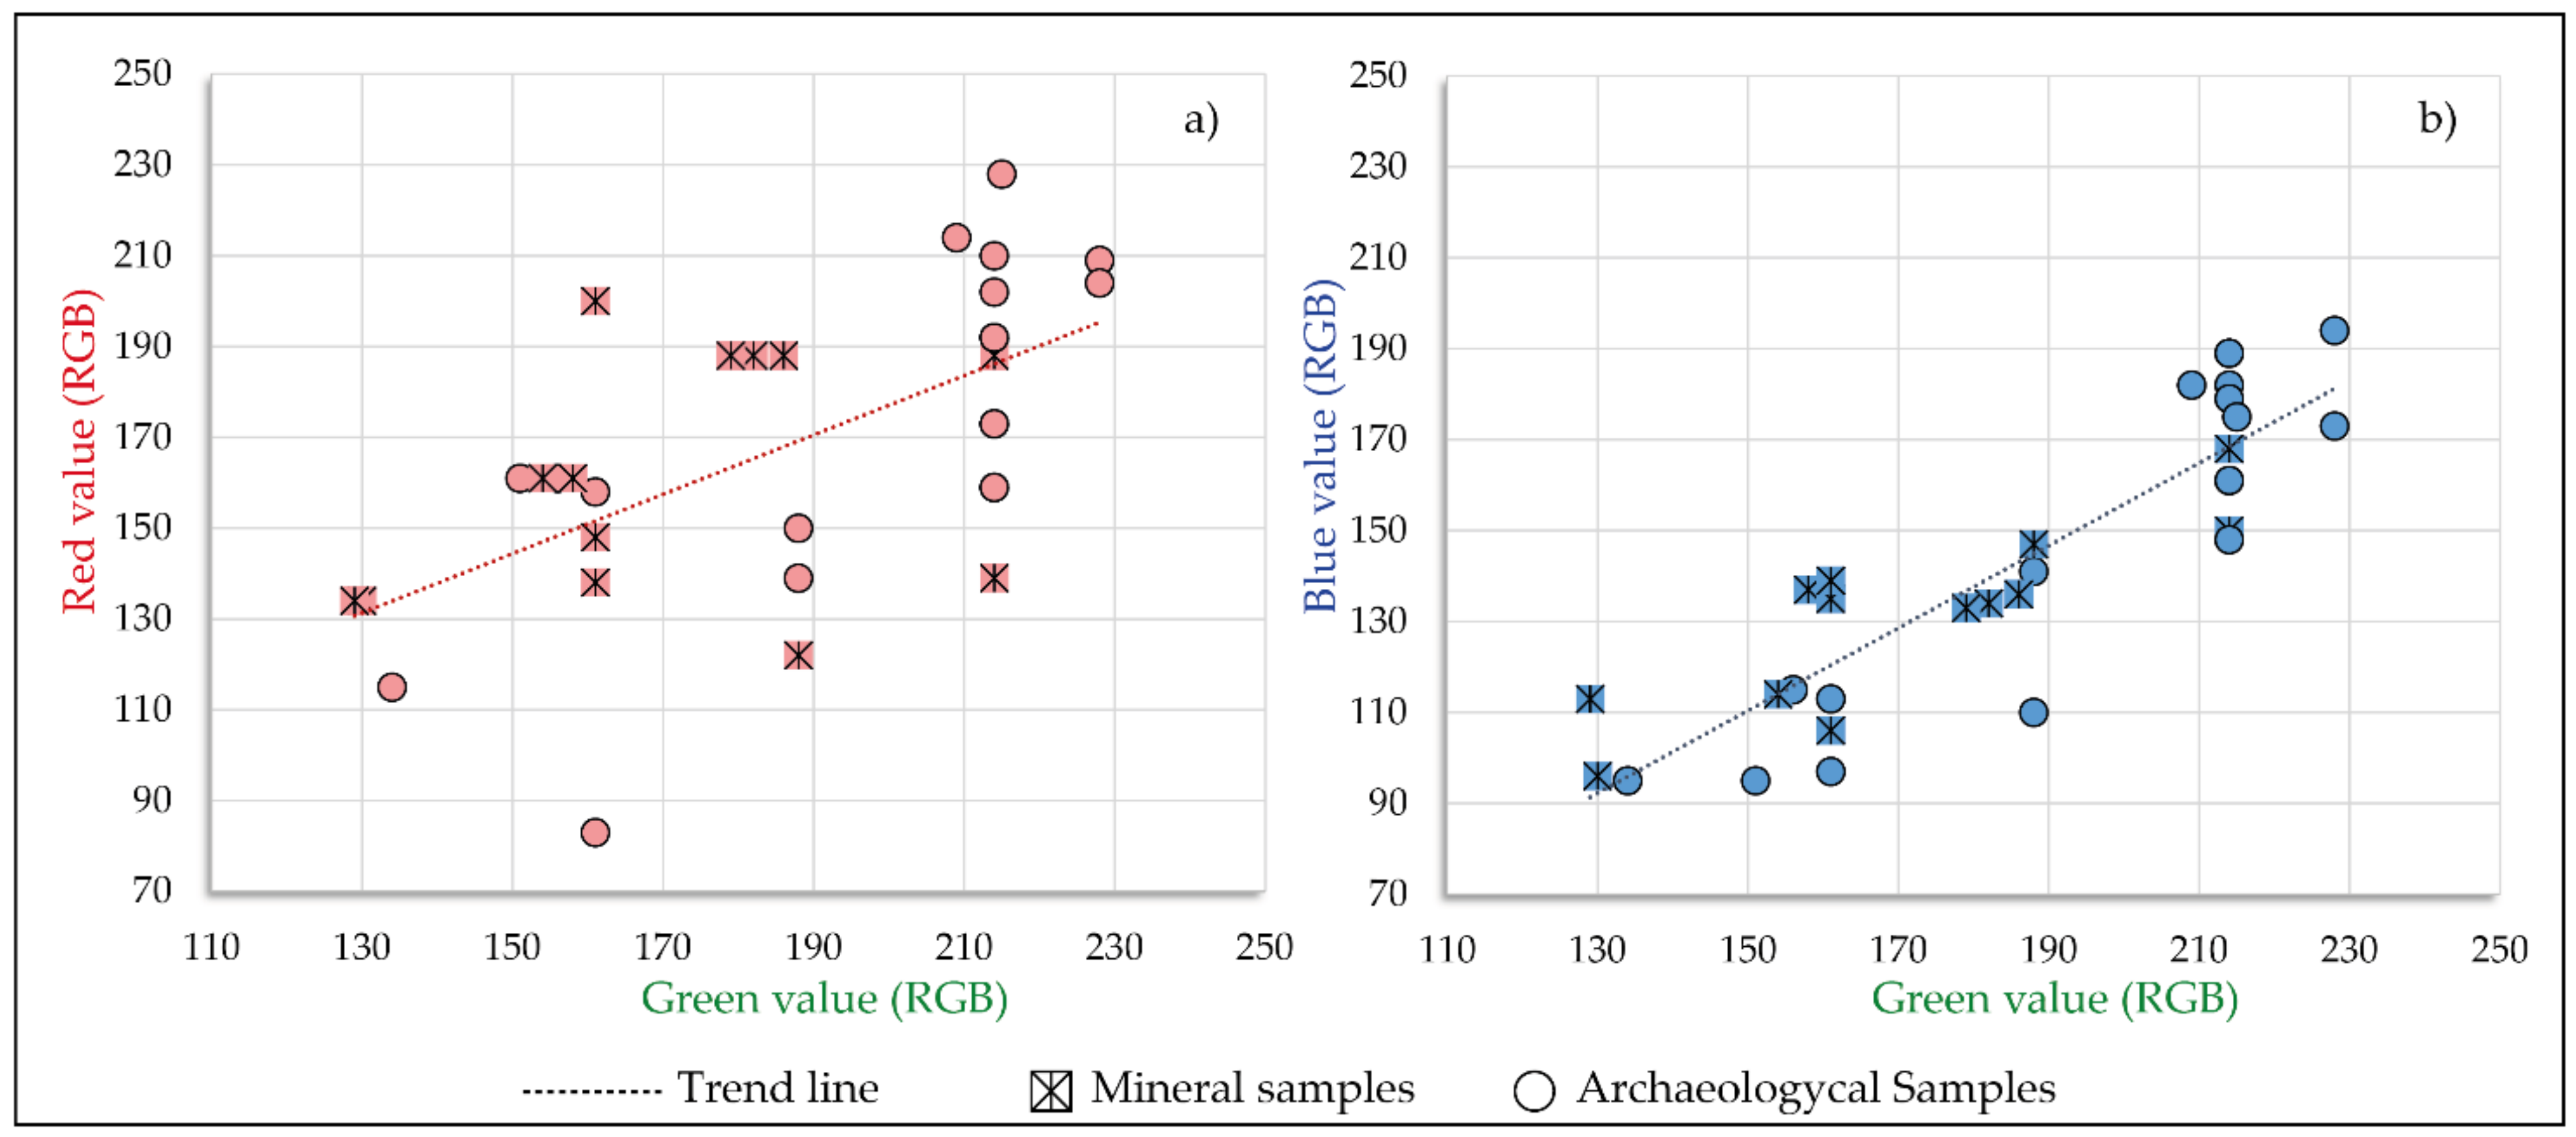
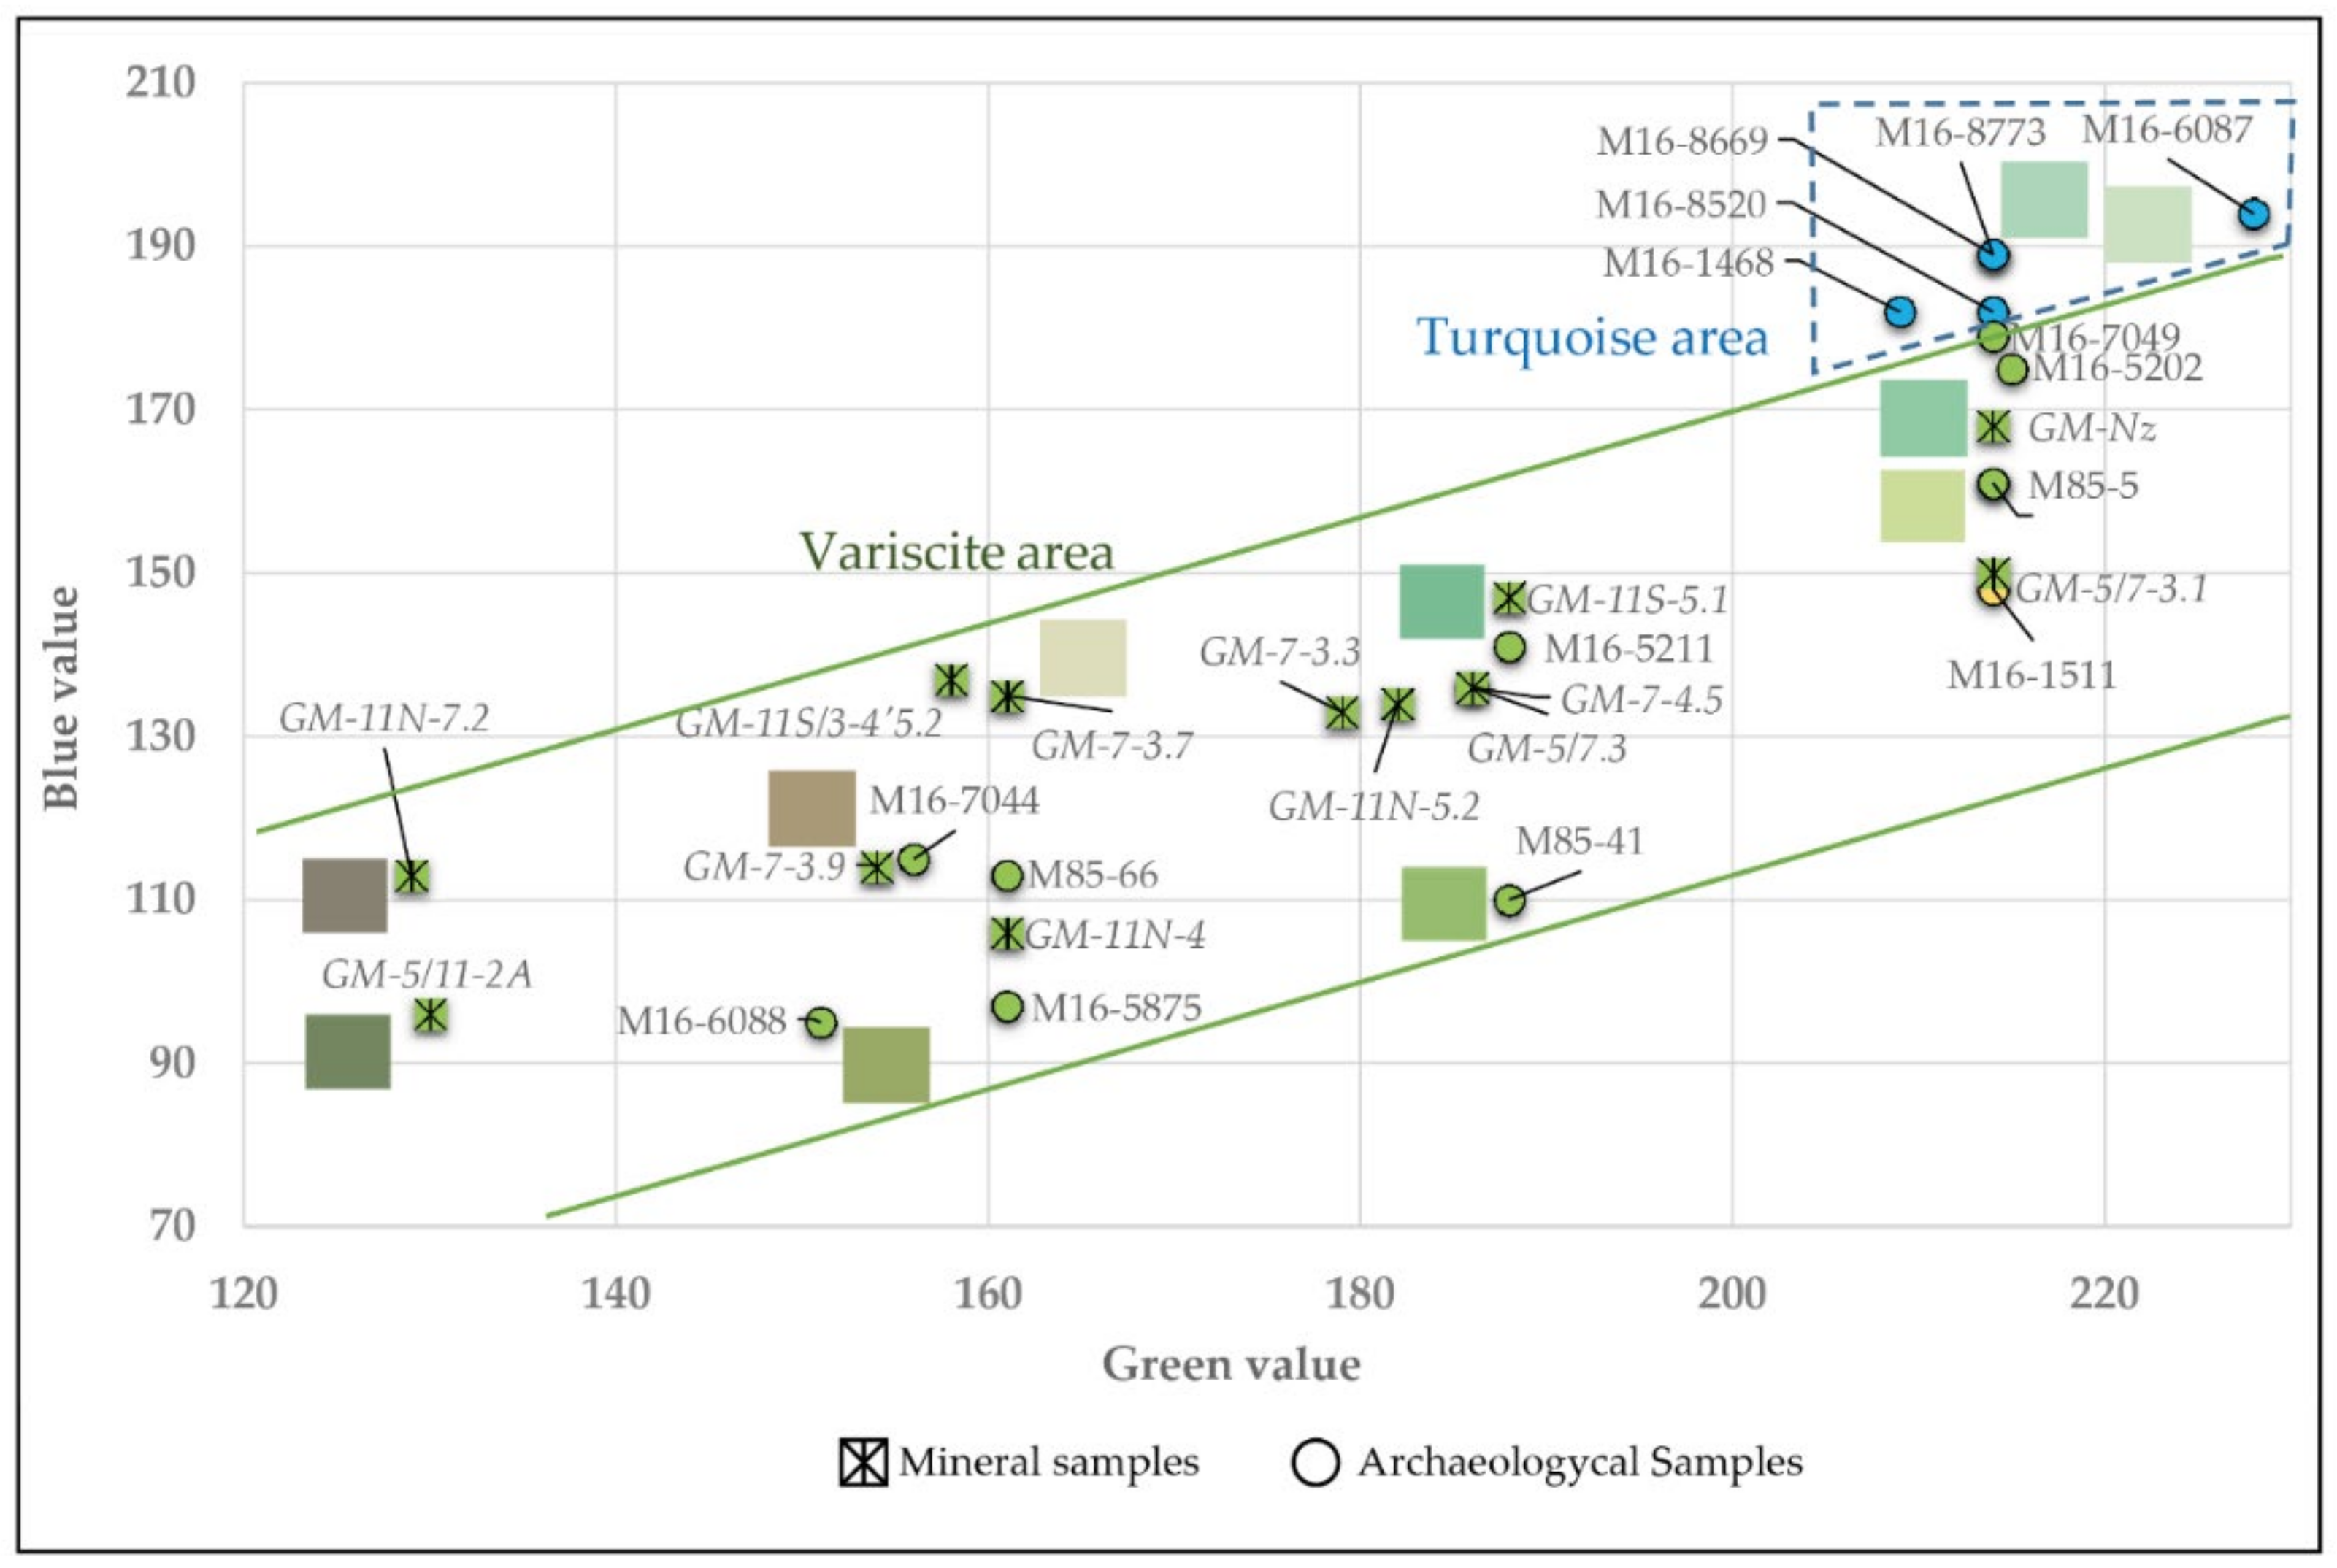
5.1. Colourimetry
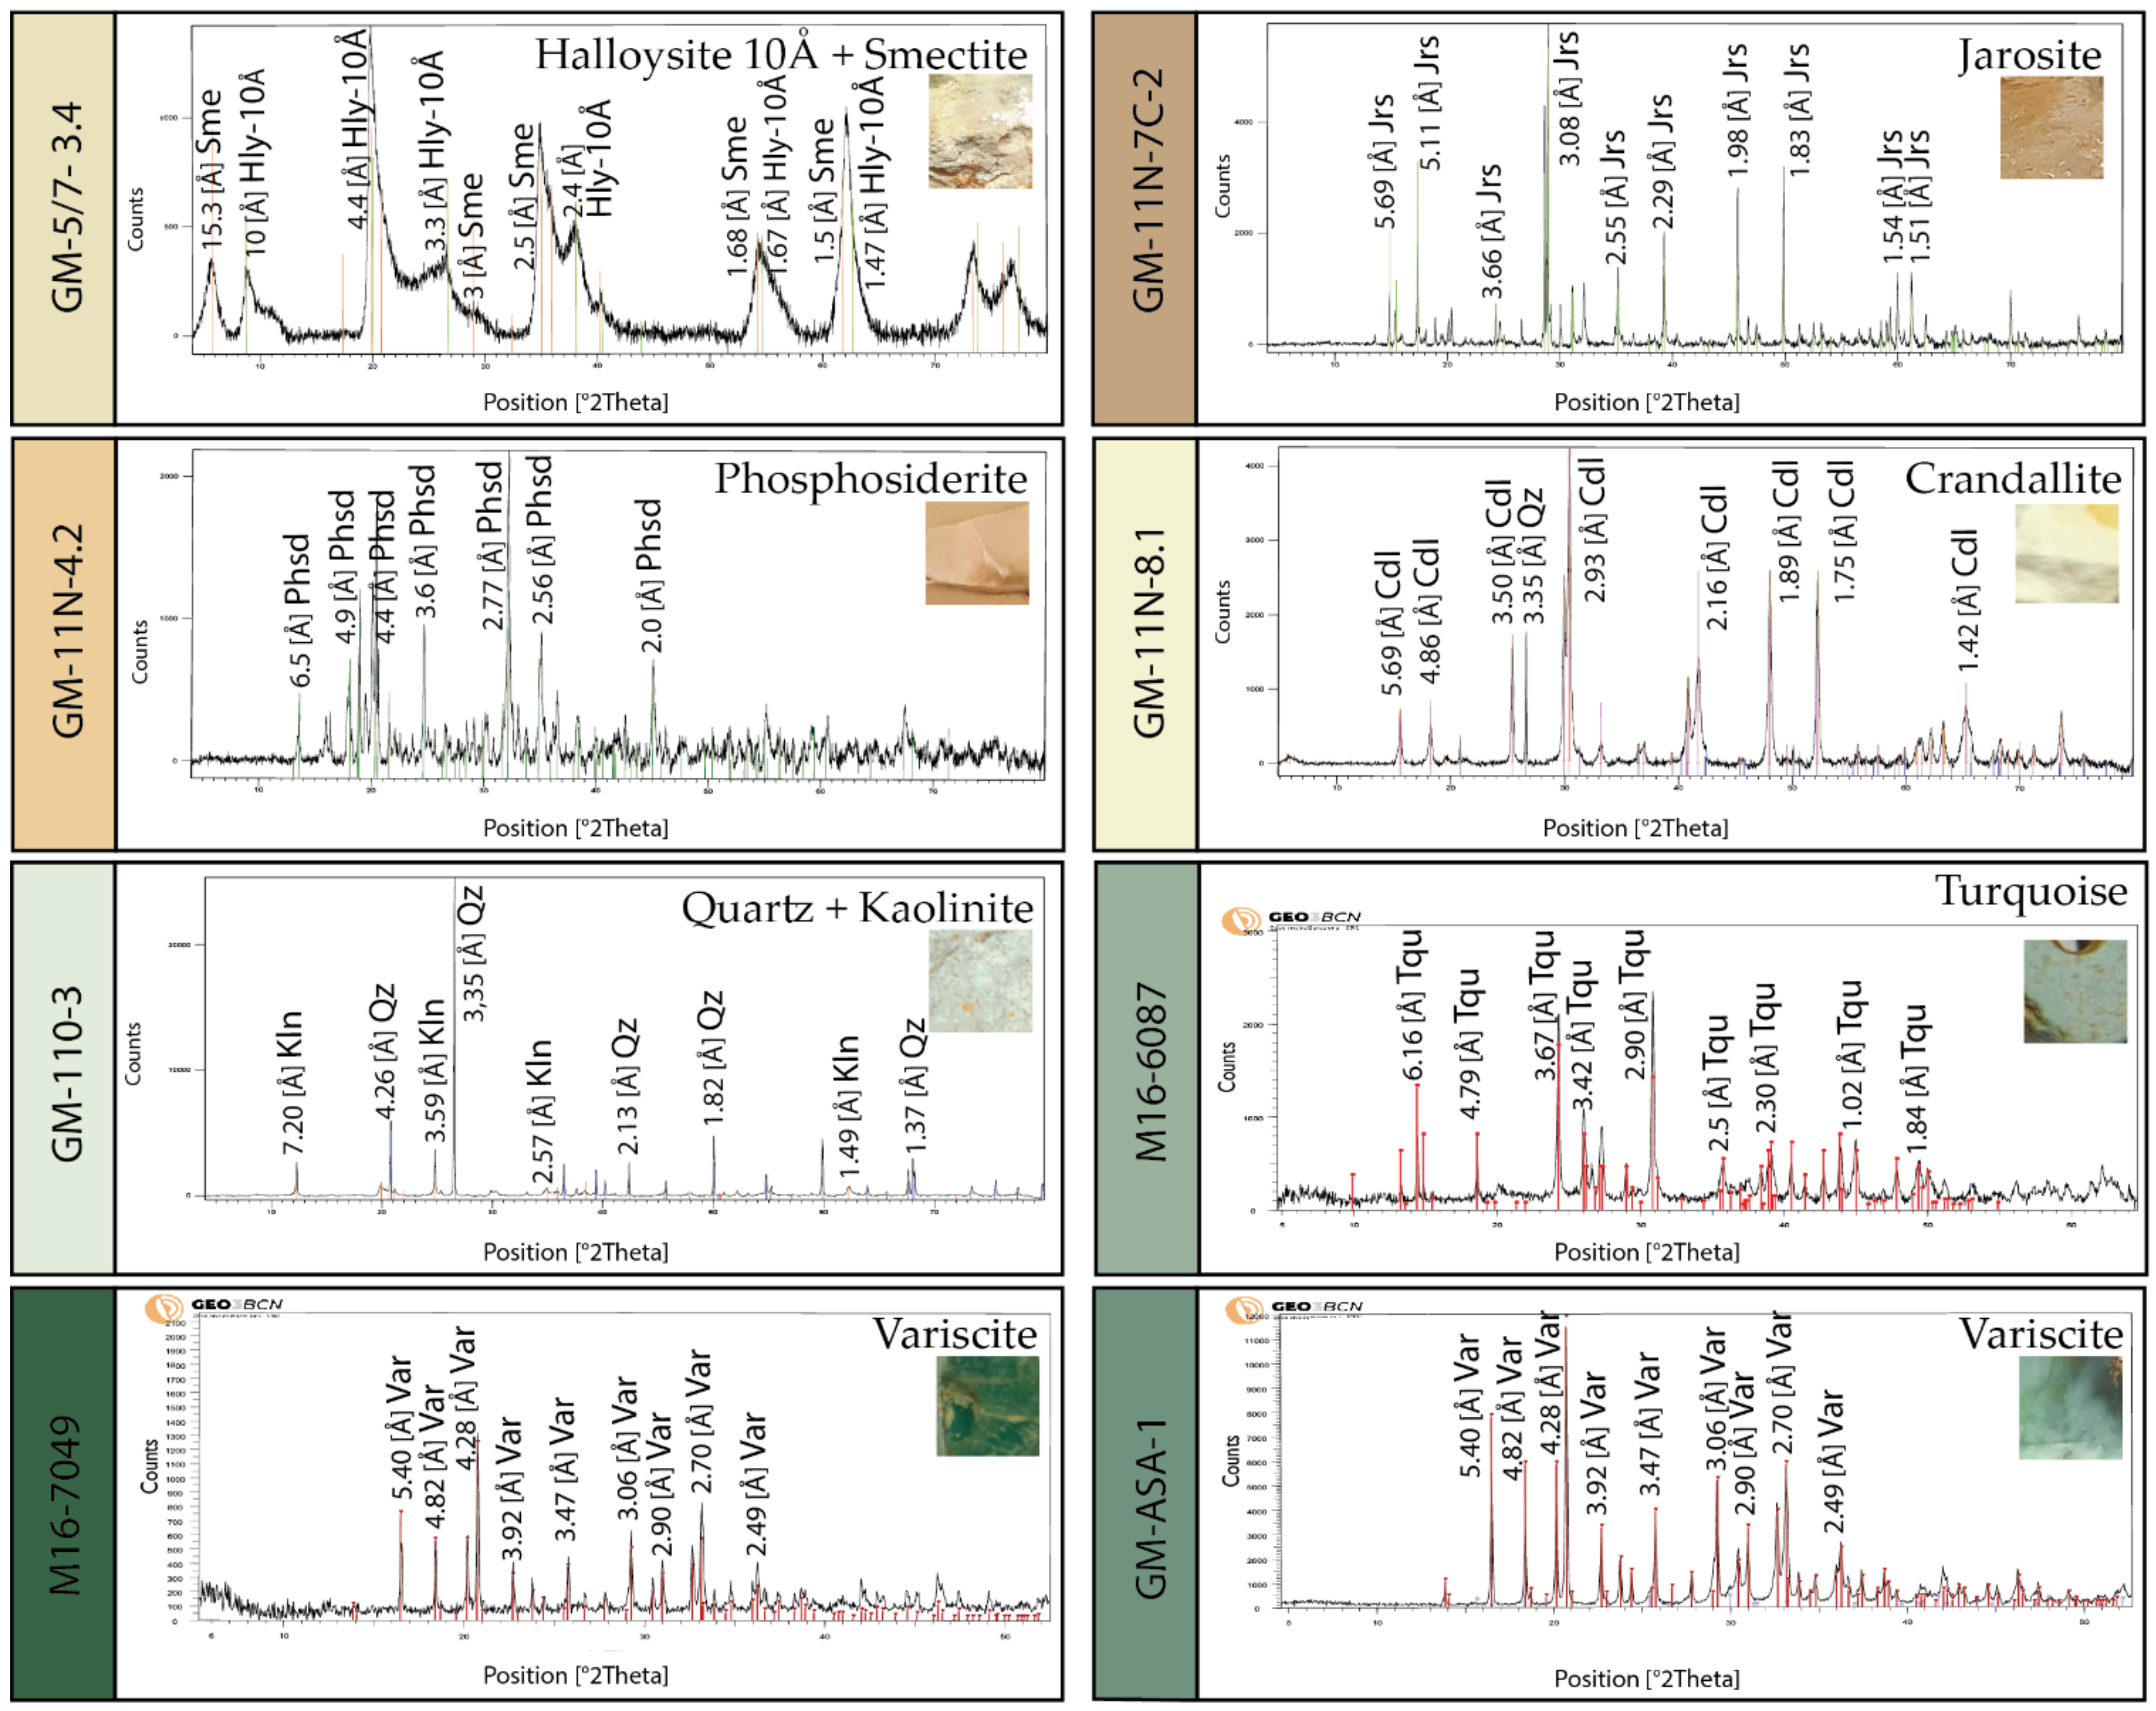
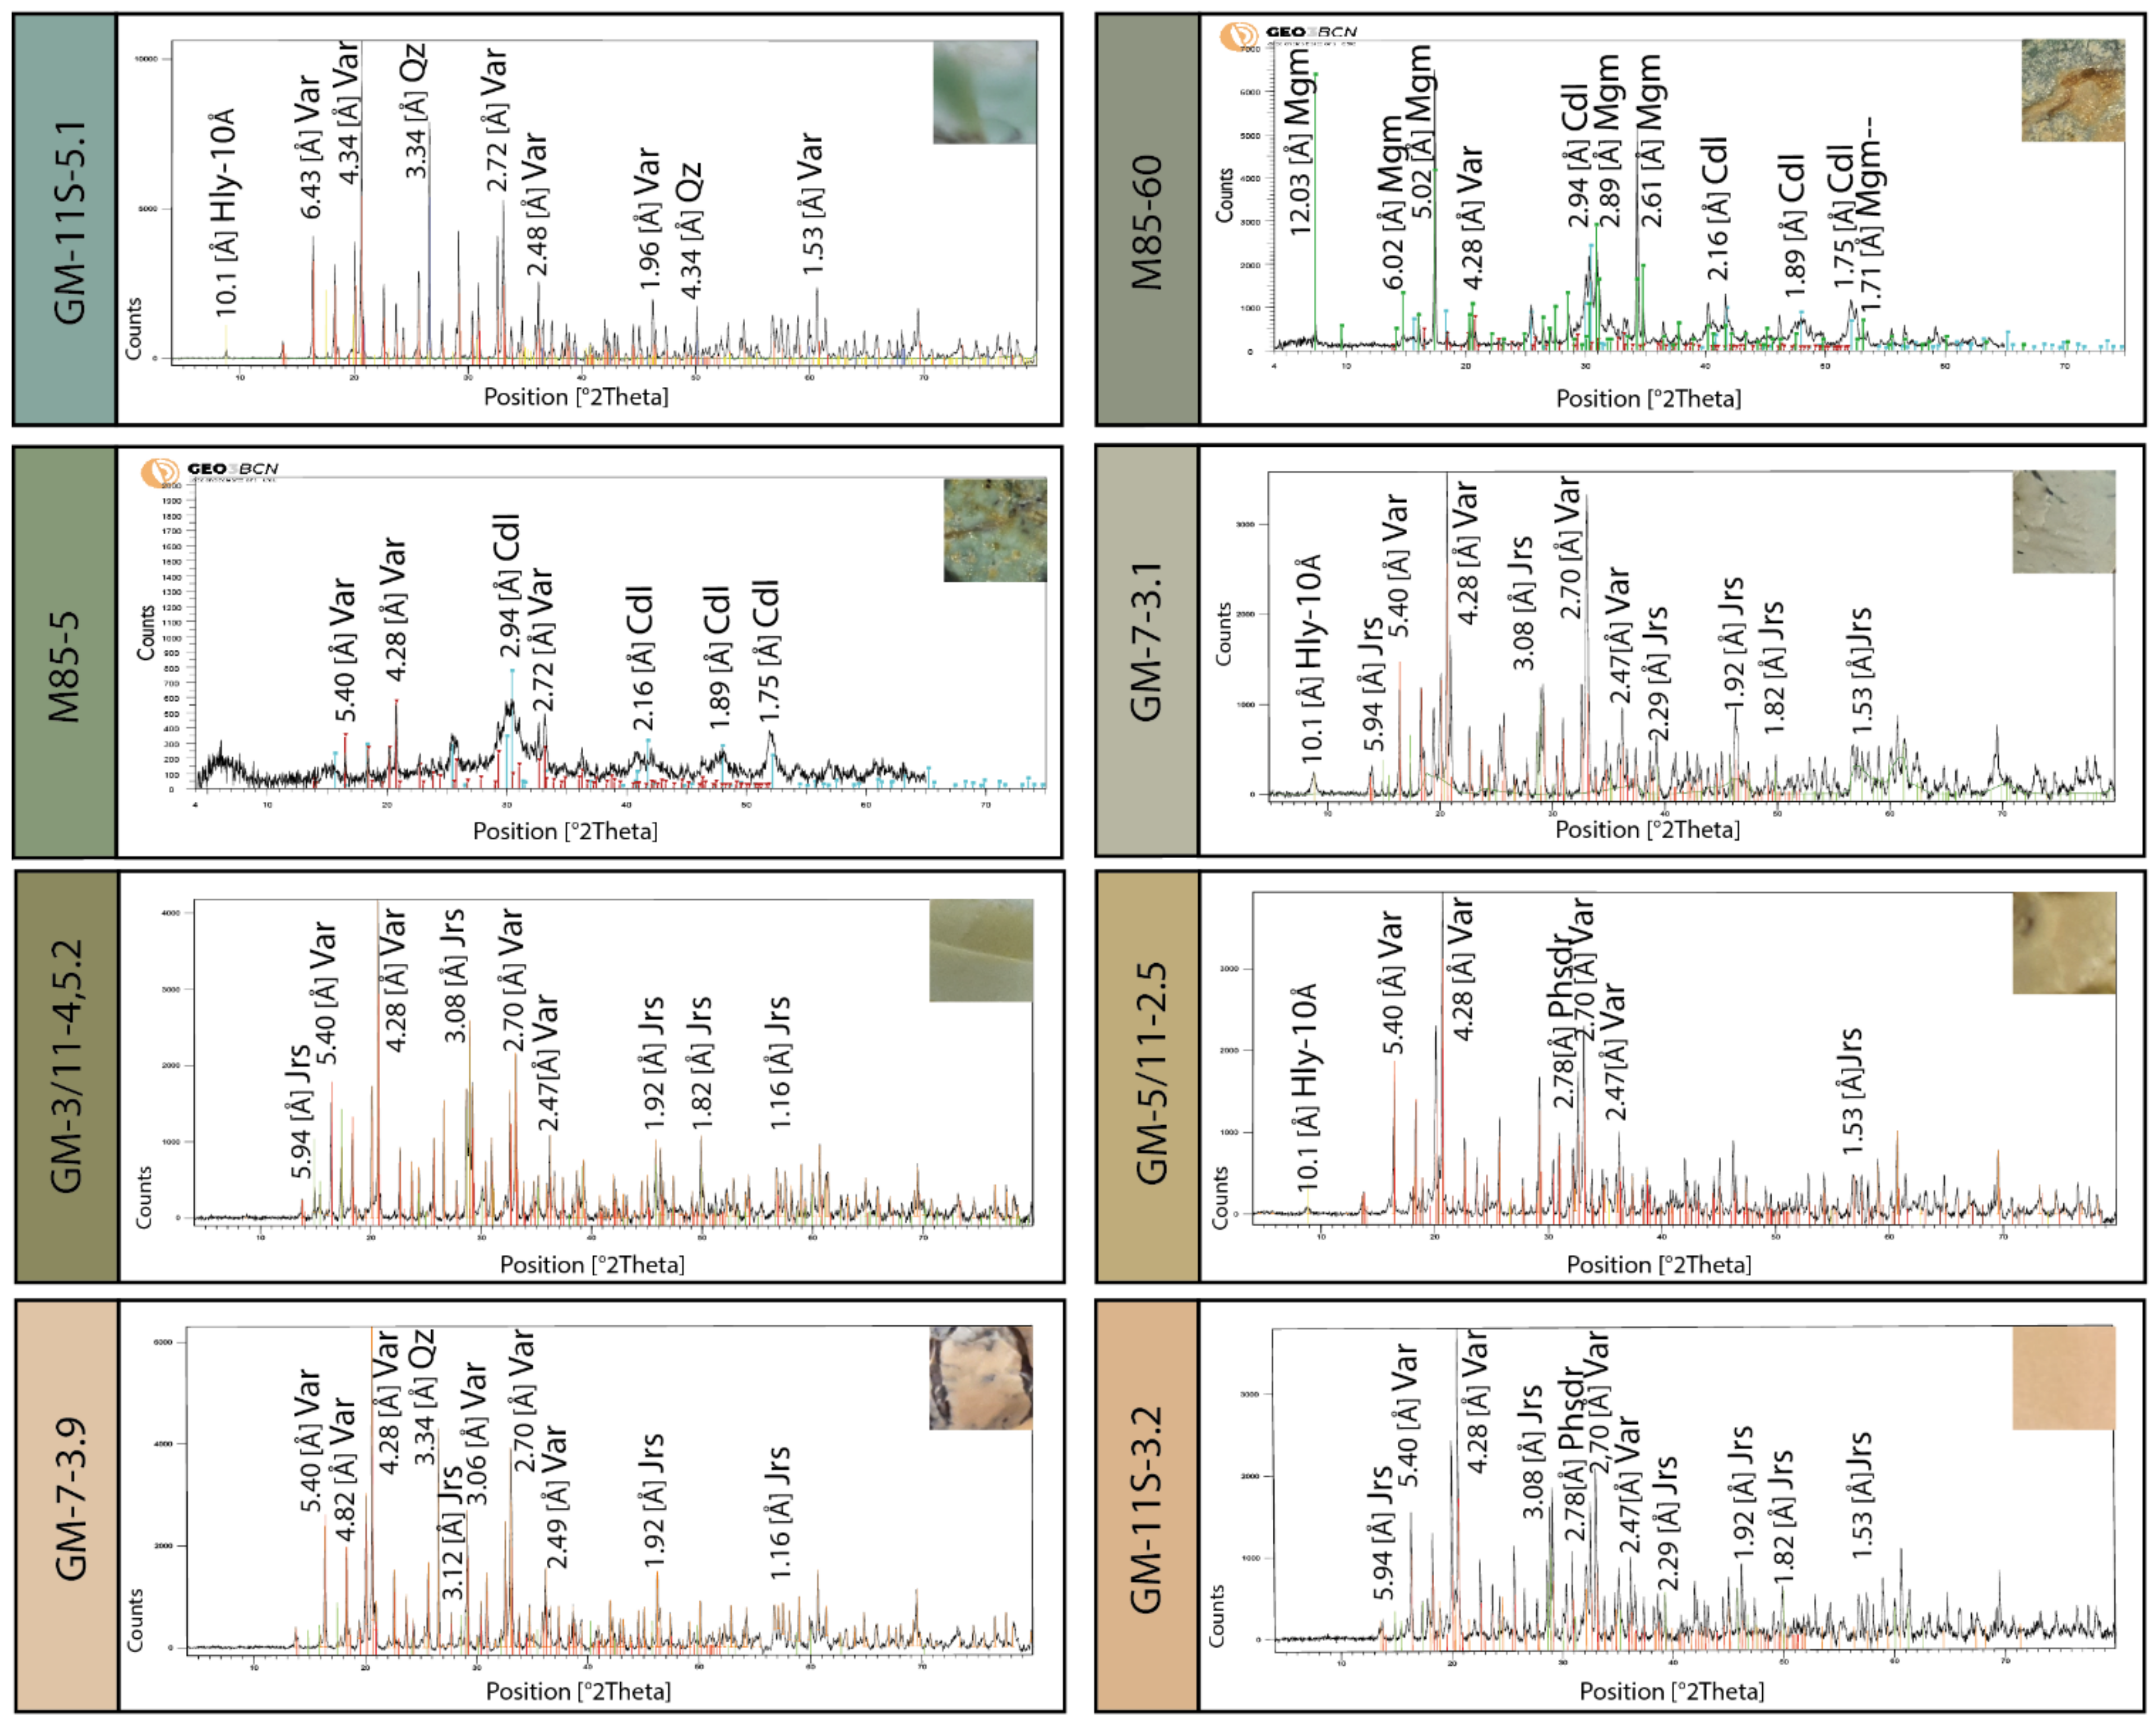
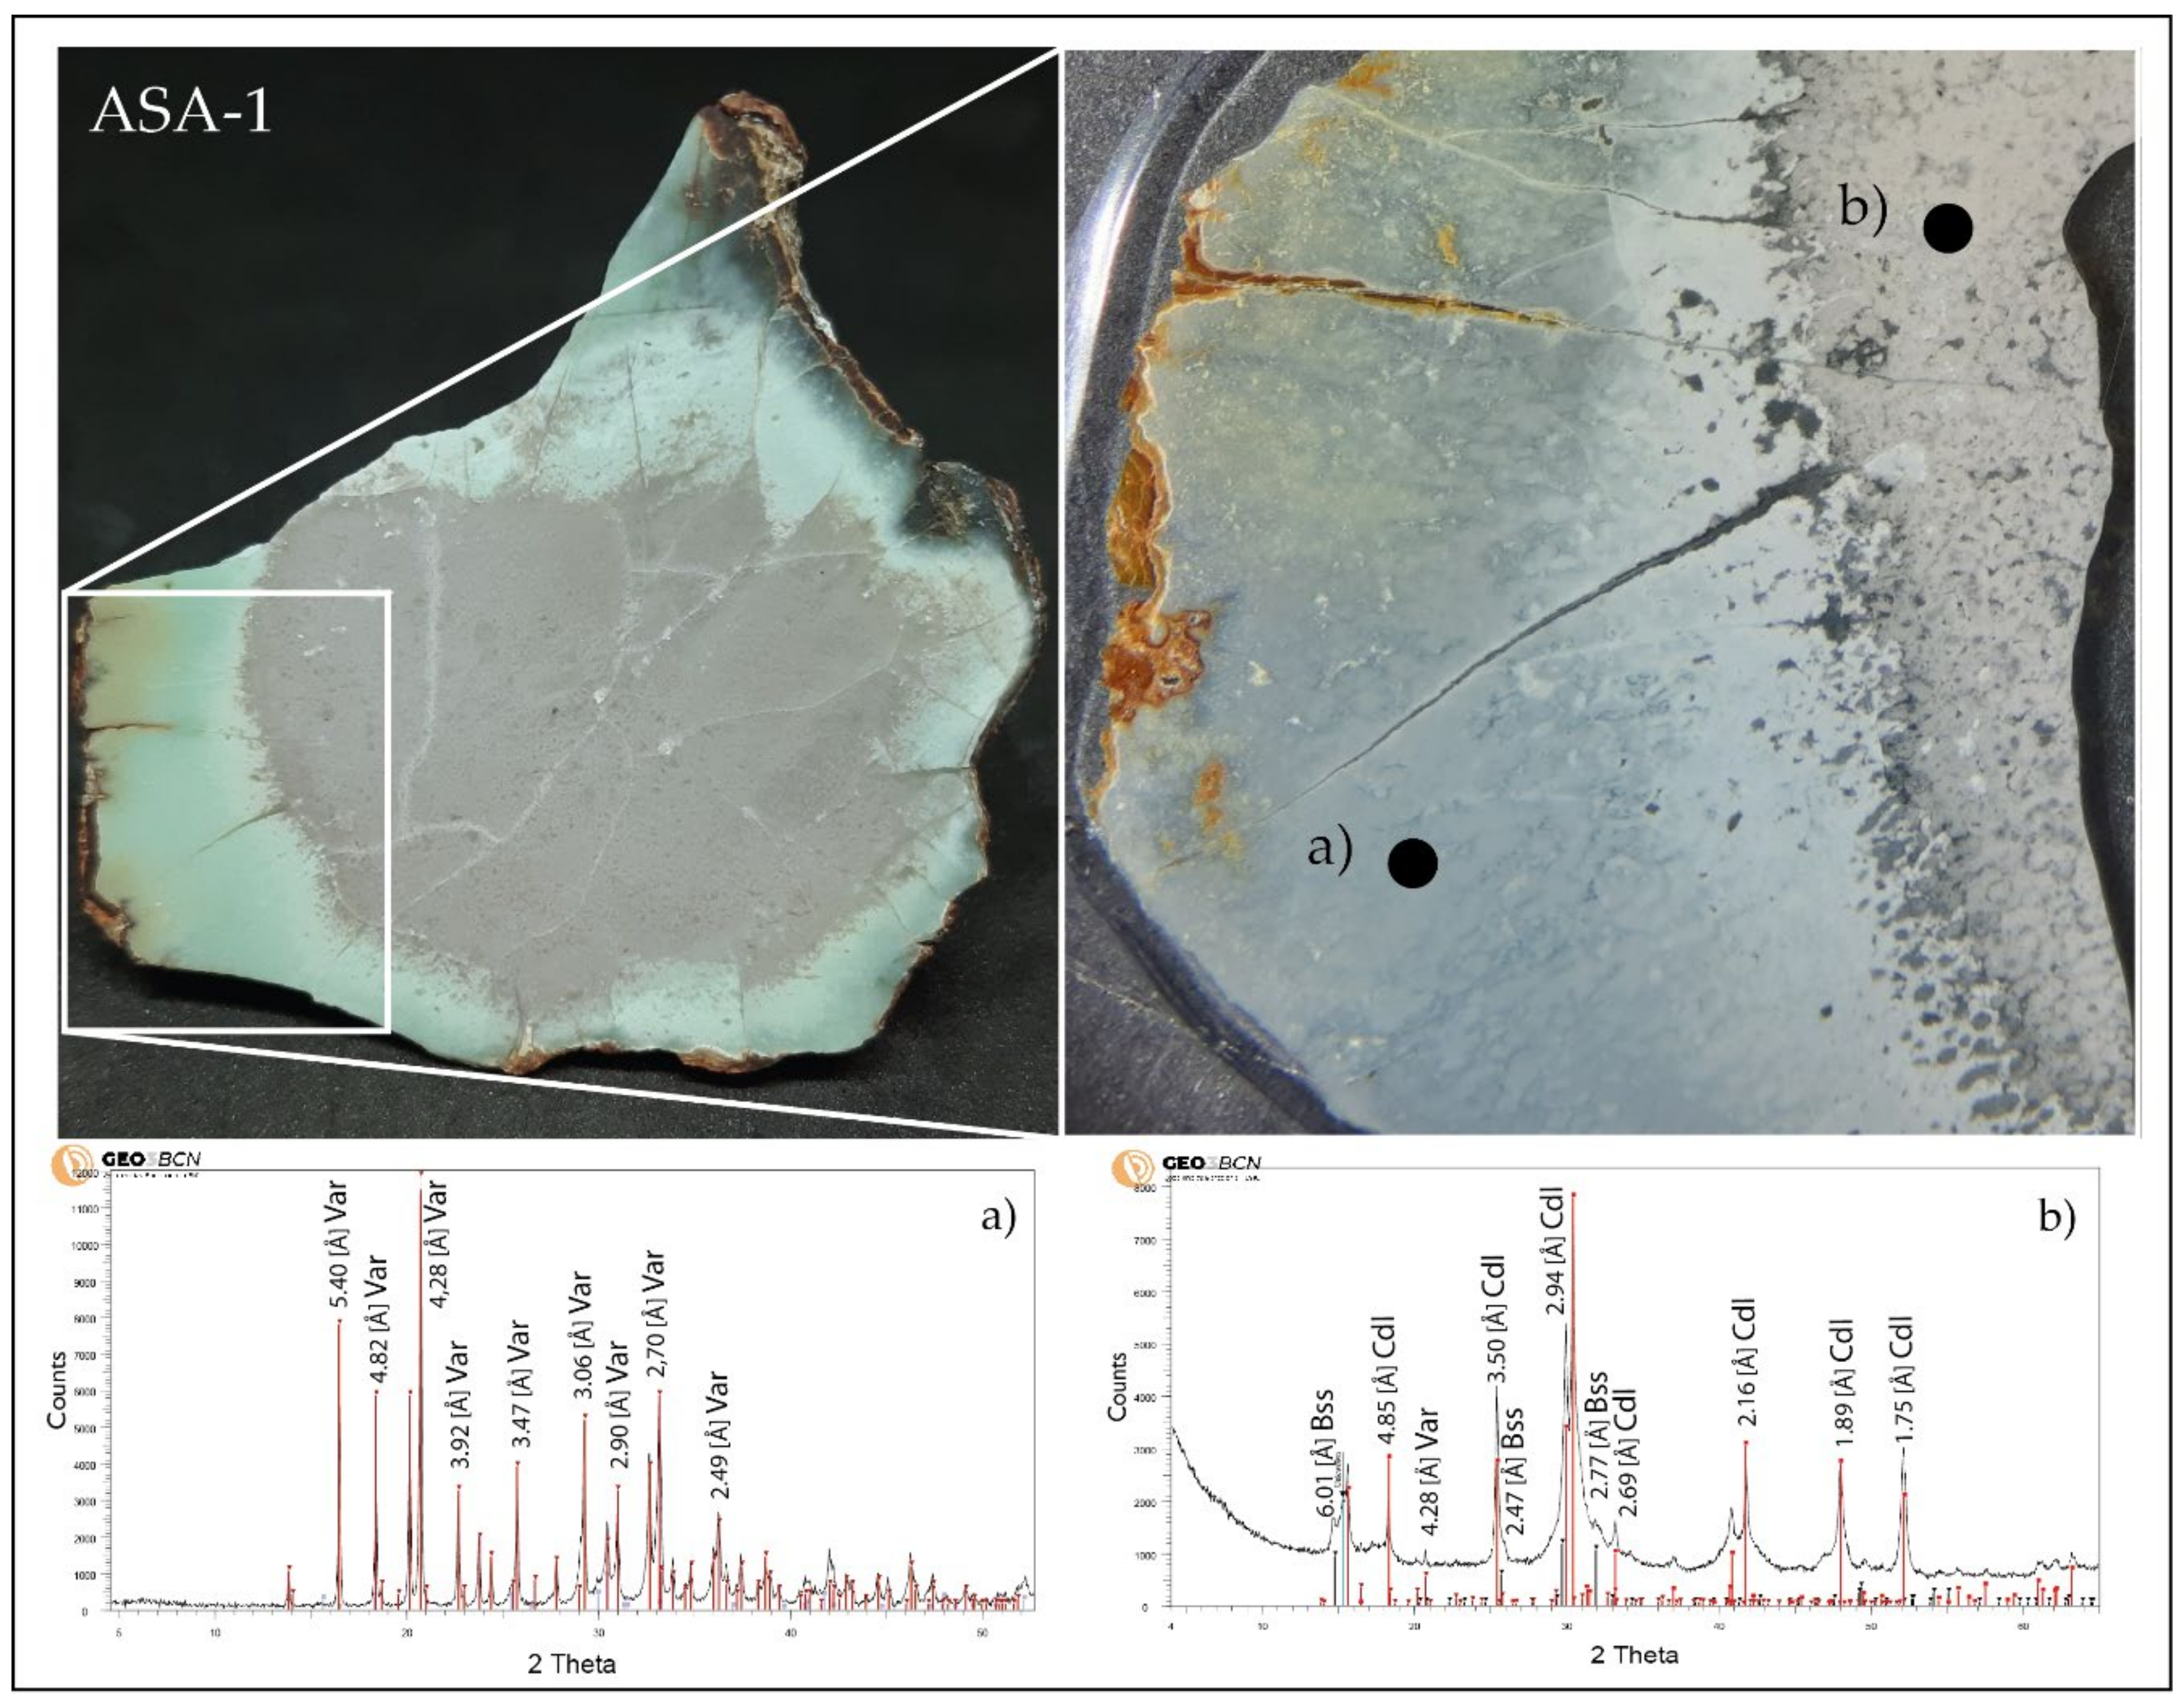
5.2. X-ray Diffraction (XRD)
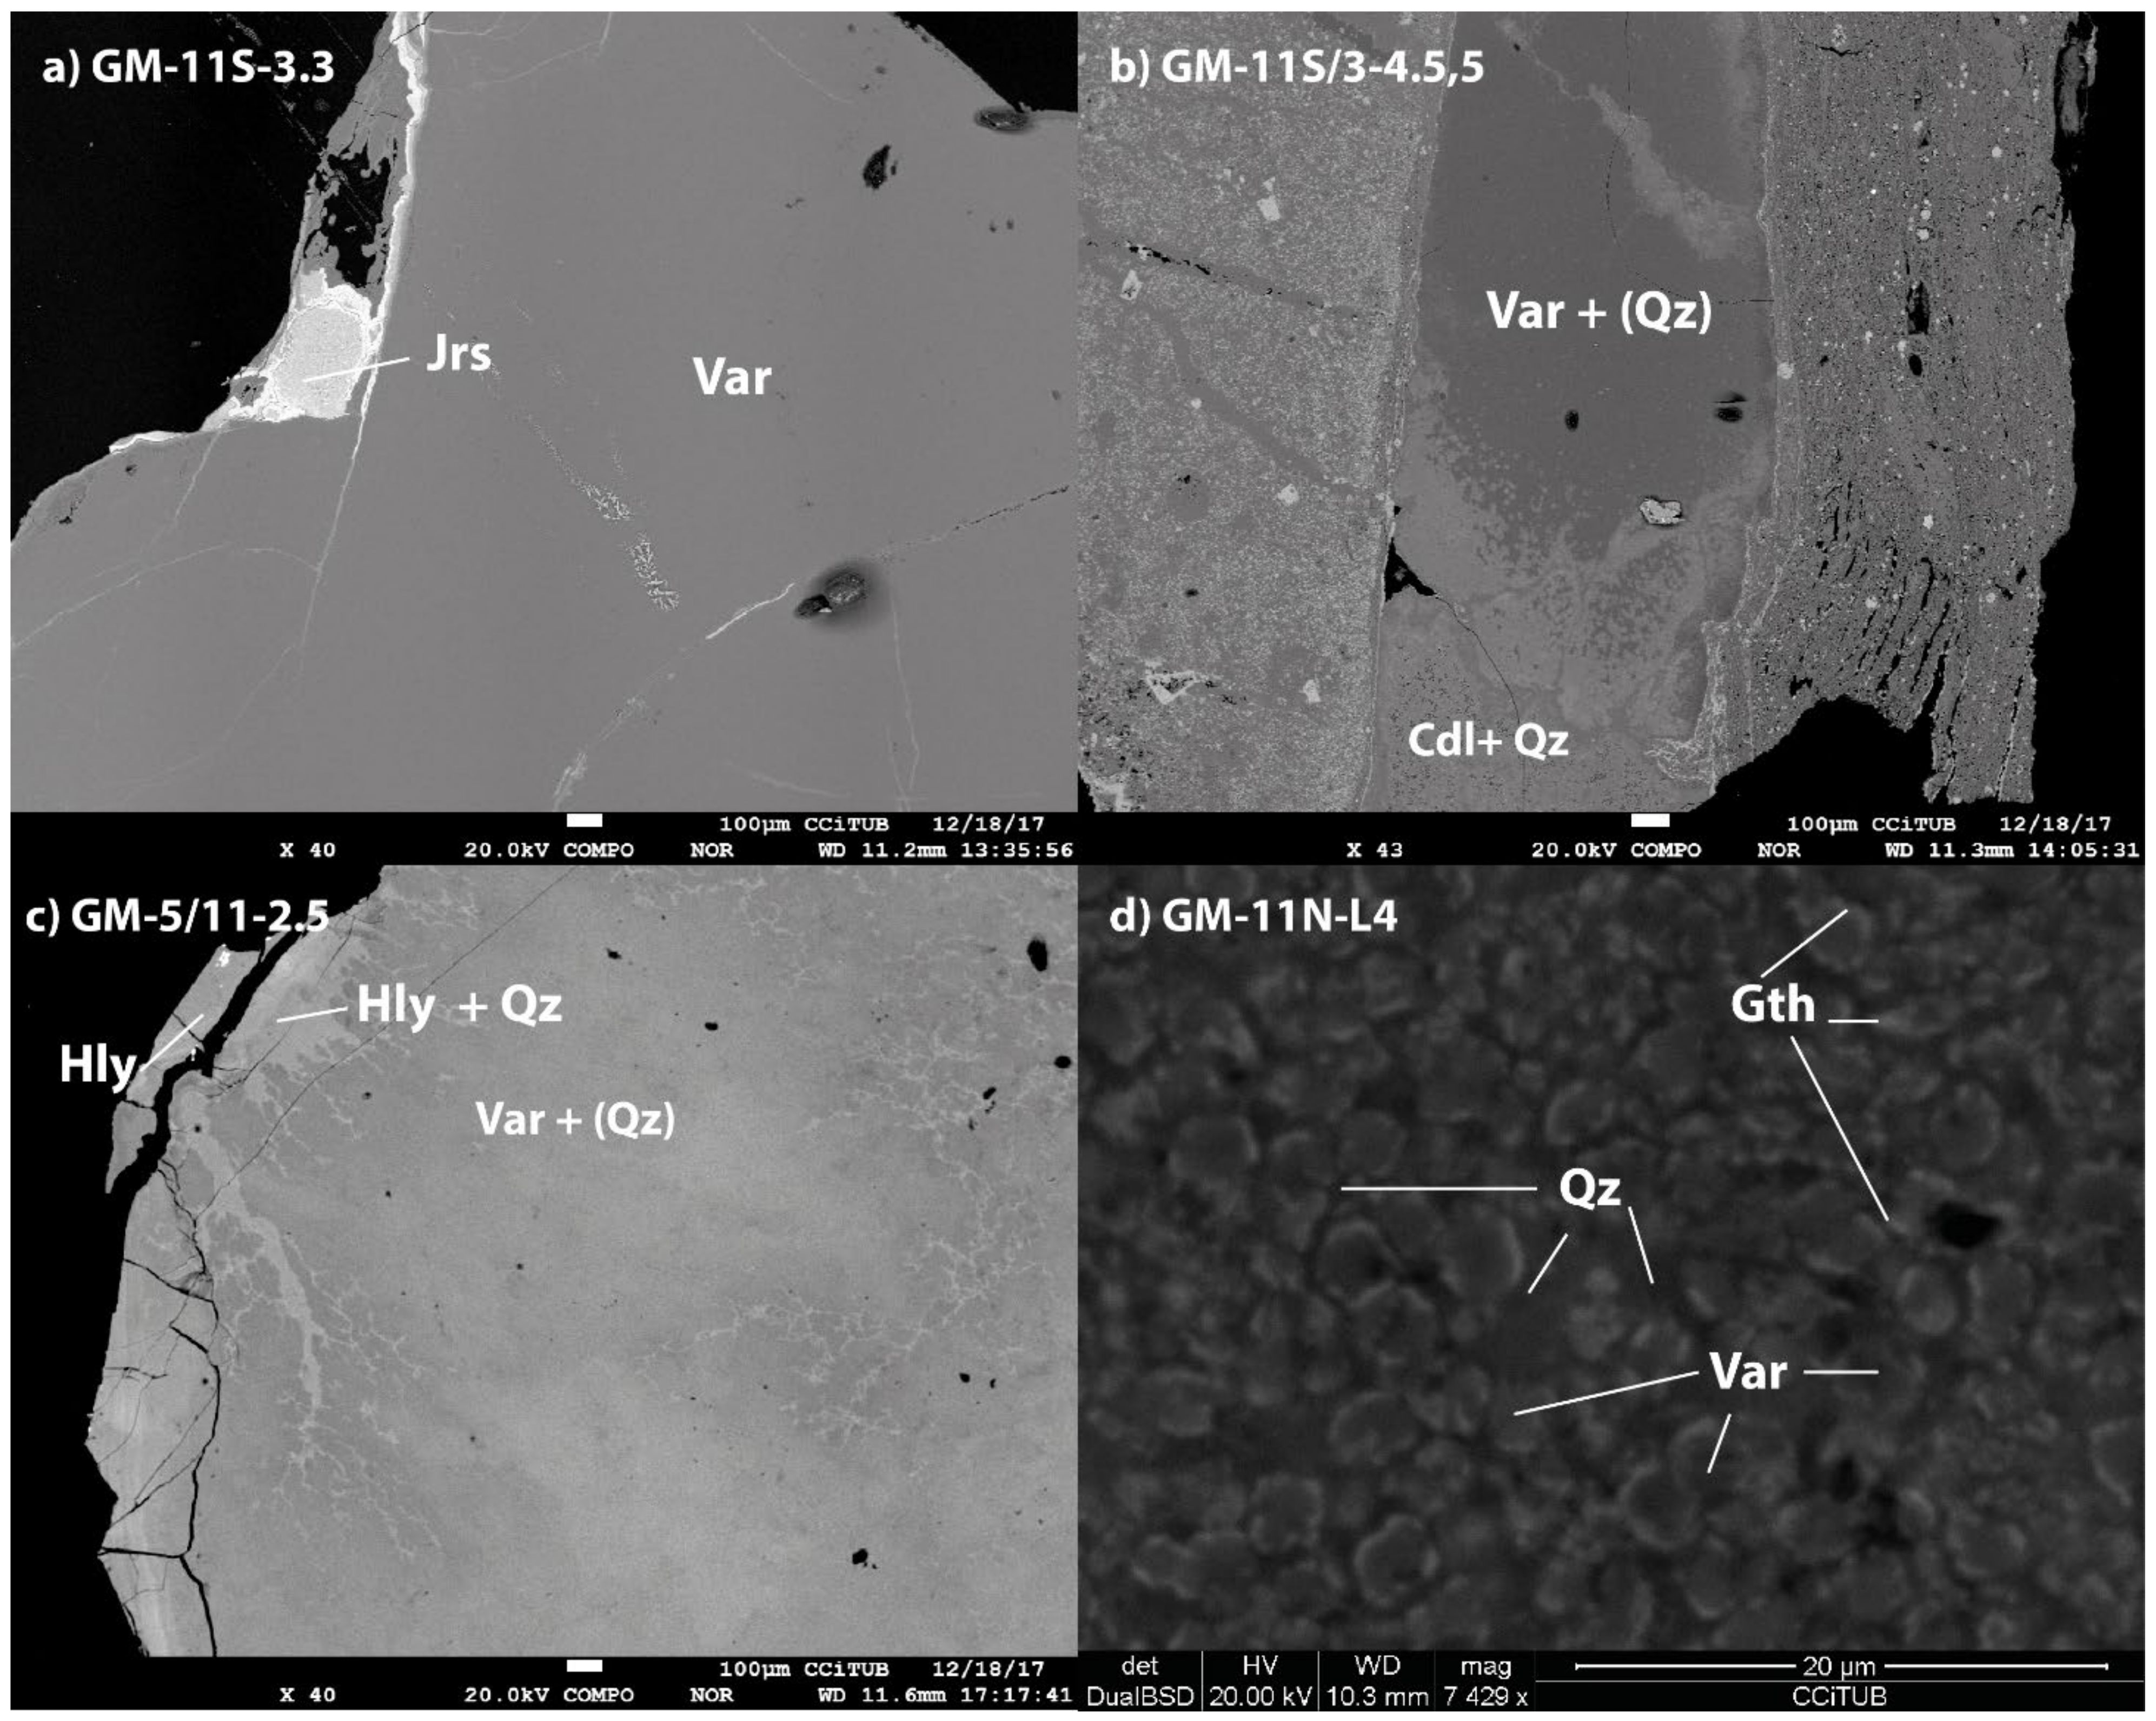
5.3. Scanning Electron Microscopy (SEM)
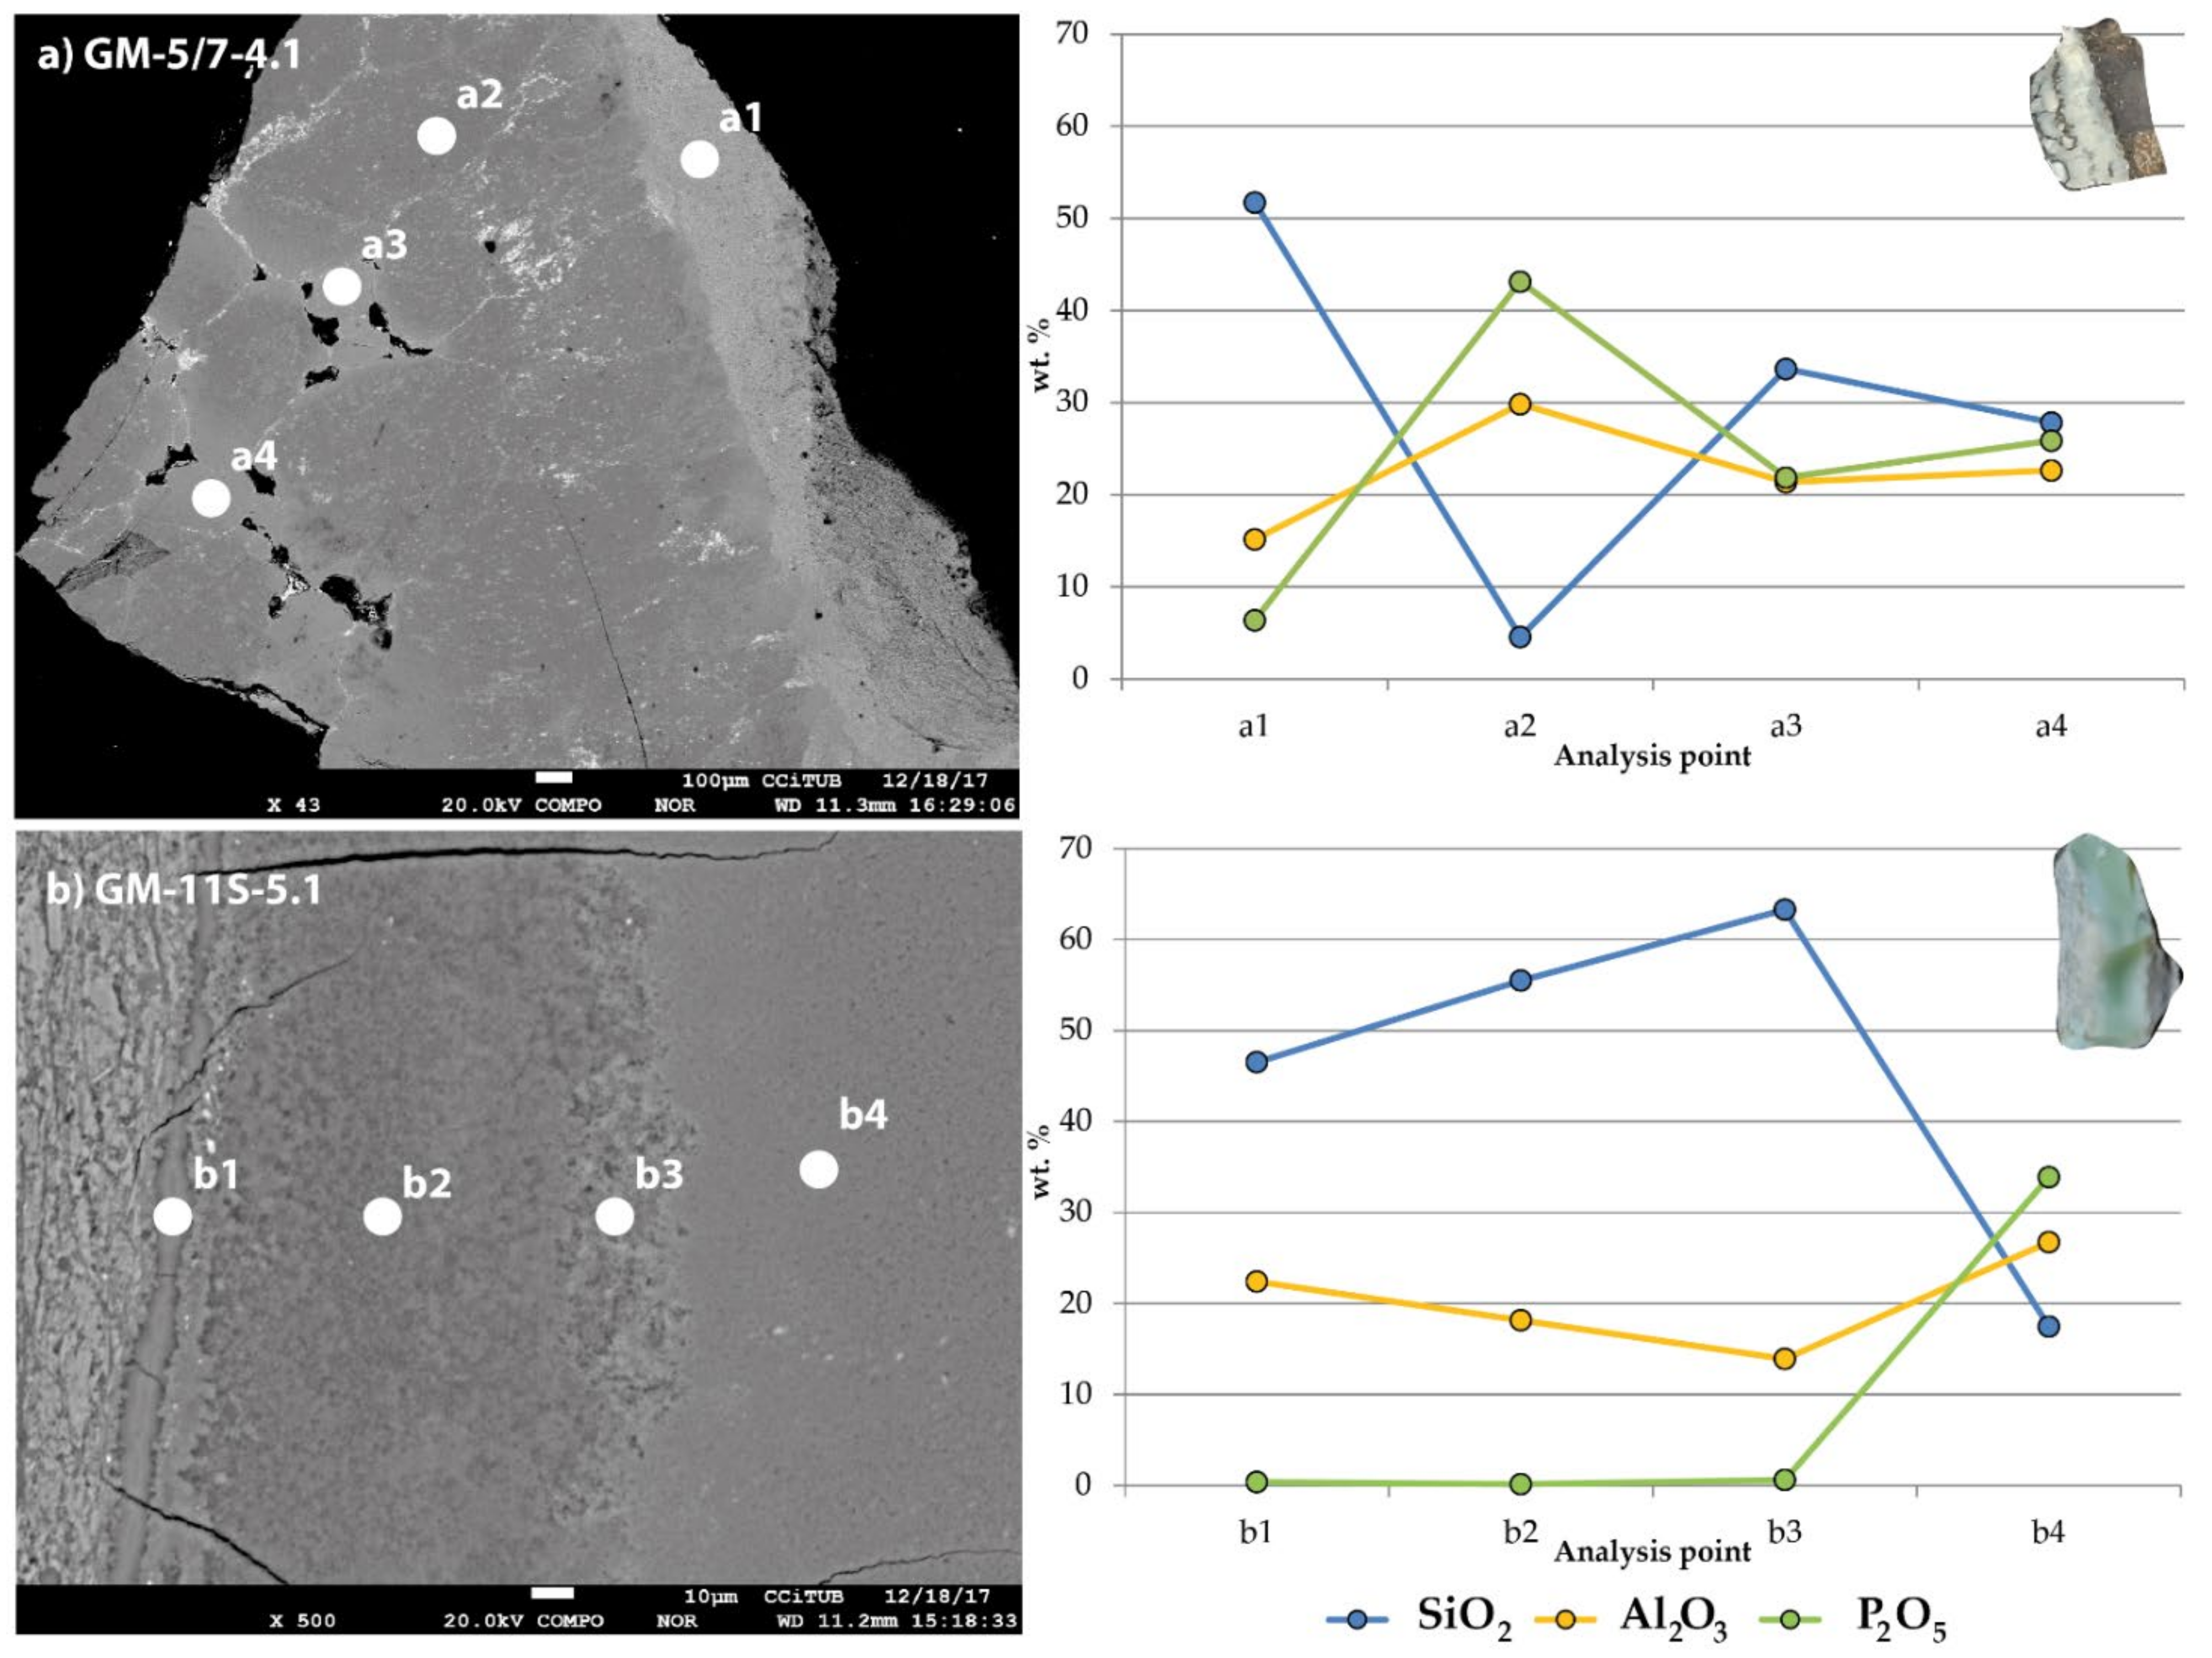
5.4. Electron Probe Microanalysis (EPMA)
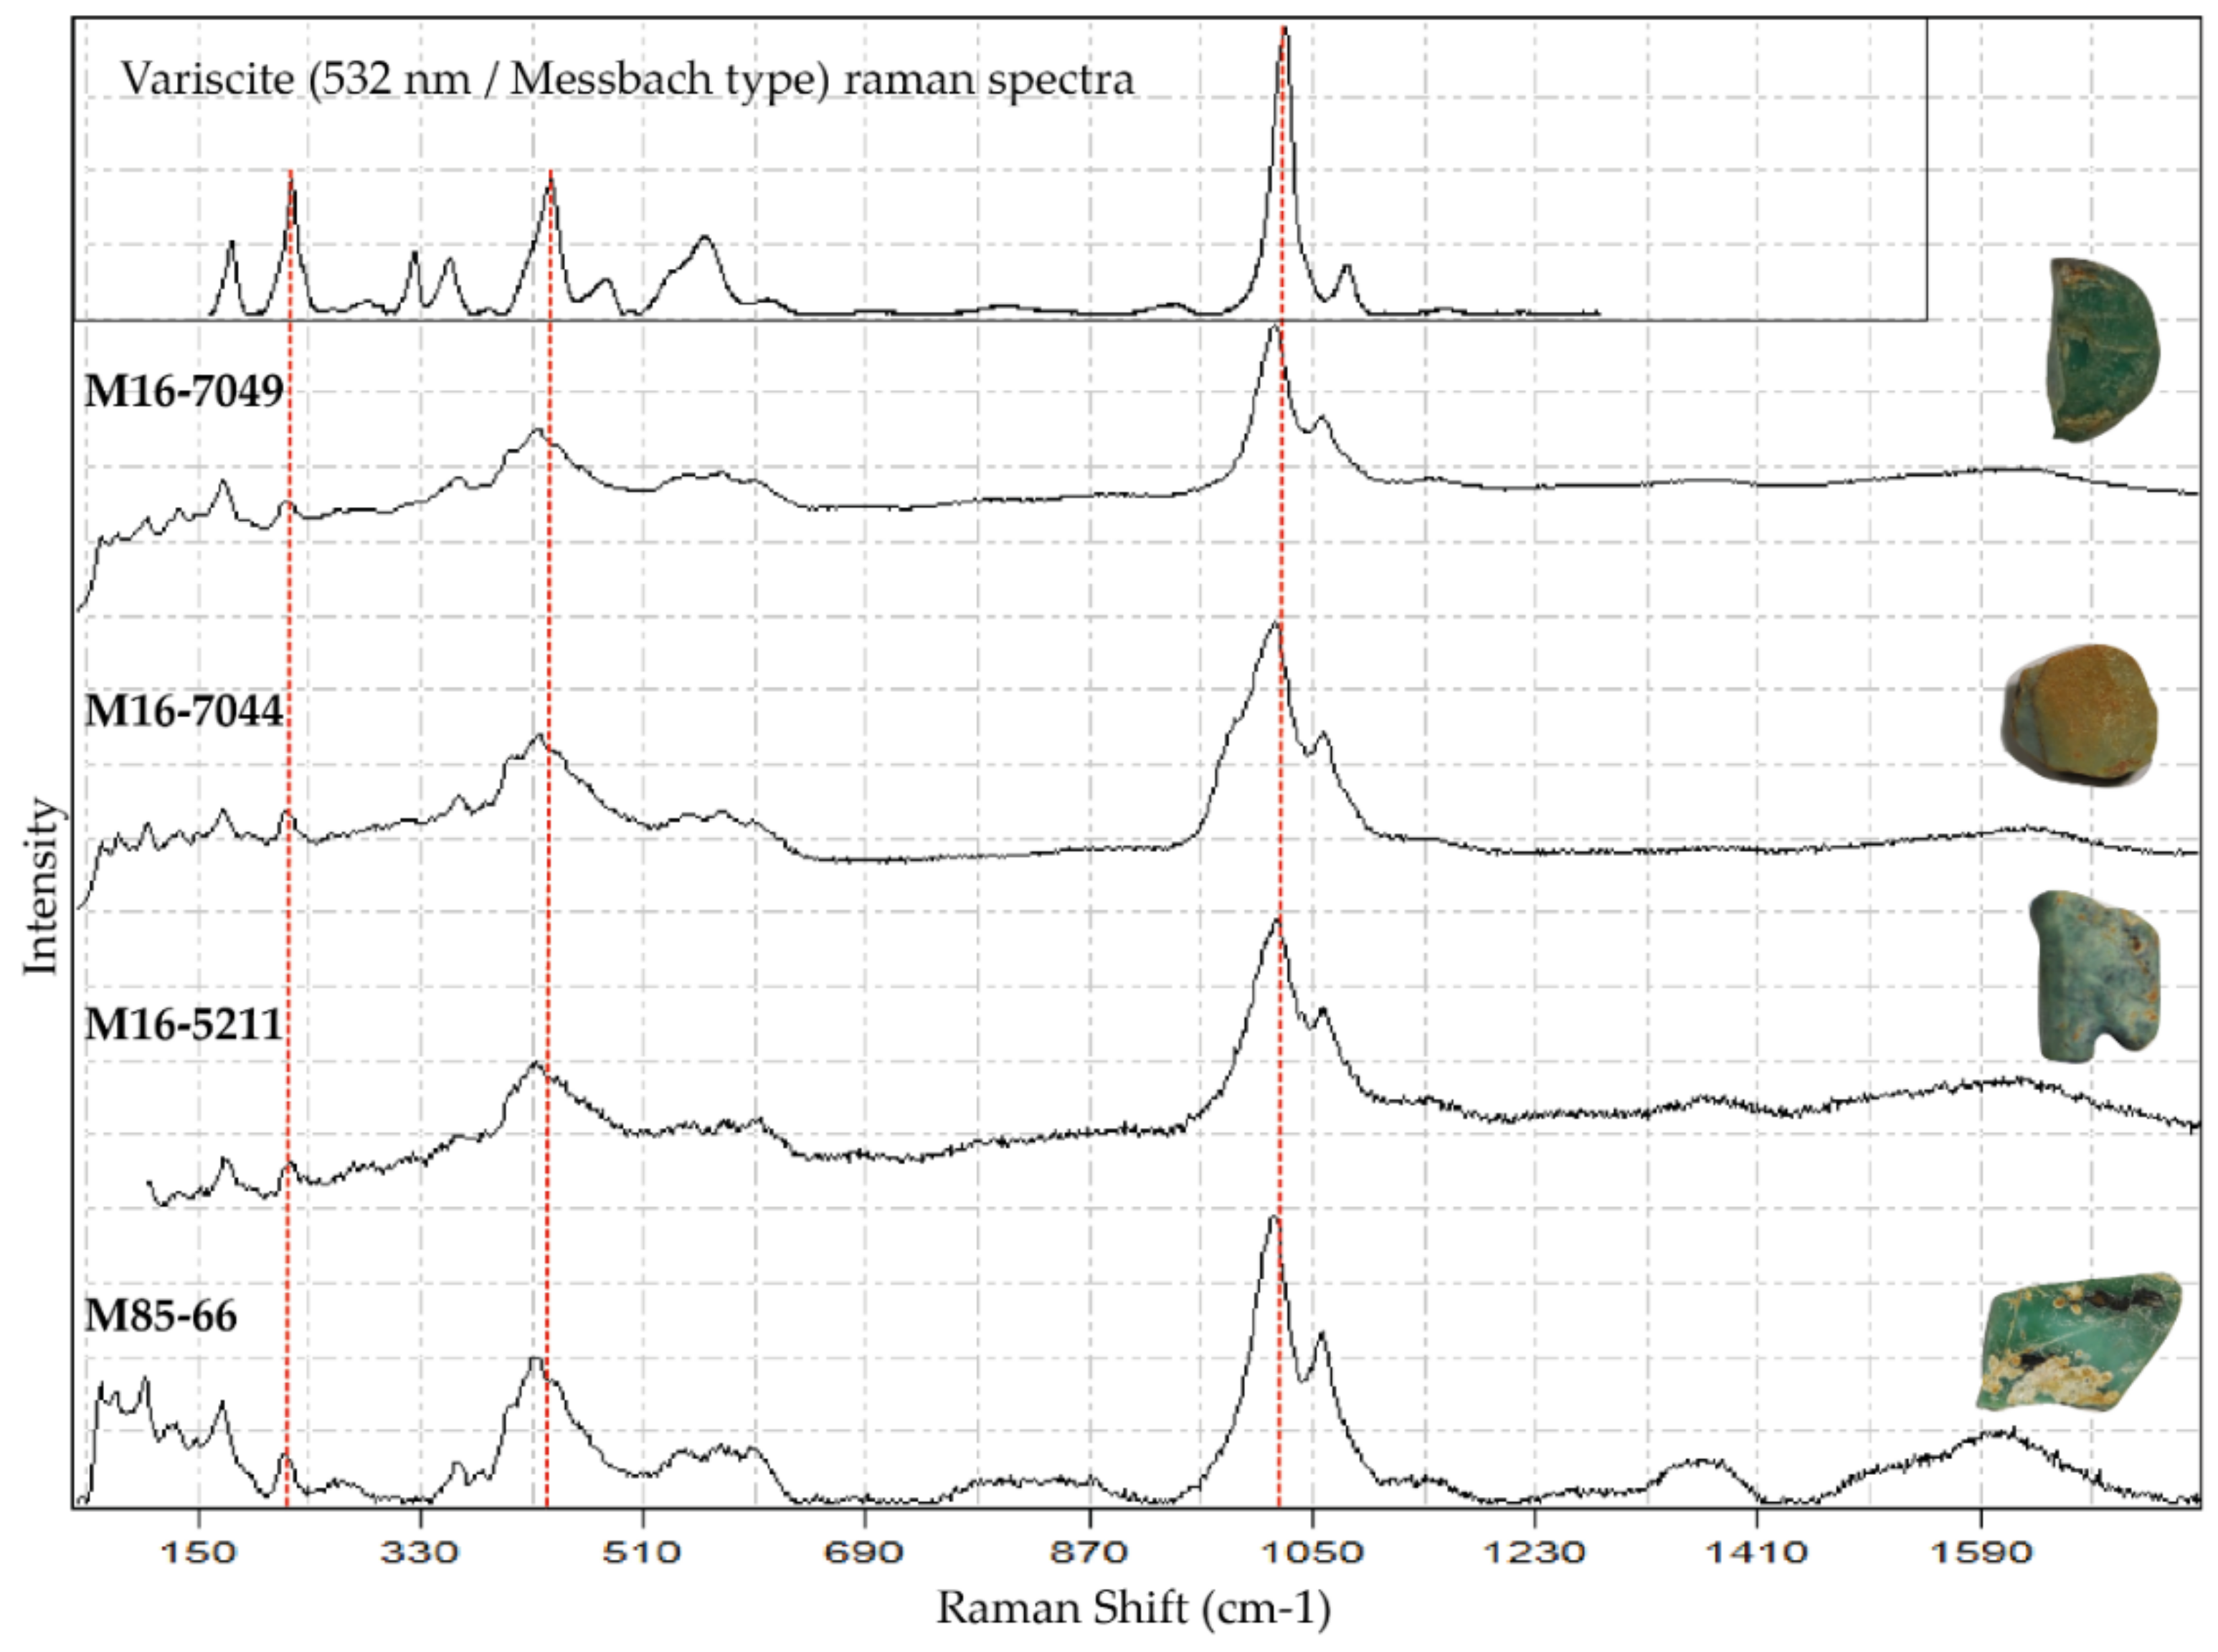
5.5. Raman Spectroscopy

| (a) Representative Composition of Variscite (Including Cr and V Results). | ||||||||||||||
| Mineral | Variscite | |||||||||||||
| Analysis Number | 3-n | 5/11-2A2 | 11S-3.4 | 11S-3.3 | 7-3.1 | 7-3.3 | 7-3.7 | 7-3.8 | 7-4.5 | 11/3-4.5 | 5/7-5.1 | 11N-5.1 | 11N-6.2 | 11N-7.2 |
| wt.% | ||||||||||||||
| SiO2 | 1.75 | 0.15 | 0.62 | 0.19 | 2.87 | 4.08 | 3.60 | 2.10 | 1.69 | 2.29 | 0.13 | 2.45 | 2.41 | 4.95 |
| Al2O3 | 29.6 | 28.9 | 28.4 | 29.0 | 29.5 | 28.6 | 29.2 | 27.0 | 27.3 | 28.5 | 29.1 | 29.9 | 29.6 | 28.6 |
| FeO | 2.79 | 3.05 | 2.82 | 2.51 | 1.91 | 2.59 | 1.28 | 1.74 | 4.12 | 1.82 | 2.63 | 1.47 | 3.71 | 3.23 |
| Fe2O3 calculated | 3.10 | 3.39 | 3.13 | 2.79 | 2.12 | 2.88 | 1.42 | 1.93 | 4.58 | 0.46 | 2.92 | 1.63 | 4.12 | 3.59 |
| MgO | bdl | bdl | bdl | bdl | bdl | 0.07 | bdl | bdl | 0.05 | 0.11 | bdl | 0.12 | bdl | 0.04 |
| CaO | 0.28 | 0.21 | 0.36 | 0.06 | 0.67 | 1.29 | 1.04 | 0.68 | 0.35 | 0.39 | 0.16 | 2.31 | 0.50 | 3.62 |
| K2O | 0.04 | 0.02 | 0.04 | 0.03 | 0.02 | 0.04 | 0.03 | 0.02 | 0.07 | 0.27 | 0.01 | 0.07 | 0.03 | 0.06 |
| P2O5 | 45.0 | 44.7 | 44.6 | 45.0 | 43.7 | 41.2 | 43.0 | 41.5 | 44.1 | 44.2 | 46.1 | 41.0 | 44.2 | 39.2 |
| SO3 | 0.03 | 0.02 | 0.14 | 0.08 | 0.06 | 0.11 | 0.06 | 1.80 | 0.08 | 0.13 | 0.08 | 0.16 | 0.07 | 0.12 |
| V2O3 | 0.23 | bdl | 0.08 | 0.02 | 0.07 | 0.03 | 0.07 | 0.04 | 0.11 | 0.15 | 0.05 | 0.06 | 0.05 | 0.05 |
| Cr2O3 | 0.05 | 0.08 | 0.06 | 0.07 | 0.05 | 0.07 | 0.04 | 0.07 | bdl | 0.04 | 0.14 | 0.17 | 0.07 | 0.07 |
| Total | 79.5 | 77.1 | 77.1 | 76.8 | 78.7 | 78.0 | 78.1 | 73.1 | 77.6 | 77.7 | 78.1 | 77.3 | 80.5 | 79.7 |
| apfu | ||||||||||||||
| Si | 0.045 | 0.004 | 0.017 | 0.005 | 0.075 | 0.108 | 0.094 | 0.057 | 0.045 | 0.060 | 0.004 | 0.066 | 0.062 | 0.131 |
| Al | 0.899 | 0.909 | 0.889 | 0.910 | 0.905 | 0.893 | 0.902 | 0.867 | 0.853 | 0.885 | 0.897 | 0.943 | 0.893 | 0.887 |
| Fe3+ | 0.060 | 0.068 | 0.063 | 0.056 | 0.042 | 0.057 | 0.028 | 0.040 | 0.091 | 0.040 | 0.058 | 0.033 | 0.079 | 0.071 |
| Mg | 0.002 | 0.002 | 0.002 | 0.002 | 0.002 | 0.002 | 0.002 | 0.002 | 0.002 | 0.002 | 0.002 | 0.005 | 0.002 | 0.001 |
| Ca | 0.008 | 0.006 | 0.010 | 0.002 | 0.019 | 0.037 | 0.029 | 0.020 | 0.010 | 0.011 | 0.004 | 0.066 | 0.014 | 0.102 |
| K | 0.001 | 0.001 | 0.001 | 0.001 | 0.001 | 0.001 | 0.001 | 0.001 | 0.002 | 0.009 | 0.000 | 0.003 | 0.001 | 0.002 |
| P | 0.983 | 1.008 | 1.005 | 1.014 | 0.963 | 0.924 | 0.953 | 0.957 | 0.990 | 0.985 | 1.020 | 0.929 | 0.960 | 0.876 |
| S | 0.001 | 0.000 | 0.003 | 0.002 | 0.001 | 0.002 | 0.001 | 0.037 | 0.002 | 0.003 | 0.002 | 0.003 | 0.001 | 0.002 |
| V | 0.005 | 0.000 | 0.002 | 0.001 | 0.001 | 0.001 | 0.001 | 0.001 | 0.002 | 0.003 | 0.001 | 0.001 | 0.001 | 0.001 |
| Cr | 0.001 | 0.002 | 0.001 | 0.001 | 0.001 | 0.002 | 0.001 | 0.001 | 0.000 | 0.001 | 0.003 | 0.004 | 0.001 | 0.001 |
| Total cations | 2.001 | 1.996 | 1.995 | 1.989 | 2.006 | 2.027 | 2.009 | 1.980 | 1.996 | 1.998 | 1.986 | 2.048 | 2.010 | 2.073 |
| Oxygens | 4 | 4 | 4 | 4 | 4 | 4 | 4 | 4 | 4 | 4 | 4 | 4 | 4 | 4 |
| (b) Representative Composition of Crandallite, Phosphosiderite, Halloysite, and Jarosite. | ||||||||||||||
| Mineral | Crandallite | Phosphosiderite | Halloysite | Jarosite | ||||||||||
| Analysis Number | 11S-3.4 | 11N-7.2 | 108-5 | 7-4.7 | 11N-4.2 | 11N-7C.2 | 11N-1.4 | 7-2.2 | 5/11-3.6 | 5/11-5.1 | 11S-3.1 | 11S-3.3 | 7-4.9 | |
| wt.% | ||||||||||||||
| SiO2 | 5.20 | 4.52 | 3.18 | 6.89 | 2.18 | 3.98 | 51.1 | 51.9 | 51.5 | 51.8 | 0.02 | 1.26 | 0.08 | |
| Al2O3 | 29.0 | 29.8 | 4.34 | 8.08 | 6.06 | 0.99 | 34.3 | 26.4 | 31.0 | 26.3 | 1.09 | 6.19 | 0.55 | |
| FeO | 2.36 | 1.74 | 30.5 | 24.5 | 33.7 | 32.1 | 4.68 | 9.16 | 5.98 | 10.1 | 40.4 | 36.5 | 40.6 | |
| Fe2O3 calculated | 2.62 | 1.93 | 33.9 | 27.2 | 37.5 | 35.7 | 5.20 | 10.2 | 6.65 | 11.3 | 44.9 | 40.6 | 45.1 | |
| MgO | 0.03 | 0.27 | 0.16 | 0.21 | 0.20 | 0.48 | 0.45 | 0.75 | 0.45 | 0.74 | bdl | 0.01 | bdl | |
| CaO | 12.3 | 11.3 | 3.73 | 2.50 | 5.24 | 10.9 | 1.22 | 1.36 | 1.27 | 1.57 | 0.08 | 0.21 | 0.22 | |
| K2O | bdl | 0.03 | 0.14 | 0.07 | 0.15 | 0.15 | 0.10 | 0.04 | 0.06 | 0.02 | 7.20 | 7.16 | 7.46 | |
| P2O5 | 24.7 | 32.0 | 34.6 | 33.9 | 40.1 | 29.0 | 0.20 | 0.22 | 0.06 | 0.10 | 1.08 | 1.09 | 1.03 | |
| SO3 | 0.20 | 0.09 | 0.04 | 0.12 | 0.11 | 0.13 | 0.07 | 0.08 | bdl | 0.05 | 31.0 | 27.4 | 28.9 | |
| Total | 73.6 | 79.7 | 76.8 | 76.2 | 87.7 | 77.6 | 92.5 | 90.1 | 90.4 | 91.2 | 50.5 | 52.6 | 50.2 | |
| apfu | ||||||||||||||
| Si | 0.418 | 0.329 | 0.098 | 0.206 | 0.059 | 0.128 | 2.087 | 2.199 | 2.153 | 2.185 | 0.002 | 0.123 | 0.008 | |
| Al | 2.745 | 2.557 | 0.157 | 0.285 | 0.192 | 0.038 | 1.653 | 1.319 | 1.526 | 1.309 | 0.125 | 0.711 | 0.066 | |
| Fe3+ | 0.159 | 0.106 | 0.783 | 0.612 | 0.759 | 0.865 | 0.160 | 0.324 | 0.209 | 0.357 | 0.000 | 0.000 | 0.000 | |
| Mg | 0.004 | 0.029 | 0.007 | 0.009 | 0.008 | 0.023 | 0.028 | 0.047 | 0.028 | 0.047 | 0.000 | 0.001 | 0.000 | |
| Ca | 1.060 | 0.880 | 0.123 | 0.080 | 0.151 | 0.377 | 0.053 | 0.062 | 0.057 | 0.071 | 0.008 | 0.022 | 0.025 | |
| K | 0.000 | 0.003 | 0.005 | 0.003 | 0.005 | 0.006 | 0.005 | 0.002 | 0.003 | 0.001 | 0.893 | 0.890 | 0.973 | |
| P | 1.683 | 1.969 | 0.901 | 0.857 | 0.913 | 0.791 | 0.007 | 0.008 | 0.002 | 0.004 | 0.089 | 0.090 | 0.089 | |
| S | 0.012 | 0.005 | 0.001 | 0.003 | 0.002 | 0.003 | 0.002 | 0.003 | 0.000 | 0.002 | 2.263 | 2.002 | 2.218 | |
| Total cations | 6.081 | 5.878 | 2.081 | 2.056 | 2.094 | 2.231 | 3.995 | 3.964 | 3.978 | 3.974 | 6.722 | 6.827 | 6.875 | |
| Oxygens | 10.50 | 10.50 | 4 | 4 | 4 | 4 | 7 | 7 | 7 | 7 | 11 | 11 | 11 | |
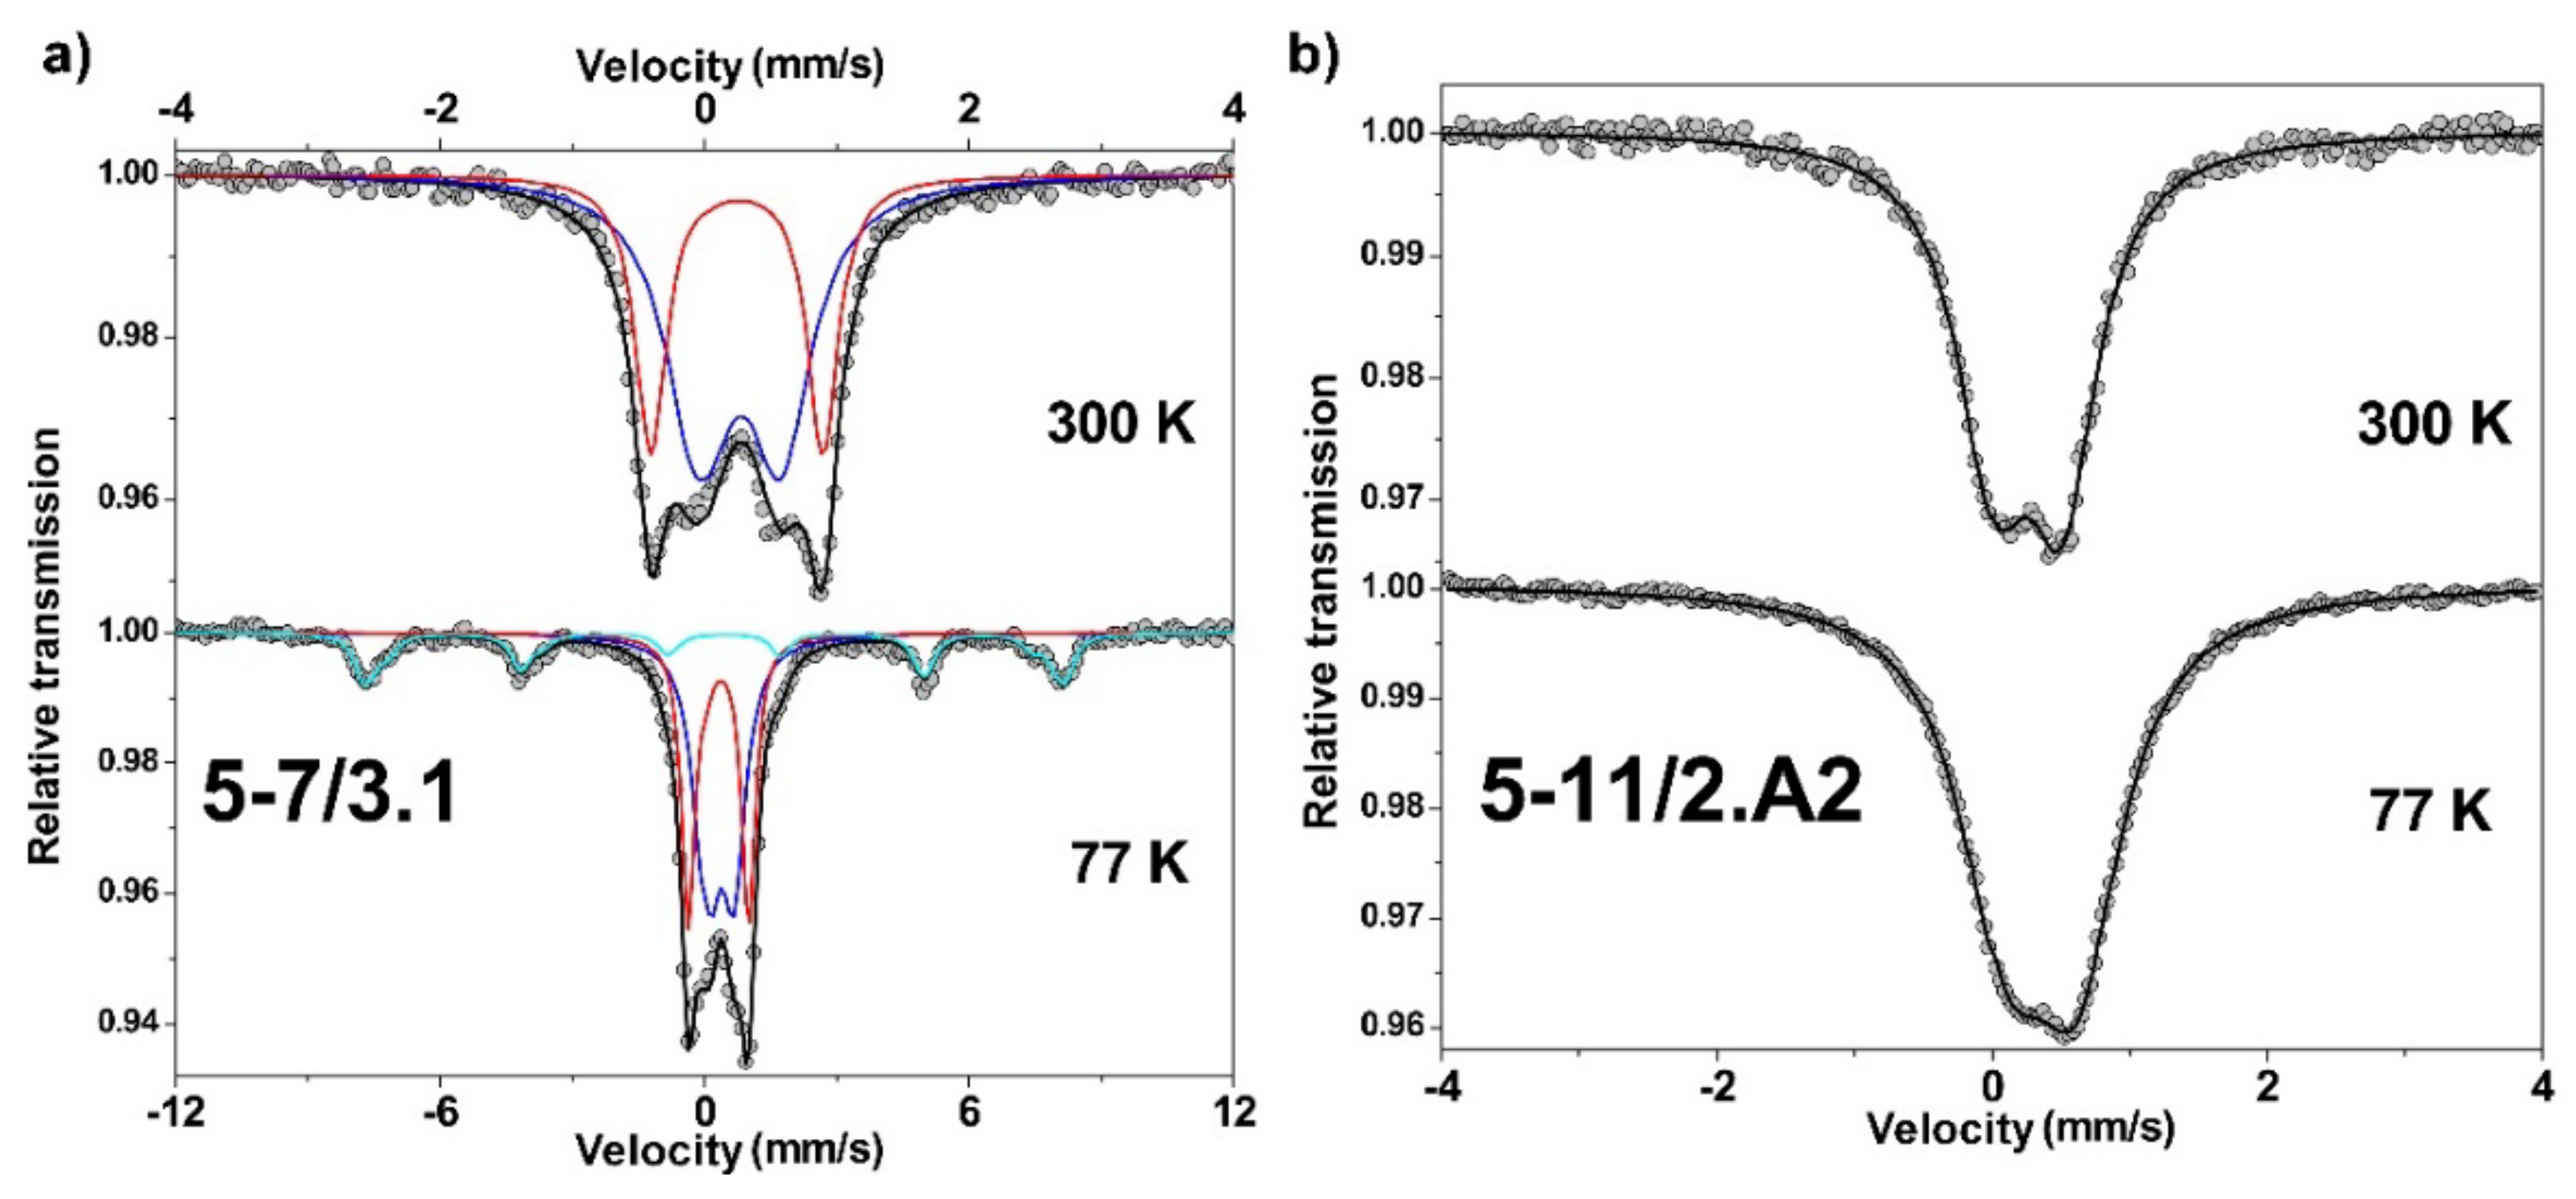
5.6. Mössbauer
6. Discussion
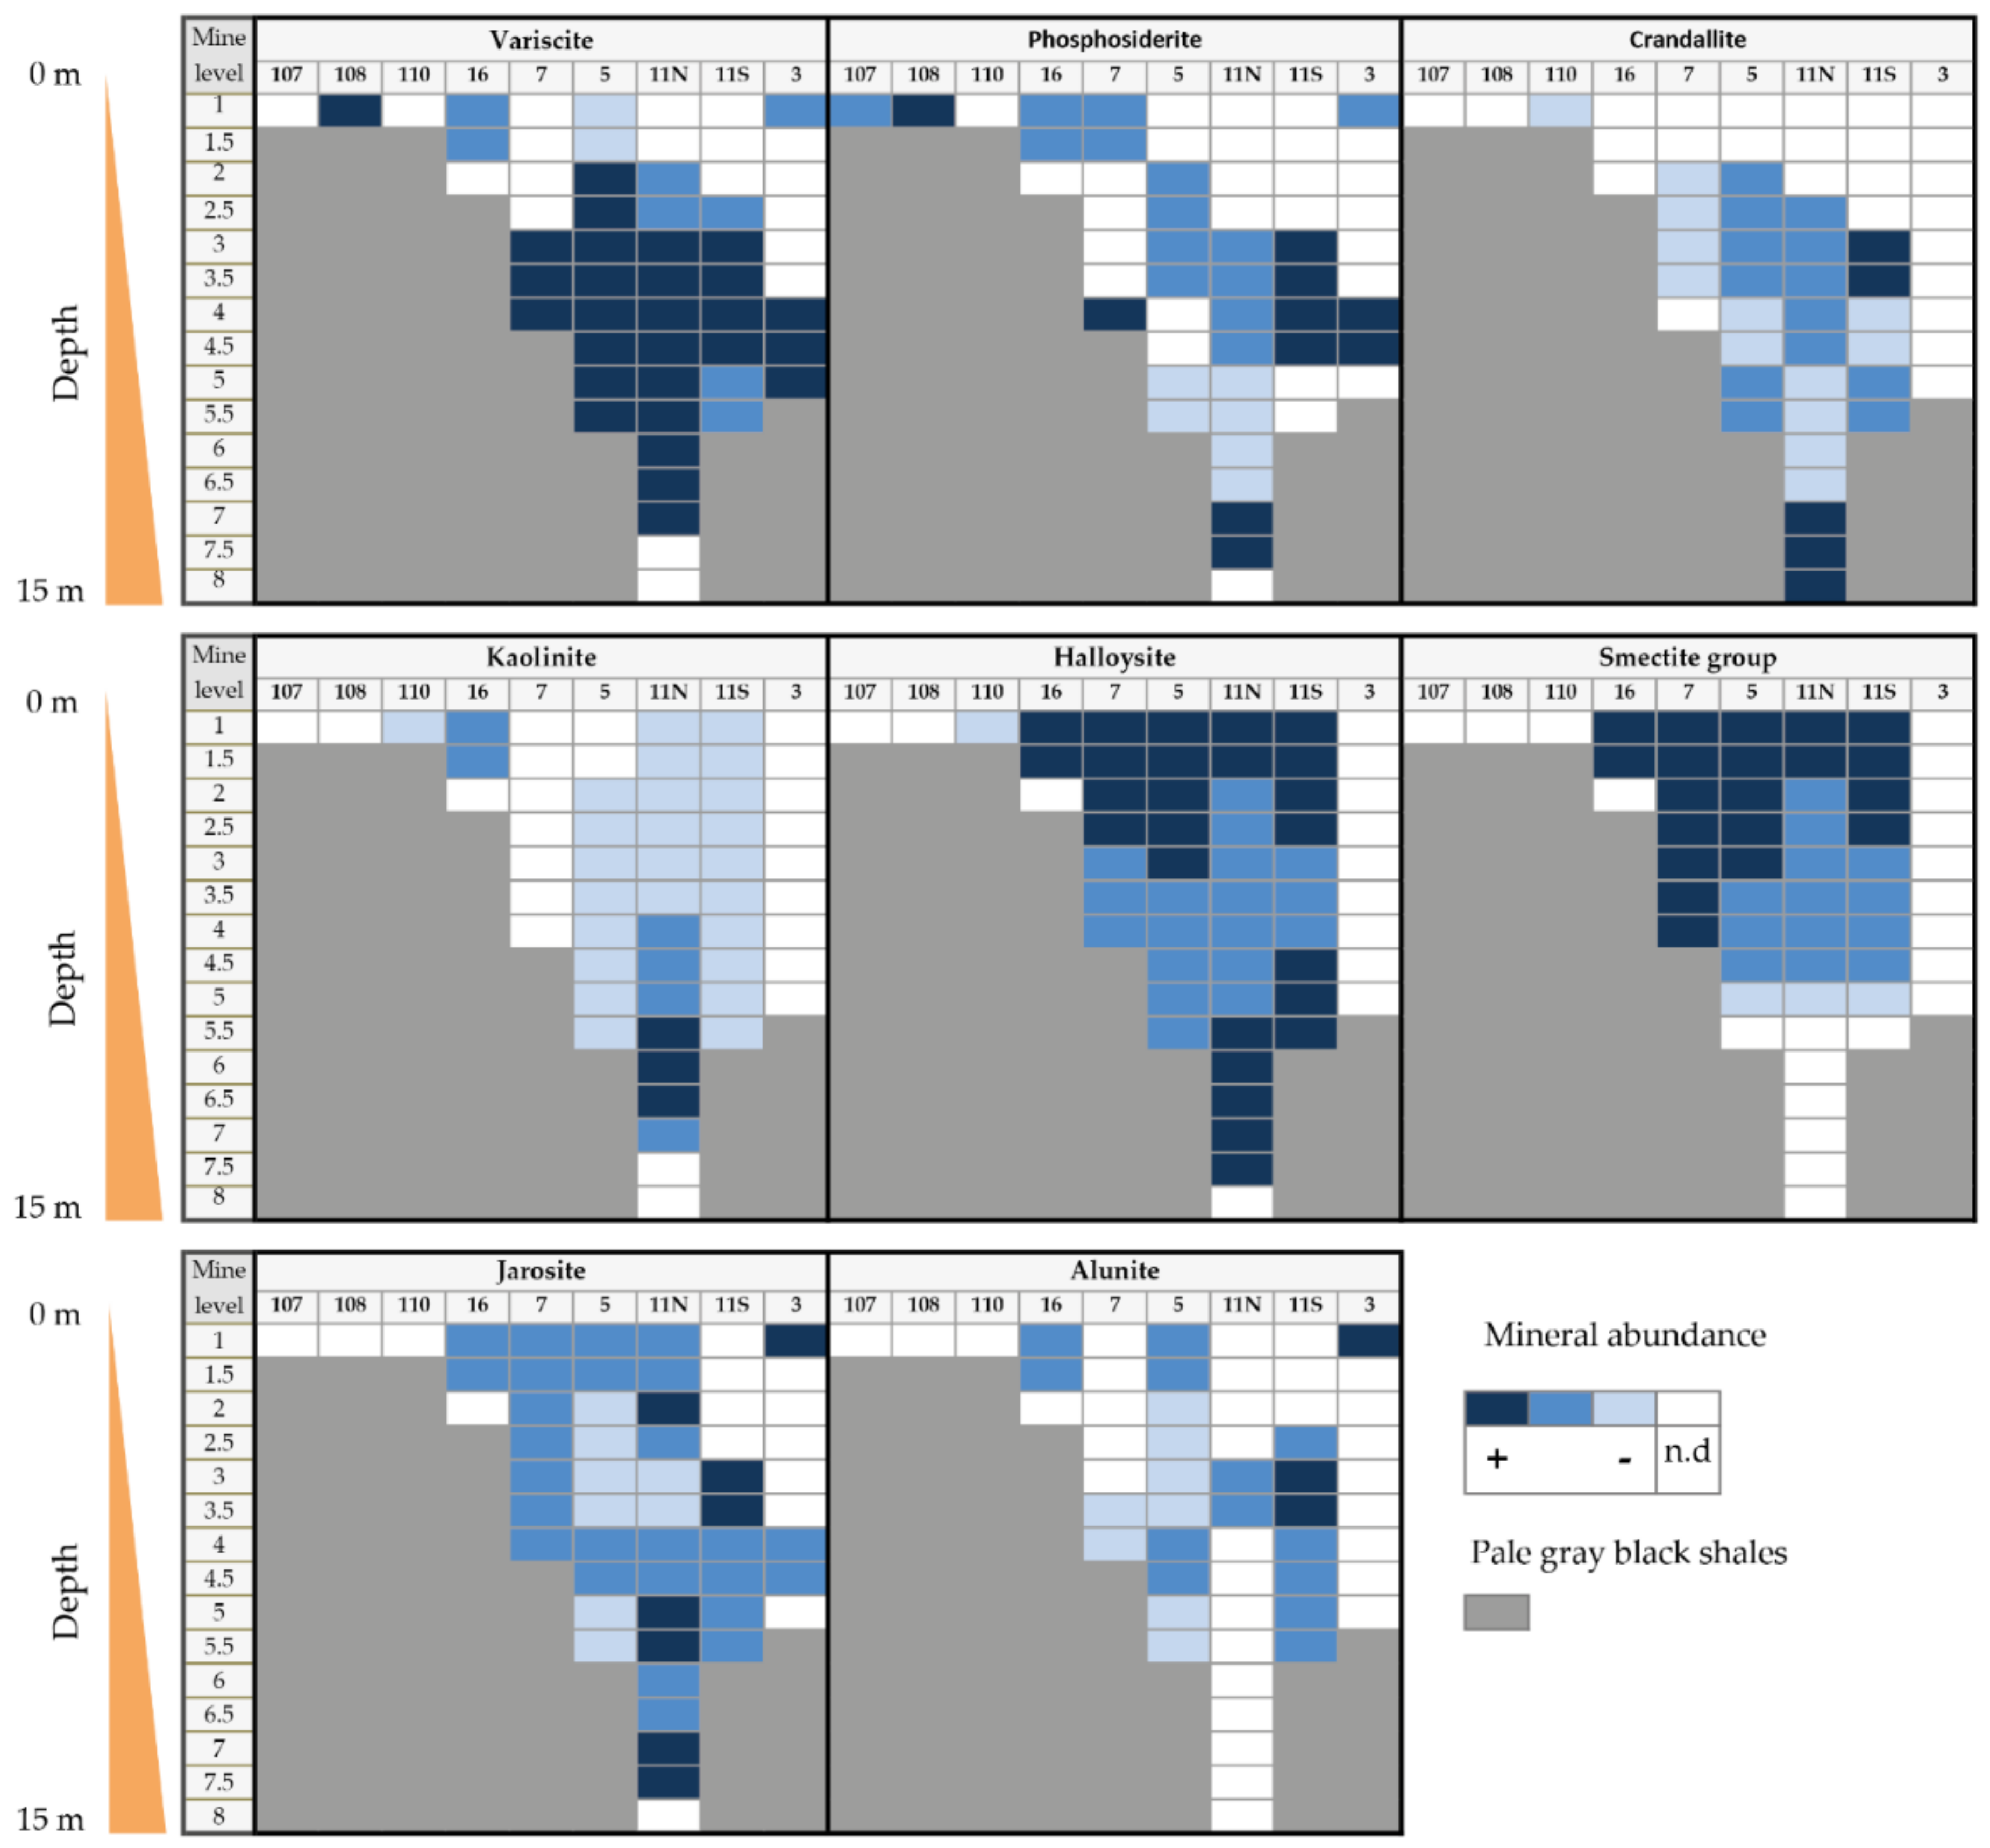
6.1. Greenish Geological and Archaeological Samples: Mineralogy and Distribution
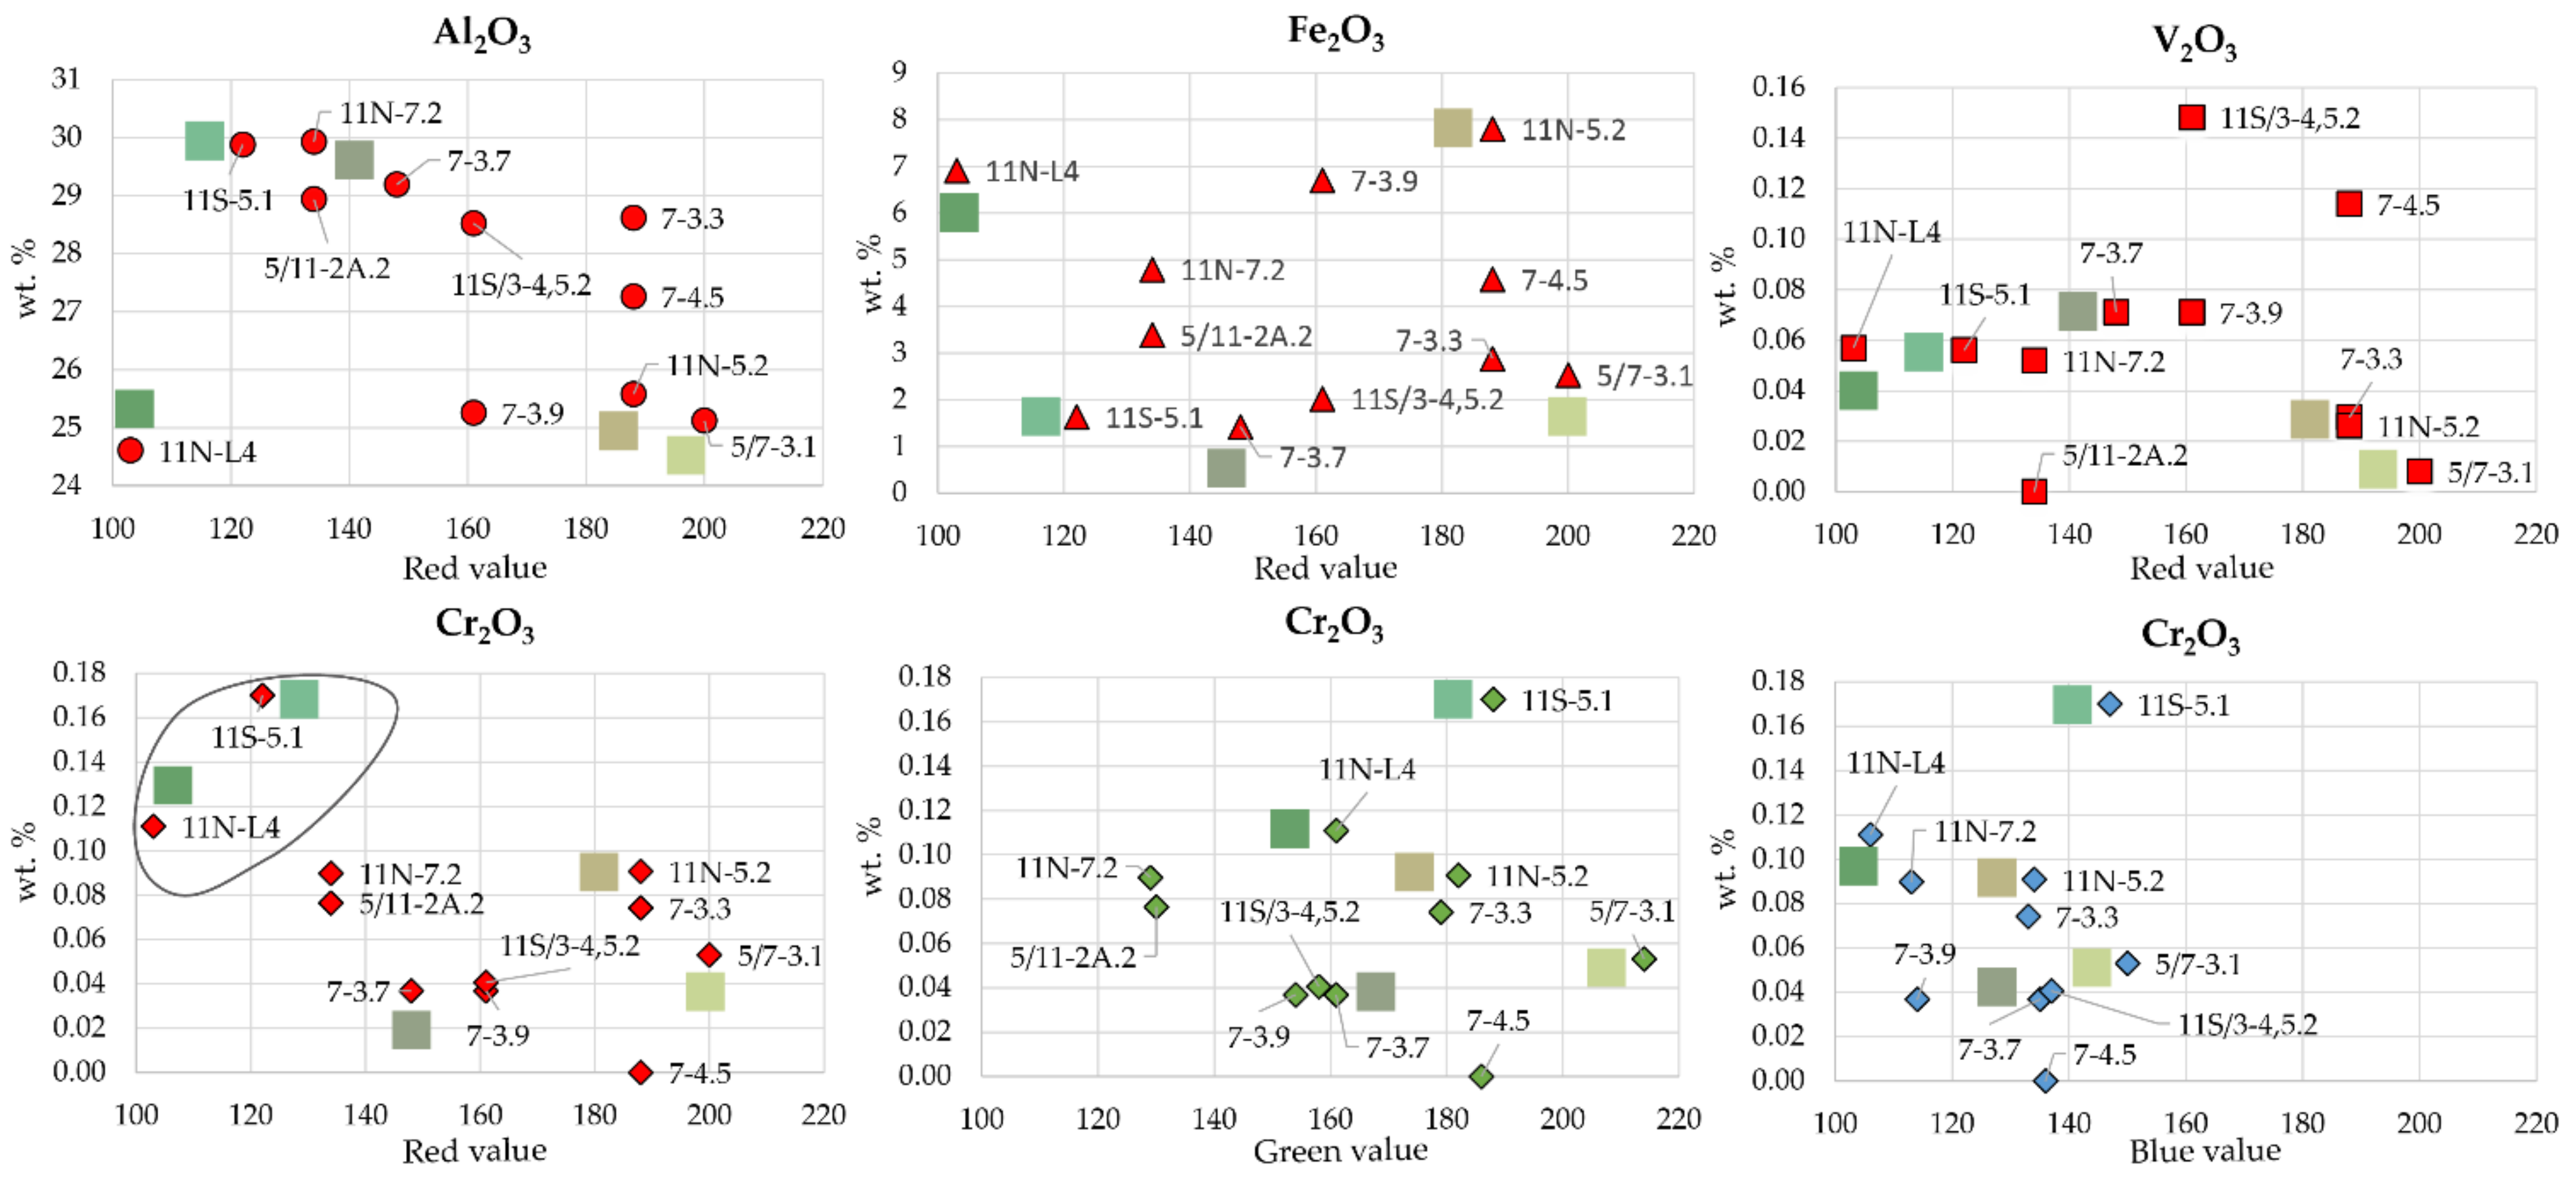
6.2. Green Colour in Variscite: Influence of the Chemical Composition
6.3. Green Colour in Variscite: Influence of Mineral Mixtures
6.4. Variscite vs. Turquoise by Colour
7. Conclusions
- Neolithic galleries and pits of the Gavà mines follow pure variscite veins but also veins with variscite mixtures with other phosphates (e.g., turquoise, phosphosiderite, montgomeryite, or crandallite), sulphates (alunite and jarosite), or silicates (kaolinite, halloysite, quartz, and smectite). Mining operations opened to exploit veins with pure green clays are rare and were abandoned only a few meters from the mine entrance.
- Archaeological samples are composed of variscite and turquoise. This fact, along with the scarce length of the excavations that follow pure clay veins, suggests that some galleries were opened as prospective works. Fe-rich smectite can be easily confused with variscite according to their similar colour but these kinds of silicates are not suitable for the manufacturing of ornaments.
- The green colour of variscite seems to be correlated with Cr3+ enrichment. Despite the low Cr3+ contents of the Gavà variscite (compared to other similar mineralizations), samples with more Cr3+ also correspond to those with a more intense colour.
- If variscite is intimately mixed with other cryptocrystalline white minerals (e.g., crandallite, alunite, quartz, or kaolinite), the resulting green colour is paler. If variscite is mixed with goethite, jarosite, or phosphosiderite, then it tends to acquire a yellowish hue. Therefore, gemmy variscite requires high contents of Cr3+ and a low proportion of a mixture with other minerals, particularly yellow-brownish minerals.
- Up to the present moment, turquoise has not been found in the excavated Gavà mines. However, it has been identified in five archaeological specimens from mine 16 of the GMAP. It is reasonable to assume that this turquoise was extracted from hidden or unexcavated Gavà mines but other hypotheses, such as the importation of turquoise from other localities, cannot be ruled out.
- The colourimeter has proven to be an efficient tool to easily differentiate turquoise and variscite from the Gavà area provided that the mineral does not present surface patinas that could disrupt the original colour.
Author Contributions
Funding
Acknowledgments
Conflicts of Interest
References
- Nassau, K. The origins of colour in minerals. Am. Mineral. 1978, 63, 219–229. [Google Scholar]
- Burns, R. Mineralogical Applications of Crystal Field Theory. Cambridge Topics in Mineral Physics and Chemistry, 2nd ed.; Cambridge University Press: Cambridge, UK, 1993; p. 480. [Google Scholar]
- Mattson, S.M.; Rossman, G.R. Identifying characteristics of charge transfer transitions in minerals. Phys. Chem. Miner. 1987, 14, 94–99. [Google Scholar] [CrossRef]
- Bill, H.; Calas, G. Colour centers, associated rare-earth ions and the origin of colouration in natural fluorites. Phys. Chem. Miner. 1978, 3, 117–131. [Google Scholar] [CrossRef]
- Krambrock, K.; Ribeiro, L.; Pinheiro, M.; Leal, A.S.; Menezes, M.A.; Spaeth, J. Colour centers in topaz: Comparison between neutron and gamma irradiation. Phys. Chem. Miner. 2007, 34, 437–444. [Google Scholar] [CrossRef]
- Lindberg, M.L.; Pecora, W.T. Phosphate minerals from Sapucaia Pegmatite Mine, Minas Gerais. Bol. Soc. Bras. Geol. 1958, 7, 5–14. [Google Scholar]
- Cassedanne, J.P.; Baptista, A. Famous mineral localities: The Sapucaia pegmatite, Minas Gerais, Brazil. Mineral. Rec. 1999, 30, 347–360. [Google Scholar]
- Segnit, E.R.; Francis, G.L. Secondary phosphate minerals from Iron Monarch, South Australia. Aust. Mineral. 1983, 43, 243–250. [Google Scholar]
- Barwood, H. Red and Pink Variscite from the Wood Mine, Cocke County, Tennessee. Rocks Miner. 1997, 72, 268–270. [Google Scholar] [CrossRef]
- Meireles, C.; Ferreira, N.; Lourdes, R.M. Variscite Occurrences in Silurian Formations from Northern Portugal. Comun. Dos Serviços Geológicos De Port. 1987, 73, 21–27. [Google Scholar]
- Herbaut, F.; Querré, G. La parure néolithique en variscite dans le sud de l’Armorique. Bull. Société Préhistorique Française 2004, 101, 497–520. [Google Scholar] [CrossRef]
- Fernández Turiel, J.L.; Blanco Majado, J.; López Alonso, M.; Edo, M. Estudio analítico de determinación mineralógica y de composición química de las cuentas de collar de calíta y otras materias primas del yacimiento de Las Peñas (Quiruelas de Vidriales, Zamora). Rubricatum 1995, 1, 227–237. [Google Scholar]
- Odriozola, C.P.; Linares-Catela, J.A.; Hurtado Pérez, V. Variscite source and source analysis: Testing assumptions at Pico Centeno (Encinasola, Spain). J. Archaeol. Sci. 2010, 37, 3146–3157. [Google Scholar] [CrossRef]
- Odriozola, C.P.; Linares-Catela, J.A.; Hurtado-Pérez, V.M. Provenancing variscite beads: Pico Centeno (Encinasola, Spain) outcrop case study. Open J. Archaeom. 2013, 1, 80–84. [Google Scholar] [CrossRef]
- Villalobos, R.; Odriozola, C.P. Organizing the production of variscite personal ornaments in later Prehistoric Iberia: The mines of aliste and the production sites of Quiruelas de Vidriales (Zamora, Spain). Eur. J. Archaeol. 2016, 19, 631–651. [Google Scholar]
- Acevedo, N.; Weber, M.; García-Casco, A.; Proenza, J.A.; Sáenz, J.; Cardona, A. A first report of variscite Tairona (A.D. 1100–1600) from the Sierra Nevada de Santa Marta, Colombia, and its implications for Precolumbian exchange networks in the region. Lat. Am. Antiq. 2007, 27, 549–560. [Google Scholar] [CrossRef][Green Version]
- Acevedo, N.; Weber, M.; Proenza, J.A.; García-Casco, A.; Sáenz-Samper, J. Provenance study of the variscite artifacts of the Sierra Nevada de Santa Marta, Colombia and approach to routes of pre-Hispanic exchange. J. Archaeol. Sci. 2021, 136, 105511. [Google Scholar] [CrossRef]
- Ball, S.H. The Mining of Gems and Ornamental Stones by American Indians; Bureau of American Ethnology Bulletin 128, Anthropological Papers 13; Smithsonian Institution: Washington, DC, USA, 1941; p. 77. [Google Scholar]
- Willing, M.; Stocklmayer, S.; Wells, M. Ornamental variscite: A new gemstone resource from Western Australia. J. Gemmol. 2008, 31, 111–124. [Google Scholar] [CrossRef]
- Díaz-Acha, Y.; Campeny, M.; Tauler, E.; Bosch, J.; Melgarejo, J.C.; Camprubí, A.; Villanova-de-Benavent, C.; Jorge-Villar, S.; Díaz-Ontiveros, I.; Fernández-Lluch, D.; et al. Critical Elements in Supergene Phosphates: The Example of the Weathering Profile at the Gavà Neolithic Mines, Catalonia, Spain. Minerals 2020, 10, 3. [Google Scholar] [CrossRef]
- Melgarejo, J.C.; Arqués, L.; Villanova-de-Benavent, C.; Jahwari, T.; Torró, L.; Bosch, J.; Castillo-Oliver, M.; Campeny, M.; Amores, S.; Andreazini, A.; et al. The use of Raman spectroscopy in the characterization of variscite provenance: The Gavà case. In La Parure en Callaïs du Néolithique Européen; Archaeopress: Oxford, UK, 2019; pp. 241–251. [Google Scholar]
- Fritsch, E.; Rossman, G.R. An update on colour in gems. Part 1: Introduction and colours caused by dispersed metal ions. Gemst. Gemol. 1987, 23, 126–139. [Google Scholar] [CrossRef]
- Foster, M.D.; Schaller, W.T. Cause of colour in wavellite from Dug Hill, Arkansas. Am. Mineral. 1996, 51, 422–428. [Google Scholar]
- Marty, J.; Howard, D.G.; Barwood, H. Minerals of the Utahlite Claim, Lucin, Box Elder County, Utah; Utah Geological Survey Miscellaneous Publication: Salt Lake City, UT, USA, 1999; p. 16. [Google Scholar]
- Rossman, G.R. Mineral Spectroscopy Server; California Institute of Technology: Pasadena, CA, USA, 2004; Available online: http://minerals.gps.caltech.edu/FILES/Visible/Variscite/Index.html (accessed on 15 March 2022).
- Calas, G.; Galoisy, L.; Kiratisin, A. The origin of the green colour of variscite. Am. Miner. 2005, 90, 984–990. [Google Scholar] [CrossRef]
- Salvador, P.; Fayos, J. Some aspects of the structural relationship between “Messbach-type” and “Lucin-type” variscites. Am. Miner. 1972, 57, 36–44. [Google Scholar]
- García-Guinea, J.; Correcher, V.; Sánchez Muñoz, L.; López-Arce, P.; Townsend, P.; Hole, D. Radiation damage of variscite in historic crafts: Solarization, decolouration, structural changes and spectra from ionoluminescence. Radiat. Phys. Chem. 2008, 77, 18–22. [Google Scholar] [CrossRef]
- Alonso, M.; Edo, M.; Gordo, L.; Millán, M.; Villalba, M.J. Explotación minera neolítica en Can Tintoré (Gavà, Barcelona). Pyrenae 1978, 13, 7–14. [Google Scholar]
- Villalba, M.J.; Blasco, A.; Edo, M.; Bañolas, L.; Arenas, J. Minería neolítica: Can Tintorer, una aportación fundamental. Rev. Arqueol. 1989, 96, 13–24. [Google Scholar]
- Villalba, M.J.; Bañolas, L.; Arenas, J. Can Tintorer (Gavà, Catalunya): Une exploitation néolithique de phosphates et silicates. Cah. Du Quat. 1990, 17, 275–285. [Google Scholar]
- Villalba, M.J. Le gîte de variscite de Can Tintorer: Production, transformation, et circulation du minéral vert. In Matériaux, Productions, Circulations du Néolithique à l’âge du Bronze: Paris, France; Guilaine, J., Ed.; Éditions Errance: Paris, France, 2002; pp. 115–129. [Google Scholar]
- Blasco, A.; Edo, M.; Villalba, M.J. Les Perles en Callaïs du Sud de la France: Proviennent-Elles des Mines de Can Tintorer? Montpellier, France, Conseil Général de l’Hérault, Le Chalcolithique en Languedoc, Ses Relations Extra-Régionales (Saint Mathieu de Tréviers, 1990), Archéologie en Languedoc; Colloque International Hommage au Dr. Jean Arnal: Saint Mathieu de Tréviers, France, 1991; pp. 279–289. Available online: https://www.researchgate.net/publication/292140097_Les_perles_en_callais_du_Sud_de_la_France_proviennent-elles_des_Mines_de_Can_Tintorer (accessed on 15 March 2022).
- Blasco, A.; Villalba, M.J.; Edo, M. Cronologia del complex miner de Can Tintorer. Aportacions a la periodització del Neolític mitjà català: Puigcerdà, Catalonia, 9è Col·loqui Internacional d’Arqueologia de Puigcerdà. In Estat de la Investigació Sobre el Neolític a Catalunya; Institut d’Estudis Ceretans: Barcelona, Spain, 1992; pp. 215–219. [Google Scholar]
- Blasco, M.; Borrell, M.; Bosch, J. Las minas prehistóricas de Gavà (Barcelona): Un ejemplo de estudio, conservación y presentación pública de un yacimiento arqueológico. Trab. Prehist. 2000, 57, 77–87. [Google Scholar] [CrossRef]
- Bosch, J.; Estrada, A.; Noain, M.J. Minería neolítica en Gavá (Baix Llobregat, Barcelona). Trab. Prehist. 1996, 53, 59–71. [Google Scholar] [CrossRef][Green Version]
- Bosch, J.; Gómez, A. Estudi de les ceràmiques neolítiques procedents de les mines 83, 84, 85 i 90 de Gavà. Rubricatum 2009, 4, 63–83. [Google Scholar]
- Borrell, F.; Estrada, A. Elements ornamentals neolítics de variscita trobats a les mines 83 i 85 de Gavà. Rubricatum 2009, 4., 171–181. [Google Scholar]
- Borrell, F.; Orri, E. Excavacions arqueològiques a la serra de les Ferreres, Mines Prehistòriques de Gavà. In L’Arqueologia a Gavà. Homenatge a Alícia Estrada: Gavà, Catalonia, Ajuntament de Gavà/Amics del Museu de Gavà, Collecció La Nostra Gent; Museu de Gavà: Gavà, Spain, 2009; pp. 67–86. Available online: https://www.researchgate.net/publication/305073009_Excavacions_arqueologiques_a_la_serra_de_les_Ferreres_Mines_Prehistoriques_de_Gava (accessed on 15 March 2022).
- Borrell, F.; Bosch, J. Las minas de variscita de Gavà (Barcelona) y las redes de circulación en el Neolítico. Rubricatum 2012, 5, 315–322. [Google Scholar]
- Borrell, F.; Bosch, J.; Majó, T. Life and death in the Neolithic Variscite Mines at Gavà (Barcelona, Spain). Antiquity 2015, 89, 72–90. [Google Scholar] [CrossRef]
- Borrell, F.; Bosch, J.; Gibaja, J.F.; Schmidt, P.; Terradas, X. The status of imported Barremian-Bedoulian flint in north-eastern Iberia during the Middle Neolithic. Insights from the variscite mines of Gavà (Barcelona). PLoS ONE 2019, 14, 1–29. [Google Scholar] [CrossRef]
- Costa, F.; Camprubí, A.; Melgarejo, J.C. Aproximación geológica a las minas neolíticas de fosfatos férrico-alumínicos de Gavà (Cataluña). Bol. Geol. Min. 1994, 105, 436–443. [Google Scholar]
- Camprubí, A.; Melgarejo, J.C.; Proenza, J.A.; Costa, F.; Bosch, J.; Estrada, A.; Borrell, F.; Yushkin, N.P.; Andreichev, V.L. Mining and geological knowledge during the Neolithic: A geological study on the variscite mines at Gavà, Catalonia. Episodes 2003, 26, 295–301. [Google Scholar] [CrossRef] [PubMed][Green Version]
- Díaz-Acha, Y.; Melgarejo, J.C.; Bosch, J.; Andreazini, A.; Pastor, M.; Pujol-Solà, N.; Campeny, M.; Torró, L.; Villanova-de-Benavent, C.; Castillo-Oliver, M.; et al. The Neolithic variscite mines of Gavà, Catalonia: Criteria for mineral exploration and exploitation in the Prehistory. Bol. Soc. Geol. Mex. 2019, 71, 83–319. [Google Scholar] [CrossRef]
- Díaz-Acha, Y.; Campeny, M.; Melgarejo, J.C.; Bosch, J.; Lehbib, S.; Torró, L.; Proenza, J.A.; Castillo-Oliver, M.; Camprubí, A.; Villanova-de-Benavent, C.; et al. Geological context of the historic and prehistoric iron mines in the Gavà area, Catalonia, NE Iberian peninsula. Bol. Soc. Geol. Mex. 2019, 71, 321–342. [Google Scholar] [CrossRef]
- Noain, M.J. Las cuentas de collar en variscita de las minas prehistóricas de Gavà (Can Tintorer): Bases para un estudio experimental. Cuad. Prehist. Arqueol. 1996, 23, 37–86. [Google Scholar]
- Alarashi, H.; Borrell, F. Constructing identities in Neolithic times. The variscite ornaments of Gavà (Barcelona). In L’Art du Paraître: Apparences de l’Humain, de la Préhistoire à Nos Jours. The art of Human Appearance, from Prehistory to the Present Day. 40e Rencontres Internationales d’Archéologie et d’Histoire de Nice Côte d’Azur; Éditions APDCA-CEPAM: Nice, France, 2020; pp. 109–125. Available online: https://www.researchgate.net/publication/345805488_Constructing_identities_in_Neolithic_times_The_variscite_ornaments_of_Gava_Barcelona_In_book_L%27ART_DU_PARAITRE_APPARENCES_DE_L%27HUMAIN_DE_LA_PREHISTOIRE_A_NOS_JOURS_THE_ART_OF_HUMAN_APPEARANCE_FROM_PRE (accessed on 15 March 2022).
- Fernández, A.; Moro, C.; Dabard, M.P. Les Minéralisations De Variscite Du Sud-Ouest De l’Europe: Caractéristiques Minéralogiques, Géochimiques Et Genèse. La Parure En Callaïs Du Néolithique Européen; Archaeopress Publishing: Oxford, UK, 2019; pp. 9–23. [Google Scholar]
- Anadón, P.; Colombo, F.; Esteban, M.; Marzo, M.; Robles, S.; Santanach, P.; Solé Sugrañés, L. Evolución tectonoestratigráfica de los Catalánides. Acta Geol. Hisp. 1979, 14, 242–270. [Google Scholar]
- Guimerà, J. Palaeogene evolution of deformation in the north-eastern Iberian peninsula. Geol. Mag. 1984, 121, 413–420. [Google Scholar] [CrossRef]
- Santanach, P.; Casas, J.M.; Gratacós, O.; Liesa, M.; Muñoz, J.A.; Sàbat, F. Variscan and Alpine structure of the hills of Barcelona: Geology in an urban area. J. Ib. Geol. 2011, 37, 121–136. [Google Scholar]
- Julivert, M.; Duran, H. Paleozoic stratigraphy of the Central and Northern part of the Catalonian Coastal Ranges (NE Spain). Acta Geol. Hisp. 1990, 25, 3–12. [Google Scholar]
- Julivert, M.; Duran, H.; Rickards, R.B.; Chapman, A.J. Siluro-Devonian graptolite stratigraphy of the Catalonian Coastal Ranges. Acta Geol. Hisp. 1985, 20, 199–207. [Google Scholar]
- Bordas, A.; Borrell, F.; Bosch, J. 10 anys de recerques arqueològiques a la serra de Les Ferreres (mines de Gavà, Baix Llobregat). De la variscita al ferro: Neolític i Antiguitat. Rubricatum 2009, 4, 10–14. [Google Scholar]
- Frost, R.L.; Weier, M.L.; Erickson, K.L.; Carmody, O.; Mills, S.J. Raman spectroscopy of phosphates of the variscite mineral group. J. Raman Spectrosc. 2004, 35, 1047–1055. [Google Scholar] [CrossRef]
- Fritsch, E.; Karampelas, S.; Mevellec, J.Y. Raman spectra of gem-quality variscite and metavariscite. J. Raman Spectrosc. 2017, 48, 1554–1558. [Google Scholar] [CrossRef]
- Brok, E.; Frandsen, C.; Madsen, D.E.; Jacobsen, H.; Birk, J.O.; Lefmann, K.; Bendix, J.; Pedersen, K.S.; Boothroyd, C.B.; Berhe, A.A.; et al. Magnetic properties of ultra-small goethite nanoparticles. J. Phys. D Appl. Phys. 2014, 47, 365003. [Google Scholar] [CrossRef]
- Dyar, M.; Jawin, E.; Breves, E.; Marchand, G.; Nelms, M.; Lane, M.; Mertzman, S.; Bish, D.; Bishop, J. Mössbauer parameters of iron in Phosphate minerals: Implications for interpretation of Martian data. Am. Mineral. 2014, 99, 914–942. [Google Scholar] [CrossRef]
- Balatskiy, D.; Dedushenko, S.; Gritsenko, Y.; Ksenofontov, D.; Perfiliev, Y. X-ray and Mössbauer study of phosphosiderite from Atacama, Chile. Hyperfine Interact. 2021, 242, 14. [Google Scholar] [CrossRef]
- Kovács, K.; Kuzmann, E.; Homonnay, Z.; Vértes, A.; Gunneriusson, L.; Sandström, Å. Mössbauer study of synthetic jarosites. ICAME 2009, 186, 69–73. [Google Scholar]
- Bosch, J. Gavà (Barcelone), mine et atelier au Néolithique. In La Parure en Callaïs du Néolithique Européen; Querré, G., Cassen, S., Vigier, E., Eds.; Archaeopress Publishing Ltd.: Oxford, UK, 2019; pp. 43–58. [Google Scholar]
- Molist, M.; Oliva, M. La parure en variscite au Néolithique dans la partie est de l’Espagne. In La Parure en Callaïs du Néolithique Européen; Querré, G., Cassen, S., Vigier, E., Eds.; Archaeopress Publishing Ltd.: Oxford, UK, 2019; pp. 351–364. [Google Scholar]
- Nriagu, J.O.; Moore, P.B. Phosphate Minerals; Springer: Berlin, Germany, 1984; p. 442. [Google Scholar]
- Prietzel, J. Mobilization of X-ray amorphous and crystalline aluminum and iron phosphates by common soil extraction procedures. J. Soil Nutr. Soil Sci. 2017, 180, 14–17. [Google Scholar] [CrossRef]
- Werner, F.; Mueller, C.W.; Thieme, J.; Gianoncelli, A.; Rivard, C.; Höschen, C.; Prietzel, J. Micro-scale heterogeneity of soil phosphorus depends on soil substrate and depth. Nat. Comm. Sci. Rep. 2017, 7, 3203. [Google Scholar] [CrossRef] [PubMed]
- Fábregas, R.; Rodríguez-Rellán, C. Palazuelo de las Cuevas and the exploitation of variscite in the North-West of Iberia. In La Parure en Callaïs du Néolithique Européen; Querré, G., Cassen, S., Vigier, E., Eds.; Archaeopress Publishing Ltd.: Oxford, UK, 2019; pp. 59–70. [Google Scholar]
- Domínguez-Bella, S.; Ramos-Muñoz, J. Pico Centeno prehistoric variscite mines (Encinasola, Huelva, SW Spain). In La Parure en Callaïs du Néolithique Européen; Querré, G., Cassen, S., Vigier, E., Eds.; Archaeopress Publishing Ltd.: Oxford, UK, 2019; pp. 71–83. [Google Scholar]
- Fritsch, E.; Rondeau, B.; Lulzac, Y.; Mocquet, B. Gemmology of gem phosphates: A review with particular attention to variscite. In La Parure en Callaïs du Néolithique Européen; Querré, G., Cassen, S., Vigier, E., Eds.; Archaeopress Publishing Ltd.: Oxford, UK, 2019; pp. 25–40. [Google Scholar]
- Querré, G.; Calligaro, T.; Cassen, S.; Dabard, M.P.; Domínguez-Bella, S. Provenance des parures en variscite du Néolithique européen: Élaboration d’un modèle chimiométrique. In La Parure en Callaïs du Néolithique Européen; Querré, G., Cassen, S., Vigier, E., Eds.; Archaeopress Publishing Ltd.: Oxford, UK, 2019; pp. 105–128. [Google Scholar]


| Archaeological Samples | Mineral Samples | ||||||
|---|---|---|---|---|---|---|---|
| Number | NCS Colour | Hex Colour | Colour | Sample | NCS Colour | Hex Colour | Colour |
| M16-1468 | S2010-Y | #d6d1b6 |  | GM-7-3.3 | S3020-Y | #bcb385 |  |
| M16-1511 | S2020-G40Y | #c0d694 |  | GM-7-3.7 | S4010-G30Y | #94a187 |  |
| M16-5202 | S1515-Y10R | #e4d7af |  | GM-7-3.9 | S4020-Y | #a19a72 |  |
| M16-5211 | S3020-G10Y | #8bbc8d |  | GM-7-4.5 | S3020-G80Y | #bcba88 |  |
| M16-5868 | S2020-B90G | #9fd6a1 |  | GM-5/7-3.1 | S2020-G50Y | #c8d696 |  |
| M16-6087 | S1510-G20Y | #cce4c2 |  | GM-5/11-2A.2 | S5020-G90Y | #868260 |  |
| M16-7044 | S4020-G90Y | #a19c73 |  | GM-11N-5.2 | S3020-G90Y | #bcb686 |  |
| M16-7049 | S4020-G10Y | #cad6b3 |  | GM-11N-7.2 | S5010-Y10R | #868171 |  |
| M16-8520 | S2010-G60Y | #d2d6b6 |  | GM-11S-5.1 | S3020-G | #7abc93 |  |
| M16-8669 | S2010-G | #add6bd |  | GM-11S/3-4,5.2 | S4010-G90 | #a19e89 |  |
| M16-8773 | S2010-G | #add6bd |  | GM-11N-4 | S4030-G10Y | #67a16a |  |
| M85-5 | S2020-G10Y | #9fd6a1 |  | GM-ASA-1 | S2020-G | #8bd6a8 |  |
| M85-41 | S3030-G30Y | #96bc6e |  | ||||
| M85-60 | S2010-G20Y | #c0d6b7 |  | ||||
| M85-66 | S4030-G | #53a171 |  | ||||
| M85-121 | S5020-G30Y | #73865f |  | ||||
| Sample | T (K) | δFe (mm/s) ±0.02 | Γ (mm/s) ±0.02 | Δ (mm/s) ±0.02 | 2ε (mm/s) ±0.02 | Bhf (T) ±0.5 | % ±2 | Interpretation |
|---|---|---|---|---|---|---|---|---|
| 11N-L4 | 300 | 0.42 | 0.46 | 0.45 | 61 | Fe3+ (SP * goethite + variscite?) | ||
| 0.37 | 0.33 | 1.24 | 39 | Fe3+ (jarosite?) | ||||
| 77 | 0.52 | 0.53 | 0.42 | 54 | Fe3+ (SP * goethite + variscite?) | |||
| 0.47 | 0.36 | 1.22 | 35 | Fe3+ (jarosite?) | ||||
| <0.51> | <−0.23> | <48.3> | 11 | Fe3+ (goethite) | ||||
| 5/7-3.1 | 300 | 0.39 | 0.57 | 0.60 | 65 | Fe3+ (SP * goethite + variscite?) | ||
| 0.37 | 0.28 | 1.27 | 35 | Fe3+ (jarosite?) | ||||
| 77 | 0.50 | 0.64 | 0.56 | 43 | Fe3+ (SP * goethite + variscite?) | |||
| 0.48 | 0.38 | 1.27 | - | 33 | Fe3+ (jarosite?) | |||
| <0.51> | <−0.25> | <48.3> | 24 | Fe3+ (goethite) | ||||
| 5/11-2.A2 | 300 | 0.39 | 0.62 | 0.48 | 100 | Fe3+ (SP * goethite + variscite?) | ||
| 77 | 0.48 | 0.78 | 0.50 | - | 100 | Fe3+ (SP * goethite + variscite?) |
Publisher’s Note: MDPI stays neutral with regard to jurisdictional claims in published maps and institutional affiliations. |
© 2022 by the authors. Licensee MDPI, Basel, Switzerland. This article is an open access article distributed under the terms and conditions of the Creative Commons Attribution (CC BY) license (https://creativecommons.org/licenses/by/4.0/).
Share and Cite
Díaz-Acha, Y.; Campeny, M.; Casas, L.; Di Febo, R.; Ibañez-Insa, J.; Jawhari, T.; Bosch, J.; Borrell, F.; Jorge-Villar, S.E.; Greneche, J.-M.; et al. Colours of Gemmy Phosphates from the Gavà Neolithic Mines (Catalonia, Spain): Origin and Archaeological Significance. Minerals 2022, 12, 368. https://doi.org/10.3390/min12030368
Díaz-Acha Y, Campeny M, Casas L, Di Febo R, Ibañez-Insa J, Jawhari T, Bosch J, Borrell F, Jorge-Villar SE, Greneche J-M, et al. Colours of Gemmy Phosphates from the Gavà Neolithic Mines (Catalonia, Spain): Origin and Archaeological Significance. Minerals. 2022; 12(3):368. https://doi.org/10.3390/min12030368
Chicago/Turabian StyleDíaz-Acha, Yael, Marc Campeny, Lluís Casas, Roberta Di Febo, Jordi Ibañez-Insa, Tariq Jawhari, Josep Bosch, Ferran Borrell, Susana Esther Jorge-Villar, Jean-Marc Greneche, and et al. 2022. "Colours of Gemmy Phosphates from the Gavà Neolithic Mines (Catalonia, Spain): Origin and Archaeological Significance" Minerals 12, no. 3: 368. https://doi.org/10.3390/min12030368
APA StyleDíaz-Acha, Y., Campeny, M., Casas, L., Di Febo, R., Ibañez-Insa, J., Jawhari, T., Bosch, J., Borrell, F., Jorge-Villar, S. E., Greneche, J.-M., Tauler, E., & Melgarejo, J. C. (2022). Colours of Gemmy Phosphates from the Gavà Neolithic Mines (Catalonia, Spain): Origin and Archaeological Significance. Minerals, 12(3), 368. https://doi.org/10.3390/min12030368