Article

Damage and Failure Characteristics of Surrounding Rock in Deep Circular Cavern under Cyclic Dynamic Load: A True Triaxial Experiment Investigation

1
Zijin School of Geology and Mining, Fuzhou University, Fuzhou 350108, China
2
103 Geological Brigade of the Bureau, Geology and Mineral Exploration and Development in Guizhou Province, Tongren 554300, China
*
Author to whom correspondence should be addressed.
Minerals 2022, 12(2), 134; https://doi.org/10.3390/min12020134
Submission received: 14 November 2021 / Revised: 6 January 2022 / Accepted: 20 January 2022 / Published: 24 January 2022
(This article belongs to the Special Issue Fracturing of Coal and Rock Mass)

Abstract

:
For ensuring safety and efficiency during the construction of deep engineering, it is essential to explore the failure mode of the surrounding rock mass under dynamic disturbance and high geo-stress. We conducted true triaxial load tests for rock-like material with a preexisting circular hole, and monitored the acoustic emission (AE) signal during the whole test. The result demonstrates the evolution characteristics of damage and failure mode with different cyclic dynamic load amplitudes and intermediate principal stress. With the increase in cyclic dynamic load amplitude or the decrease in intermediate principal stress, the failure source mainly occurs at the two horizontal side walls of the surrounding rock where the failure patterns change from the slabbing to wall caving and, finally, to rockburst. The former failure mode can actually serve as an important precursor for the latter. Based on such mechanisms, the precursor can be indirectly detected in forms of AE signal released by microcracking. The research can provide a reliable guidance for the rock stability control and faithfully forecasting the larger-scale failure during the excavation of deep circular cavern.

1. Introduction

Deep-earth resource exploitation is very popular in recent years since the mineral resources in the shallow have been excessively depleted and, nowadays, the demand for mineral resources is increasing. Many engineering projects for deep-earth resource exploitation, such as 1197 m Caitun coal mine in Shenyang (Northeast China), 4700 m gold mine in Western Deep Level, and 8038 m oil drilling in Tarim Basin, have been launched. Due to the complex geophysical environments and severe engineering disturbances, different forms of dynamic disasters, such as rockburst, large squeezing deformation, and roof collapse, are often encountered during the construction of deep engineering, which seriously threatens the implementation of the project. To achieve the safe and efficient exploitation of deep-earth resources, exploring the physical processes involved in dynamic disasters driven by true triaxial stress states has become an urgent scientific problem.
Laboratory investigations are conducive to a basic understanding of the dynamic disaster evolution mechanisms and the interpretation of field observations [1,2,3,4,5,6,7,8]. Investigating the laboratory scale dynamic disasters under laboratory environments is, therefore, essential.
At present, there are three methods to study the damage and failure characteristics of surrounding rock in deep engineering: theoretical analysis, numerical simulation, and laboratory or in situ tests. In terms of theoretical research, Fan et al. [9] used a theoretical model to study the variation law of the strain energy of the surrounding rock and calculated the damage scale of the surrounding rock based on the elastic strain energy criterion. Thongraksa et al. [10] conducted a series of stress analysis and failure criteria research on the rock failure of a pressure cavern and determined the chart of the initial failure position. Using the numerical simulation method, Barla et al. [11] studied the expansion phenomenon of the surrounding rock caused by tunnel excavation. Wang et al. [12] simulated the failure mechanism of the isotropic rock of a circular tunnel based on the realistic failure process analysis. Because theoretical research and numerical analysis cannot completely simulate the actual construction scheme and engineering environment, the study of deformation and failure characteristics of the surrounding rock still needs to be supported by in situ and laboratory tests. Li et al. [13] analyzed the failure characteristics of the surrounding rock during tunnel excavation by in situ tests. Feng et al. [14] obtained the evolution law in the time and space of rock bursts through in situ monitoring. Considering the high cost of in situ tests, many achievements have been made in the study of surrounding rock failure mode through laboratory tests. Dai et al. [15] analyzed dynamic characteristics, damage characteristics, and energy dissipation and failure modes of rock with a single hole under cyclic impact load by using Split Hopkinson Pressure Bar (SHPB). Cheon et al. [16] used CT technology to detect the failure of surrounding rock and distinguish damaged and failure areas. Based on scanning electron microscopy (SEM), Hu et al. [17] identified microcracks in the surrounding rock and obtained the fracture characteristics of granite. Dresen et al. [18,19,20,21] used the monitoring, statistics, and positioning functions of acoustic emission (AE) signals to study the evolution law of microscopic failure characteristics and achieved good results. In addition, many scholars [22,23,24,25,26] studied the damage and failure characteristics of the surrounding rock by combining model tests and numerical simulation methods. Based on the true-triaxial experiments of static and dynamic loads, Luo et al. [27] studied the mechanical behaviors and AE characteristics of the dynamically induced rock failure. Gong et al. [28,29,30] illustrated the failure characteristics of the surrounding rock based on cube specimens with circular holes. Zhang et al. [31] studied the splitting failure of the surrounding rock of a high sidewall cavern under high geo-stress. In addition, the influences of the magnitude and direction of the intermediate principal stress on rock failure mechanism with a pre-existing circular opening were studied by carrying out true triaxial tests [32,33].
In summary, the problem of rock deformation under deep dynamic loading has not yet been comprehensively studied, and the mechanism of dynamic hazard occurrence applicable to the stability control of deep rock masses is not yet clear. Specifically, most of the previous studies were conducted under certain boundary conditions or a single factor, and it is difficult to simulate the complex deep stress environment; there are few basic studies on the failure characteristics under dynamic loading. The innovations of this study are as follows: (1) The true triaxial cyclic loading test was conducted to simulate the mining effect of deep rock mass, and (2) the failure mode and influencing factors of deep rock mass induced by true triaxial cyclic loading are summarized to reveal the mechanism of dynamic disasters in deep rock masses. The research results can provide guidance for solving the problems of deep dynamic disaster prevention and control, and enable safe and efficient mining of deep mineral resources.

2. True Triaxial Model Test
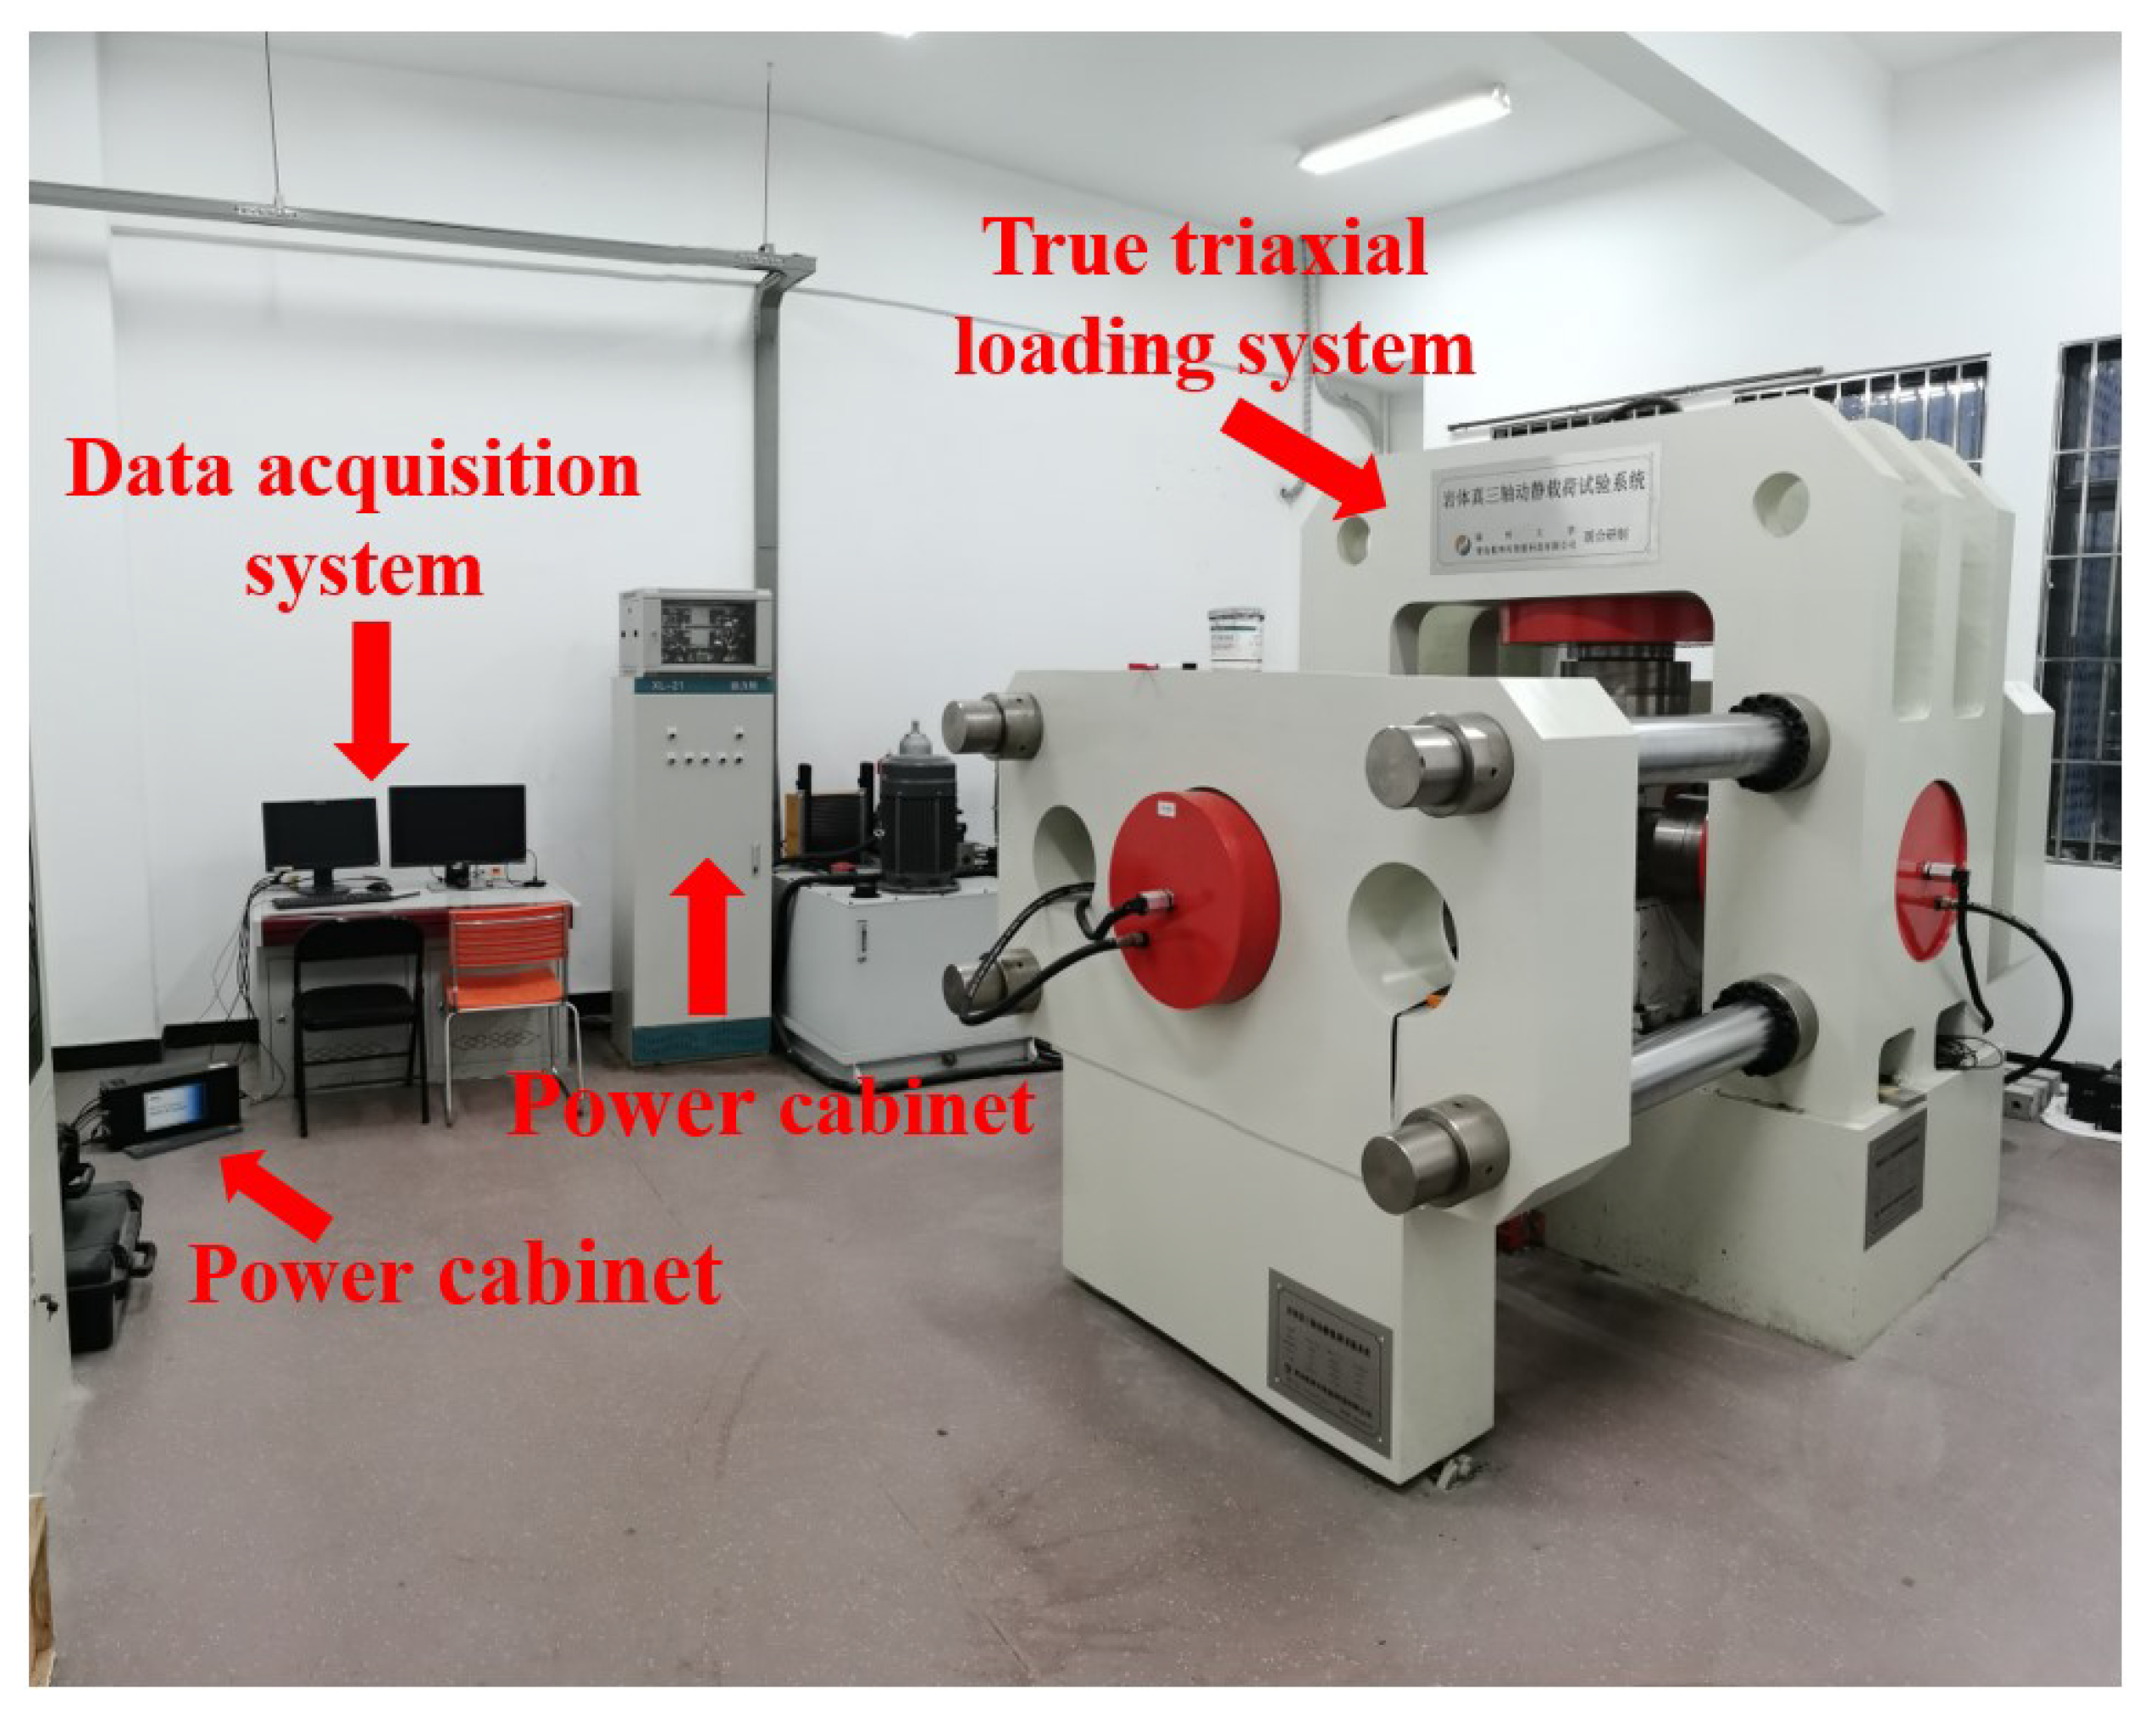
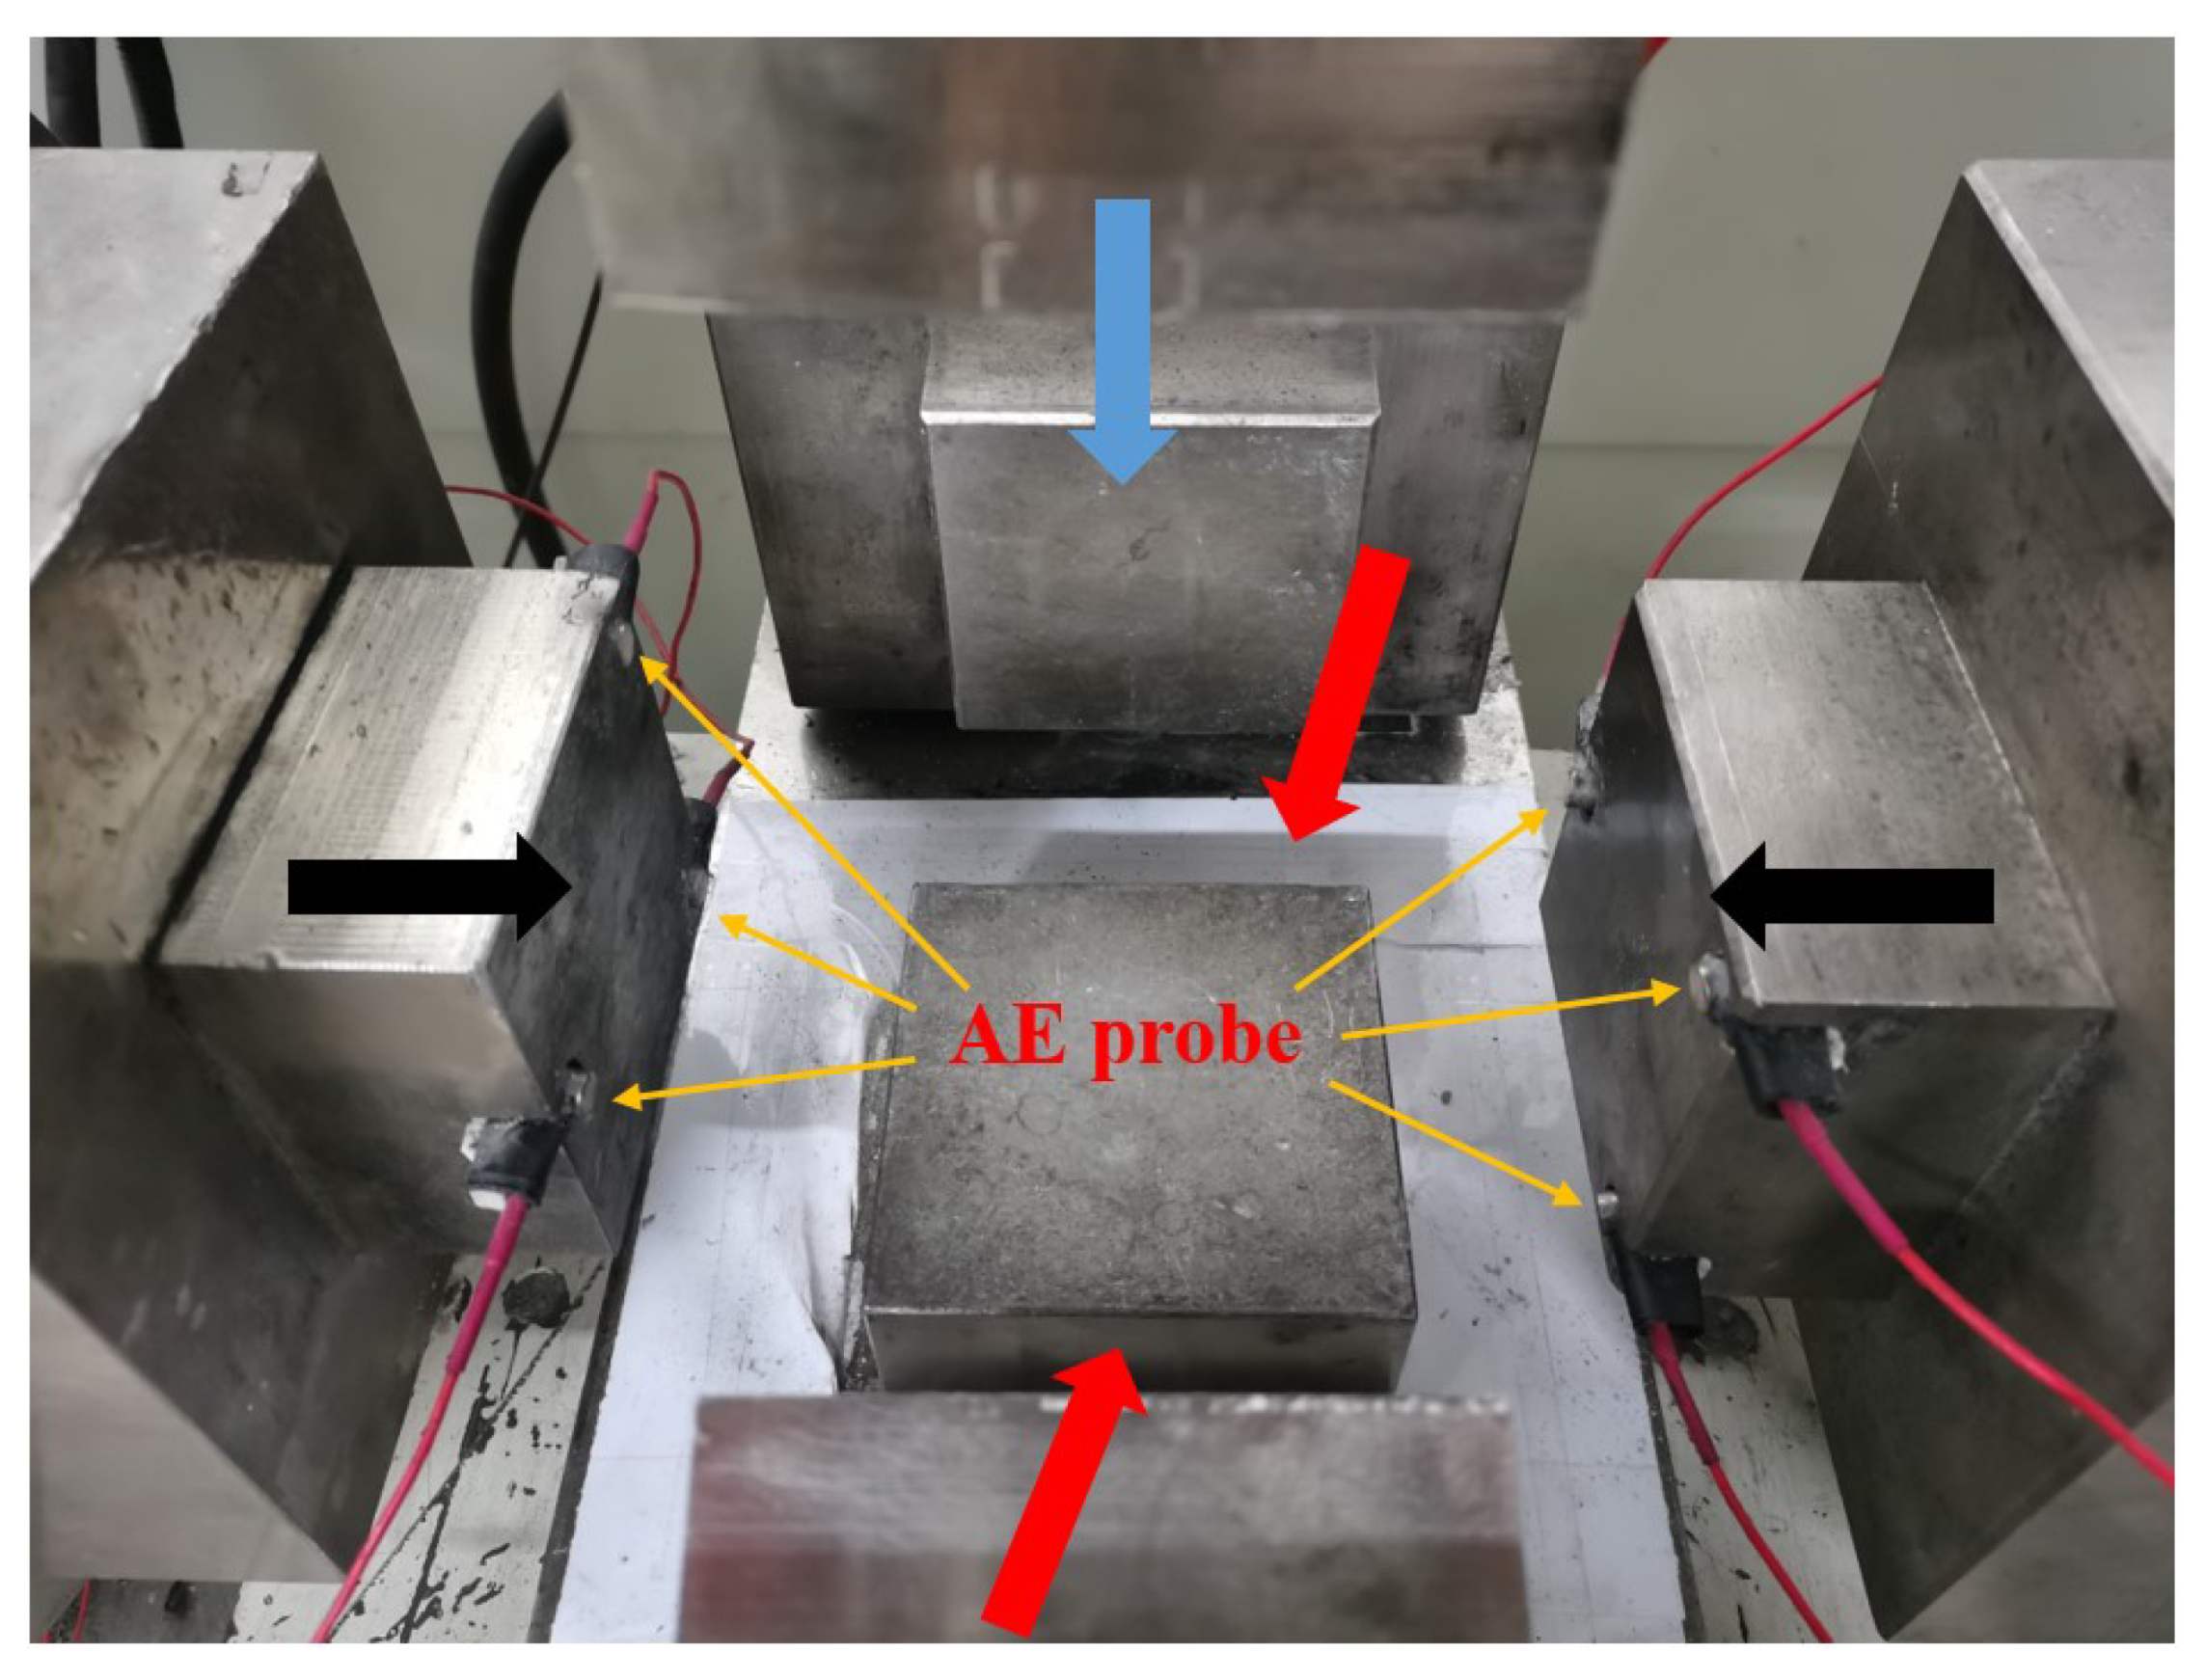
2.1. Test System

True triaxial cyclic dynamic load tests with AE monitoring are performed in the laboratory by using the QKX-ZSZ-4000 rock mass true triaxial dynamic and static load test system (Figure 1) and the Micro-II acoustic emission testing system. The loading system has an axial load capacity of 4000 kN and a lateral load capacity of 2400 kN. It can exert loads along three orthogonal directions perpendicular to the specimen’s surfaces, and the bottom hydro-cylinder can achieve various types of dynamic loading. Acoustic emission serves as an auxiliary monitoring technique to real-timely detect the microcracking information herein. A total of six AE sensors with a resonance frequency of approximately 150 kHz and a fairly flat response from 0 to 400 kHz are used. Figure 2 shows the locations of the AE sensors. The AEWin software with a hit-based mode, produced by physical acoustics corporation (PAC), is used for acquisition of the AE parameters. The AE hardware is set up with a pre-amplification of 40 dB, sampling rate of 2 MSPS, sample length of 1 k, and a bandpass filtration of 20~100 kHz. To avoid ambient noise [4,34], the threshold is set to be 45 dB. Only the AE signal over the threshold of 45 dB can be registered as an AE event. The peak definition time (PDT), hit definition time (HDT), and hit lockout time (HLT) defines the detection of AE events for hit-based mode. Three criteria of PDT = 200 μ s, HDT = 800 μ s and HLT = 1000 μ s are established for the detection of AE events generated from the specimens [3,4]. The efficiency of the AE data acquisition parameters has been verified by pencil lead break (PLB) and auto sensor testing (AST) before the loading.

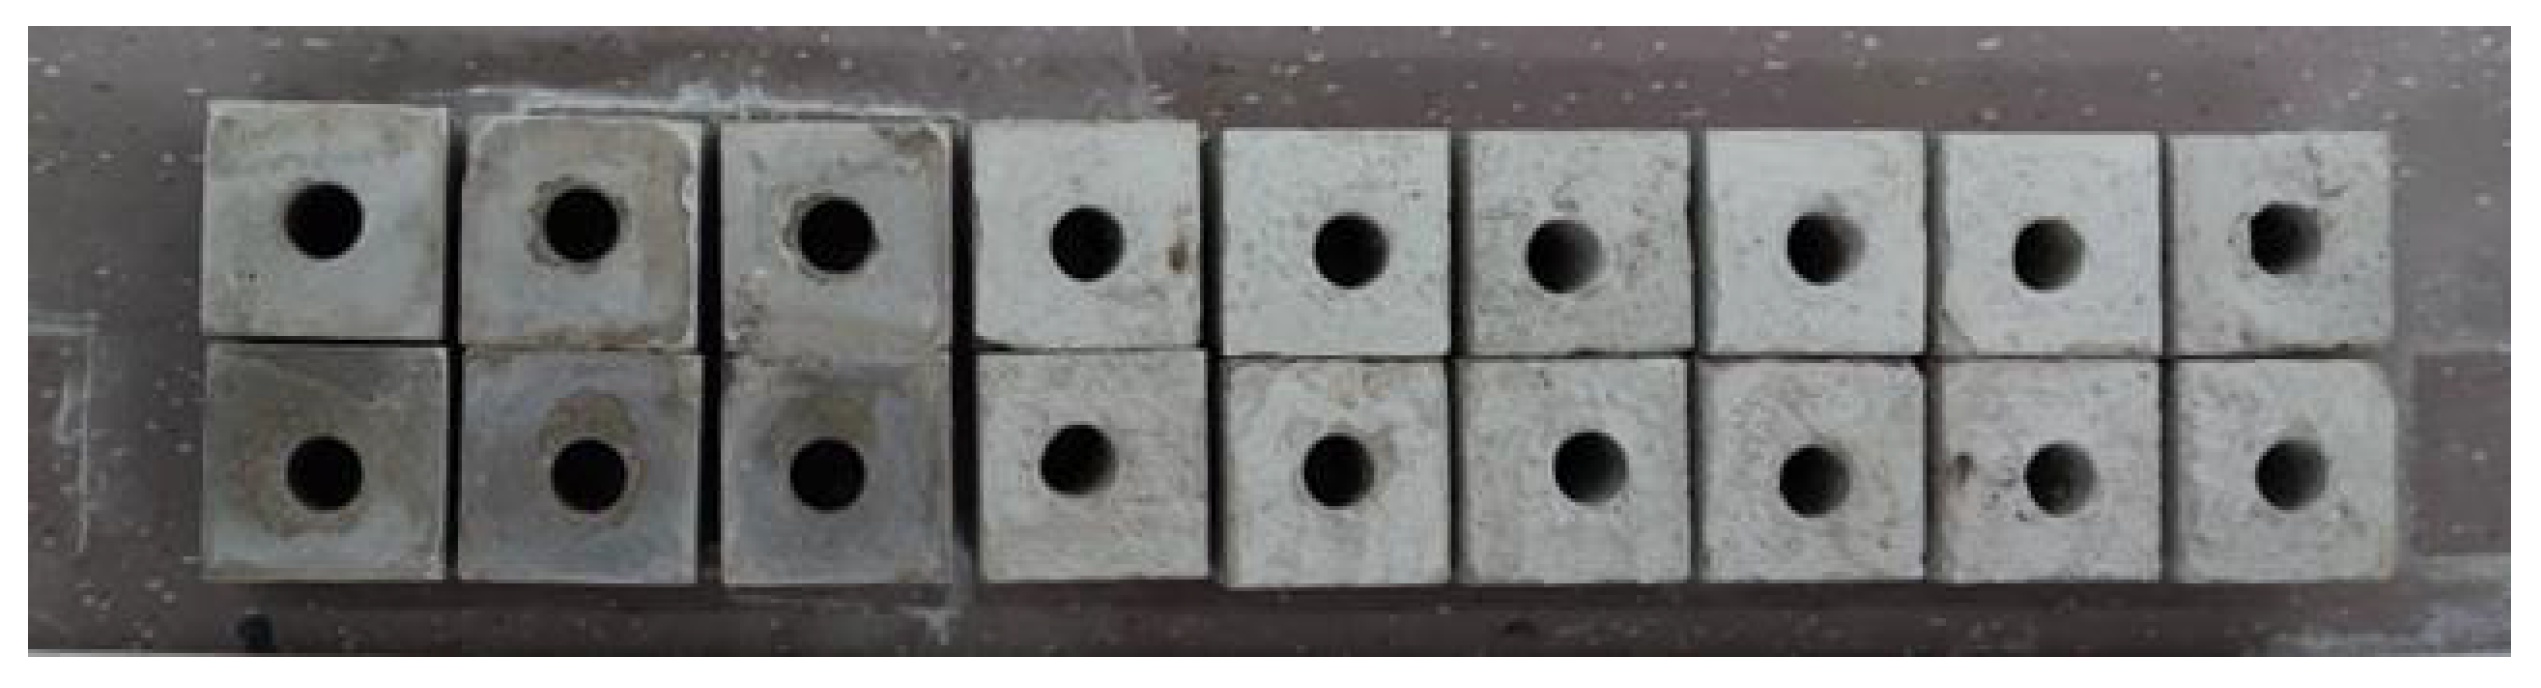
2.2. Specimen Preparation

In this study, the cube specimens with a prefabricated through-thickness hole at the center of cross section are cast with 42.5 ordinary Portland cement and quartz sand with a particle size of 0.2–0.5 mm. The sand–cement ratio is 2.5, and water–cement ratio is 0.5. In addition, the size of the cube specimen with prefabricated hole is 100 mm × 100 mm × 100 mm, and a circular hole with a diameter of 32 mm is left in the center, as shown in Figure 3. Such experimental configurations aim at simulating the deformation and damage behaviors in the surrounding rocks of the deep circular tunnels. After natural drying for 24 h, the specimens are maintained for 28 d under indoor standard conditions (room temperature: 25 ± 1 ℃, humidity: 99%).
The same materials with the same sand–cement ratio and water–cement ratio are used to prepare the standard cylinder specimens with the dimension of 100 mm (height) × 50 mm (diameter) to obtain the basic mechanical properties. The tests show that the uniaxial compression strength σ u c s of the molded specimens (loading velocity of 0.5 kN/s) reaches 21.1 MPa, elastic modulus E (obtained by the ratio of uniaxial compressive stress to longitudinal strain in the elastic stage) attains 26.57 GPa, and the density ρ is 1.96 g·cm−3. Moreover, cylinder specimens with a smaller dimension of 50 mm (height) × 50 mm (diameter) are prepared to test the tensile strength σ t in the Brazilian disc test, and the result of σ t is 2.2 MPa. The physical and mechanical parameters are presented in Table 1.

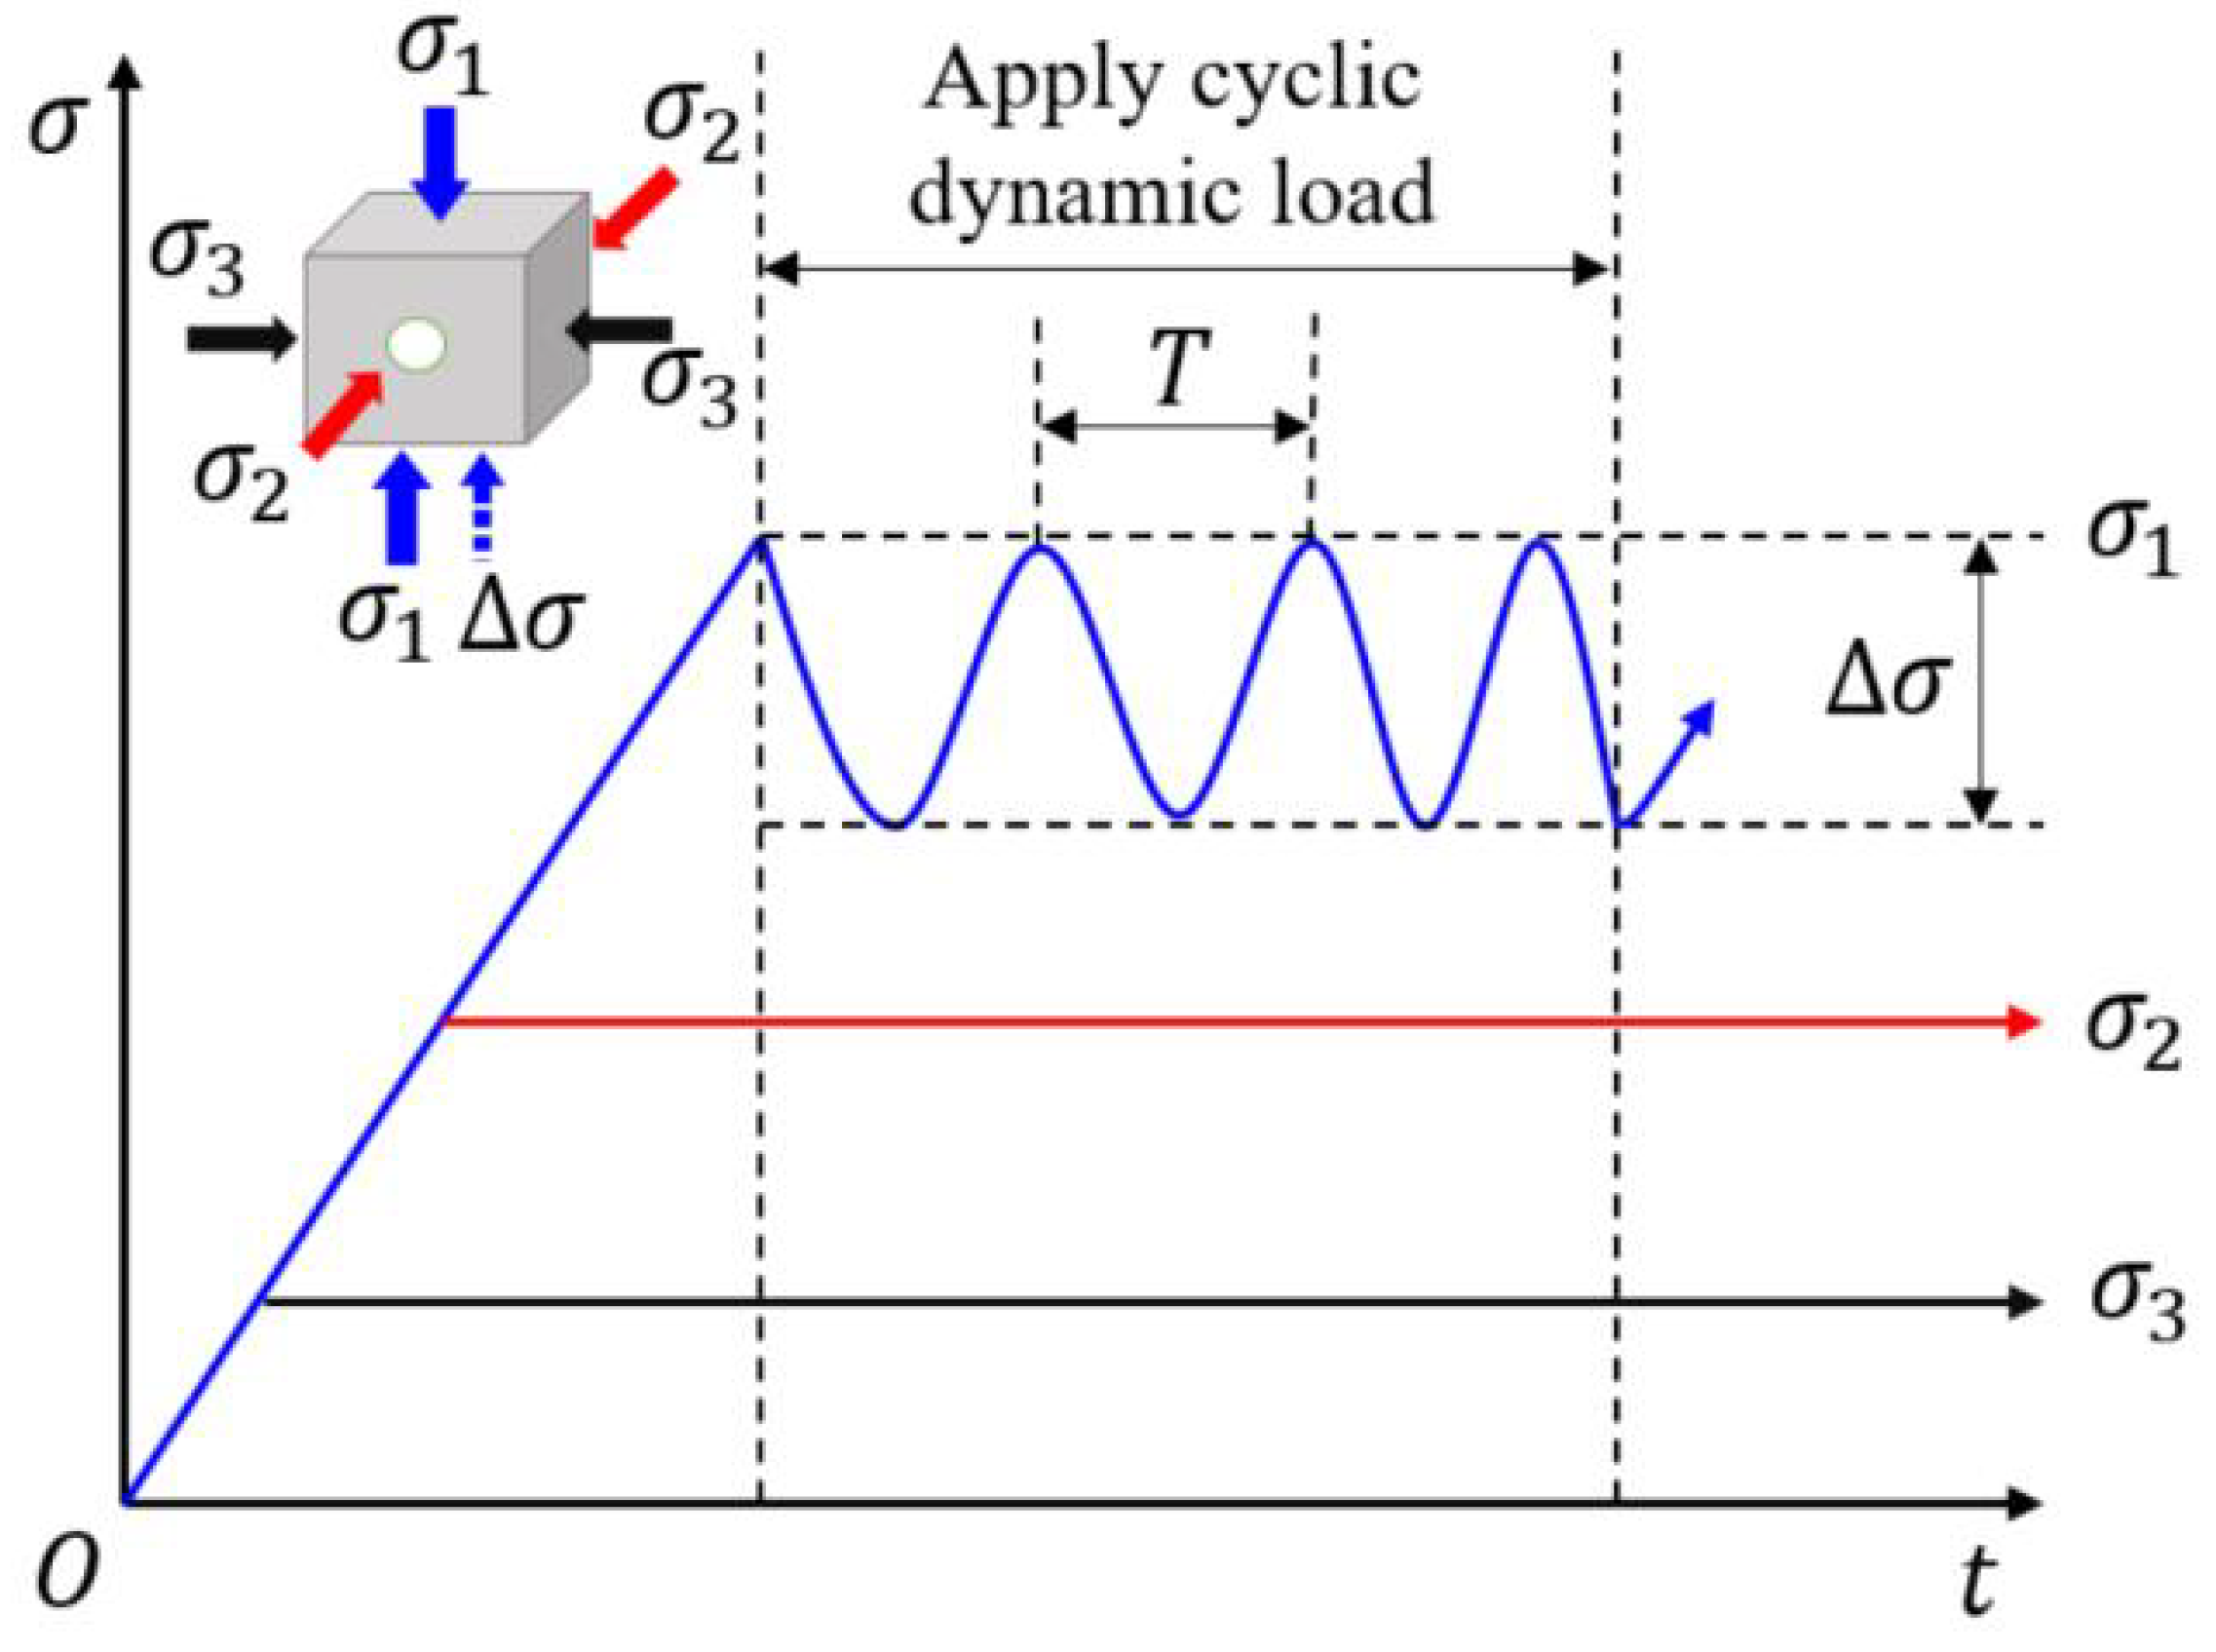
2.3. Experimental Protocol

The loading diagram is shown in Figure 4 where the vertical stress is the maximum principal stress σ 1 , the axial stress parallel to the hole axis is the intermediate principal stress σ 2 , the minimum principal stress σ 3 is along the radial direction of circular hole, and Δ σ is the amplitude of cyclic dynamic load. Herein, we consider the two important mechanical parameters namely the intermediate principal stress and the amplitude of cyclic dynamic loads. The frequency of cyclic dynamic load is set as 1.0 Hz, the amplitudes of cyclic dynamic loads are, respectively, set as 0.2 σ u c s , 0.3 σ u c s , and 0.4 σ u c s , and the intermediate principal stresses are, respectively, designed to be 0.2 σ u c s , 0.4 σ u c s , and 0.8 σ u c s . To simulate the deep high stress environment, the maximum principal stress is set to be 22 MPa (104% σ u c s ), and the minimum principal stress is set to be 2 MPa (9% σ u c s ). The loading is terminated when the stress drops to 90% of the peak stress. The details of the variables in the test are summarized in Table 2. Three specimens for each set of tests are prepared and loaded to prevent possible errors.

3. Influence of Cyclic Dynamic Load Amplitude on Failure Characteristics of Surrounding Rock

In order to compare the responses of the surrounding rock to cyclic dynamic load amplitude, the failure modes under a certain number of cycles should be targeted for the analysis. To that end, we target the number of cycles as 100 times for specimen D1 ( Δ σ = 4 MPa), 52 times for specimen D2 ( Δ σ = 6 MPa) and 33 times for specimen D3 ( Δ σ = 8 MPa).

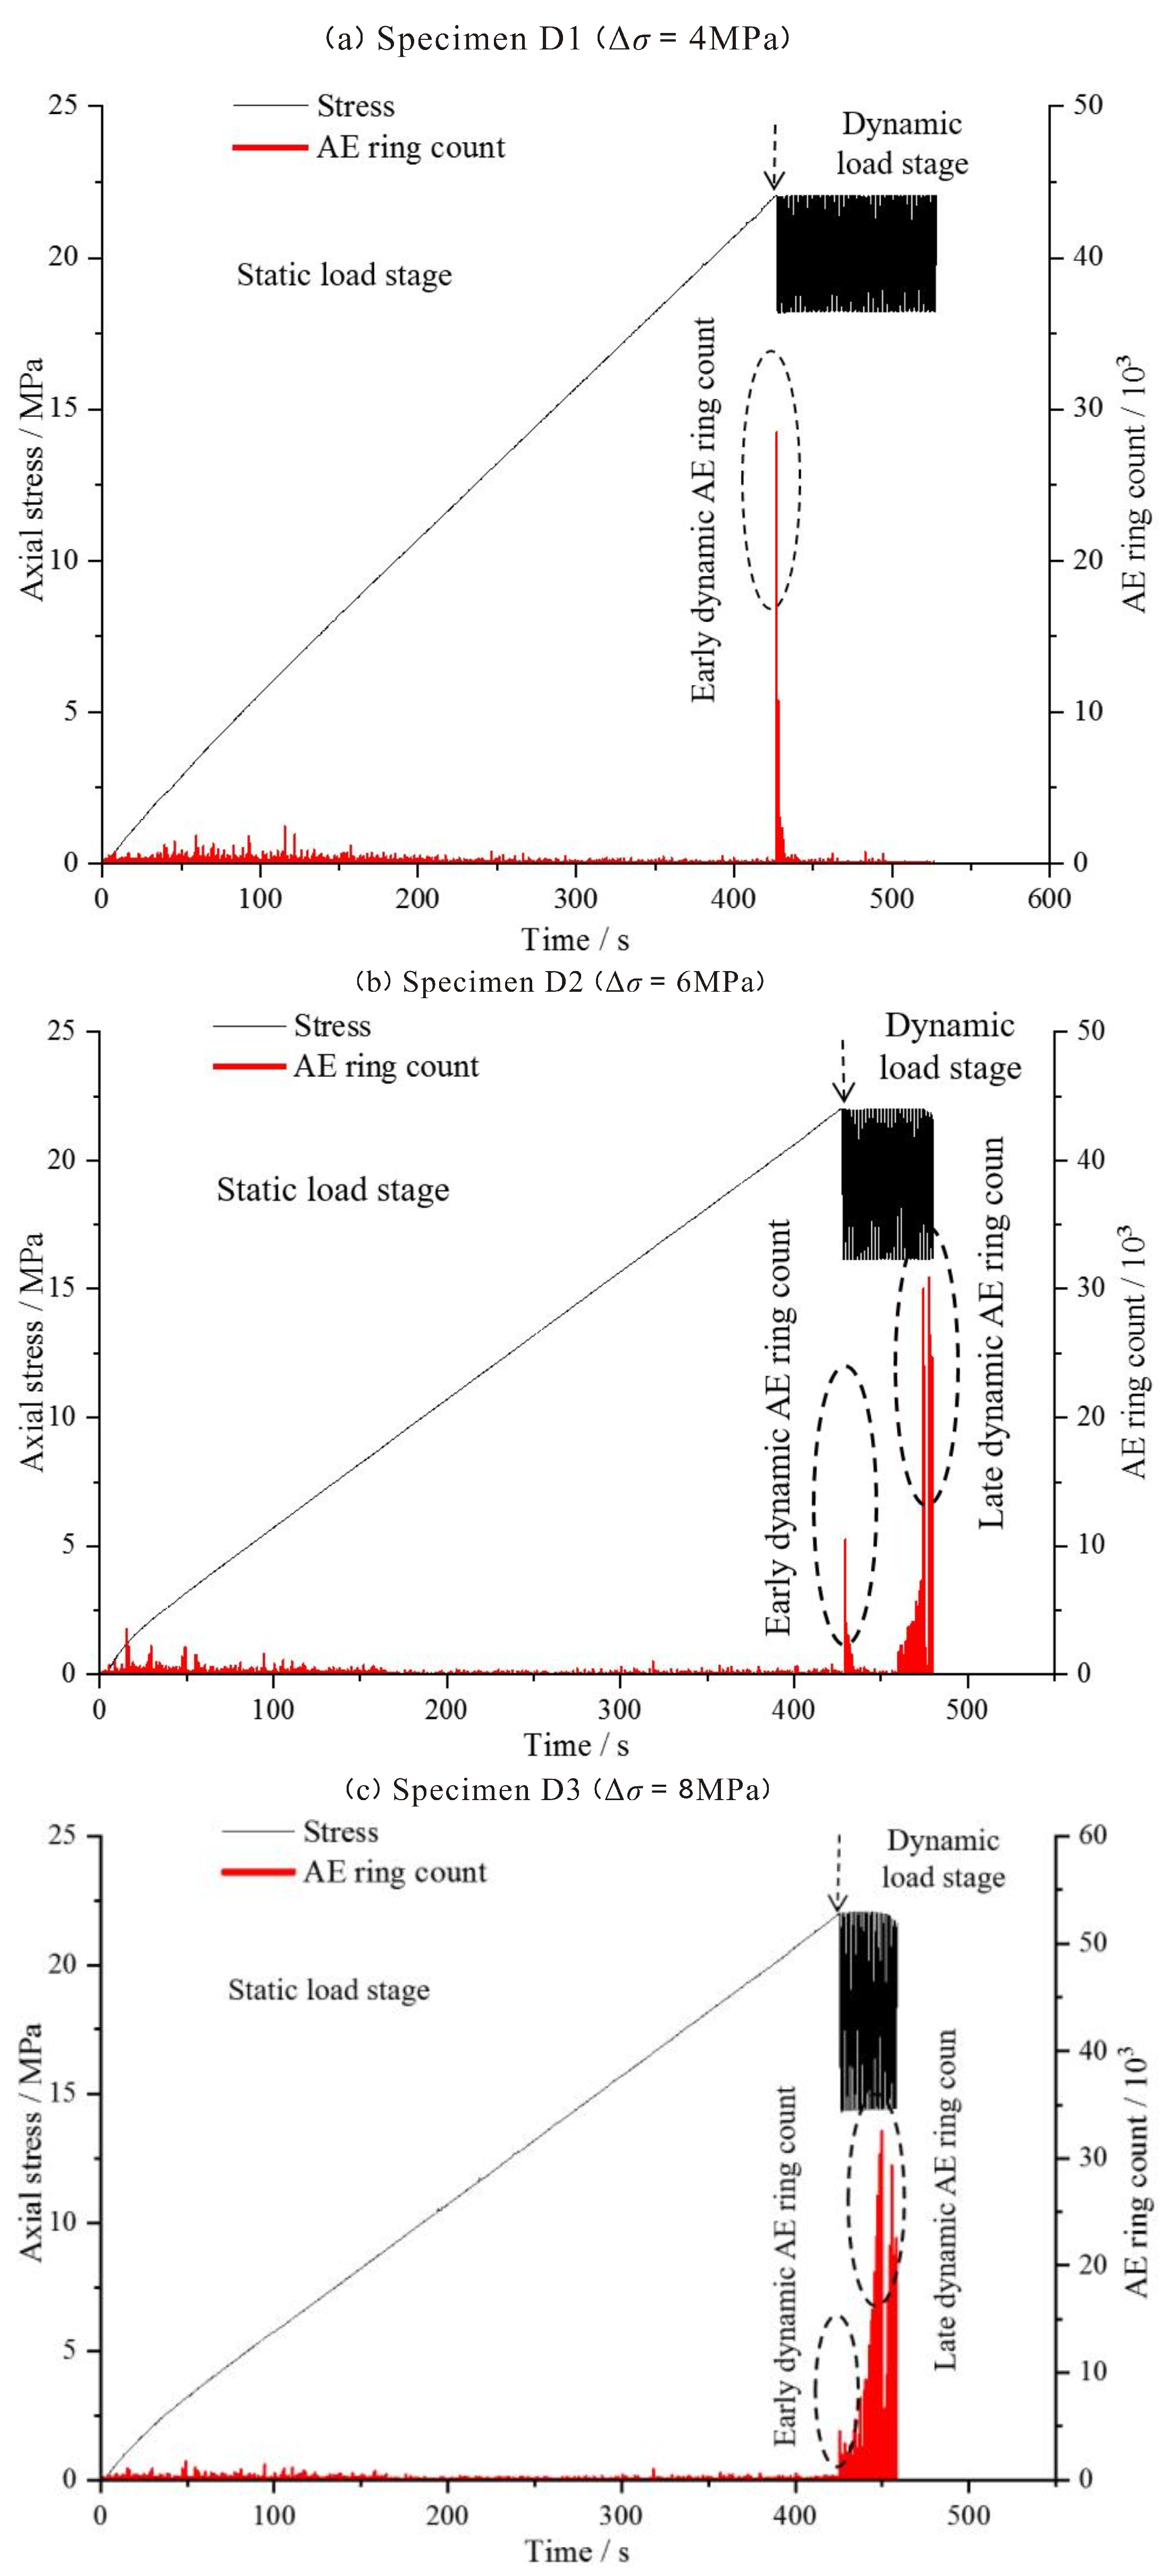
3.1. AE Characteristics

Figure 5 shows the evolutions of AE count versus time, along with the respective load induced for the specimens under different cyclic dynamic load amplitudes. Both the static loading phase and the cyclic dynamic loading phase are depicted in Figure 5. It is found that for specimen D1 (Figure 5a), the AE count dramatically increases to 28 × 103 when the cyclic dynamic load starts to be applied. In a very short time, the AE count drops rapidly until it reaches a lower level comparable to that at the static loading phase. However, no large AE events are registered after the dramatic increase in the AE count at the onset of cyclic dynamic loading. AE signals at the cyclic dynamic loading phase have a count smaller than 1 × 10³.
When Δ σ = 6 MPa (Figure 5b), the AE count of specimen D2 at the moment of entering the cyclic dynamic loading phase increases to 11 × 103. Similarly to the specimen D1, AE count drops rapidly in short order to a lower level comparable to that of the static loading phase. With the increase in the dynamic load cycles, the AE count of specimen D2 increases sharply from the 33th cycle onwards until it reaches the peak value of 31 × 103 at the 50th cycle.
When Δ σ = 8 MPa, specimen D3 also experiences an instantaneous increase in AE count (reaching 5 × 10³ approximately) at the onset of the cyclic dynamic loading phase, as depicted in Figure 5c. Different from specimens D1 and D2, the AE count generally increases with the increase in dynamic load cycles and peaks (33 × 103) at the 24th cycle. After the peak, the AE count generally remains at the high level at the cyclic dynamic loading phase relative to the static loading phase, as shown in Figure 5c.
A comparison of the AE characteristics among the specimens D1, D2, and D3 is carried out here. The results show that the AE activity at the later period of cyclic dynamic loading phase become active when the cyclic dynamic load amplitude gradually increases from 4 MPa to 6 MPa and, finally, to 8 MPa. Additionally, an interesting phenomenon can be observed from Figure 5: The AE activity at the early stage of the static loading is more severe than that at the middle and later stage. This may be attributed to the interaction between the stronger stress wave and the crack closure at the early stage of the static loading.

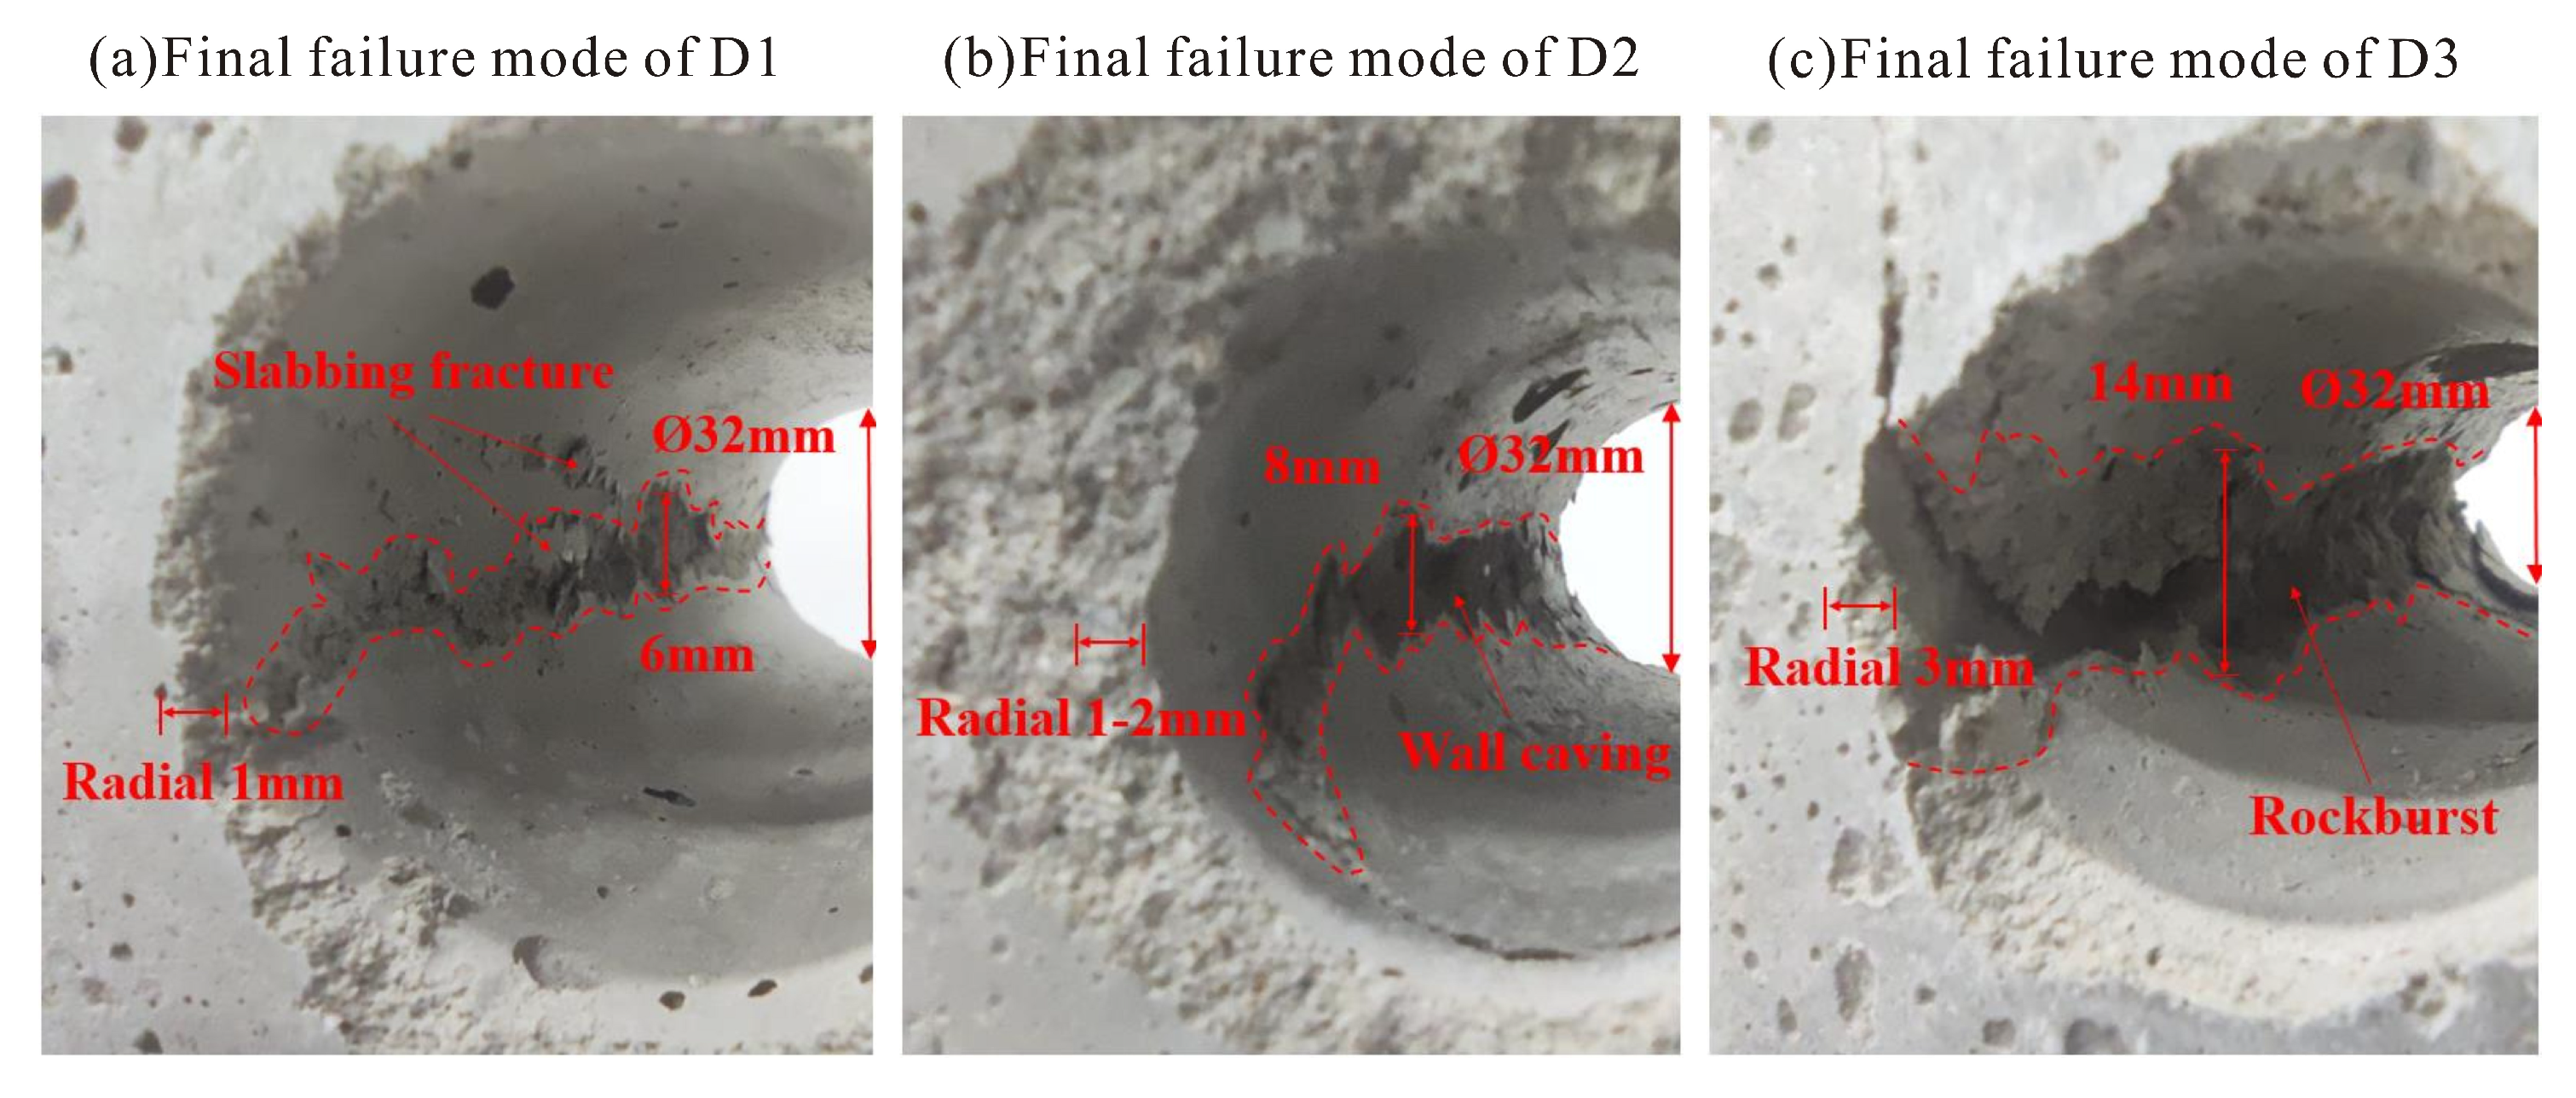
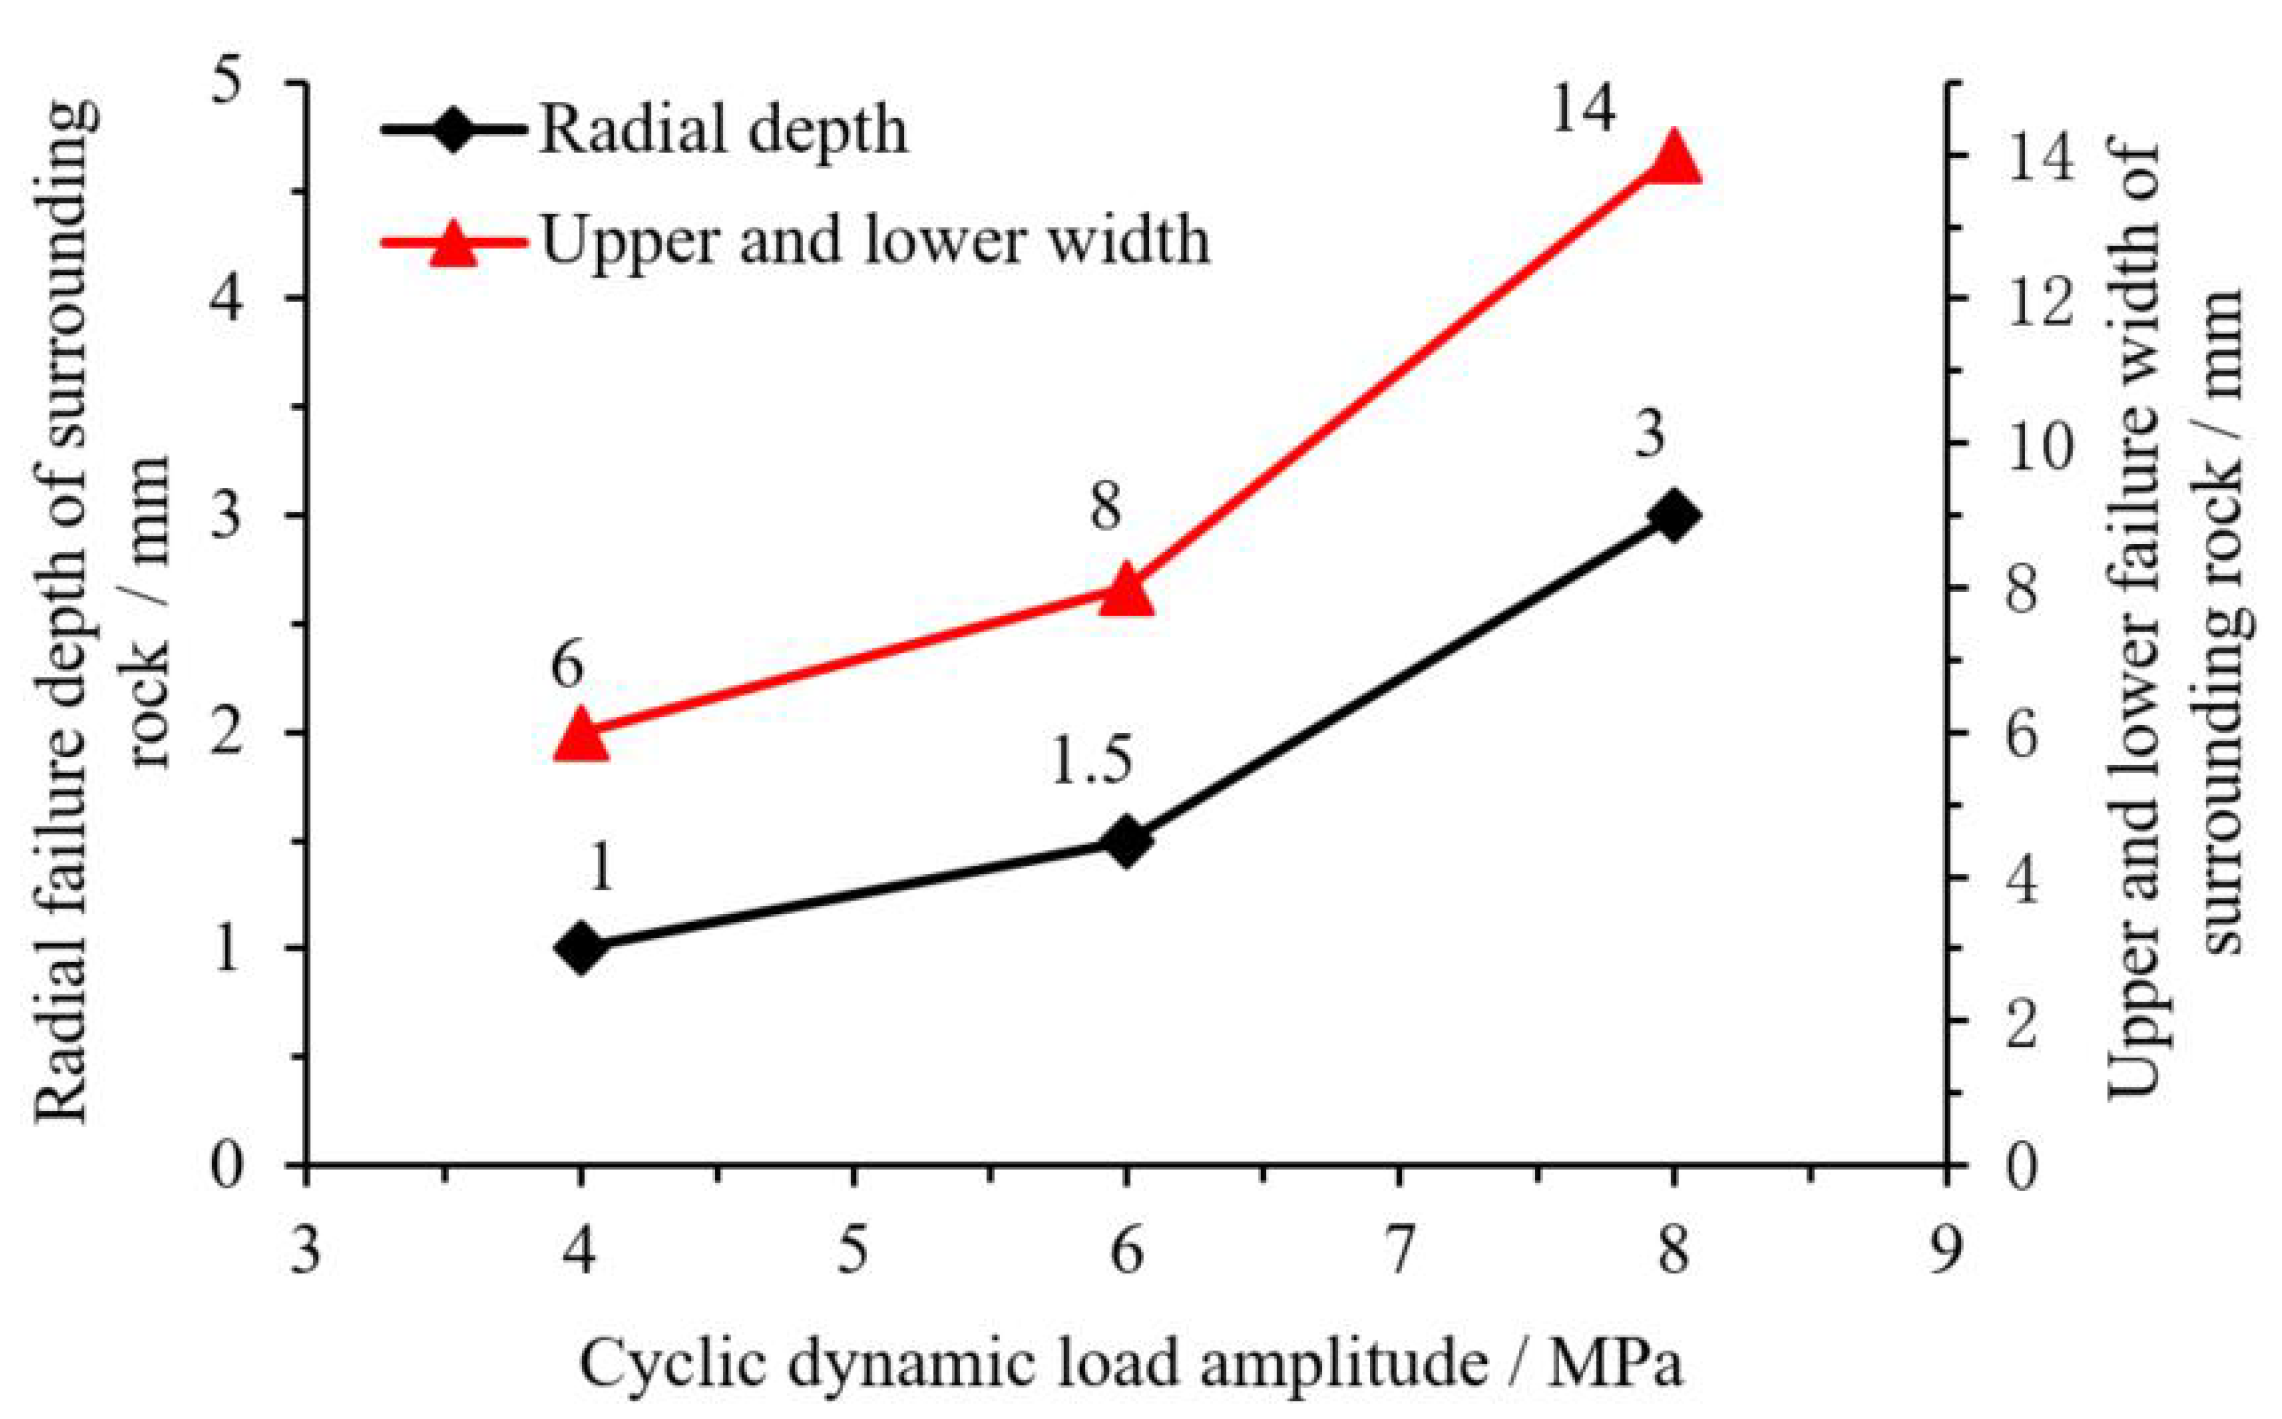
3.2. Ultimate Failure Modes of Surrounding Rocks

It is well known that when a tunnel is subjected to compressive stress, the circumferential stress in the surrounding rocks is the maximum principal stress, while the radial stress is the minimum principal stress (the null in fact) when the circular tunnel is excavated in the non-hydrostatic stress field, such as the true triaxial stress states studied in this paper. For the current study, the maximum circumferential stress occurs at the two horizontal side wall of the surrounding rock, which indicates the main sources where the failure occurs. When the axial stress is increased, the damage progression is aggravated due to the enhancement of the stress heterogeneity.
Combined with the AE signal monitoring results during cyclic dynamic loading, the failure characteristics of the surrounding rock are comprehensively analyzed.
Physical image in Figure 6a shows that the slabbing occurs at the horizontal side wall of the surrounding rock when Δ σ = 4 MPa. It is reasonably inferred that the slabbing occurs simultaneously with the dramatic increase in the AE count at the onset of cyclic dynamic loading, as depicted in Figure 5a. This deduction is strongly supported by the previous works [2,4] where it was documented that the large AE events can be triggered by large-scale failure, such as macrocrack initiation and growth. Quantitatively, the depth and width of slabbing, respectively, reaches 1 mm and 6 mm, which are approximately 3% and 19% of the hole diameter. Subsequently, the AE count gradually decreases, and there are no obvious AE signals in the late period of cyclic dynamic loading. With the increase in cyclic dynamic load amplitude, the effect of the amplitude on rock failure becomes more obvious. When Δ σ = 6 MPa, the AE count of specimen D2 increases not only at the initial stage of cyclic dynamic loading but also at the later stage. It should be said that the failure of the surrounding rock share the same physical process. Specifically, the wall caving takes place at the horizontal side wall of the surrounding rock where the maximum circumferential stress occurs, as shown in Figure 6b. The radial depth of wall caving is approximately 1–2 mm, accounting for 3–6% of the hole diameter, and the width is 8 mm, which is about 25% of the hole diameter. When cyclic dynamic load amplitude increases to Δ σ = 8 MPa (specimen D3), the AE activity is much server than that for Δ σ = 6 MPa (specimen D2). Correspondingly, the more severe failure of the specimen D3 is induced. The obvious V-shaped explosion pits are gradually formed, displaying the rockburst characteristics. The failure depth is 3 mm, accounting for 9% of the hole diameter; and the width is 14 mm, accounting for 44% of the hole diameter. At the same time, the failure is accompanied by the formation of wall caving and slabbing fractures, as shown in Figure 6c.
A quantitative characterization of the effects of cyclic dynamic load amplitude on the failure modes is shown in Figure 7. With the increase in cyclic dynamic load amplitude, both the radial depth and vertical width of the failure zones increase, and the failure patterns change from the slabbing to wall caving and finally to rockburst. In addition, the number of rock fragments increase as cyclic dynamic load amplitude increases.

4. Influence of Intermediate Principal Stress on Failure Characteristics of Surrounding Rock under Cyclic Dynamic Loading

The numbers of cycles of 27 times for specimen D4 ( σ 2 = 4 MPa), 52 times for specimen D2 ( σ 2 = 8 MPa) and 100 times for specimen D5 ( σ 2 = 16 MPa) are respectively targeted for the analysis.

4.1. AE Characteristics

Figure 8 shows the evolutions of the AE count versus time, in juxtaposition to the respective load induced for the specimens under different intermediate principal stresses. For the specimen D4, subjected to σ 2 = 4 MPa, the AE count rapidly increases to 23 × 103 when the cyclic dynamic load starts to be applied, and the AE count decreases, in turn, in the next two cycles. The AE count gradually rises from the third cycle onwards, and reaches the maximum value of 29 × 103 when the specimen begins to fail. In the second cycle after the failure, the AE count instantly reduces to 1 × 10³. At this time, the specimen experiences 27 dynamic load cycles, which is followed by the recovery of the AE count to a high level in the next three cycles.
When the intermediate principal stress increases to σ 2 = 16 MPa, the compressive strength of specimen D5 is significantly increased so that the cyclic dynamic load does not contribute to the progressive damage of the surrounding rock. It is observed that the AE count displays an instantaneous increase (about to 2 × 10³) at the onset of the cyclic dynamic loading, and then gradually decreases to a level lower than that at the static loading phase. At the cyclic dynamic loading phase, the maximum AE count does not exceed 1 × 10³.
A comparison among the data presented in Figure 5b and Figure 8 shows that the AE count exhibits an obvious decrease tendency at the cyclic dynamic loading phase with the increase in intermediate principal stress. Meanwhile, the AE activity at the early stage of the static loading is more severe than that at the middle and later stage, which may be related to the interaction between the stronger stress wave and the crack closure at the early stage of the static loading.

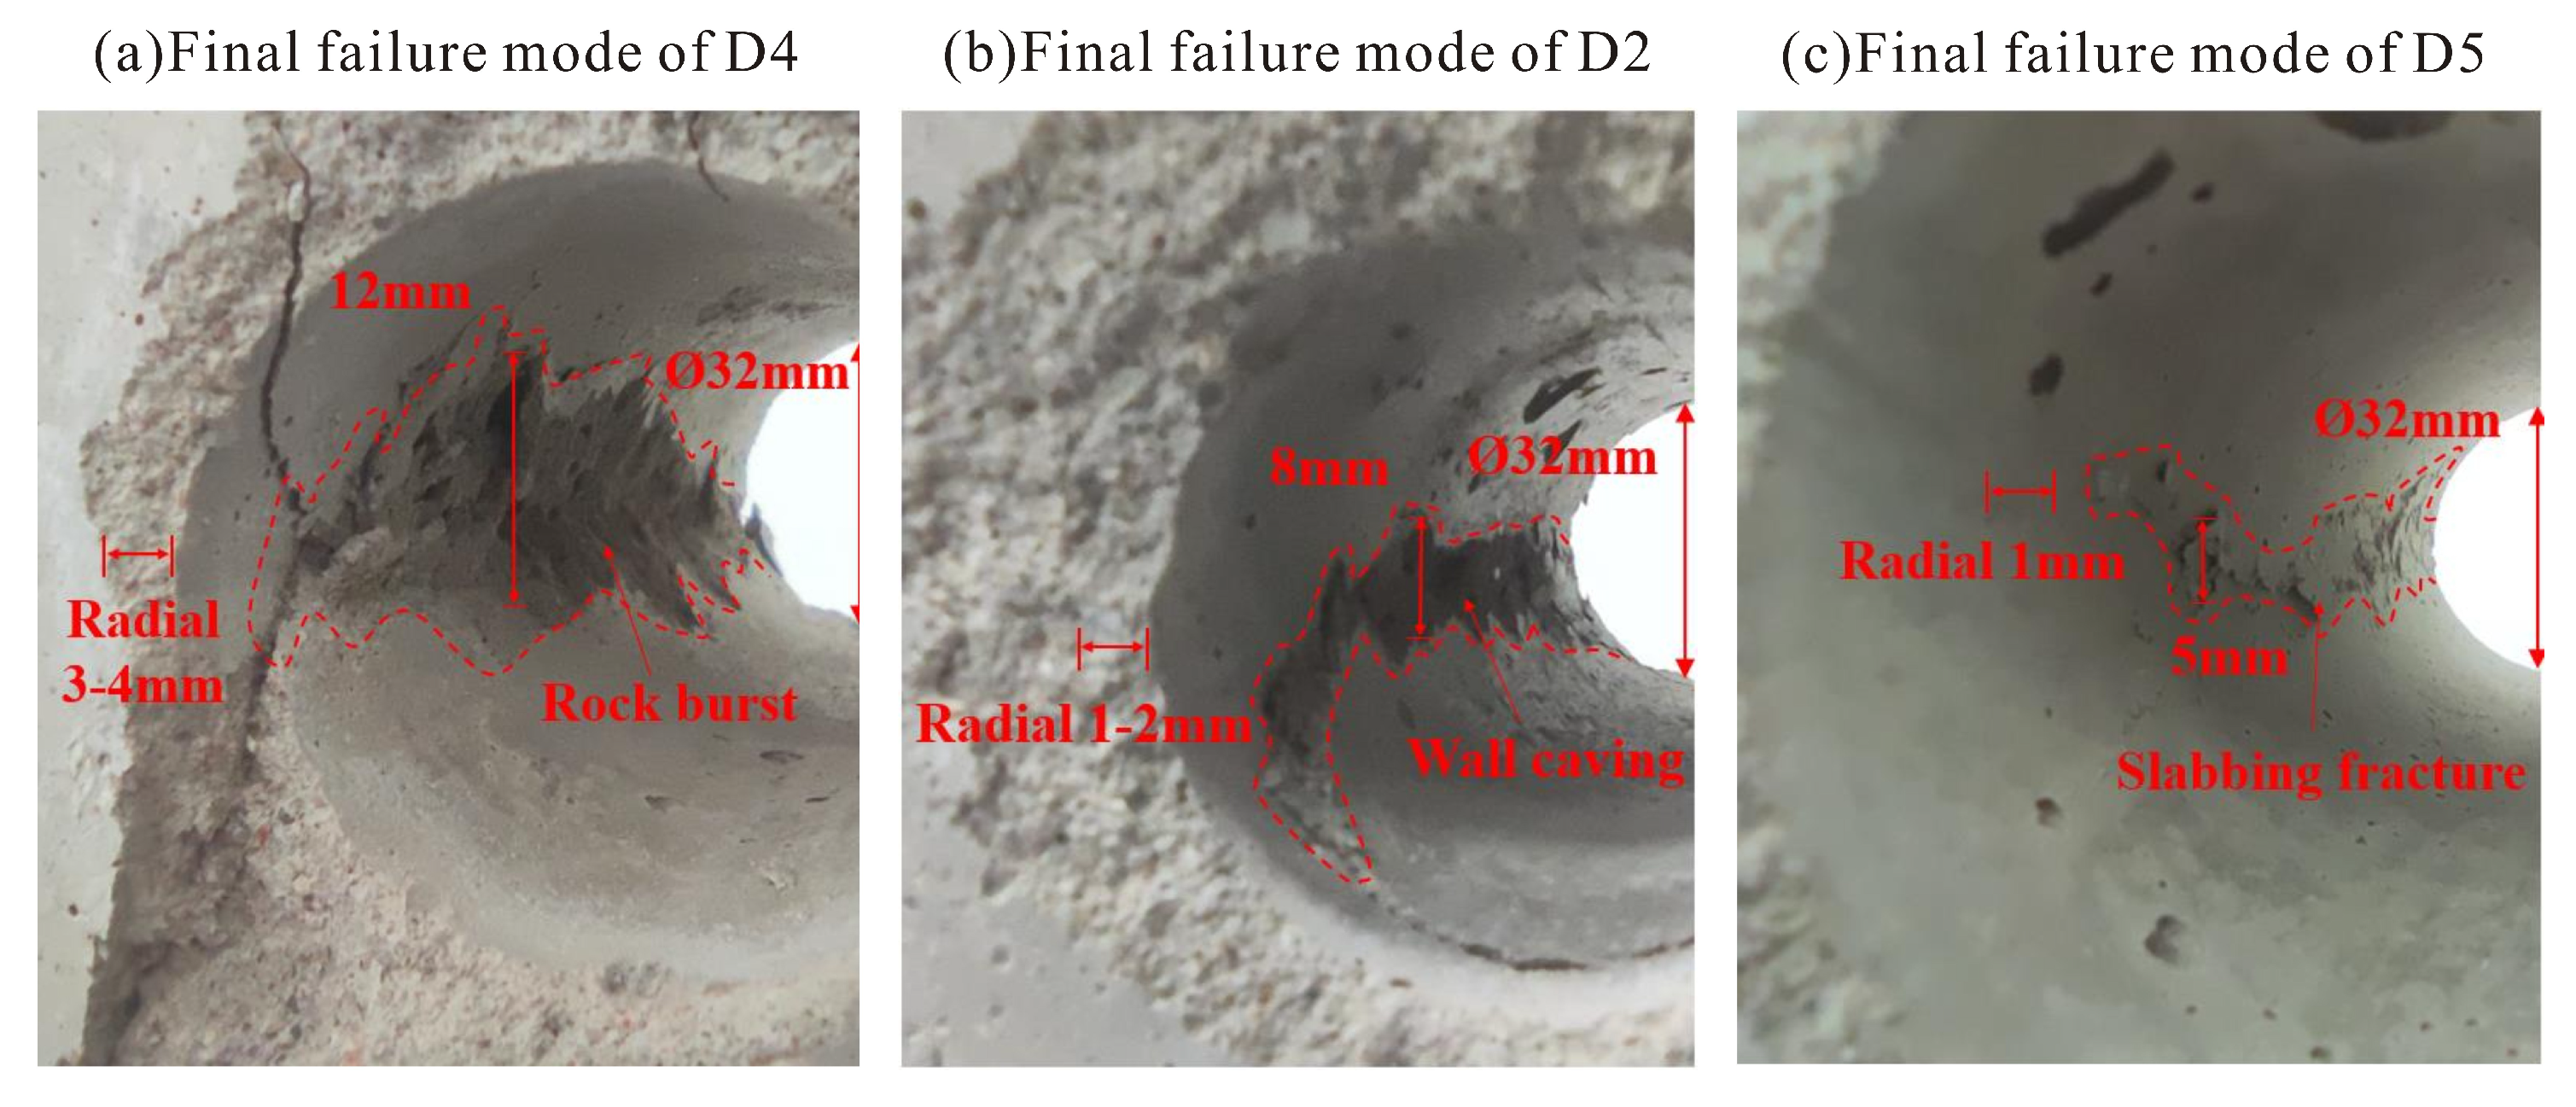
4.2. Ultimate Failure Modes of Surrounding Rocks
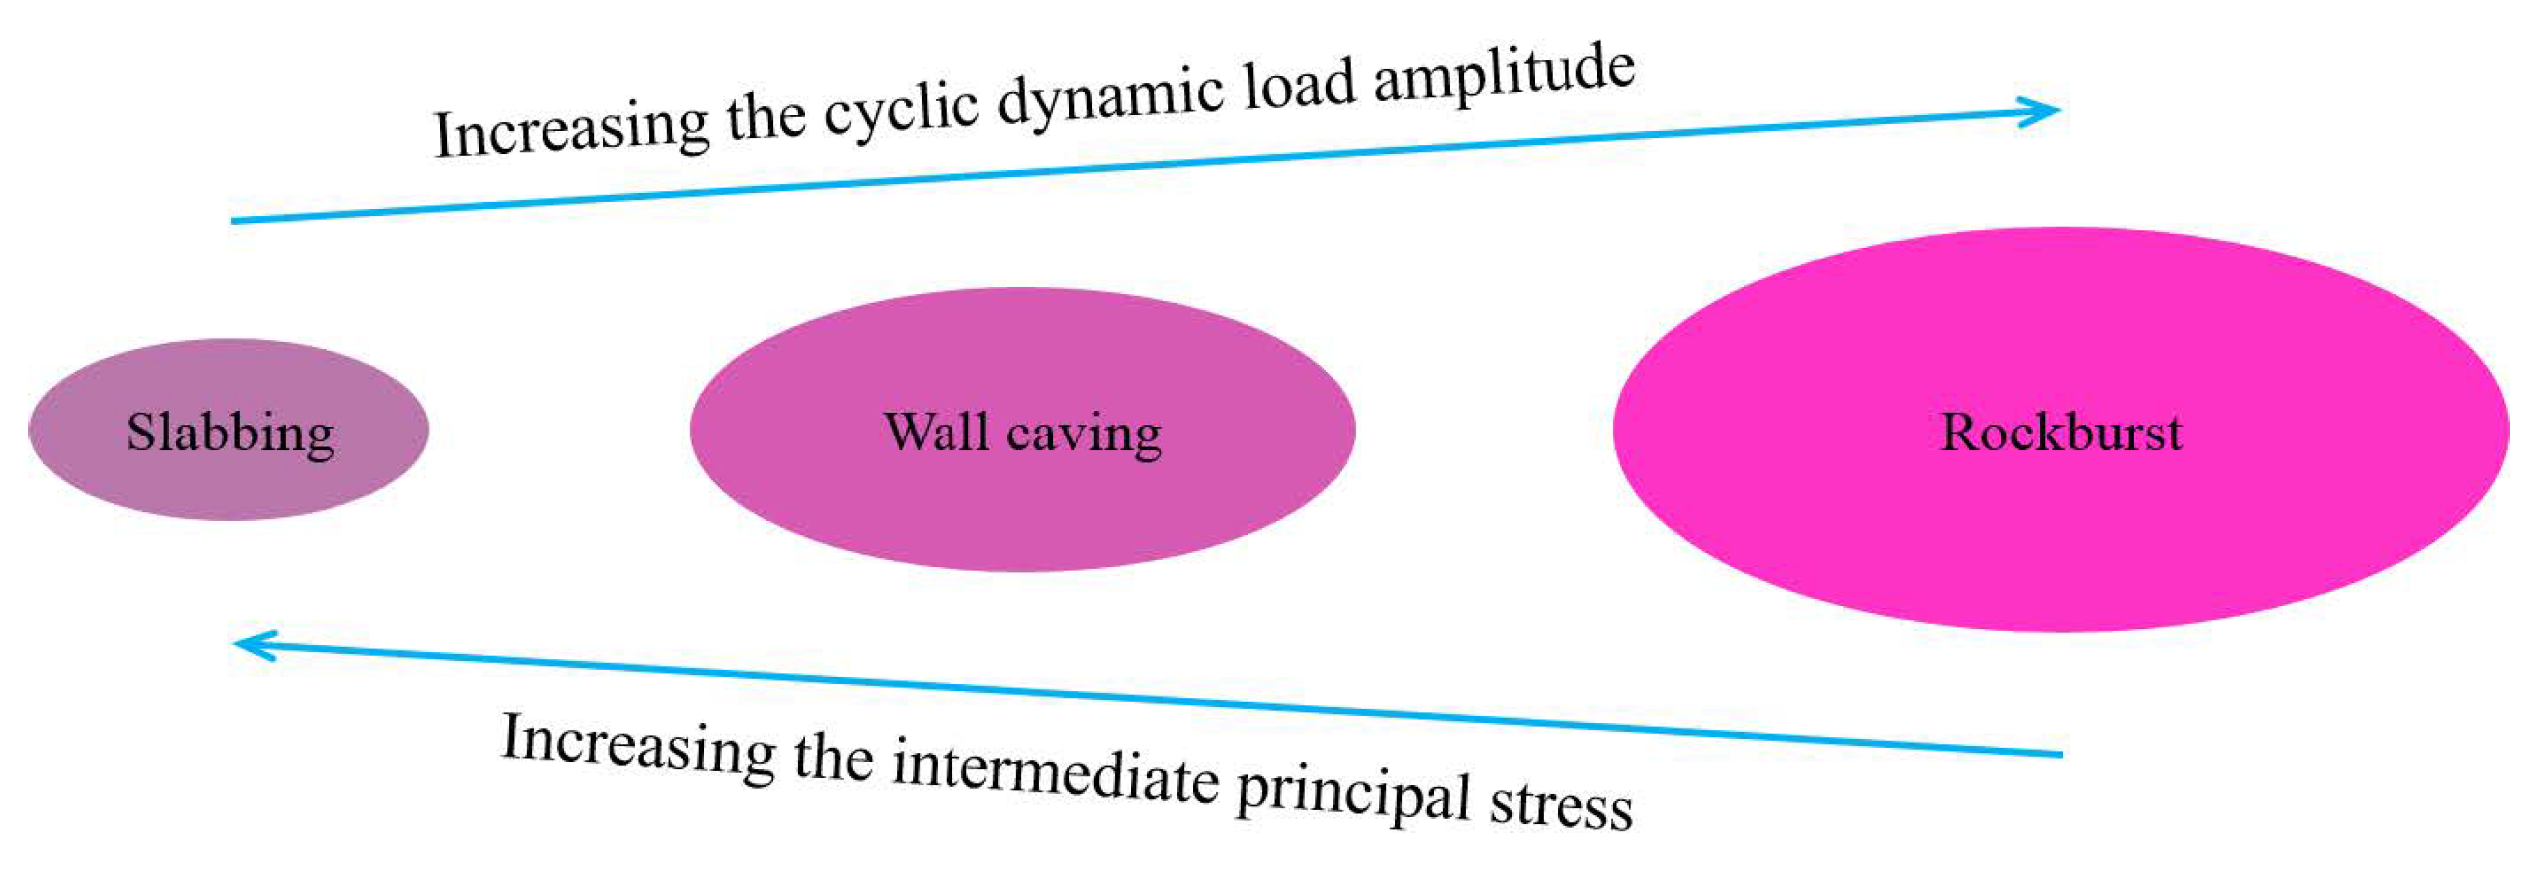
Compared with specimen D2 ( σ 2 = 8 MPa), specimen D4 ( σ 2 = 4 MPa) has a similar AE characteristic at the cyclic dynamic loading phase. The difference is that the failure of the surrounding rock is more intense for specimen D4, namely the obvious V-shaped explosion pits are gradually formed in specimen D4. The formation of V-shaped explosion pits is evident for the rockburst phenomenon, as shown in Figure 9a,b. Apart from the rockburst, wall caving is also registered simultaneously. The radial depth of the explosion pits reaches 3–4 mm, accounting for 9~13% of the hole diameter; and the maximum width attains 12 mm, accounting for 38% of the hole diameter. It can be seen that the smaller intermediate principal stress makes the surrounding rock damage more severe under the same cyclic dynamic load amplitude.
Interestingly, compared with specimen D2 ( σ 2 = 8 MPa), AE signals with a small count are commonly registered at the moment of applying the cyclic dynamic load for specimen D5 ( σ 2 = 16 MPa). There exists a relatively weak response of the surrounding rock for specimen D5 ( σ 2 = 16 MPa) to cyclic dynamic loads. In terms of specimen D5, albeit the whole structure is nearly intact and not damaged by the stress, both horizontal side walls of the hole are slightly split into plates, and the splitting depth is about 1 mm, accounting for 3% of the hole diameter, as shown in Figure 9c. Under the same conditions of cyclic dynamic load, the surrounding rock of specimen D5 finally shows the slight slabbing fracture characteristics.
Under the same cyclic dynamic load amplitude, the specimens show obvious intermediate principal stress effect at the cyclic dynamic loading phase. More specifically, with the increase in intermediate principal stress, the compressive strength of surrounding rock increases, and meanwhile the radial failure depth and vertical failure width of surrounding rock decrease, as shown in Figure 10.

5. Discussions

Experimental data and visual observations show that the slabbing and wall caving are always registered when the rockburst occurs in the modelled specimens. It is reasonably inferred that the slabbing and wall caving take place prior to the rockburst but at the same locations where the stress concentrates. The slabbing and wall caving can be regard as the precursor of the rockburst. Similarly, the slabbing can serve as the precursor for wall caving in accord with the corresponding experimental observations.
There exist the correlations of the failure modes with the incorporated parameters, i.e., the intermediate principal stress and cyclic dynamic load amplitude. Such correlations can be characterized schematically in Figure 11. The colored ellipses with different sizes denote different failure modes. When the cyclic dynamic load amplitude is relatively small, the modelled specimen fails in the mode of slabbing. Interestingly, wall caving and slabbing take place when the cyclic dynamic load amplitude increases. Reasonably, wall caving appears at a relatively large stress level when compared with the slabbing. If the stress continues to increase, the three failure modes of slabbing, wall caving, and rockburst are all produced in the modelled specimen. In this state, one can infer that the rockburst occurs at a larger stress level in relative to the slabbing and wall caving.
Speculatively, when the stress is continuously increased and uncontrolled, the surrounding rock successively experiences the slabbing and then wall caving and finally rockburst. Therefore, the slabbing serves as an important precursor for wall caving, and wall caving further serves as the precursor for rockburst. This statement is supported by the fact that the small-scale failure, such as the microcrack initiation, and growth is indicative of the approach to the macrofracturing [3,4,8]. Based on such mechanisms, the precursor can be indirectly detected in forms of acoustic emission, which is released by microcracking. Precursory AE time series detected during the microcracking stage can be faithfully used to forecast the larger-scale failure. This is the important implication of the experimental results in the present study.
At present, the deficiencies of this work mainly lie in that the size of the cube sample is small, and the center of the hole is close to the edge of the cube sample. So the results may be affected by the size effect. Only the AE ringing count is considered to analyze AE signal characteristics, and AE amplitude, energy, and other indicators can be used to study the damage process at a later stage. In the future, larger size models should be considered to test, and not only the circular cavern, but also the failure characteristics of straight wall and semicircular arch, three-center arched cavern, and different forms of cross section are also worthy of study. During the experiment process, three-dimensional AE positioning and micro-camera need to be used to monitor and record the damage location and energy characteristics in real time. Further, the laboratory results will be analyzed combining with failure criteria or numerical modelling.

6. Conclusions

Assisted by AE signal monitoring, true triaxial dynamic, and static loading tests were applied to cube specimens with circular holes inside. Several conclusions can be drawn from the results described above.
With the increase in cyclic dynamic load amplitude, the failure source occurs at the two horizontal side wall of the surrounding rock where the failure patterns change from the slabbing to wall caving and finally to rockburst. Correspondingly, the AE activity at the later period of cyclic dynamic loading phase become active gradually.
The smaller intermediate principal stress makes the surrounding rock damage more severe under the same cyclic dynamic load amplitude. Similarly, AE count exhibits an obvious increase in tendency at the cyclic dynamic loading phase.
The slabbing and wall caving can be regarded as the precursor of the rockburst. Precursory AE time series detected during the microcracking stage can be faithfully used to forecast the larger-scale failure, such as rockburst.

Author Contributions

Conceptualization and methodology, B.L. and Y.C.; validation, formal analysis, investigation, B.L., P.G., and S.Z.; Data curation, P.G.; writing—original draft preparation, P.G. and W.G.; writing—review and editing, W.G., Y.C., and J.Z.; visualization, P.G., W.G., and J.Z.; supervision and project administration, Y.C.; funding acquisition, Y.C. All authors have read and agreed to the published version of the manuscript.

Funding

This research was funded by the Natural Science Foundation of Fujian Province of China (Grant No. 2019J05036), and by the Geological Research Project of Bureau of Geology and Mineral Exploration and Development Guizhou Geological of China (Grant No. Qiandikuang Kehe [2020] No.1.)

Data Availability Statement

The data used to support the findings of this study are available from the corresponding author upon request.

Conflicts of Interest

The authors declare no conflict of interest.

Abbreviations

The following abbreviations are used in this manuscript:
AEAcoustic emission;
PDTPeak definition time;
HDTHit definition time;
HLTHit lockout time;

References

  1. Zhang, J.Z.; Zhou, X.P.; Zhou, L.S.; Berto, F. Progressive failure of brittle rocks with non-isometric flaws: Insights from acousto-optic-mechanical (AOM) data. Fatigue Fract. Eng. Mater. Struct. 2019, 42, 1787–1802. [Google Scholar] [CrossRef]
  2. Zhang, J.Z. A Study of the Failure Process in Brittle Awed Rocks and Geophysical Failure Forecast by Integrated Acousto-Optical Data. Ph.D. Thesis, Chongqing University, Chongqing, China, 2020. [Google Scholar]
  3. Zhang, J.Z.; Zhou, X.P. Forecasting catastrophic rupture in brittle rocks using precursory AE time series. J. Geophys. Res. Solid Earth 2020, 125, e2019JB019276. [Google Scholar] [CrossRef]
  4. Zhang, J.Z.; Zhou, X.P. AE event rate characteristics of flawed granite: From damage stress to ultimate failure. Geophys. J. Int. 2020, 222, 795–814. [Google Scholar] [CrossRef]
  5. Zhou, X.P.; Zhang, J.Z.; Qian, Q.H.; Niu, Y. Experimental investigation of progressive cracking processes in granite under uniaxial loading using digital imaging and ae techniques. J. Struct. Geol. 2019, 126, 129–145. [Google Scholar] [CrossRef]
  6. Li, L.P.; Hu, J.; Li, S.C.; Qin, C.S.; Liu, H.L.; Chen, D.Y.; Wang, J. Development of a novel triaxial rock testing method based on biaxial test apparatus and its application. Rock Mech. Rock Eng. 2021, 54, 1597–1607. [Google Scholar] [CrossRef]
  7. Li, L.P.; Shang, C.S.; Chu, K.W.; Zhou, Z.Q.; Song, S.G.; Liu, Z.H.; Chen, Y.H. Large-scale geo-mechanical model tests for stability assessment of super-large cross-section tunnel. Tunn. Undergr. Space Technol. 2021, 109, 103756. [Google Scholar] [CrossRef]
  8. Zhou, X.P.; Zhang, J.Z. Damage progression and acoustic emission in brittle failure of granite and sandstone. Int. J. Rock Mech. Min. Sci. 2021, 143, 104789. [Google Scholar] [CrossRef]
  9. Fan, Y.; Jiang, L.; Lu, W.B.; Zhou, Y.H.; Zhao, C.J.; Yan, P. Strain energy characteristics of surrounding rock under blasting load and transient release of geostress during excavation of circular tunnel. Chin. J. Rock Mech. Eng. 2017, 36, 1855–1866. [Google Scholar]
  10. Thongraksa, A.; Punya-in, Y.; Jongpradist, P.; Kim, H.M.; Jamsawang, P. Failure behaviors of rock masses around highly pressurized cavern: Initiation and modes of failure. Tunn. Undergr. Space Technol. 2021, 115, 104058. [Google Scholar] [CrossRef]
  11. Barla, M. Numerical simulation of the swelling behaviour around tunnels based on special triaxial tests. Tunn. Undergr. Space Technol. 2008, 23, 508–521. [Google Scholar] [CrossRef]
  12. Wang, S.Y.; Sloan, S.W.; Tang, C.A.; Zhu, W.C. Numerical simulation of the failure mechanism of circular tunnels in transversely isotropic rock masses. Tunn. Undergr. Space Technol. 2012, 32, 231–244. [Google Scholar] [CrossRef]
  13. Li, S.J.; Feng, X.T.; Li, Z.H.; Chen, B.R.; Jiang, Q.; Wu, S.Y.; Hu, B.; Xu, J.S. In situ experiments on width and evolution characteristics of excavation damaged zone in deeply buried tunnels. Sci. China Technol. Sci. 2011, 54, 167–174. [Google Scholar] [CrossRef]
  14. Feng, X.T.; Chen, B.R.; Ming, H.J.; Wu, S.Y.; Xiao, Y.X.; Feng, G.L.; Zhou, H.; Qiu, S.L. Evolution law and mechanism of rock bursts in deep tunnels: Immediate rockburst. Chin. J. Rock Mech. Eng. 2012, 31, 433–444. [Google Scholar]
  15. Dai, B.; Luo, X.Y.; Chen, L.; Tian, Y.K.; Zhang, Z.J.; Chen, Y.; Shan, Q.W. Analysis of the damage characteristics and energy dissipation of rocks with a vertical hole under cyclic impact loads. Adv. Civ. Eng. 2020, 2020, 13. [Google Scholar] [CrossRef]
  16. Cheon, D.S.; Jeon, S.; Park, C.; Song, W.K.; Park, E.S. Characterization of brittle failure using physical model experiments under polyaxial stress conditions. Int. J. Rock Mech. Min. Sci. 2011, 48, 152–160. [Google Scholar] [CrossRef]
  17. Hu, X.C.; Su, G.S.; Chen, G.Y.; Mei, S.M.; Feng, X.T.; Mei, G.X.; Huang, X.H. Experiment on rockburst process of borehole and its acoustic emission characteristics. Rock Mech. Rock Eng. 2019, 52, 783–802. [Google Scholar] [CrossRef]
  18. Dresen, G.; Stanchits, S.; Rybacki, E. Borehole breakout evolution through acoustic emission location analysis. Int. J. Rock Mech. Min. Sci. 2010, 47, 426–435. [Google Scholar] [CrossRef]
  19. Zhao, H.G.; Liu, C.; Huang, G.; Yu, B.C.; Liu, Y.B.; Song, Z.L. Experimental investigation on rockburst process and failure characteristics in trapezoidal tunnel under different lateral stresses. Constr. Build Mater. 2020, 259, 119530. [Google Scholar] [CrossRef]
  20. Hou, G.Y.; Jing, H.Y.; Liang, J.P.; Tan, J.P.; Zhang, Y.K.; Yang, X.; Xie, X. Experimental study on surrounding rock deformation and acoustic emission characteristics of rectangular roadway under different loads. Rock Soil Mech. 2020, 41, 1818–1828. [Google Scholar]
  21. Zhu, G.Q.; Feng, X.T.; Zhou, Y.Y.; Li, Z.W.; Fu, L.J.; Xiong, Y.R. Physical model experimental study on spalling failure around a tunnel insynthetic marble. Rock Mech. Rock Eng. 2020, 53, 909–926. [Google Scholar] [CrossRef]
  22. Kamata, H.; Mashimo, H. Centrifuge model test of tunnel face reinforcement by bolting. Tunn. Undergr. Space Technol. 2003, 18, 205–212. [Google Scholar] [CrossRef]
  23. Sagong, M.; Park, D.; Yoo, J.; Lee, J.S. Experimental and numerical analyses of an opening in a jointed rock mass under biaxial compression. Int. J. Rock Mech. Min. Sci. 2011, 48, 1055–1067. [Google Scholar] [CrossRef]
  24. Hidalgo, K.P.; Nordlund, E. Failure process analysis of spalling failure—Comparison of laboratory test and numerical modelling data. Tunn. Undergr. Space Technol. 2012, 32, 66–77. [Google Scholar] [CrossRef]
  25. Zhong, Z.B.; Deng, R.G.; Lv, L.; Fu, X.M.; Yu, J. Fracture mechanism of naturally cracked rock around an inverted u-shaped opening in a biaxial compression test. Int. J. Rock Mech. Min. Sci. 2018, 103, 242–253. [Google Scholar] [CrossRef]
  26. Mishra, S.; Kumar, A.; Rao, K.; Gupta, N. Experimental and numerical investigation of the dynamic response of tunnel in soft rocks. Structures 2021, 29, 2162–2173. [Google Scholar] [CrossRef]
  27. Luo, D.; Su, G.; Zhang, G. True-triaxial experimental study on mechan-ical behaviours and acoustic emission characteristics of dynamicallyinduced rock failure. Rock Mech. Rock Eng. 2020, 53, 1205–1223. [Google Scholar] [CrossRef]
  28. Gong, F.Q.; Luo, Y.; Li, X.B.; Si, X.F.; Tao, M. Experimental simulation investigation on rockburst induced by spalling failure in deep circular tunnels. Tunn. Undergr. Space Technol. 2018, 81, 413–427. [Google Scholar] [CrossRef]
  29. Si, X.F.; Huang, L.Q.; Gong, F.Q.; Liu, X.L.; Li, X.B. Experimental investigation on influence of loading rate on rockburst in deepcircular tunnel under true-triaxial stress condition. J. Cent. South Univ. 2020, 27, 2914–2929. [Google Scholar] [CrossRef]
  30. Luo, Y.; Gong, F.Q.; Li, X.B.; Wang, S.Y. Experimental simulation inves-tigation of influence of depth on spalling characteristics in circular hardrock tunnel. J. Cent. South Univ. 2020, 27, 891–910. [Google Scholar] [CrossRef]
  31. Zhang, Q.Y.; Li, F.; Duan, K.; Yu, G.Y.; Cheng, L.; Guo, X. Experimental investigation on splitting failure of high sidewall cavern under three-dimensional high in-situ stress. Tunn. Undergr. Space Technol. 2021, 108, 103725. [Google Scholar] [CrossRef]
  32. Zhang, S.R.; Sun, B.; Wang, C.; Yan, L. Influence of intermediate principal stress on failure mechanism of hard rock with a pre-existing circular opening. J. Cent. South Univ. 2014, 21, 1571–1582. [Google Scholar] [CrossRef]
  33. Mei, S.M.; HU, X.C.; Su, G.S.; Chen, G.Y. Model test study of the influence of intermediate principal stress on rockburst in tunnel. Rock Soil Mech. 2019, 40, 3959–3968. [Google Scholar]
  34. Aggelis, D.; Mpalaskas, A.; Matikas, T. Investigation of different fracture modes in cement-based materials by acoustic emission. Cem. Concr. Res. 2013, 48, 1–8. [Google Scholar] [CrossRef]
Figure 1. Test system.
Minerals 12 00134 g001
Figure 2. True triaxial specimen box.
Minerals 12 00134 g002
Figure 3. Cube specimen with prefabricated hole inside.
Minerals 12 00134 g003
Figure 4. Schematic diagram of cyclic dynamic load path.
Minerals 12 00134 g004
Figure 5. Evolutions of AE count versus time, in juxtaposition to the respective load induced for the specimens under different cyclic dynamic load amplitudes: (a) Specimen D1 ( Δ σ = 4 MPa), (b) Specimen D2 ( Δ σ = 6 MPa), and (c) Specimen D3 ( Δ σ = 8 MPa).
Minerals 12 00134 g005
Figure 6. Final failure modes of surrounding rock under different cyclic dynamic load amplitudes.
Minerals 12 00134 g006
Figure 7. Failure of surrounding rock under different cyclic dynamic load amplitudes.
Minerals 12 00134 g007
Figure 8. Evolution of AE count versus time, in juxtaposition to the respective load induced for the specimens under different intermediate principal stresses: (a) Specimen D4 ( σ 2 = 4 MPa), (b) Specimen D5 ( σ 2 = 16 MPa). Specimen D2 ( σ 2 = 8 MPa) is also analyzed in this subsection, the data of which have been shown in Figure 5b.
Minerals 12 00134 g008
Figure 9. Final failure modes of surrounding rock under different intermediate principal stresses.
Minerals 12 00134 g009
Figure 10. Failure of surrounding rock under different intermediate principal stresses.
Minerals 12 00134 g010
Figure 11. Correlations of the failure modes with the intermediate principal stress and cyclic dynamic load amplitude.
Minerals 12 00134 g011
Table 1. Main mechanical parameters of the specimen.
Type σ ucs /MPa σ t /MPa ρ /(g·cm−3)E/GPa
Model material21.12.21.9626.57
Table 2. Details of the variables in the test.
Static LoadCyclic Dynamic Load
No. σ 1 /MPa σ 2 /MPa σ 3 /MPa Δ σ /MPaf/Hz
D1228241
D2228261
D3228281
D4224261
D52216261
Publisher’s Note: MDPI stays neutral with regard to jurisdictional claims in published maps and institutional affiliations.

