
Depositional Setting of Archean BIFs from Congo: New Insight into Under-Investigated Occurrences

 ,
,  ,
,
Abstract
:1. Introduction
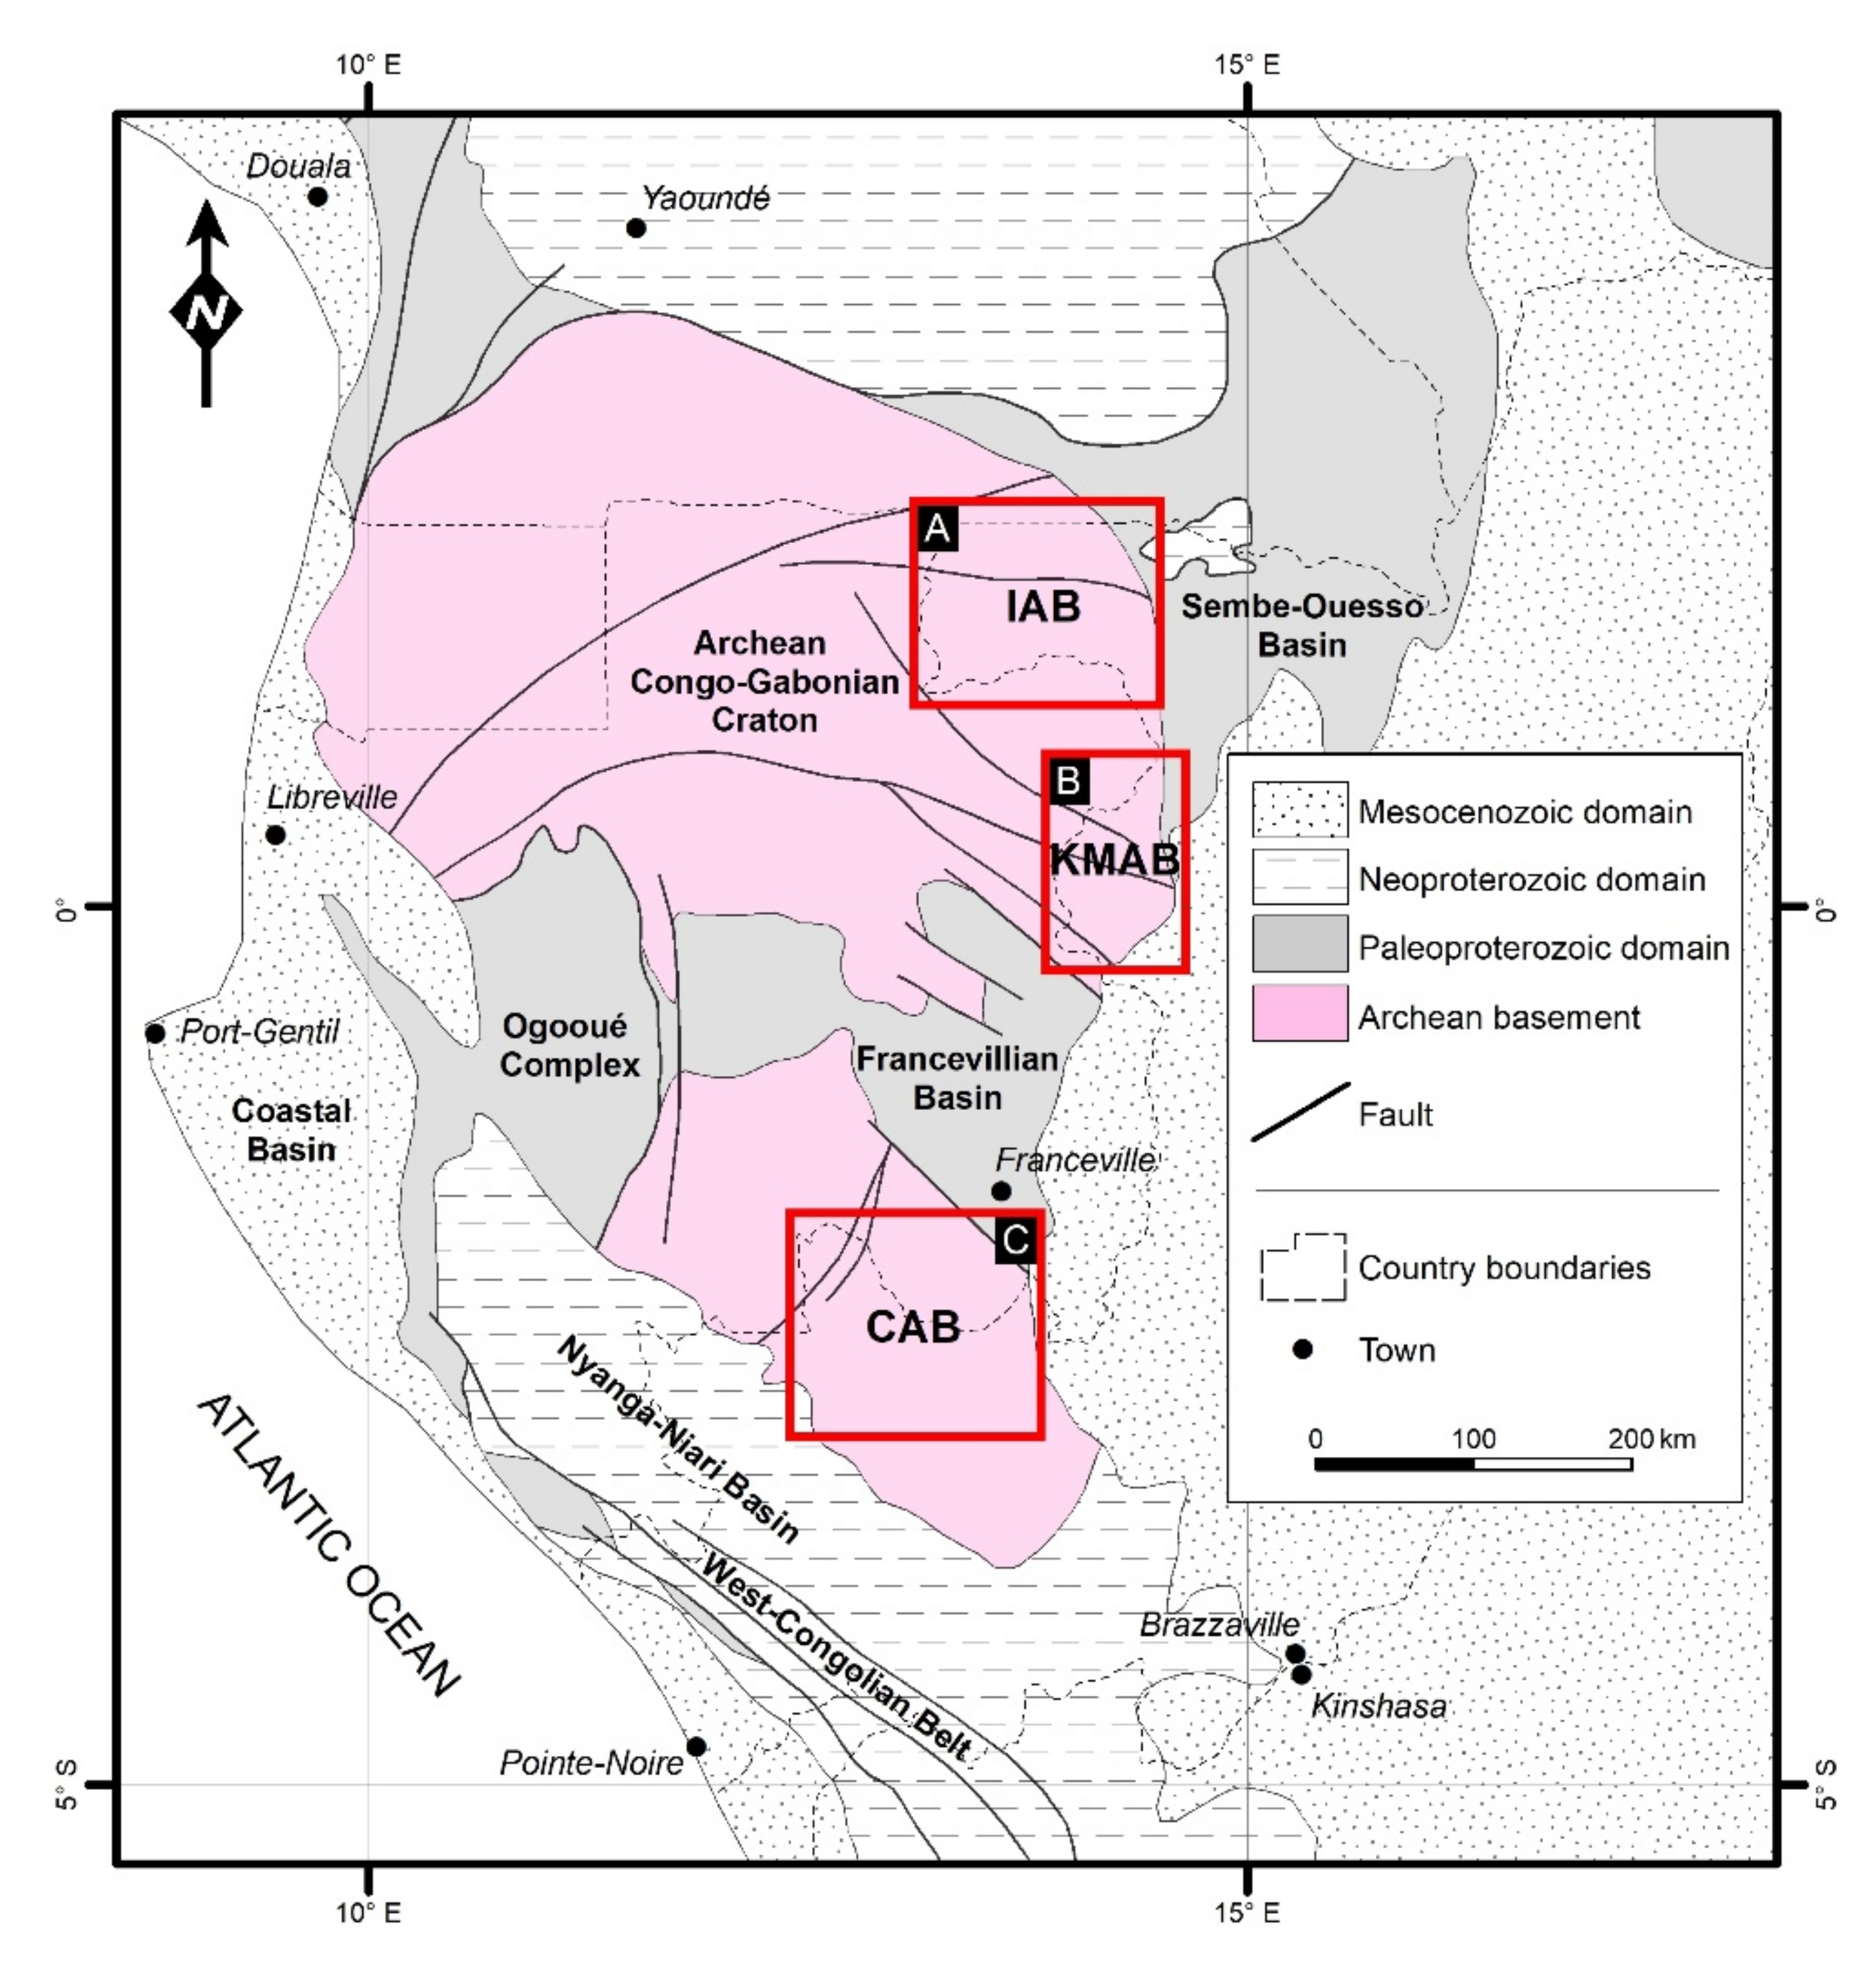
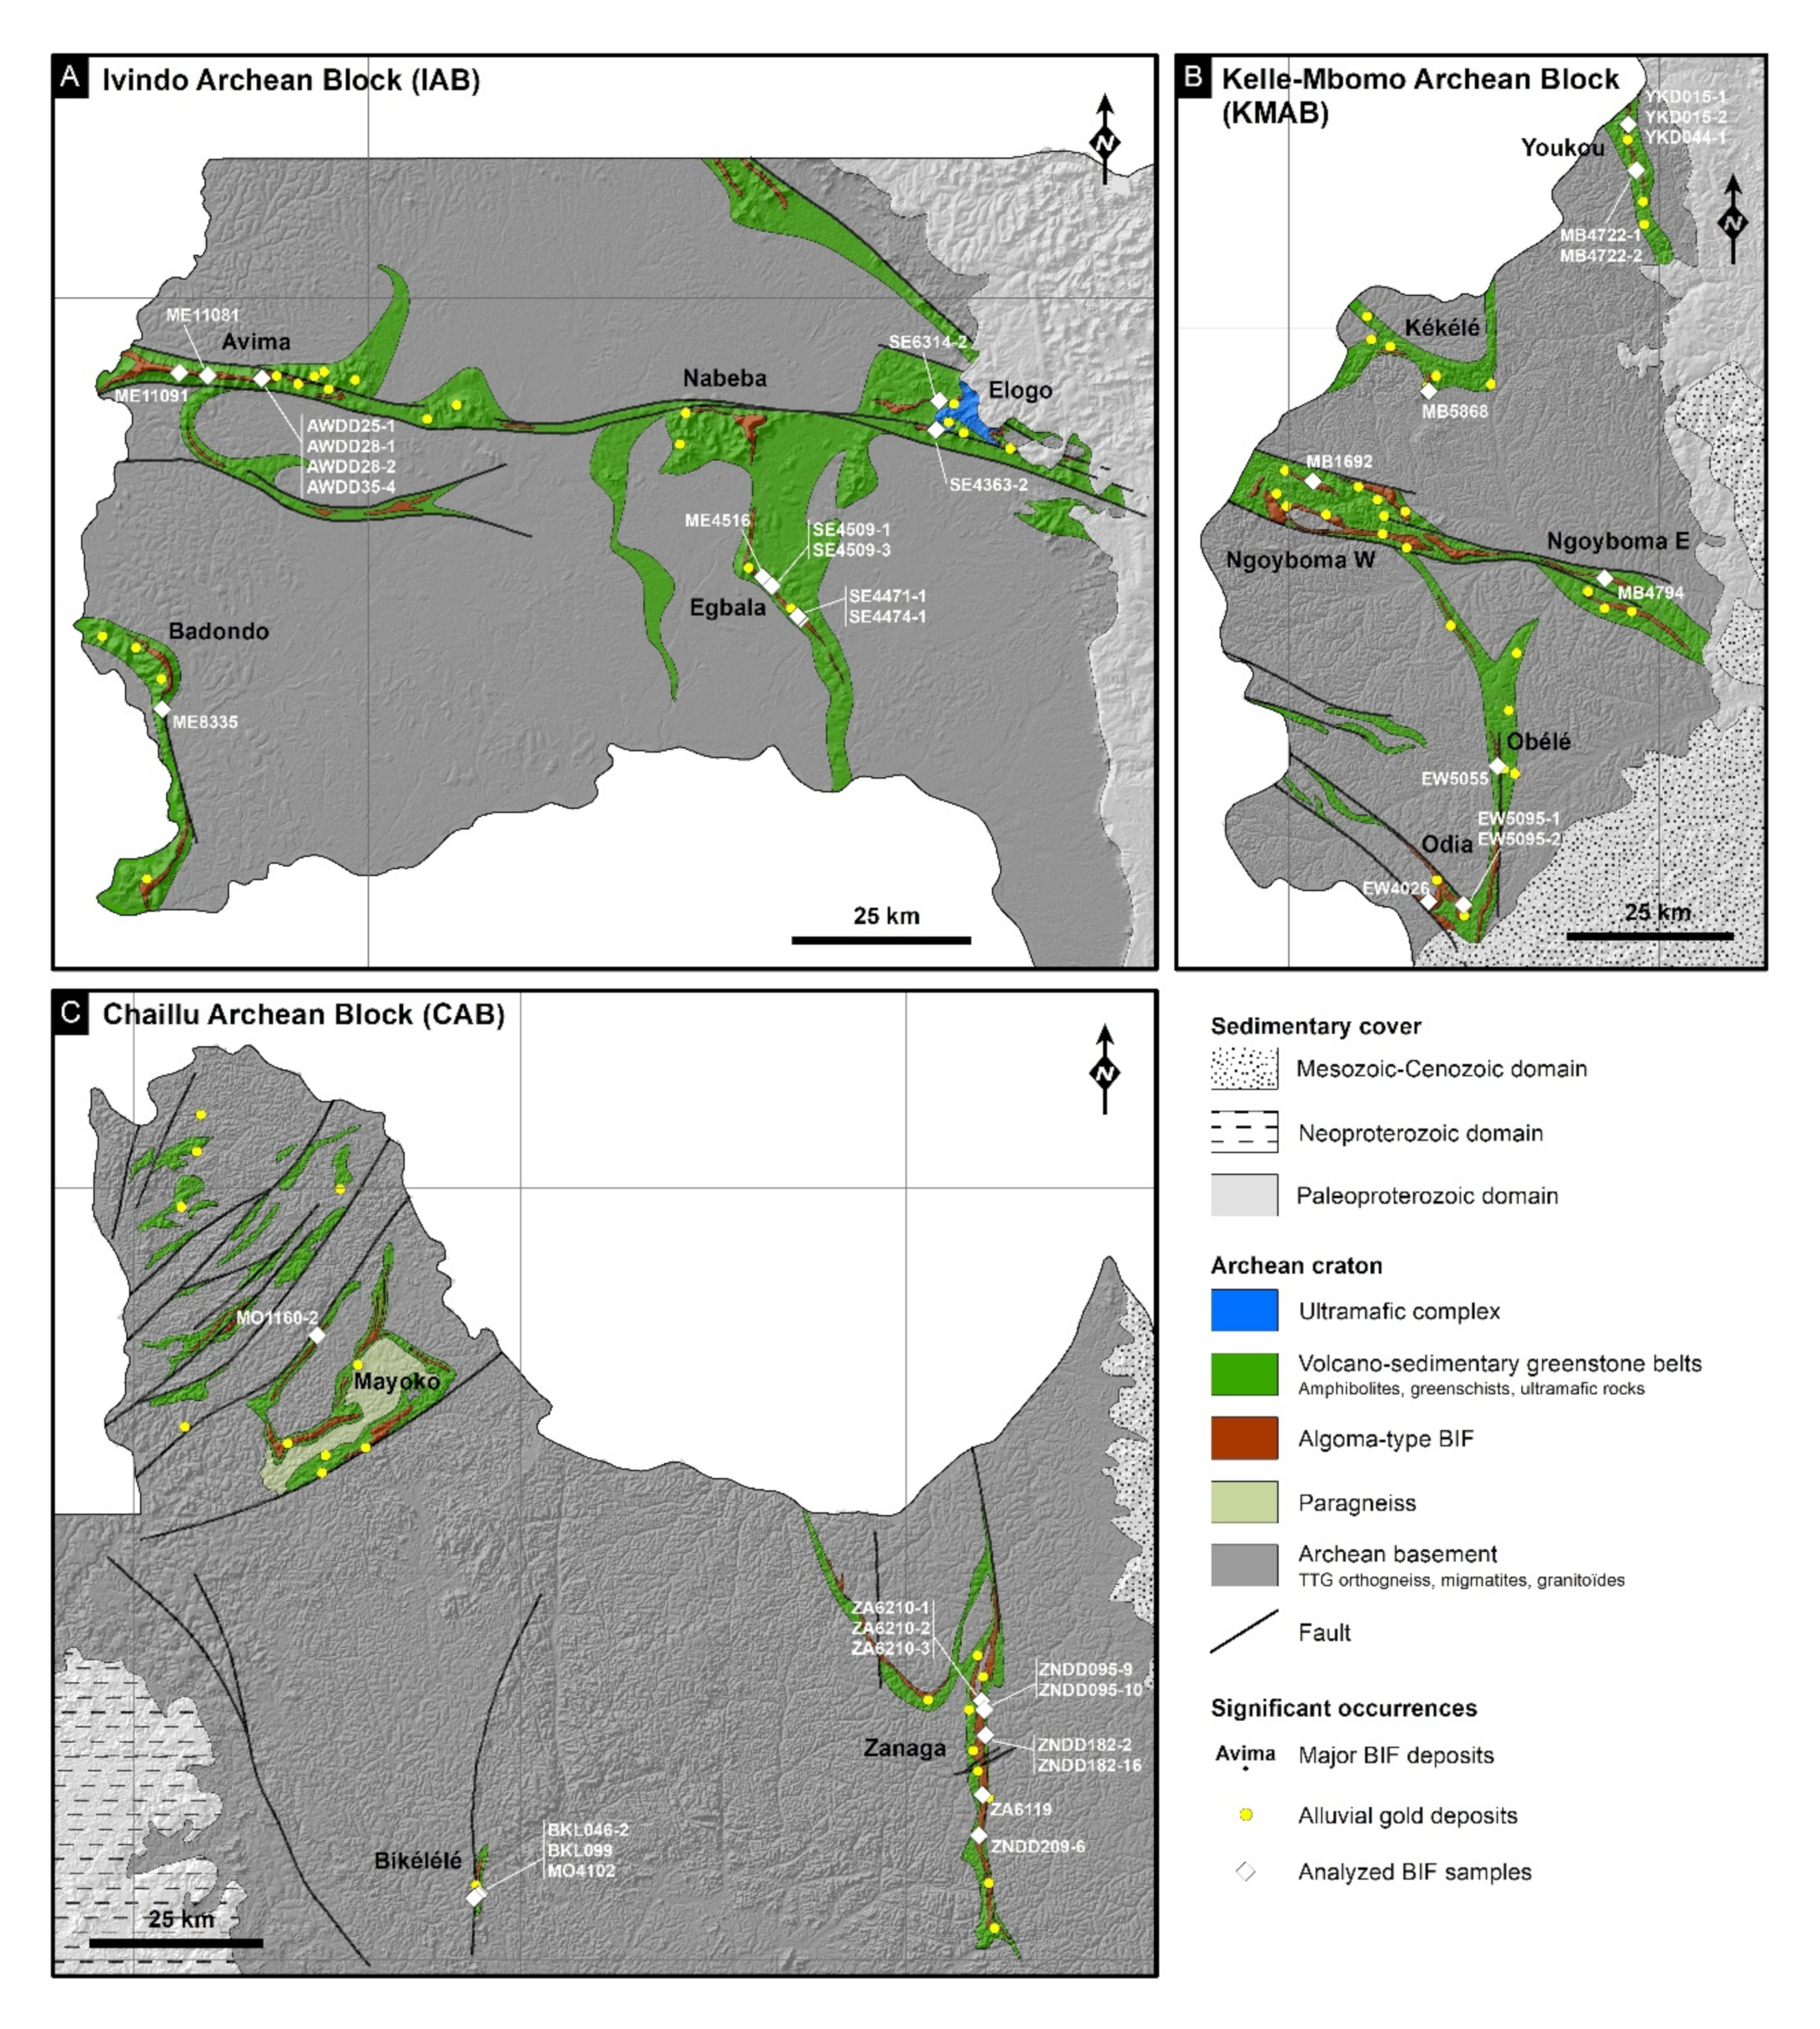
2. Regional Setting
2.1. The Ivindo Archean Block
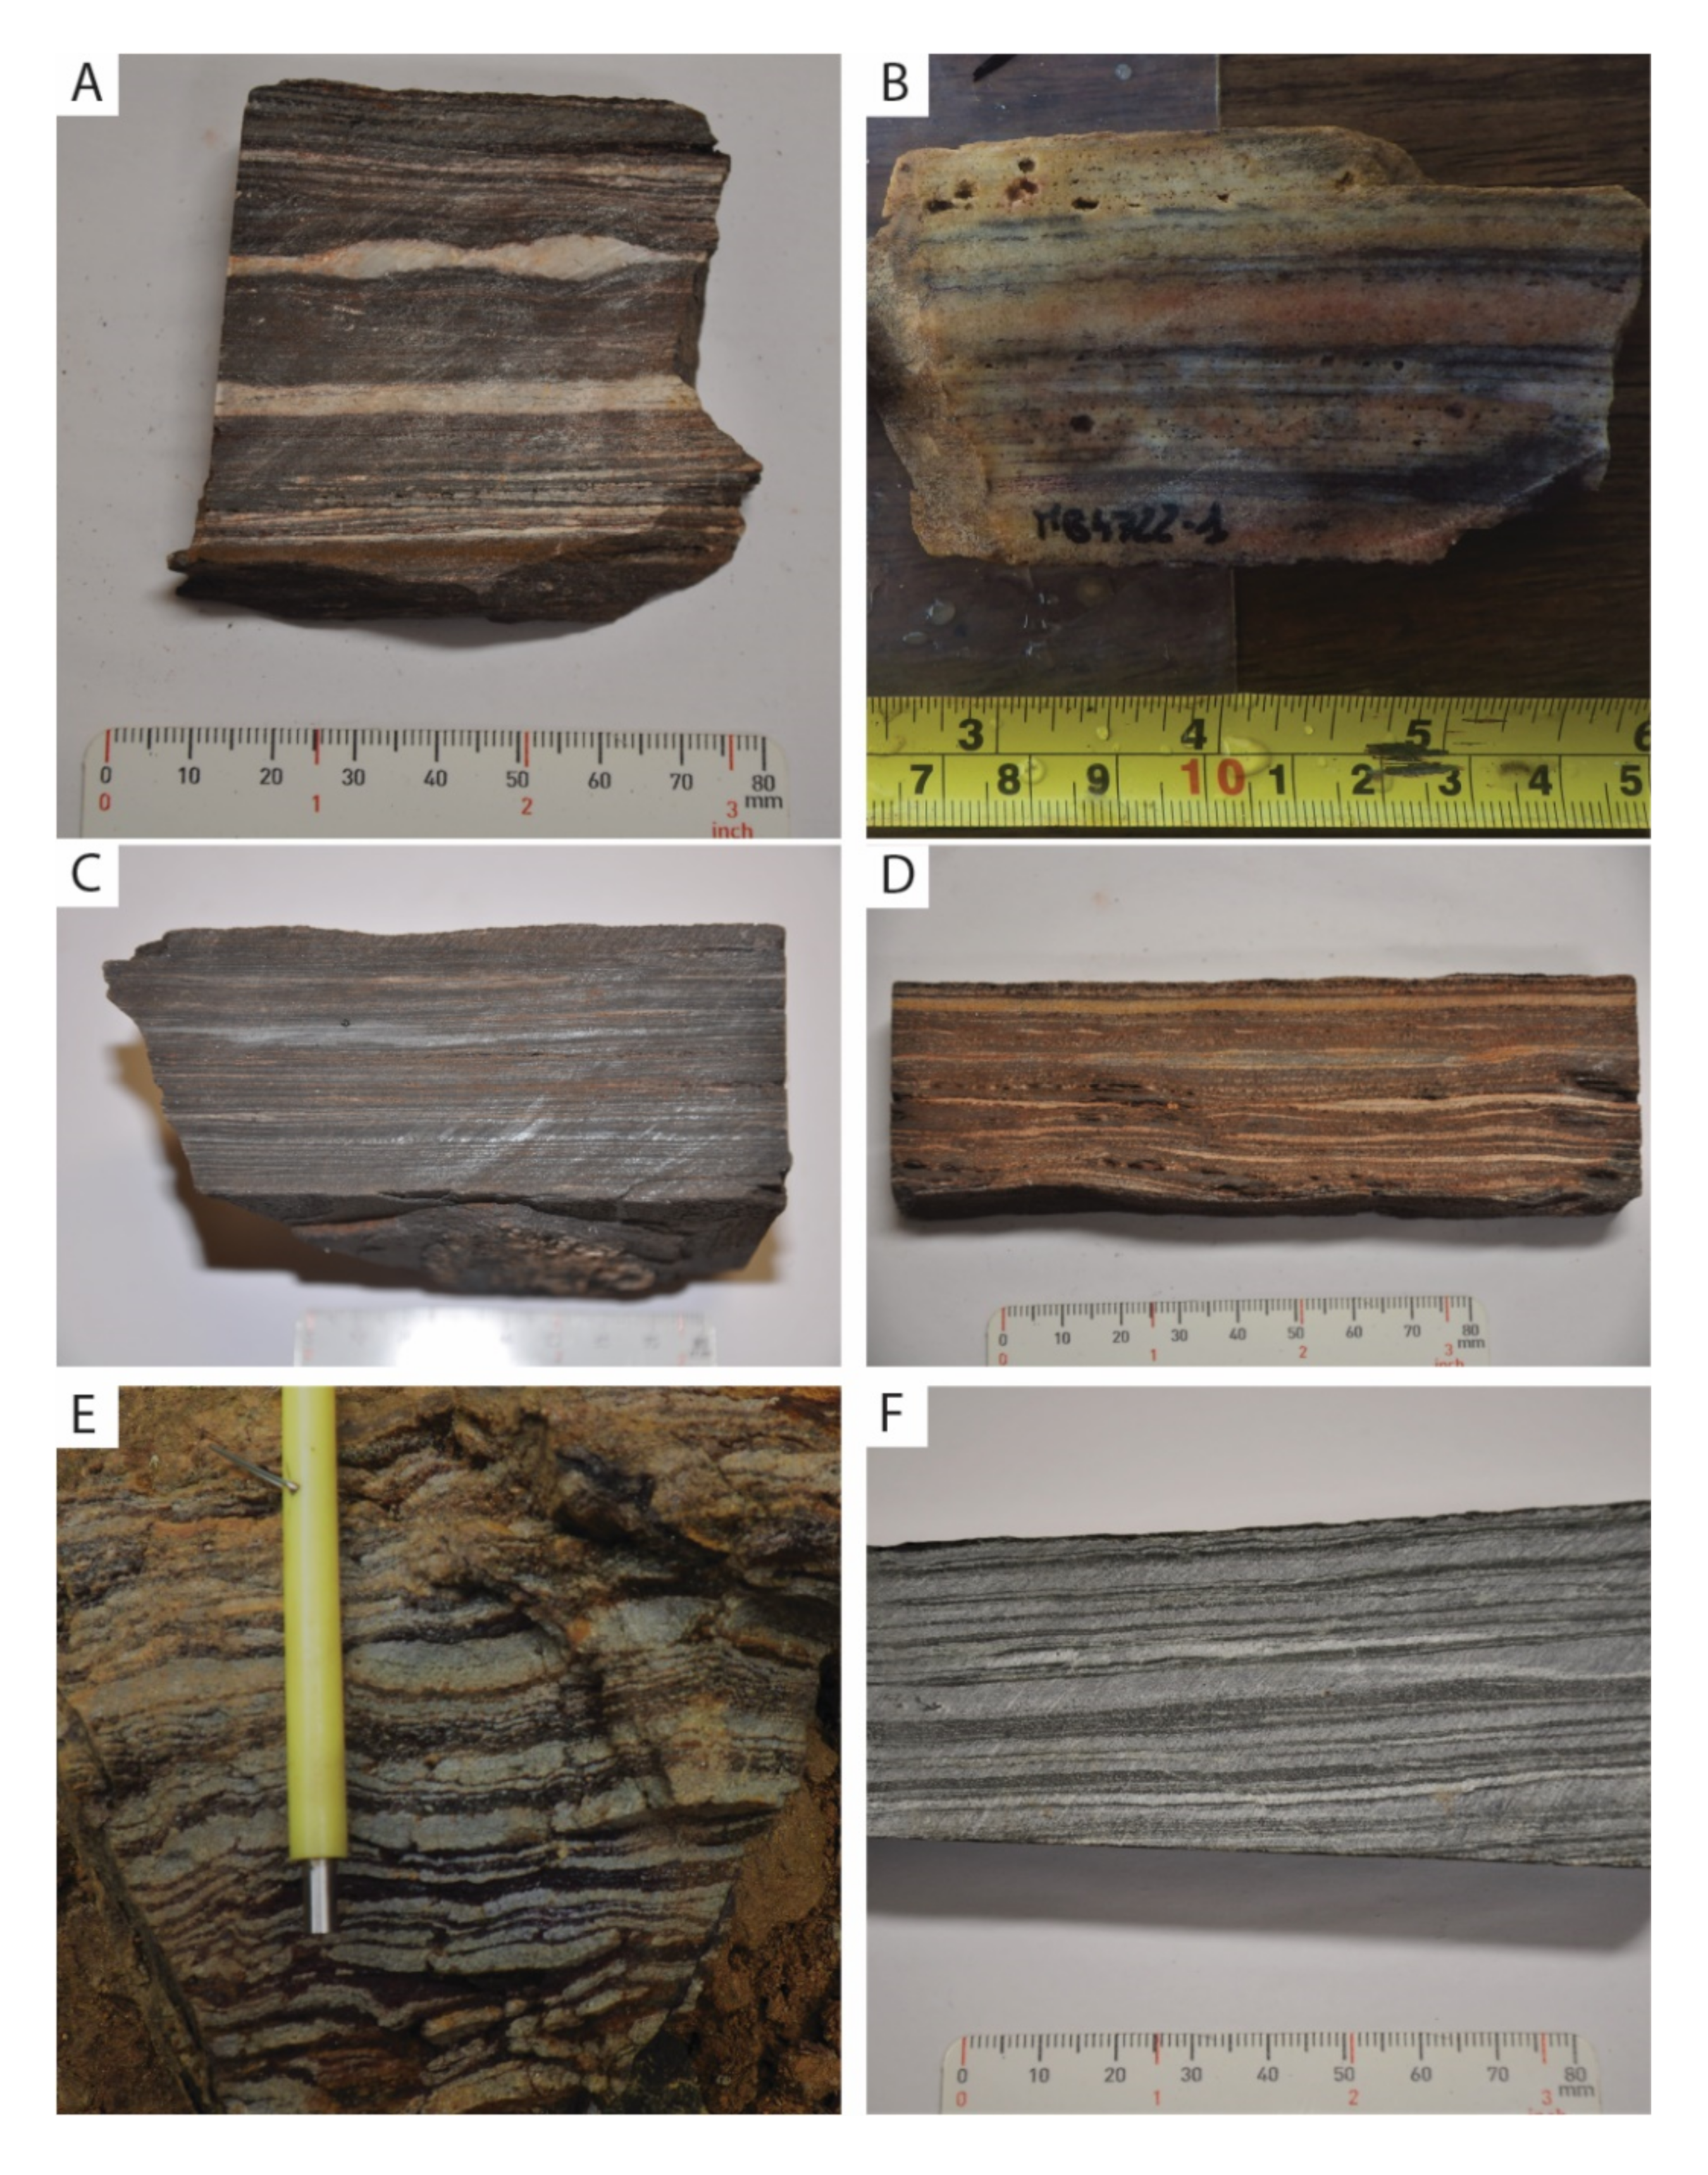
Description of the Sampled BIFs
2.2. The Kelle-Mbomo Archean Block
Description of the Sampled BIFs
2.3. The Chaillu Archean Block
Description of the Sampled BIFs
3. Materials and Methods
Whole-Rock Analyses
4. Results
4.1. REE + Y Systematics
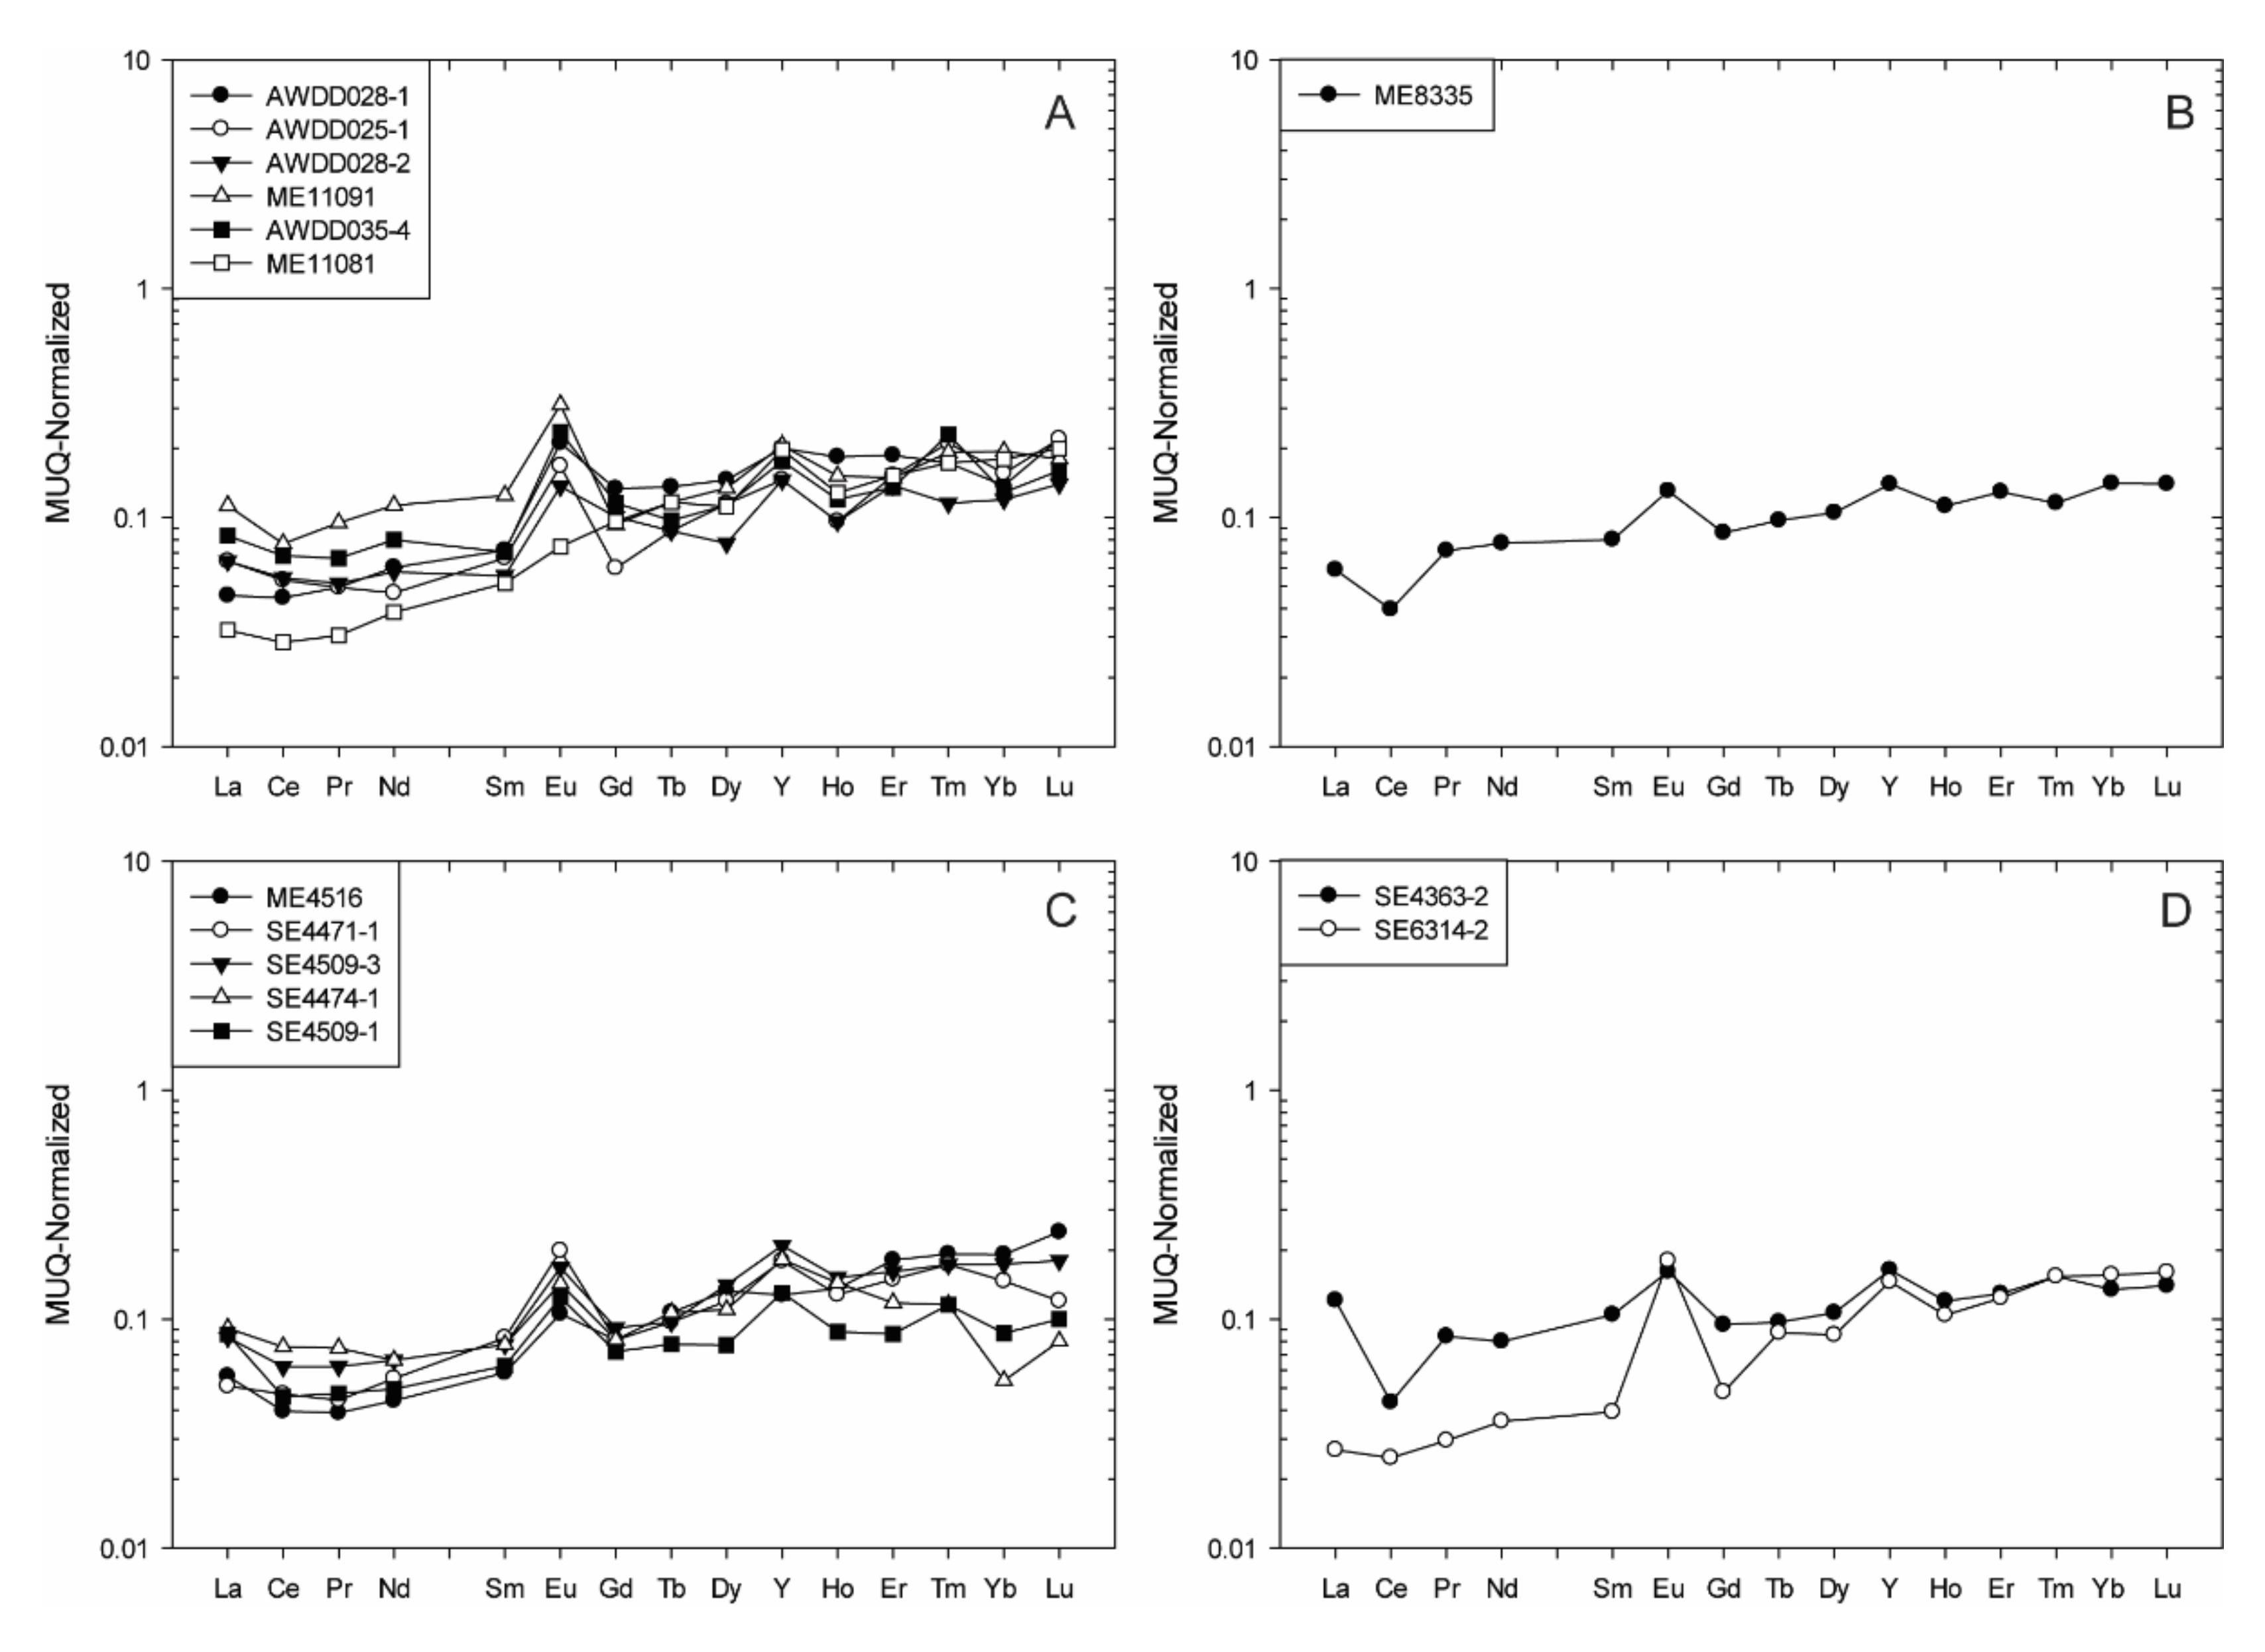
4.1.1. The Ivindo Archean Block
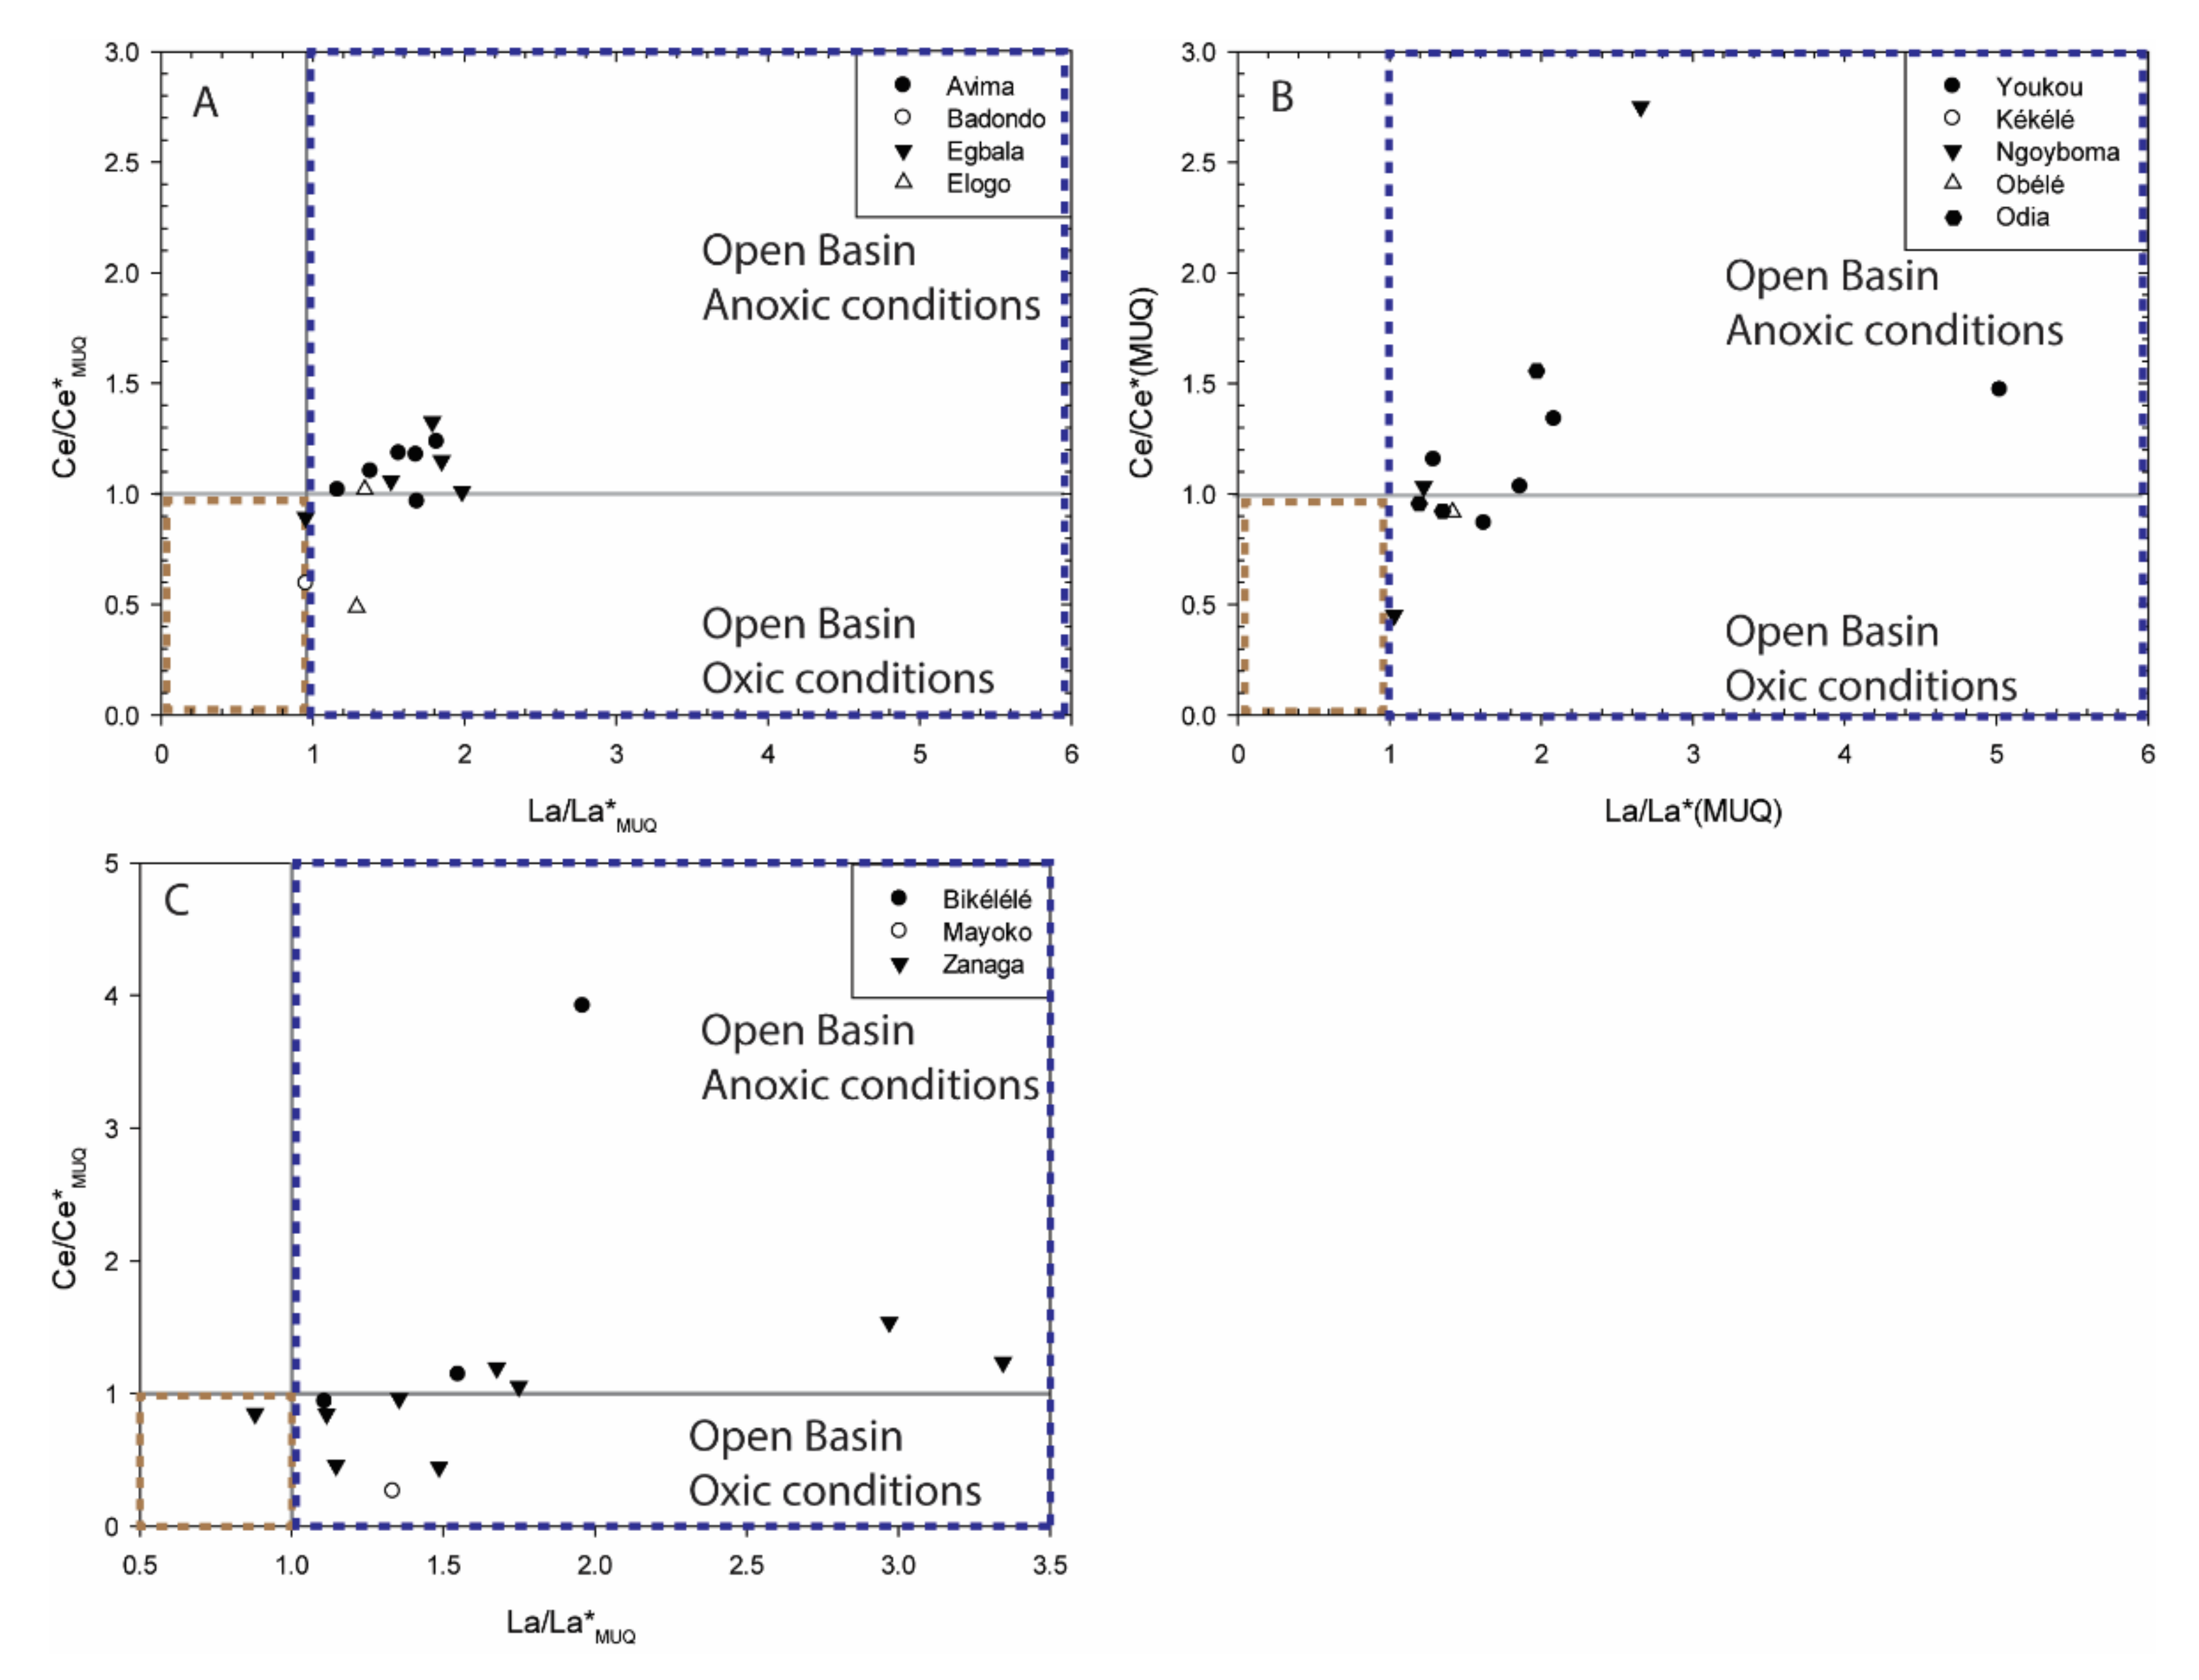
- All samples from the Avima BIF unit show HREE enrichment (Nd/YbMUQ = 0.21–0.62), well developed positive La, Y, and Eu anomalies (La/La*MUQ = 1.16–1.81, Y/Y*MUQ = 1.08–1.40, Eu/Eu*MUQ = 1.07–2.93), and super-chondritic to chondritic Y/Ho values (Y/Ho = 28.69–38.66). Weakly-positive to positive Ce anomalies are reported for these samples (Ce/Ce*MUQ = 0.96–1.23) (Figure 4A).
- The ME8335 sample from the Badondo BIF unit shows enrichment in HREE relative to LREE (Nd/YbMUQ = 0.54), has positive Y and Eu anomalies (Y/Y*MUQ = 1.15, Eu/Eu*MUQ = 1.49) related to a non-depletion of La (La/La*MUQ = 0.95), and a super-chondritic Y/Ho ratio (Y/Ho = 32.85). A strongly developed negative Ce anomaly is reported for this sample (Ce/Ce*MUQ = 0.59) (Figure 4B).
- Most Egbala BIF unit samples show HREE enrichment (Nd/YbMUQ = 0.21–0.62), except SE4474-1 that shows only enrichment of LREE relative to MREE (Nd/YbMUQ = 1.22, Pr/SmMUQ = 0.96). Slightly negative to strongly positive to La, Y, and Eu anomalies and chondritic to super-chondritic Y/Ho values are reported for this BIF unit (La/La*MUQ = 0.95–1.84, Y/Y*MUQ = 0.80–1.49, Eu/Eu*MUQ = 1.44–2.22, Y/Ho = 24.70–39.09). Slightly negative to moderately positive Ce anomalies are shown for these samples (Ce/Ce*MUQ = 0.89–1.32) (Figure 4C).
- All samples from the Elogo BIF unit show HREE enrichment (Nd/YbMUQ = 0.21–0.62), well developed positive La, Y, and Eu anomalies (La/La*MUQ = 1.03–1.34, Y/Y*MUQ = 1.05–1.31, Eu/Eu*MUQ = 1.45–3.40), and super-chondritic Y/Ho values (Y/Ho = 30.35–36.92). Variable Ce anomalies are reported for these samples (Ce/Ce*MUQ = 0.48–1.02) (Figure 4D).
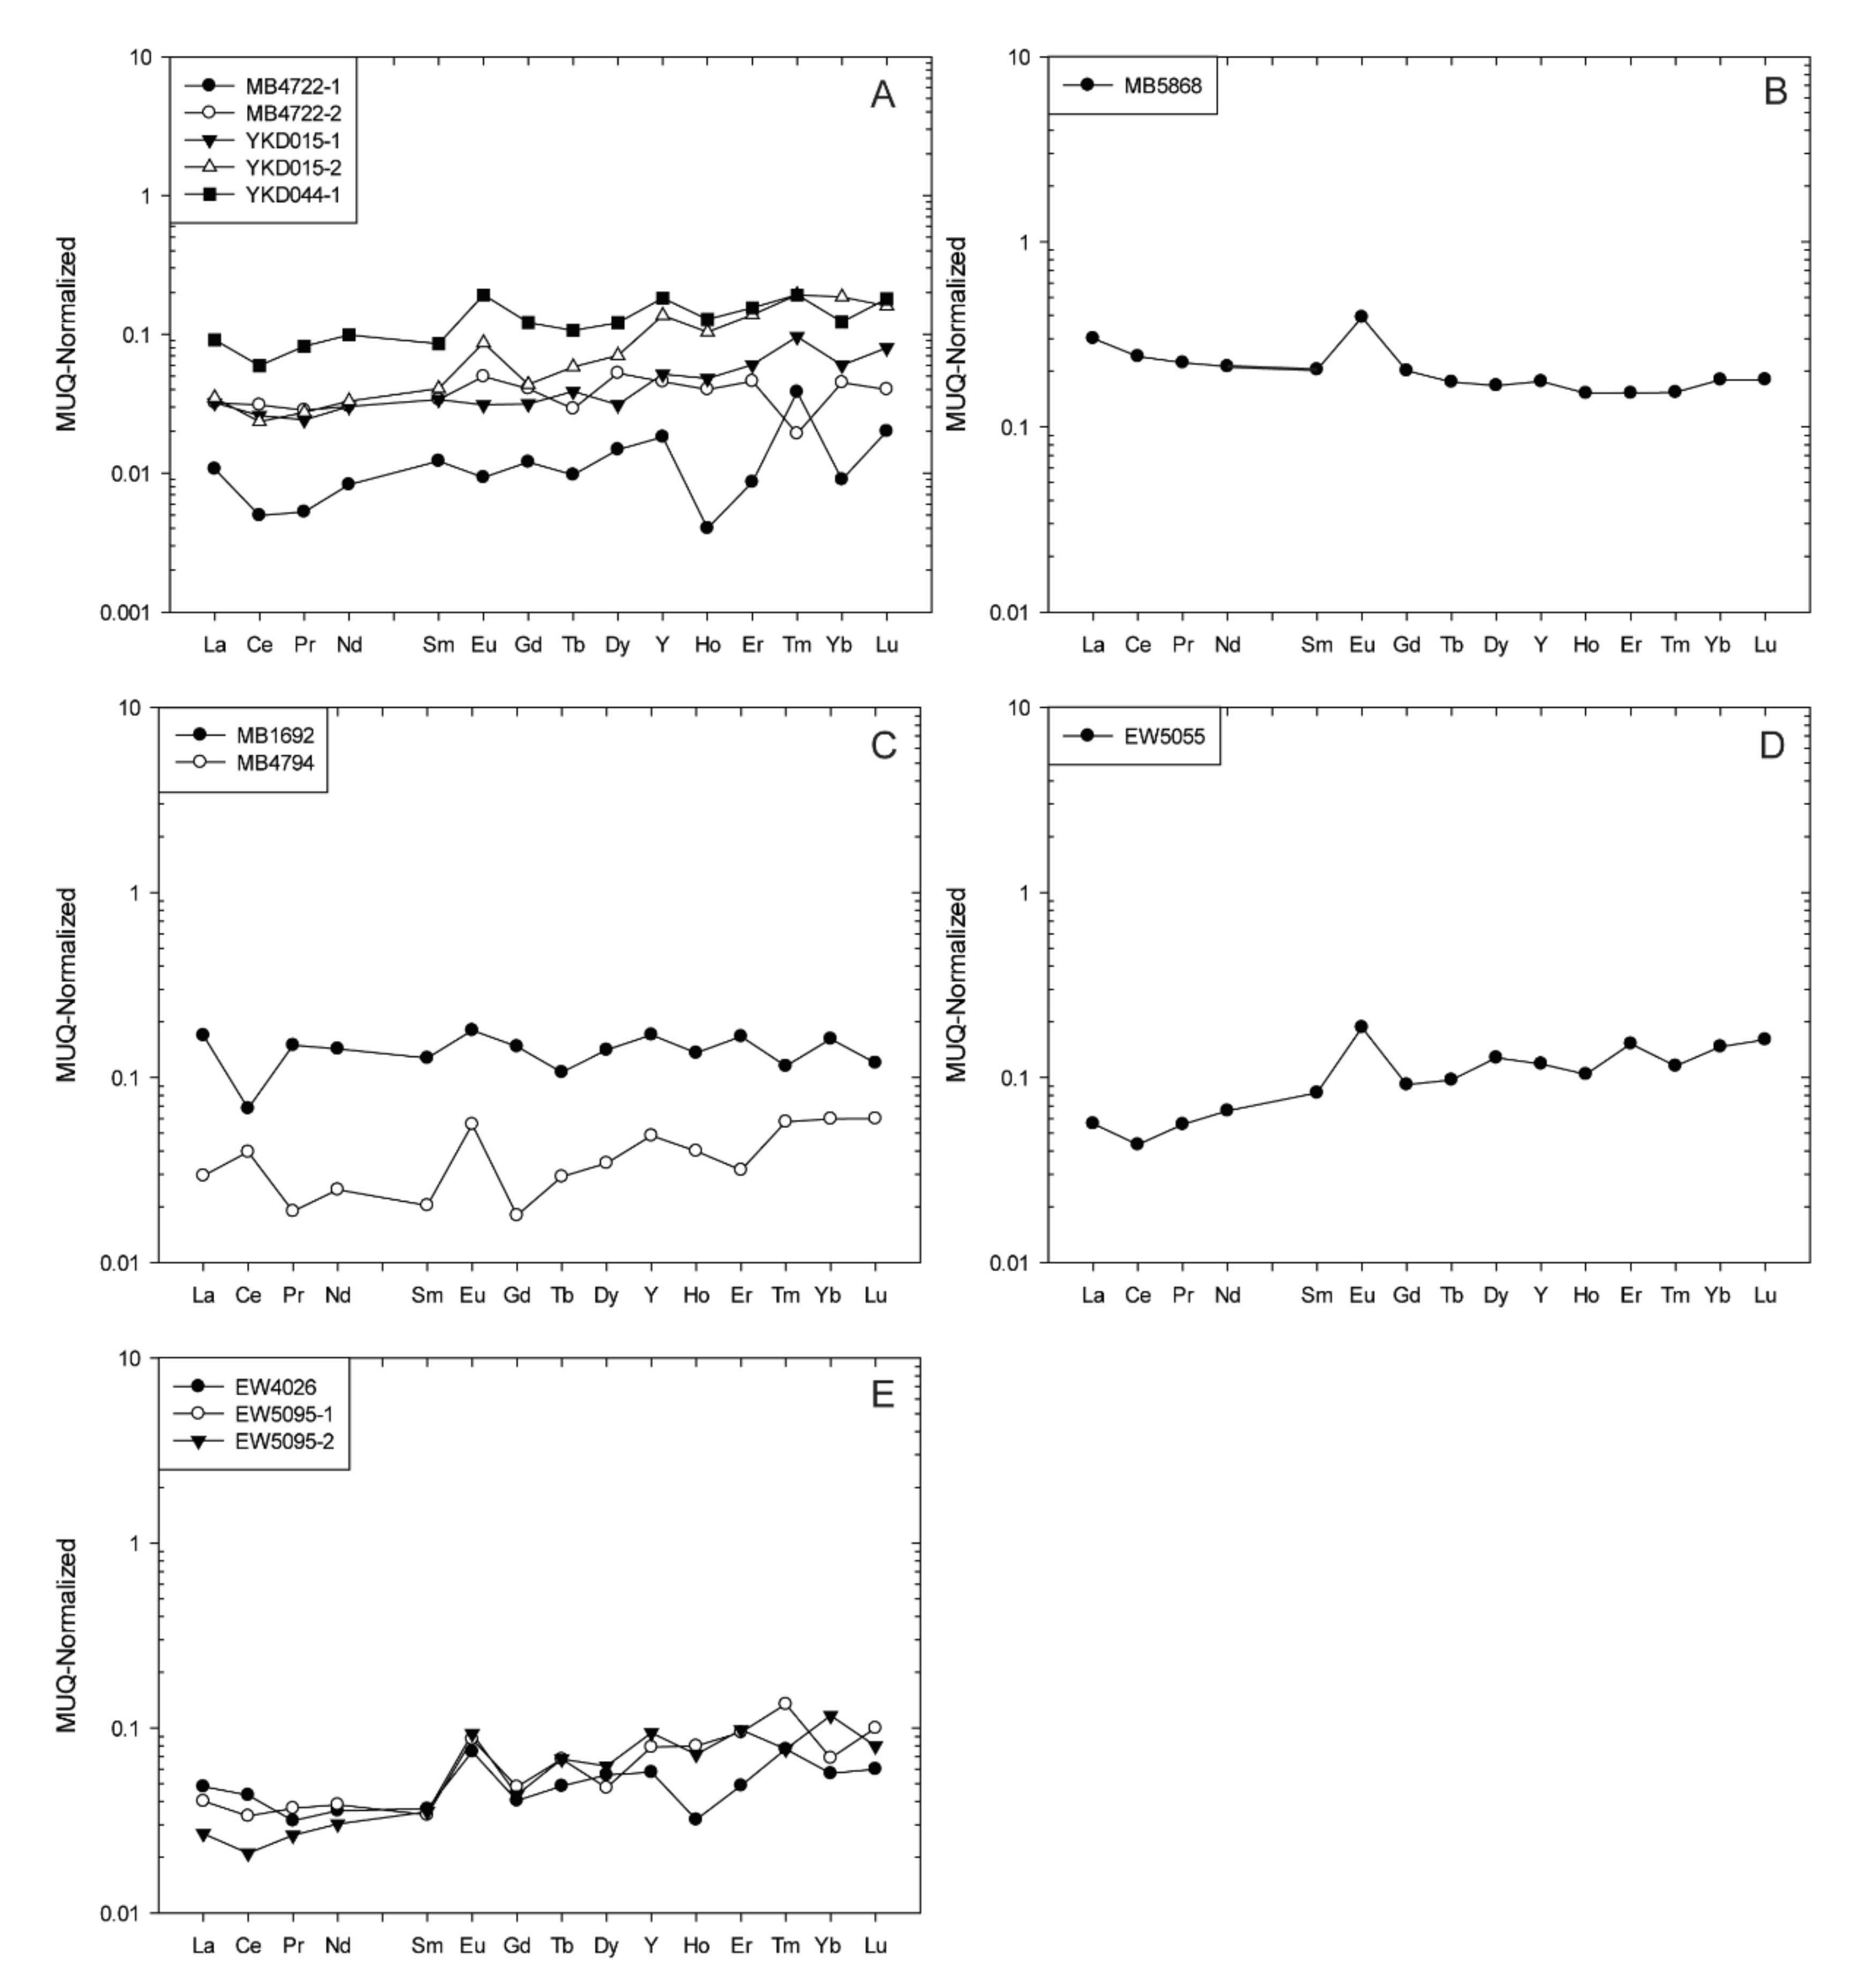
4.1.2. The Kelle-Mbomo Archean Block
- All samples from the Youkou BIF unit show relative HREE enrichment to relatively flat patterns (Nd/YbMUQ = 0.17–0.91), faintly negative to strongly positive La and Y (La/La*MUQ = 1.28–5.01, Y/Y*MUQ = 0.95–2.88), and variable Eu and Ce anomalies (Eu/Eu*MUQ = 0.78–2.04, Ce/Ce*MUQ = 0.87–1.47) along with chondritic to super-chondritic Y/Ho values (Y/Ho = 28.33–120) (Figure 5A).
- Sample MB5868 from the Kékélé BIF unit shows a relatively flat REE pattern (Nd/YbMUQ = 1.17). It also has a positive La anomaly (La/La*MUQ = 1.23) related to the non-depletion of Y (Y/Y*MUQ = 1.15), a positive Eu anomaly (Eu/Eu*MUQ = 1.98), and a super-chondritic Y/Ho ratio (Y/Ho = 30.52). A positive Ce anomaly is reported for this sample as well (Ce/Ce*MUQ = 1.03) (Figure 5B).
- The two samples from the Ngoyboma BIF unit have similar features, showing depletion in HREE enrichment (Nd/YbMUQ = 0.41–0.88), positive La, Y, and Eu (La/La*MUQ = 1.03–2.66, Y/Y*MUQ = 1.12–1.35, Eu/Eu*MUQ = 1.46–2.34), and variable Ce anomalies (Ce/Ce*MUQ = 0.43–2.73), along with super-chondritic Y/Ho values (Y/Ho = 32–32.94) (Figure 5C).
- Sample EW5055 from the Obélé BIF unit shows enrichment in LREE relative to HREE (Nd/YbMUQ = 0.45), slightly negative to moderately positive La, Y, and Eu (La/La*MUQ = 1.41, Y/Y*MUQ = 0.92, Eu/Eu*MUQ = 2.08), and a super-chondritic Y/Ho ratio (Y/Ho = 30). A non-depletion Ce anomaly is reported for this sample (Ce/Ce*MUQ = 0.91) (Figure 5D).
- All samples from the Odia BIF unit show enrichment in LREE relative to HREE (Nd/YbMUQ = 0.25–0.62), slightly negative to moderately positive La, Y, and Eu (La/La*MUQ = 1.02–1.96, Y/Y*MUQ = 0.90–1.55, Eu/Eu*MUQ = 1.41–2.05), and chondritic to super-chondritic Y/Ho values (Y/Ho = 26–50). Variable Ce anomalies are reported for these samples a well (Ce/Ce*MUQ = 0.70–1.55) (Figure 5E).
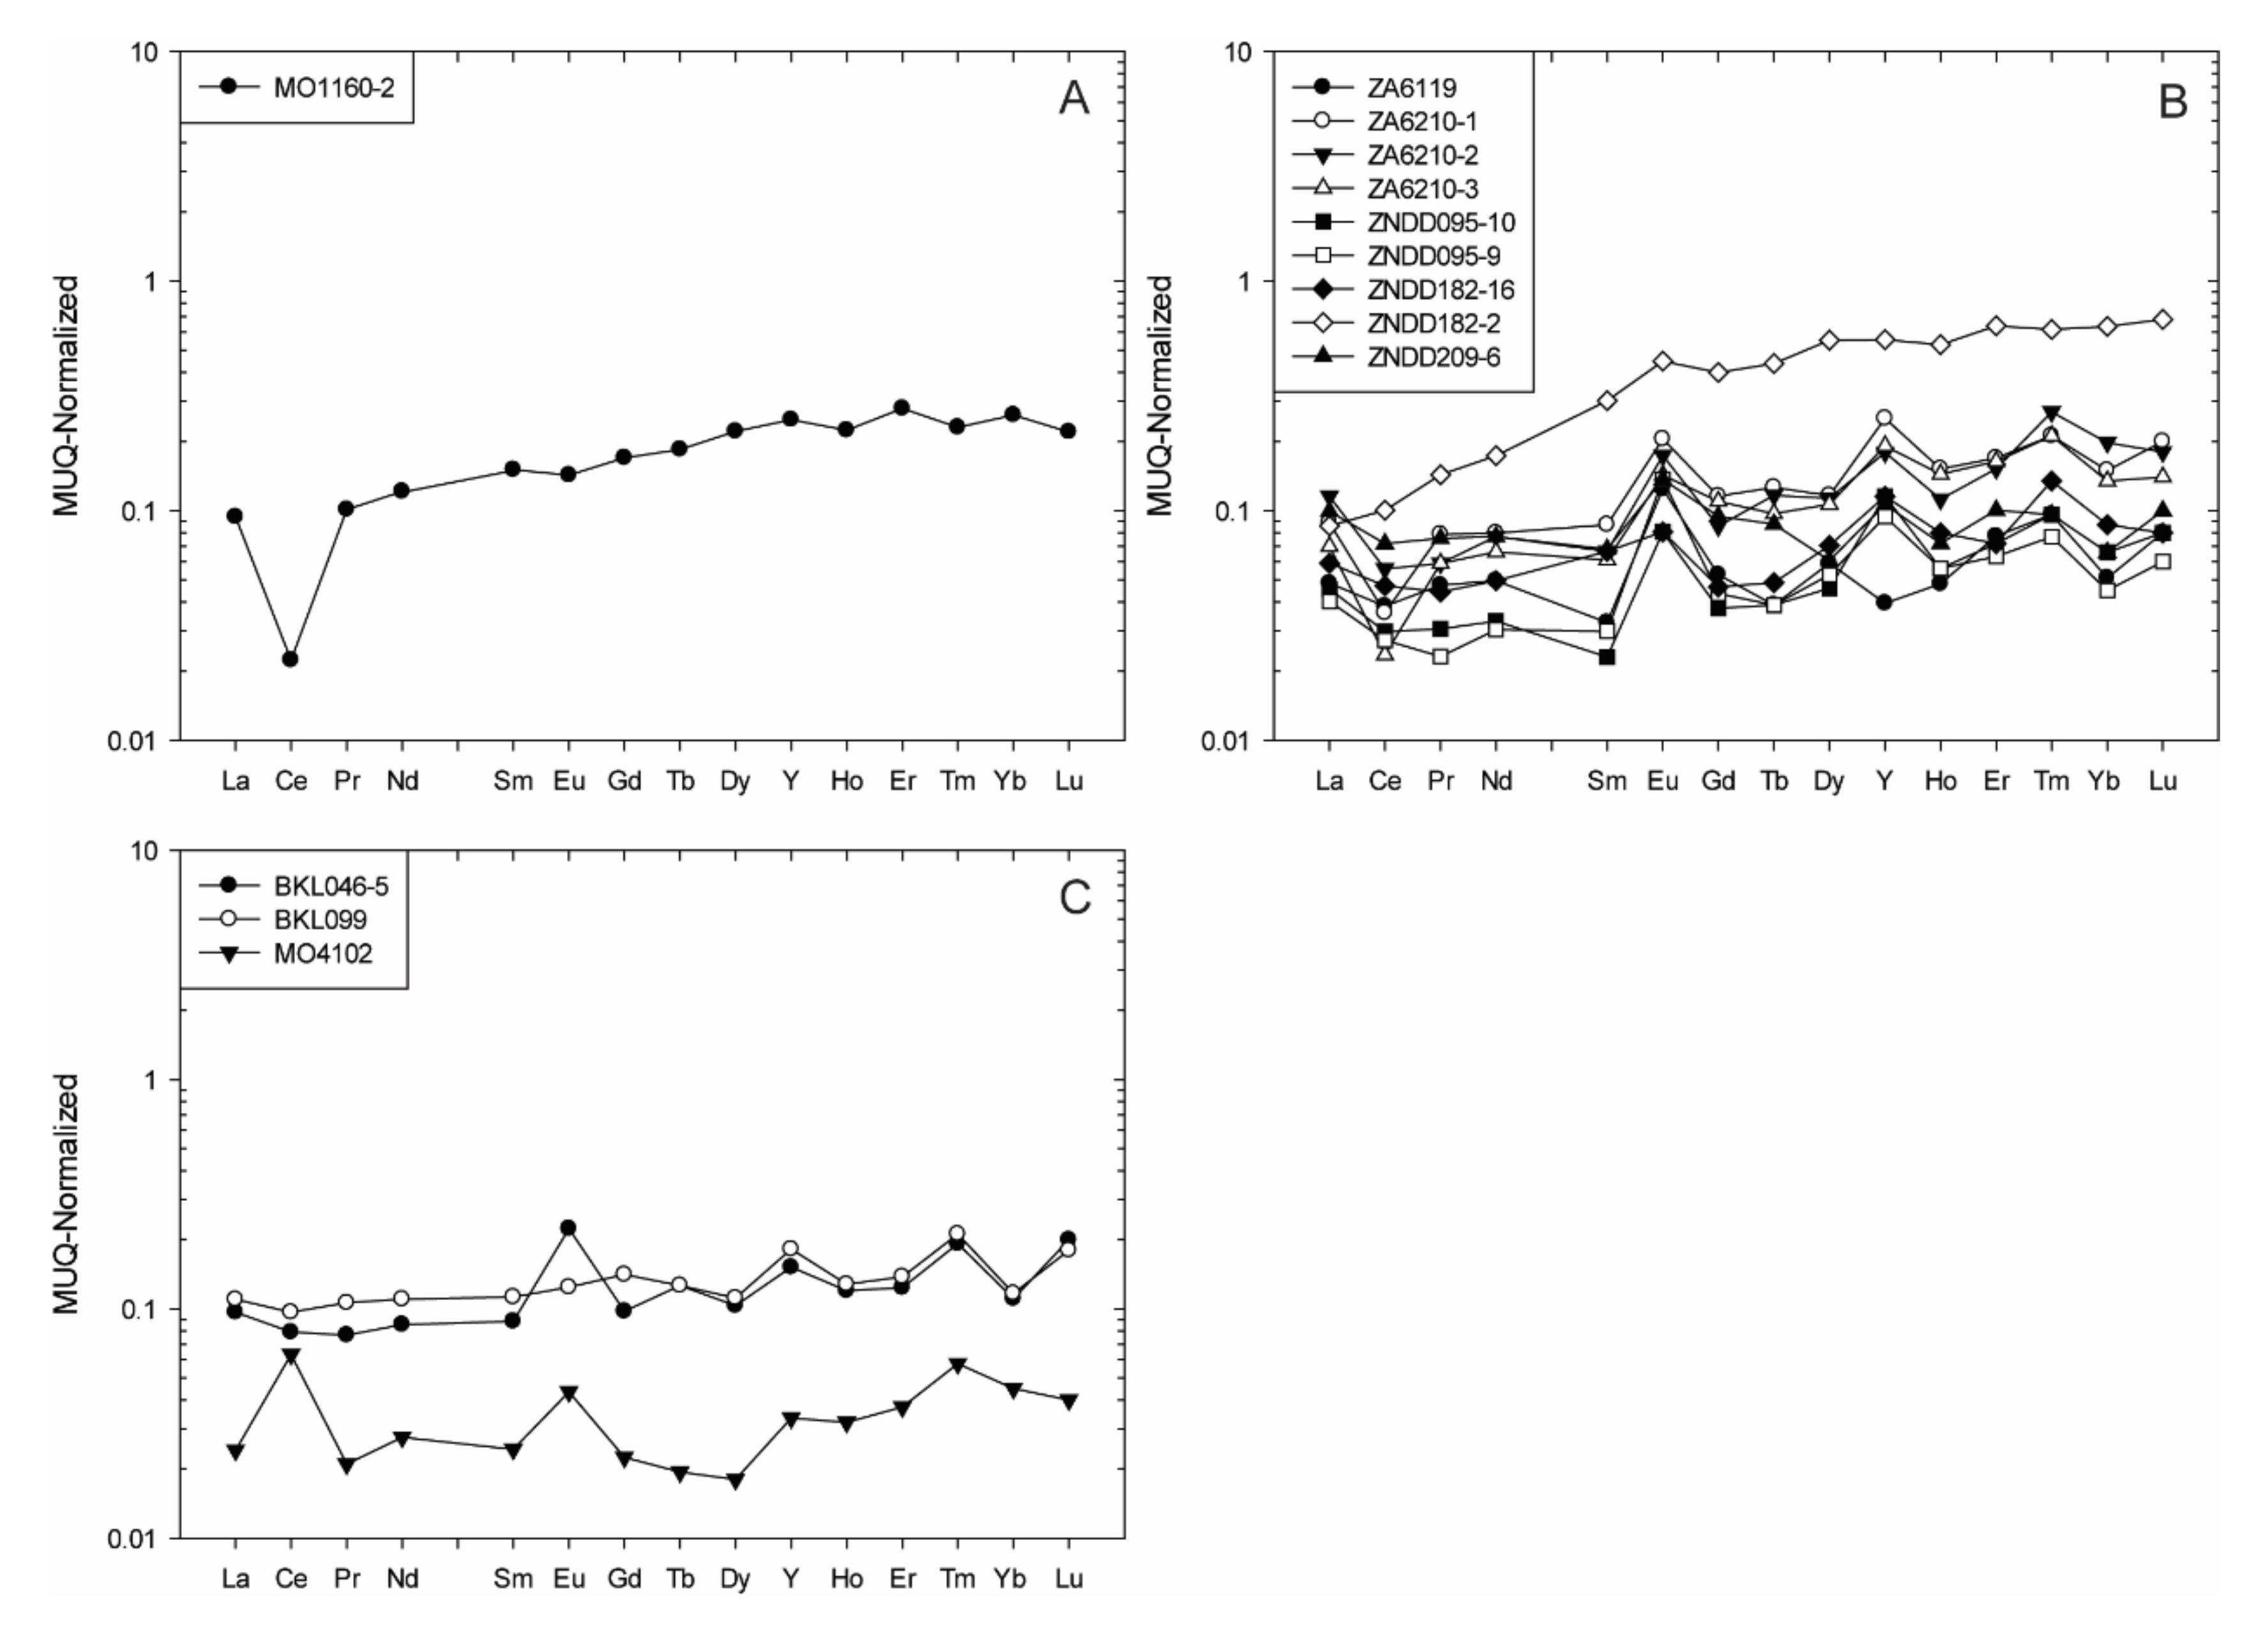
4.1.3. The Chaillu Archean Block
- Sample MO1160-2 from the Mayoko BIF unit is enriched in HREE relative to LREE (Nd/YbMUQ = 0.46), has a positive La anomaly (La/La*MUQ = 1.33) related to non-depletion of Y (Y/Y*MUQ = 0.99), a weak negative Eu anomaly (Eu/Eu*MUQ = 0.87), and a super-chondritic Y/Ho ratio (Y/Ho = 29.28). The sample also has a strongly developed negative Ce anomaly (Ce/Ce*MUQ = 0.26).
- The three samples from Bikélélé show LREE depletion (Nd/YbMUQ = 0.61–0.94), positive La, Y, and Eu anomalies (La/La*MUQ = 1.03–2.19, Y/Y*MUQ = 0.96–1.37, Eu/Eu*MUQ = 1.03–2.19), and chondritic to weakly super-chondritic Y/Ho values (Y/Ho = 27.5–33.3). Weakly-positive to positive Ce anomalies are reported for these samples (Ce/Ce*MUQ = 0.94–3.92).
- Most samples from the Zanaga BIF unit have relatively uniform REE + Y patterns with HREE enrichment, positive La, Y, and Eu anomalies, and chondritic to super-chondritic Y/Ho values (Nd/YbMUQ = 0.27–0.97, La/La*MUQ = 1.11–3.34, Y/Y*MUQ = 1.23–1.80, Eu/Eu*MUQ = 1.29–4.05, Y/Ho = 27.7–54.28). However, a few variations occur:
- The ZNDD209-6 sample varies by its weak depletion in HREE relative to LREE (Nd/YbMUQ = 1.17), and ZA6119 by its negative Y anomaly (Y/Y*MUQ = 0.62)
- The ZNDD182-2 sample varies by its weakly developed negative La and Y anomalies (La/La*MUQ = 0.87, Y/Y*MUQ = 0.95).
- For Ce anomalies, two distinct sample groups are identified: (1) with weak to moderate positive Ce anomalies (Ce/Ce*MUQ = 0.96–3.92); and (2) four samples (i.e., ZA6119, ZA6210-1, ZA6210-3, ZNDD182-2) with strongly to moderately developed negative Ce anomalies (Ce/Ce*MUQ = 0.84–0.44).
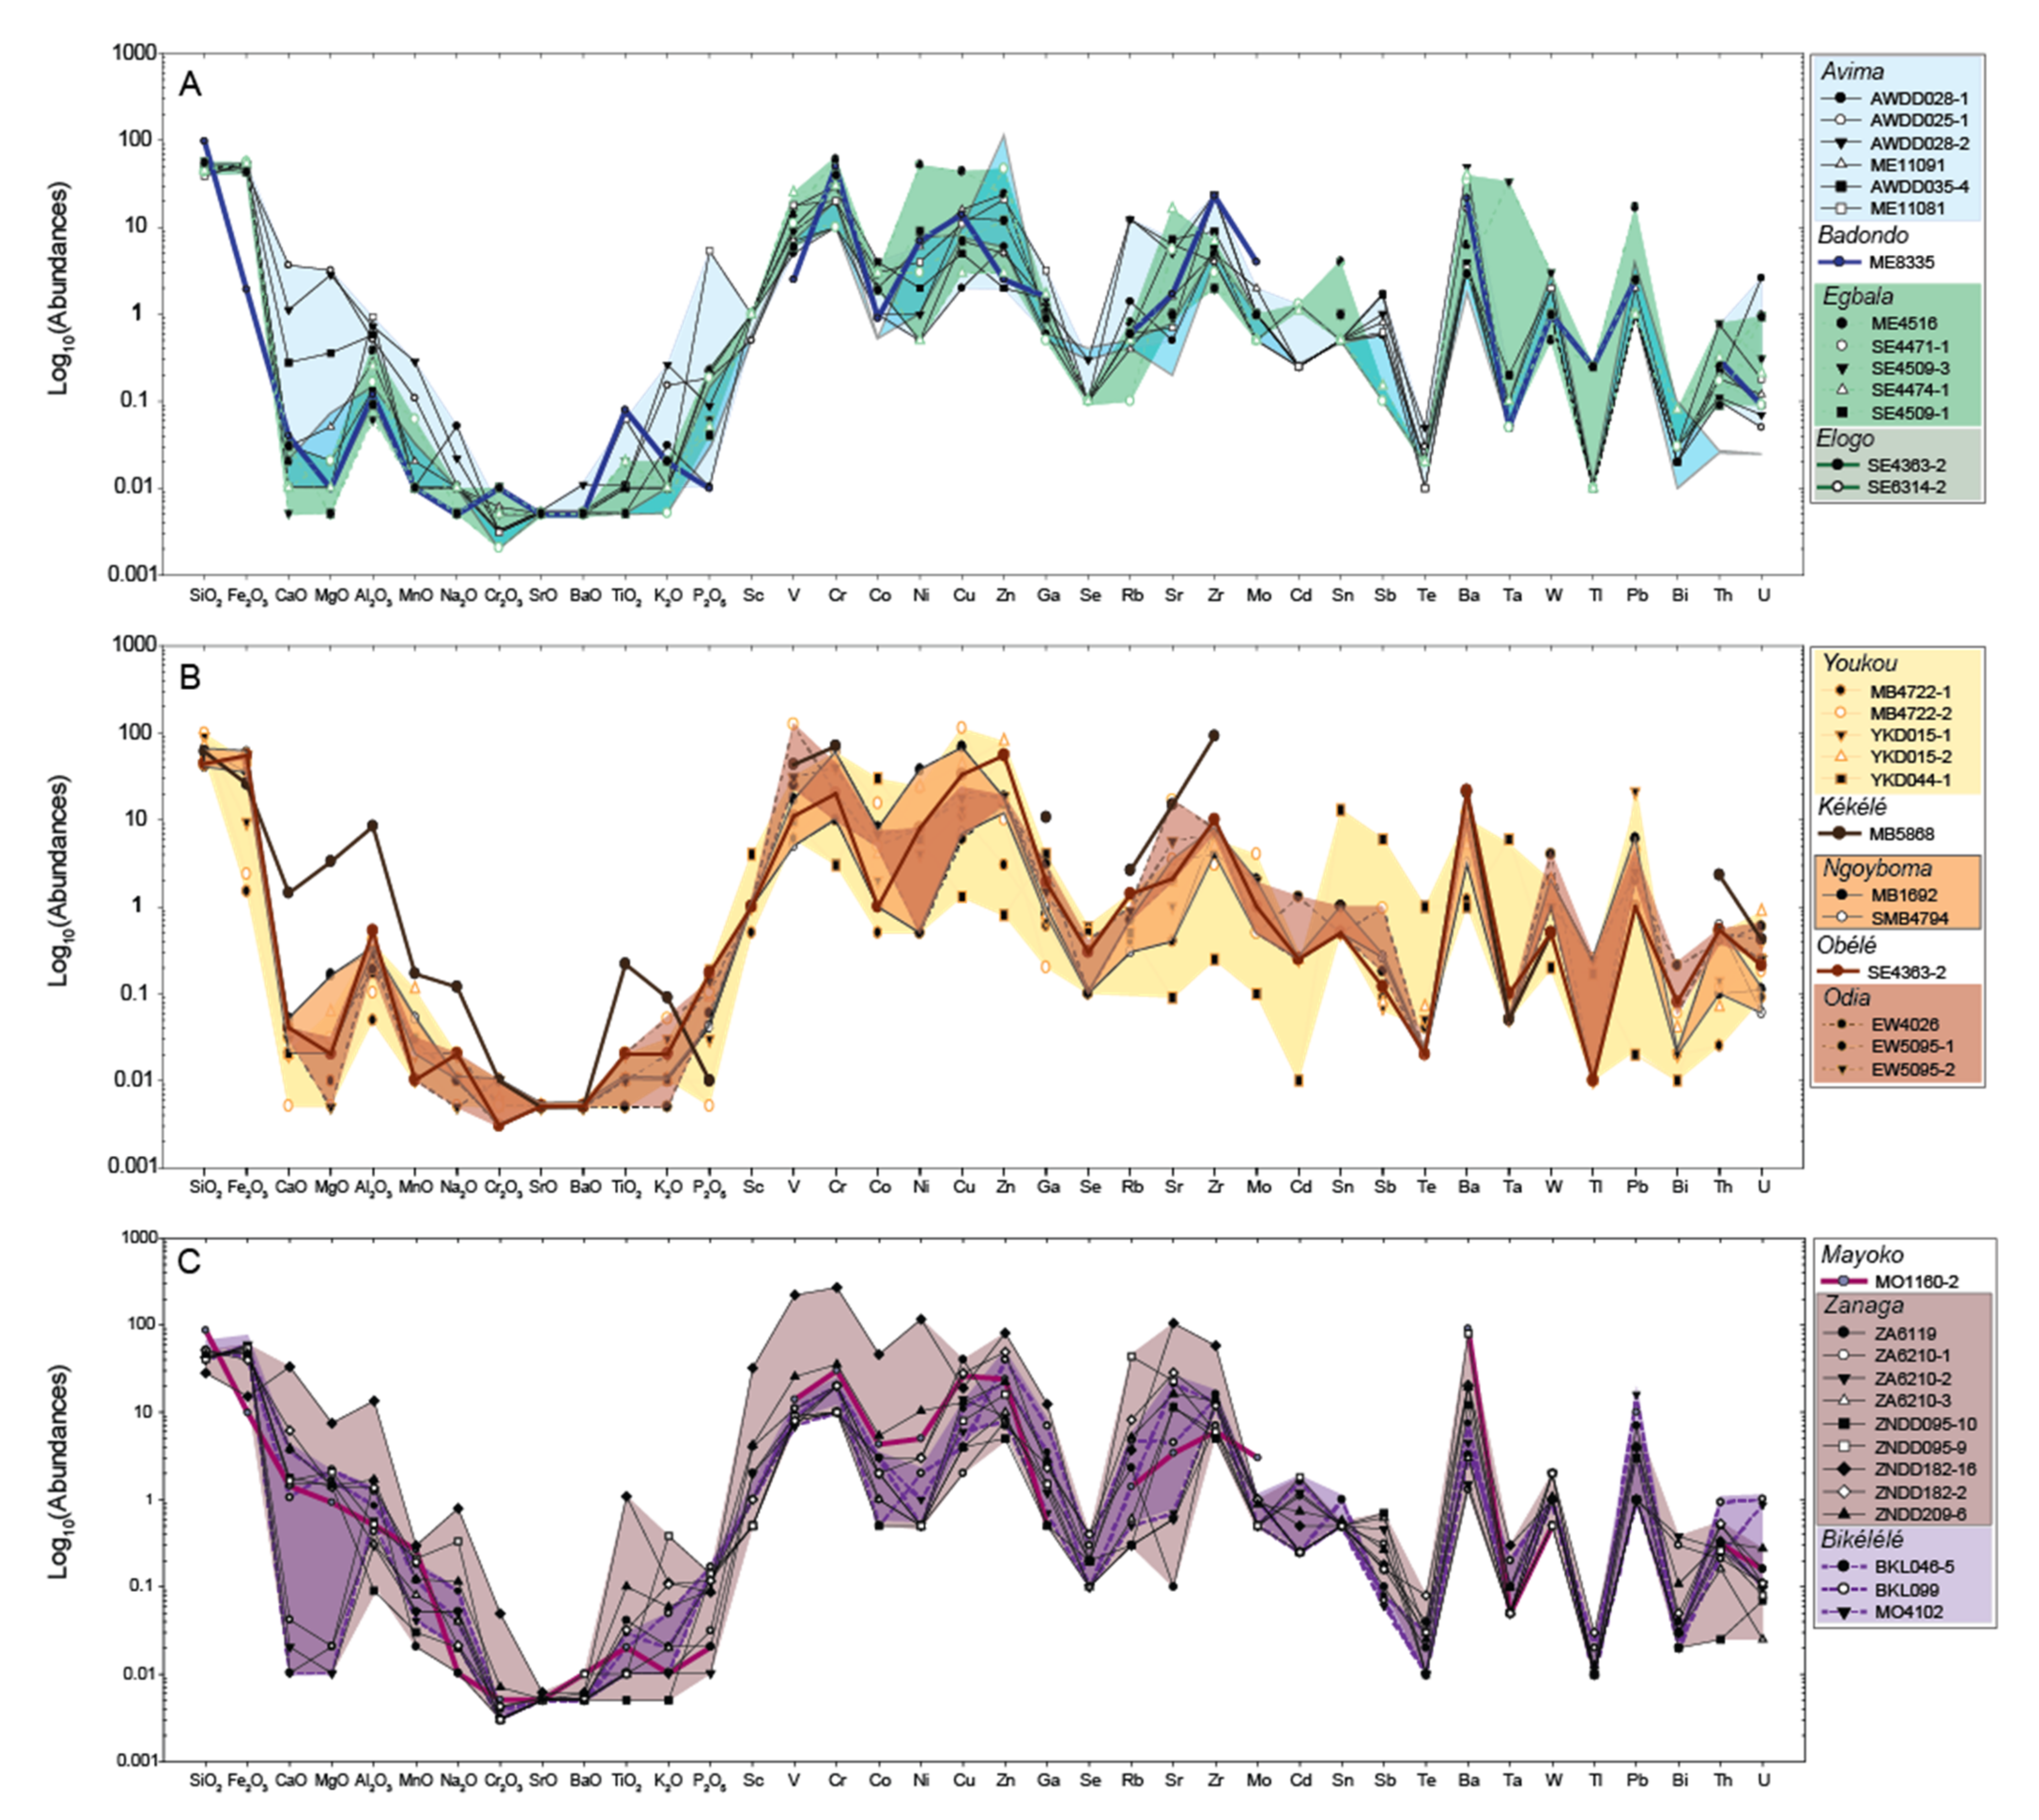
4.2. Additional Major- and Trace-Element Data
5. Discussion
5.1. Primary Signatures
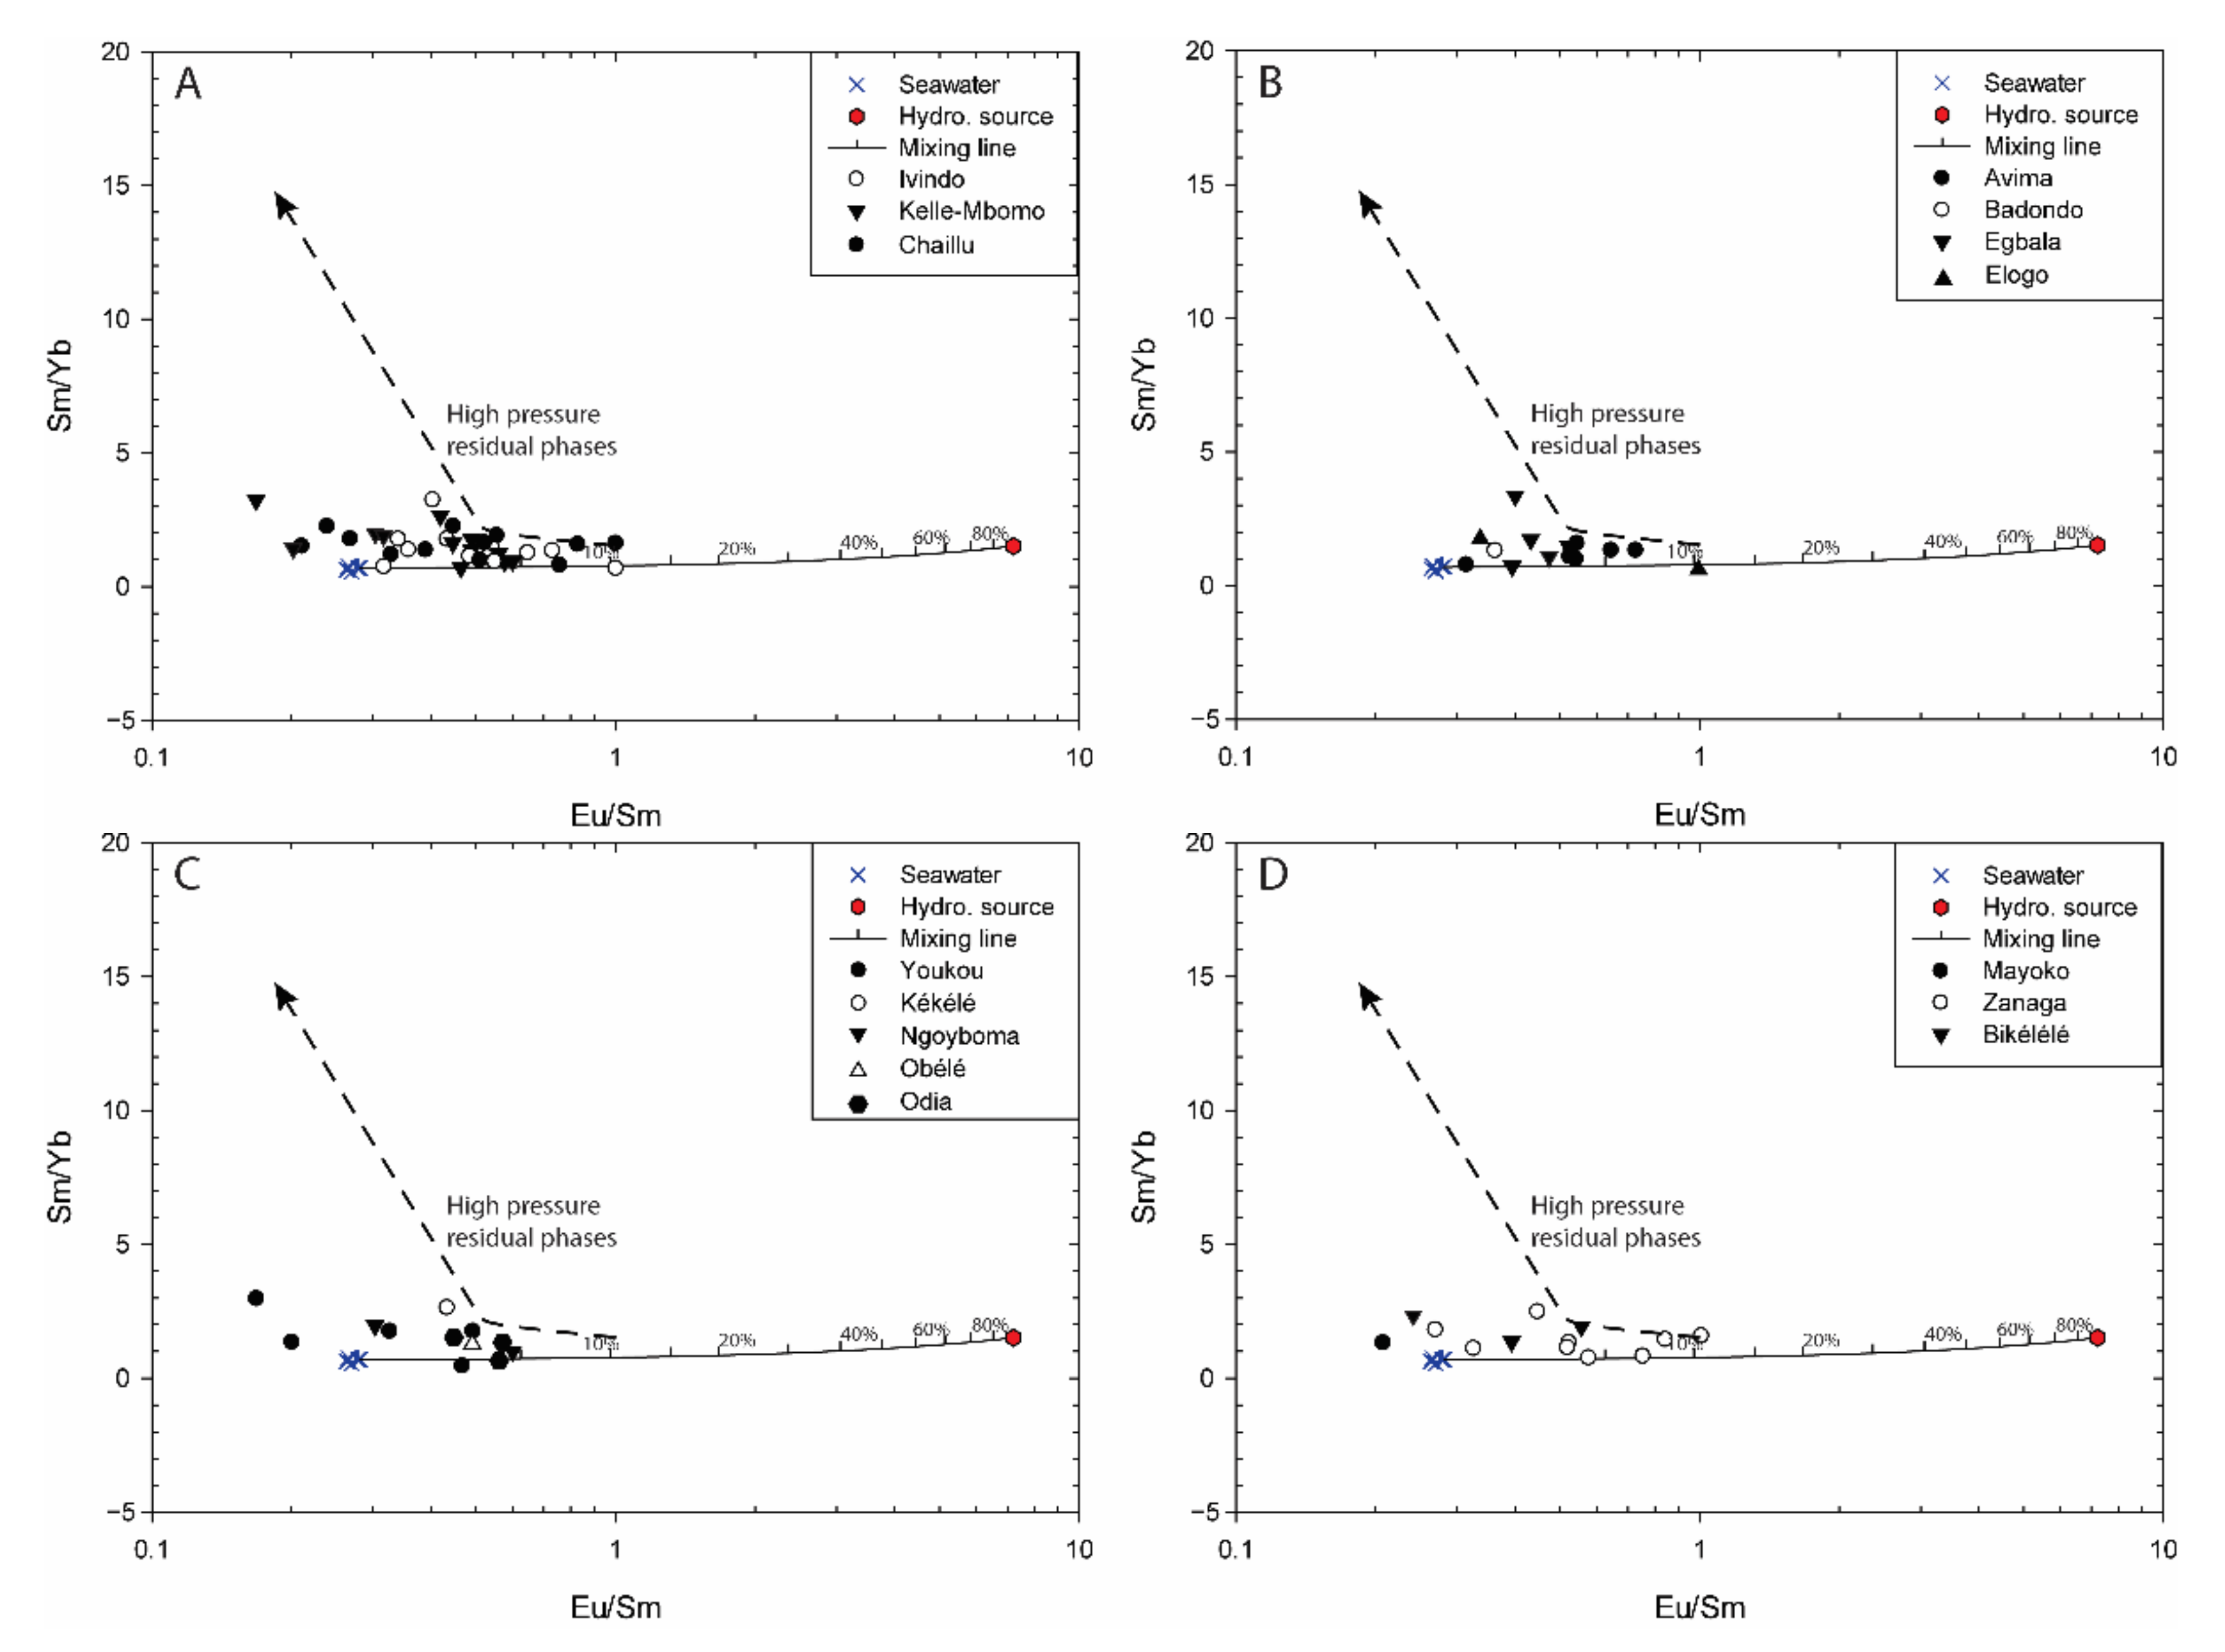
5.1.1. Assessment of High-Temperature (>250 °C) Hydrothermal Fluids
5.1.2. Assessment of Redox Conditions
- -
- closed to open basins that may have been affected by sea-level variations;
- -
- pH variations;
- -
- anoxic to oxic water conditions.
5.1.3. Sources of the Detrital Components
6. Conclusions
Supplementary Materials
Author Contributions
Funding
Acknowledgments
Conflicts of Interest
Appendix A

| SiO2 | Fe2O3 | CaO | MgO | Al2O3 | MnO | Na2O | Cr2O3 | SrO | BaO | TiO2 | K2O | P2O5 | Sc | V | Cr | Co | Ni | Cu | Zn | Ga | Se | Rb | Sr | Zr | Mo | Cd | Sb | Te | Ba | Ta | W | Tl | Pb | Bi | Th | U | |
|---|---|---|---|---|---|---|---|---|---|---|---|---|---|---|---|---|---|---|---|---|---|---|---|---|---|---|---|---|---|---|---|---|---|---|---|---|---|
| SiO2 | 1.00 | ||||||||||||||||||||||||||||||||||||
| Fe2O3 | 0.28 | 1.00 | |||||||||||||||||||||||||||||||||||
| CaO | −0.60 | −0.94 | 1.00 | ||||||||||||||||||||||||||||||||||
| MgO | −0.53 | −0.93 | 0.96 | 1.00 | |||||||||||||||||||||||||||||||||
| Al2O3 | −0.69 | −0.88 | 0.98 | 0.92 | 1.00 | ||||||||||||||||||||||||||||||||
| MnO | −0.37 | −0.80 | 0.79 | 0.84 | 0.72 | 1.00 | |||||||||||||||||||||||||||||||
| Na2O | −0.70 | −0.80 | 0.91 | 0.94 | 0.91 | 0.84 | 1.00 | ||||||||||||||||||||||||||||||
| Cr2O3 | −0.70 | −0.88 | 0.99 | 0.94 | 0.99 | 0.72 | 0.92 | 1.00 | |||||||||||||||||||||||||||||
| SrO | −0.64 | −0.86 | 0.96 | 0.85 | 0.97 | 0.71 | 0.83 | 0.96 | 1.00 | ||||||||||||||||||||||||||||
| BaO | −0.18 | −0.08 | 0.10 | 0.27 | 0.08 | 0.56 | 0.46 | 0.08 | −0.02 | 1.00 | |||||||||||||||||||||||||||
| TiO2 | −0.71 | −0.87 | 0.98 | 0.93 | 1.00 | 0.71 | 0.92 | 1.00 | 0.96 | 0.08 | 1.00 | ||||||||||||||||||||||||||
| K2O | −0.09 | −0.19 | 0.16 | 0.33 | 0.12 | 0.66 | 0.47 | 0.11 | 0.04 | 0.98 | 0.11 | 1.00 | |||||||||||||||||||||||||
| P2O5 | 0.38 | −0.40 | 0.18 | 0.40 | 0.04 | 0.48 | 0.23 | 0.06 | −0.05 | 0.46 | 0.05 | 0.54 | 1.00 | ||||||||||||||||||||||||
| Sc | −0.77 | −0.80 | 0.96 | 0.88 | 0.98 | 0.66 | 0.89 | 0.99 | 0.96 | 0.03 | 0.99 | 0.05 | −0.05 | 1.00 | |||||||||||||||||||||||
| V | −0.71 | −0.87 | 0.98 | 0.94 | 0.99 | 0.71 | 0.92 | 1.00 | 0.96 | 0.09 | 1.00 | 0.11 | 0.06 | 0.99 | 1.00 | ||||||||||||||||||||||
| Cr | −0.70 | −0.87 | 0.98 | 0.93 | 0.99 | 0.72 | 0.92 | 1.00 | 0.96 | 0.07 | 1.00 | 0.10 | 0.04 | 0.99 | 1.00 | 1.00 | |||||||||||||||||||||
| Co | −0.72 | −0.86 | 0.98 | 0.93 | 1.00 | 0.72 | 0.92 | 1.00 | 0.96 | 0.10 | 1.00 | 0.12 | 0.04 | 0.99 | 1.00 | 1.00 | 1.00 | ||||||||||||||||||||
| Ni | −0.70 | −0.88 | 0.99 | 0.94 | 1.00 | 0.72 | 0.92 | 1.00 | 0.96 | 0.08 | 1.00 | 0.11 | 0.06 | 0.99 | 1.00 | 1.00 | 1.00 | 1.00 | |||||||||||||||||||
| Cu | 0.04 | −0.26 | 0.20 | 0.08 | 0.26 | 0.15 | 0.06 | 0.16 | 0.28 | −0.10 | 0.18 | 0.01 | −0.23 | 0.12 | 0.15 | 0.16 | 0.19 | 0.18 | 1.00 | ||||||||||||||||||
| Zn | −0.41 | −0.92 | 0.93 | 0.87 | 0.88 | 0.88 | 0.79 | 0.87 | 0.92 | 0.12 | 0.86 | 0.25 | 0.25 | 0.82 | 0.85 | 0.87 | 0.86 | 0.86 | 0.33 | 1.00 | |||||||||||||||||
| Ga | −0.77 | −0.81 | 0.95 | 0.87 | 0.98 | 0.70 | 0.88 | 0.97 | 0.97 | 0.08 | 0.98 | 0.11 | −0.04 | 0.98 | 0.97 | 0.97 | 0.98 | 0.97 | 0.25 | 0.86 | 1.00 | ||||||||||||||||
| Se | 0.35 | −0.28 | 0.10 | 0.05 | 0.10 | 0.20 | −0.04 | 0.01 | 0.13 | 0.03 | 0.03 | 0.17 | 0.14 | −0.06 | 0.00 | 0.00 | 0.03 | 0.03 | 0.87 | 0.30 | 0.09 | 1.00 | |||||||||||||||
| Rb | 0.01 | 0.01 | −0.04 | 0.14 | −0.07 | 0.49 | 0.30 | −0.08 | −0.16 | 0.98 | −0.08 | 0.98 | 0.51 | −0.14 | −0.08 | −0.09 | −0.07 | −0.08 | −0.04 | 0.05 | −0.08 | 0.14 | 1.00 | ||||||||||||||
| Sr | −0.53 | −0.95 | 0.98 | 0.98 | 0.95 | 0.87 | 0.93 | 0.95 | 0.91 | 0.24 | 0.95 | 0.31 | 0.32 | 0.91 | 0.95 | 0.95 | 0.95 | 0.95 | 0.18 | 0.94 | 0.91 | 0.13 | 0.11 | 1.00 | |||||||||||||
| Zr | −0.72 | −0.83 | 0.96 | 0.87 | 0.99 | 0.67 | 0.87 | 0.98 | 0.97 | 0.02 | 0.98 | 0.05 | −0.08 | 0.97 | 0.98 | 0.98 | 0.98 | 0.98 | 0.34 | 0.86 | 0.98 | 0.13 | −0.13 | 0.91 | 1.00 | ||||||||||||
| Mo | 0.03 | −0.57 | 0.47 | 0.42 | 0.47 | 0.37 | 0.25 | 0.40 | 0.45 | −0.22 | 0.42 | −0.08 | 0.16 | 0.34 | 0.39 | 0.39 | 0.41 | 0.41 | 0.66 | 0.55 | 0.41 | 0.58 | −0.20 | 0.46 | 0.47 | 1.00 | |||||||||||
| Cd | −0.34 | 0.41 | −0.22 | −0.17 | −0.20 | 0.11 | 0.13 | −0.16 | −0.21 | 0.67 | −0.17 | 0.56 | −0.15 | −0.11 | −0.16 | −0.15 | −0.15 | −0.18 | −0.42 | −0.23 | −0.12 | −0.47 | 0.62 | −0.17 | −0.21 | −0.72 | 1.00 | ||||||||||
| Sb | 0.35 | 0.19 | −0.28 | −0.18 | −0.35 | −0.48 | −0.35 | −0.27 | −0.41 | −0.40 | −0.29 | −0.46 | 0.22 | −0.30 | −0.27 | −0.27 | −0.30 | −0.28 | −0.61 | −0.44 | −0.44 | −0.55 | −0.40 | −0.30 | −0.38 | −0.29 | −0.24 | 1.00 | |||||||||
| Te | 0.23 | −0.53 | 0.37 | 0.35 | 0.27 | 0.65 | 0.20 | 0.22 | 0.36 | 0.12 | 0.22 | 0.33 | 0.46 | 0.15 | 0.20 | 0.22 | 0.22 | 0.22 | 0.44 | 0.67 | 0.27 | 0.60 | 0.21 | 0.44 | 0.25 | 0.63 | −0.32 | −0.44 | 1.00 | ||||||||
| Ba | −0.03 | −0.16 | 0.11 | 0.30 | 0.06 | 0.60 | 0.42 | 0.06 | −0.03 | 0.97 | 0.06 | 0.99 | 0.61 | −0.01 | 0.07 | 0.05 | 0.07 | 0.06 | −0.05 | 0.18 | 0.05 | 0.15 | 0.98 | 0.27 | −0.01 | −0.16 | 0.54 | −0.36 | 0.26 | 1.00 | |||||||
| Ta | −0.79 | −0.60 | 0.79 | 0.73 | 0.82 | 0.48 | 0.71 | 0.83 | 0.79 | −0.04 | 0.83 | −0.05 | −0.02 | 0.87 | 0.83 | 0.82 | 0.83 | 0.83 | −0.07 | 0.65 | 0.87 | −0.17 | −0.20 | 0.74 | 0.80 | 0.13 | −0.08 | −0.16 | 0.06 | −0.06 | 1.00 | ||||||
| W | 0.51 | −0.19 | 0.00 | −0.04 | −0.12 | −0.06 | −0.22 | −0.09 | −0.03 | −0.40 | −0.10 | −0.30 | 0.15 | −0.15 | −0.10 | −0.06 | −0.11 | −0.09 | 0.00 | 0.11 | −0.20 | 0.08 | −0.32 | −0.01 | −0.10 | −0.06 | −0.33 | 0.48 | 0.20 | −0.25 | −0.21 | 1.00 | |||||
| Tl | 0.52 | −0.25 | 0.04 | −0.03 | −0.06 | 0.32 | −0.18 | −0.10 | 0.10 | −0.11 | −0.11 | 0.10 | 0.29 | −0.16 | −0.13 | −0.10 | −0.12 | −0.11 | 0.41 | 0.39 | −0.06 | 0.61 | 0.04 | 0.09 | −0.06 | 0.40 | −0.32 | −0.30 | 0.88 | 0.06 | −0.21 | 0.47 | 1.00 | ||||
| Pb | 0.39 | 0.03 | −0.18 | −0.25 | −0.12 | −0.27 | −0.33 | −0.21 | −0.12 | −0.25 | −0.19 | −0.18 | −0.13 | −0.25 | −0.22 | −0.22 | −0.19 | −0.19 | 0.82 | −0.09 | −0.13 | 0.87 | −0.14 | −0.20 | −0.07 | 0.46 | −0.56 | −0.32 | 0.20 | −0.17 | −0.30 | 0.01 | 0.32 | 1.00 | |||
| Bi | −0.28 | 0.56 | −0.34 | −0.49 | −0.28 | −0.43 | −0.32 | −0.25 | −0.16 | −0.30 | −0.26 | −0.39 | −0.74 | −0.13 | −0.25 | −0.23 | −0.25 | −0.27 | −0.34 | −0.35 | −0.18 | −0.57 | −0.33 | −0.44 | −0.21 | −0.60 | 0.50 | 0.06 | −0.44 | −0.42 | 0.00 | 0.04 | −0.21 | −0.41 | 1.00 | ||
| Th | 0.00 | −0.23 | 0.20 | 0.06 | 0.23 | 0.33 | 0.09 | 0.14 | 0.32 | 0.03 | 0.16 | 0.17 | −0.23 | 0.12 | 0.13 | 0.14 | 0.17 | 0.15 | 0.89 | 0.43 | 0.27 | 0.78 | 0.11 | 0.19 | 0.30 | 0.62 | −0.19 | −0.81 | 0.64 | 0.06 | −0.09 | −0.08 | 0.60 | 0.59 | −0.17 | 1.00 | |
| U | −0.40 | 0.39 | −0.16 | −0.27 | −0.10 | −0.24 | −0.20 | −0.12 | −0.05 | −0.17 | −0.11 | −0.22 | −0.38 | 0.01 | −0.11 | −0.13 | −0.10 | −0.12 | −0.16 | −0.16 | 0.07 | −0.20 | −0.19 | −0.22 | −0.06 | −0.30 | 0.23 | −0.20 | −0.13 | −0.23 | 0.41 | −0.39 | −0.10 | −0.10 | 0.54 | −0.05 | 1.00 |
References
- James, H.L. Sedimentary facies of iron-formation. Econ. Geol. 1954, 49, 235–293. [Google Scholar] [CrossRef]
- Goodwin, A.M. Archean iron-formations and tectonic basins of the Canadian Shield. Econ. Geol. 1973, 68, 915–933. [Google Scholar] [CrossRef]
- Bekker, A.; Slack, J.F.; Planavsky, N.; Krapez, B.; Hofmann, A.; Konhauser, K.O.; Rouxel, O.J. Iron formation: The sedimentary product of a complex interplay among mantle, tectonic, oceanic, and biospheric processes. Econ. Geol. 2010, 105, 467–508. [Google Scholar] [CrossRef]
- Huston, D.L.; Logan, G.A. Barite, BIFs and bugs: Evidence for the evolution of the Earth’s early hydrosphere. Earth Planet. Sci. Lett. 2004, 220, 41–55. [Google Scholar] [CrossRef] [Green Version]
- Van den Boorn, S.H.J.M.; Van Bergen, M.J.; Vroon, P.Z.; de Vries, S.T.; Nijman, W. Silicon isotope and trace element constraints on the origin of 3.5 Ga cherts: Implications for early Archaean marine environments. Geochim. Cosmochim. Acta 2010, 74, 1077–1103. [Google Scholar] [CrossRef]
- Hickman-Lewis, K.; Gourcerol, B.; Westall, F.; Manzini, D.; Cavalazzi, B. Reconstructing Palaeoarchaean microbial biomes flourishing in the presence of emergent landmasses using trace and rare earth element systematics. Precambrain Res. 2020, 342, 105689. [Google Scholar] [CrossRef]
- Gourcerol, B.; Thurston, P.; Kontak, D.; Côté-Mantha, O.; Biczok, J. Depositional setting of Algoma-type banded iron formation. Precambrain Res. 2016, 281, 47–79. [Google Scholar] [CrossRef]
- Gourcerol, B.; Kontak, D.J.; Thurston, P.C.; Duparc, Q. Do Magnetite layers in Algoma-Type Banded Iron Formations (BIF) preserve their primary geochemical signature? A case study of samples from three Archean BIF-hosted gold deposits. Can. Mineral. 2016, 54, 605–624. [Google Scholar] [CrossRef]
- Araújo, J.C.S.; Lobato, L.M. Depositional model for banded iron formation host to gold in the Archean Rio das Velhas greenstone belt, Brazil, based on geochemistry and LA-ICP-MS magnetite analyses. J. S. Am. Earth Sci. 2019, 94, 102205. [Google Scholar] [CrossRef]
- Ilouga, C.D.I.; Suh, C.E.; Ghogomu, R.T. Textures and rare earth elements composition of Banded Iron Formations (BIF) at Njweng prospect, Mbalam Iron Ore District, Southern Cameroon. Int. J. Earth Sci. 2013, 4, 146–165. [Google Scholar] [CrossRef] [Green Version]
- Ilouga, D.C.I.; Ndong Bidzang, F.; Ziem A. Bidias, L.A.; Olinga, J.B.; Tata, E.; Minyem, D. Geochemical characterization of a stratigraphic log bearing iron ore in the Sanaga prospect, Upper Nyong Unit of Ntem Complex, Cameroon. Int. J. Geosci. Geomat. 2017, 5, 218–228. [Google Scholar]
- Ganno, S.; Ngnotue, T.; Kouankap Nono, G.D.; Nzenti, J.P.; Notsa Fonkeng, M. Petrology and geochemistry of the banded iron-formations from Ntemcomplex greenstones belt, Elom area, Southern Camroon: Implications for the origin and depositional environment. Geochemistry 2015, 75, 375–387. [Google Scholar]
- Ganno, S.; Njiosseu Tanko, E.L.; Kouankap, N.G.D.; Djoukouo Soh, A.; Moudioh, C.; Ngnotue, T.; Nzenti, J.P. A mixed seawater and hydrothermal origin of superior-type banded iron formation (BIF)-hosted Kouambo iron deposit, Palaeoproterozoic Nyong series, Southwestern Cameroon: Constraints from petrography and geochemistry. Ore Geol. Rev. 2017, 80, 860–875. [Google Scholar]
- Teutsong, T.; Bontognali, T.R.R.; Ndjiogui, P.-D.; Vrijmoed, J.C.; Teagle, D.; Cooper, M.; Vance, D. Petrography and geochemistry of the Mesoarchean Bikoula banded iron formation in the Ntem complex (Congo Craton), Southern Cameroon. Implications for its origin. Ore Geol. Rev. 2017, 80, 267–288. [Google Scholar] [CrossRef] [Green Version]
- Ndime, E.N.; Ganno, S.; Soh Tamehe, L.; Nzenti, J.P. Petrography, lithostratigraphy and major element geochemistry of Mesoarchean metamorphosed banded iron formation-hosted Nkout iron ore deposit, north western Congo craton, Central West Africa. J. Afr. Earth Sci. 2019, 148, 80–98. [Google Scholar] [CrossRef]
- Moudioh, C.; Soh Tamehe, L.; Ganno, S.; Nzepang Tankwa, M.; Brando Soares, M.; Ghosh, R.; Kankeu, J.; Nzentia, P. Tectonic setting of the Bipindi greenstone belt, northwest Congo craton, Cameroon: Implications on BIF deposition. J. Afr. Earth Sci. 2020, 171, 103971. [Google Scholar] [CrossRef]
- Soh Tamehe, L.; Nzepang, T.M.; Wei, C.T.; Ganno, S.; Ngnotue, T.; Kouankap, N.G.D.; Simon, S.J.; Zhang, J.J.; Nzenti, J.P. Geology and geochemical constrains on the origin and depositional setting of the Kpwa–Atog Boga banded iron formations (BIFs), northwestern Congo craton, southern Cameroon. Ore Geol. Rev. 2018, 95, 620–638. [Google Scholar] [CrossRef]
- Soh Tamehe, L.; Chongtao, W.; Ganno, S.; Simon, S.J.; Kouankap Nono, G.D.; Nzenti, J.P.; Lembjou, B.Y.; Lin, N.H. Geology of the Gouap iron deposit, Congo craton, southern Cameroon: Implication for iron ore exploration. Ore Geol. Rev. 2019, 107, 1097–1128. [Google Scholar] [CrossRef]
- Retonda Kondja, S.; Ndong Ondo, S.M.; Edou Minko, A.; Mayaga Mikolo, F. The Bélinga Iron Ore Deposit (∼2.8 Ga), NE-Gabon: Reactualization and new interpretations on crests. Eur. Sci. J. 2017, 13, 307–321. [Google Scholar]
- Thiéblemont, D.; Liégeois, J.P.; Fernandez-Alonso, M.; Ouabadi, A.; Le Gall, B.; Maury, R.; Jalludin, M.; Vidal, M.; Ouattara-Gbélé, C.; Tchaméni, R.; et al. Geological Map of Africa at 1:10 M Scale; Editors CGMW-BRGM: Orléans, France, 2016. [Google Scholar]
- Thiéblemont, D.; Castaing, C.; Billa, M.; Bouton, P.; Préat, A. Notice Explicative de la Carte Géologique et des Ressources Minérales de la République Gabonaise à 1/1 000 000; Editor DGMG—Ministère des Mines, du Pétrole, des Hydrocarbures: Libreville, Gabon, 2009; p. 381. [Google Scholar]
- Chevallier, L.; Makanga, J.F.; Thomas, R.J. Notice Explicative de la Carte Géologique de la République Gabonaise à 1/1 000 000; Editions DGMG Gabon: Libreville, Gabon, 2002; p. 195. [Google Scholar]
- Blein, O.; Callec, Y.; Fullgraf, T.; Chevillard, M.; Cagnard, F.; Bauer, H.; Prognon, F.; Badinier, G.; Vic, G.; Boudzoumou, F.; et al. Notice Explicative de la Carte Géologique de la République Du Congo à 1/200 000, Feuille Mbomo; Editor BRGM: Brazzaville, République du Congo, 2017; 206p. [Google Scholar]
- Chevillard, M.; Fullgraf, T.; Blein, O.; Badinier, G.; Boudzoumou, F.; Joannes, C.; Rouzeau, O.; Callec, Y. Carte Géologique de la République du Congo à 1/200 000, Feuille Ewo; Editor BRGM: Brazzaville, République du Congo, 2017; 1p. [Google Scholar]
- Fullgraf, T.; Blein, O.; Le Bayon, B.; Cagnard, F.; Boudzoumou, F.; Joannes, C.; Chevillard, M.; Melleton, J.; Callec, Y. Notice Explicative de la Carte Géologique de la République du Congo à 1/200 000, Feuille Mékambo-Mintom; Editor BRGM: Brazzaville, République du Congo, 2017; 148p. [Google Scholar]
- Gloaguen, E.; Chevillard, M.; Fullgraf, T.; Blein, O.; Boudzoumou, F.; Joannes, C.; Badinier, G.; Issautier, B.; Callec, Y.; Madous, P.L.; et al. Carte Géologique de la République du Congo à 1/200 000, Feuille Zanaga; Editor BRGM: Brazzaville, République du Congo, 2017; 1p. [Google Scholar]
- Issautier, B.; Chevillard, M.; Fullgraf, T.; Callec, Y.; Le Bayon, B.; Schroetter, J.-M.; Gloaguen, E.; Blein, O.; Prognon, F.; Badinier, G.; et al. Carte Géologique de la République du Congo à 1/200 000, Feuille Sembé-Souanké; Editor BRGM: Brazzaville, République du Congo, 2017; 1p. [Google Scholar]
- Chevillard, M.; Fullgraf, T.; Blein, O.; Bauer, H.; Prognon, F.; Badinier, G.; Vic, G.; Boudzoumou, F.; Loumbi Tatinéné, C.M.; Ngandziami, P.V.; et al. Carte Géologique de la République Du Congo à 1/200 000, Feuille Mbomo; Editor BRGM: Brazzaville, République du Congo, 2017; 1p. [Google Scholar]
- Chevillard, M.; Callec, Y.; Gloaguen, E.; Paquet, F.; Serrano, O.; Fullgraf, T.; Blein, O.; Boudzoumou, F.; Joannes, C.; Devoir, A.; et al. Carte Géologique de la République Du Congo à 1/200 000, Feuille Mossendjo; Editor BRGM: Brazzaville, République du Congo, 2017; 1p. [Google Scholar]
- Chevillard, M.; Gloaguen, E.; Fullgraf, T.; Blein, O.; Callec, Y.; Paquet, F.; Serrano, O.; Melleton, J.; Boudzoumou, F.; Cagnard, F.; et al. Notice Explicative de la Carte Géologique de la République Du Congo à 1/200 000, Feuille Mossendjo; Editor BRGM: Brazzaville, République du Congo, 2017; 159p. [Google Scholar]
- Thiéblemont, D.; Agenbacht, A.; Boulingui, B.; Bouton, P.; Ekogha, H.; Goujou, J.C.; Kassadou, A.B.; Moussavou, M.; Prian, J.P.; Theunissen, K.; et al. Synchronous BIF, HT metamorphism and granitic plutonism at ca. 2.8 Ga in Gabon. In Proceedings of the 23th Congress on African Geology, Johannesburg, South Africa, 11–14 January 2011. [Google Scholar]
- Cunningham, M.; De Waele, B. Geological mapping of Badondo and iron mineralization targets, Republic of the Congo. Struct. Geol. Resour. 2012, 54, 54–56. [Google Scholar]
- Avima Iron Ore. 2016. Available online: http://avimairon.com/avima.html (accessed on 16 January 2022).
- Gates Ebotehouna, C.; Xie, Y.; Adomako-Ansah, K.; Gourcerol, B.; Qu, Y. Depositional setting and genesis of the Nabeba BIF hosting high-grade iron ore deposit, NW of the Republic Congo. Minerals 2021, 11, 579. [Google Scholar]
- Caen-Vachette, M.; Vialette, Y.; Bassot, J.P.; Vidal, P. Apport de la géochronologie isotopique à la connaissance de la géologie gabonaise. Chron. Rech. Min. 1988, 491, 35–53. [Google Scholar]
- Bouton, P.; Thiéblemont, D.; Gouin, J.; Cocherie, A.; Guerrot, C.; Tegyey, M.; Préat, A.; Simo Ndounze, S.; Moussavou, M. Notice Explicative de la Carte Géologique de la République du Gabon à 1/200 000, Feuille Franceville-Boumango; Edition DGMG-Ministère des Mines, du Pétrole, des Hydrocarbures: Libreville, Gabon, 2009; p. 79. [Google Scholar]
- Sindhuja, C.S.; Manikyamba, C.; Pahari, A.; Satyanarayanan, M. Geochemistry of banded sulphidic cherts of Sandur greenstone belt, Dharwar Craton, India: Constraints on hydrothermal processes and gold mineralization. Ore Geol. Rev. 2020, 122, 103529. [Google Scholar] [CrossRef]
- Lawrence, M.G.; Kamber, B.S. The behavior of the rare earth elements during estuarine mixing—Revisited. Mar. Chem. 2006, 100, 147–161. [Google Scholar] [CrossRef]
- Bonnand, P.; Lalonde, S.V.; Boyeta, M.; Heubeck, C.; Homann, M.; Nonnotte, P.; Foster, I.; Konhauser, K.O.; Köhler, I. Post-depositional REE mobility in a Paleoarchean banded iron formation revealed by La-Ce geochronology: A cautionary tale for signals of ancient oxygenation. Earth Planet. Sci. Lett. 2020, 547, 116452. [Google Scholar] [CrossRef]
- Mukhopadhyay, J.; Crowley, Q.G.; Ghosh, S.; Ghosh, G.; Chakrabarti, K.; Misra, B.; Heron, K.; Bose, S. Oxygenation of the Archean atmosphere: New paleosol constraints from eastern India. Geology 2014, 42, 923–926. [Google Scholar] [CrossRef]
- Danielson, A.; Möller, P.; Dulski, P. The europium anomalies in banded iron formations and the thermal history of the oceanic crust. Chem. Geol. 1992, 97, 89–100. [Google Scholar] [CrossRef]
- Bau, M.; Dulski, P. Comparing yttrium and rare earths in hydrothermal fluids from the Mid-Atlantic Ridge: Implications for Y and REE behaviour during near- vent mixing and for the Y/Ho ratio of Proterozoic seawater. Chem. Geol. 1999, 155, 77–90. [Google Scholar] [CrossRef]
- Allwood, A.C.; Kamber, B.S.; Walter, M.R.; Burch, I.W.; Kanik, I. Trace element record depositional history of an Early Archean stromatolitic carbonate platform. Chem. Geol. 2010, 270, 148–163. [Google Scholar] [CrossRef]
- Thurston, P.C.; Kamber, B.S.; Whitehouse, M. Archean cherts in banded iron formation: Insight into Neoarchean ocean chemistry and depositional processes. Precambrian Res. 2012, 214, 227–257. [Google Scholar] [CrossRef]
- Nesbitt, H.W. Mobility and fractionation of rare earth elements during weathering of granodiorite. Nature 1979, 279, 206–210. [Google Scholar] [CrossRef]
- Gourcerol, B.; Thurston, P.C.; Kontak, D.J.; Côté-Mantha, O. Interpretations and implications of LA ICP-MS analysis of chert for the origin of geochemical signatures in banded iron formations (BIFs) from the Meadowbank gold deposit, Western Churchill Province, Nunavut. Chem. Geol. 2015, 410, 89–107. [Google Scholar] [CrossRef]
- Alexander, B.W.; Bau, M.; Andersson, P.; Dulski, P. Continentally-derived solutes in shallow Archean sea water; rare earth element and Nd isotope evidence in iron formation from the 2.9 Ga Pongola Supergroup, South Africa. Geochim. Cosmochim. Acta 2008, 72, 378–394. [Google Scholar] [CrossRef]
- Alibo, D.S.; Nozaki, Y. Rare earth elements in seawater: Particle association, shale-normalization, and Ce oxidation. Geochim. Cosmochim. Acta 1999, 63, 363–372. [Google Scholar] [CrossRef]
- Kawabe, I.; Ohta, A.; Ishii, S.; Tokumura, M.; Miyauchi, K. REE partitioning between Fe-Mn oxyhydroxide precipitates and weakly acid NaCl solutions: Convex tetrad effect and fractionation of Y and Sc from heavy lanthanides. Geochem. J. 1999, 33, 167–179. [Google Scholar] [CrossRef] [Green Version]
- Bau, M.; Koschinsky, A. Oxidative scavenging of cerium on hydrous Fe oxide: Evidence from distribution of rare earth elements and yttrium between Fe oxides and Mn oxides in hydrogenetic ferro manganeses crusts. Geochem. J. 2008, 43, 37–47. [Google Scholar] [CrossRef] [Green Version]
- Bau, M. Scavenging of dissolved yttrium and rare earths by precipitating iron oxyhydroxide: Experimental evidence for Ce oxidation, Y-Ho fractionation, and lanthanide tetrad effect. Geochim. Cosmochim. Acta 1999, 63, 67–77. [Google Scholar] [CrossRef]
- Rouxel, O.J.; Bekker, A.; Edwards, K.J. Iron Isotope Constraints on the Archean and Paleoproterozoic Ocean Redox State. Science 2005, 307, 1088–1091. [Google Scholar] [CrossRef] [Green Version]
- Fralick, P.; Riding, R. Steep Rock Lake: Sedimentology and geochemistry of an Archean carbonate platform. Earth-Sci. Rev. 2015, 151, 132–175. [Google Scholar] [CrossRef]
- Swanner, E.D.; Maisch, M.; Wu, W.; Kappler, A. Oxic Fe(III)reduction could have generated Fe(II) in the photic zone of Precambrian seawater. Nature 2018, 8, 4238. [Google Scholar] [CrossRef]
- Bhatia, M.R.; Crook, K.A.W. Trace element characteristics of graywackes and tectonic setting discrimination of sedimentary basins. Contrib. Mineral. Petrol. 1986, 92, 181–193. [Google Scholar] [CrossRef]
- Bau, M.; Alexander, B.W. Distribution of high field strength elements (Y, Zr, REE, Hf, Ta, Th, U) in adjacent magnetite and chert bands and in reference standards FeR-3 and FeR-4 from the Temagami iron-formation, Canada, and the redox level of the Neoarchean ocean. Precambrain Res. 2009, 174, 337–346. [Google Scholar] [CrossRef]
- Pecoits, E.; Gringas, M.K.; Barley, M.E.; Kappler, A.; Posth, N.R.; Konhauser, K.O. Petrography and geochemistry of the Dales Gorge banded iron formation: Paragenetic sequence, source and implications for palaeo-ocean chemistry. Precambrain Res. 2009, 172, 163–187. [Google Scholar] [CrossRef]
- Dare, S.A.S.; Beaudoin, G.; Méric, J.; Boutroy, E.; Potvin-Doucet, C. Trace elements in magnetite as petrogenetic indicators. Miner. Depos. 2014, 49, 785–796. [Google Scholar] [CrossRef]
- Mloszewska, A.M.; Pecoits, E.; Cates, N.L.; Mojzsis, S.J.; O’Neil, J.; Robbins, L.J.; Konhauser, K.O. The compositon of Earth’s oldest iron formations: The Nuvvuagittuq Supracrustal belt (Québec, Canada). Earth Planet. Sci. Lett. 2012, 317, 331–342. [Google Scholar] [CrossRef]


Publisher’s Note: MDPI stays neutral with regard to jurisdictional claims in published maps and institutional affiliations. |
© 2022 by the authors. Licensee MDPI, Basel, Switzerland. This article is an open access article distributed under the terms and conditions of the Creative Commons Attribution (CC BY) license (https://creativecommons.org/licenses/by/4.0/).
Share and Cite
Gourcerol, B.; Blein, O.; Chevillard, M.; Callec, Y.; Boudzoumou, F.; Djama, L.-M.J. Depositional Setting of Archean BIFs from Congo: New Insight into Under-Investigated Occurrences. Minerals 2022, 12, 114. https://doi.org/10.3390/min12020114
Gourcerol B, Blein O, Chevillard M, Callec Y, Boudzoumou F, Djama L-MJ. Depositional Setting of Archean BIFs from Congo: New Insight into Under-Investigated Occurrences. Minerals. 2022; 12(2):114. https://doi.org/10.3390/min12020114
Chicago/Turabian StyleGourcerol, Blandine, Olivier Blein, Matthieu Chevillard, Yannick Callec, Florent Boudzoumou, and Louis-Marie Joachim Djama. 2022. "Depositional Setting of Archean BIFs from Congo: New Insight into Under-Investigated Occurrences" Minerals 12, no. 2: 114. https://doi.org/10.3390/min12020114
APA StyleGourcerol, B., Blein, O., Chevillard, M., Callec, Y., Boudzoumou, F., & Djama, L.-M. J. (2022). Depositional Setting of Archean BIFs from Congo: New Insight into Under-Investigated Occurrences. Minerals, 12(2), 114. https://doi.org/10.3390/min12020114