Article

Multivariate Analysis of Magnetic Parameters and Trace Metals in Atmospheric Dustfall and Its Environmental Implications in Northern China

1
National Key Laboratory of Ecological Security and Resource Utilization in Arid Areas, Xinjiang Institute of Ecology and Geography, Chinese Academy of Sciences, Urumqi 830011, China
2
Geomagnetism Laboratory, Department of Earth and Ocean Sciences, University of Liverpool, Liverpool L69 7ZE, UK
3
University of Chinese Academy of Sciences, Beijing 100049, China
*
Author to whom correspondence should be addressed.
Minerals 2022, 12(12), 1598; https://doi.org/10.3390/min12121598
Submission received: 21 October 2022 / Revised: 6 December 2022 / Accepted: 10 December 2022 / Published: 12 December 2022
(This article belongs to the Special Issue Environmental Magnetism and Its Implication for Heavy Metal Pollution)

Abstract

:
Magnetic measurement was combined with geochemical analysis to investigate the trace metal pollution of atmospheric dustfall from rural areas of Inner Mongolia and urban regions of Hebei province in northern China. It is found that the type of magnetic mineral within atmospheric dustfall samples in Inner Mongolia is similar to those found in Hebei province, but the atmospheric dustfall samples in Inner Mongolia have lower magnetic mineral concentrations and finer particles. Linear multiple regression analyses show that the relationship between magnetic parameters and trace metals is found to vary between the contrasting rural and urban areas, and is controlled by the different source magnetic minerals. The concentration- and type-dependent magnetic properties of the particles correlated strongly with the concentrations of trace metals derived from natural processes, and the grain size-dependent magnetic parameters correlated negatively and significantly with the concentrations of trace metals derived from anthropogenic activities.

1. Introduction

Among abiotic stresses to earth’s ecosystem, atmospheric pollution ranks as the most harmful [1], and particulate matter (PM) in the atmosphere can cause serious health problems for humans and animals, as well as visible degradation to infrastructure. PM can be of natural or anthropogenic origin and emitted from point, mobile, or areal sources [2]. It can impact air quality both in local source regions and in large areas downwind, due to long-range transport. Diversity in particle origin and size composition is observed in PM. Therefore, dust prediction and observations can help constrain the relative contribution of natural or anthropogenic origin to total pollution. It allows the drawing-up of policies aimed at reducing emissions and the appraisal of their long-term effectiveness [3].
Trace metals, sometimes with serious toxic side effects, are omnipresent in PM and can be transported over long distances [4]. The atmospheric-deposited dust in urban settings is an important carrier of these trace metal contaminants [5]. Magnetic measurements on deposited atmospheric dust can provide ancillary parameters for rapidly assessing environmental pollution. They rely on the naturally-present magnetic iron oxides and hydroxides which can comprise up to 70% of the bulk Fe content in urban PM [1] and are readily measured with standard instrumentation.
Application of mineral magnetic techniques to the study of atmospheric dust commencing in the 1980s are successfully able to recognize different source types [6,7,8,9]. Since then, many studies have combined chemical and magnetic parameters to characterize atmospheric dust [10,11,12]. The statistical relationship between magnetic and chemical parameters in the dust [5,13], soil [11,14], sediment [15,16], and plants [17,18] was observed, indicating that magnetic parameters can be employed as effective proxies to assess trace metal pollution.
Dry deposition is a key sink of atmospheric particles, which impact human and ecosystem health, and the radiative balance of the planet [19]. Therefore, the usage of dustfall samples collected from dry deposition sampler for the prediction of airborne trace metal concentrations may provide a practical alternative to the complex PM sampling methods and chemical analyses of airborne trace metals. In this study, atmospheric-deposited material was collected simultaneously from rural locations in Inner Mongolia and urban locations in Hebei. The magnetic properties and trace metal concentrations in dustfall samples were measured. The primary aim of this case study was to establish a method for predicting trace metal concentrations in PM using the stepwise method with pollutant concentrations and magnetic properties as inputs, thus exploiting the demonstrated relationship between trace metal concentrations and magnetic properties.

2. Materials and Methods

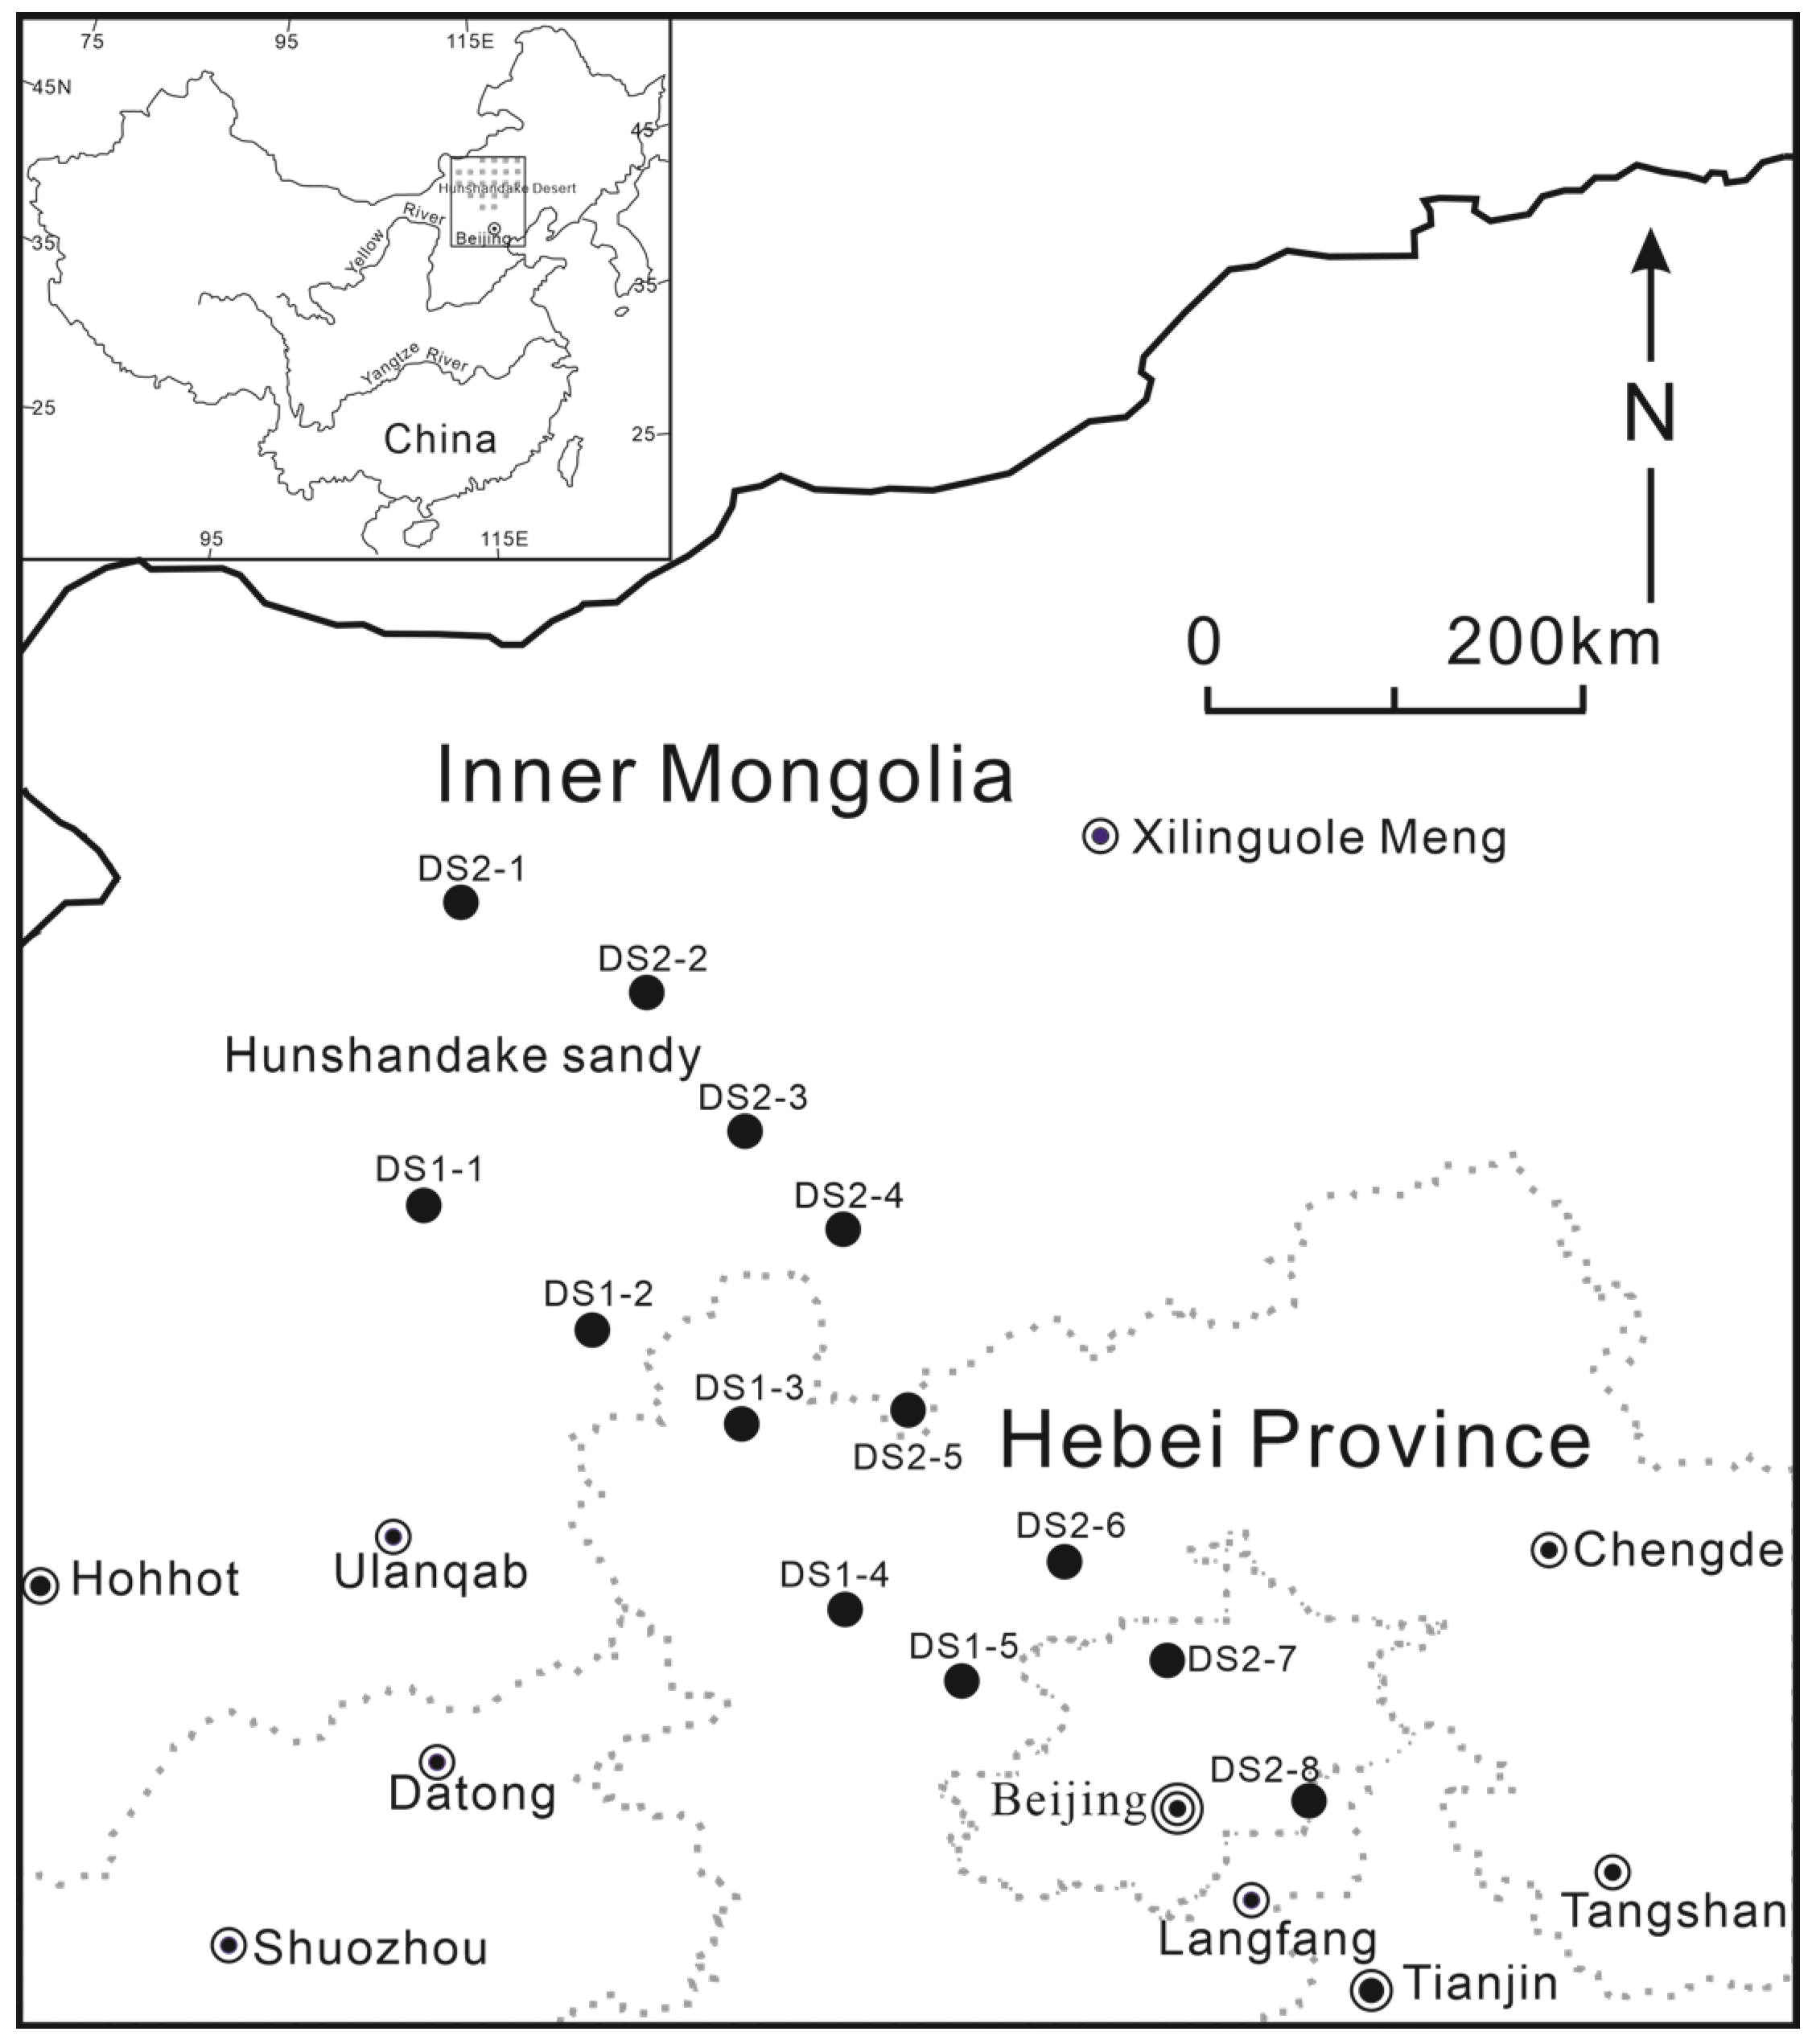
2.1. Study Area and Sampling

The Hunshandake Sandy Land (HSL, Figure 1) is located in the eastern part of Inner Mongolia where there are 50–110 windy days yearly with wind velocities ≥ 5 ms−1 are capable of moving sand grade material [20]. The HSL lies directly upwind of extensive metropolitan areas and the airborne dust is transported across much of northern China including Beijing, central Hebei, and Tianjin; it can potentially move farther to the east over Korea and ultimately over Japan [21]. In Inner Mongolia the population is predominantly rural; people live mostly in separate households and can cover quite large areas as they pasture their animals [22]. In contrast, the population of Hebei province is predominantly urban and concentrated, and there is an extensive industrial infrastructure with mining and manufacturing incorporating materials including coal, iron, oil, steel, and textiles.
Atmospherically-deposited dust has been collected in Inner Mongolia and Hebei Province from locations spanning a NW-SE zone embracing two contrasting sets of sites, firstly in countryside away from pollution sources and representative of the rural background, and secondly at sites within the zones of anthropogenic pollution (Figure 1). The sampling approach and the methods of element analysis and magnetic measurement are described in detail in [23] and will not be repeated here. Based on the magnetic susceptibility values and the sufficient amount for element analysis (exclude site DS2-1), we selected 48 samples from the same month in each quarter for trace metal analysis. Sites DS2-7 and DS2-8 are distributed in Beijing, site DS2-5 is located on the border of Inner Mongolia and Hebei province, so we do not consider these sites in this study.

2.2. Descriptive Analysis, Correlation Analysis, and Multivariate Analysis

Descriptive data analysis, including calculation of the mean and standard deviation (SD), has been performed on the concentrations of the trace metals. Correlation coefficients are calculated to identify relationships between the different elements and to identify sources that may have similar origins. Principal component analysis (PCA) is routinely used to emphasize variations and highlight patterns in a dataset; it is employed in this study to reduce dimensionality in the data whilst aiming to preserve relationships present in the original results [24]. The program SPSS for window, version 18.0 (SPSS Inc, USA) has been used for the descriptive and correlation analyses, and for the multivariate statistical analysis.

3. Results and Discussion

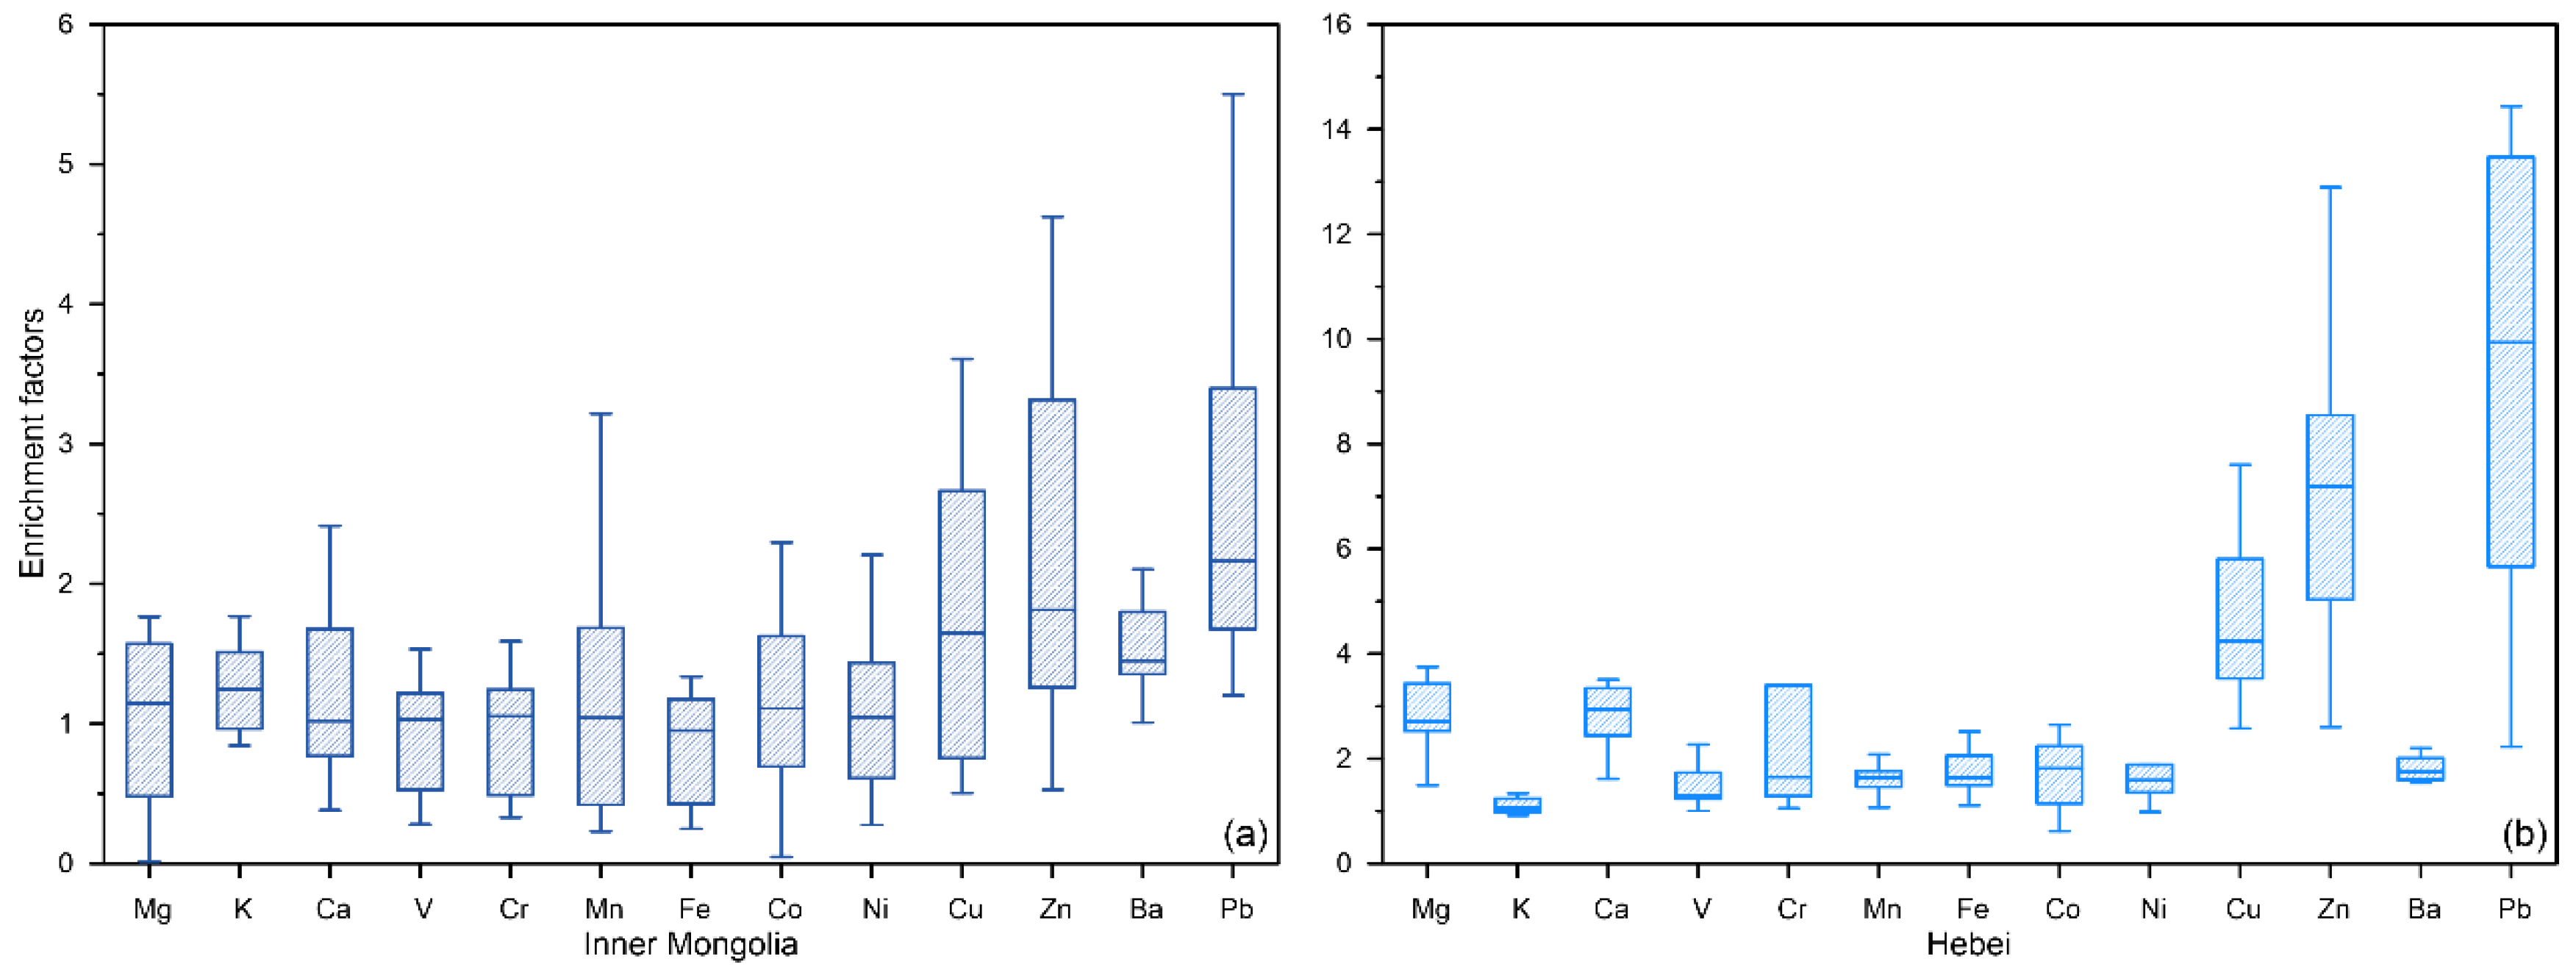
3.1. Elemental Concentrations

The average concentration of trace metals, expressed as mass-related contents (μg/g), in dustfall was in the decreasing order of K > Ca > Fe > Mg > Ba > Mn > Zn > Pb > V > Cr > Cu >Ni > Co for Inner Mongolia. With the exception of K, this order is largely preserved in urban Hebei: Ca > Fe > Mg > K > Ba > Mn > Zn > Pb ≈ Cr > V ≈ Cu > Ni > Co (Table 1). The enrichment factor (EF) is one of the most common environmental indices applied to distinguish the anthropogenic and natural sources of the elements in the samples based on their ratio to the primary component in the background soil composition [25,26].
The EF was calculated according to the following algorithm:
EF = (X/Eref)sample/(X/Eref)background
where X is the concentration of the element to be evaluated and Eref is the concentration of the reference element. Selection of a relevant background composition is crucial in the calculation of EF, and a local, study-specific background could be a better strategy [27,28]. For most trace metals of environmental interest, concentrations in soil easily vary over 2–3 orders of magnitude depending on the parent material from which the soil was derived [29]. Therefore, the trace metal contents of soils in Inner Mongolia and Hebei were used as the regional background values (Table 1) [30]. Al, due to its terrestrial origin and dominance in the earth’s crust composition, was used as the reference element in our study.
Both EF and pollution load index (PLI) specify various levels of contamination in the studied areas although their outcomes are mostly uniform. In our previous study, we used PLI to assess the metal contamination in dustfall [23]. PLI is an aggregative explanation of the overall level of metal pollution, whereas EF was calculated for individual elements over the average elemental composition, and EFs use terrestrial element (Al in this study) for normalization in the calculation and appear to provide better contamination assessment than PLI, as it considers more metals [31].
By convention, a value of 0.5 ≤ EF ≤ 1.5 indicates that the trace elements enrichment is entirely provided by crustal contribution, whereas EF > 1.5 suggests that contamination is linked to anthropogenic sources [32]. Moreover, five contamination categories classified into deficiency to minimal enrichment (EF < 2), moderate enrichment (2 ≤ EF < 5), significant enrichment (5 ≤ EF < 20), very high enrichment (20 ≤ EF < 40), and extremely high enrichment (EF ≥ 40) [33]. Cu, Zn, and Pb in dustfall from Inner Mongolia, with their mean EFs between 2 and 5 (Table 1, Figure 2a), were classified as moderately contaminated. The mean EFs for Mg, Ca, Cr, Cu, Zn, Ba, and Pb in samples from Hebei province were all higher than 2 (Table 1, Figure 2b), and this indicates that the dominant source for these elements was non-crustal sources.

3.2. Correlation Analysis

Pearson’s correlation coefficients of trace metals in the dustfall samples are compiled in Table 2. From Table 2, most of the trace metal pairs show significant positive or negative relationships in the Inner Mongolia dustfall samples. Mg, Ca, V, Cr, Mn, Fe, Co, and Ni correlate significantly positively with each other (r ≥ 0.475, p = 0.01 or p = 0.05), which may suggest a common origin, while Cu, Zn, and Pb form another group based on their positive correlation (r ≥ 0.522, p = 0.01 or p = 0.05). Ca and Cr are also positively correlated to Cu, Zn, and Pb (r ≥ 0.485, p = 0.01 or p = 0.05), indicating that apart from a natural source, it may also be influenced by anthropogenic activities. K is negatively correlated with other metals except significant positive relationships are found among K and Ba (r = 0.674, p = 0.01), reflecting different sources of K, Ba, and other elements.
As shown in Table 2, significant positive relationships are found among V and Mn, Fe, Co (r ≥ 0.753, p = 0.01), Mn and Fe, Co, Ni (r ≥ 0.638, p = 0.01 or p = 0.05), Fe and Co (r = 0.875, p = 0.01) in Hebei dustfall, indicating that they may have the same sources. By the way, Ni is also positively correlated to Cr and Cu (r ≥ 0.613, p = 0.01 or p = 0.05), indicating that Ni was likely to be of mixed origin. Moreover, Pb exhibits a significant positive correlation with Zn and Ba (r ≥ 0.918, p = 0.01), it can be interpreted as the same contribution.

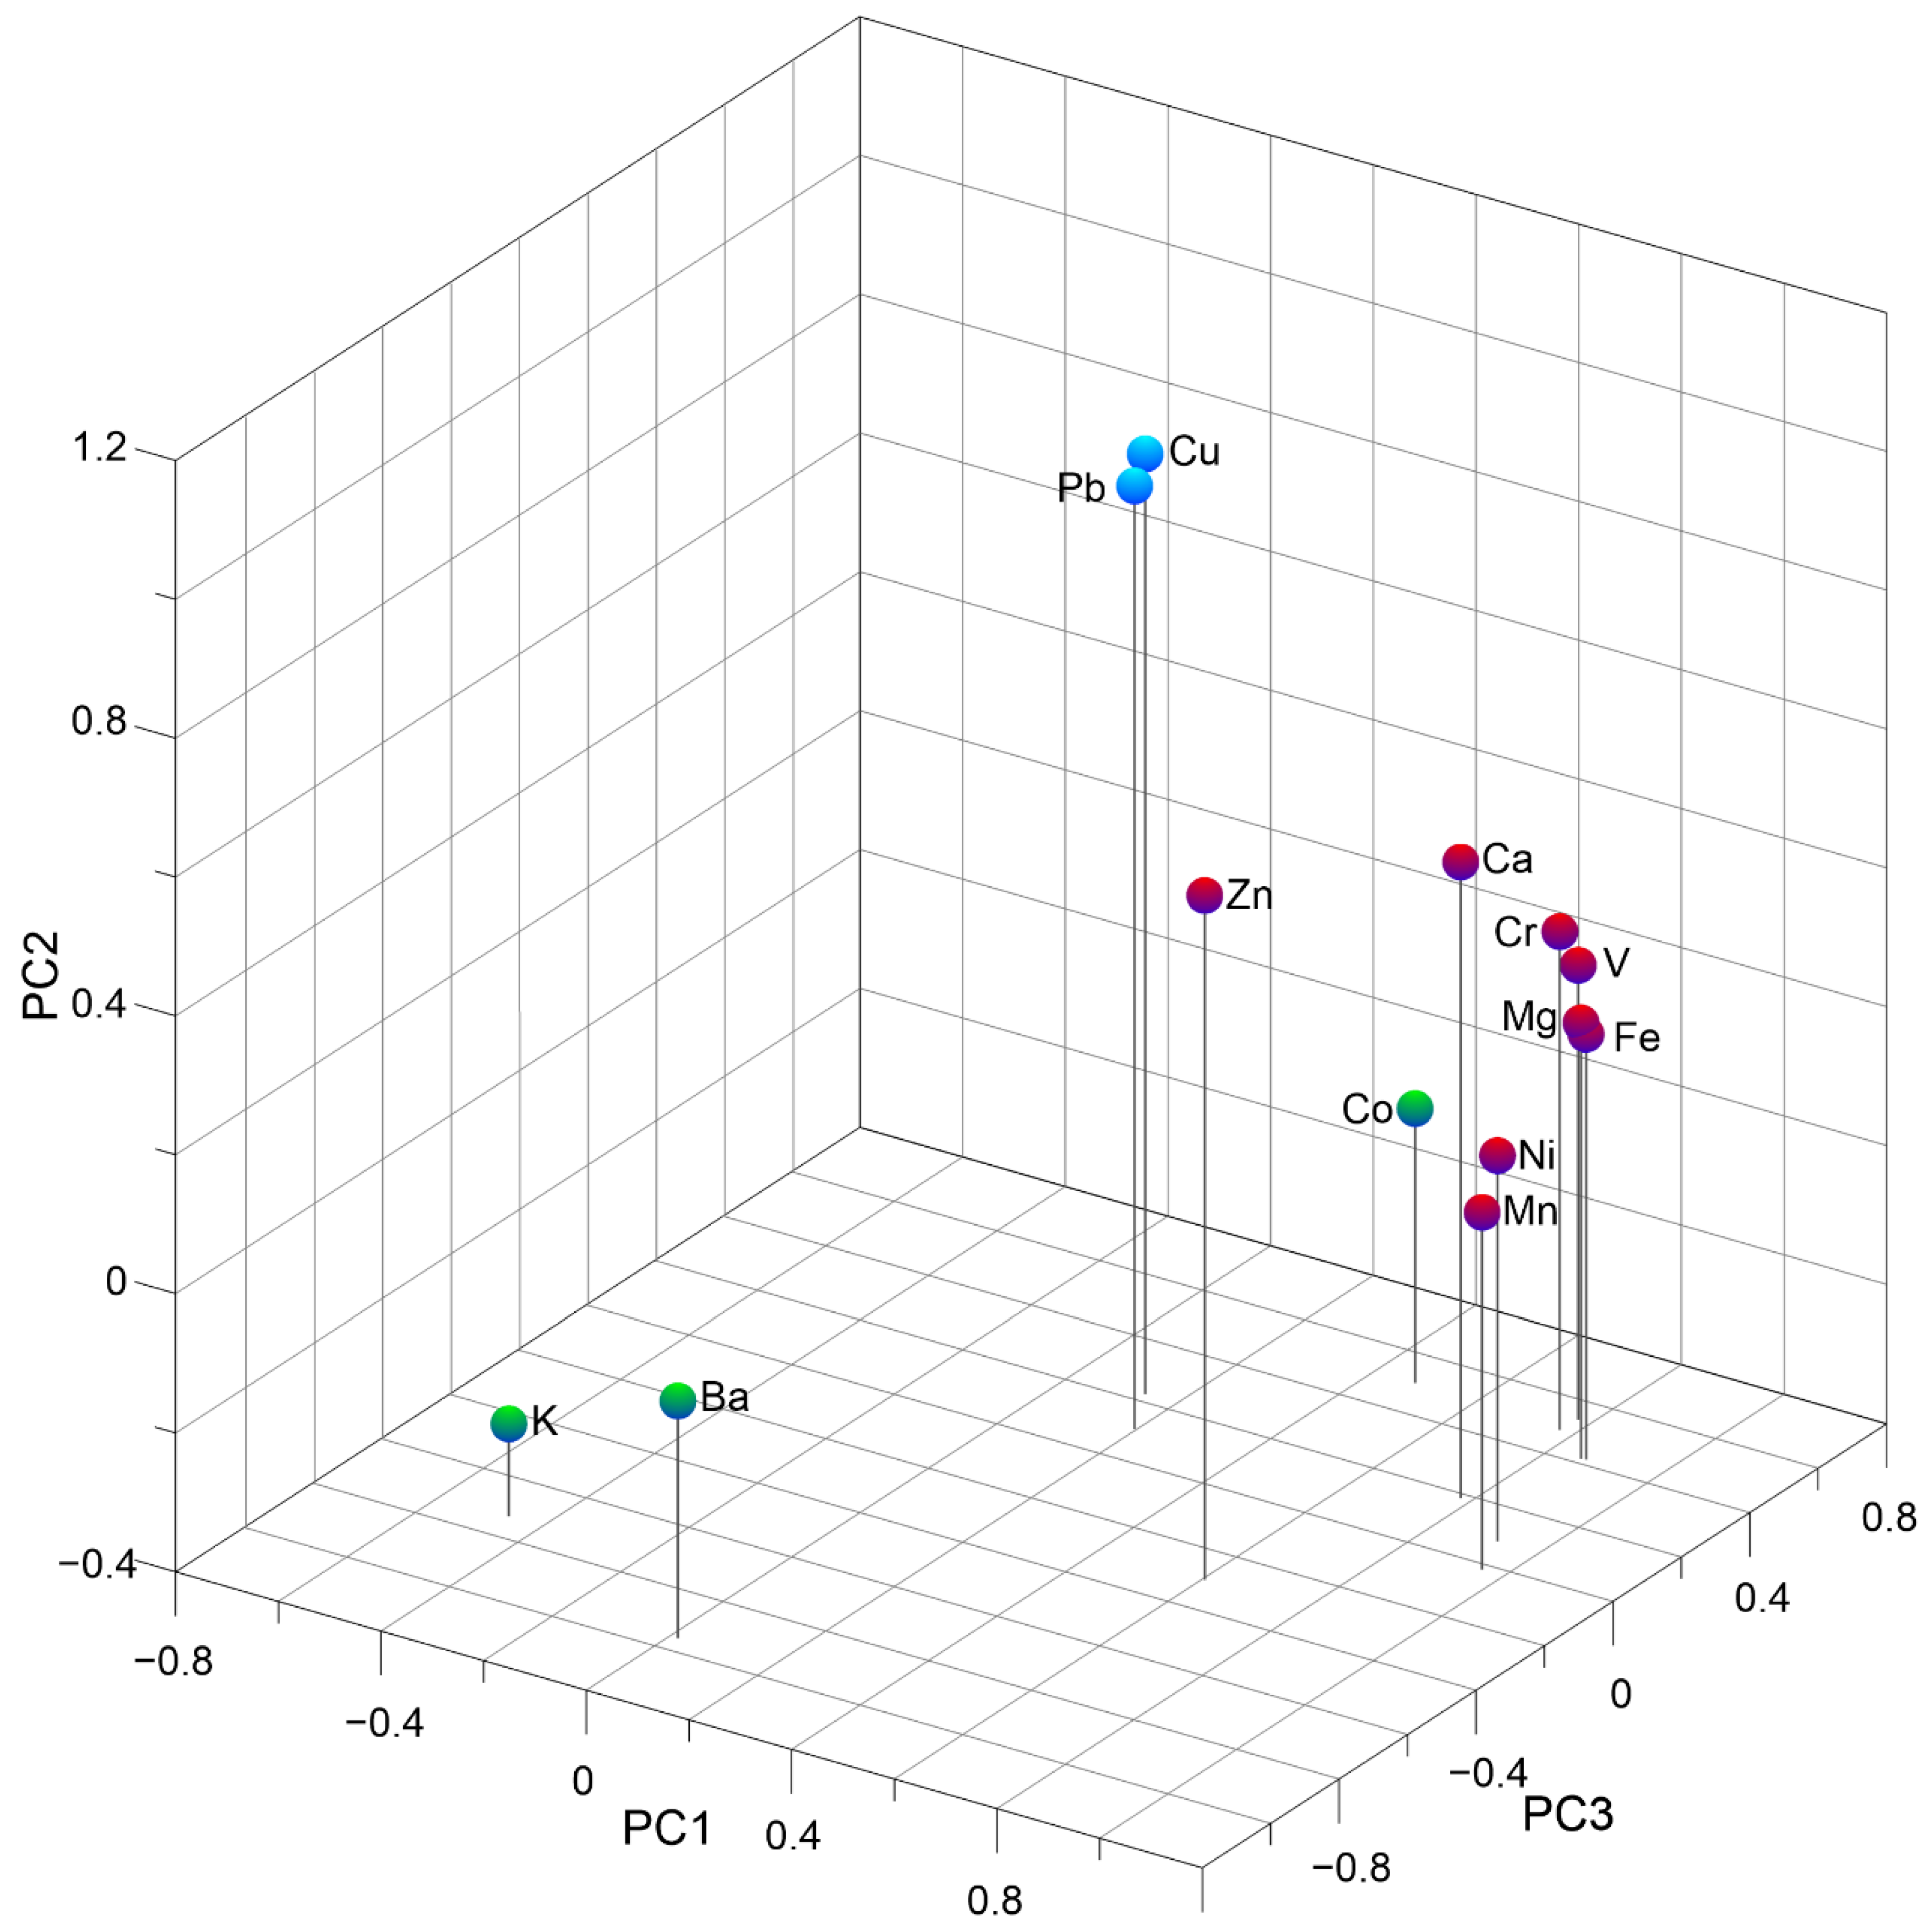
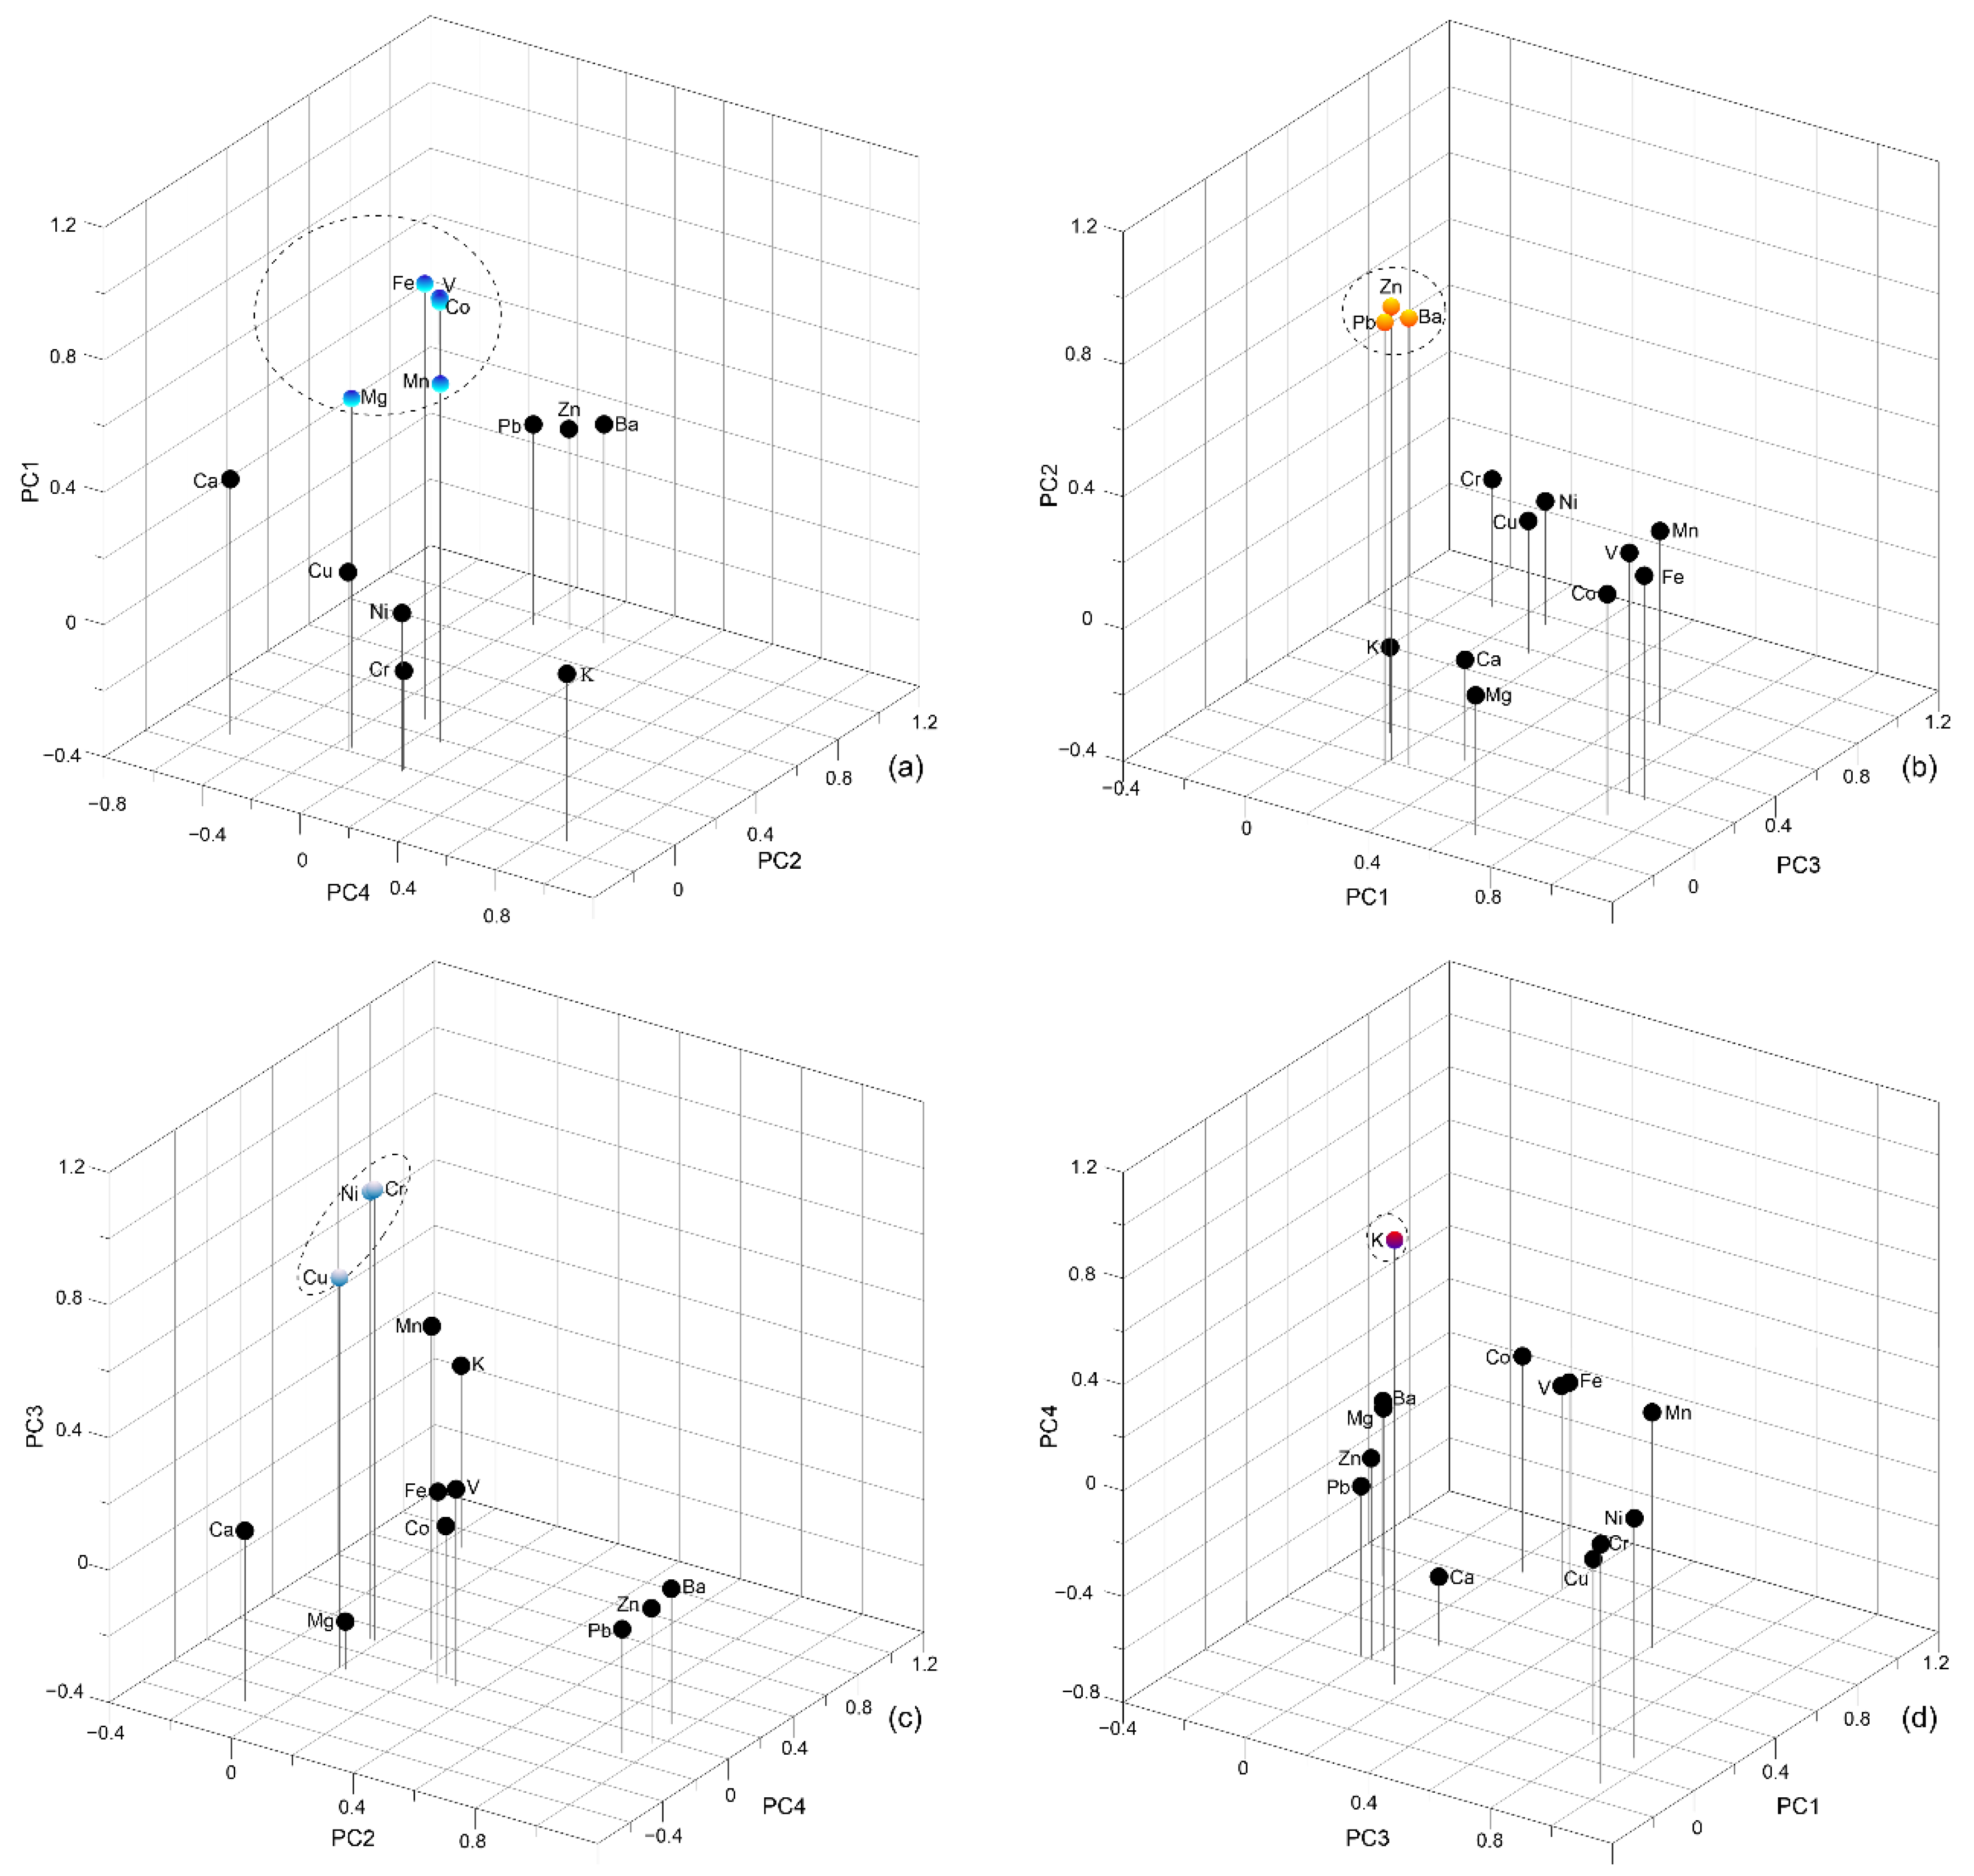
3.3. Principal Component Analysis

PCA was conducted on the metal concentrations in dustfall samples to identify the possible sources of the trace metals. According to the Kaiser criterion, the first three components with eigenvalues larger than 1.0 have dominant influences. For Inner Mongolia, all the trace metals were well represented by principal component 1 (PC1), principal component 2 (PC2) and principal component 3 (PC3), which accounted for 88.5% of the total variance. In the loading plot of PCA shown in Figure 3, three groups were identified. Mg, Ca, V, Cr, Mn, Fe, and Ni (loading range 0.772–0.958) formed a group, accounting for 62.8% of the total variance. The factor PC2 is characterized by high loadings for Cu (0.954) and Pb (0.958) and endorses their strong positive relationships and enrichment degrees indicating a derivation from anthropogenic sources. The third group consisted of K (−0.727), Ba (−0.956), and Co, with a high loading for Co (0.502), accounting for 11.8% of the total variance.
The PCA results of the Hebei dustfall are illustrated in Figure 4. Four major components are identified with eigenvalues larger than 1.0 and together these explain 83.1% of the total variance. The first PCA factor (PC1) has high loadings for Mg, V, Mn, Fe, and Co, and the initial eigenvalue of the first factor is the largest: 5.09, accounting for 39.2% of the total variance (Figure 4a). This suggests the existence of one dominant emission source or a group of emission sources of some elements. The factor PC2 is characterized by high loadings for Zn (0.972), Ba (0.951), Pb (0.939), and the association Zn-Ba-Pb is evident on the PC2 axis of Figure 4b. As shown in Figure 4c, the factor PC3 is characterized by high loadings for Cr (0.963), Ni (0.952), and Cu (0.777), accounting for 13.1% of the total variance. The fourth group consisted only of K, which had a higher loading in PC4.

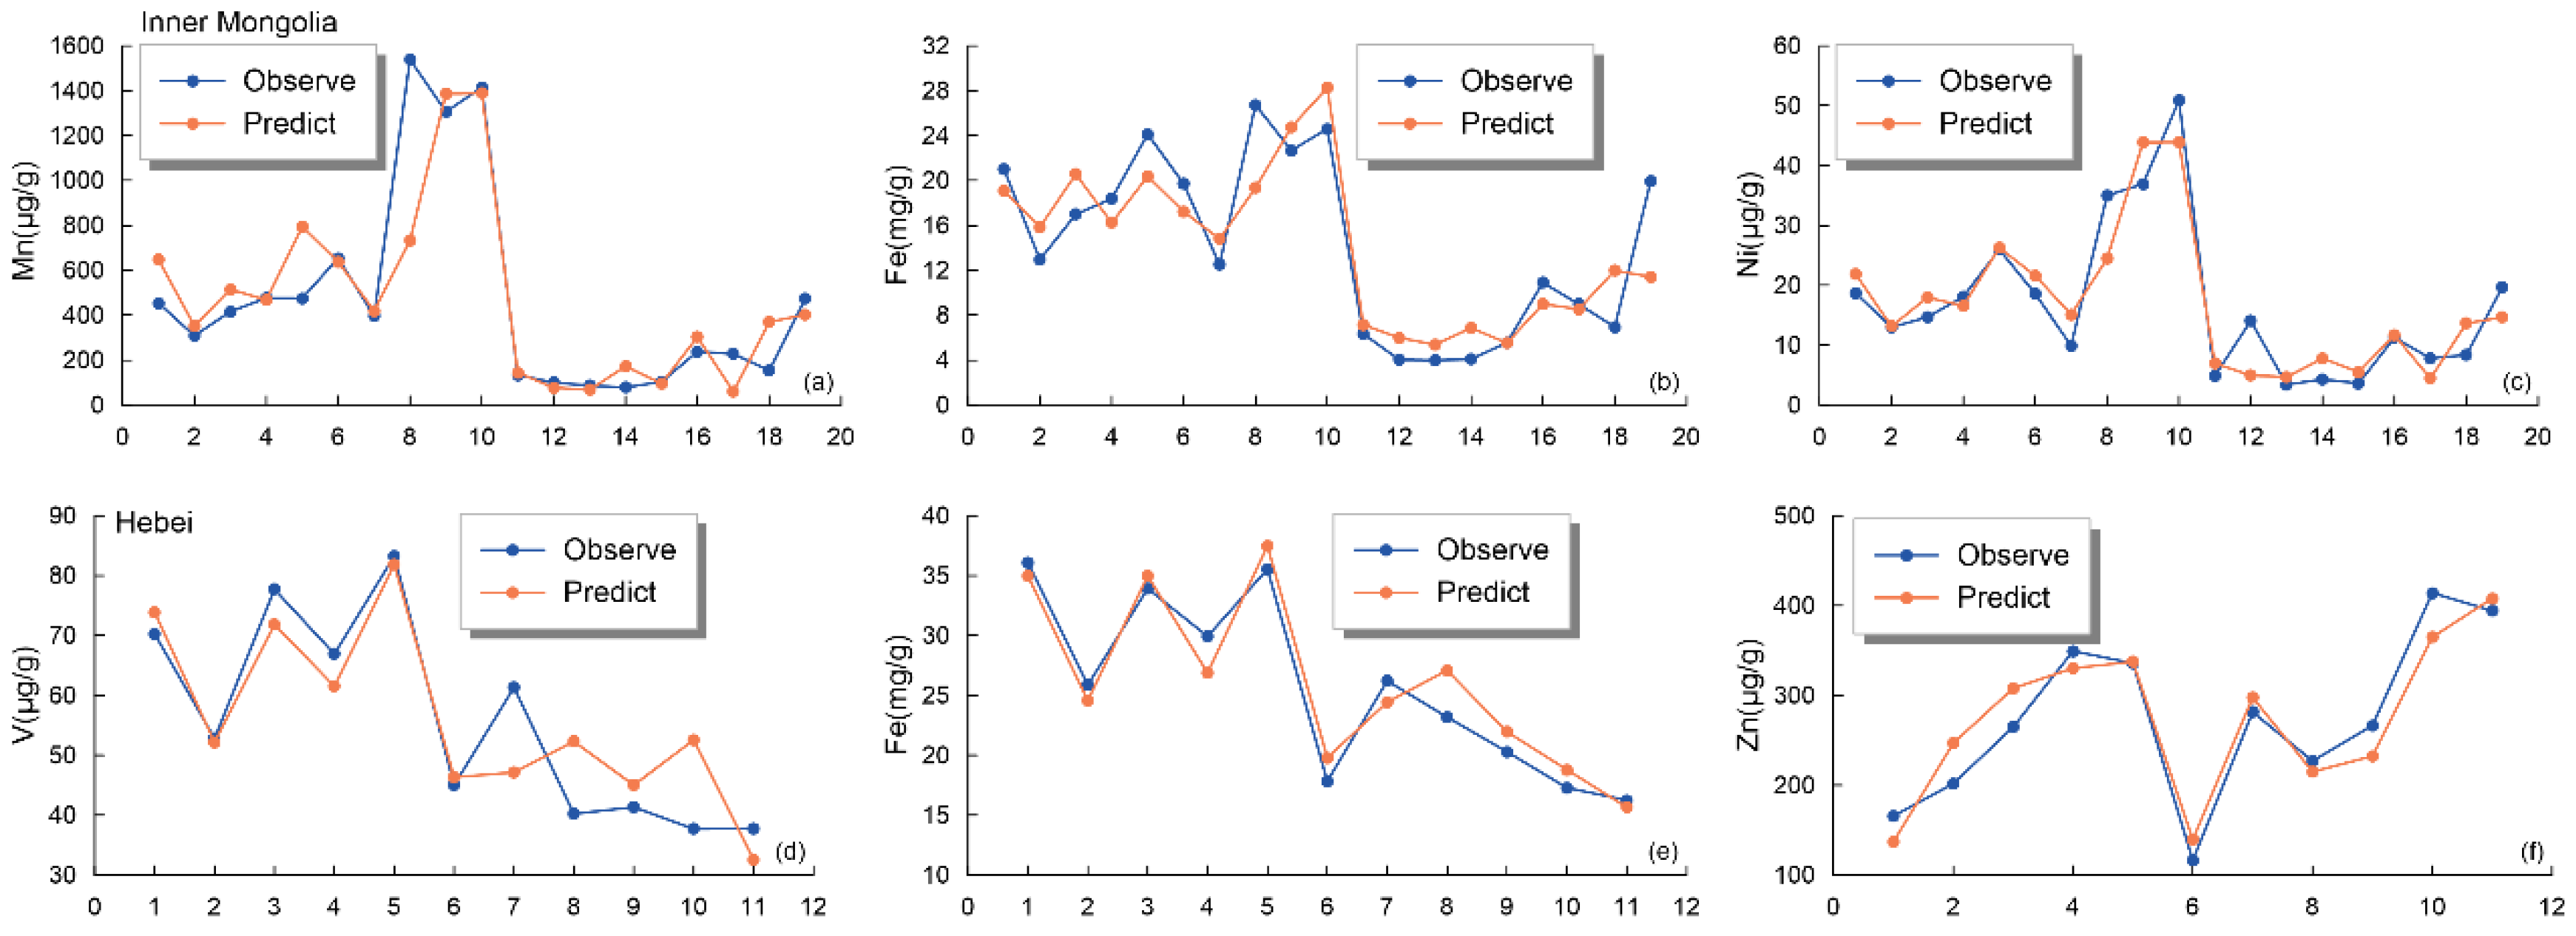
3.4. Source Identification of Trace Metals

3.4.1. Inner Mongolia

Compared with background values of soils, Cu, Zn, and Pb have elevated concentrations in the dustfall of Inner Mongolia (Table 1), which suggests anthropogenic sources of these elements, and other elements have concentrations approximating their corresponding background values, indicating a natural origin. A strong correlation among Mg, Ca, V, Cr, Mn, Fe, and Ni in both correlation analysis and PCA is an indicator of the common source or sources (Table 2, Figure 3). The low EFs determined for these metals (Table 1, Figure 2) may suggest significant natural sources. Cu and Pb, K and Ba are also correlated in both analyses, suggesting other common sources. Vehicle emissions and the long-time use of coal associated with the accelerated industrialization of China have both been recognized as the leading contributors to airborne Pb pollution [34,35]. Whereas the normal activity and deterioration of vehicles on the roads can emit Cu into the air [36,37,38]. The strong positive relationship between Cu and Pb (r = 0.984, p = 0.01) indicates that these two metals derive mainly from traffic emissions. Ba is released to environmental media by both natural processes and anthropogenic sources, and K is found in an abundance of approximately 2.5% in the Earth’s crust [39]. K is correlated with Ba in correlation analysis, which indicates perhaps come mainly from soil sources. The factor PC3 shows a high loading for Co (0.502); Co is the transition metal next to Fe in the Periodic Table and significant positive relationships are also found among Co and Fe as well as Mg, Ca, V, Cr, and Mn, indicating that the bulk of the Co originates in natural sources.

3.4.2. Hebei Province

The PCA, correlation analysis, and EF analysis have created an impression that V, Mn, Fe, and Co in dustfall samples of Hebei province may have a natural source, and the emission source for these elements is primarily the resuspension of soil-derived particles. The association Zn-Ba-Pb is evident (Figure 4b). Industrial metallurgic processes lead to increasing concentration of Zn [40] and this element is also associated with the abrasion of rubber tires [41]. Products containing Ba have a wide range of uses, such as in detergents and dispersants, and are also incorporated into oxidation and corrosion inhibitors in engine lubricating oils; additionally, they are used for smoke suppressant additives in diesel fuels [42]. The province of Hebei is a highly strategic location for its logistics, iron and steel fabrication, and heavy manufacturing industries. Road traffic emissions are the likely primary sources for Zn, Ba, and Pb. Cu and Ni are both important constituents of many metal alloys [43,44] and the emission sources of these trace metals are logically attributed to the pyrometallurgical manufacturing activities within the urban region.

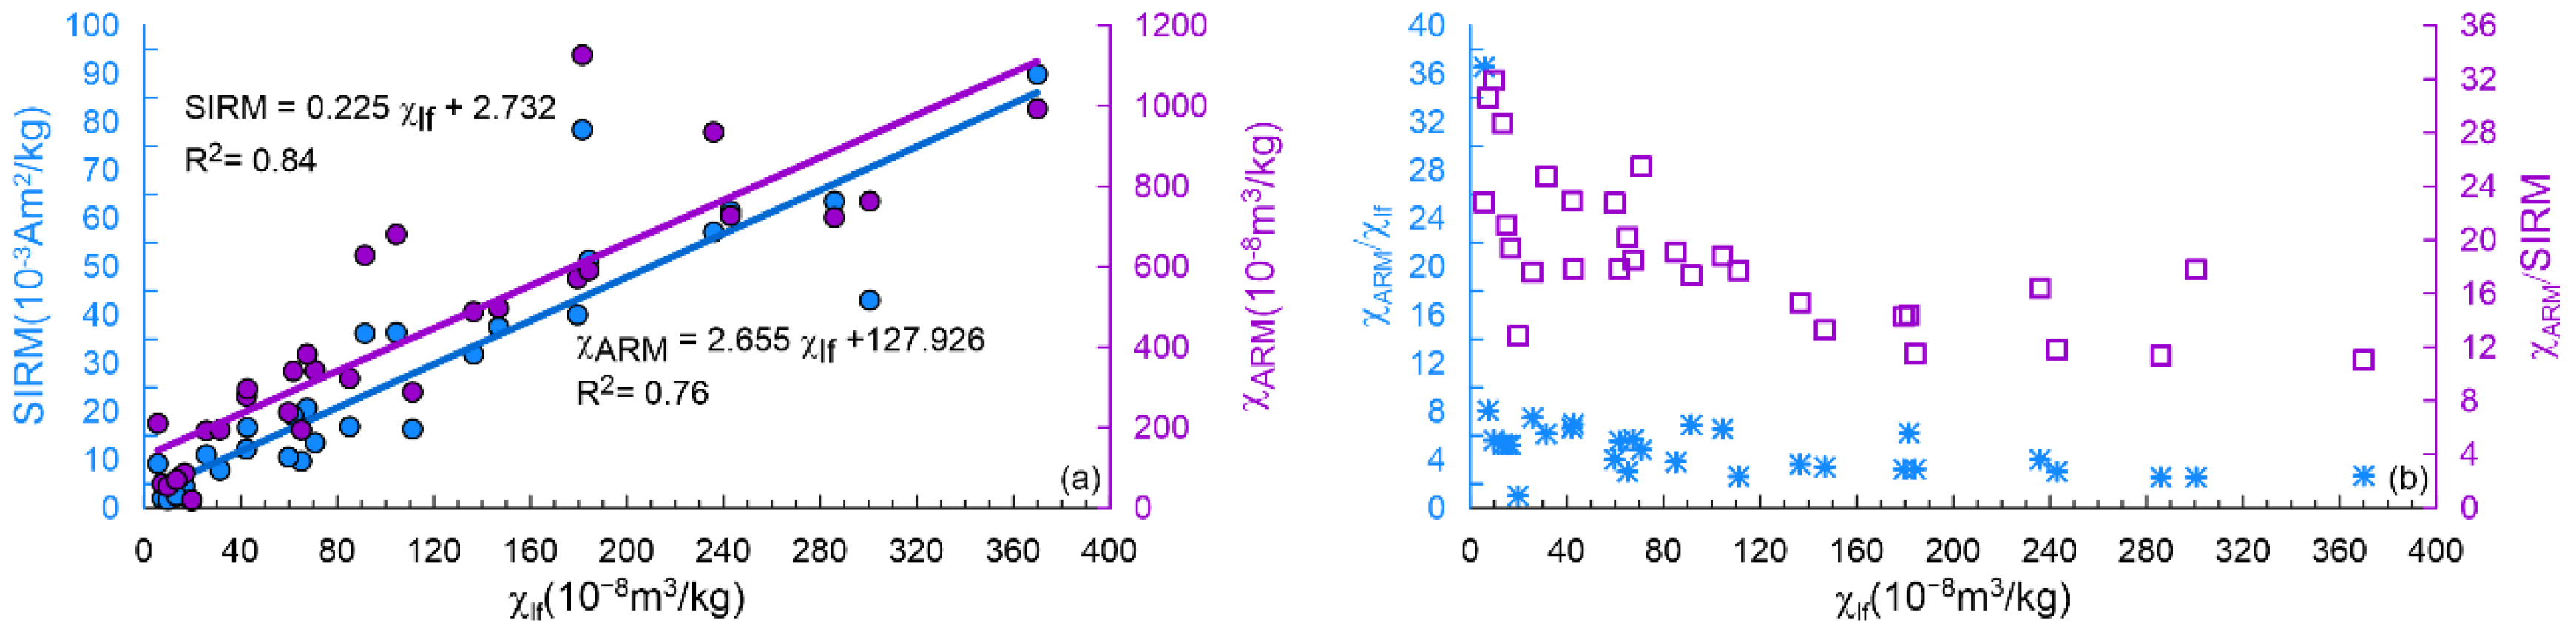
3.5. Magnetic Properties

χlf, SIRM, ARM, and the average χARM values were higher in Hebei province than in Inner Mongolia (Table 3), indicating the important contribution of anthropogenic activities in the concentration of magnetic minerals. As shown in Figure 5a, the SIRM and χlf values were linearly correlated (R2 = 0.84), indicating that ferrimagnetic minerals were the dominant magnetic minerals in dustfall samples. The average S-ratio values were high and varied within a narrow range, from 0.92 to 0.94 in Inner Mongolia and Hebei province (Table 3), which further indicated the dominant contribution of low-coercivity magnetite-type ferrimagnetic minerals to the dustfall samples. There was a significant correlation between χARM and χlf (R2 = 0.76; Figure 5a), whereas high χlf values corresponded to low χARMlf and low χARM/SIRM ratios (Figure 5b); thus, the significant enhancement of χlf was closely related to coarser ferrimagnetic phases. These results confirmed that the magnetic minerals in the dustfall samples were dominated by low-coercivity ferrimagnetic minerals.

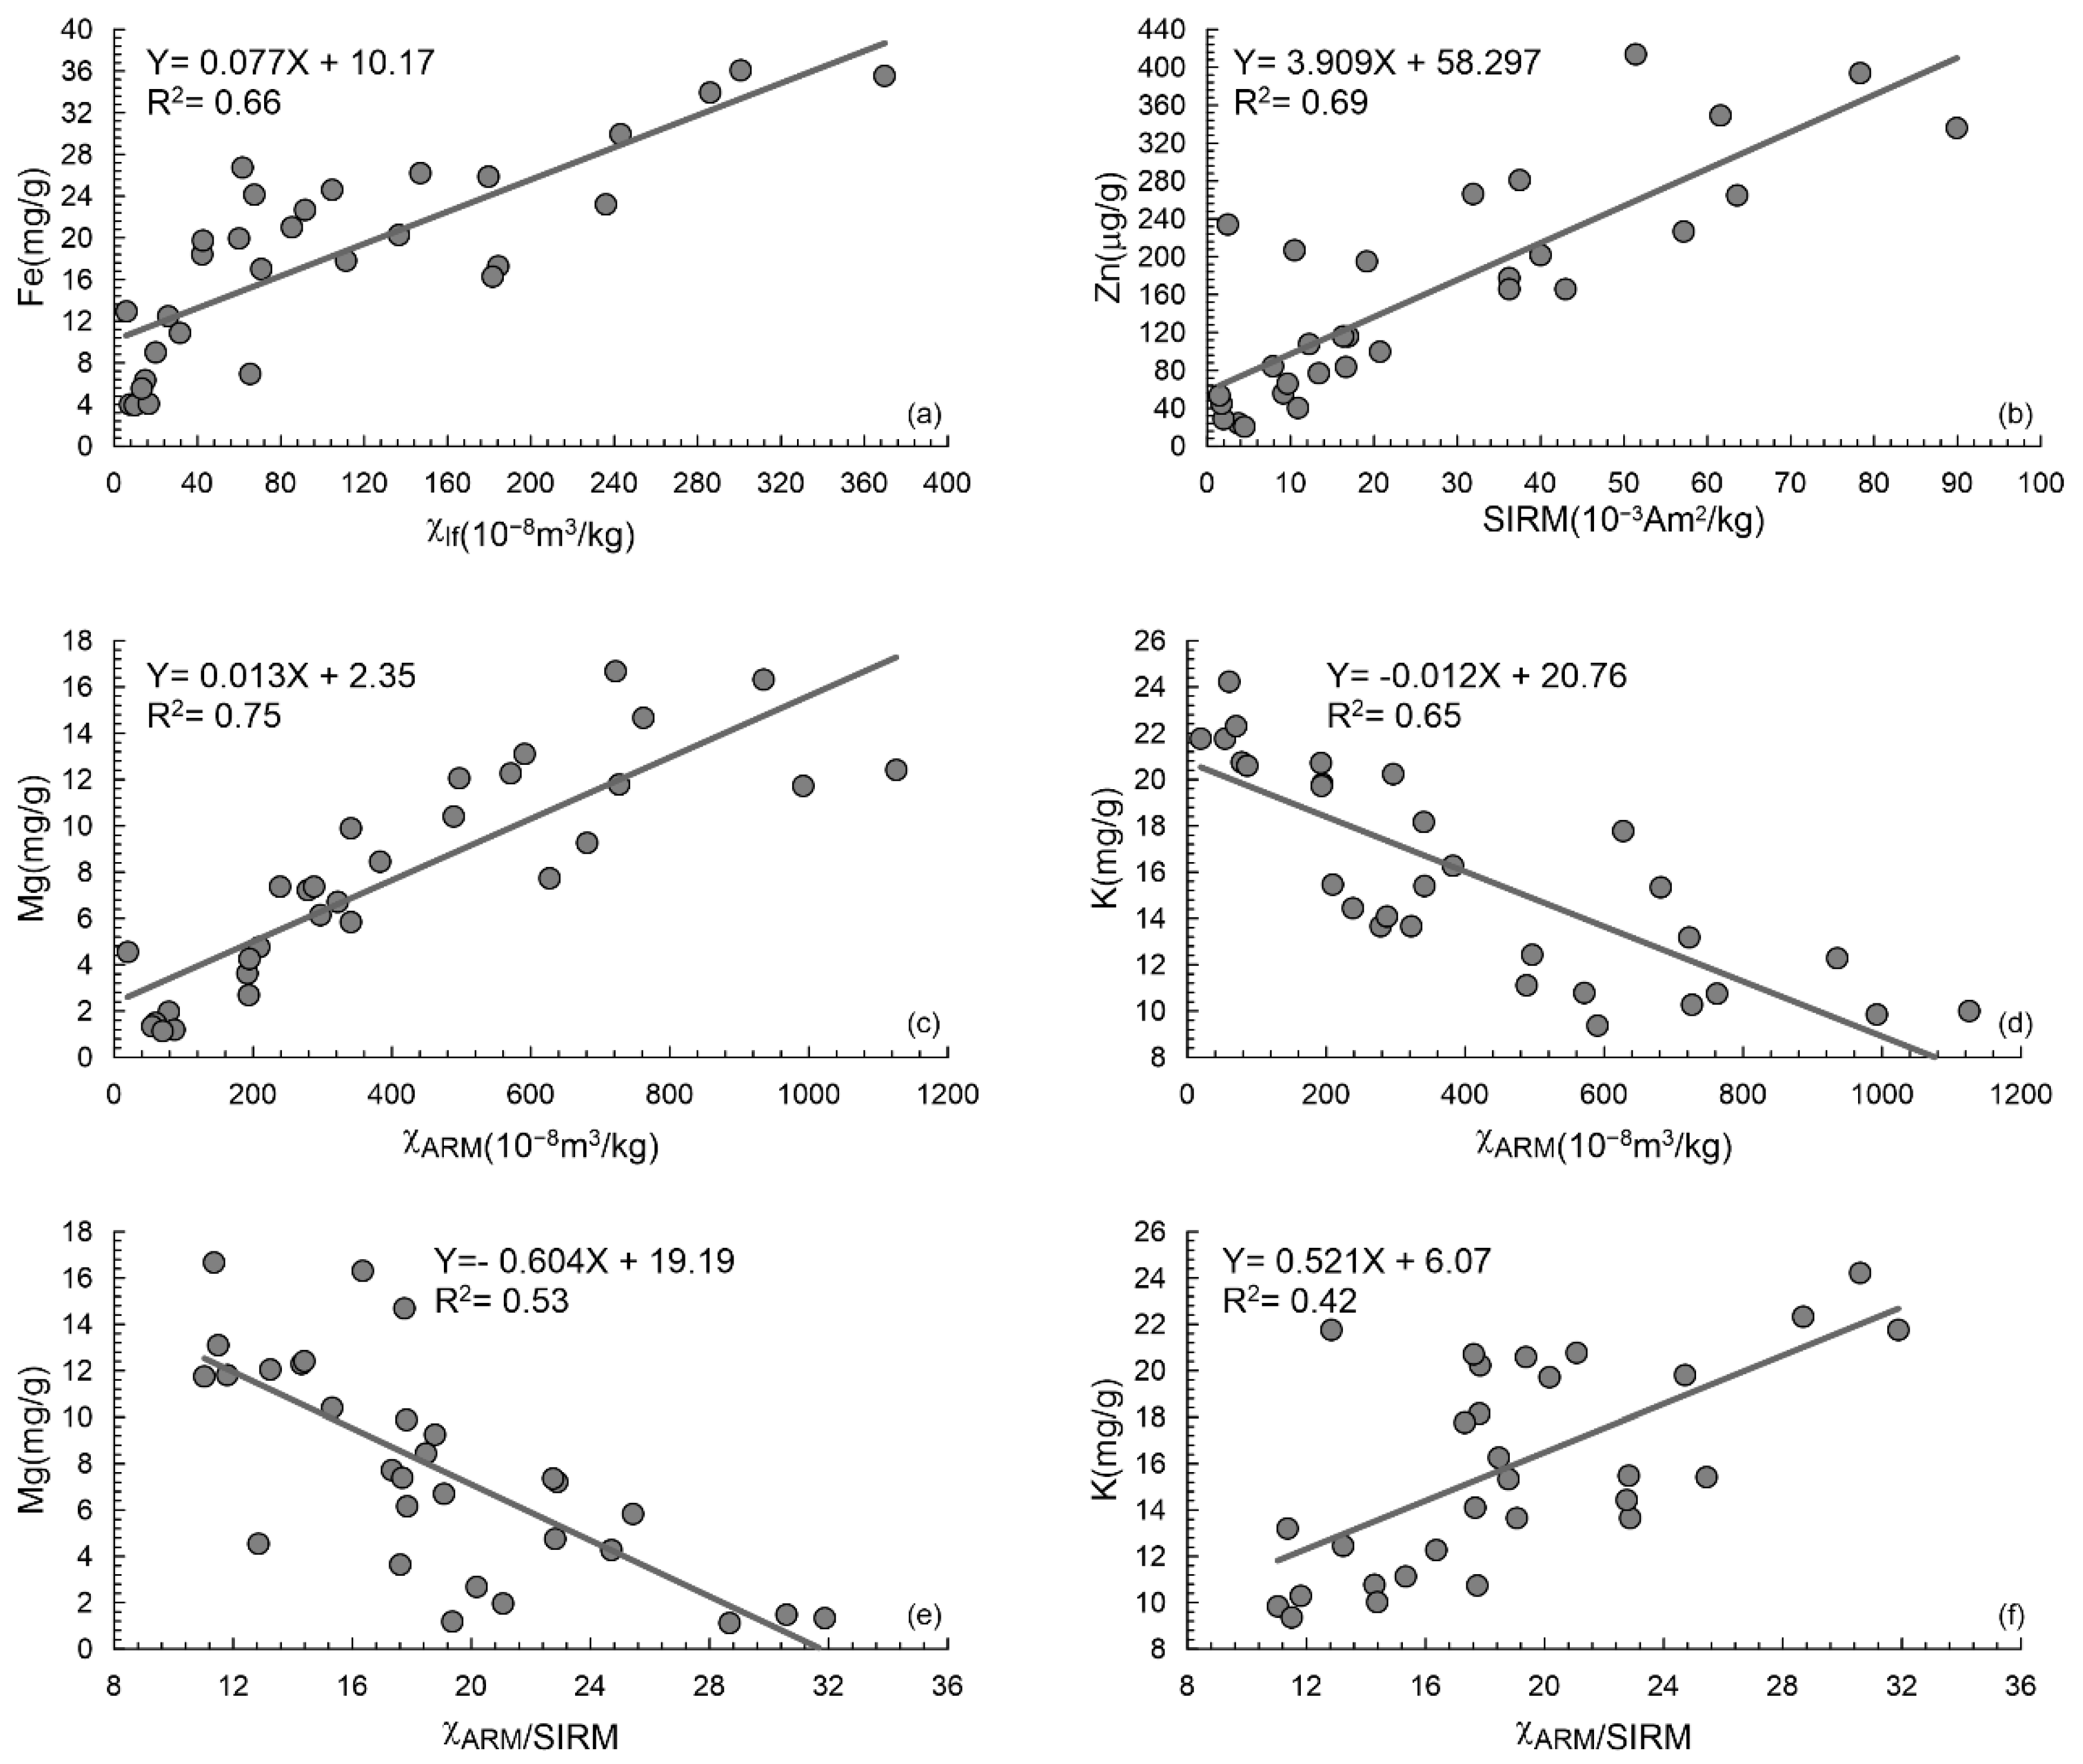
3.6. Correlations among Magnetic Properties and Trace Metal Concentrations

The correlation coefficients of the magnetic properties and trace metals are presented in Table 4 and Figure 6. For Mg, Ca, V, Fe, Ni, Cu, Zn, and Pb, their concentrations correlated significantly and positively with χlf, SIRM, and χARM (Figure 6a–c). The highest r was that of the correlation between Mg and χARM (0.867) (Figure 6c). The S-ratio correlated positively and significantly with Mg, Ca, V, Cr, Mn, Fe, Co, and Ni. For K and Ba, their concentrations correlated negatively and significantly with χlf, SIRM, χARM and S-ratio (Figure 6d). Nearly all metals, except K, Mn, Cu, and Ba, correlated significantly and negatively with χARM/SIRM (Figure 6e,f). Such correlation is mainly based on the fact that trace metals occur in close association with magnetic particles, either absorbed or through a common origin. This justifies environmental magnetism analyses as proxies for evaluating the concentrations of airborne trace metals.
The interrelationships of the trace metal contents and magnetic parameters were further examined in multiple regression analysis for Inner Mongolia and Hebei province, respectively. Using the stepwise method, we obtain regression equations for 6 elements in Inner Mongolia showing relatively high correlation coefficients (R2 = 0.59–0.84; p = 0.01) with corresponding magnetic parameters and 4 elements (R2 = 0.52–0.78; p = 0.01) for Hebei province (Table 5 and Figure 7). χlf and SIRM generally reflect the concentration of magnetic minerals, especially ferrimagnetic minerals [45,46], unlike SIRM, χlf is also influenced by paramagnetic and diamagnetic minerals [45], and χARM is selectively sensitive to the abundance of ferrimagnetic grains within the stable single domain and fine pseudo-single domain range [47,48]. The overall findings show that the elements of dustfall samples from soil and other lithogenic sources were positively and negatively related to these concentration- and type-dependent magnetic parameters; whereas from the anthropogenic sources were negatively related to grain size-dependent ratio parameter χARM/SIRM.
R2 always increases as more variables are added to the multiple linear regression model, as shown in Table 5. For Inner Mongolia, the R2 values of V and Fe were 0.587 and 0.686, whereas for Hebei province were 0.696 and 0.78. It is worth noting that the regression equations for V and Fe in the dustfall of Hebei province involve the same variables (Table 5), but there is a larger deviation between the estimate and observed values for V. This is a consequence of Fe likely formed the iron oxides responsible for the magnetic properties of dustfall samples.

3.7. Environmental Implications

Our study was conducted in rural Inner Mongolia and urban Hebei province with extensive industrial infrastructure. We found that the majority of the trace metals in Inner Mongolia dustfall samples closely correlated with one another and the magnetic parameters, whereas the trace metals in Hebei province have multiple sources causing their concentrations to correlate poorly with each other. These findings indicate that trace metal concentrations and magnetic parameters in environments with similar and/or “single” source contributions have a more reliable linkage, whereas multiple sources of heterogeneous chemical and magnetic particles can complicate determinations of the relationships between atmospheric trace metals and magnetic parameters. Additionally, our study also showed that the χARM/SIRM ratios correlated negatively and significantly with the anthropogenic trace metals and therefore that comprehensive magnetic measurements should be performed before trace metal contamination is assessed.

4. Conclusions

Atmospheric dustfall samples were collected in rural Inner Mongolia and urban Hebei province. Compared to the trace metals and magnetic characteristics of atmospheric dustfall from Inner Mongolia, the concentrations of trace metals and magnetic minerals from atmospheric dustfall in Hebei province are higher. The type of magnetic minerals is similar, and the higher ratios of χARMlf, χARM/SIRM, and SIRM/χlf indicate that the dominant magnetic particles within atmospheric dustfall in Inner Mongolia are fine.
Linear regression equations with trace metal and magnetic parameters reveal that the concentration- and type-dependent magnetic properties (χlf, SIRM) correlated positively and significantly with the concentrations of trace metals derived from natural processes, and the concentrations of trace metals derived from anthropogenic activities correlated negatively and significantly with the grain size-dependent magnetic parameters (χARM/SIRM). The mechanisms influencing this relationship remain to be elucidated in further studies.

Author Contributions

Conceptualization and methodology, Q.Q.; software, Q.Q., Z.L.; writing—original draft preparation, Q.Q.; writing—review and editing, J.D.A.P.; funding acquisition, Q.Q. All authors have read and agreed to the published version of the manuscript.

Funding

This research was funded by the National Natural Science Foundation of China (grant 42122028, 41774077), the International Partnership Program of Chinese Academy of Sciences with the grant number of 131551KYSB20200021; The Science and Technology Major Project of Xinjiang Uygur Autonomous Region, China with the grant number of 2021A03001.

Data Availability Statement

All data is freely available and can be requested to the authors.

Conflicts of Interest

The authors declare no conflict of interest.

References

  1. Petrovský, E.; Ellwood, B.B. Magnetic monitoring of air- land- and water-pollution. In Quaternary Climates, Environments and Magnetism; Maher, B.A., Thompson, R., Eds.; Cambridge University Press: Cambridge, UK, 1999; pp. 279–322. [Google Scholar]
  2. Petrovský, E.; Zbořil, R.; Matys Grygar, T.; Kotlík, B.; Novák, J.; Kapička, A.; Grison, H. Magnetic particles in atmospheric particulate matter collected at sites with different level of air pollution. Stud. Geophys. Geod. 2013, 57, 755–770. [Google Scholar] [CrossRef]
  3. Shu, J.; Dearing, J.A.; Morse, A.P.; Yu, L.Z.; Yuan, N. Determining the sources of atmospheric particles in Shanghai, China, from magnetic and geochemical properties. Atmos. Environ. 2001, 35, 2615–2625. [Google Scholar] [CrossRef]
  4. McConnell, J.R.; Edwards, R. Coal burning leaves toxic heavy metal legacy in the Arctic. Proc. Natl. Acad. Sci. USA 2008, 105, 12140–12144. [Google Scholar] [CrossRef] [PubMed] [Green Version]
  5. Zhu, Z.M.; Sun, G.Y.; Bi, X.Y.; Li, Z.G.; Yu, G.H. Identification of trace metal pollution in urban dust from kindergartens using magnetic, geochemical and lead isotopic analyses. Atmos. Environ. 2013, 77, 9–15. [Google Scholar] [CrossRef]
  6. Chester, R.; Sharples, E.J.; Sanders, G.; Oldfield, F.; Saydam, A.C. The distribution of natural and non-crustal ferrimagnetic minerals in soil-sized particulates from the Mediterranean atmosphere. Water Air Soil Poll. 1984, 23, 25–35. [Google Scholar] [CrossRef]
  7. Hunt, A. The application of mineral magnetic methods to atmospheric aerosol discrimination. Phys. Earth Planet. Int. 1986, 42, 10–21. [Google Scholar] [CrossRef]
  8. Hunt, A.; Jones, J.; Oldfield, F. Magnetic measurements and heavy metals in atmospheric particulates of anthropogenic origin. Sci. Total Environ. 1984, 33, 129–139. [Google Scholar] [CrossRef]
  9. Oldfield, F.; Hunt, A.; Jones, M.D.H.; Chester, R.; Dearing, J.A.; Olsson, L.; Prospero, J.M. Magnetic differentiation of atmospheric dust. Nature 1985, 317, 516–518. [Google Scholar] [CrossRef]
  10. Castanheiro, A.; Samson, R.; De Wael, K. Magnetic- and particle-based techniques to investigate metal deposition on urban green. Sci. Total Environ. 2016, 571, 594–602. [Google Scholar] [CrossRef]
  11. Jordanova, N.V.; Jordanova, D.V.; Veneva, L.; Yorova, K.; Petrovsky, E. Magnetic response of soils and vegetation to heavy metal pollution—A case study. Environ Sci. Technol. 2003, 37, 4417–4424. [Google Scholar] [CrossRef]
  12. Wang, J.H.; Li, S.W.; Li, H.M.; Qian, X.; Li, X.L.; Liu, X.M.; Lu, H.; Wang, C.; Sun, Y.X. Trace metals and magnetic particles in PM2.5: Magnetic identification and its implications. Sci. Rep. 2017, 7, 9865. [Google Scholar] [CrossRef] [Green Version]
  13. Li, H.M.; Qian, X.; Wei, H.T.; Zhang, R.B.; Yang, Y.; Liu, Z.; Hu, W.; Gao, H.L.; Wang, Y.L. Magnetic properties as proxies for the evaluation of heavy metal contamination in urban street dusts of Nanjing, Southeast China. Geophys. J. Int. 2014, 199, 1354–1366. [Google Scholar] [CrossRef] [Green Version]
  14. Xia, D.S.; Wang, B.; Yu, Y.; Jia, J.; Nie, Y.; Wang, X.; Xu, S.J. Combination of magnetic parameters and heavy metals to discriminate soil-contamination sources in Yinchuan—A typical oasis city of Northwestern China. Sci. Total Environ. 2014, 485–486, 83–92. [Google Scholar] [CrossRef]
  15. Blaha, U.; Basavaiah, N.; Deenadayalan, K.; Borole, D.V.; Mohite, R.D. Onset of industrial pollution recorded in Mumbai mudflat sediments, using integrated magnetic, chemical, 210Pb dating, and microscopic methods. Environ. Sci. Technol. 2011, 45, 686–692. [Google Scholar] [CrossRef]
  16. Ma, M.M.; Hu, S.Y.; Cao, L.W.; Appel, E.; Wang, L.S. Atmospheric pollution history at Linfen (China) uncovered by magnetic and chemical parameters of sediments from a water reservoir. Environ. Pollut. 2015, 204, 161–172. [Google Scholar] [CrossRef]
  17. Cao, L.W.; Appel, E.; Hu, S.Y.; Yin, G.; Lin, H.; Rösler, W. Magnetic response to air pollution recorded by soil and dust-loaded leaves in a changing industrial environment. Atmos. Environ. 2015, 119, 304–313. [Google Scholar] [CrossRef]
  18. Wuyts, K.; Hofman, J.; Van Wittenberghe, S.; Nuyts, G.; De Wael, K.; Samson, R. A new opportunity for biomagnetic monitoring of particulate pollution in an urban environment using tree branches. Atmos. Environ. 2018, 190, 177–187. [Google Scholar] [CrossRef]
  19. Emerson, E.W.; Hodshire, A.L.; DeBolt, H.M.; Bilsback, K.R.; Pierce, J.R.; McMeeking, G.R.; Farmer, D.K. Revisiting particle dry deposition and its role in radiative effect estimates. Proc. Natl. Acad. Sci. USA 2020, 117, 26076–26082. [Google Scholar] [CrossRef]
  20. Yang, X.; Zhu, B.; Wang, X.; Li, C.; Zhou, Z.; Chen, J.; Wang, X.; Yin, J.; Lu, Y. Late Quaternary environmental changes and organic carbon density in the Hunshandake Sandy Land, eastern Inner Mongolia, China. Glob. Planet. Chang. 2008, 61, 70–78. [Google Scholar] [CrossRef]
  21. Cao, L.; Tian, W.Z.; Ni, B.F.; Zhang, Y.M.; Wang, P.S. Preliminary study of airborne particulate matter in a Beijing sampling station by instrumental neutron activation analysis. Atmos. Environ. 2002, 36, 1951–1956. [Google Scholar] [CrossRef]
  22. Yang, X.; Ding, Z.; Fan, X.; Zhou, Z.; Ma, N. Processes and mechanisms of desertification in northern China during the last 30 years, with a special reference to the Hunshandake Sandy Land, eastern Inner Mongolia. Catena 2007, 71, 2–12. [Google Scholar] [CrossRef]
  23. Qiao, Q.Q.; Huang, B.C.; Zhang, C.X.; Piper, J.D.A.; Pan, Y.P.; Sun, Y. Assessment of heavy metal contamination of dustfall in northern China from integrated chemical and magnetic investigation. Atmos. Environ. 2013, 74, 182–193. [Google Scholar] [CrossRef]
  24. Loska, K.; Wiechuła, D. Application of principal component analysis for the estimation of source of heavy metal contamination in surface sediments from the Rybnik Reservoir. Chemosphere 2003, 51, 723–733. [Google Scholar] [CrossRef] [PubMed]
  25. Megido, L.; Negral, L.; Castrillón, L.; Suárez-Peña, B.; Fernández-Nava, Y.; Marañón, E. Enrichment factors to assess the anthropogenic influence on PM10 in Gijón (Spain). Environ. Sci. Pollut. Res. 2017, 24, 711–724. [Google Scholar] [CrossRef] [PubMed]
  26. Zhang, R.; Cao, J.J.; Tang, Y.R.; Arimoto, R.; Shen, Z.X.; Wu, F.; Han, Y.M.; Wang, G.H.; Zhang, J.Q.; Li, G.H. Elemental profiles and signatures of fugitive dusts from Chinese deserts. Sci. Total Environ. 2014, 472, 1121–1129. [Google Scholar] [CrossRef]
  27. Bern, C.R.; Walton-Day, K.; Naftz, D.L. Improved enrichment factor calculations through principal component analysis: Examples from soils near breccia pipe uranium mines, Arizona, USA. Environ. Pollut. 2019, 248, 90–100. [Google Scholar] [CrossRef]
  28. Rubio, B.; Nombela, M.A.; Vilas, F. Geochemistry of Major and Trace Elements in Sediments of the Ria de Vigo (NW Spain): An Assessment of Metal Pollution. Mar. Pollut. Bull. 2000, 40, 968–980. [Google Scholar] [CrossRef]
  29. Blaser, P.; Zimmermann, S.; Luster, J.; Shotyk, W. Critical examination of trace element enrichments and depletions in soils: As, Cr, Cu, Ni, Pb, and Zn in Swiss forest soils. Sci. Total Environ. 2000, 249, 257–280. [Google Scholar] [CrossRef]
  30. China National Environmental Monitoring Centre (CNEMC). The Background Value of Chinese Soil; Environmental Science Press of China: Beijing, China, 2008; p. 501. (In Chinese) [Google Scholar]
  31. Shirani, M.; Afzali, K.N.; Jahan, S.; Strezov, V.; Soleimani-Sardo, M. Pollution and contamination assessment of heavy metals in the sediments of Jazmurian playa in southeast Iran. Sci. Rep. 2020, 10, 4775. [Google Scholar] [CrossRef] [Green Version]
  32. Zhang, J.; Liu, C.L. Riverine composition and estuarine geochemistry of particulate metals in China—weathering features, anthropogenic impact and chemical fluxes. Estuar. Coast. Shelf Sci. 2002, 54, 1051–1070. [Google Scholar] [CrossRef]
  33. Han, Y.M.; Du, P.X.; Cao, J.J.; Posmentier, E.S. Multivariate analysis of heavy metal contamination in urban dusts of Xi’an, Central China. Sci. Total Environ. 2006, 355, 176–186. [Google Scholar]
  34. Chen, J.M.; Tan, M.G.; Li, Y.L.; Zhang, Y.M.; Lu, W.W.; Tong, Y.P.; Zhang, G.L.; Li, Y. A lead isotope record of shanghai atmospheric lead emissions in total suspended particles during the period of phasing out of leaded gasoline. Atmos. Environ. 2005, 39, 1245–1253. [Google Scholar] [CrossRef]
  35. Deng, S.; Shi, Y.J.; Liu, Y.; Zhang, C.; Wang, X.F.; Cao, Q.; Li, S.G.; Zhang, F. Emission characteristics of Cd, Pb and Mn from coal combustion: Field study at coal-fired power plants in China. Fuel Process. Technol. 2014, 126, 469–475. [Google Scholar] [CrossRef]
  36. Adachi, K.; Tainosho, Y. Characterization of heavy metal particles embedded in tire dust. Environ. Int. 2004, 30, 1009–1017. [Google Scholar] [CrossRef]
  37. Adamiec, E.; Jarosz-Krzemińska, E.; Wieszała, R. Heavy metals from non-exhaust vehicle emissions in urban and motorway road dusts. Environ. Monit. Assess. 2016, 188, 369. [Google Scholar] [CrossRef] [Green Version]
  38. Wang, Y.F.; Huang, K.L.; Li, C.T.; Mi, H.H.; Luo, J.H.; Tsai, P.J. Emissions of fuel metals content from a diesel vehicle engine. Atmos. Environ. 2003, 37, 4637–4643. [Google Scholar] [CrossRef]
  39. Gad, S.C. Barium. In Encyclopedia of Toxicology, 3rd ed.; Wexler, P., Ed.; Academic Press: Oxford, UK, 2014; pp. 368–370. [Google Scholar]
  40. Wang, X.L.; Sato, T.; Xing, B.S.; Tamamura, S.; Tao, S. Source identification, size distribution and indicator screening of airborne trace metals in Kanazawa, Japan. J. Aerosol. Sci. 2005, 36, 197–210. [Google Scholar] [CrossRef]
  41. Pacyna, J.M. Source inventories for atmospheric trace metals. In Atmospheric Particles, IUPAC Series on Analytical and Physical Chemistry of Environmental Systems; Harrison, R.M., van Grieken, R.E., Eds.; Wiley: Chichester, UK, 1998; Volume 5, pp. 385–423. [Google Scholar]
  42. de Miguel, E.; Llamas, J.F.; Chacón, E.; Berg, T.; Larssen, S.; Røyset, O.; Vadset, M. Origin and patterns of distribution of trace elements in street dust: Unleaded petrol and urban lead. Atmos. Environ. 1997, 31, 2733–2740. [Google Scholar] [CrossRef]
  43. Manno, E.; Varrica, D.; Dongarrà, G. Metal distribution in road dust samples collected in an urban area close to a petrochemical plant at Gela, Sicily. Atmos. Environ. 2006, 40, 5929–5941. [Google Scholar] [CrossRef]
  44. Siegel, F.R. Environmental Geochemistry of Potential Toxic Metals; Springer: Berlin/Hidellberg, Germany, 2002. [Google Scholar]
  45. Thompson, R.; Oldfield, F. Environmental Magnetism; Allen & Unwin: Winchester, MA, USA, 1986. [Google Scholar]
  46. Liu, Q.S.; Roberts, A.P.; Larrasoaña, J.C.; Banerjee, S.K.; Guyodo, Y.; Tauxe, L.; Oldfield, F. Environmental magnetism: Principles and applications. Rev. Geophys. 2012, 50, 1–50. [Google Scholar] [CrossRef] [Green Version]
  47. King, J.; Banerjee, S.K.; Marvin, J.; Özdemir, Ö. A comparison of different magnetic methods for determining the relative grain size of magnetite in natural materials: Some results from lake sediments. Earth Planet. Sci. Lett. 1982, 59, 404–419. [Google Scholar] [CrossRef]
  48. Maher, B.A. Magnetic properties of some synthetic sub-micron magnetites. Geophys. J. Int. 1988, 94, 83–96. [Google Scholar] [CrossRef]
Figure 1. Map showing the distribution of sampling sites (solid circles) of the atmospherically-deposited dust used in this study. These span the swathe of ground ranging from arid to semi-arid in the northwest to the strongly urbanized industrial belt embracing Beijing and Tianjin in the southeast. The inset map shows the regional location of the study area within China.
Minerals 12 01598 g001
Figure 2. Boxplot of enrichment factors (EFs) for trace elements in the atmospheric dustfall in rural Inner Mongolia (a) and urban Hebei (b). (a) Cu, Zn, and Pb in dustfall from Inner Mongolia, with their mean EFs between 2 and 5; (b) The mean EFs for Mg, Ca, Cr, Cu, Zn, Ba, and Pb in samples from Hebei province were all higher than 2, and this indicates that the dominant source for these elements was non-crustal sources. Note that the boxplot basically divides the normalized EFs into quartiles. The line inside the box represents the median; the boxes mark the 25th and 75th percentiles; the horizontal line outside the box, as is also called whisker, mark the values that extend 1.5 times the width of the box).
Minerals 12 01598 g002
Figure 3. PCA results of Inner Mongolia dustfall samples in three-dimensional space: plots of loading of the first three principal components (different color refer to different cluster-groups).
Minerals 12 01598 g003
Figure 4. Loadings of the rotated eigenvectors, vertical axis are the relevant component: (a) PC1 (b) PC2 (c) PC3and (d) PC4.
Minerals 12 01598 g004
Figure 5. Scatter plots of (a) χlf vs. SIRM and χARM and (b) χlf vs. the χARM -to-χlf and χARM -to-SIRM ratios of atmospheric dustfall samples. Star and box are the values of χARMlf and χARM/SIRM, respectively.
Minerals 12 01598 g005
Figure 6. The relationship between (a) χlf and Fe, (b) SIRM and Zn, (c) χARM and Mg, (d) χARM and K, (e) χARM/SIRM and Mg, (f) χARM/SIRM and K for all dustfall samples. Equations and coefficients of determination between magnetic properties and trace metal contents are listed on the figures.
Minerals 12 01598 g006
Figure 7. Predicted vs observed concentrations of (a) Mn, (b) Fe, (c) Ni for Inner Mongolia dustfall samples; (d) V, (e) Fe, (f) Zn for Hebei province dustfall samples as described by the stepwise method. Based on the correlation analysis, 30 samples were used in the multiple regression analysis (19 for Inner Mongolia; 11 for Hebei province).
Minerals 12 01598 g007
Table 1. Trace metals concentrations in the dustfall samples and the trace metal enrichment factors (mean ± SD).
ElementInner Mongolia (n = 20)Hebei (n = 15)
Content in Mass (μg/g)EFBackground Value (μg/g)Content in Mass (μg/g)EFBackground Value (μg/g)
Mg (103)5.17 ± 2.861.03 ± 0.576.213.02 ± 2.542.85 ± 0.598.7
K (103)18.32 ± 3.271.24 ± 0.3120.810.83 ± 1.551.11 ± 0.1418.5
Ca (103)15.41 ± 9.141.14 ± 0.581833.33 ± 7.852.91 ± 0.7321.8
V34.29 ± 17.330.9 ± 0.4151.159.37 ± 20.531.51 ± 0.4173.2
Cr28.96 ± 15.360.94 ± 0.4541.4112.49 ± 116.053.08 ± 3.0768.3
Mn485.01 ± 443.221.2 ± 0.94520515.54 ± 129.431.58 ± 0.27608
Fe (103)14.6 ± 7.830.84 ± 0.3923.126.89 ± 8.71.77 ± 0.4328.2
Co8.42 ± 4.971.11 ± 0.6510.311.21 ± 5.051.66 ± 0.6212.4
Ni17.08 ± 12.441.14 ± 0.7119.530.18 ± 16.591.84 ± 0.9430.8
Cu27.02 ± 41.622.48 ± 3.7914.453.93 ± 14.984.74 ± 1.4821.8
Zn98.14 ± 64.72.25 ± 1.4959.1381.57 ± 414.79.14 ± 8.6778.4
Ba611.68 ± 117.921.58 ± 0.39542794.52 ± 1257.362.86 ± 4.08497
Pb50.48 ± 72.623.86 ± 5.4717.2125.58 ± 103.8811.07 ± 8.0221.5
Number shown in red highlight element contents in dustfall samples that are larger than the background values defined by the element contents in topsoils. Based on the magnetic susceptibility values and the sufficient amount for element analysis (exclude site DS2-1), we selected 48 samples from the same month in each quarter for trace metal analysis. Sites DS2-7 and DS2-8 are distributed in Beijing, site DS2-5 is located on the border of Inner Mongolia and Hebei province, so we did not consider these sites in this study.
Table 2. Correlation matrix for trace elements concentrations.
MgKCaVCrMnFeCoNiCuZnBaPb
Inner Mongolia
Mg1
K−0.751 **1
Ca0.865 **−0.551 *1
V0.967 **−0.849 **0.798 **1
Cr0.948 **−0.843 **0.802 **0.966 **1
Mn0.828 **−0.4250.854 **0.713 **0.736 **1
Fe0.981 **−0.748 **0.857 **0.974 **0.953 **0.828 **1
Co0.571 **−0.456 *0.566 **0.587 **0.500 *0.475 *0.604 **1
Ni0.857 **−0.522 *0.810 **0.761 **0.796 **0.927 **0.847 **0.4011
Cu0.429−0.4420.666 **0.458 *0.500 *0.2480.4140.2340.3121
Zn0.523 *−0.3380.632 **0.513 *0.556 *0.580 **0.544 *0.0610.538 *0.522 *1
Ba−0.3960.674 **−0.206−0.491 *−0.476 *−0.007−0.403−0.362−0.114−0.2570.2681
Pb0.429−0.380.698**0.4240.485 *0.3290.4080.2010.3670.984 **0.577 **−0.1561
Hebei
Mg1
K−0.1521
Ca0.133−0.1151
V0.3920.0090.2671
Cr−0.2180.2340.0550.0431
Mn0.2940.1480.2170.753 **0.538 *1
Fe0.4950.0060.3080.970 **0.0370.785 **1
Co0.4710.0770.3090.829 **−0.0610.638 *0.875 **1
Ni−0.0950.2530.1280.1940.974 **0.660 **0.1870.0931
Cu−0.113−0.02500.330.627 *0.4370.3360.2120.613 *1
Zn0.19−0.1370.0350.482−0.0230.3170.4490.4320.0050.0291
Ba0.191−0.004−0.0390.511−0.0050.3840.4960.4830.029−0.0030.975 **1
Pb0.198−0.180.1810.468−0.0610.2430.4370.424−0.040.0150.962 **0.918 **1
* Correlations significant at the 0.05 level (2-tailed); ** Correlations significant at the 0.01 level (2-tailed); The numbers in red also highlight correlations significant at the 0.05 or 0.01 level.
Table 3. Summary of the magnetic properties (mass specific) of dustfall samples collected from Inner Mongolia and Hebei province.
Inner MongoliaHebei
χlf (10−8 m3/kg)Range5.71–104.50111.24–369.81
Mean ± SD44.0 ± 31.16215.92 ± 79.03
χARM (10−8 m3/kg)Range19.24–680.9287.56–1125.61
Mean ± SD245.57 ± 182.18699.82 ± 247.33
SIRM (10−3 Am2/kg)Range1.50–36.2616.27–89.92
Mean ± SD12.38 ± 10.3151.86 ± 21.21
ARM (10−6 Am2/kg)Range7.66–271.06114.48–448.09
Mean ± SD97.76 ± 72.52278.59 ± 98.46
S-ratioRange0.86–0.980.88–0.97
Mean ± SD0.92 ± 0.040.94 ± 0.03
χARMlfRange0.97–36.582.53–6.20
Mean ± SD7.06 ± 7.343.35 ± 1.05
χARM/SIRM (10−5 m/A)Range12.84–31.8811.03–17.75
Mean ± SD21.58 ± 4.9214.06 ± 2.5
SIRM/χlf (105 A/m)Range0.08–1.60.14–0.43
Mean ± SD0.33 ± 0.320.24 ± 0.08
Table 4. Pearson’s correlation coefficients (r) between trace metals and magnetic properties.
MgKCaVCrMnFeCoNiCuZnBaPb
χlf0.863 **−0.798 **0.780 **0.772 **0.3410.2340.813 **0.414 *0.424 *0.425 *0.729 **−0.560 **0.445 *
SIRM0.842 **−0.790 **0.796 **0.697 **0.3100.3030.734 **0.3230.444 *0.391 *0.833 **−0.591 **0.493 **
χARM0.867 **−0.804 **0.788 **0.693 **0.2810.406 *0.754 **0.3380.482 **0.396 *0.772 **−0.559 **0.462 *
S-ratio0.583 **−0.504 **0.455 *0.639 **0.380 *0.441 *0.652 **0.606 **0.502 **0.0810.160−0.450 *0.004
χARMlf−0.2440.123−0.251−0.195−0.158−0.050−0.2110.053−0.145−0.199−0.268−0.032−0.190
χARM/SIRM−0.726 **0.649 **−0.707 **−0.622 **−0.406 *−0.339−0.650 **−0.423 *−0.475 **−0.324−0.608 **0.565 **−0.362 *
SIRM/χlf−0.084−0.025−0.088−0.065−0.0760.047−0.0710.147−0.035−0.129−0.112−0.172−0.100
* Correlation is significant at the 0.05 level (2-tailed); ** Correlation is significant at the 0.01 level (2-tailed).
Table 5. Multiple linear regression results of the trace metal concentrations in the dustfall samples.
R2FSignif. FRegression Equations
Inner Mongolia0.63532.3320.000 Mg = 1.891+ 0.013 χARM
0.58726.5950.000 V = 14.315 + 0.432 χlf
0.65835.6720.000 Cr = 11.138 + 0.07 χARM
0.74252.7280.000 Mn = 2.219 + 38.228 SIRM
0.68640.3430.000 Fe = 5.342 + 0.036 χARM
0.84195.9390.000 Ni = 2.727 + 1.136 SIRM
Hebei0.69612.430.004V = 30.457 − 0.036 χARM + 0.236 χlf
0.7818.7490.001 Fe = 12.862 + 0.107 χlf − 0.015 χARM
0.51811.750.008 Zn = 670.842 − 28.205 χARM/SIRM
0.59515.7160.003Pb = 295.68 − 13.852 χARM/SIRM
Publisher’s Note: MDPI stays neutral with regard to jurisdictional claims in published maps and institutional affiliations.

