Article

Numerical and Experimental Study on a Novel Filling Support Method for Mining of Closely Spaced Multilayer Orebody

1
School of Resources and Environmental Engineering, Wuhan University of Technology, Wuhan 430070, China
2
Hubei Key Laboratory of Mineral Resources Processing and Environment, Wuhan 430070, China
*
Author to whom correspondence should be addressed.
Minerals 2022, 12(12), 1523; https://doi.org/10.3390/min12121523
Submission received: 27 September 2022 / Revised: 21 November 2022 / Accepted: 25 November 2022 / Published: 28 November 2022

Abstract

:
Mining of closely spaced multilayer orebodies brings the problems of significant disturbance between adjacent mining layers and drastic structural changes in surrounding rock, which brings the need for a more effective stope support method. Previous research has made sound analysis on filling or bolt support, but neither of them can solely provide ideal support effects. Thus, a novel bolt-filling support method is proposed by utilizing the synergistic effect of rock bolts (cable bolts) and filling. Numerical simulation and similarity experiments were conducted in this research to analyze the support effect of this method for multilayer ore mining. For numerical simulation, the distinct-element modelling framework PFC2D (Particle Flow Code in 2 Dimensions) was applied for four support scenarios based on the calibration of the microscopic parameters of particles in vanadium shale ores. The numerical simulation results show that the number of fractures decreases from 1311 without support through 652 with 95% filling support to 410 with bolt-filling support, which is resulted from the redistribution of the force chains due to support change. On the other hand, a 300 cm ×180 cm × 40 cm similarity model with a geometry similarity constant of 100 was established based on the 4# rock layer profile of Mount Shangheng. Two parts of similarity experiments were conducted to investigate the strains around the stopes in multi-layer ore mining for three support scenarios. The experiment results prove that the highest strain is in the center of the roof on the upper goaf, and the roof-bolt filling support induces smaller strains than zero support and conventional filling support. Finally, an effective bolt-filling support system has been developed and validated, which can improve the safety and the stability of the roofs and interlayers during the mining process of closely spaced multilayer orebody by reducing the overall load and fractures in surrounding rock.

1. Introduction

When an ore deposit consists of multiple layers with small spacing, its occurrence is usually rather complex. If multiple sections are mined in such ore layers, the disturbance generated by one layer affects another adjacent layer, which will form a large interactional multilayer goaf group. When other ore layers continue to be mined, the floor of the upper layer will become the roof of the next layer, which makes the management of roof stability more complicated [1]. In this situation, the stability of the goaf and the surrounding rock mass will decline layer by layer, which may even lead to a large area collapse of the roof [2], and thus is not conducive to the safe production of a mine. Therefore, research on the stope stability of a multilayer orebody is of important application value and academic significance.
The rock mass surrounding a stope for underground mining usually bears certain complexity at different aspects [3]. Many researchers analyzed the deformation of rock mass by investigating elastic strains [4,5], plastic strains [6], and elastoviscoplastic strains [7], etc. This complexity has also been studied by observing crack propagations. Some scholars conducted theoretical analysis and experiments on crack propagation [8,9,10]; others made their efforts from numerical simulations [11,12,13]; and others paid their attention on the influence of different stress factors on crack propagation [14,15,16]. High stress or strain can cause rock failure, thus plenty of research has been conducted focusing on rock behaviors and failure characteristics. For simplicity, the rock failure can be analyzed under uniaxial compression loading [17]. However, the rock mass is under triaxial loading condition for underground mining, which requires the experiments to be conducted meeting such loading condition [18]. Besides laboratory experiments, the rock failure mechanism can also be analyzed by acoustic emission [19] and numerical simulation [20,21]. In spite of the abundant research on rock behaviors, there is still a lack of force and fracture characteristics for the surrounding rocks of closely spaced multilayer ore mining.
Besides exploring the mechanical properties and failure mechanism of rock mass, scholars have carried out plenty of research on surrounding rock support and goaf filling. Ghorbani et al. [22] made a good review of rock support systems in high stress ground conditions. Among all kinds of rock support systems, rock bolts are commonly used tools. So, the mechanism and effectiveness of rock bolts have been widely studied around the world by theoretical analysis [23,24], laboratory experiments [25,26], and numerical simulations [27,28]. Till now, rock bolt support systems are still under continuous optimization [29,30]. In addition to rock bolts, cable bolts are also widely used for rock support, and there is no lack of related research [31,32,33]. However, the conventional bolt-shotcrete support is prone to breakage failure during large deformation of the surrounding rock [34], which leads to the importance of back filling support method.
Backfill mining is usually accompanied by various filling methods according to the filling process, filling power, backfill materials, filling position, filling volume, and so on [35]. Backfill mining technology is widely applied around the world [36,37,38]. Currently, the most popular filling method is the cemented filling process by paste filling and paste-like filling [39]. However, paste filling has problems such as high equipment investment, long construction period, serious tube jam phenomenon and high failure rate [40]. In general, the supporting role of cemented backfill mainly lies in its limiting effect on the surrounding rock and joint action with the surrounding rock [41]. From an energy balance point of view [42], there exists energy exchange during the coupling process between the backfill materials and the rock mass, and the reaction force provided by the deformation energy stored in the backfill materials can inhibit the deformation of the surrounding rock.
In summary, most of the existing research on support methods is based on either traditional rock bolts (cables) or filling support. However, there is little research on the combined support [43] of rock bolt and filling for underground mining engineering, especially for the mining of closely spaced multilayer ore bodies with the interlayer disturbance.
Based on the analysis above, it can be noted that the surrounding rock failure mechanism and stope stability are highly concerned issues for closely spaced multilayer ore mining. Thus, the purpose of this study is to propose a novel and effective support method based on the synergistic action of rock bolts (cables) and backfill. Theoretical analysis, numerical simulation and similarity experiments are used to analyze the facture distributions, force chains, stresses, and the support effect of this method.

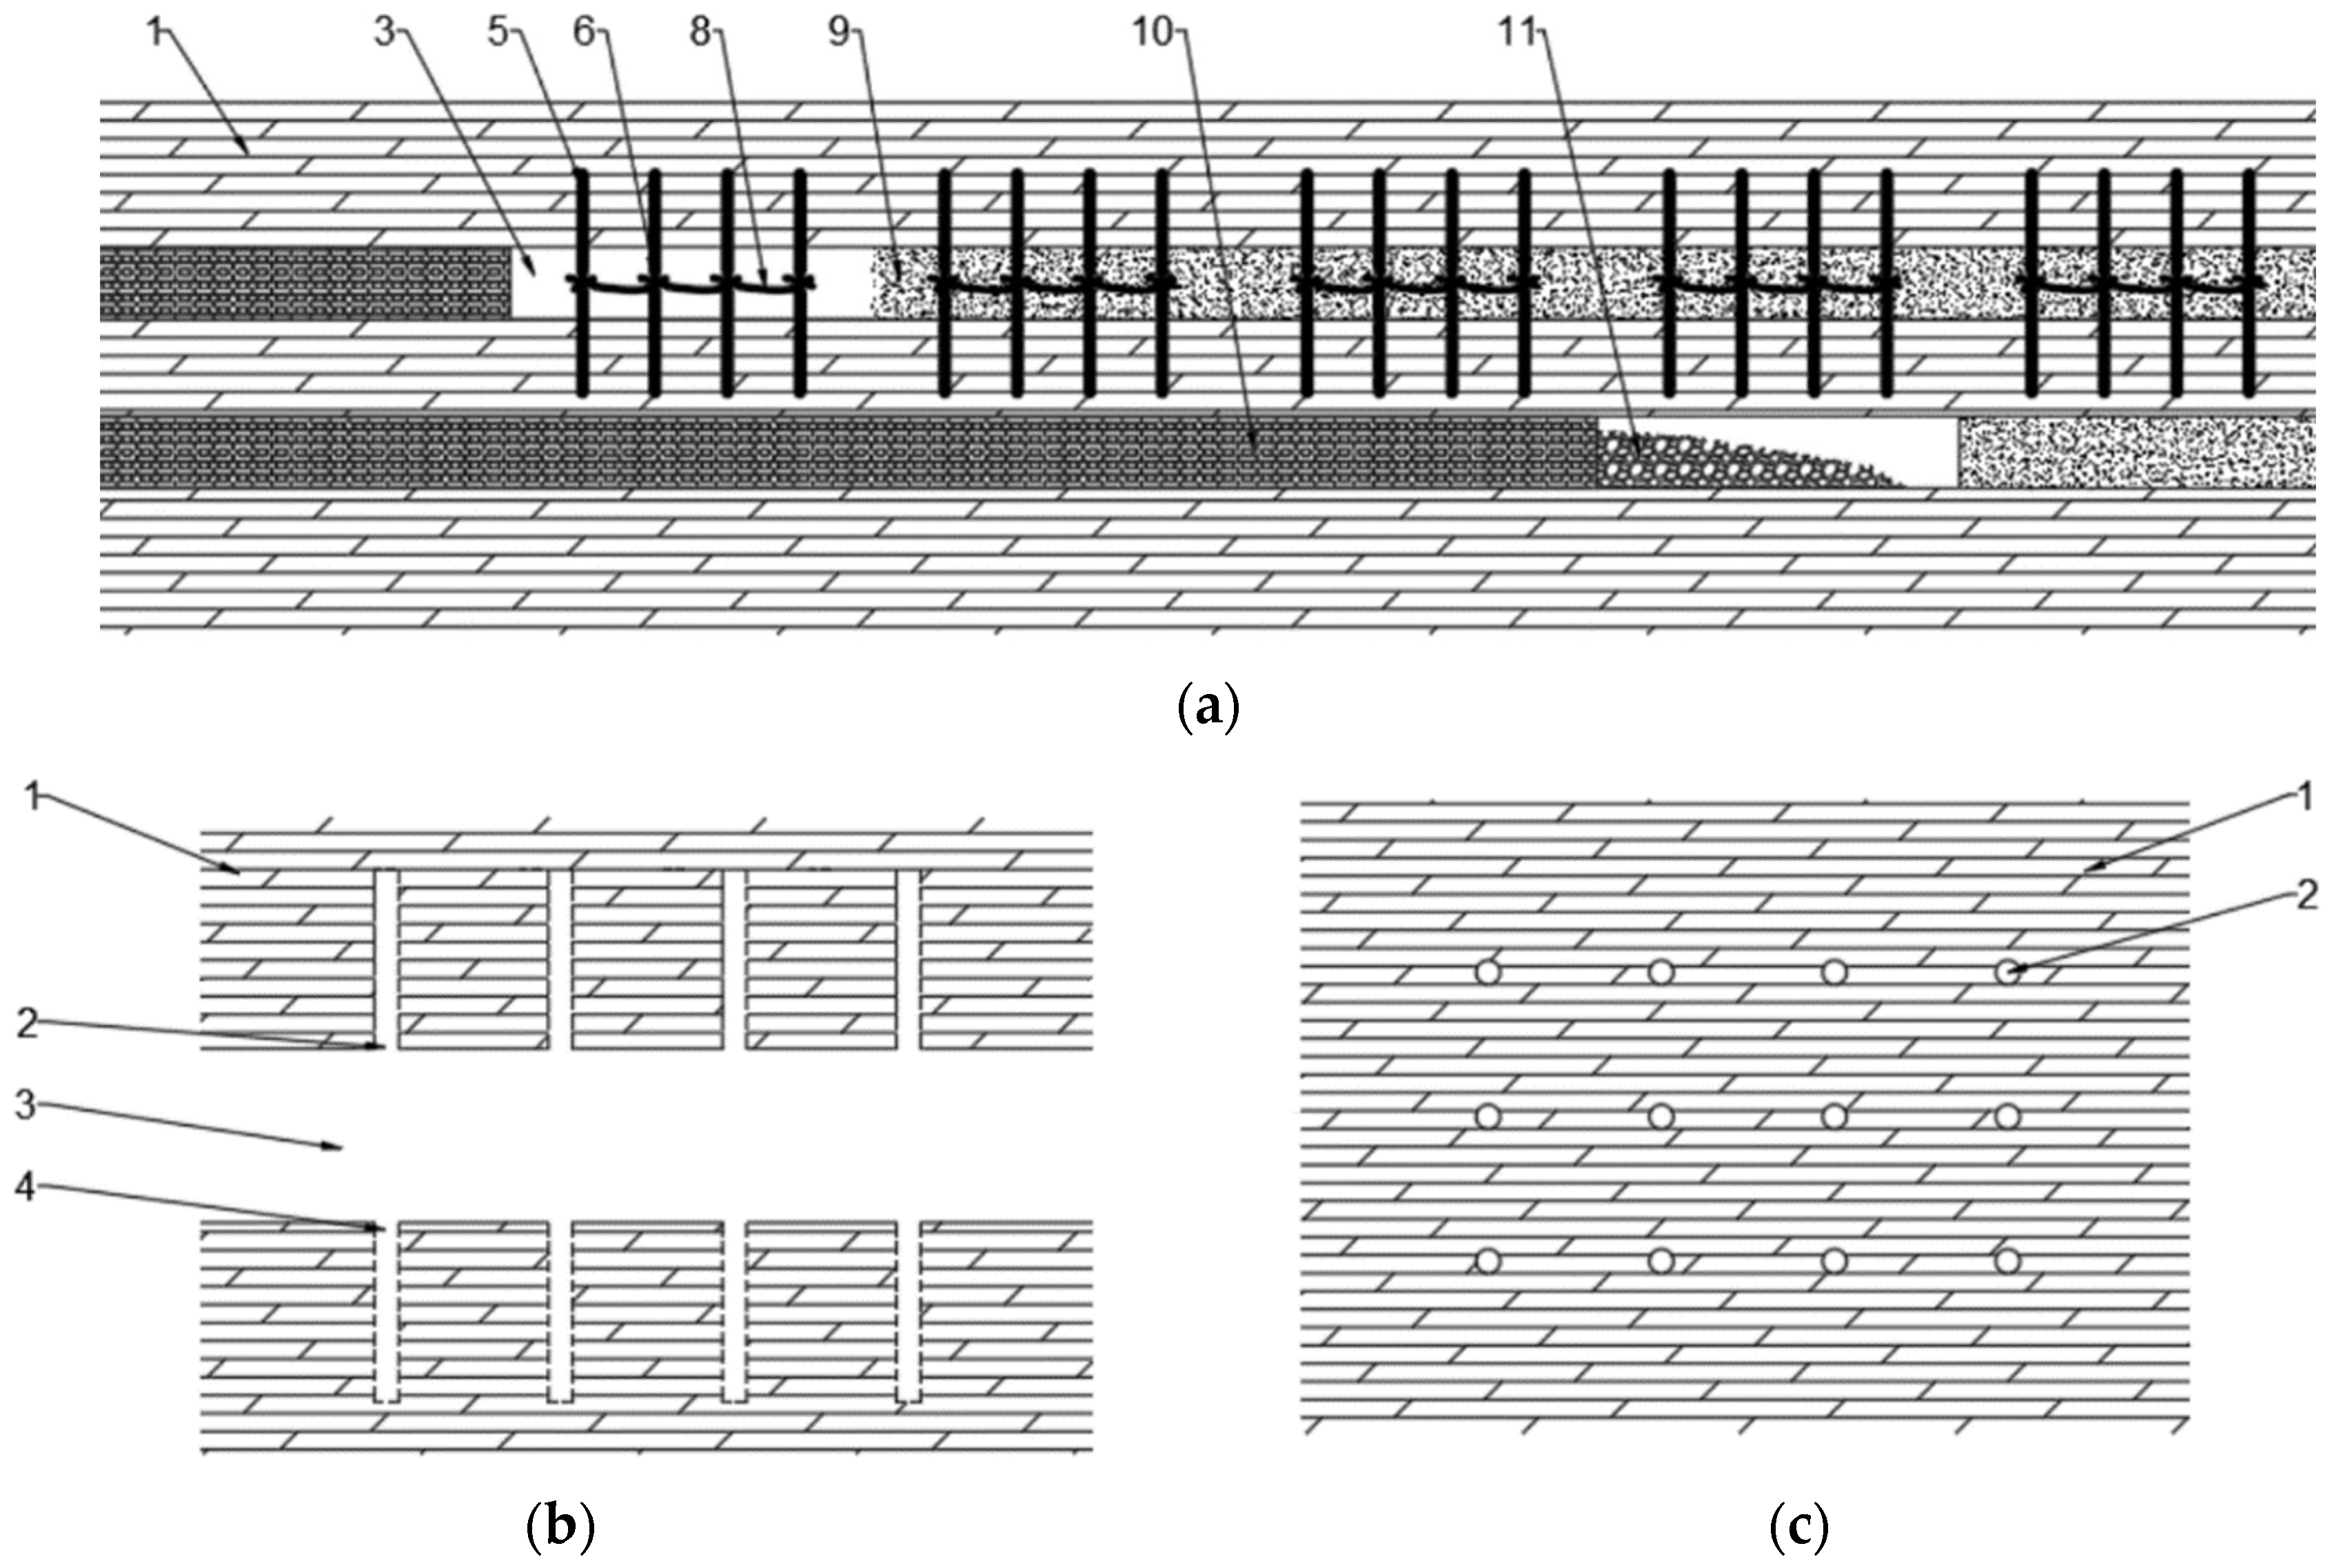
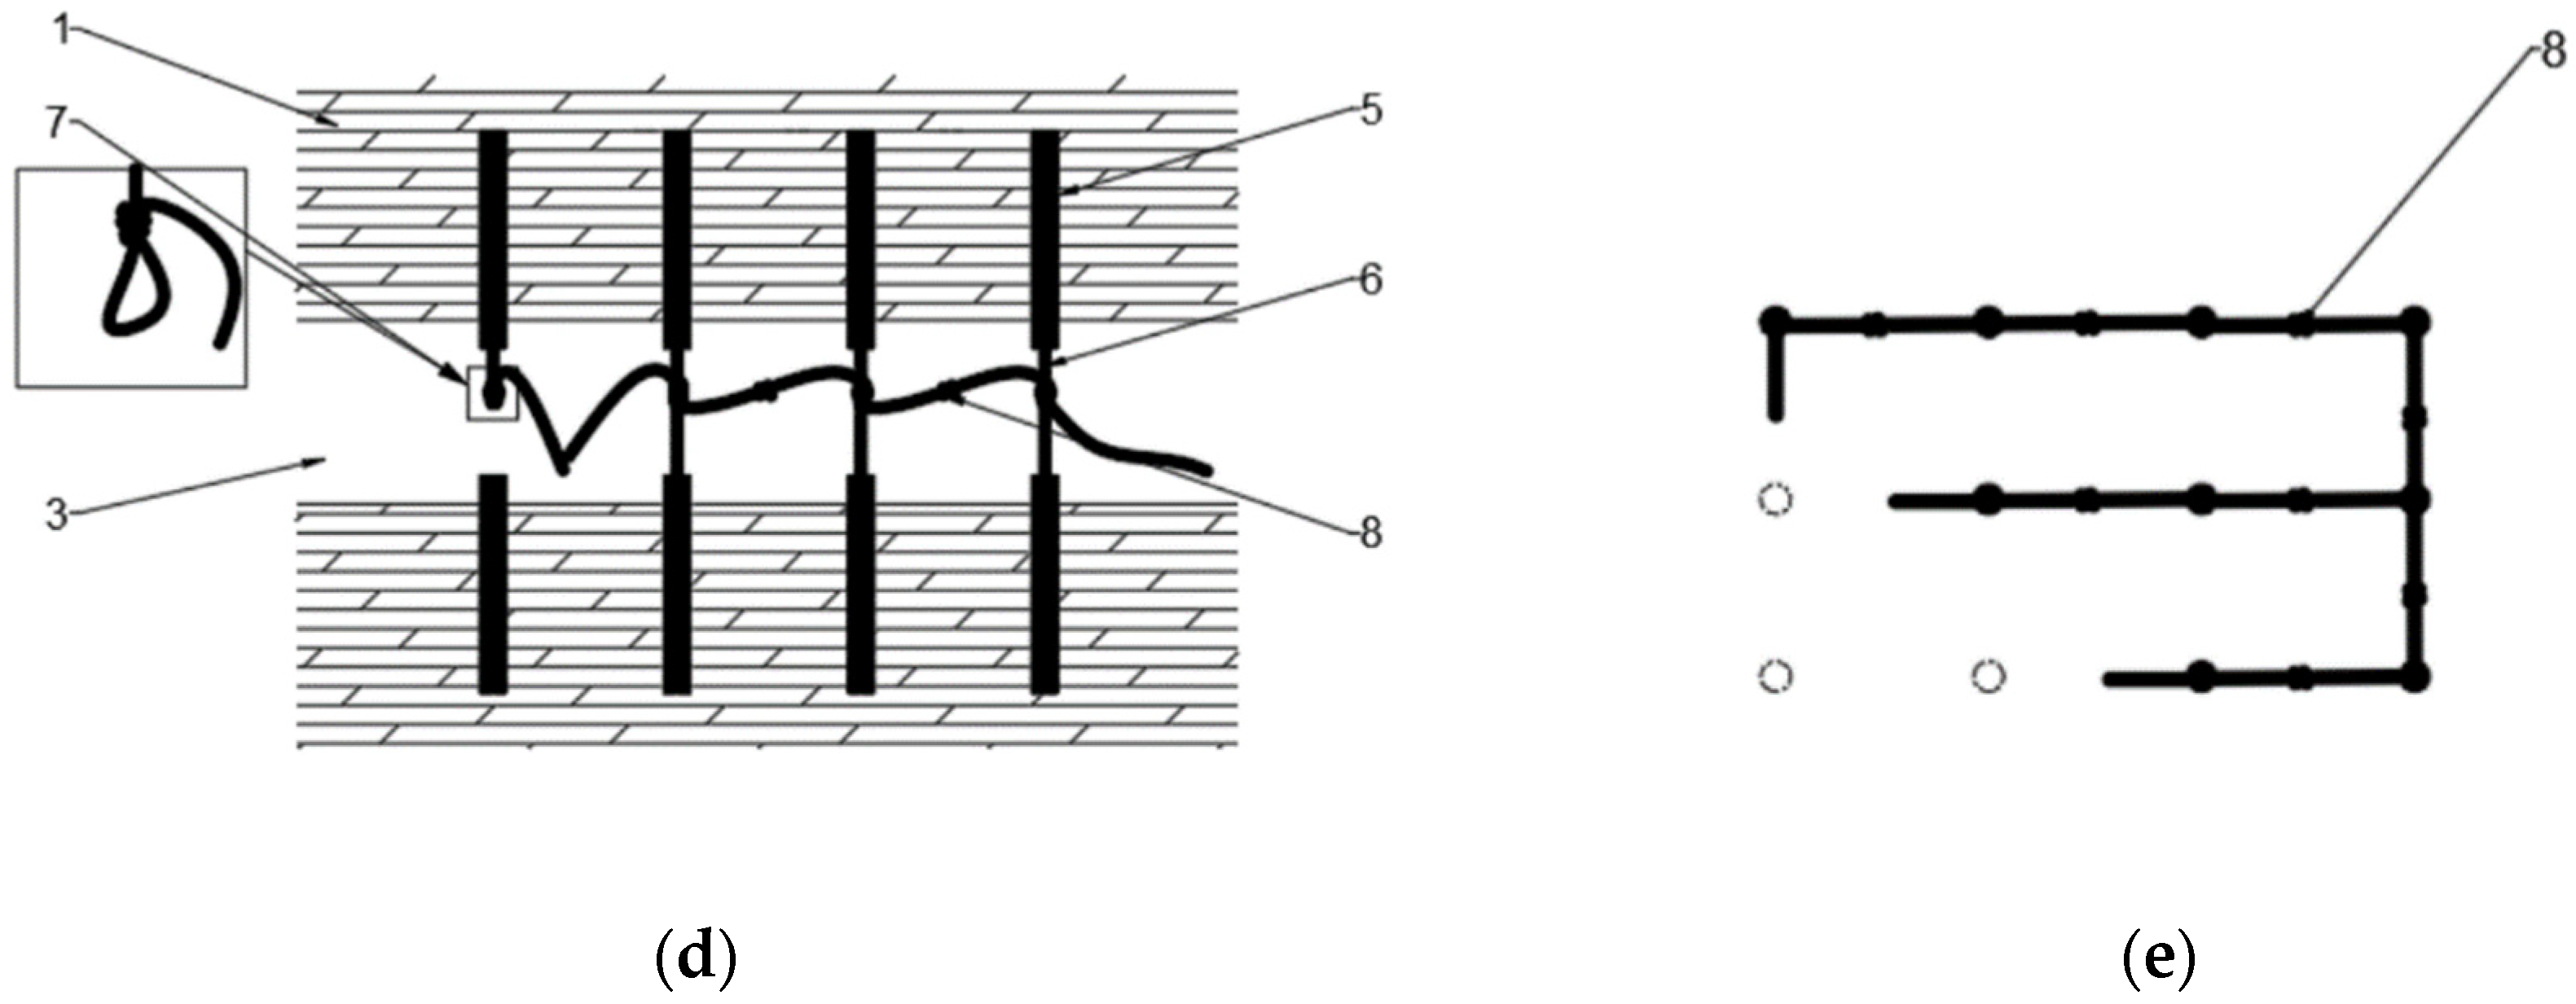
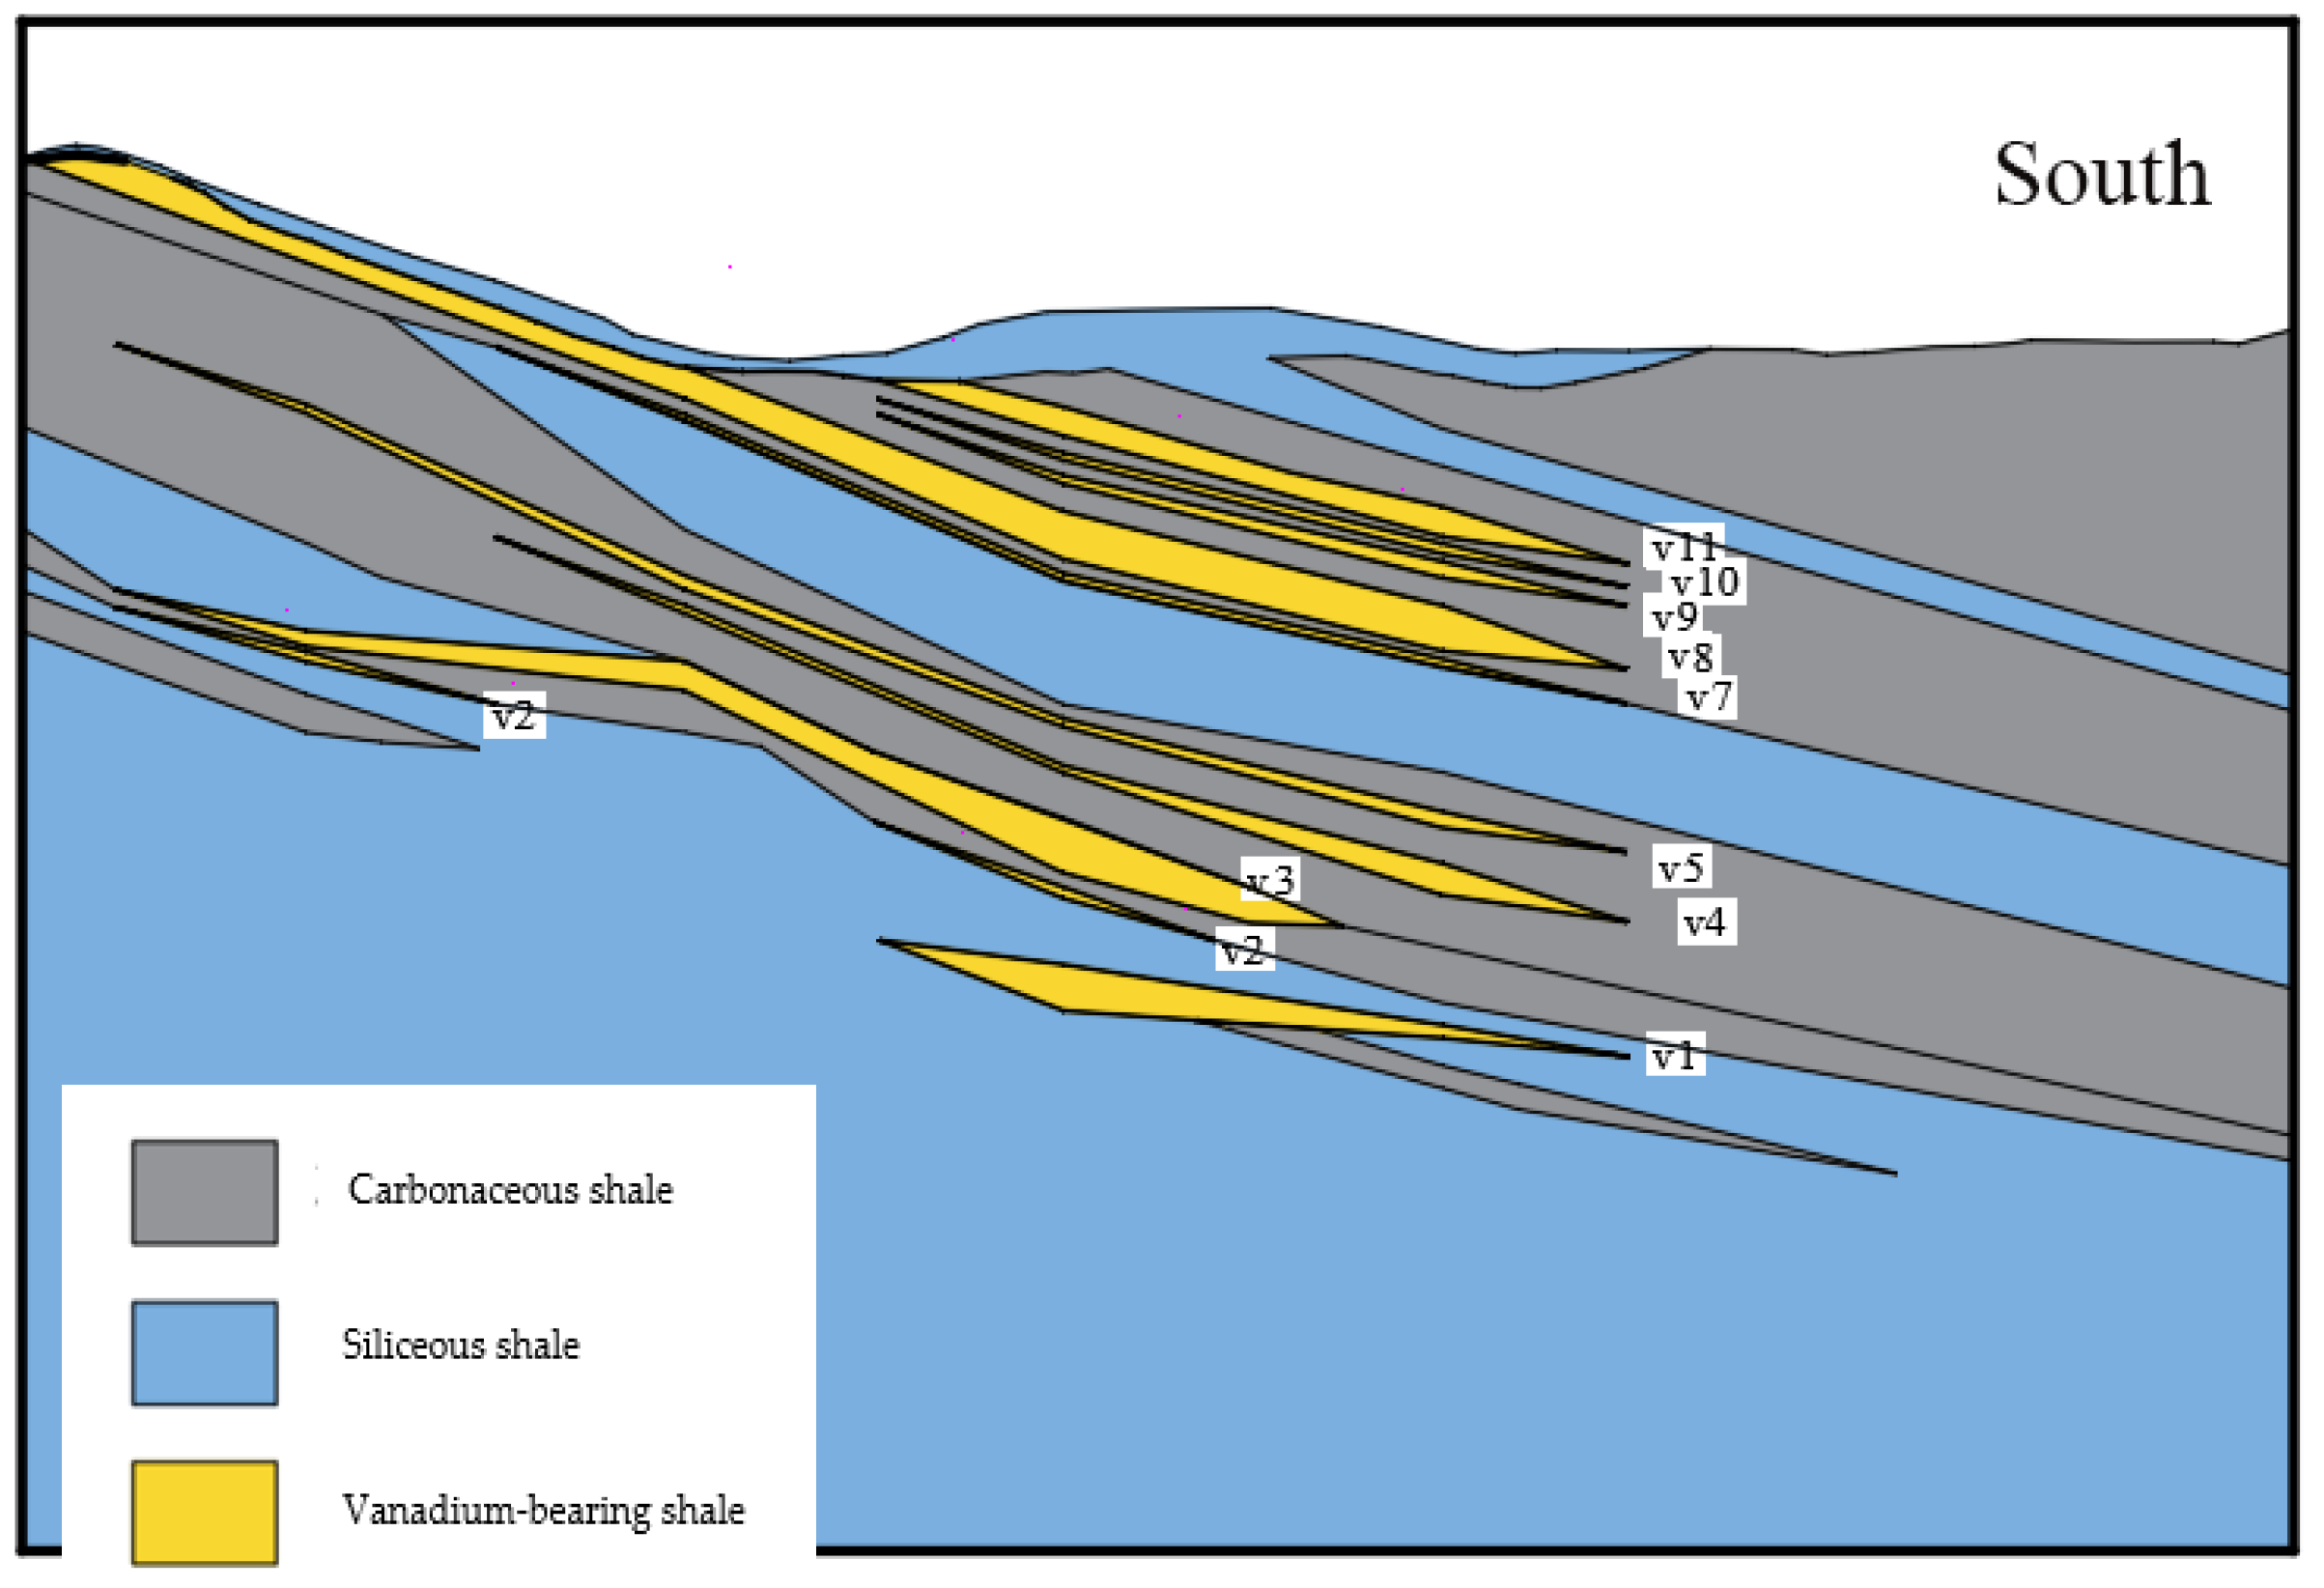
2. Bolt-Filling Support Method and System

Based on related research [44], the mining activities of closely spaced multilayer ore bodies will cause a mutual disturbance between layers, and the thin interlayer between two layers of orebodies will be prone to fracture or collapse with the formation of the goafs. When downward mining is used, filling or bolt support is often used to ensure the safe production of the stope and the stability of the goaf, but these two support methods also have certain limitations. The backfill can effectively support the surrounding rock of a goaf in a single-layer orebody and prevent further deformation and damage. However, after the lower ore body layer is mined, the floor of the upper goaf becomes the roof of the lower goaf (this part of the rock is called the interlayer). The backfill of the upper goaf presses on the interlayer, directly increasing the load on the interlayer and exacerbating the risk of interlayer fracture. When rock bolts or cable bolts are used to reinforce the surrounding rock, a larger deployment density is often set, which is costlier and cannot be used for goaf support on a large scale. Bolts require anchoring the weak rock to hard rock to prevent the instability and destruction of the weak rock, but the interlayer is suspended above and below, with no hard rock to support it. In this situation, traditional support methods are ineffective, costly, and not adapted to large-scale mining of closely spaced multilayer ore bodies. In view of the problems above, we now provide a support method with the synergistic effect of rock bolts (cable bolts) and filling, which is named bolt-filling support in that rock bolt (cable bolt) support and filling support are used at the same time.
Firstly, several sets of upward roof holes and downward floor holes with one-to-one coaxial correspondence are drilled in the upper goaf, so that the rock bolts are mainly subject to axial tensile stress after installation. Secondly, the bolt-filling support system consists of two parts: the rigid sections (rock bolts) inside the holes and the flexible sections (cable bolts) outside the holes. After the rigid sections are all anchored, the flexible sections from any pair of up-down holes with one-to-one correspondence are connected and a certain prestress is applied to ensure that the two rock bolts are in a tensile state in the axial direction. The rigid section is used to anchor the rock mass, and the flexible section is used to connect the backfill and its upper and lower surrounding rocks. Then the excess flexible sections are all unfolded and connected to each other to form a cable bolt network, which, as the main reinforcement of the backfill, bears the internal tensile force and strengthens the backfill. Finally, the backfill is injected into the goaf to complete the bolt-filling support. Figure 1 illustrates the detailed structure of this support system.

3. Numerical Simulation Study of Bolt-Filling Support

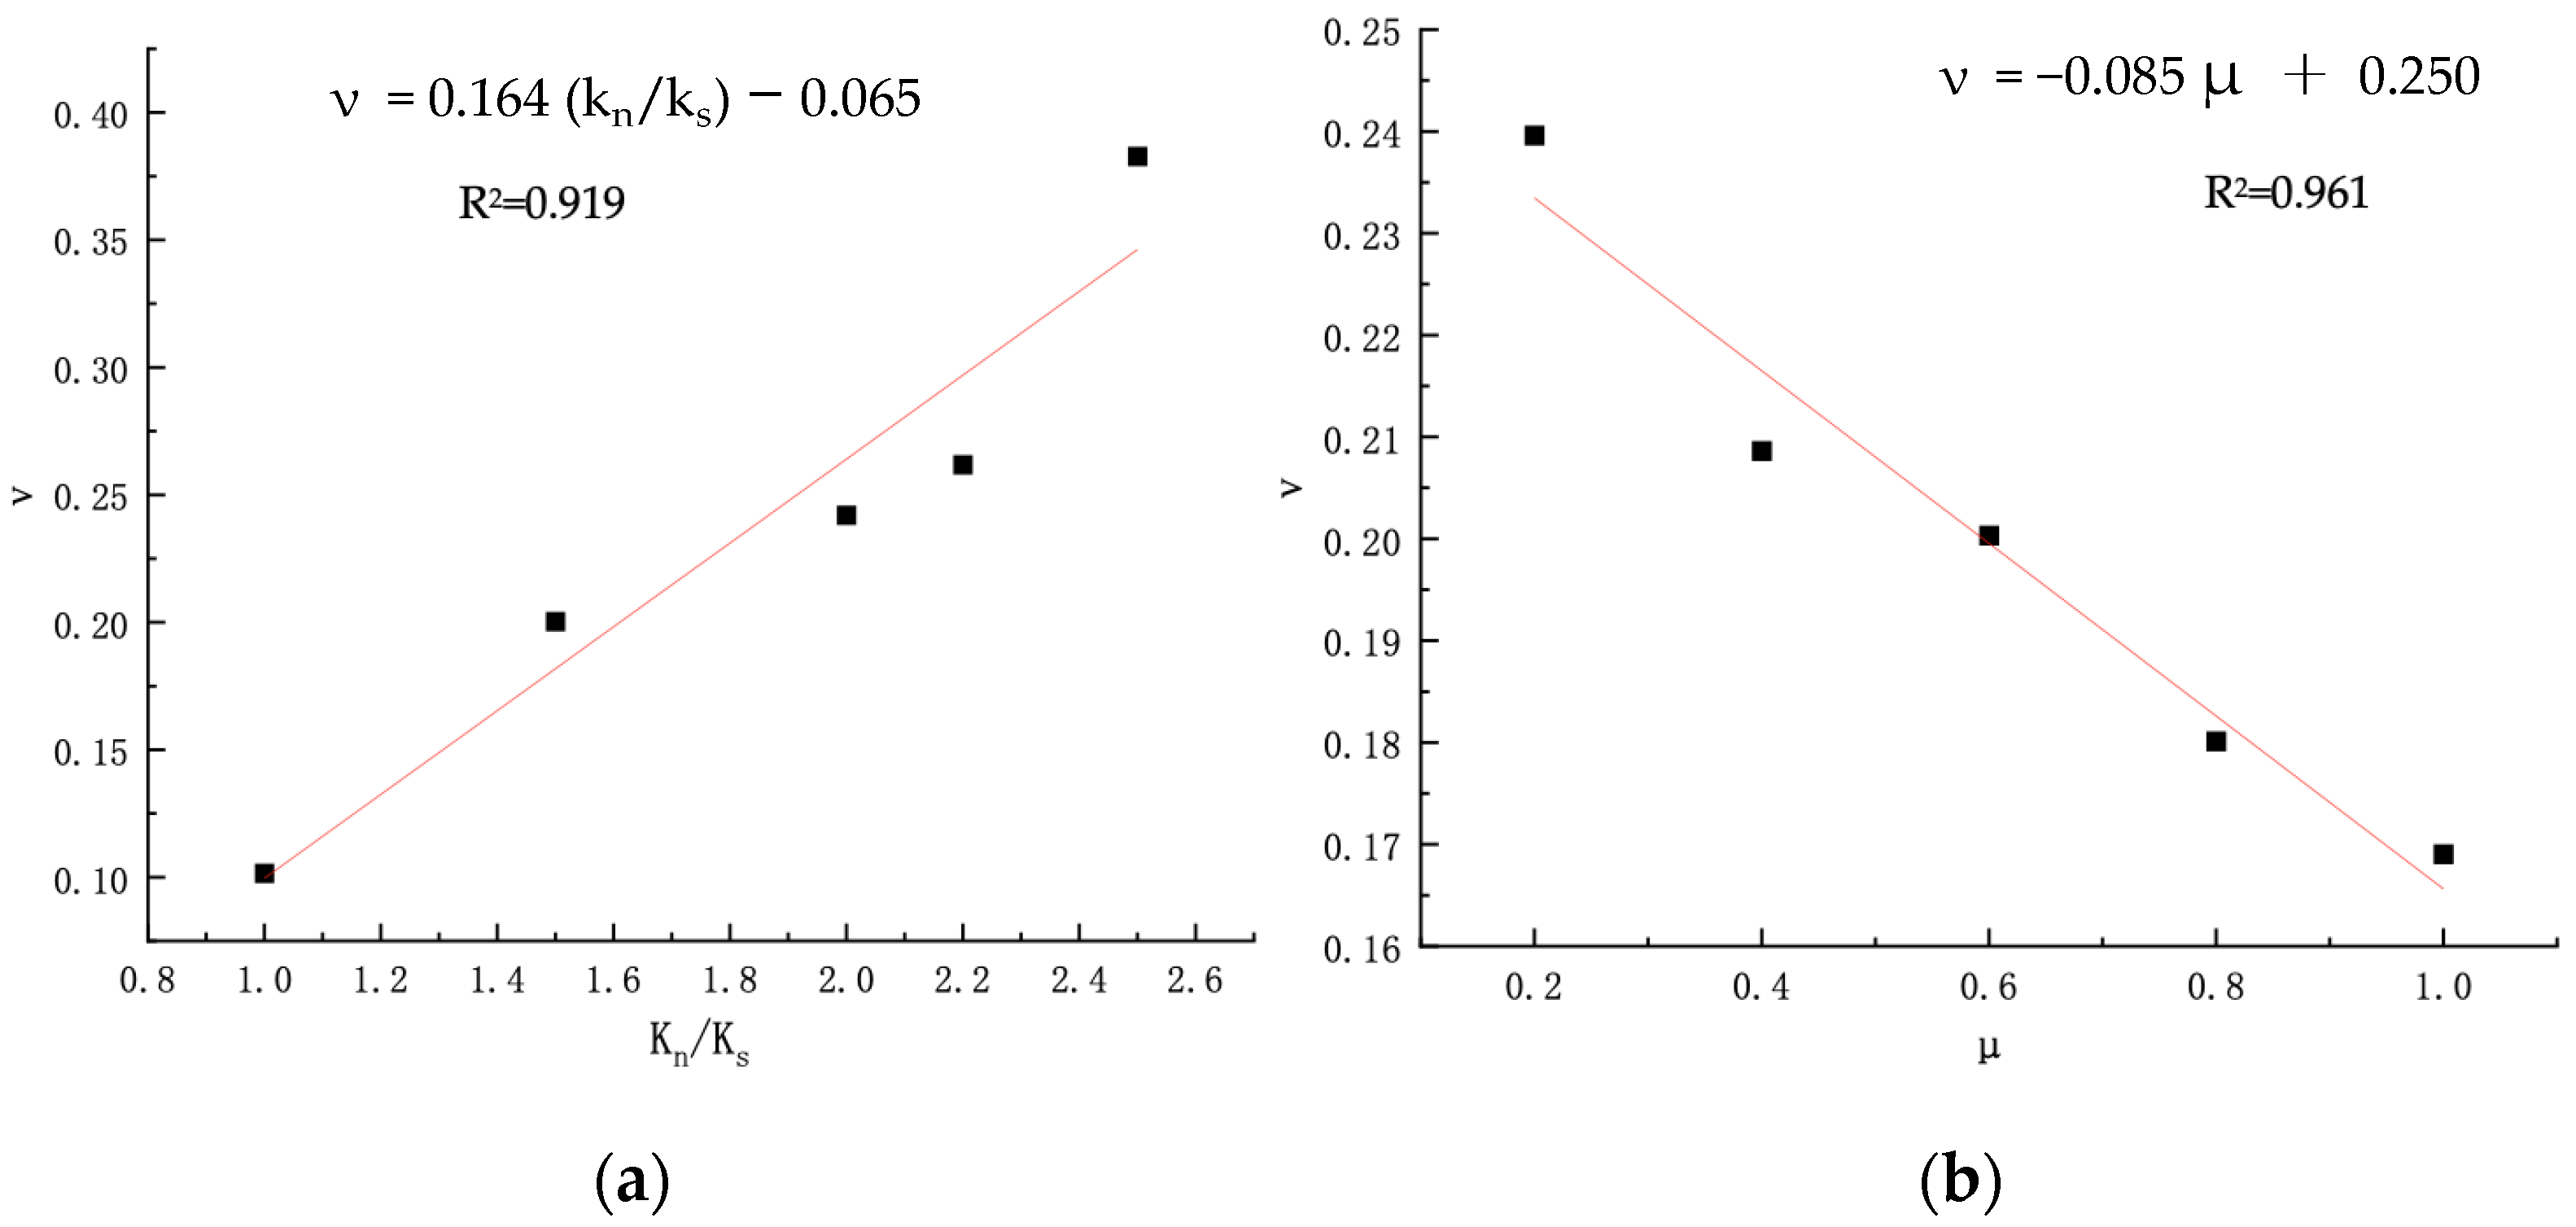
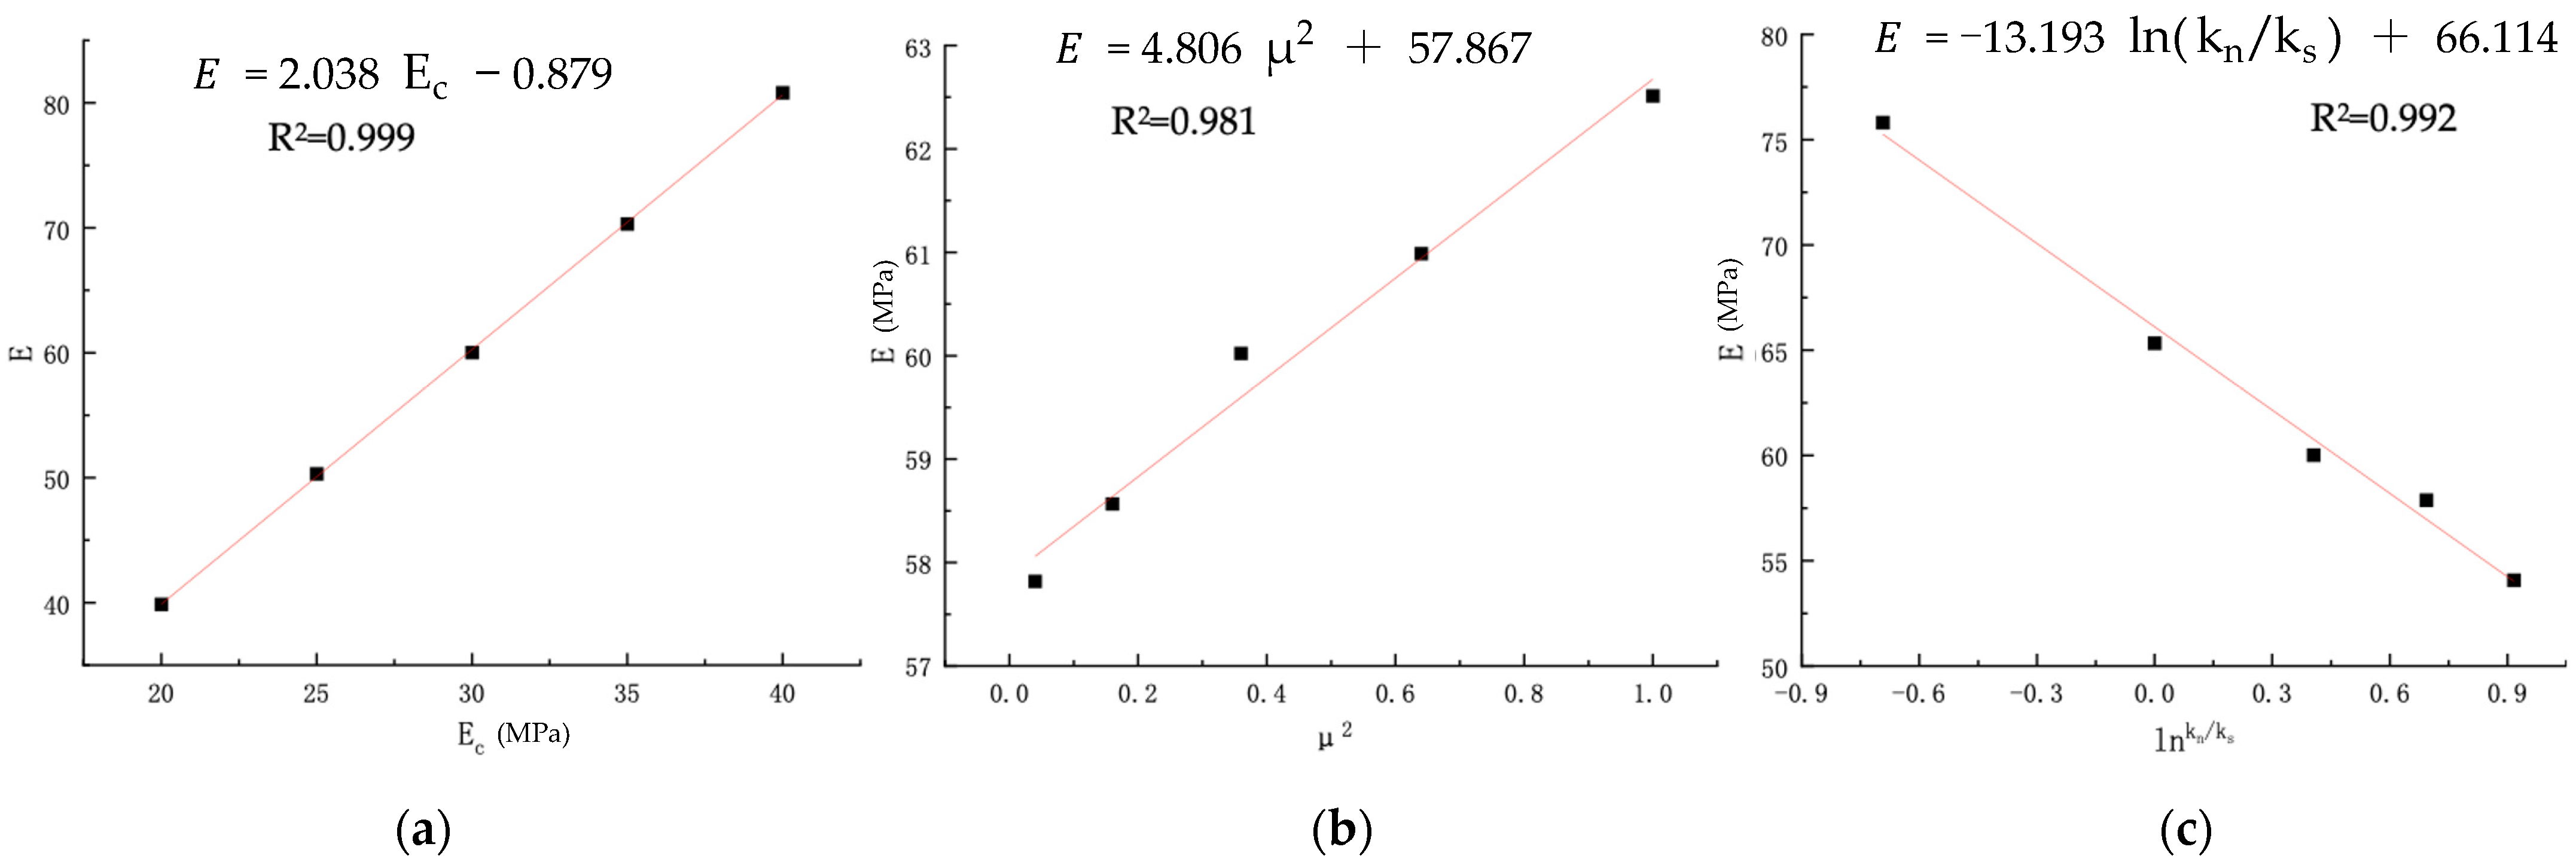
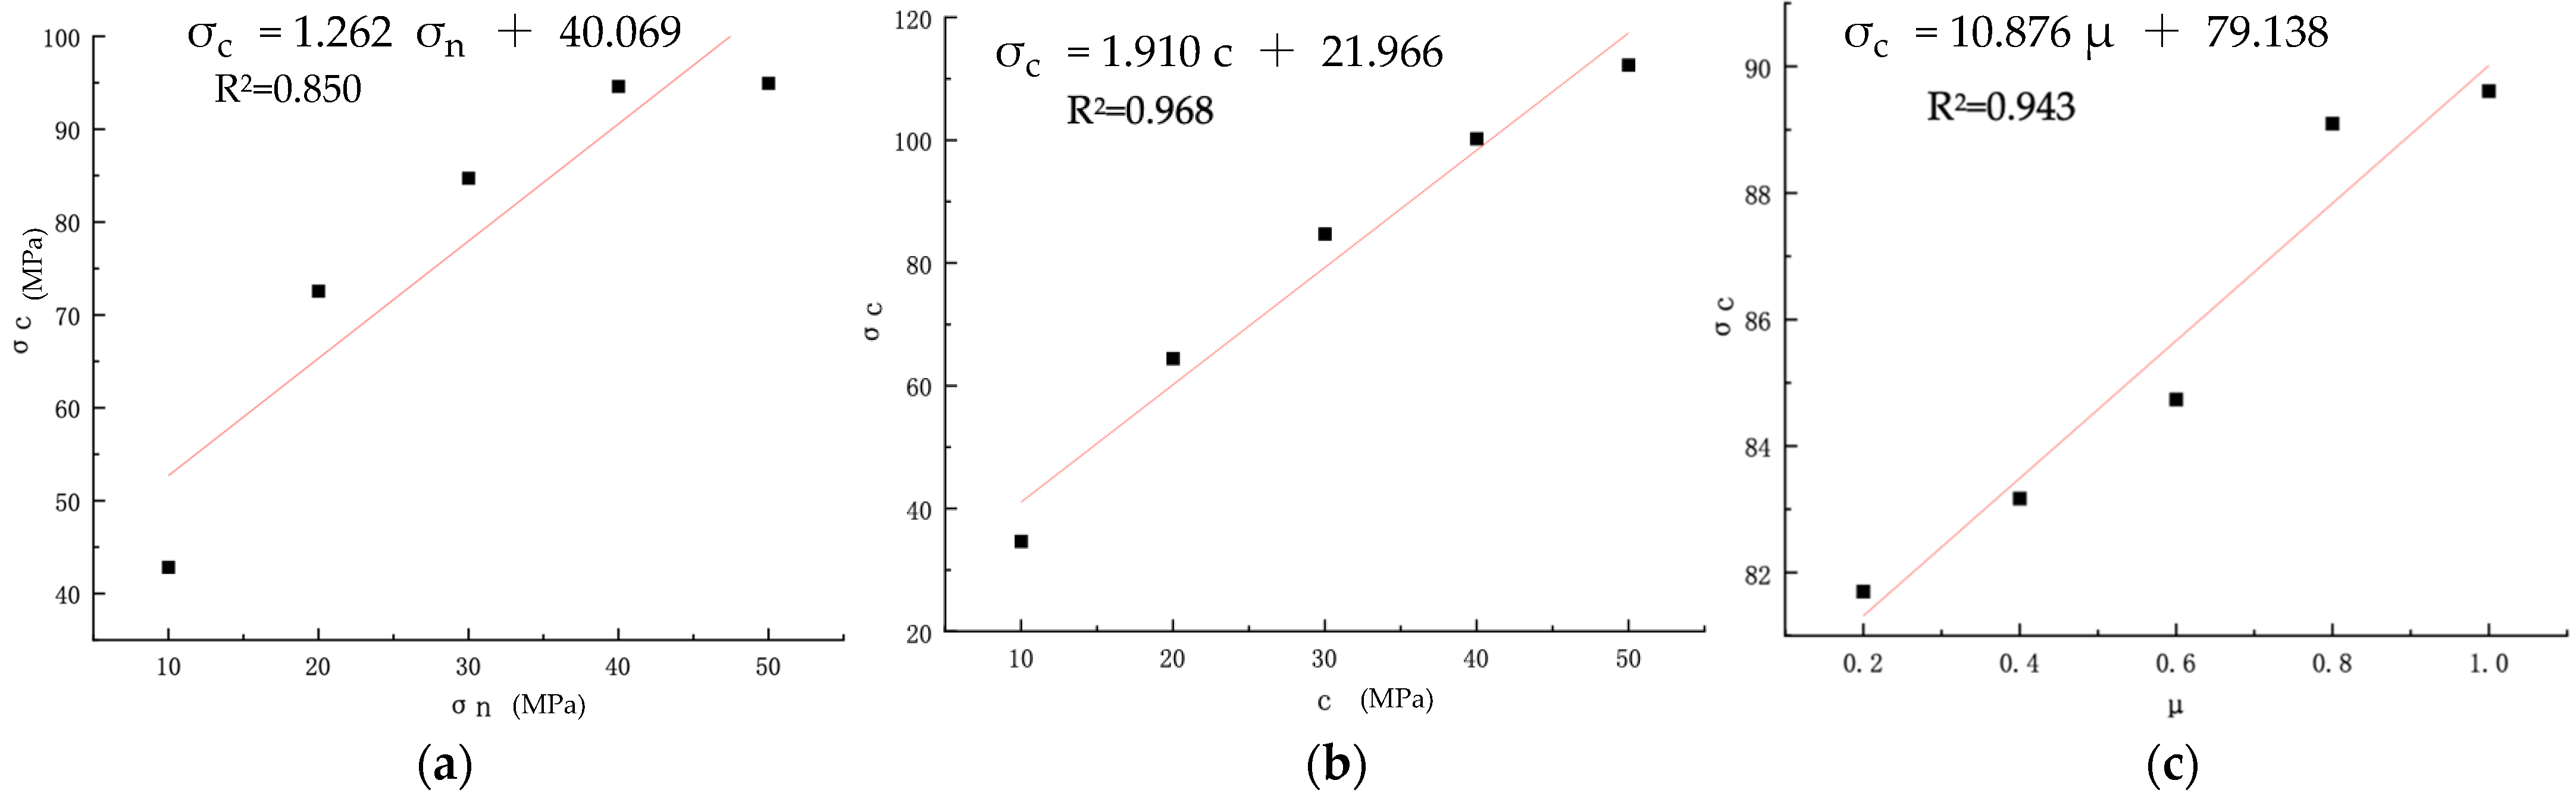
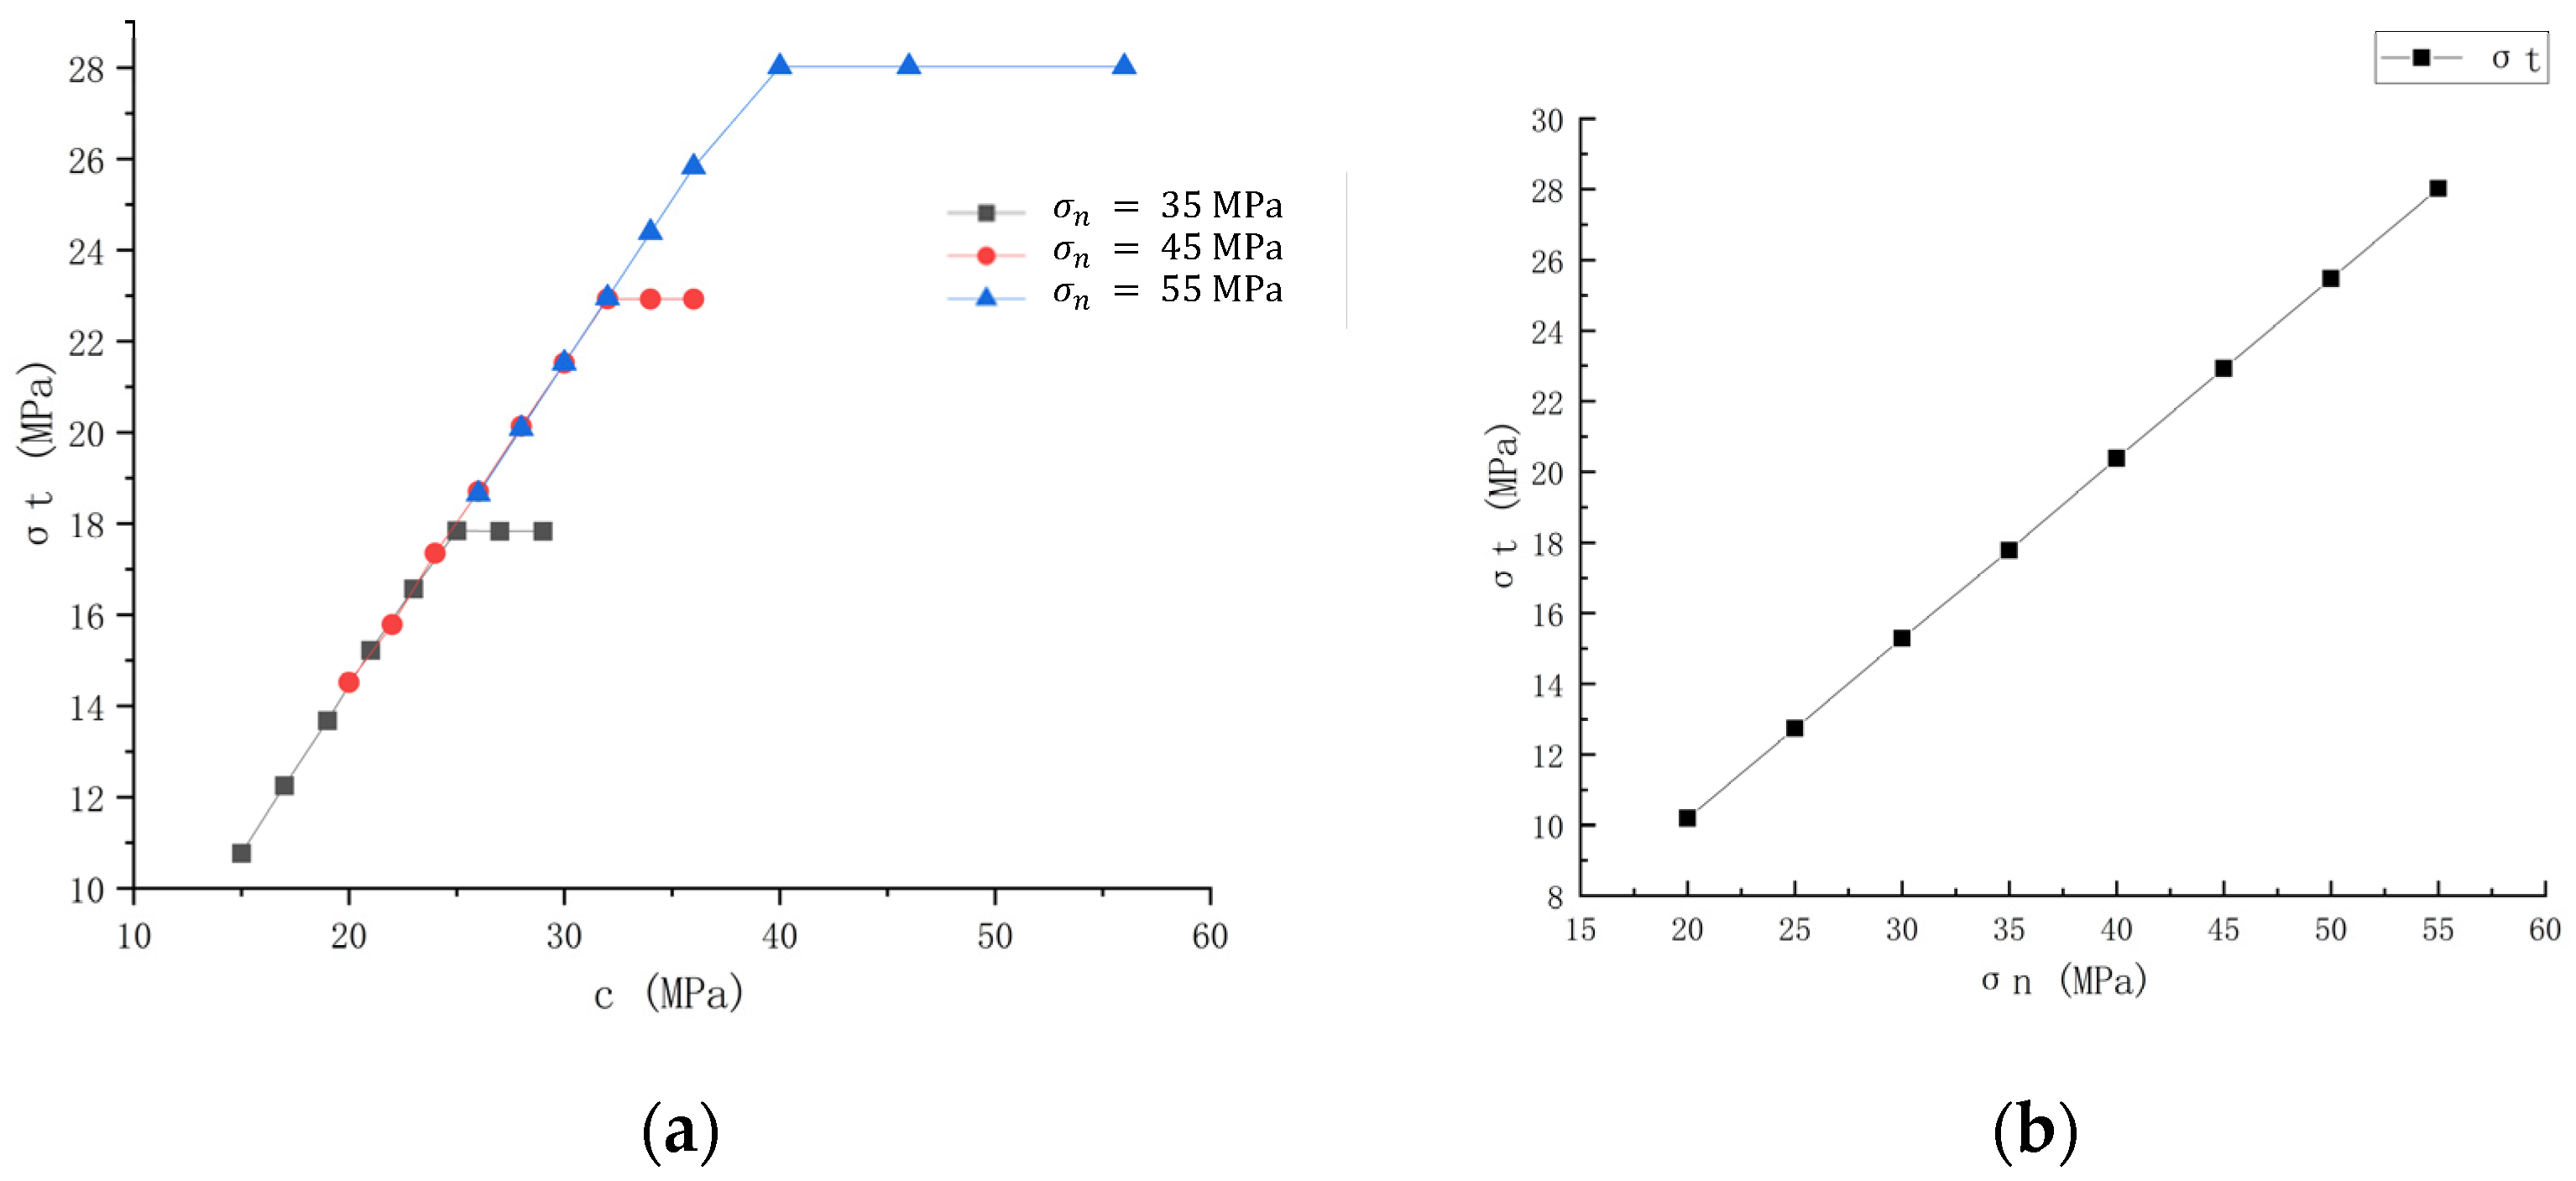
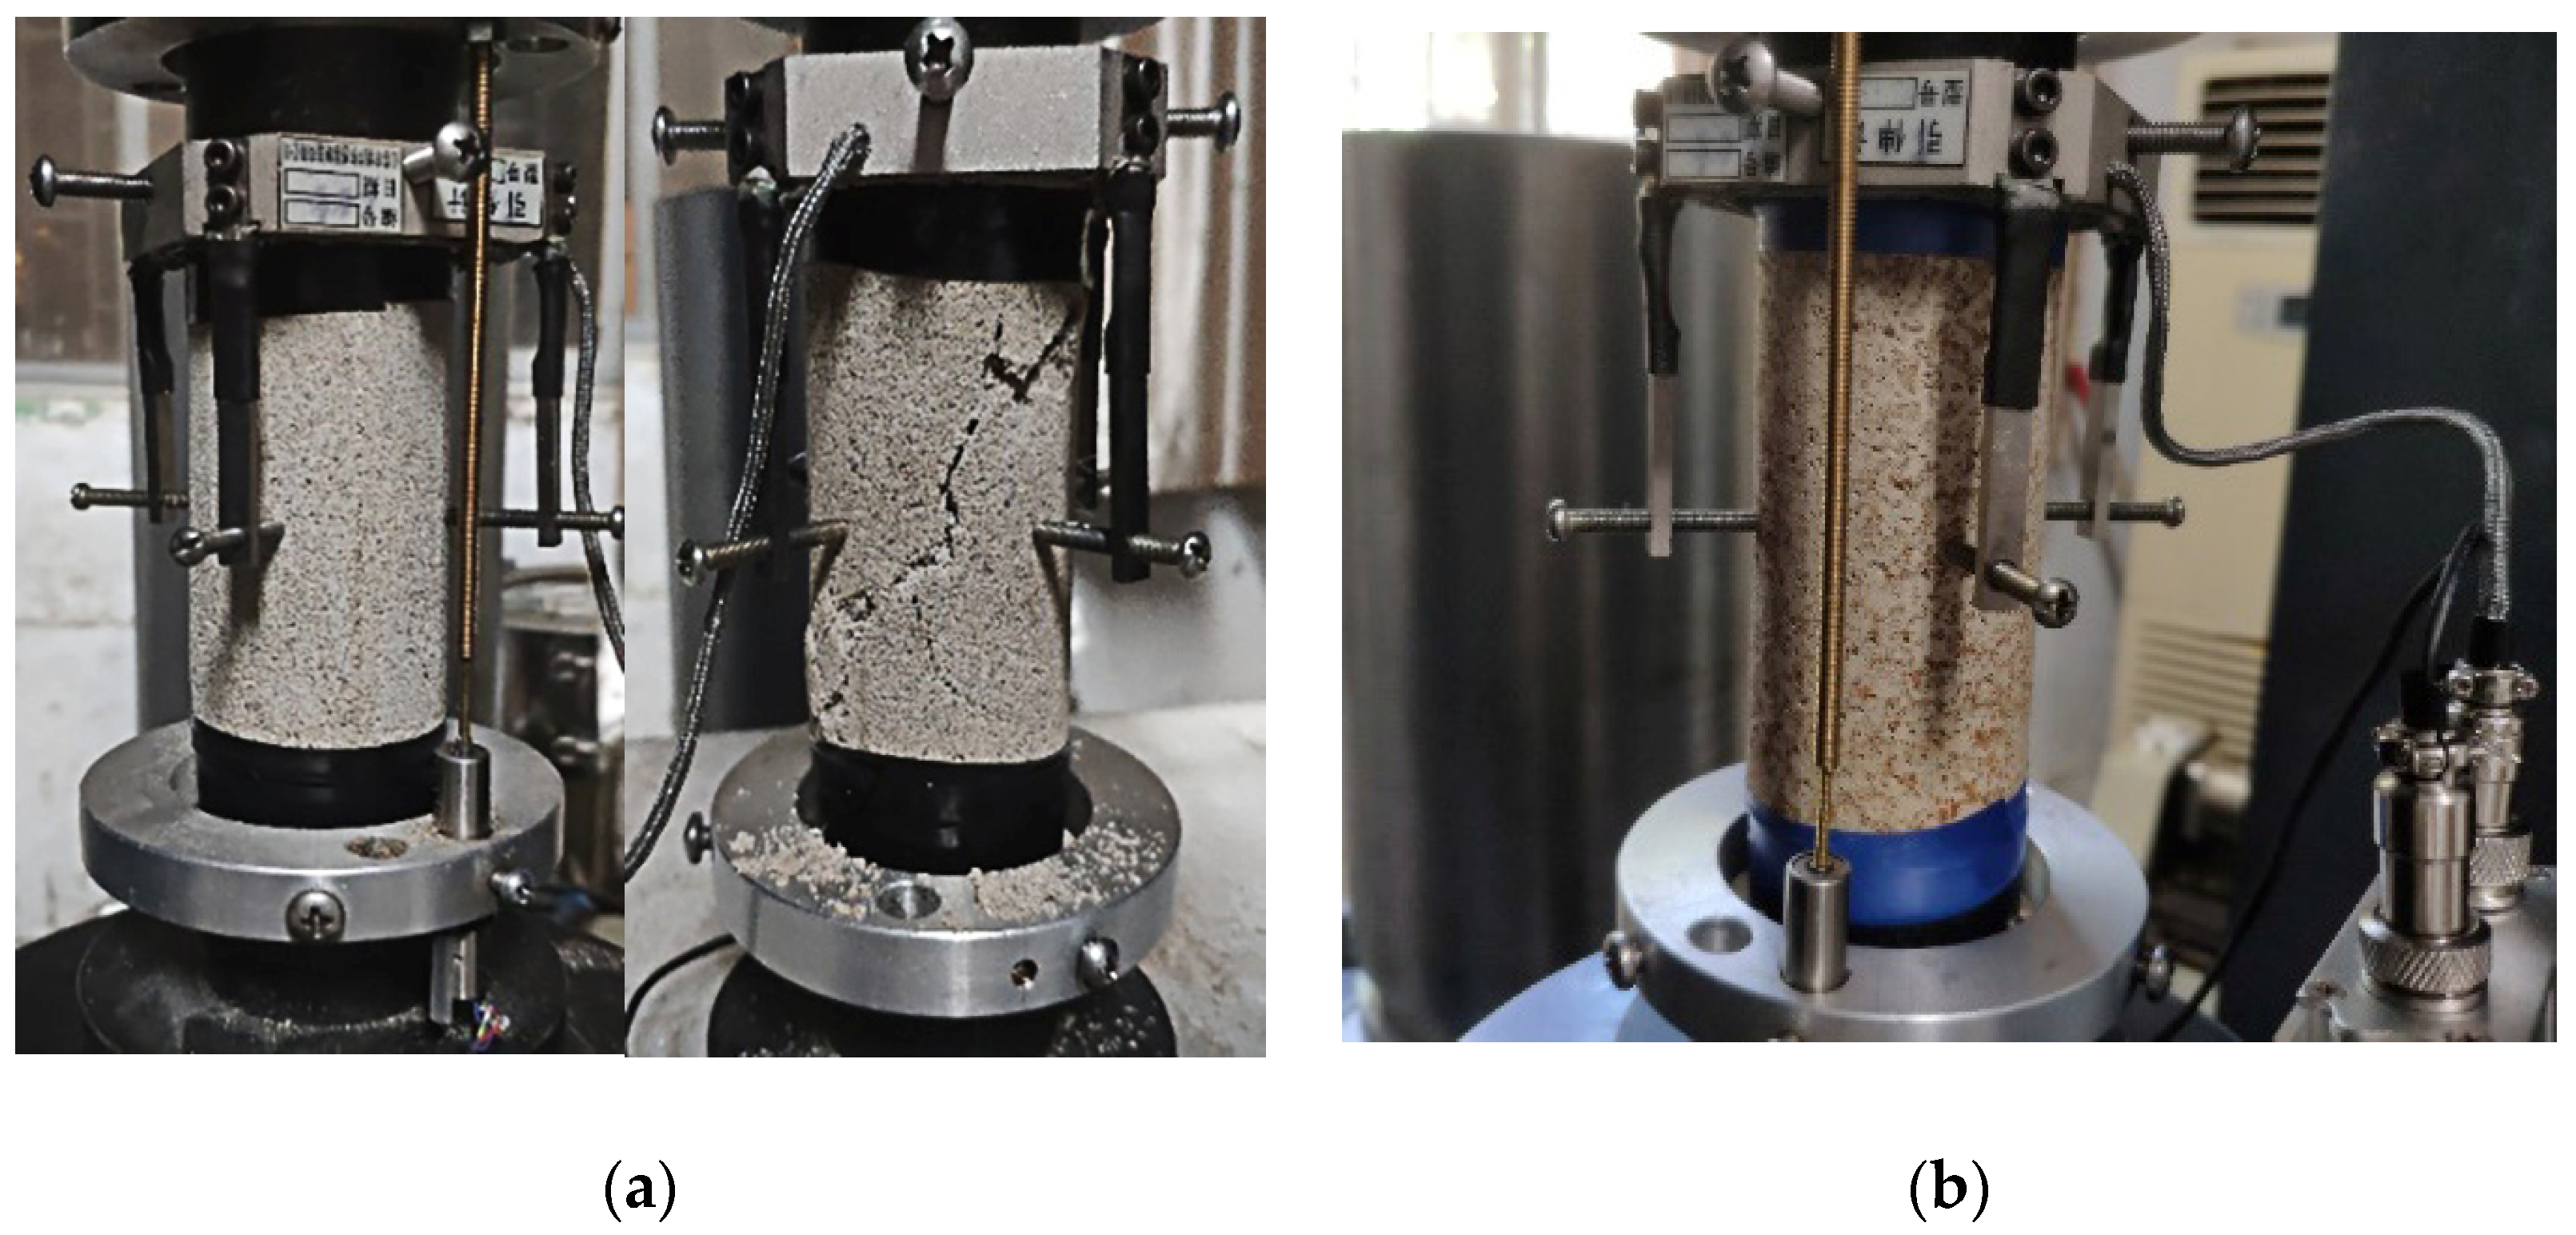
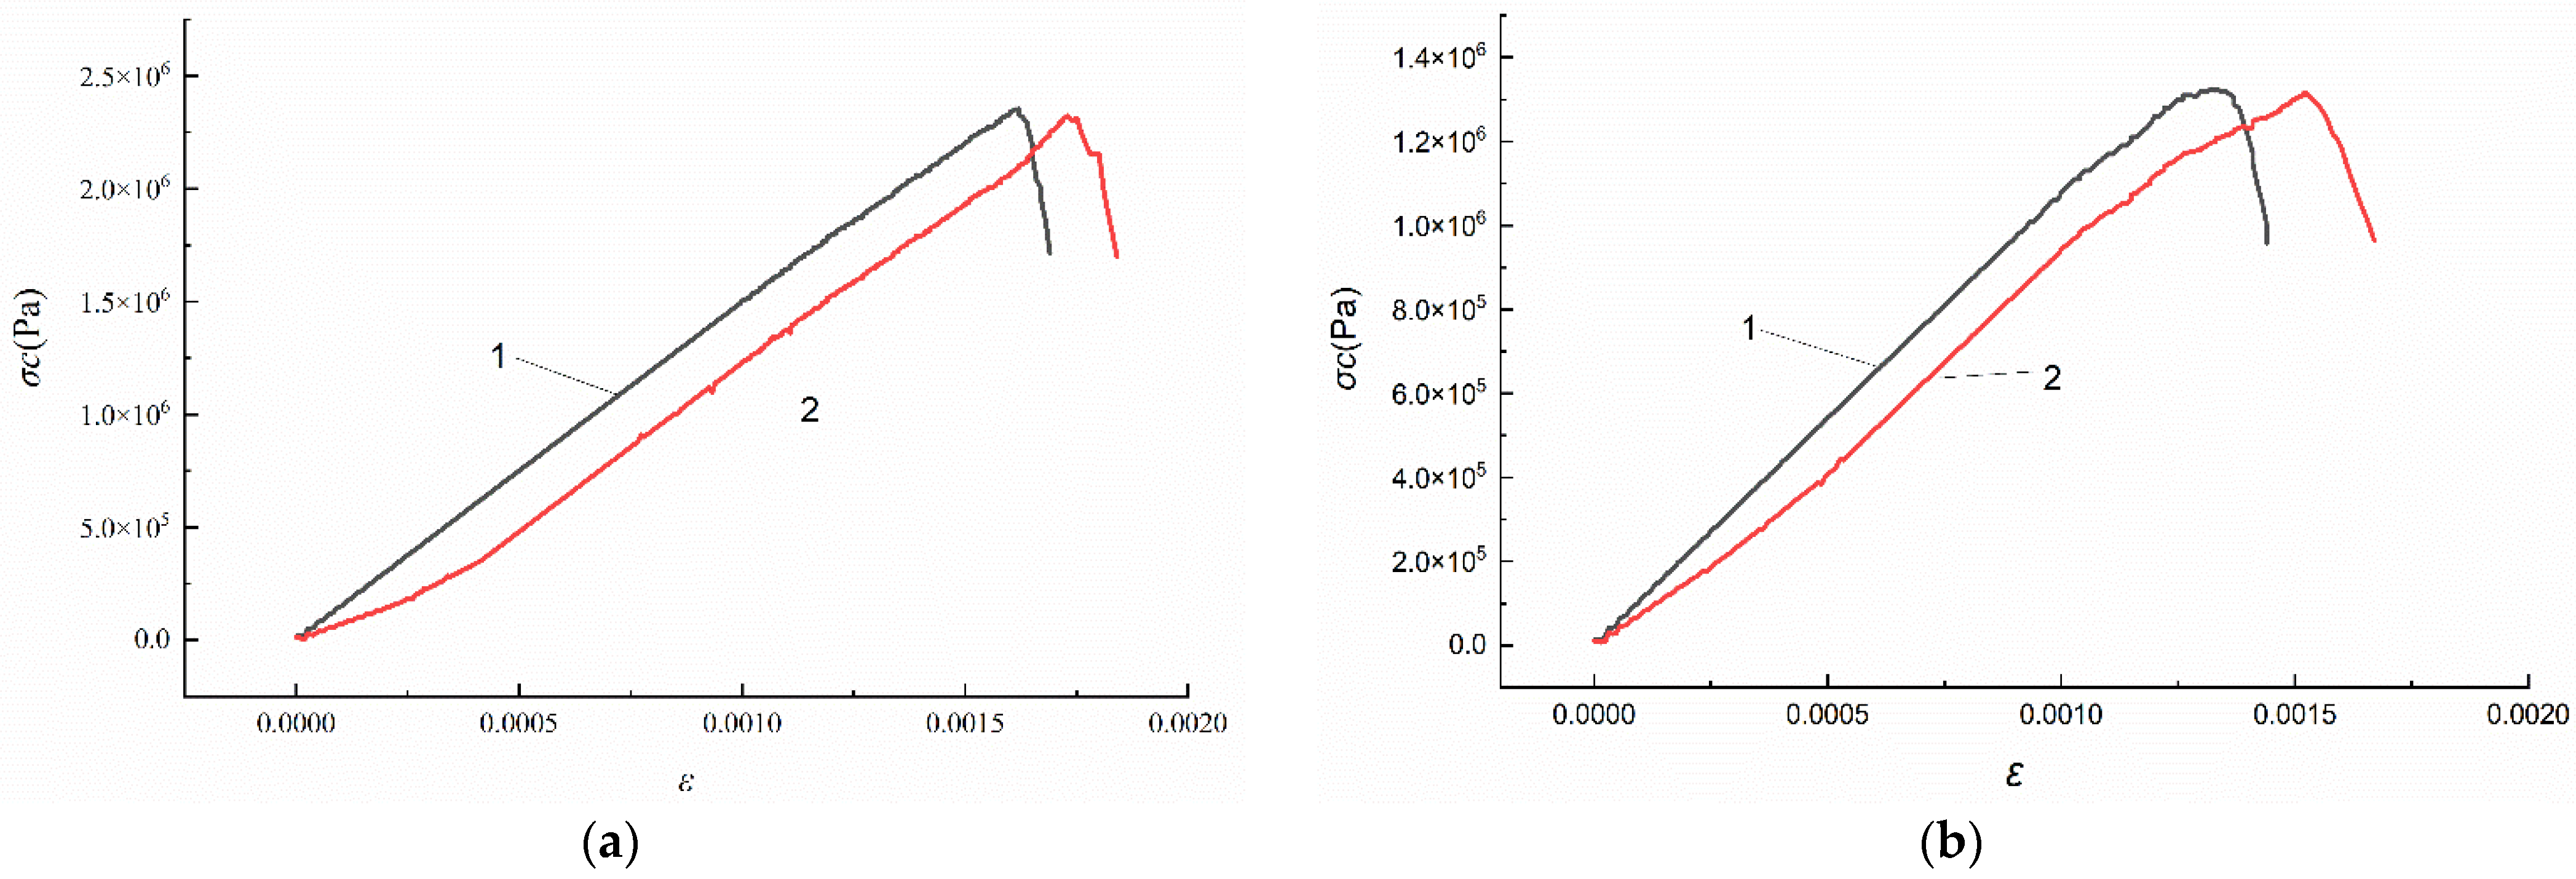
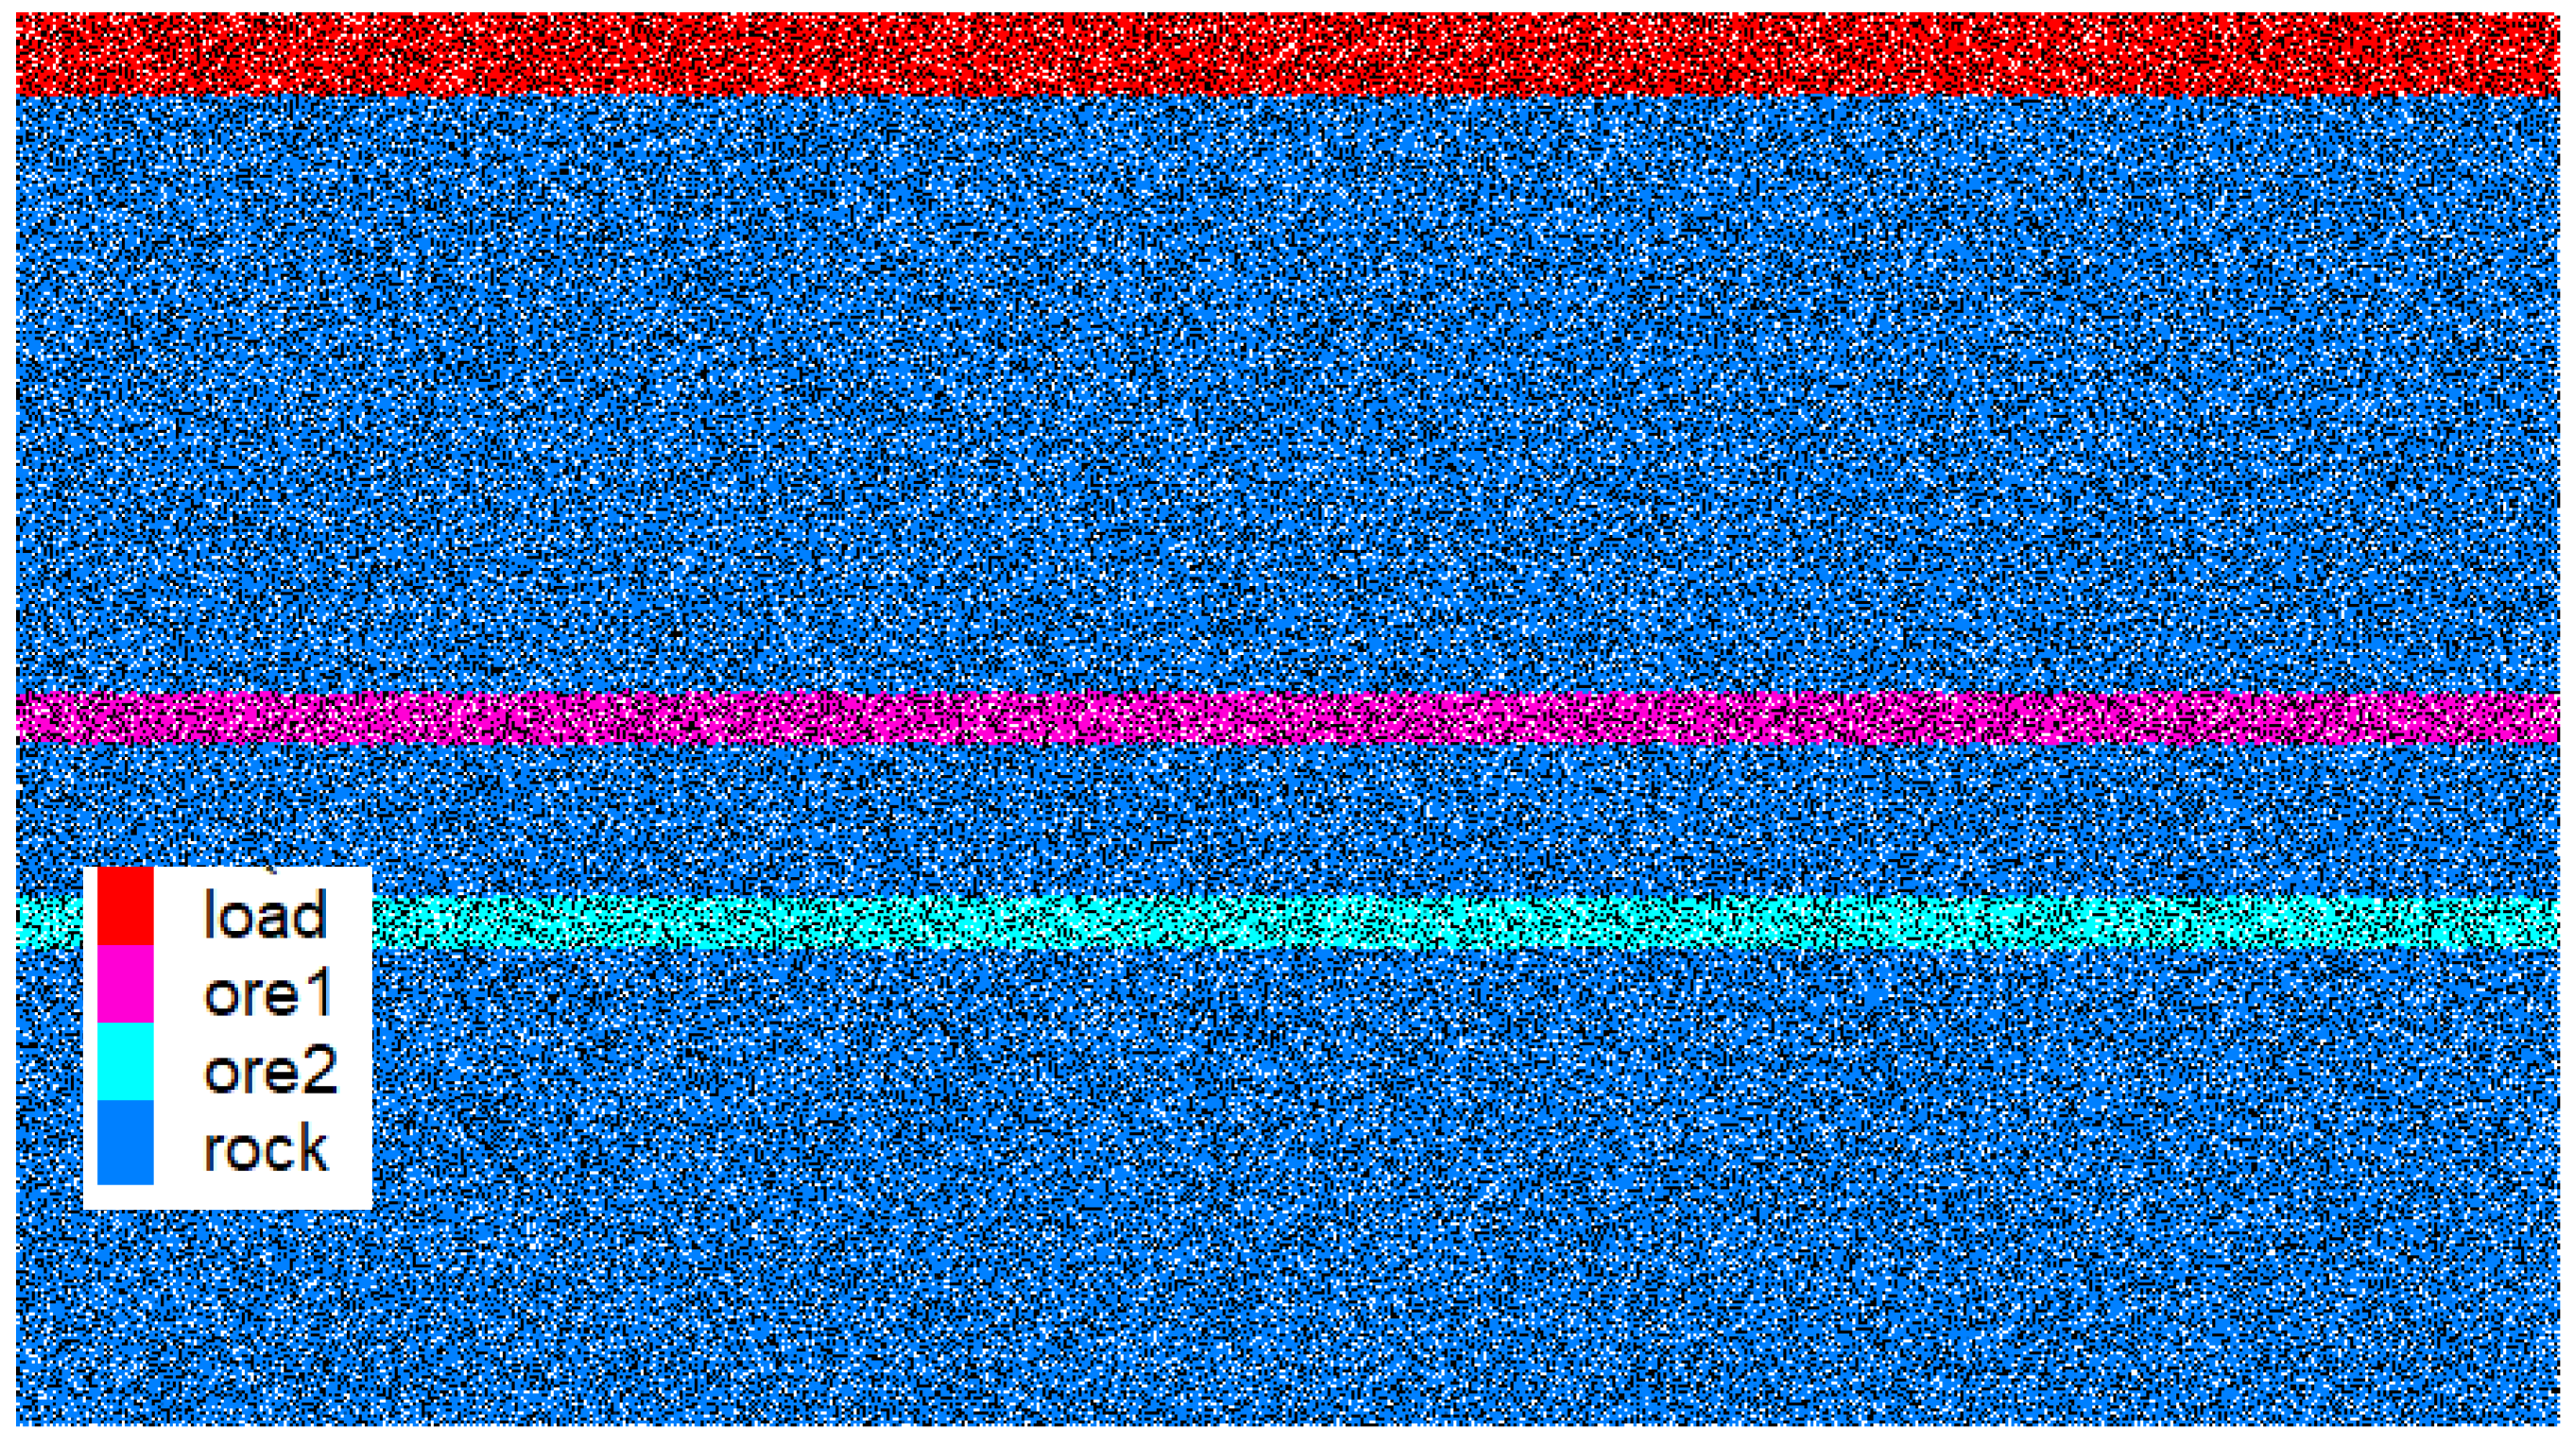
3.1. Calibration of the Microscopic Parameters

PFC is widely used to simulate fracture propagation in geotechnical engineering, and can reflect the support effect of the goaf by the number and degree of fracture generation. So PFC2D is chosen to carry out the numerical simulation research on bolt-filling support. However, the calibration of the microscopic parameters of particles has been a difficulty in using particle flow discrete element software, especially for vanadium shale ore. So, it is necessary to conduct research on calibrating the microscopic parameters of particles before simulating the support for the multilayer goaf in PFC. Thus, a large number of orthogonal uniaxial compressive and tensile tests have been carried out. Based on our studies [45], multiple linear regression analysis has been performed with the friction coefficient(μ), effective modulus of contact( E c ), stiffness ratio( k n / k s ) of the particles and the tensile strength( σ n ), cohesion(c) of the parallel bond as independent variables influencing rock’s macroscopic mechanical properties. The study shows that the Poisson’s ratio ν is linearly correlated with k n / k s and μ (Figure 2), and the elastic modulus E is linearly correlated with E c , μ2, and ln ( k n / k s ) (Figure 3). In addition, the uniaxial compressive strength( σ c ) and tensile strength( σ t ) also have a strong correlation with σ n , c, μ (Figure 4 and Figure 5). Finally, the equations for the Poisson’s ratio (Equation (1)), elastic modulus (Equation (2)), uniaxial compressive strength (Equation (3)), and tensile strength (Equation (4)) of the rock are fitted.
ν = 0.124 k n / k s 0.071 μ 0.006 μ k n / k s + 0.052 ,   R 2 = 0.882
E = 2.085 0.307 ln ( k n / k s ) + 0.199 μ 2 0.184 μ 2 ln ( k n / k s ) E c ,   ( R 2 = 0.964 )
σ c = 2.622 σ n 2.502 c + 80.475 μ + 0.147 σ n c 0.398 σ n μ + 0.792 c μ 0.069 σ n c μ + 90.409 ,   ( R 2 = 0.970 )
σ t 1 = 0.717 c   σ t 2 = 0.509 σ n σ t = Min   ( σ t 1 , σ t 2 )
Based on the microscopic parameters above, simulation of a real-scale mining model using PFC2D requires to generate a huge number of particles, which is far beyond an ordinary computer’s ability. The number of particles can be effectively reduced by increasing the particle radius, but it will result in inaccurate mechanical parameters of models. Therefore, a 1:50 plane similarity model based on PFC2D is established to reduce the overall size of the model. The similarity ratio of strength is 62.25 and the bulk density similarity ratio is 1.245 according to the similarity theory, thus the mechanical parameters of the materials for numerical simulation are obtained, as shown in Table 1.
Based on the above calibration method, numerical uniaxial compressive experiments are carried out with the calibrated microscopic parameters (shown in Table 2). At the same time, laboratory uniaxial compressive experiments are conducted on multiple sets of standard cylindrical specimens of surrounding rock and ore made in the similarity experiment by using the TAW-2000 high-temperature and high-pressure rock compression test platform with a loading rate of 0.02 mm/min (shown in Figure 6). Figure 7 shows the stress–strain curves of the surrounding rock and ore obtained in the PFC2D and laboratory tests, which are basically identical.

3.2. Fracture Expansion of Surrounding Rock and Distribution Law of Force Chain

After all the parameters are calibrated, the PFC2D numerical model can be established based on the occurrence conditions of the multilayer vanadium shale in Mount Shangheng. As shown in Figure 8, ore1 and ore2 are the upper and lower ore body, respectively, and both 3 m thick, with an 9 m-thick interlayer. The top layer is the load layer, and the remaining blue layer is surrounding rock. Three stopes are mined in each ore body with a typical stope width of 20 m and pillar width of 5 m. The simulation is divided into four scenarios as follows.

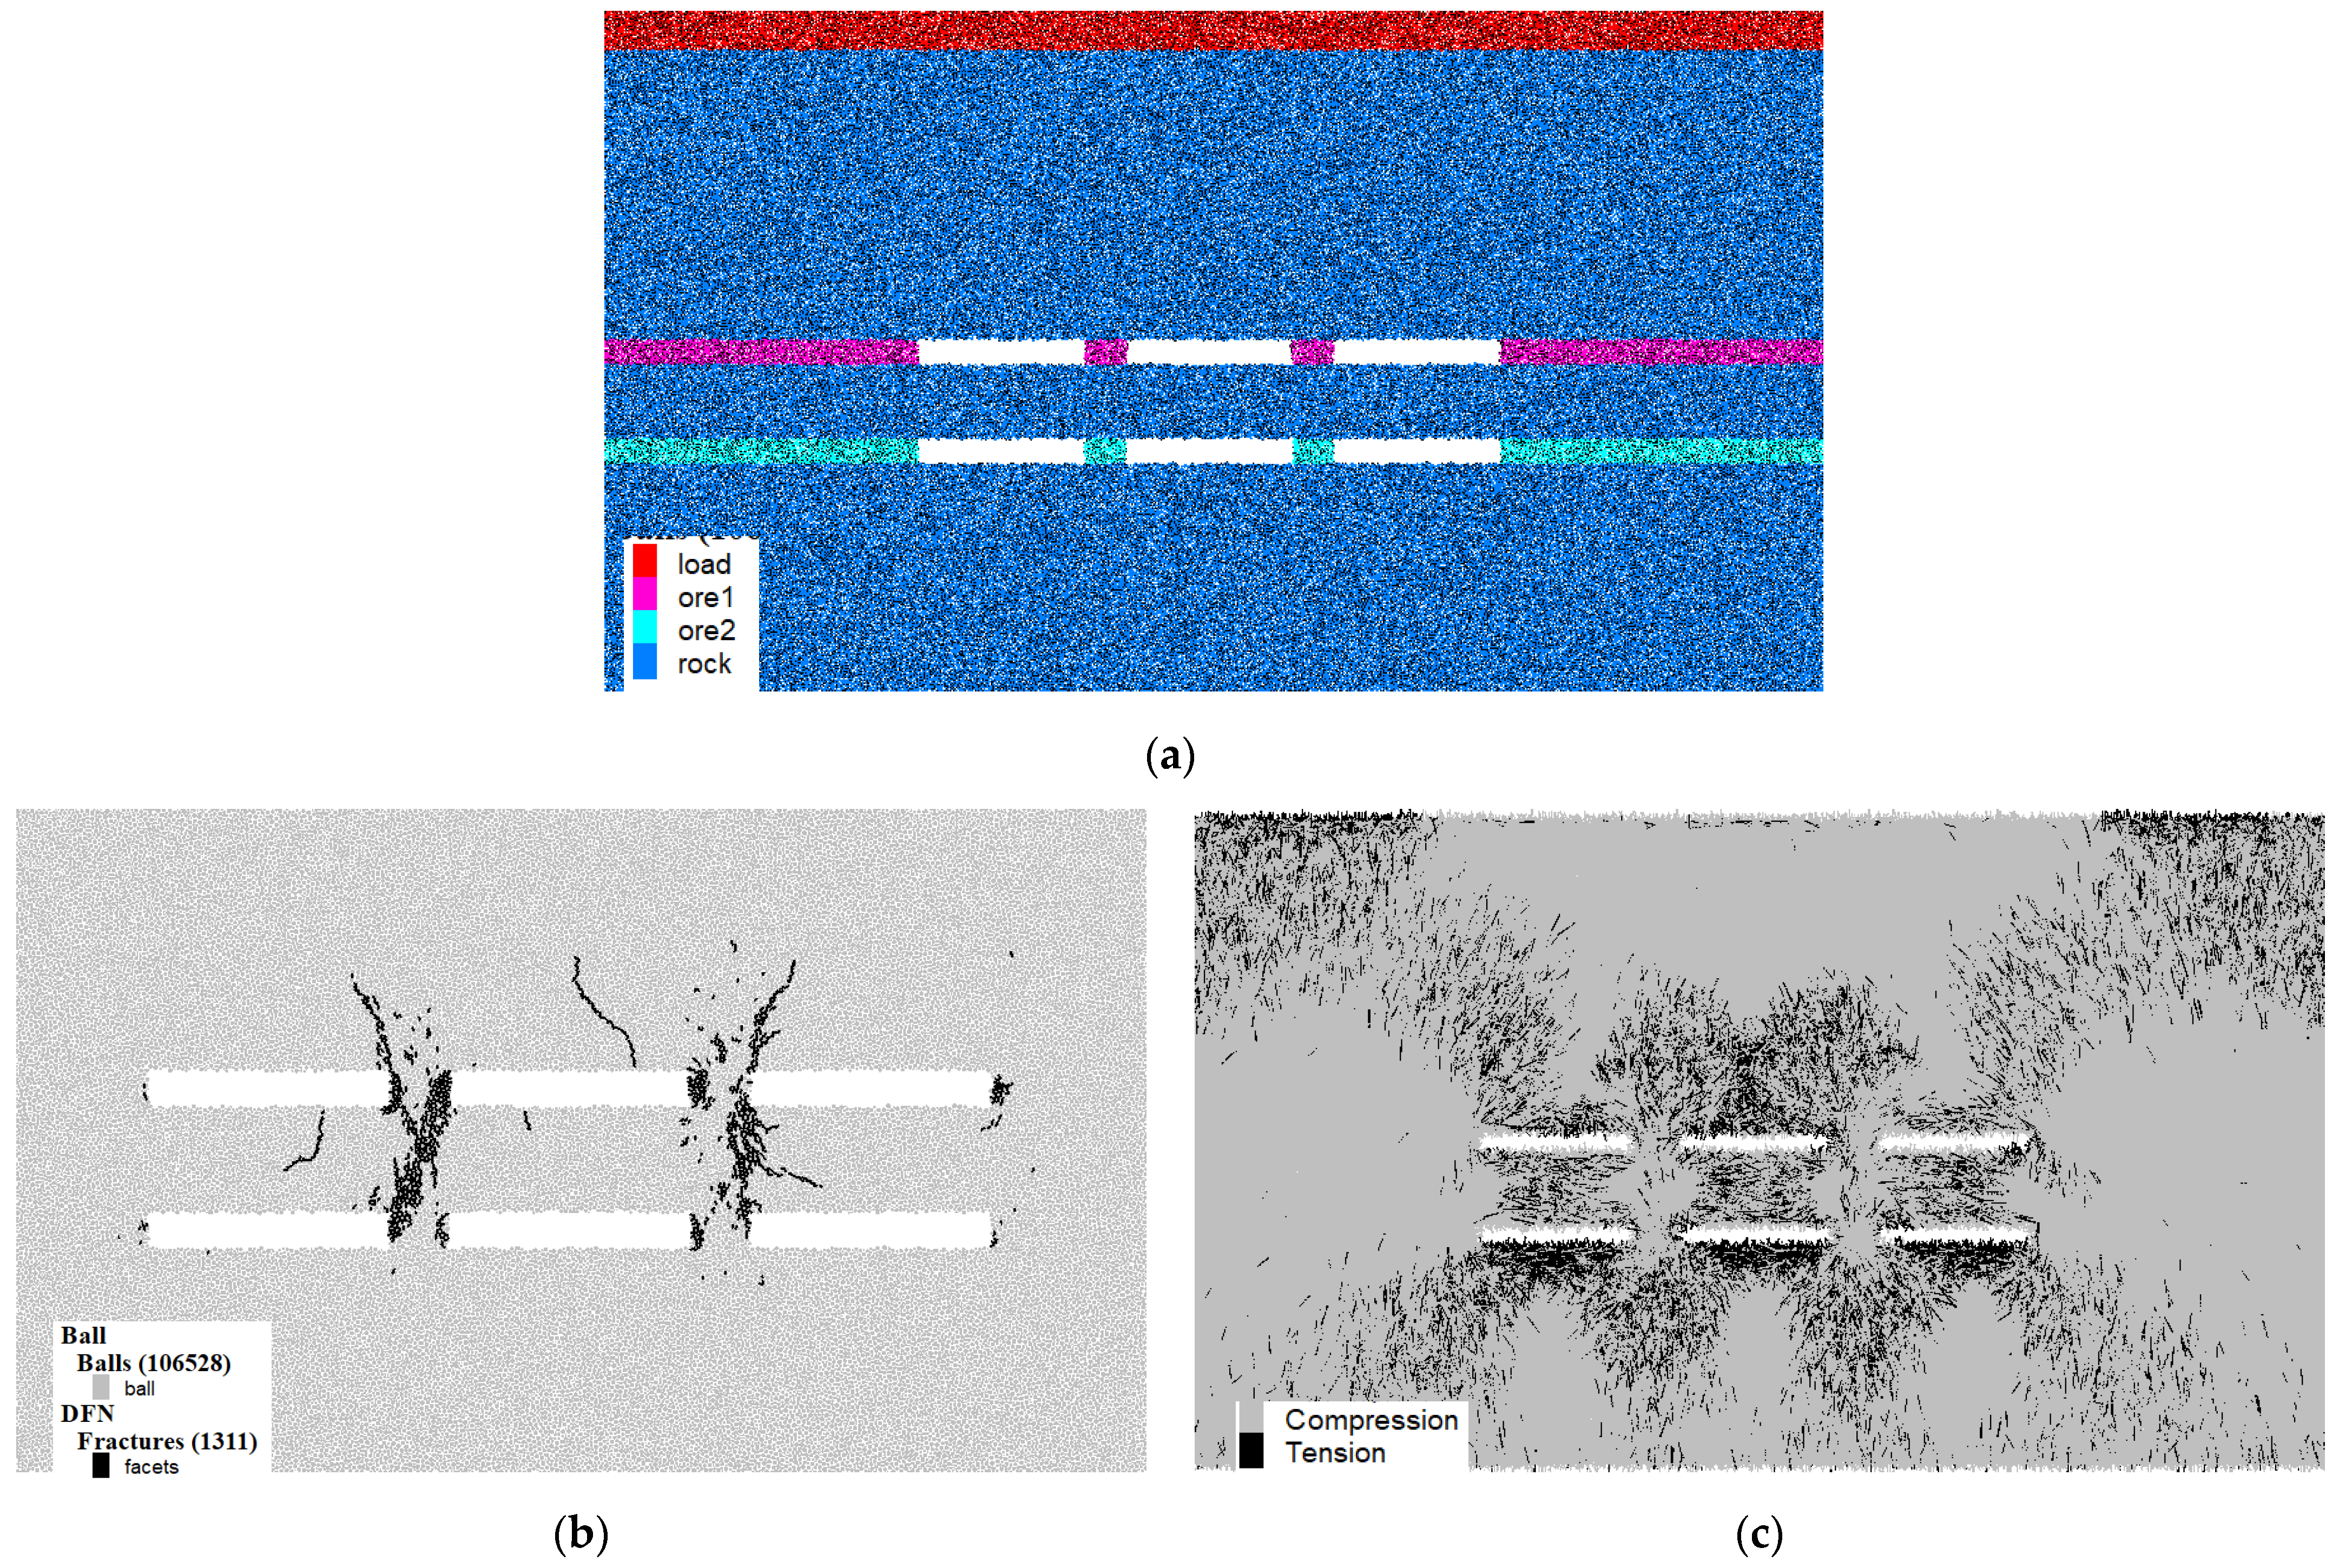
3.2.1. Upper Goaf Not Supported

For the first scenario, the lower orebody is directly mined after mining the upper orebody without any support measures (shown in Figure 9a). As shown in Figure 9b, if no support is made to the upper goaf, the pillars and the roof of the goaf are severely damaged after mining the lower ore body. The number of fractures reaches 1311, among which the roof fracture extension is more than 10 m, and the fractures of the pillars in the two layers of goaf are diagonally connected. In addition, the tensile force chains both in the overall surrounding rock and the interlayer are cross-distributed, most of which concentrated in the roof of the upper goaf and the floor of the lower goaf (shown in Figure 9c).

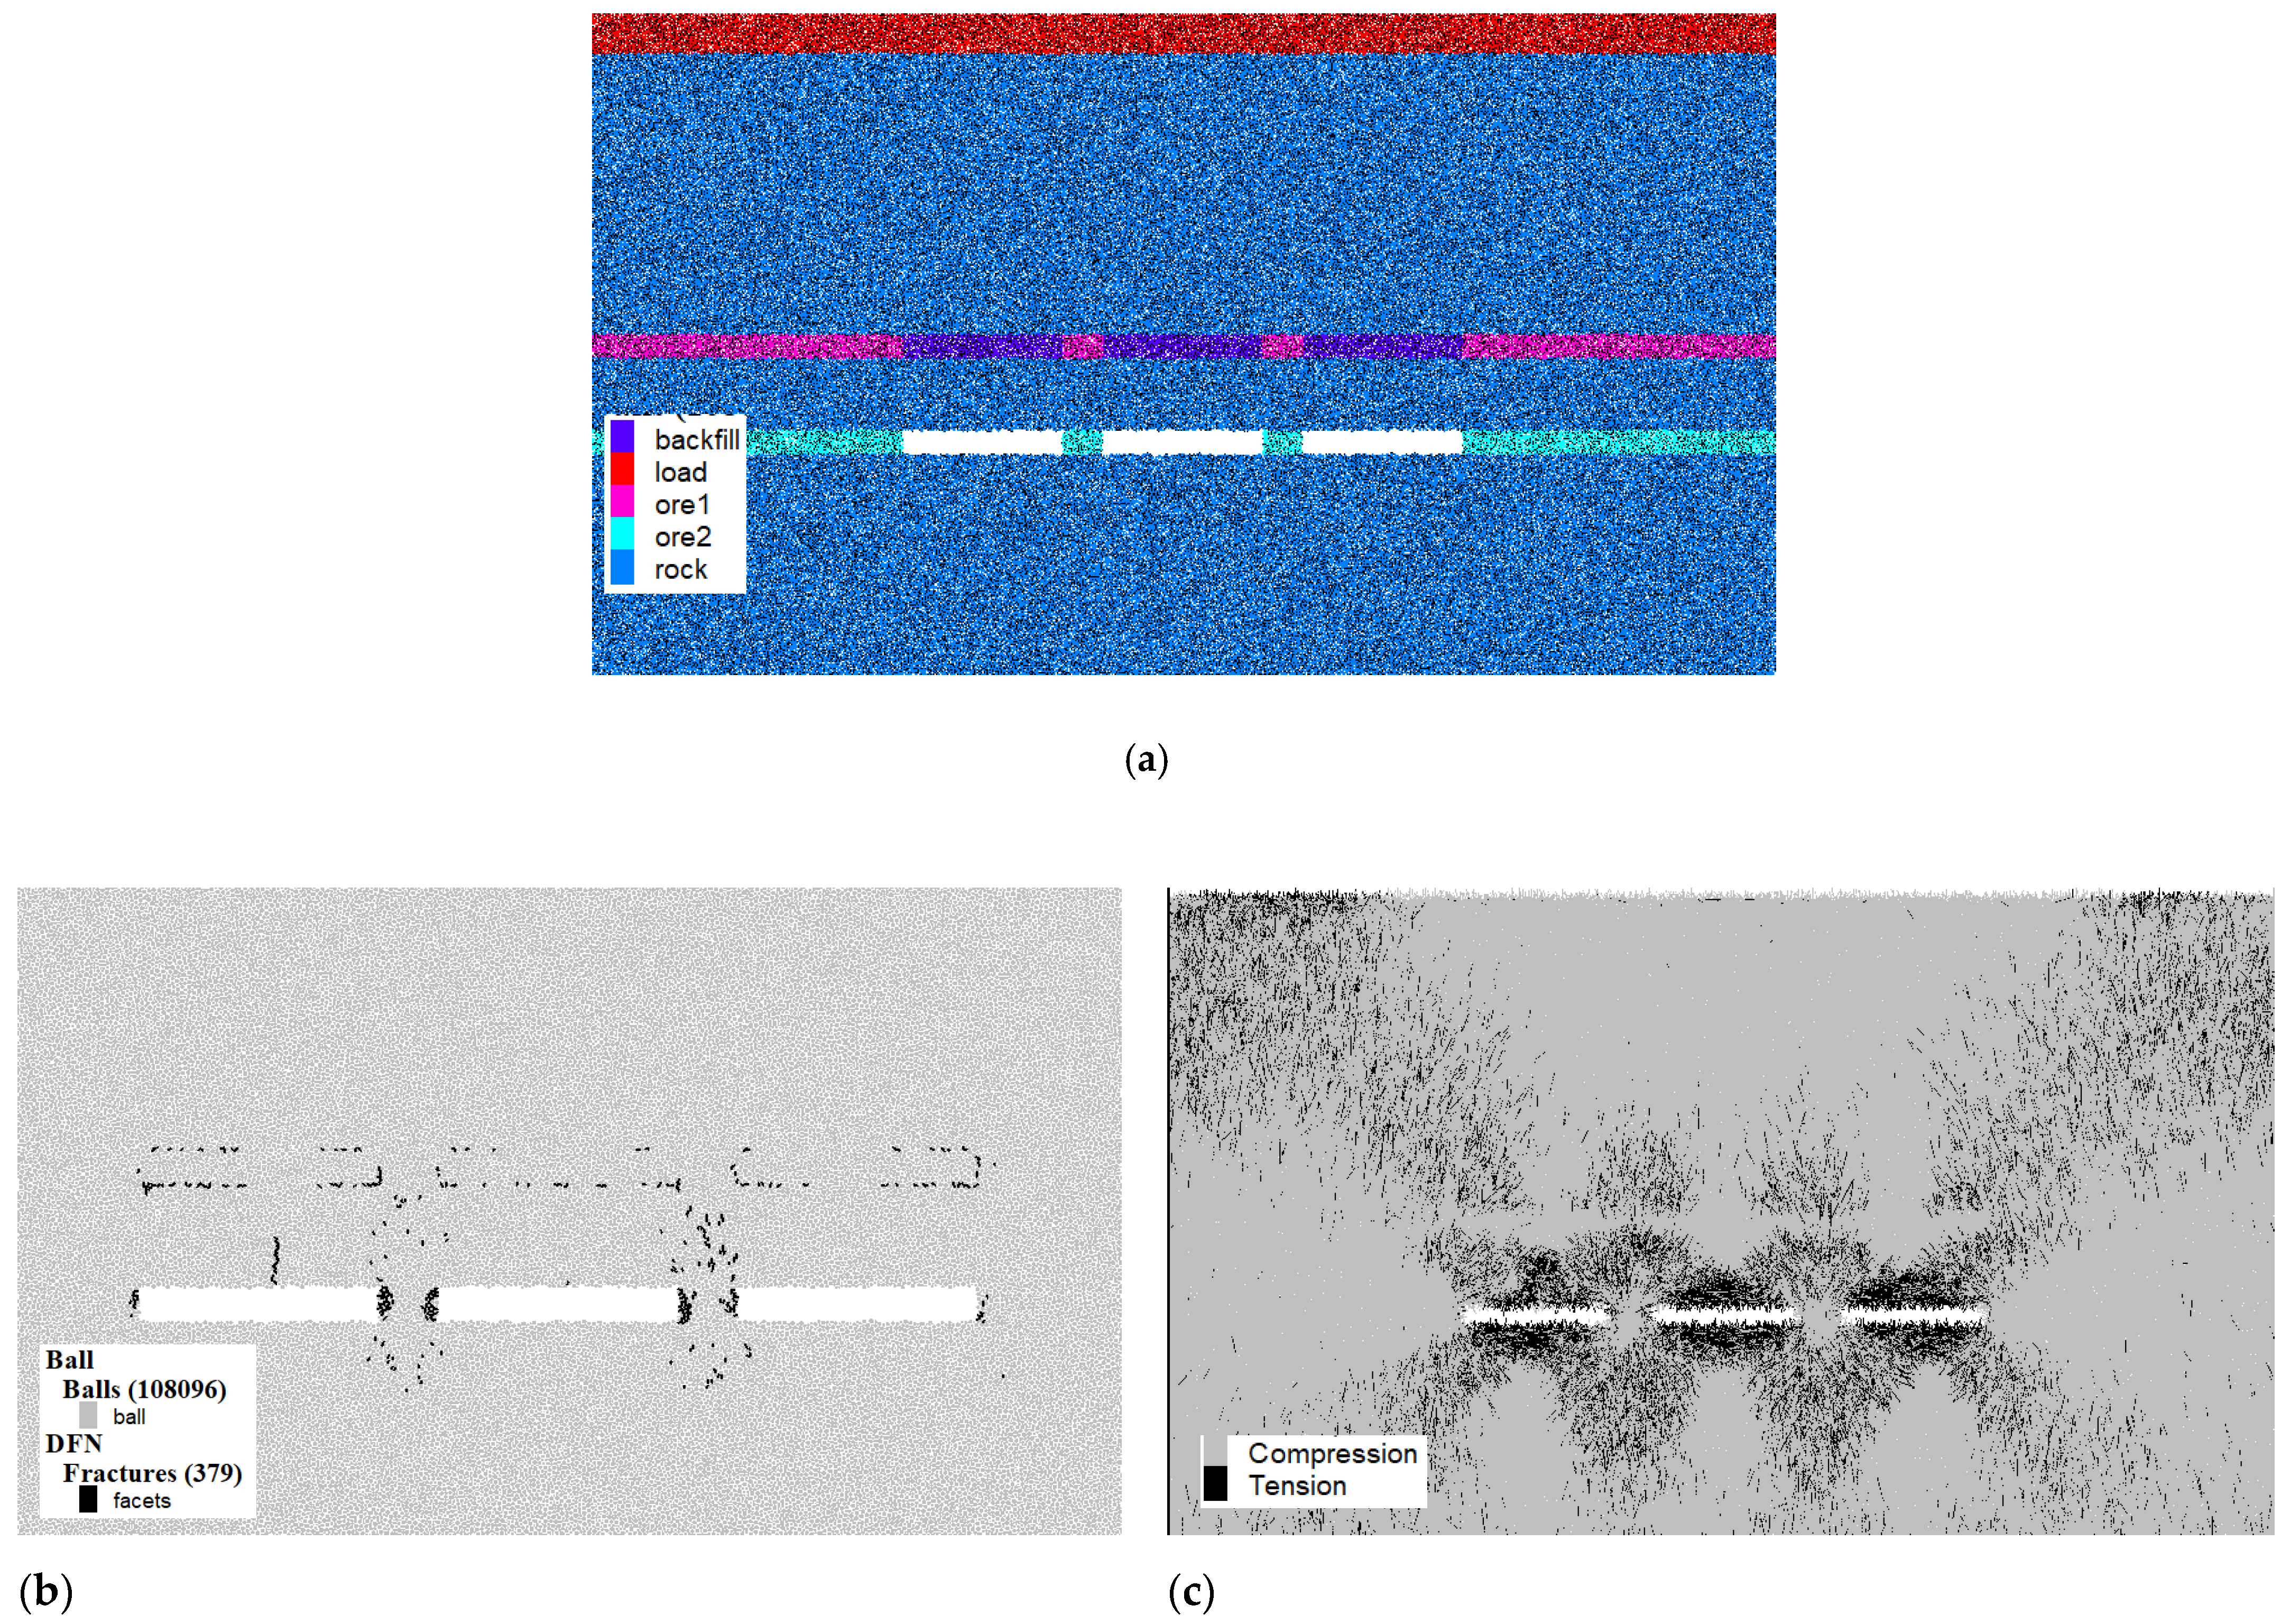
3.2.2. Upper Goaf 100% Filled

For the second scenario, backfilling is adopted with a filling rate of 100% after mining the upper ore body, and then the lower ore body is mined (shown in Figure 10a). As shown in Figure 10b, if the upper goaf is 100% filled before mining the lower ore body, the number of fractures is significantly reduced to 379, concentrating only on the edges of the upper goaf and the pillars of the lower goaf. Since the backfill improves the stress state of the upper goaf, the tensile force chains of the roof of the upper goaf are likewise significantly reduced, which ensures the stability of the roof of the upper goaf, as shown in Figure 10c. However, the weight of the backfill becomes an additional load on the roof of the lower goaf (interlayer), resulting in a significant increase in the number of tensile force chains on the roof of the lower goaf (shown in Figure 10b), where appears a long fracture more than 5m. Nevertheless, the filling support of the upper goaf is of great significance for mining a double-layered orebody.

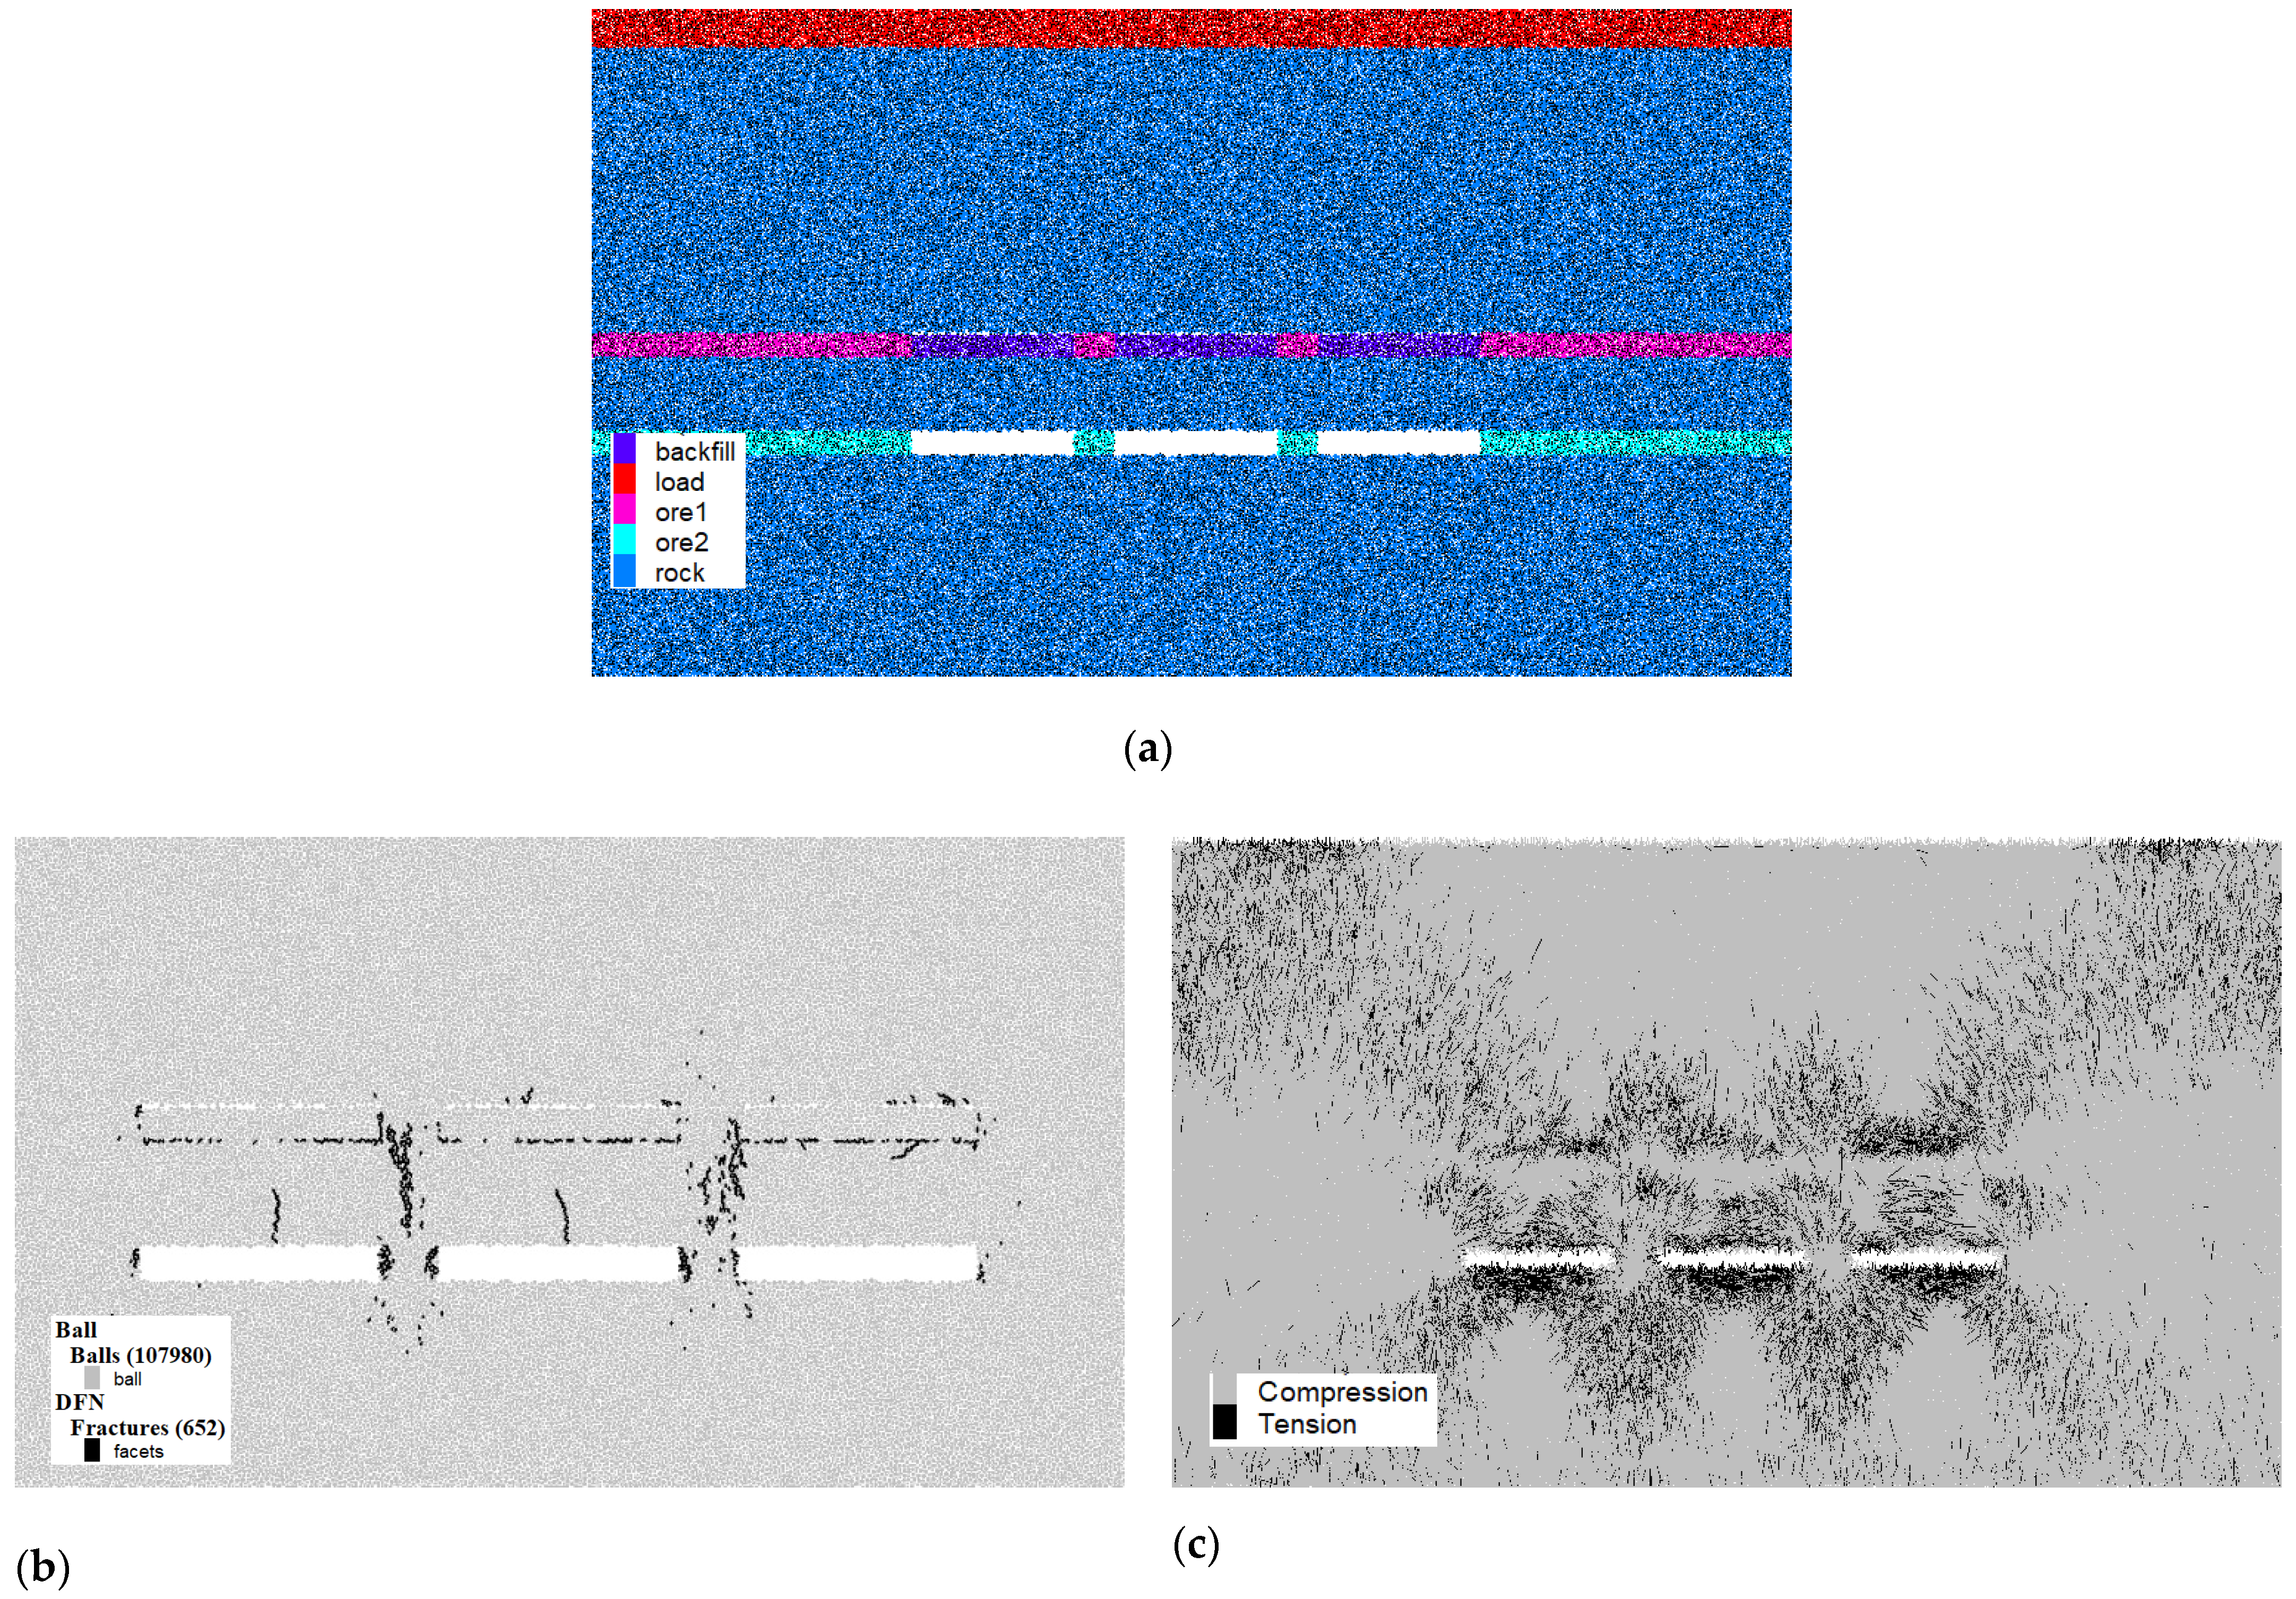
3.2.3. Upper Goaf 95% Filled

In actual production, 100% filling rate cannot be achieved due to the limitation of the filling transportation system and factors such as leakage and infiltration after filling. Incomplete filling will limit the effect of the backfill on the roof of the upper goaf. For the third scenario, backfilling is adopted with a filling rate of 95% after mining the upper ore body, and then the lower ore body is mined (shown in Figure 11a). As shown in Figure 11b, when the filling rate is 95%, 652 fractures are produced, and the fractures penetrate the pillars in the vertical direction. The roof of the lower goaf also produces fractures of about 5m. Although the number and development of the fractures under this condition are much better than the case without filling, it is far from the support effect when fully filled. As shown in Figure 11c, compared with the distribution of the force chains when it is completely (100%) filled, there is still a slight concentration of the tensile force chains on the roof of the upper goaf when it is not completely (100%) filled.

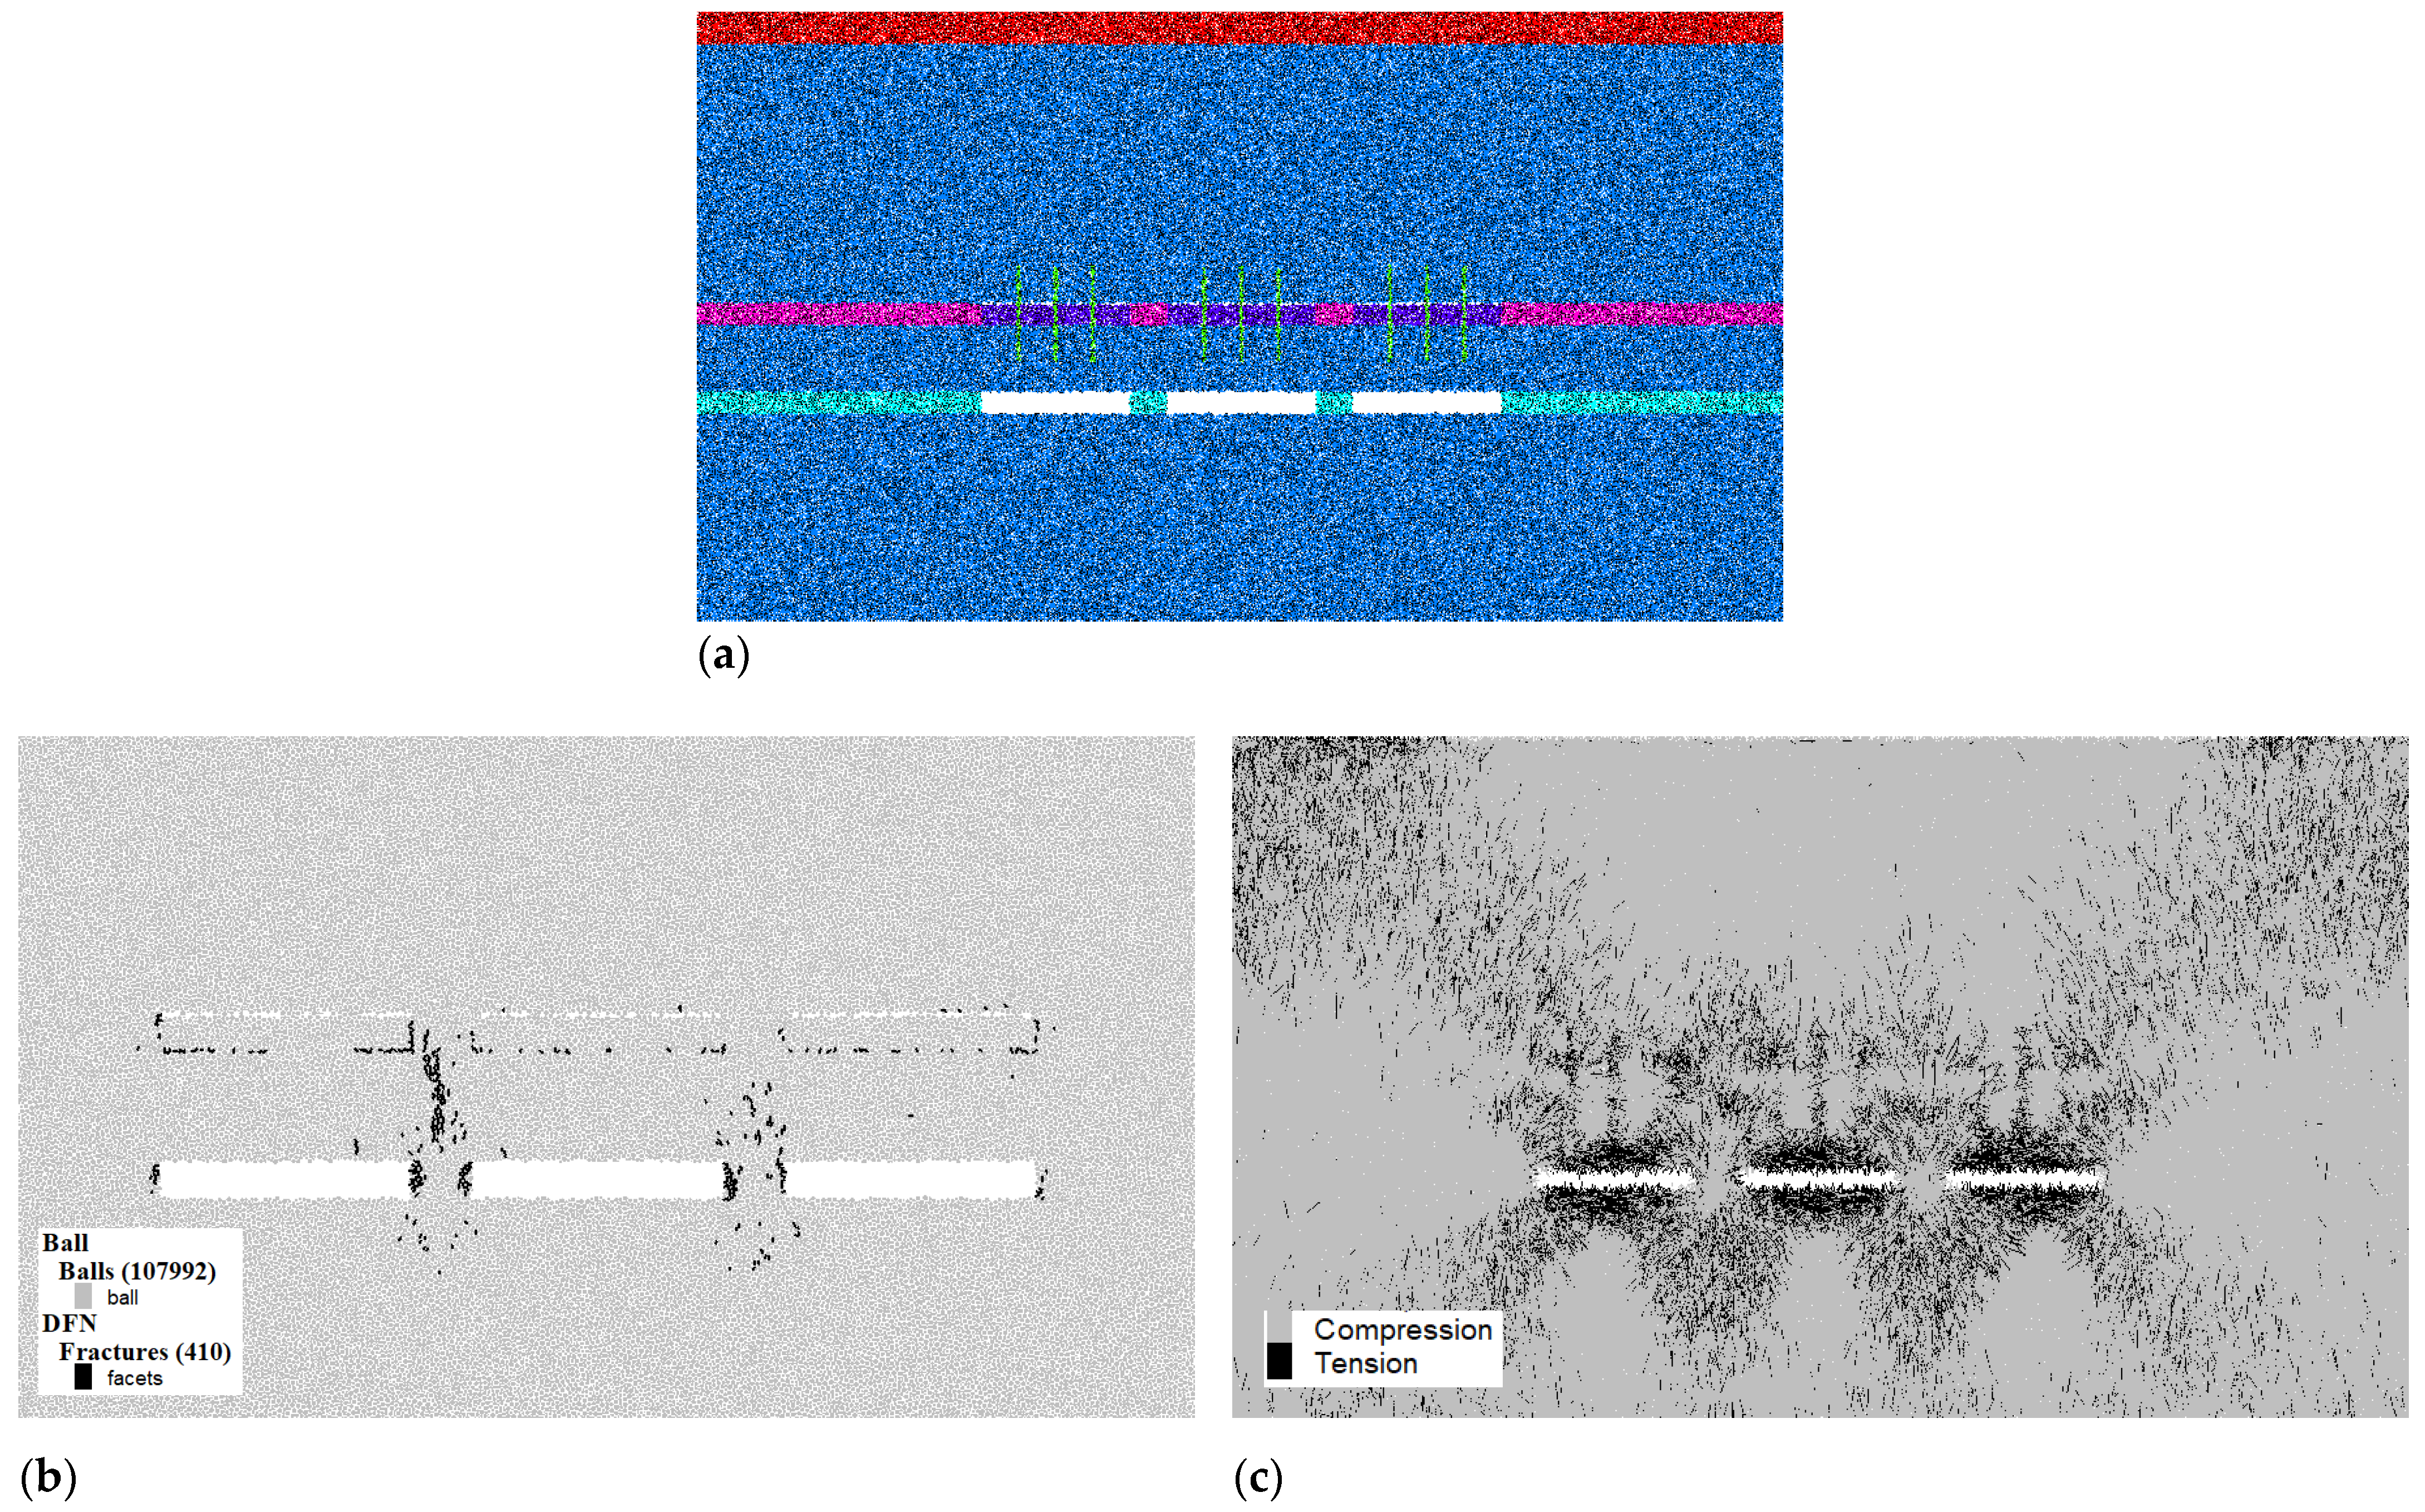
3.2.4. Bolt-Filling Support

1. The fourth scenario goes a step further than the third scenario. After the mining of the upper ore body, the bolt-filling support is used in the case of 95% filling rate, and the spacing between two adjacent bolts is 5m. After the bolt-filling support is completed, the lower ore body is then mined (shown in Figure 12a).
As is shown in Figure 12c, the concentration of the tensile force chains appears at the anchor position, which relieves the force both on the roof of the upper and lower goaf to a certain extent. Correspondingly, the fracture propagation in the roof of the lower goaf is alleviated (Figure 12b). In addition, the number of fractures under the condition of bolt-filling support reaches 410, which is less than that of no support or 95% filling and slightly larger than that of 100% filling.
Comprehensive consideration in Table 3 shows that the bolt-filling support not only reduces the roof load of the lower goaf, but also helps to improve the concentration of tensile stress in the roof of the upper goaf caused by incomplete filling, which is very effective for the support of multilayer ore mining. To verify the performance and effectiveness of the bolt-filling support method, a similarity simulation experiment is necessary to validate the numerical simulation analysis.

4. Similarity Simulation Experiment of Bolt-Filling Support

4.1. Similarity Experiment Design

4.1.1. Similarity Constants

(1)
Geometric Similarity Constant
The range of stress redistribution due to underground mining is about 3~5 times the excavated space, so the similarity analysis range should be at least 3 times larger than the mined space. For mining-type problems, the geometric similarity constant of a qualitative model is usually taken between 100 and 200. The geometric similarity constant of the model is determined to be C l   =   100 by combining the actual geological conditions and the stress distribution state. Moreover, the similarity constants are also 1 for the parameters such as internal friction angle, Poisson’s ratio, and porosity, if their dimensions are 1.
(2)
Bulk Density Similarity Constant
It is found in the production of the trial model that the model density is around 1.6 g/cm3~1.8 g/cm3 when only river sand is used as aggregate. The actual ore density is around 2.5 g/m3, so it is more reasonable to set the specific gravity similarity constant as C ρ   =   1.5 .
(3)
Strength Similarity Constant
The strength similarity constant is calculated according to Equation (5): C σ   =   C ρ   ×   C l   =   1.5   ×   100   =   150
C σ C ρ   ×   C l = 1
(4)
Time Similarity Constant
The time similarity constant is C t   =   C l   =   10

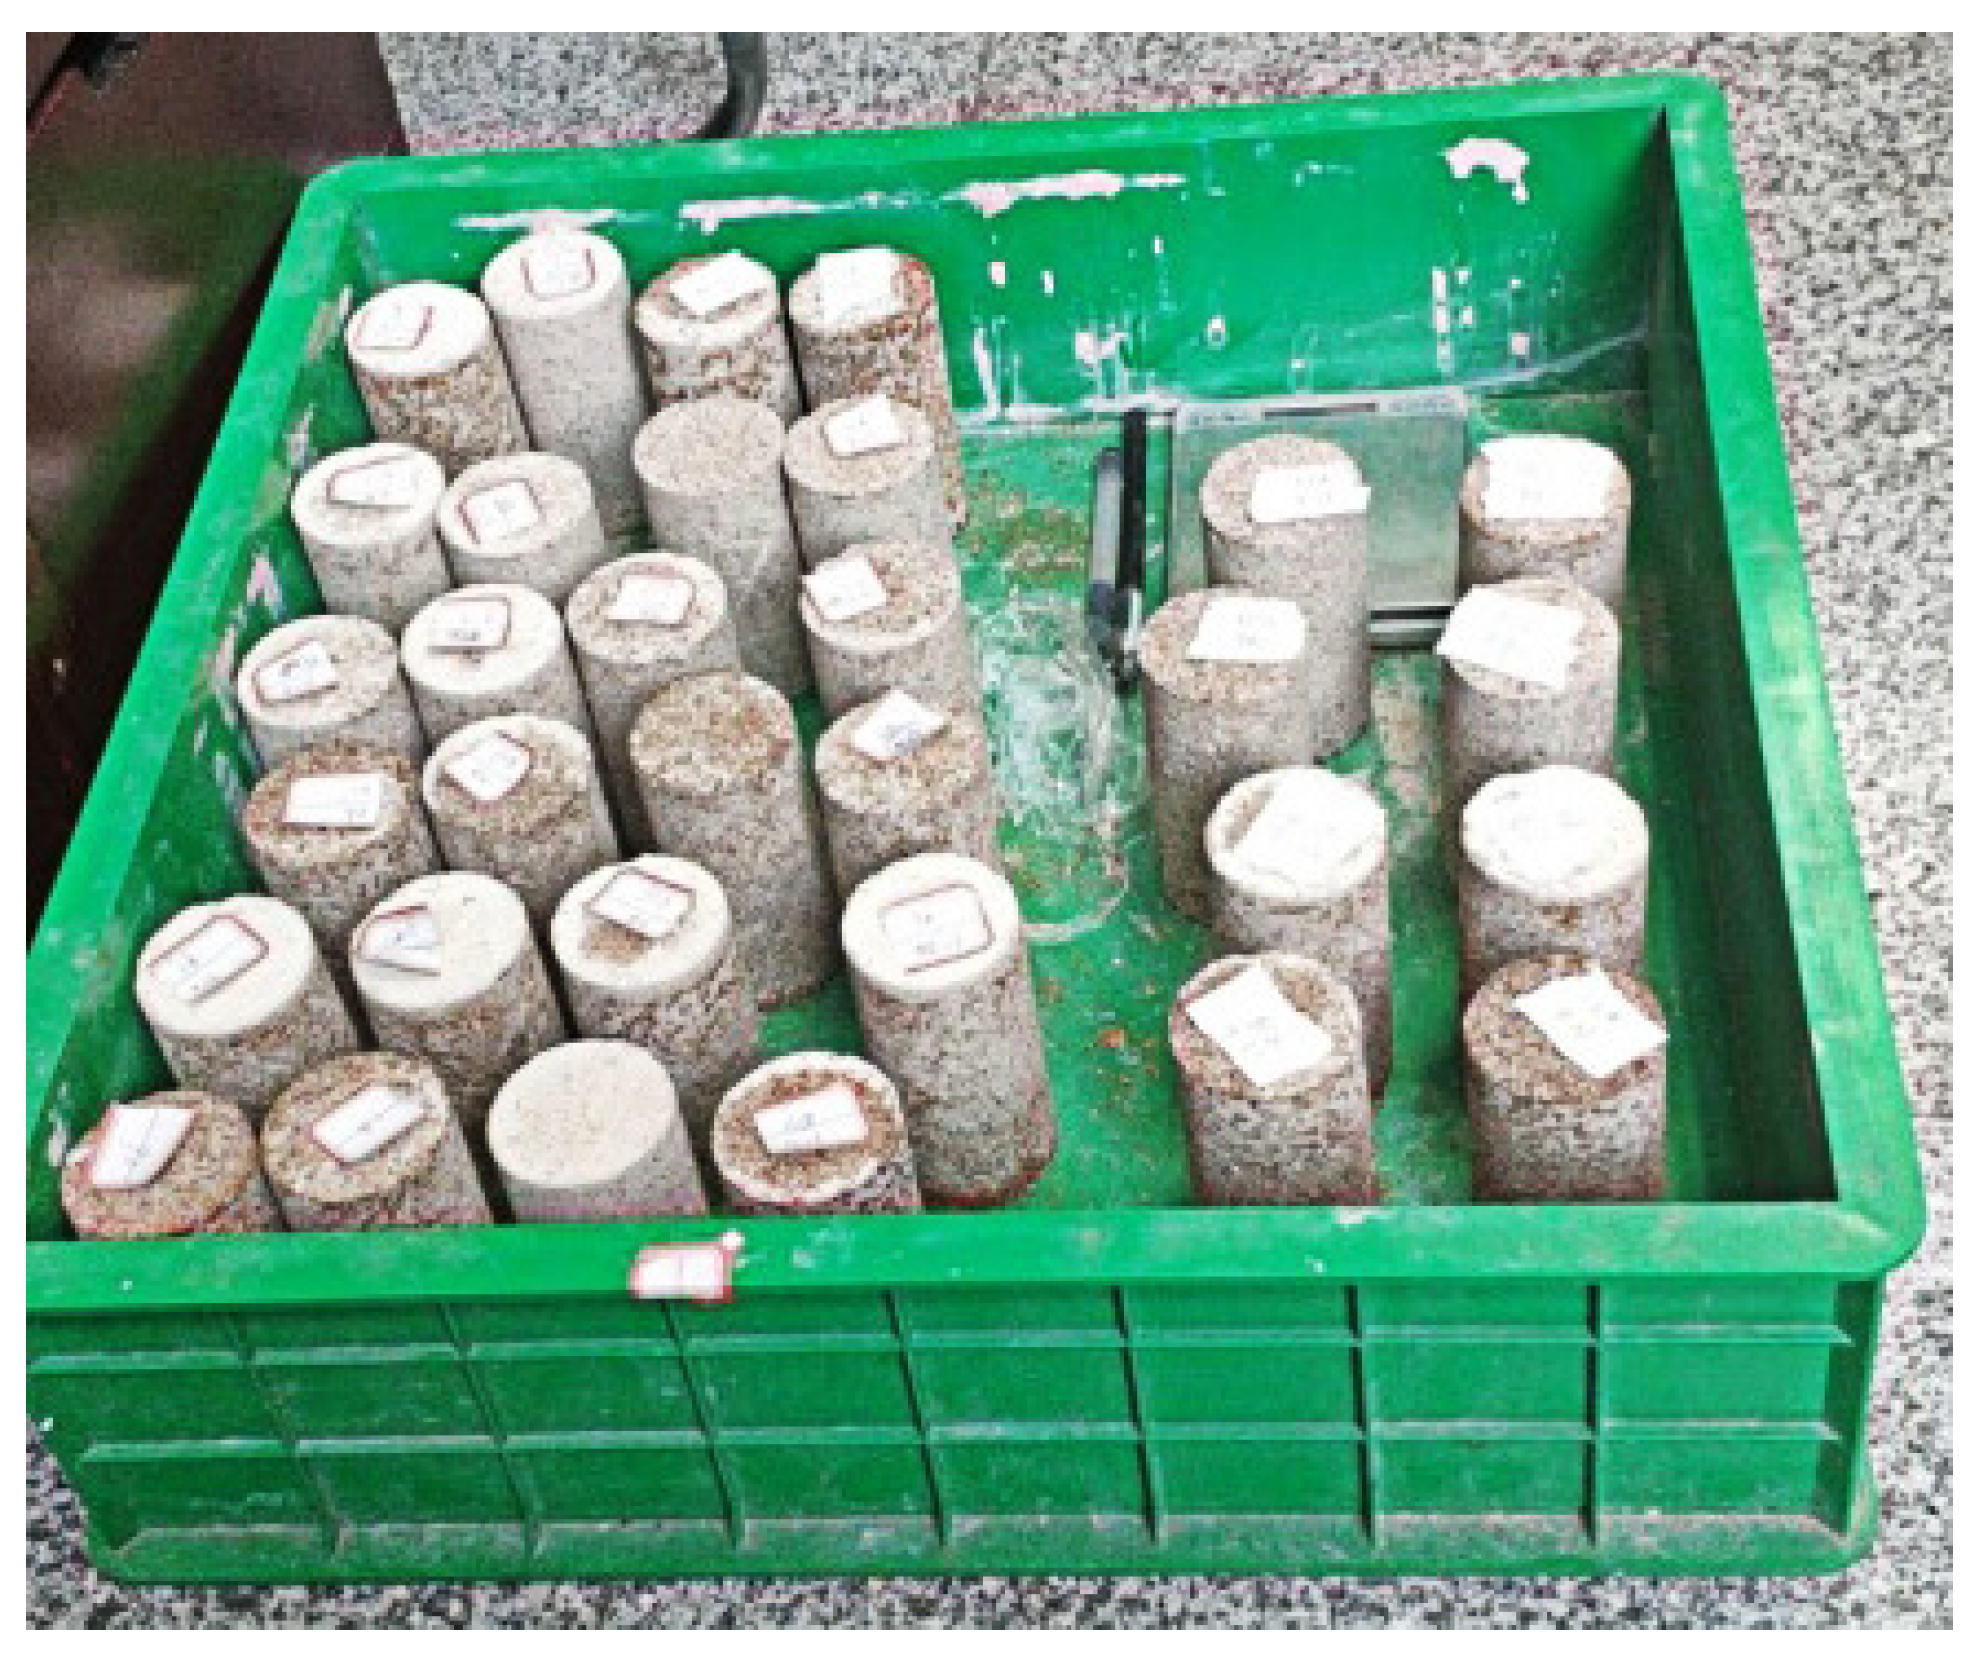
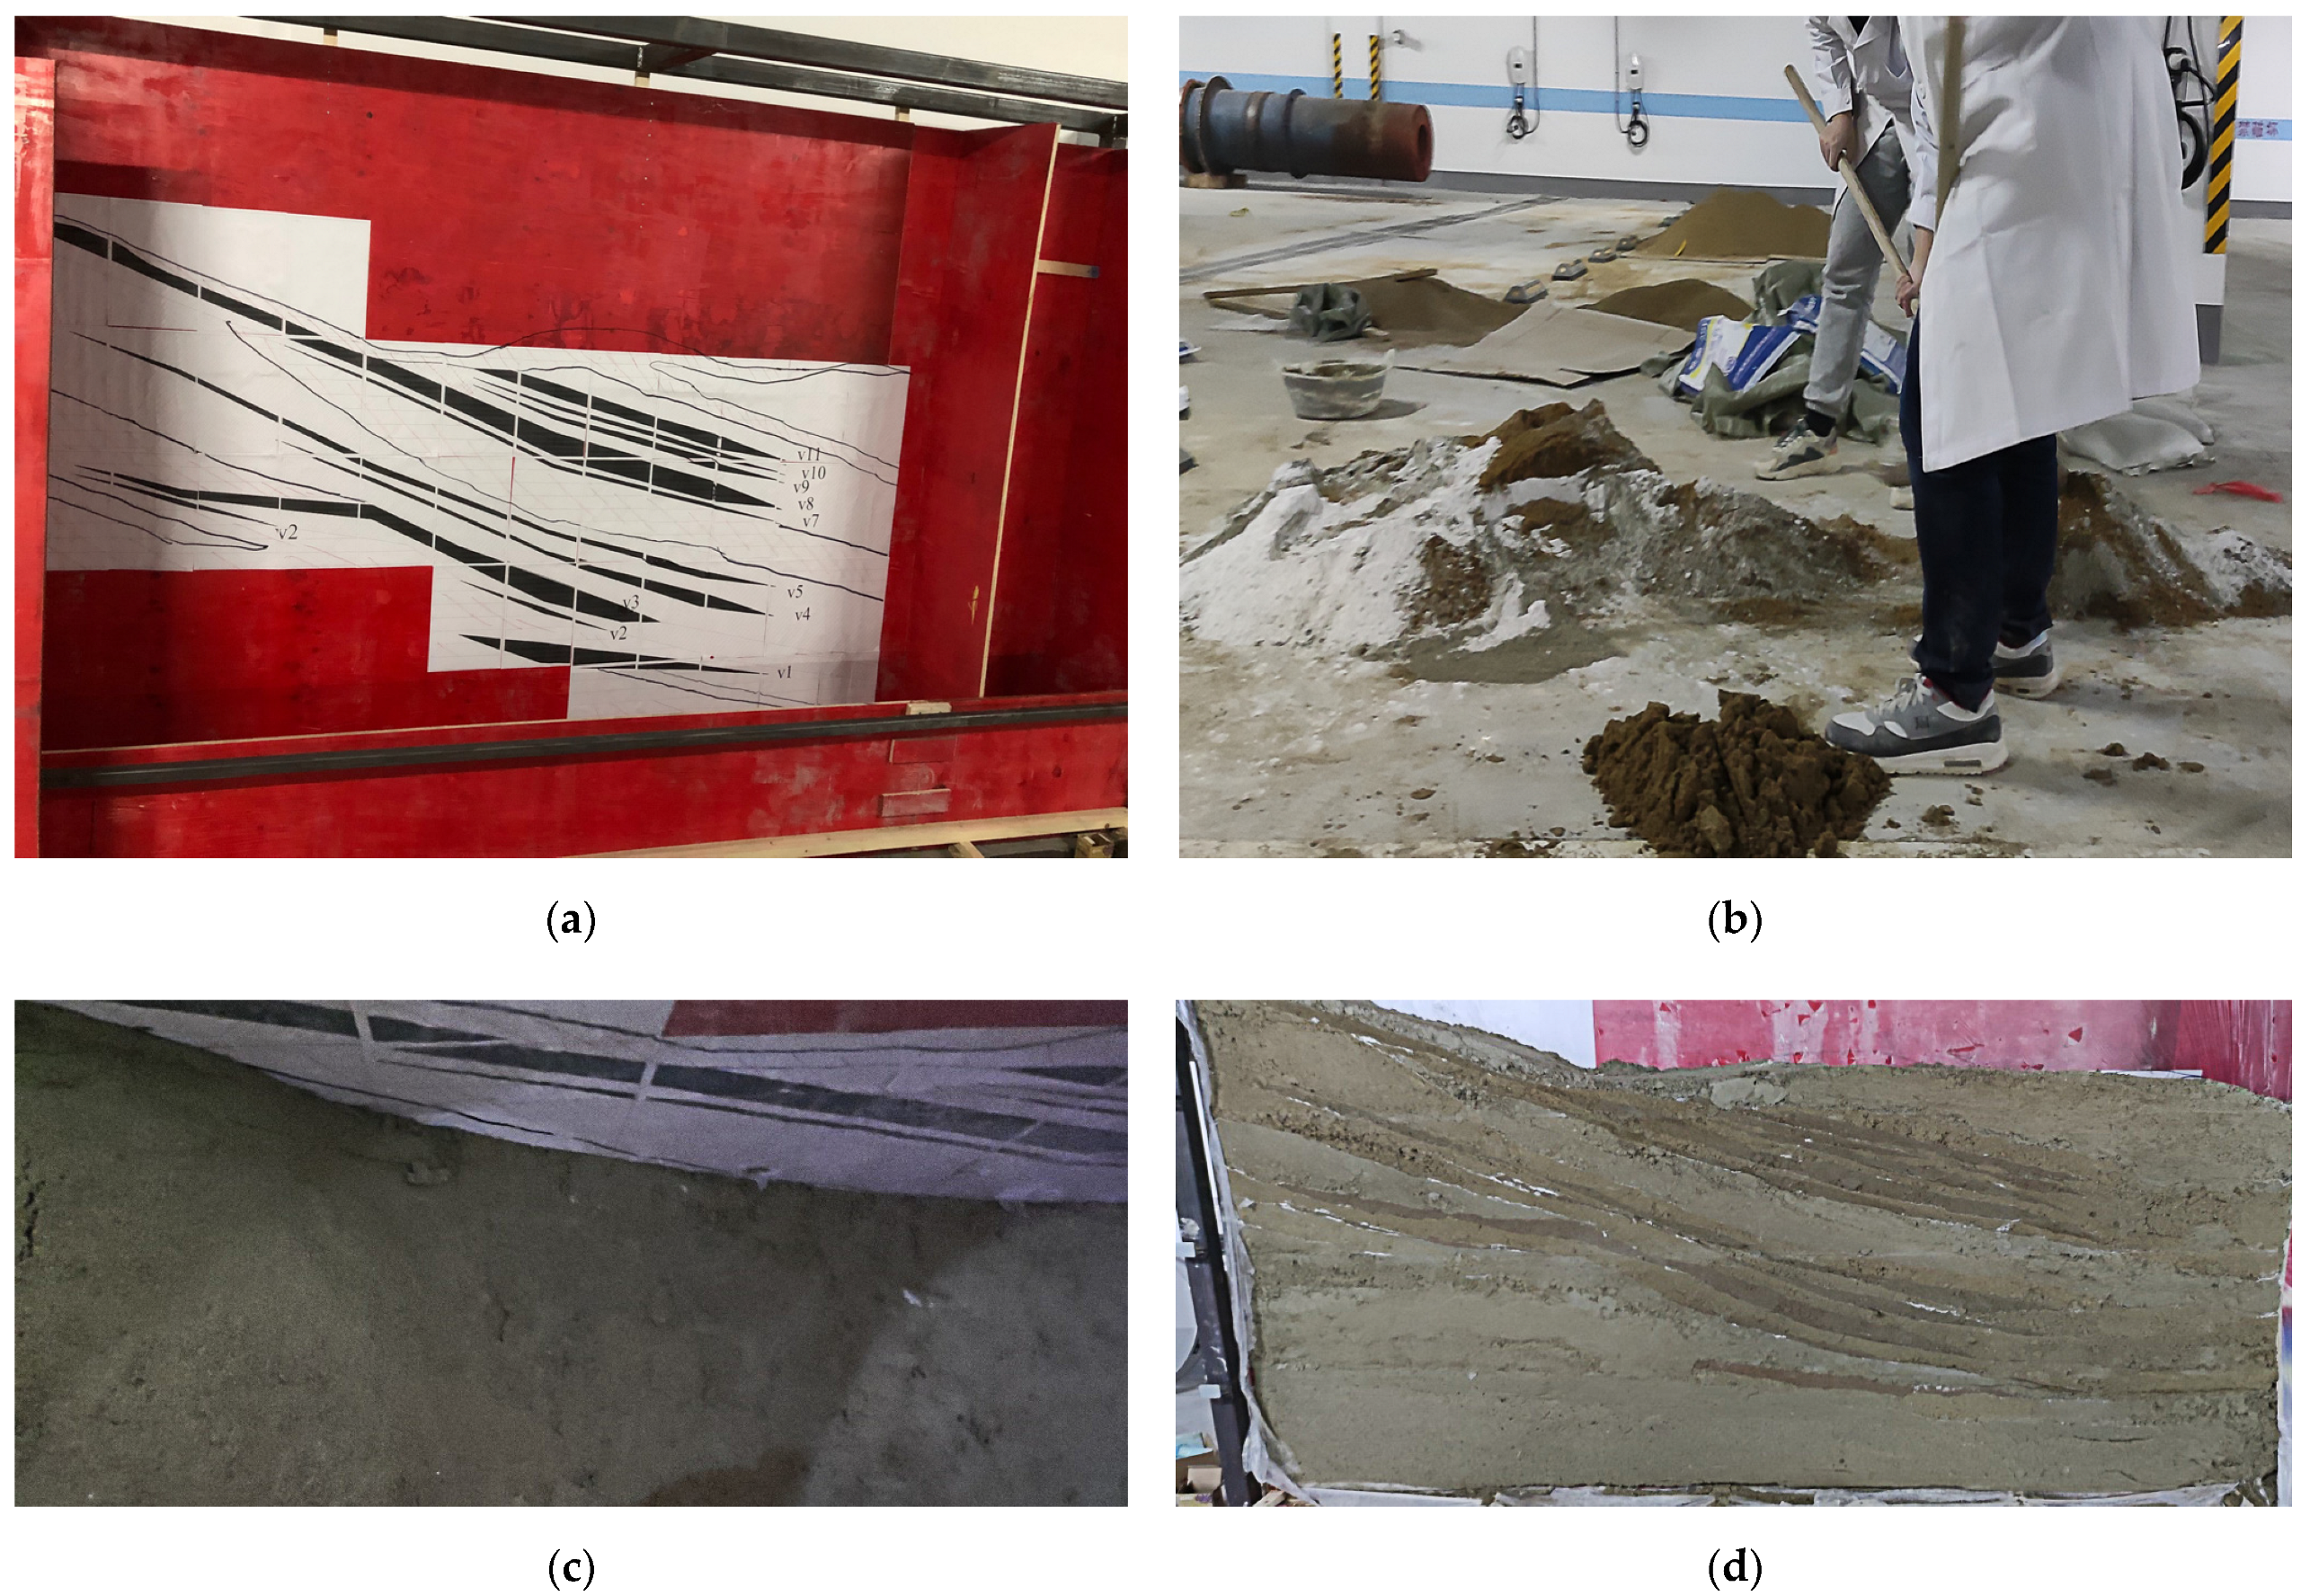
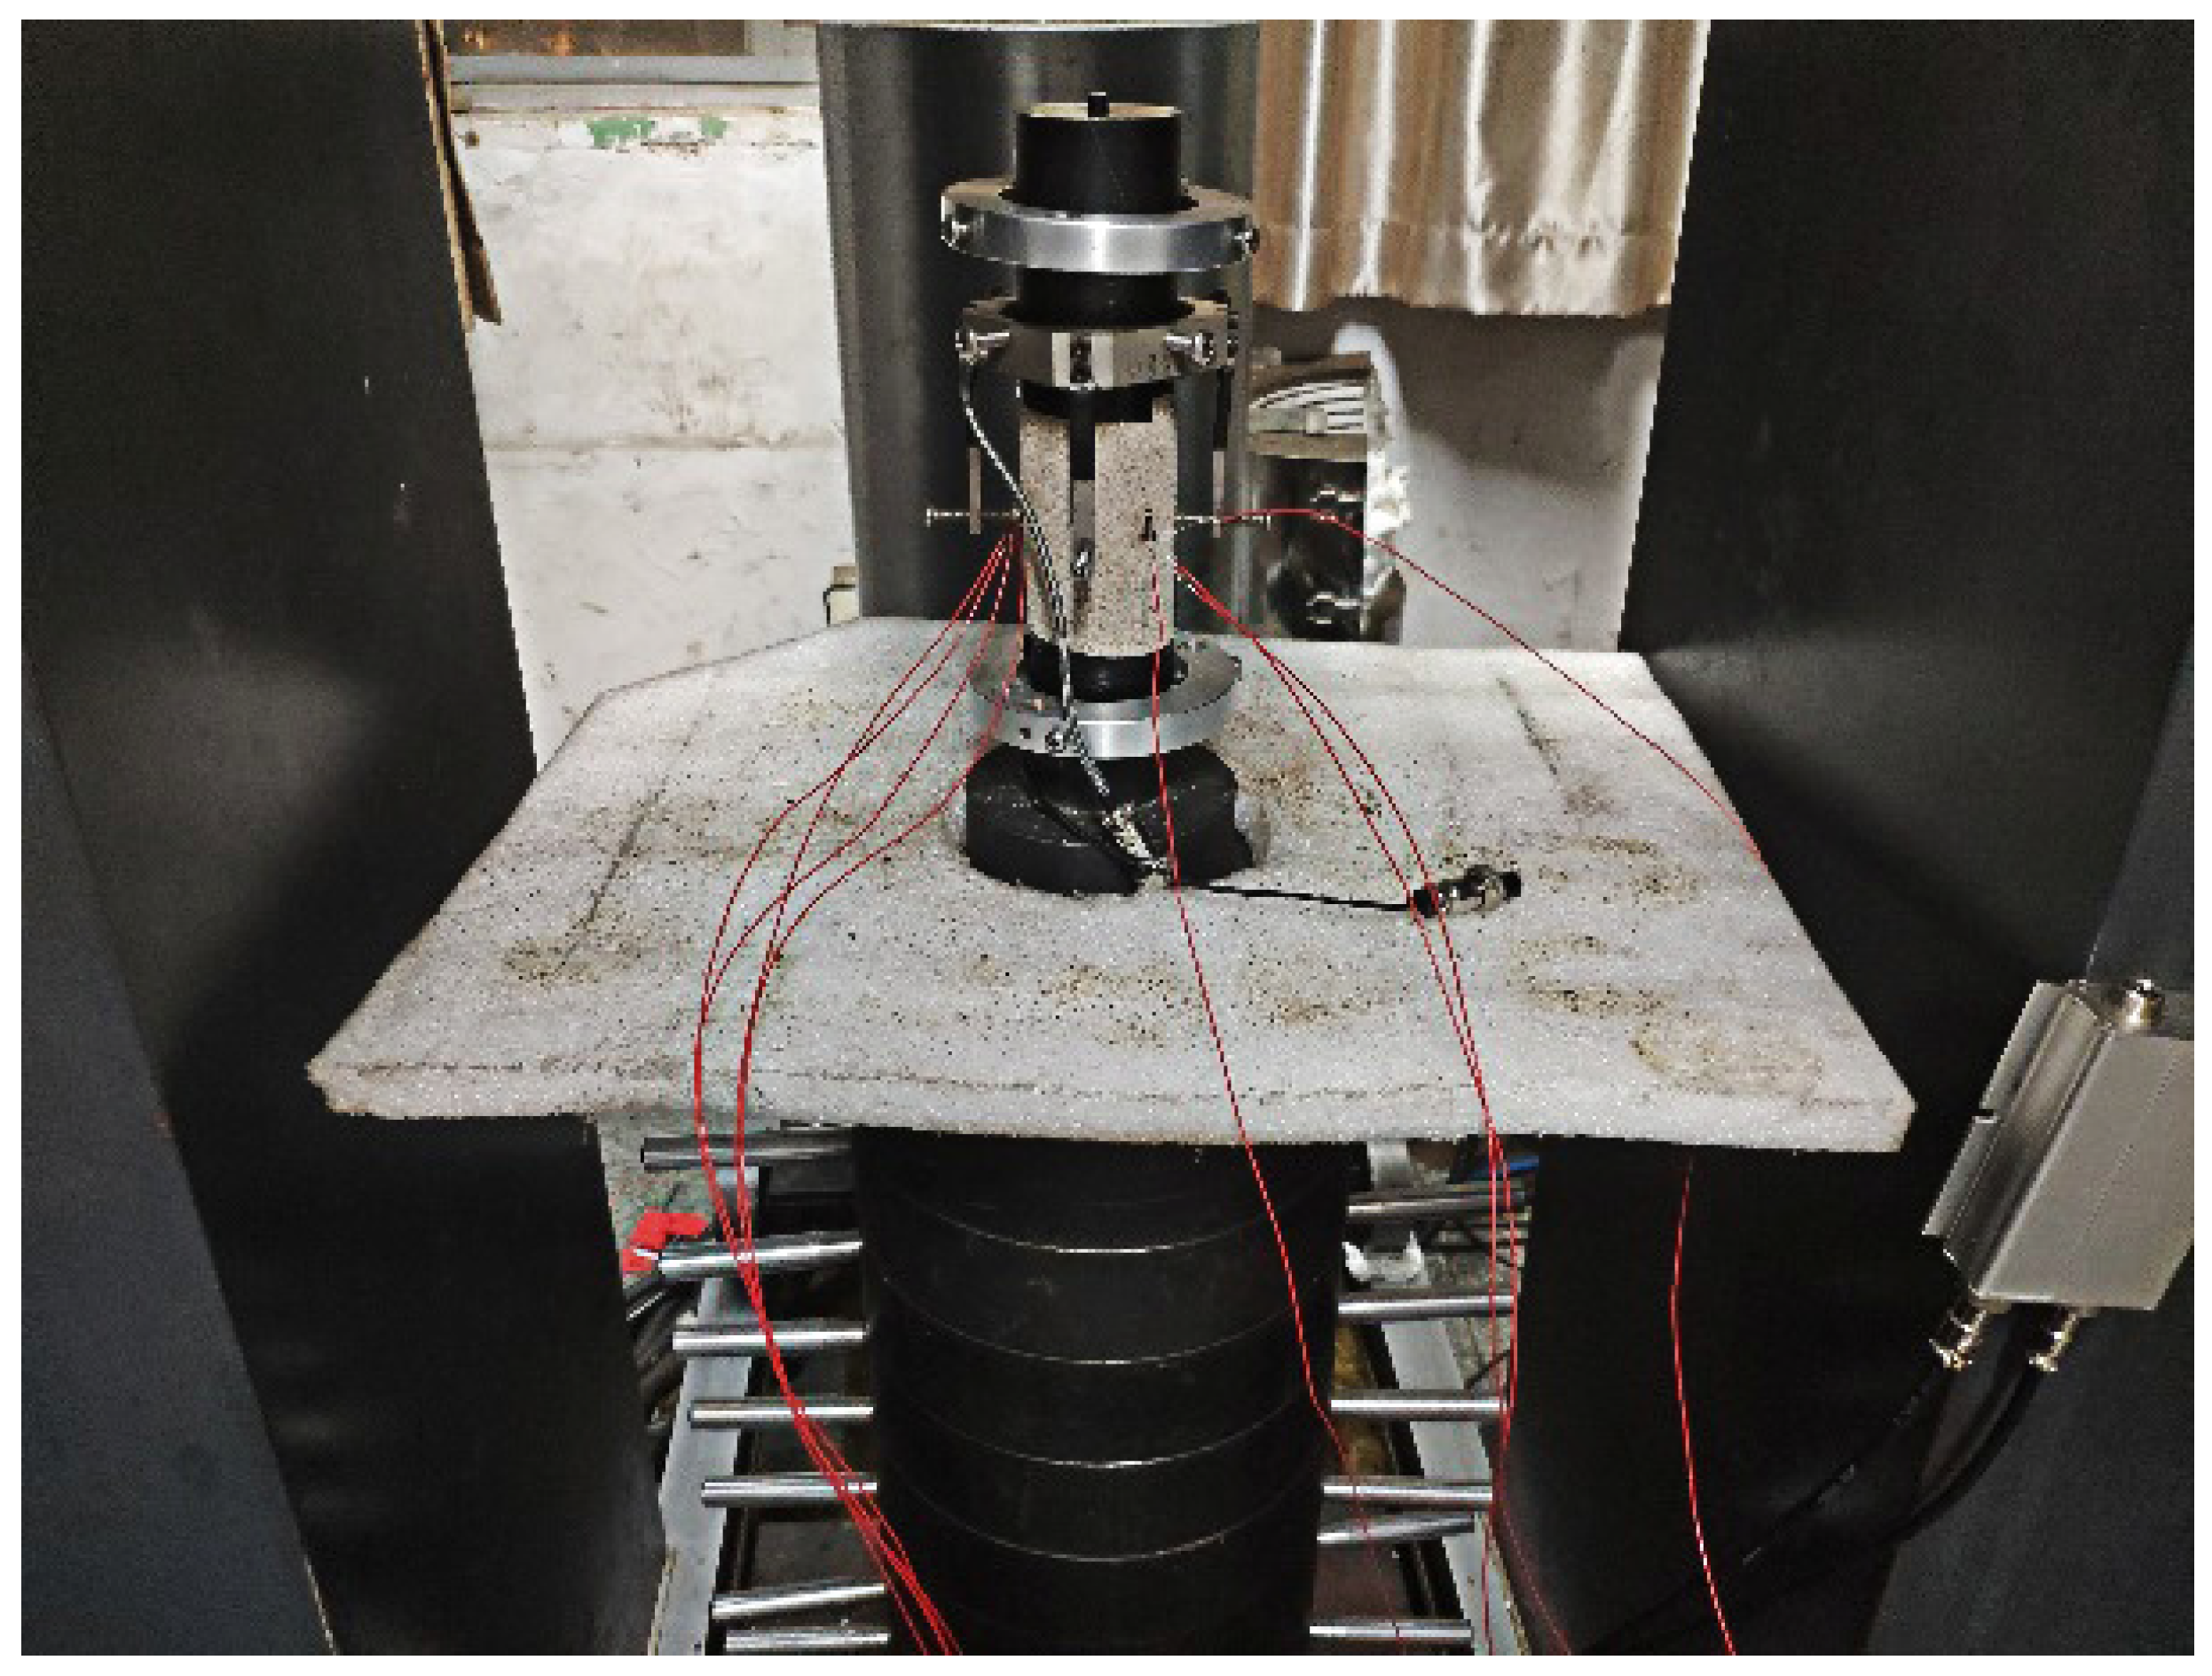
4.1.2. Selection and Preparation of Similarity Experiment Materials

C325 Portland cement and building gypsum were selected as the binder, and fine river sand with a particle size of 0.25–1.6 mm was selected as the aggregate. The amounts of water and glycerol are 10% and 1% of the total weight of the mixture, respectively. Since there is no river sand with this particle size on the market, it was necessary to screen the purchased sand after drying, as shown in Figure 13.
To appropriately simulate the real rock and ore, 10 proportion numbers, including 828, 837, 846, 955, 964, 973, 1019, 1028, 1037, and 1046, were selected to make standard specimens with a diameter of 50 mm and a height of 100 mm for tests. The first part of the proportion number (the first 1 or 2 digits) indicates the binder–sand ratio, and the second part of the proportion number (the last two digits) indicates the cement–gypsum ratio.
The mixing process was performed as follows. First, the cement, gypsum and river sand were poured into the JJ-5 cement–sand mixer with a rotational speed of 120 rpm according to the specified ratio of weighing within 2 min. Then mix every 30 L of dry materials for 15 min. The next step was to further stir the mixture by adding water slowly for 2 min.
After mixing the materials thoroughly and evenly, pour the mixture into the test molds. The test molds were placed on a vibration table for compaction. In addition, then a universal testing machine was used to further compact the molds. The molds were removed after 3 days in a maintenance box with the humidity of 90% and the temperature of 22 °C. The test samples were marked and placed indoors for 25 days at room temperature. After the maintenance was completed, laboratory tests were conducted to measure the mechanical parameters of the specimens, as shown in Figure 14. Finally, the proportion schemes of 837, 964, 1037, and 1019 were selected to simulate siliceous shale, vanadium-bearing shale, carbonaceous shale, and backfill materials, respectively. That is, the binder–sand ratios of siliceous shale, vanadium-bearing shale, carbonaceous shale, and backfill are 8:1, 9:1, 10:1, and 10:1, respectively. In addition, the cement–gypsum ratios of siliceous shale, vanadium-bearing shale, carbonaceous shale, and backfill are 3:7, 6:4, 3:7, and 1:9, respectively. Table 4 summarizes the mechanical properties of the materials.

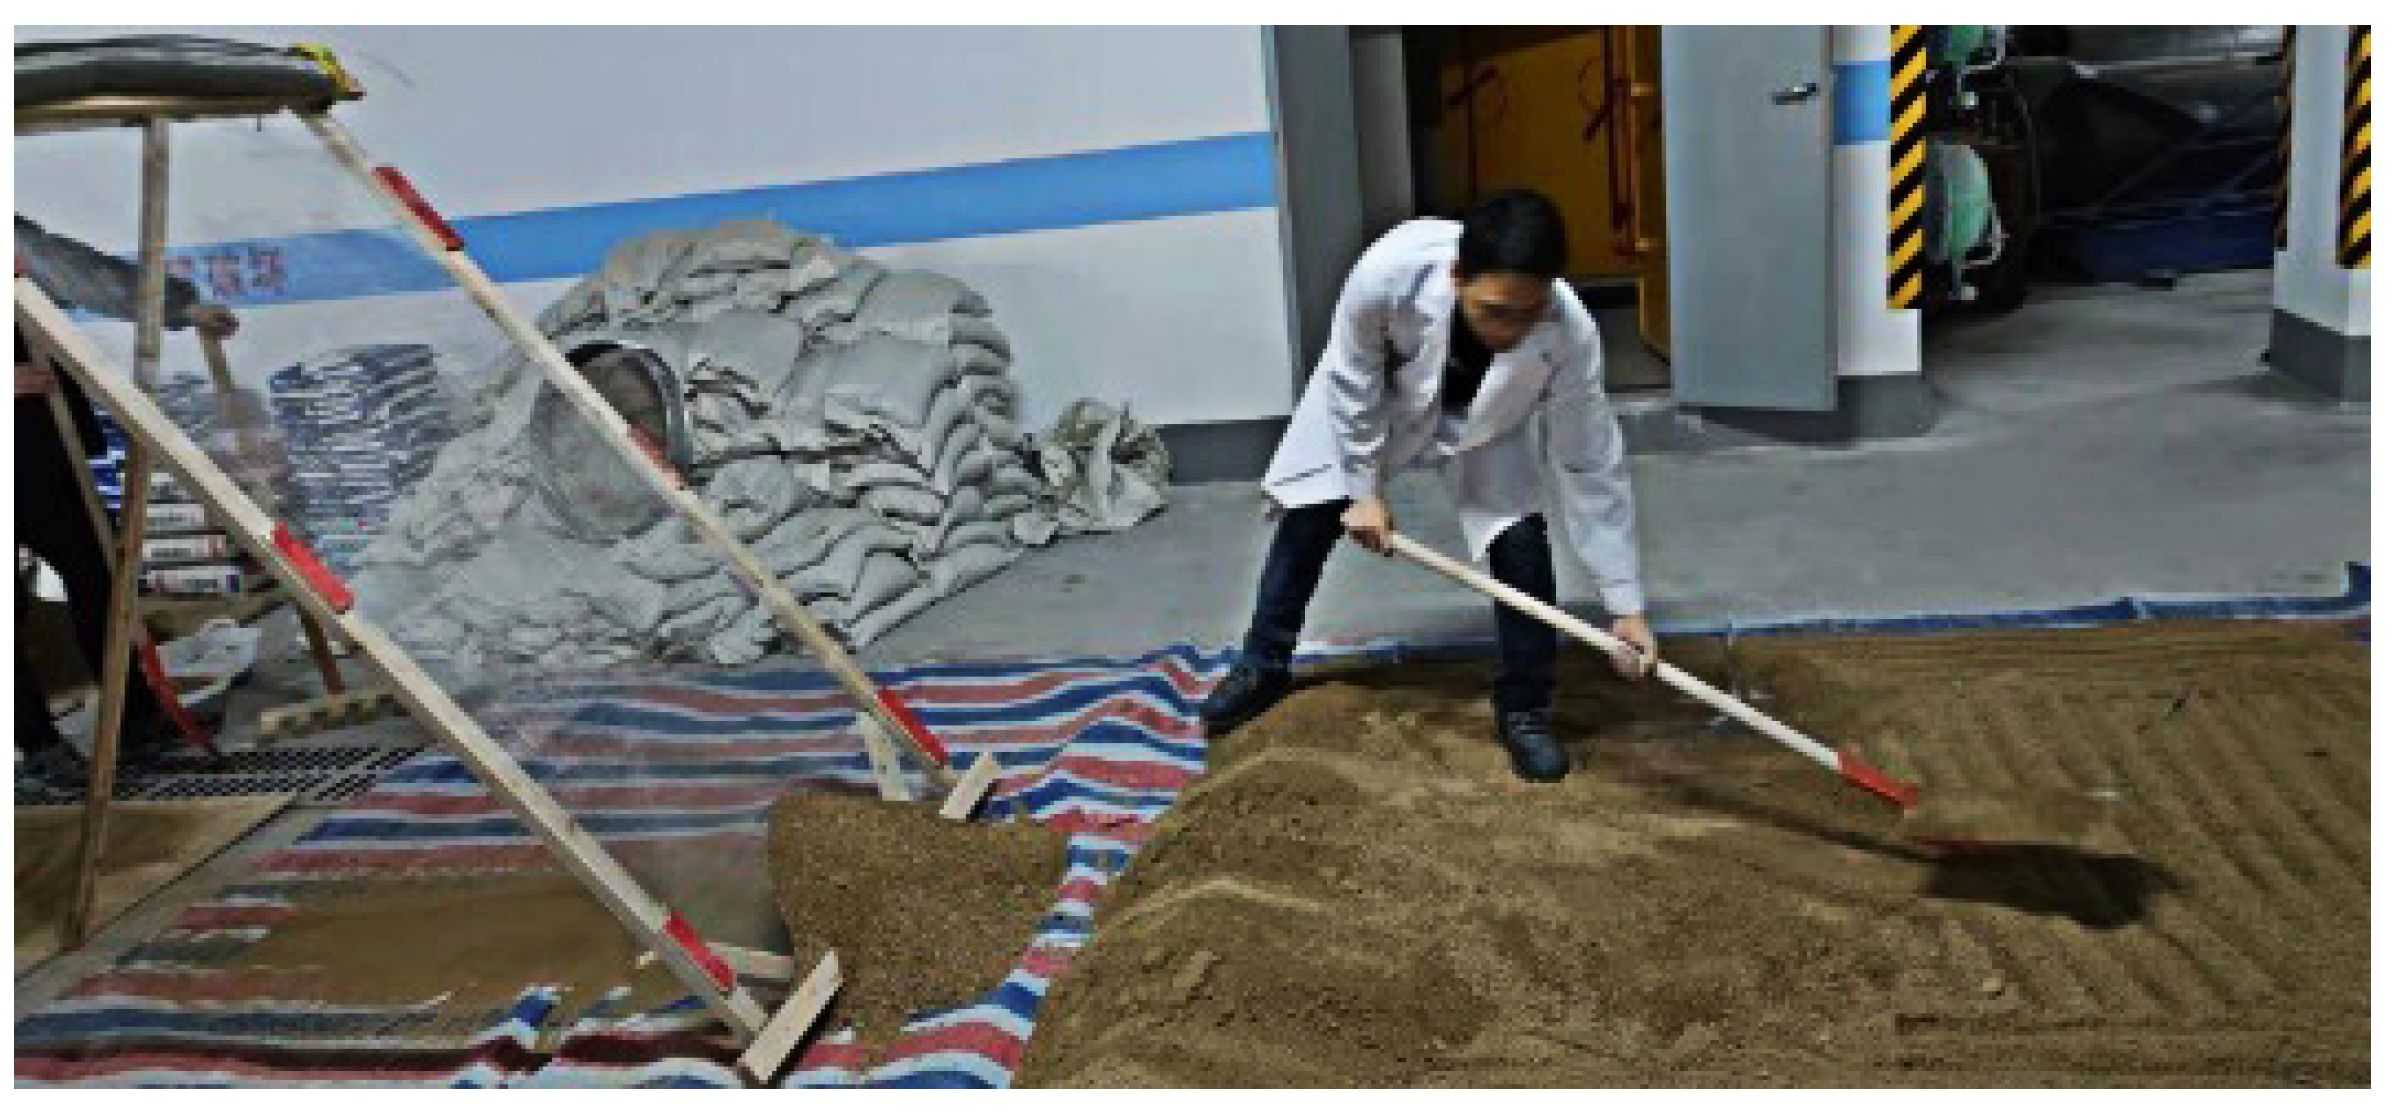
4.1.3. Similarity Model Building

In order to facilitate the test, the rock layer in the 4# profile of Mount Shangheng was appropriately simplified by merging some of the ore body branches and straightening some of the bending divisions as shown in Figure 15. The frame size of the model was 300 cm × 180 cm × 40 cm, and the calculated material dosage is shown in Table 5, which was finally prepared at an excess ratio of 120%.
The building procedure of the similarity model started from printing the profile map of the ore body shown in Figure 15 in equal proportion of the frame and pasting it on the inner wall of the model frame as the background. Then the similarity simulation materials were mixed evenly according to the previously stated procedures and prescribed proportions before being filled into the experimental frame. The filling sequence of the similarity experiment materials was siliceous shale, carbonaceous shale and vanadium-bearing shale, from bottom to top. The materials were scraped and temped layer by layer with a thickness of 15 cm. Whenever the boundary between any two deferent types of shales was encountered, 2~3 mm of mica powder was splashed at the boundary. The building process is shown in Figure 16.

4.2. The Similarity Simulation Experiment Process

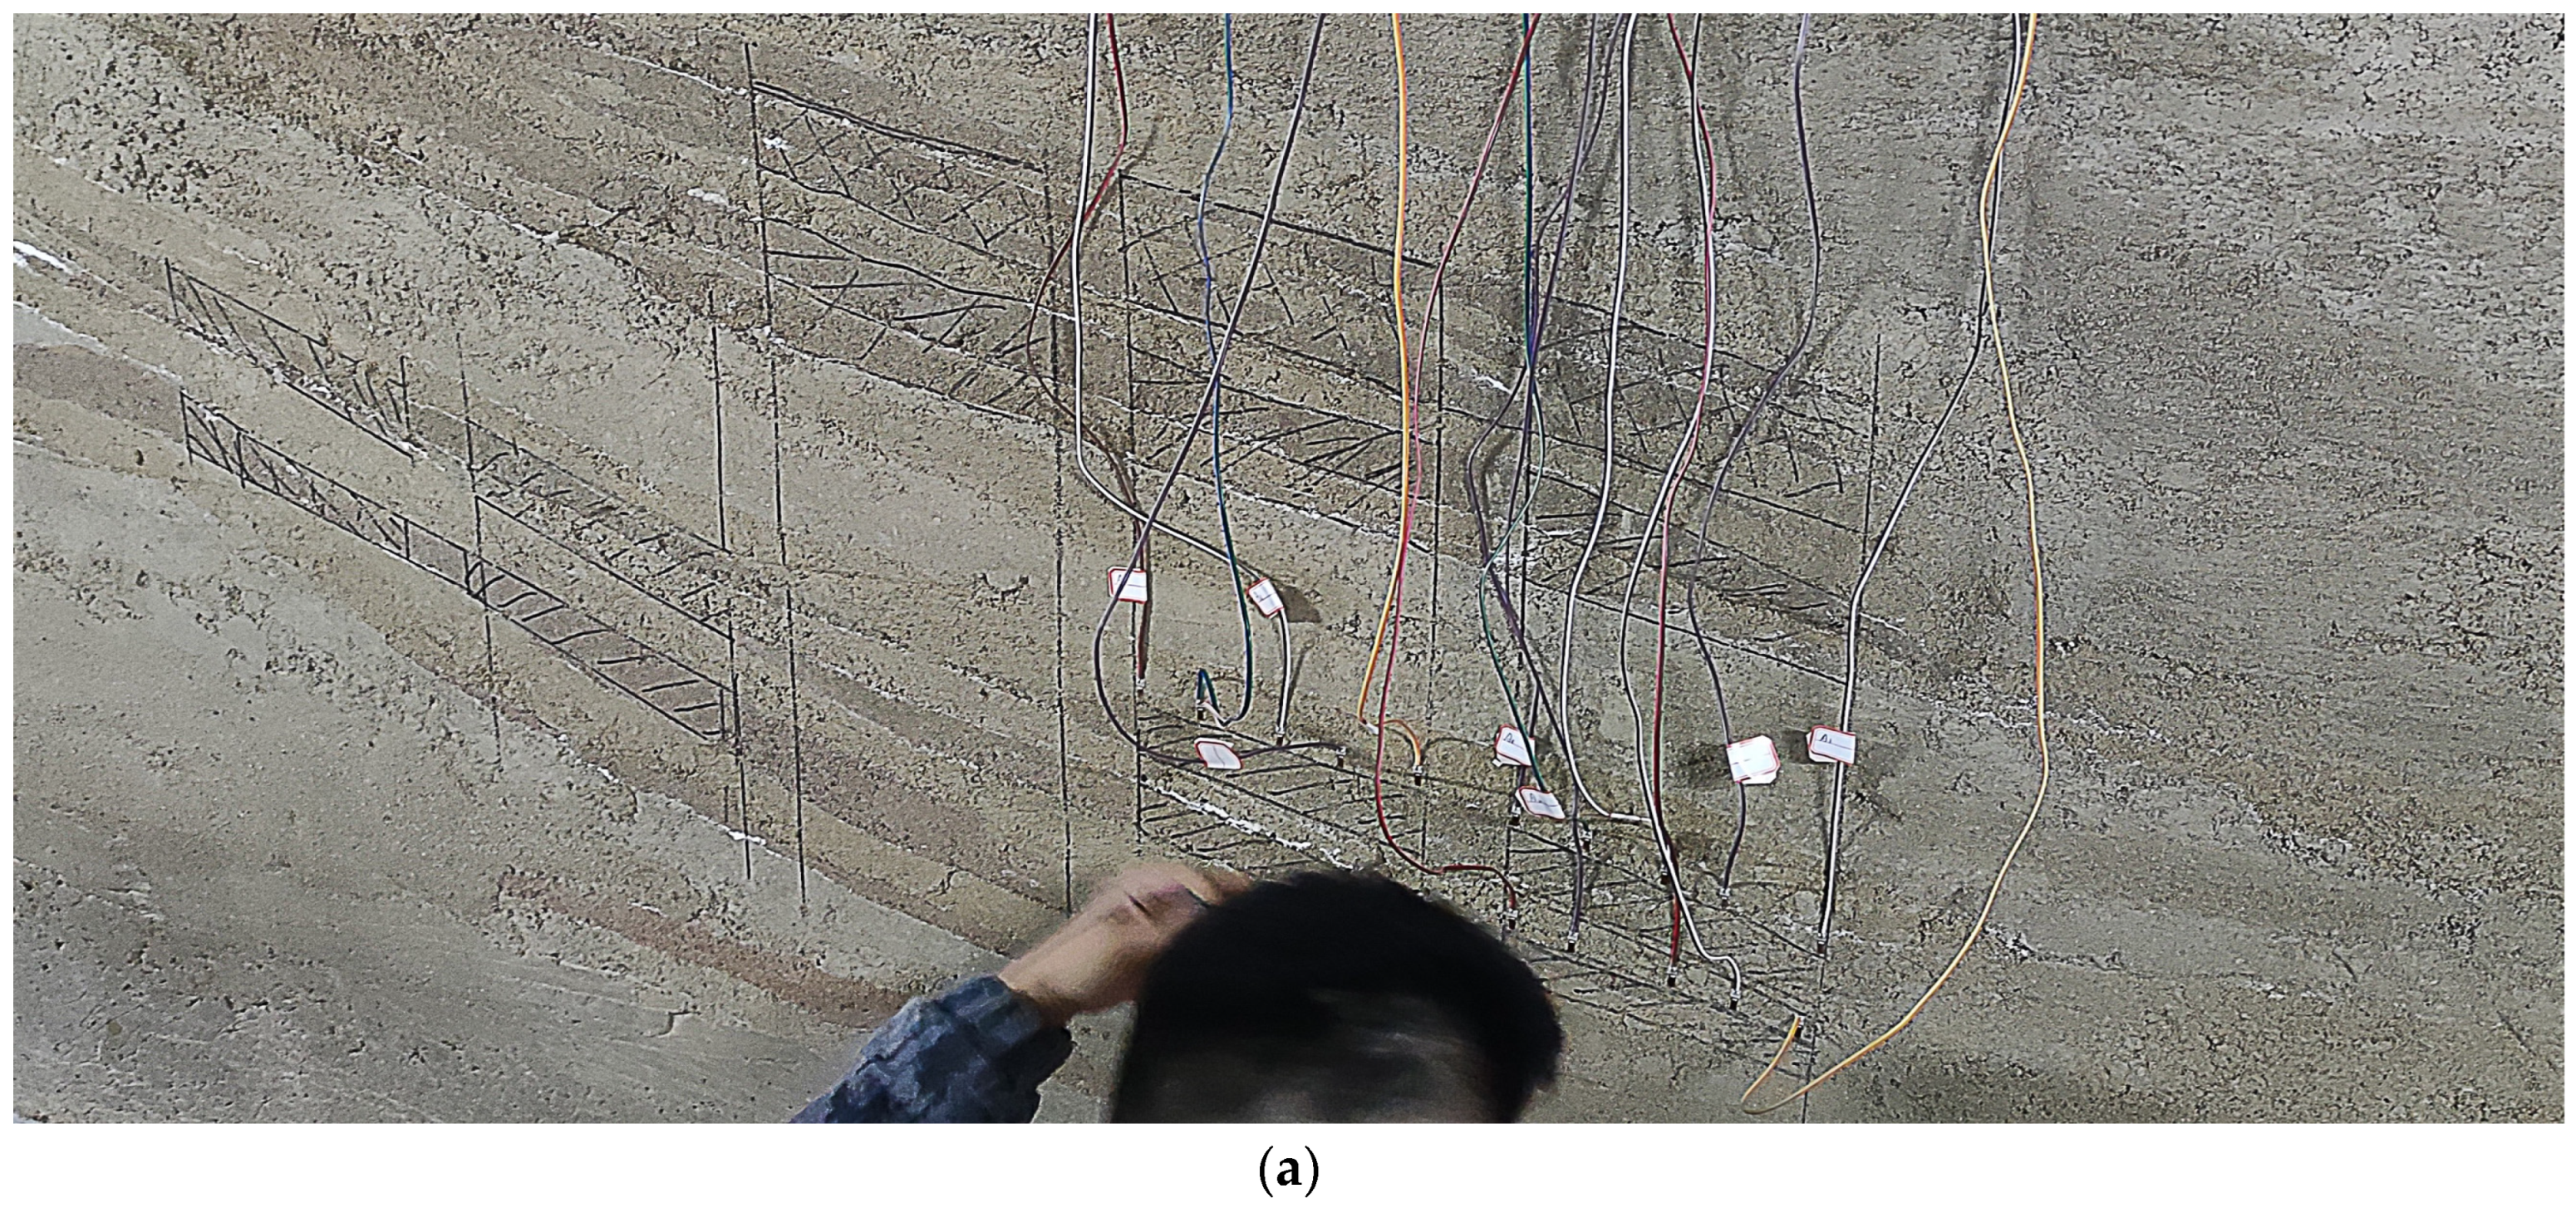
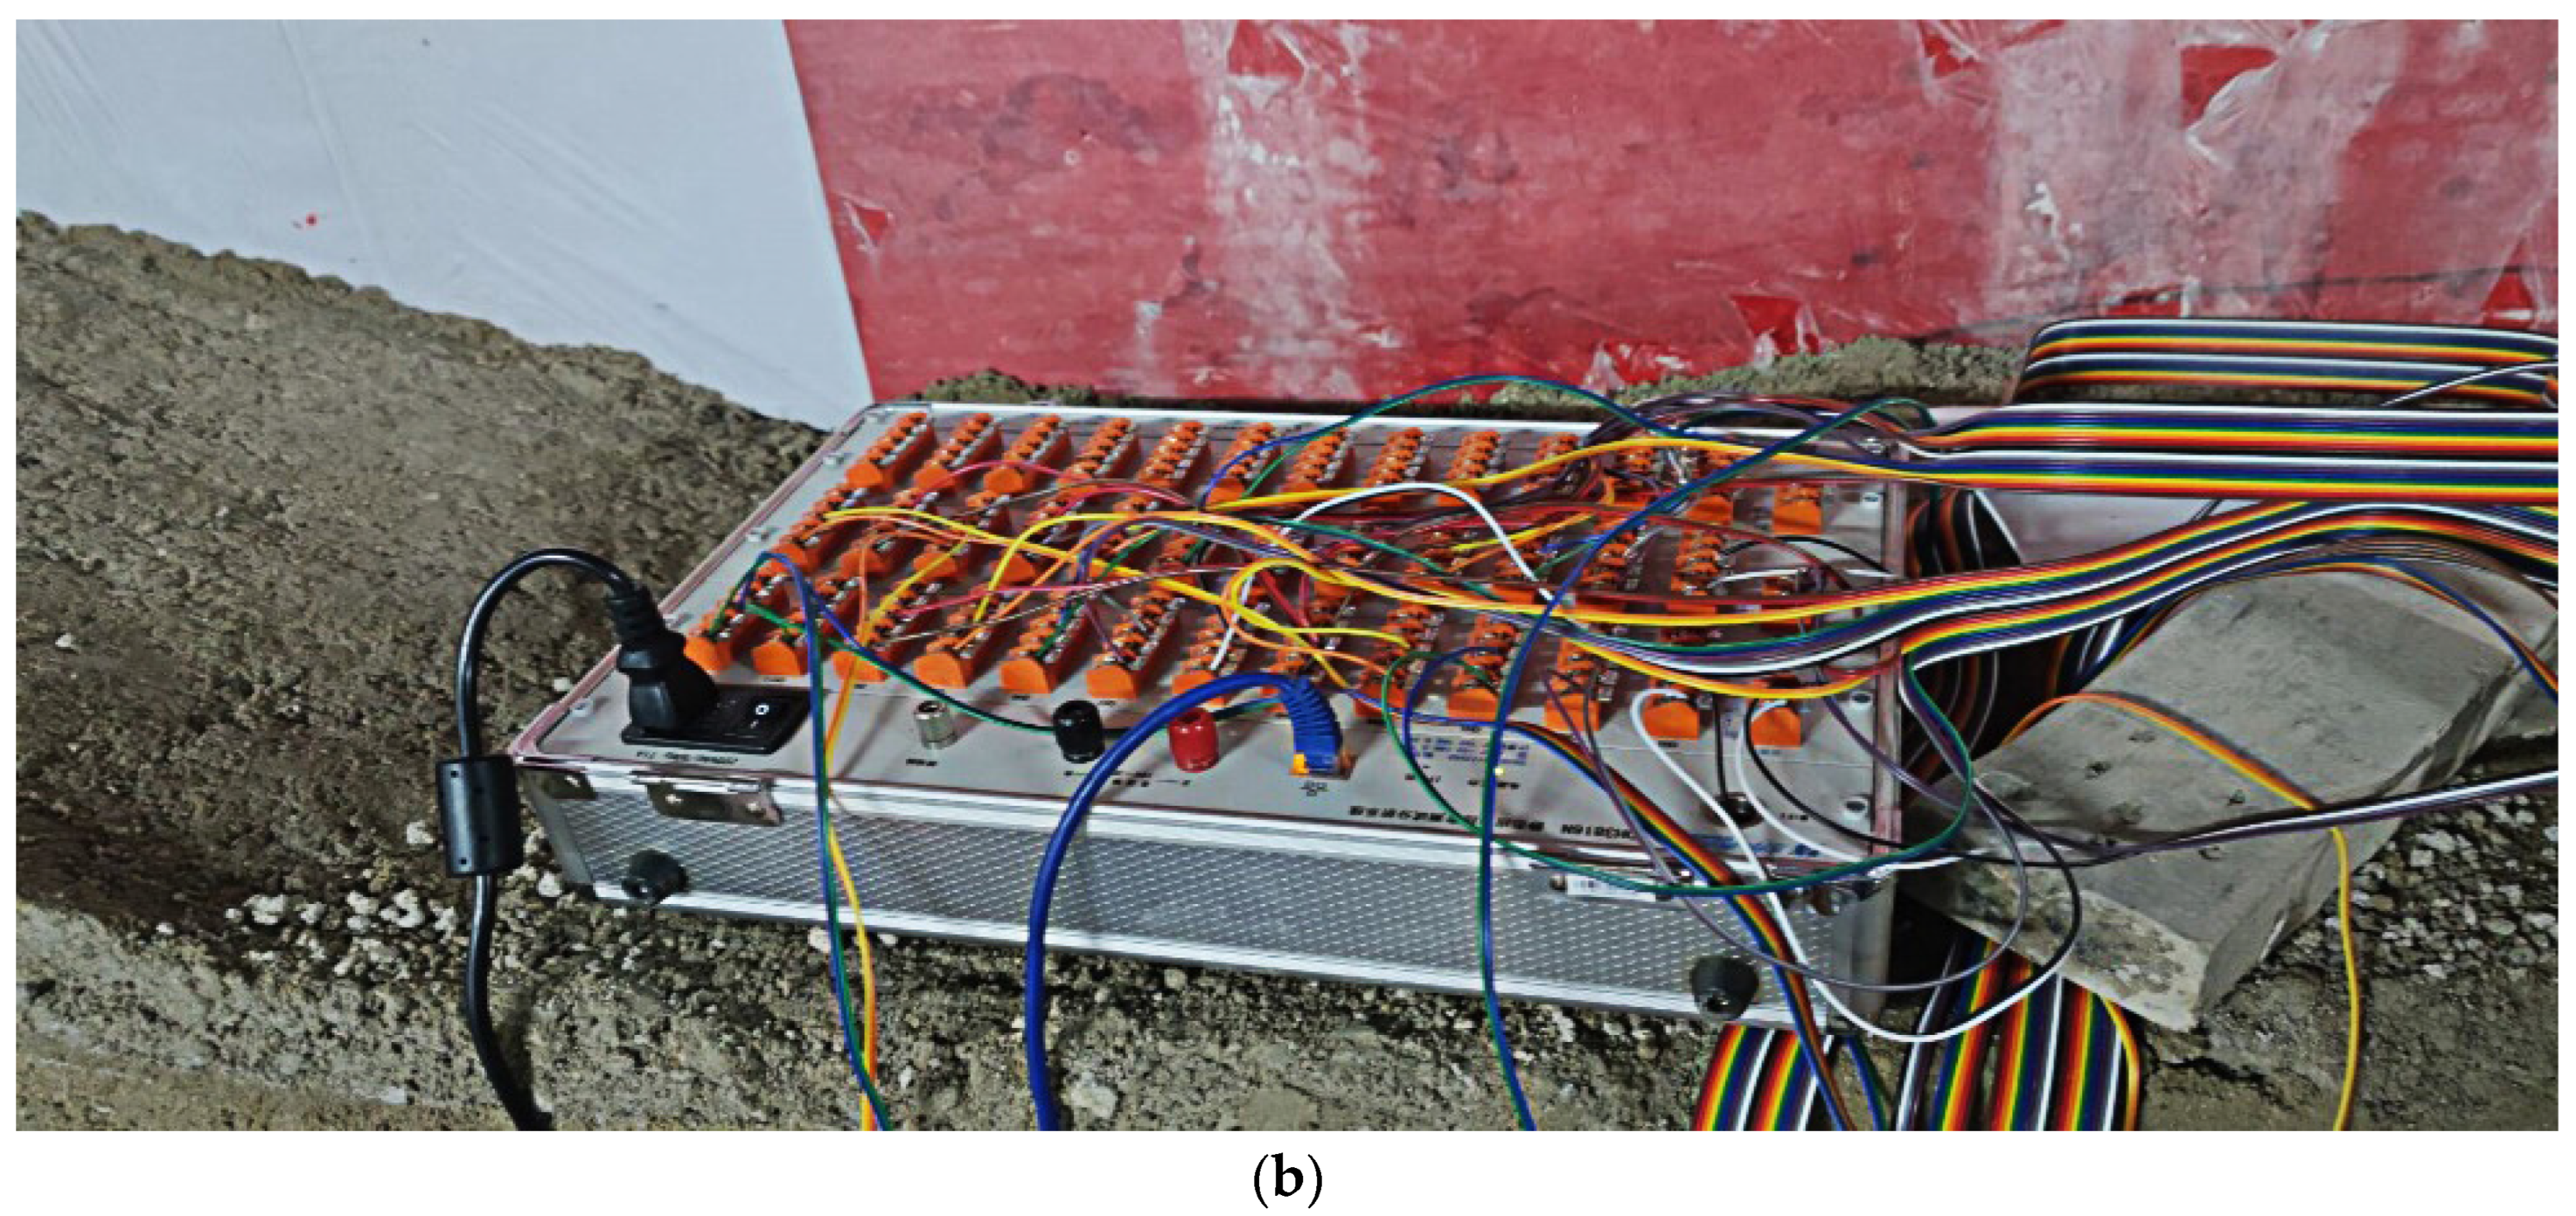
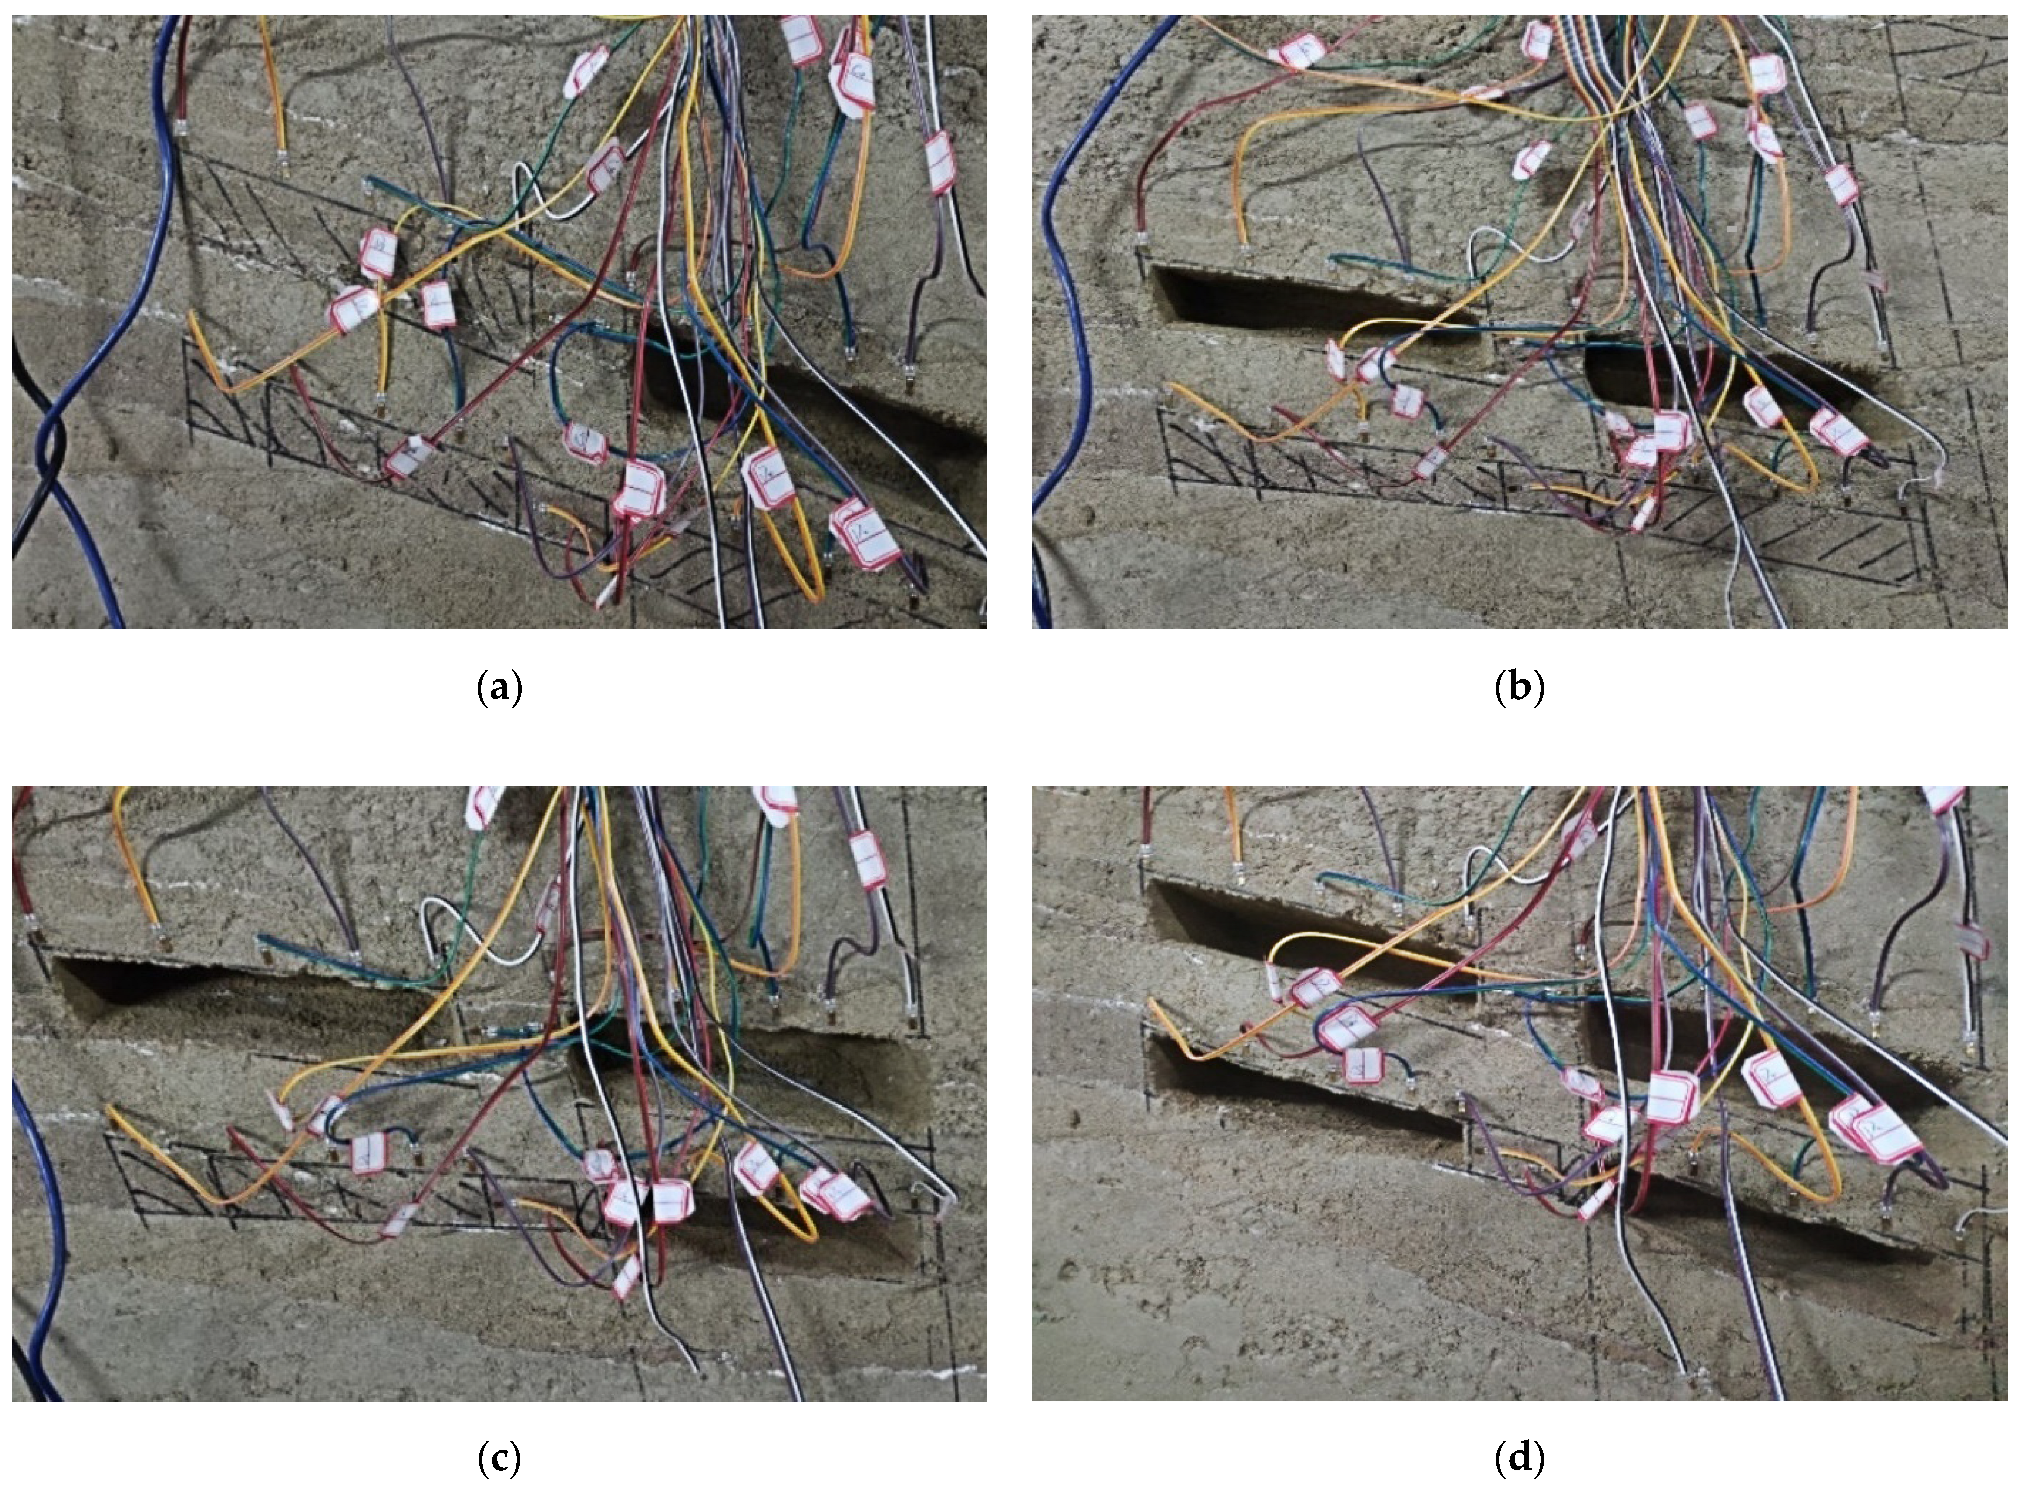
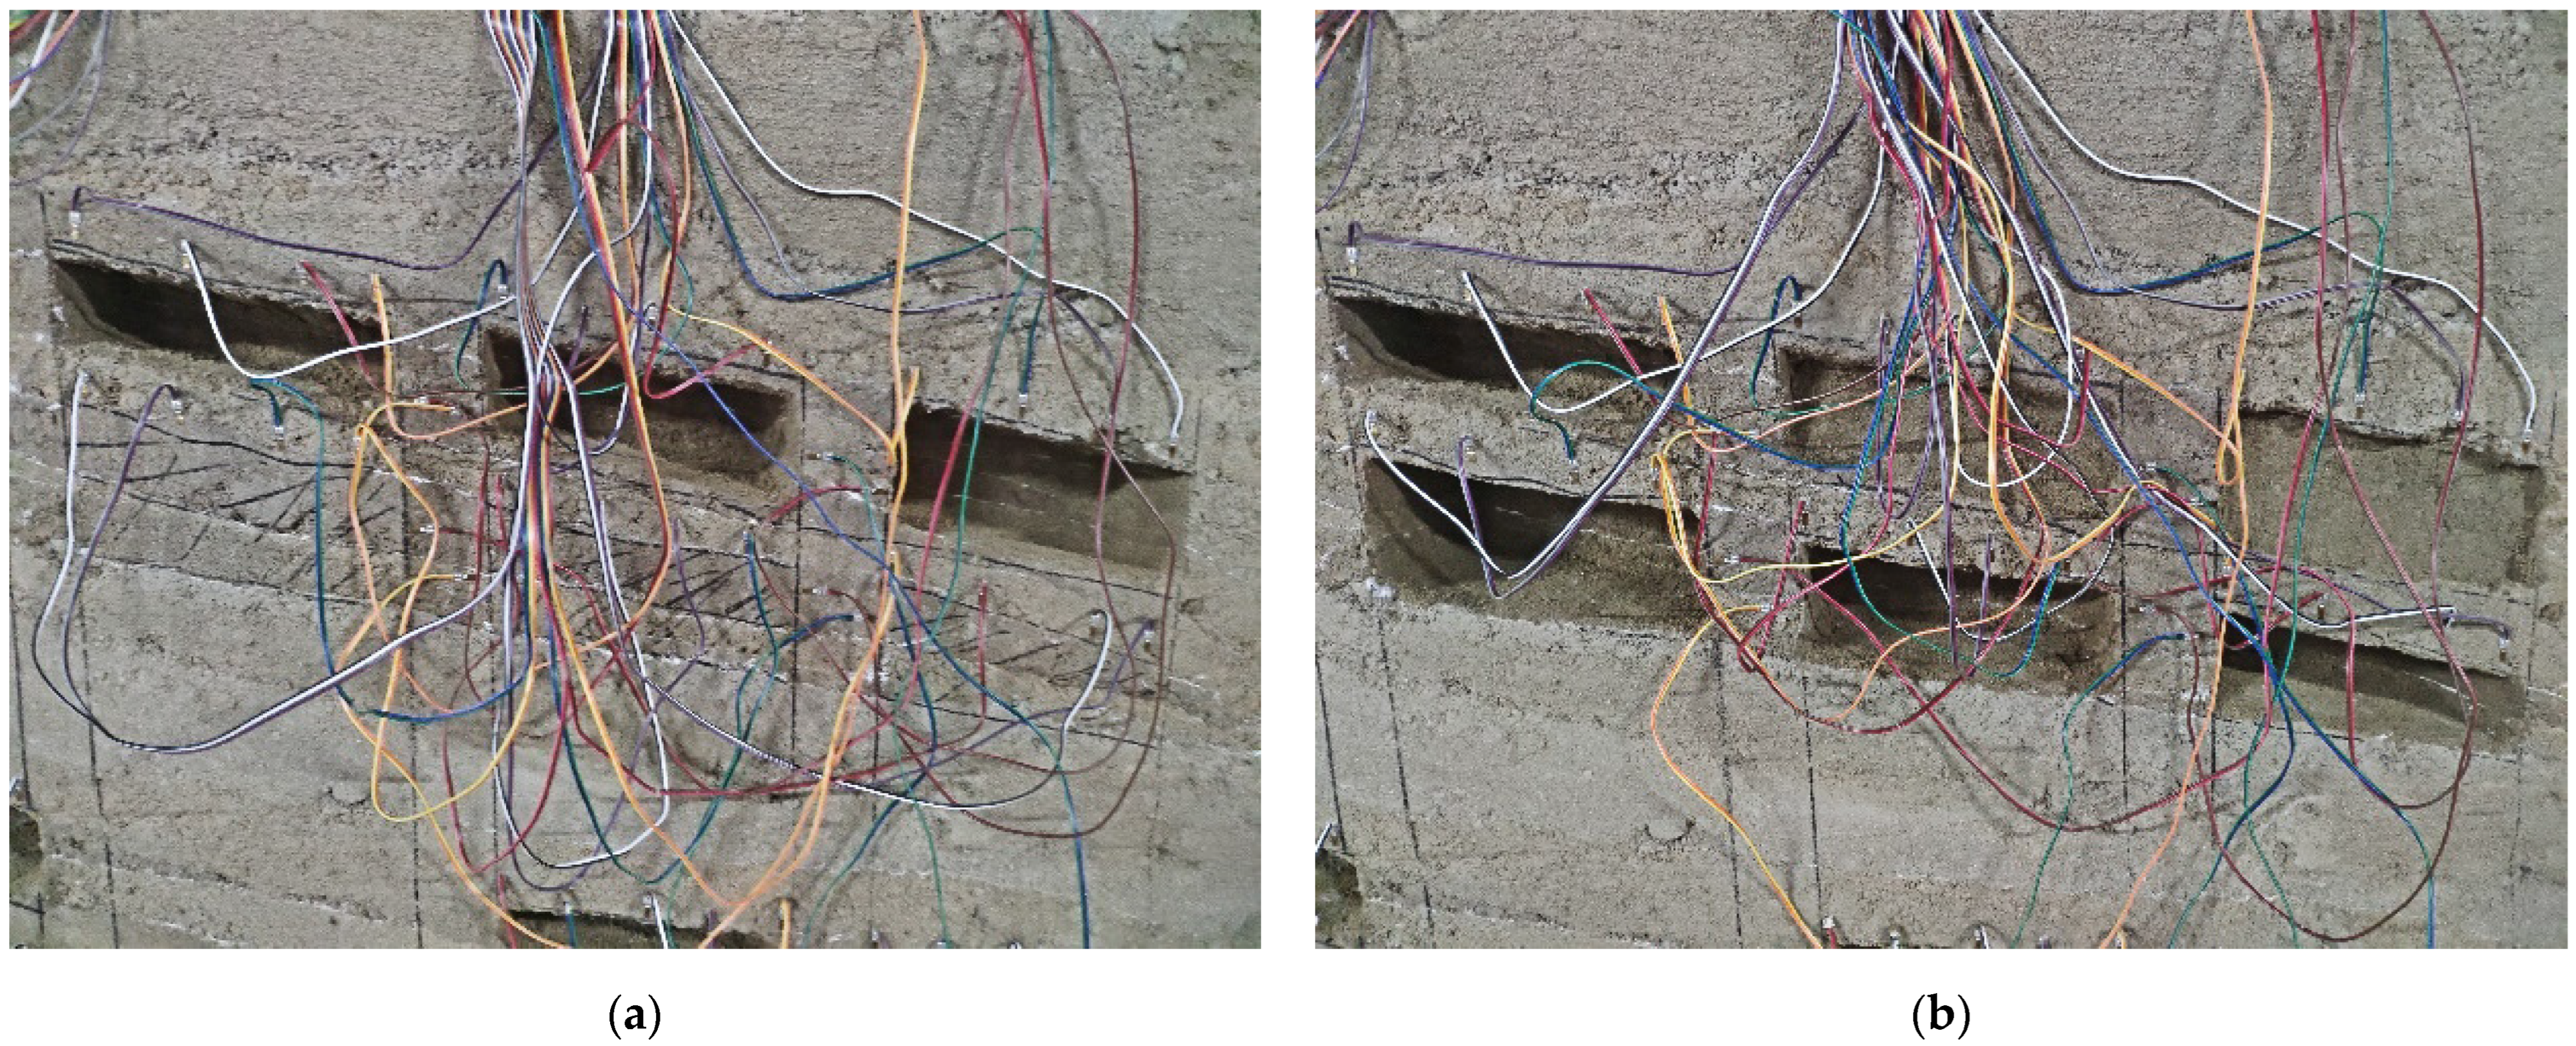
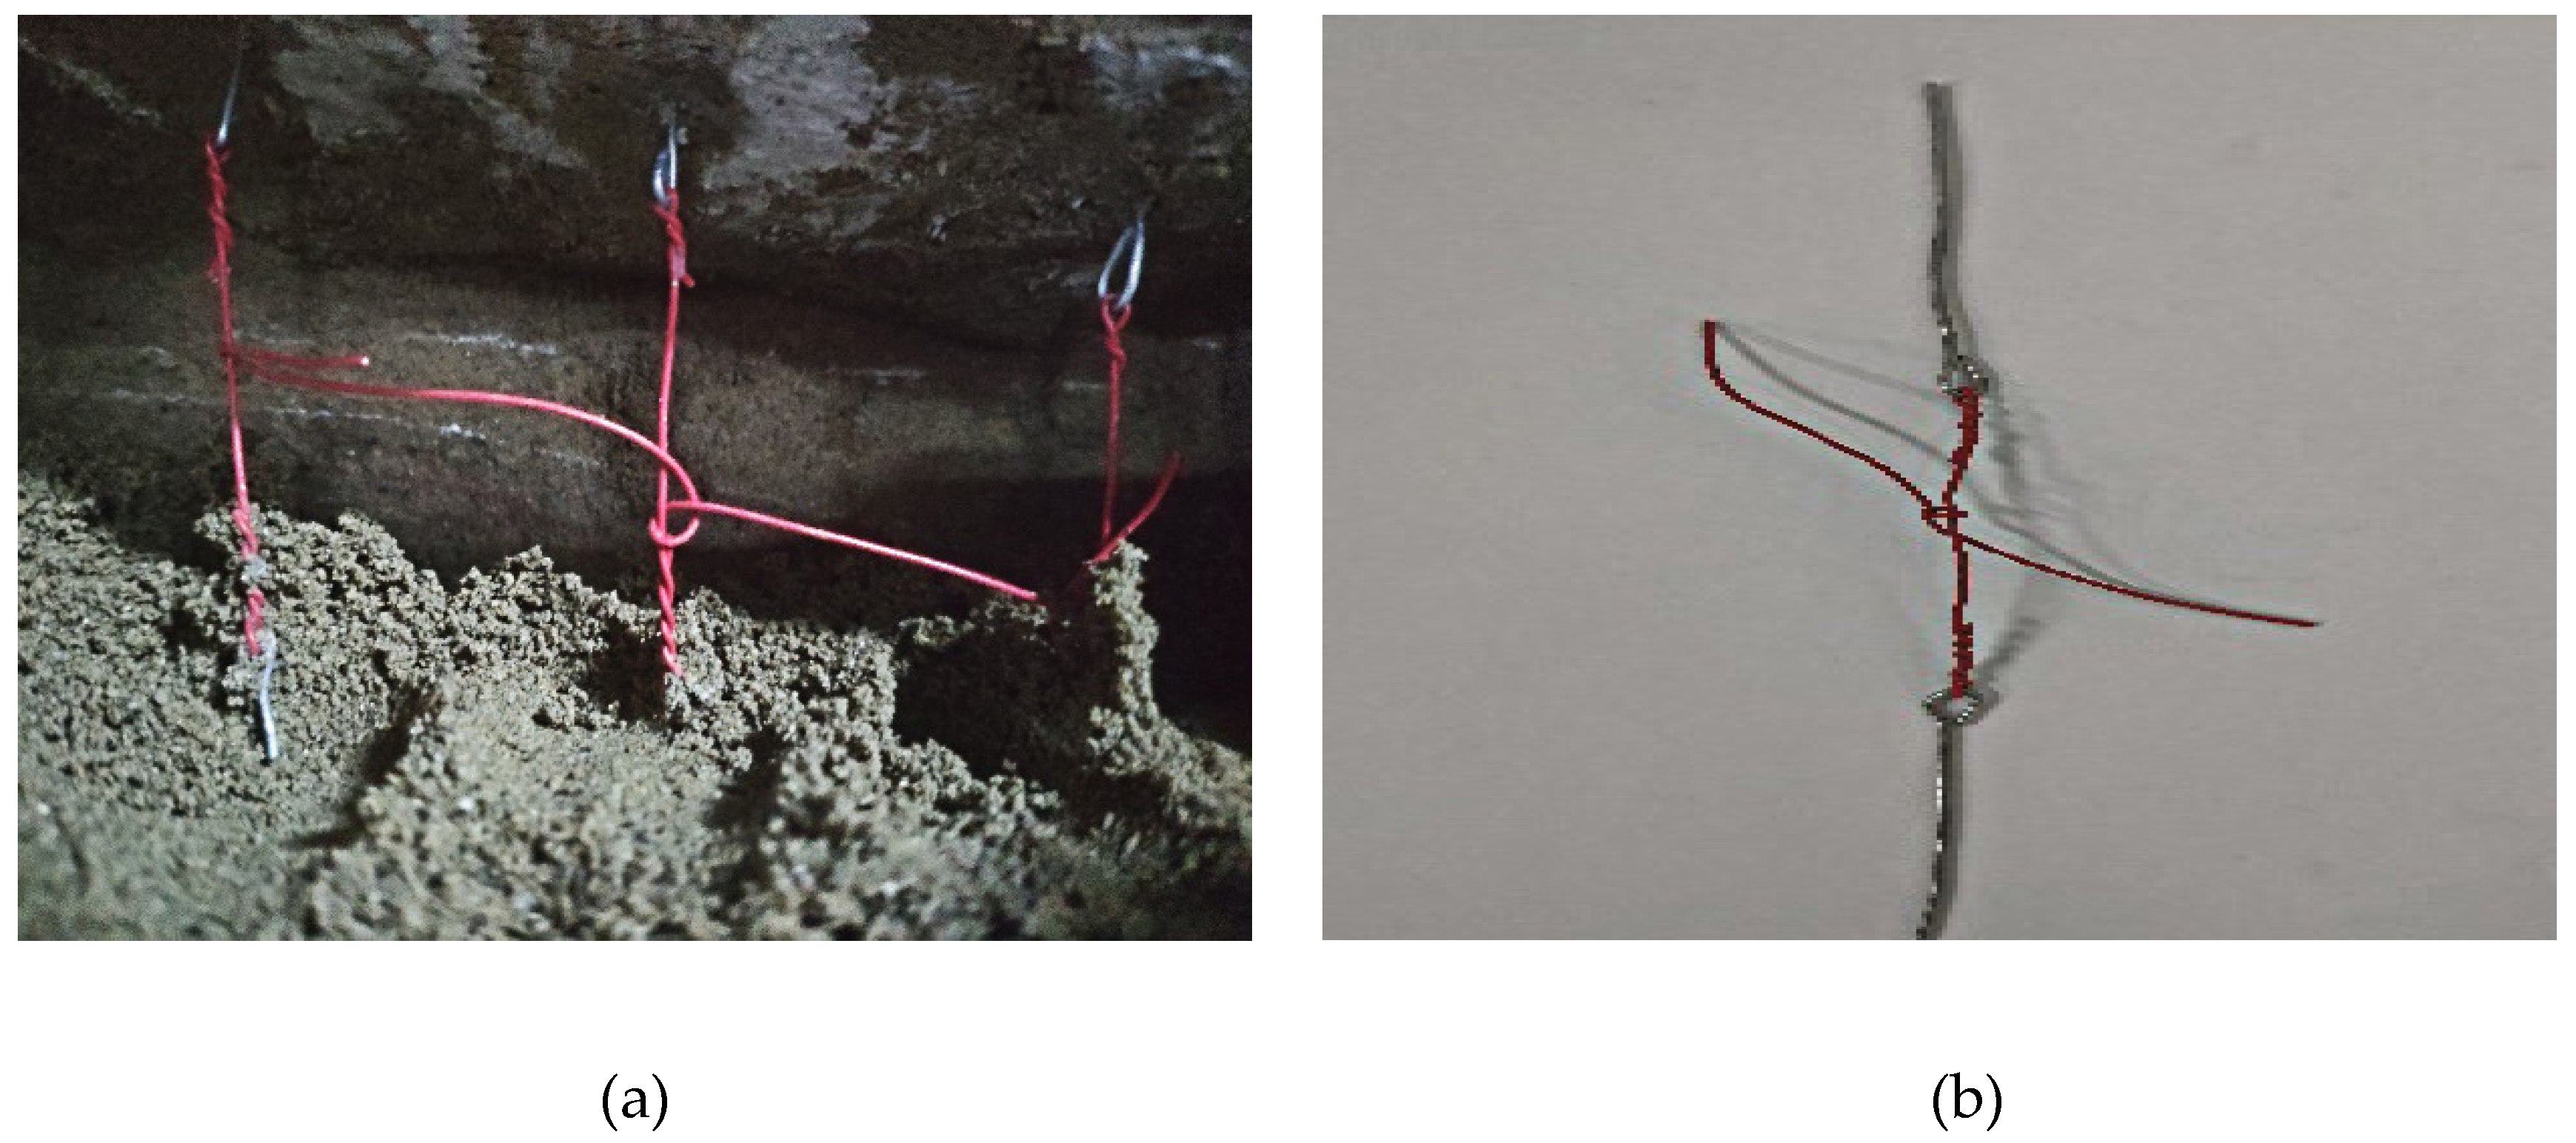
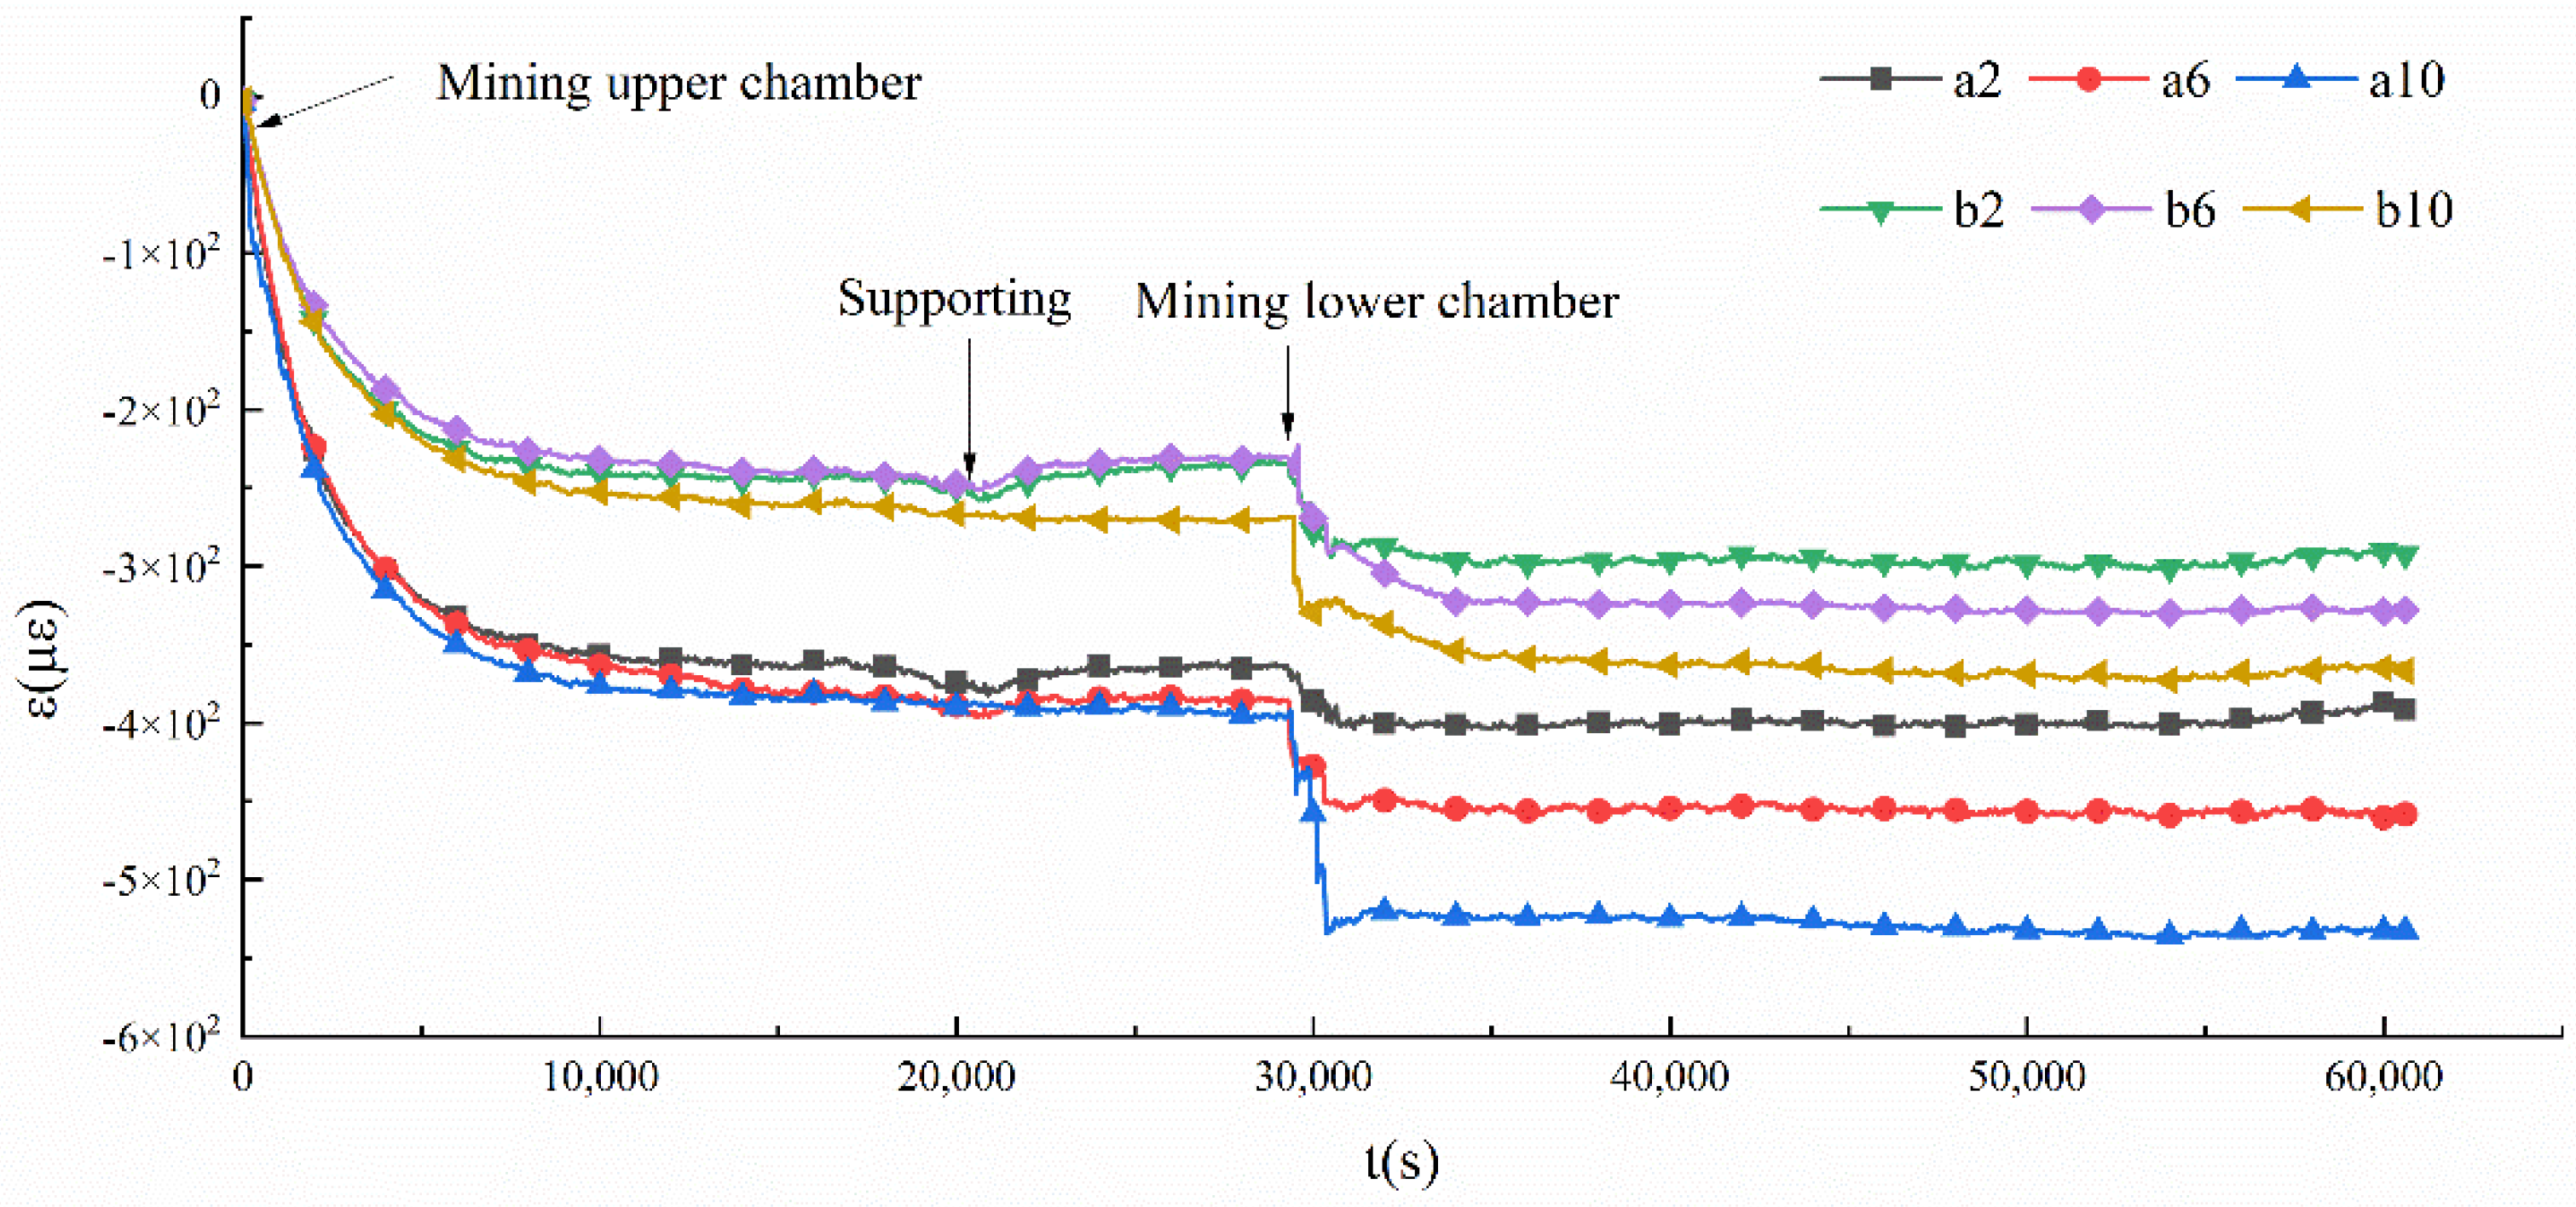
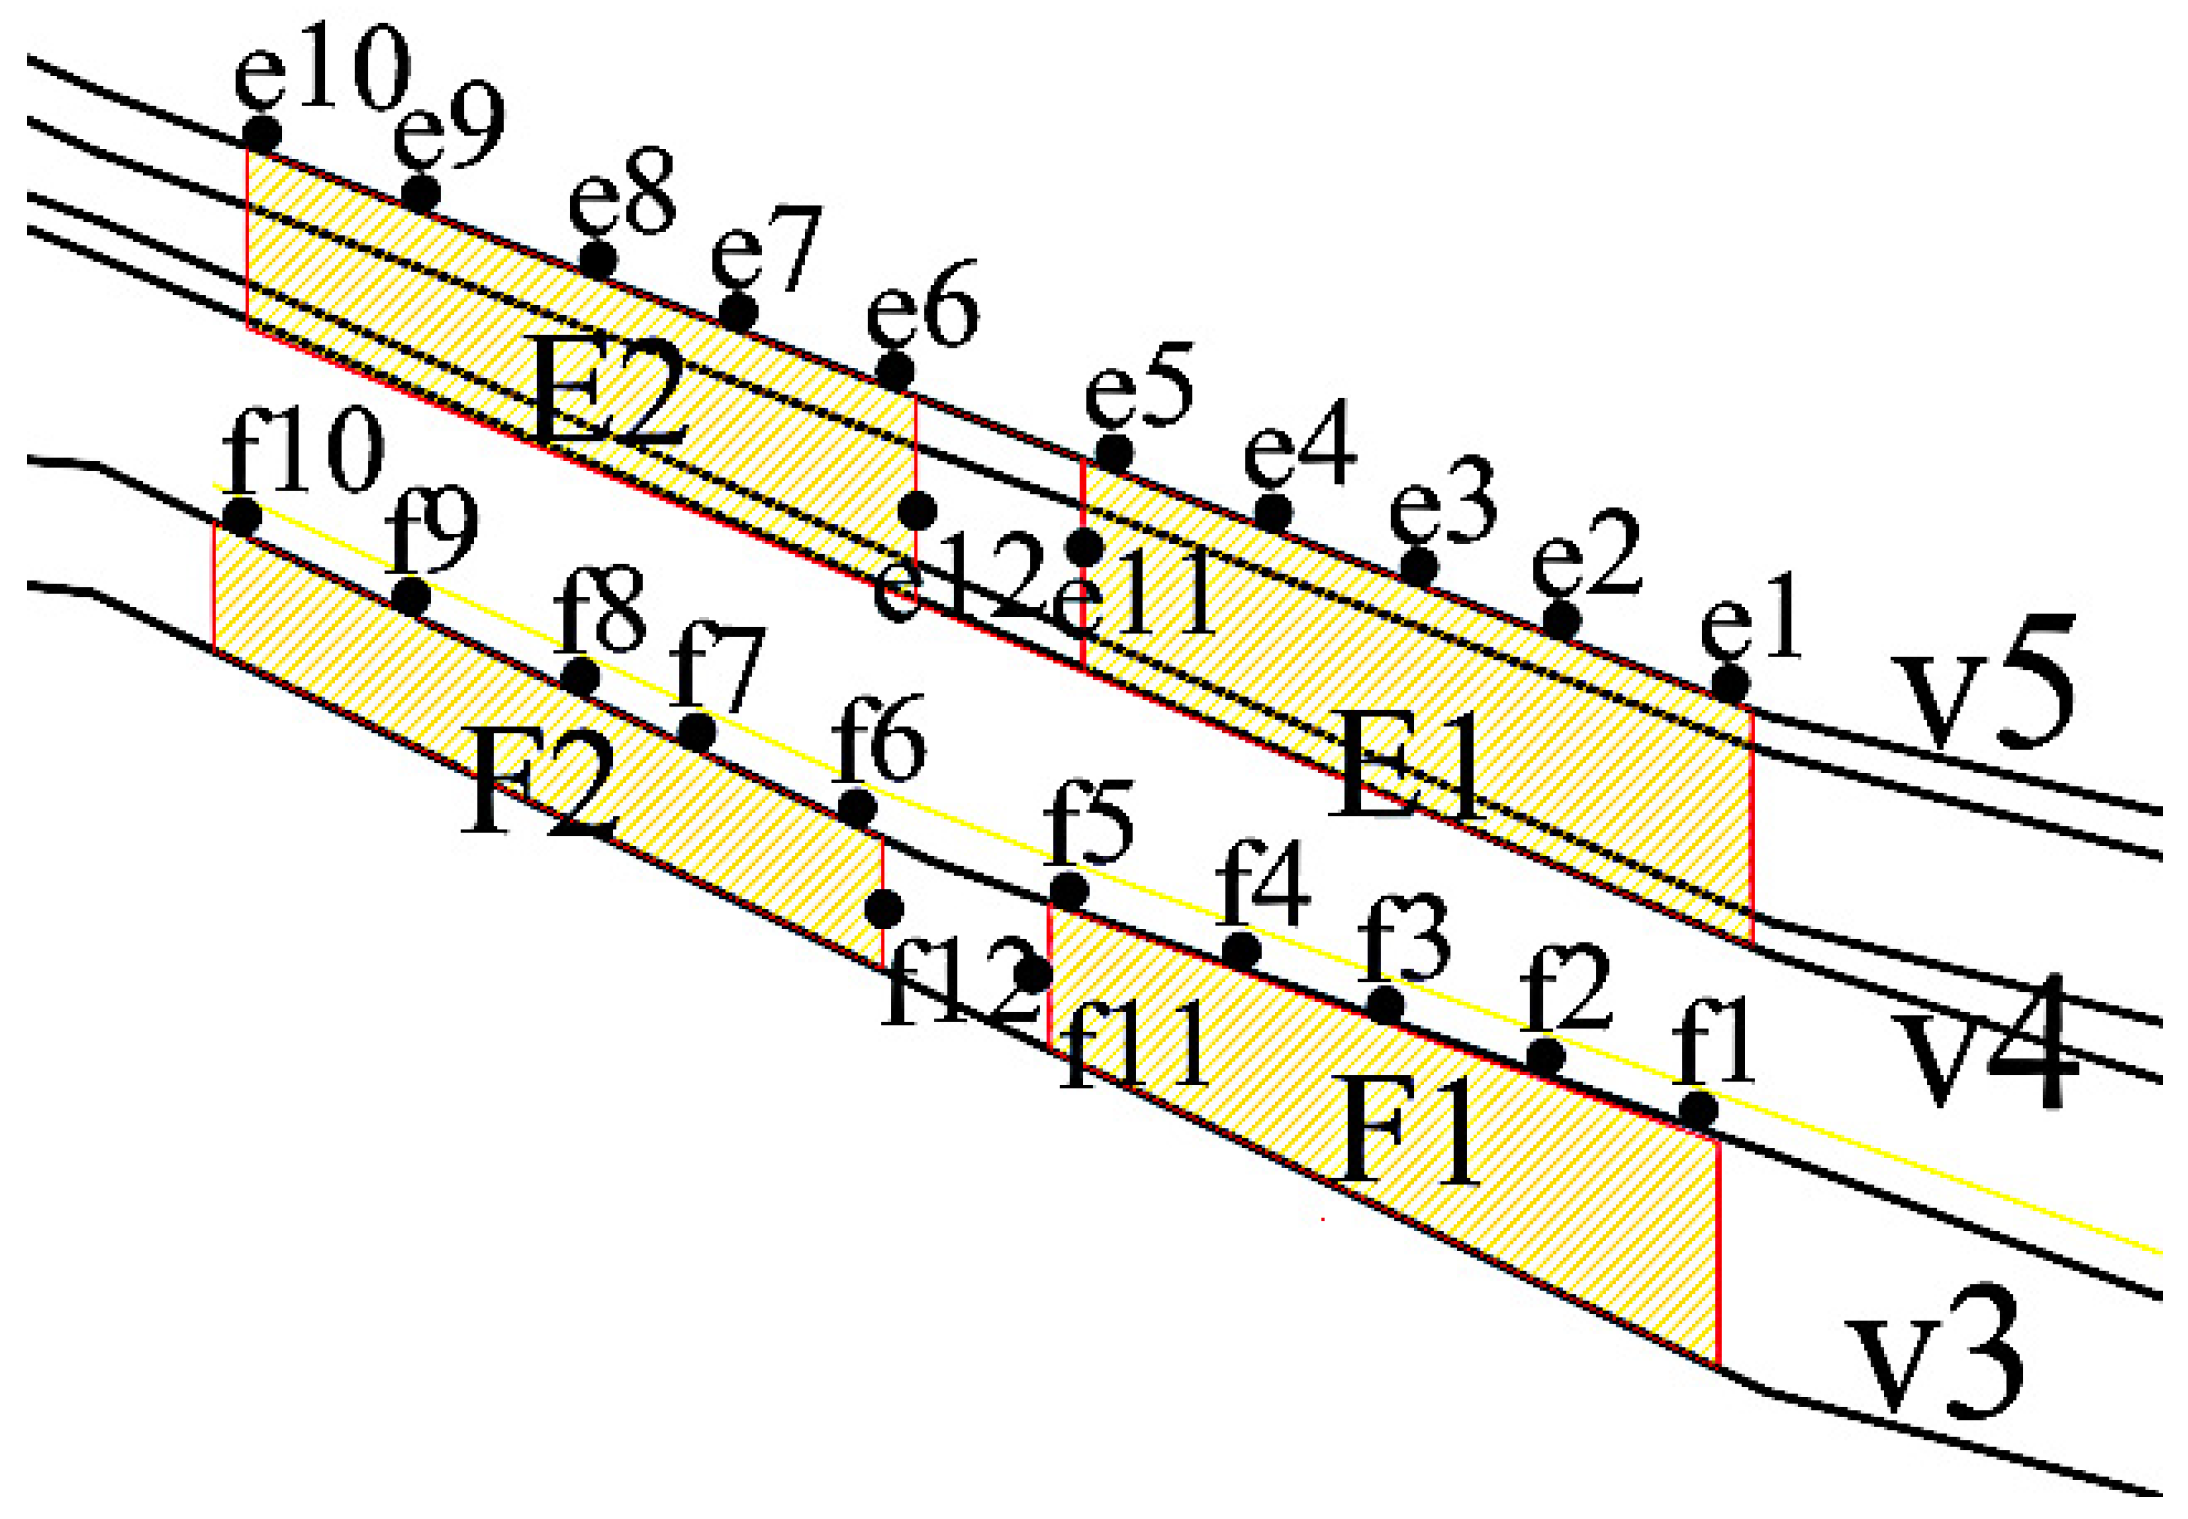
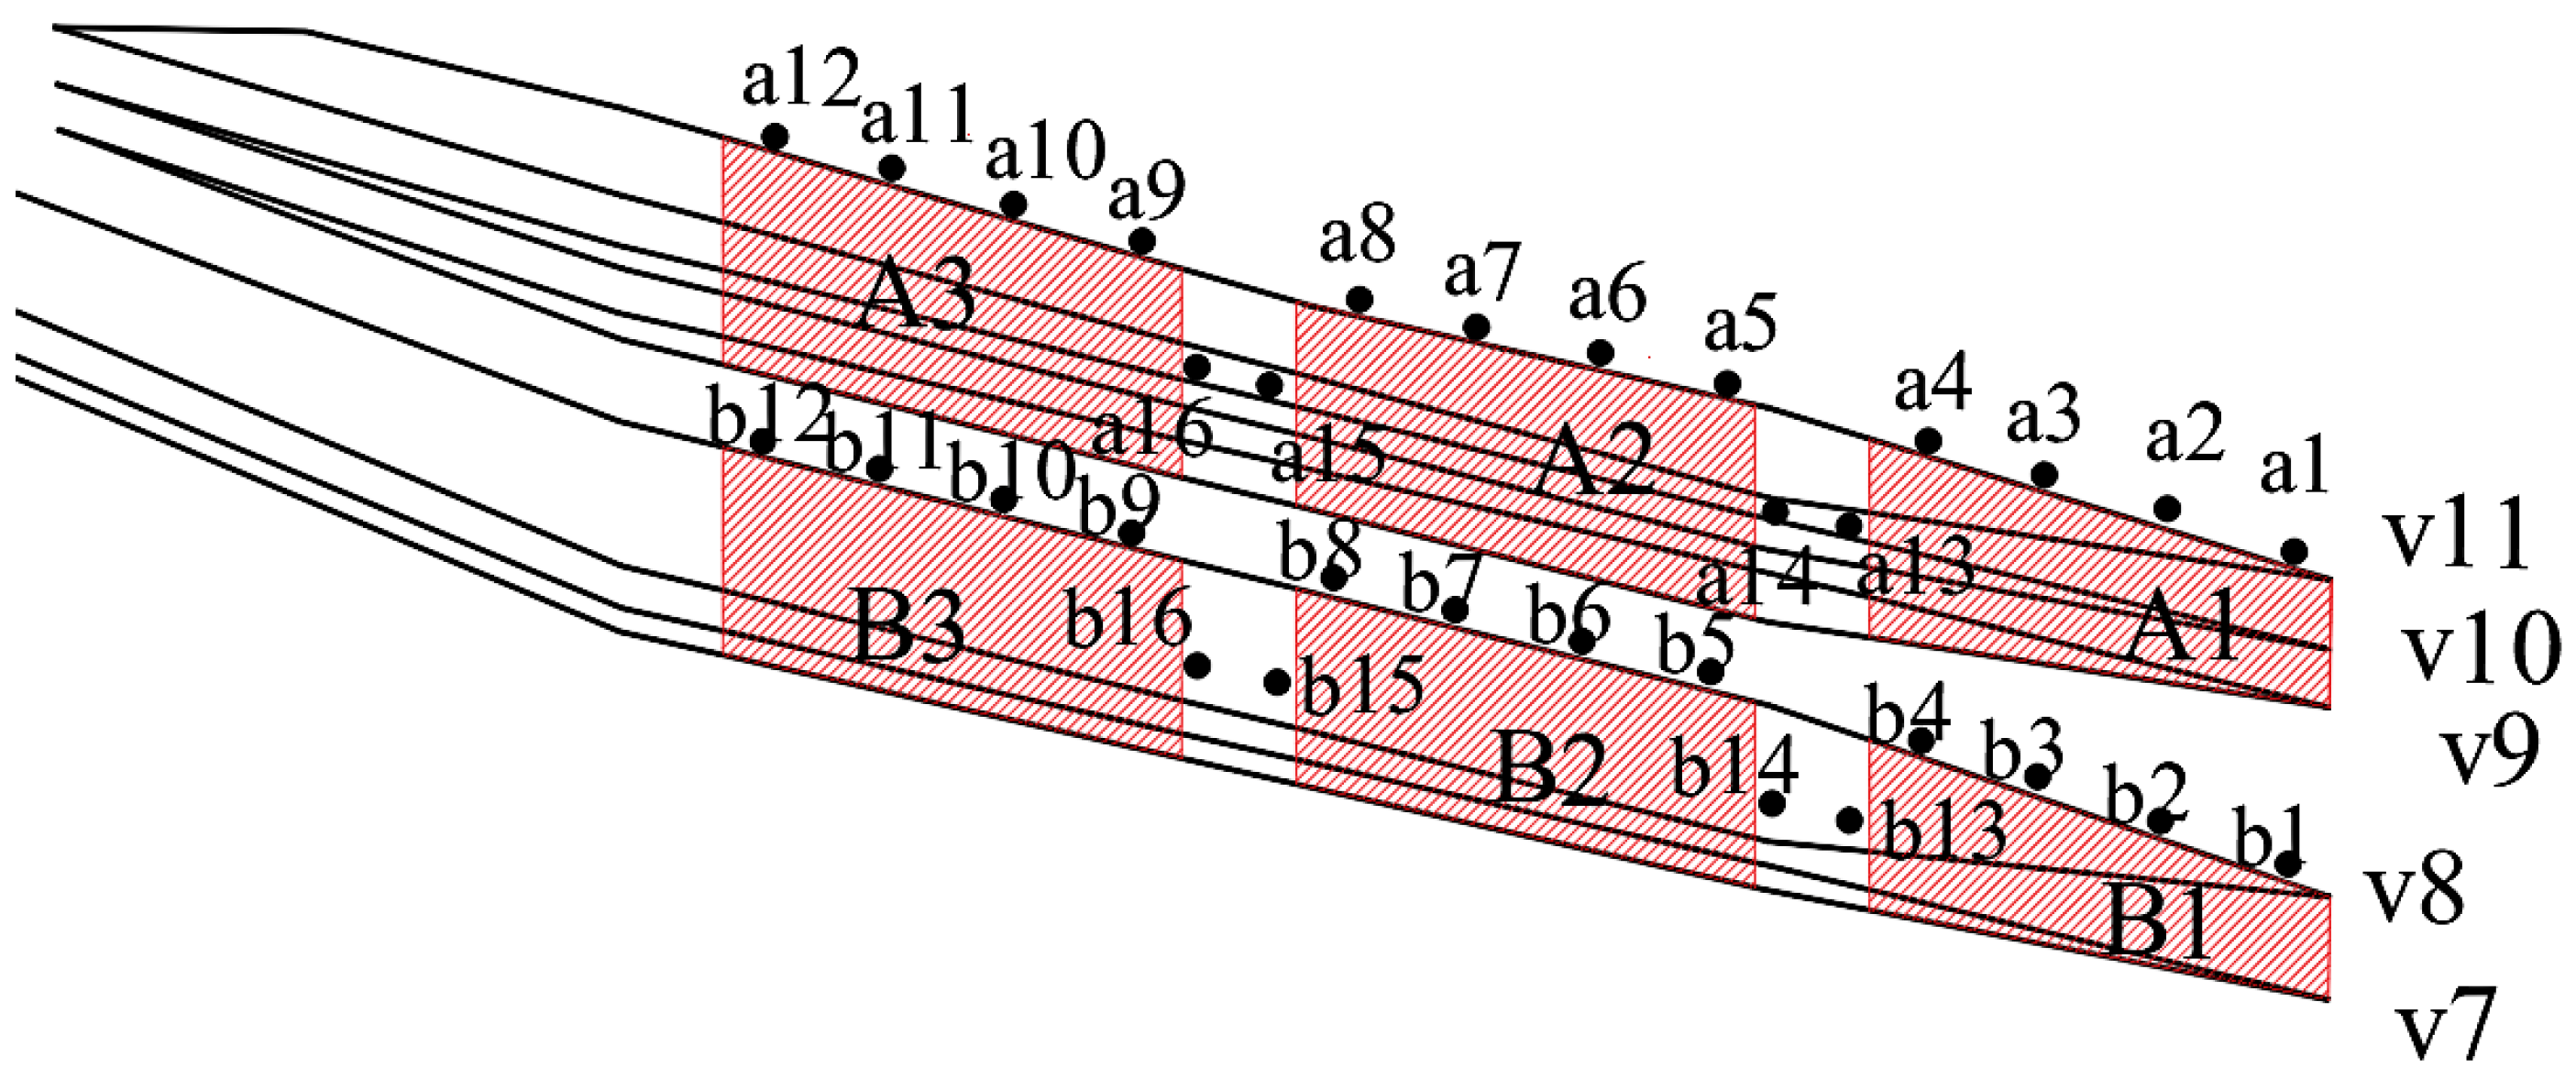
4.2.1. Arrangement of Strain Gages

Before the formal experiment, the strain meter was connected to the computer with a dynamic signal acquisition and analysis system. Then, strain gages were connected to the system to measure the strain changes during the compression of the rock specimen shown in Figure 17. The results showed that the strain values were consistent with the results measured by the calibrated traction gauges and the measurement accuracy met the experimental requirements.
Before the excavation in the model after sufficient maintenance, strain gages should be mounted on specified monitoring points. The monitoring points were fixed using glue at 5 mm from the inner edge of the roofs of the stopes and the pillars, as shown in Figure 18.

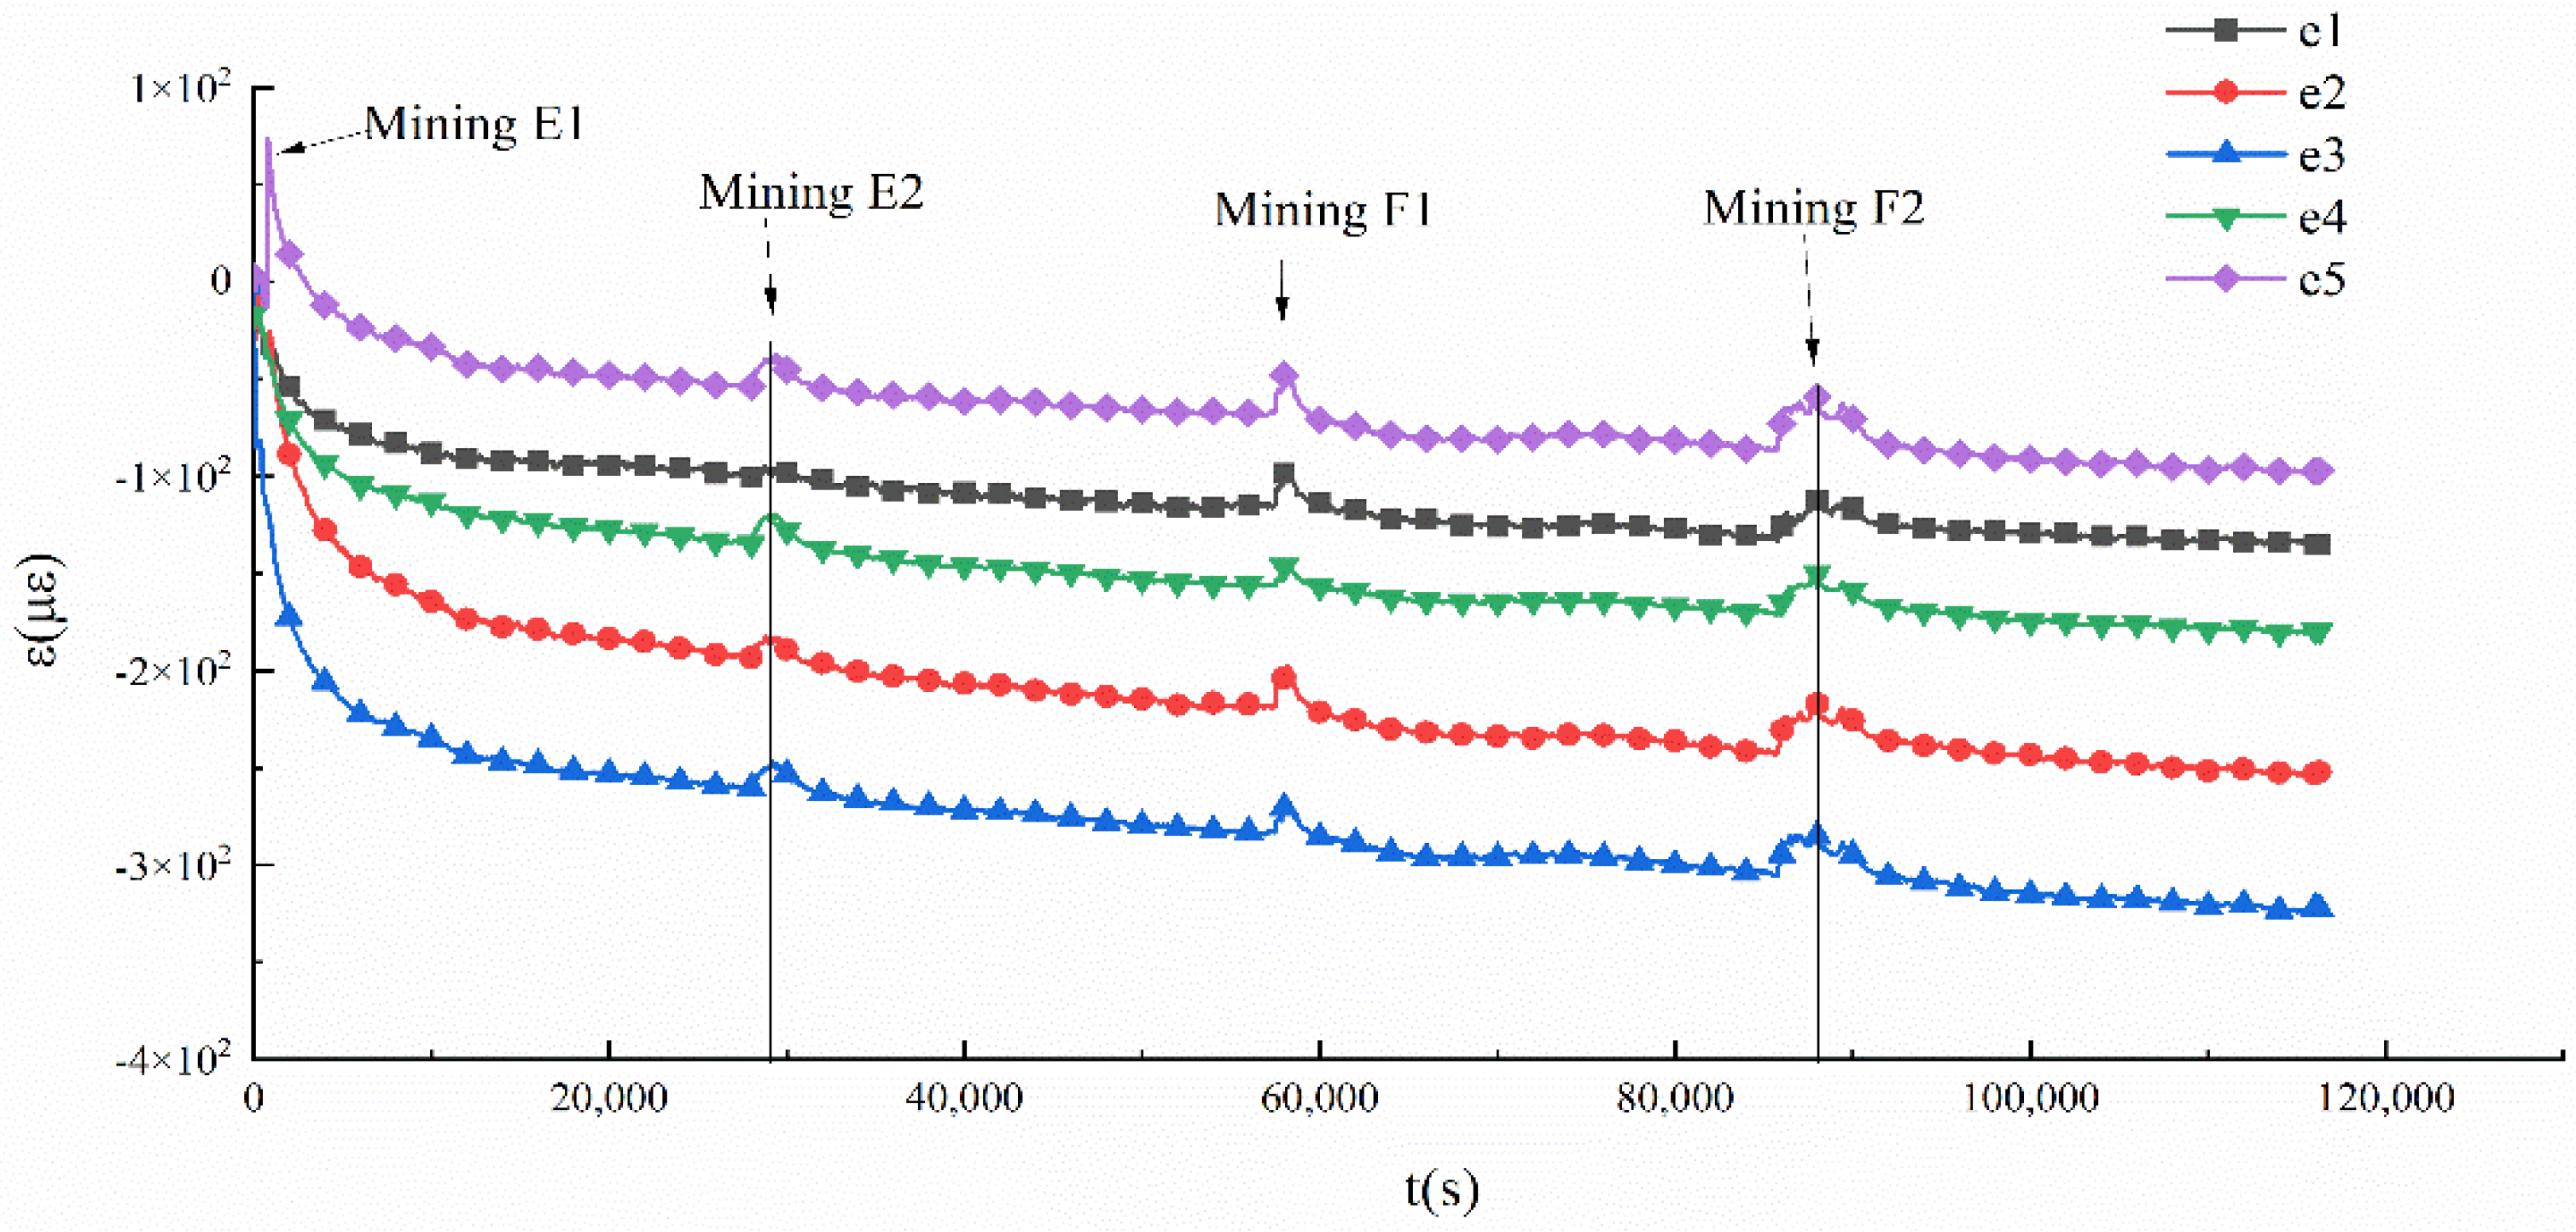
4.2.2. Similarity Experiment 1: Excavation of Double-Layer Ore Body without Support

The first experiment was conducted to find out the distributions of strains without any support when excavating two adjacent ore layers. In Figure 19, the layers of v4 and v5 were combined as one layer, and the stopes were numbered as E1 and E2. Similarly, the two stopes of ore layer v3 were numbered F1 and F2. Thus, totally four 20 cm wide stopes were mined with 5 cm wide pillars. Five strain gages were pasted at equal distances on the roof of each stope, and one strain gage was pasted on each side of each pillar. A total of 24 strain gages were numbered e1-12 and f1-12, respectively. Then, the four stopes were mined in the sequence of E1-E2-F1-F2. The data collection frequency was 1 time/s, and the interval of excavation was 8 h (Figure 20).

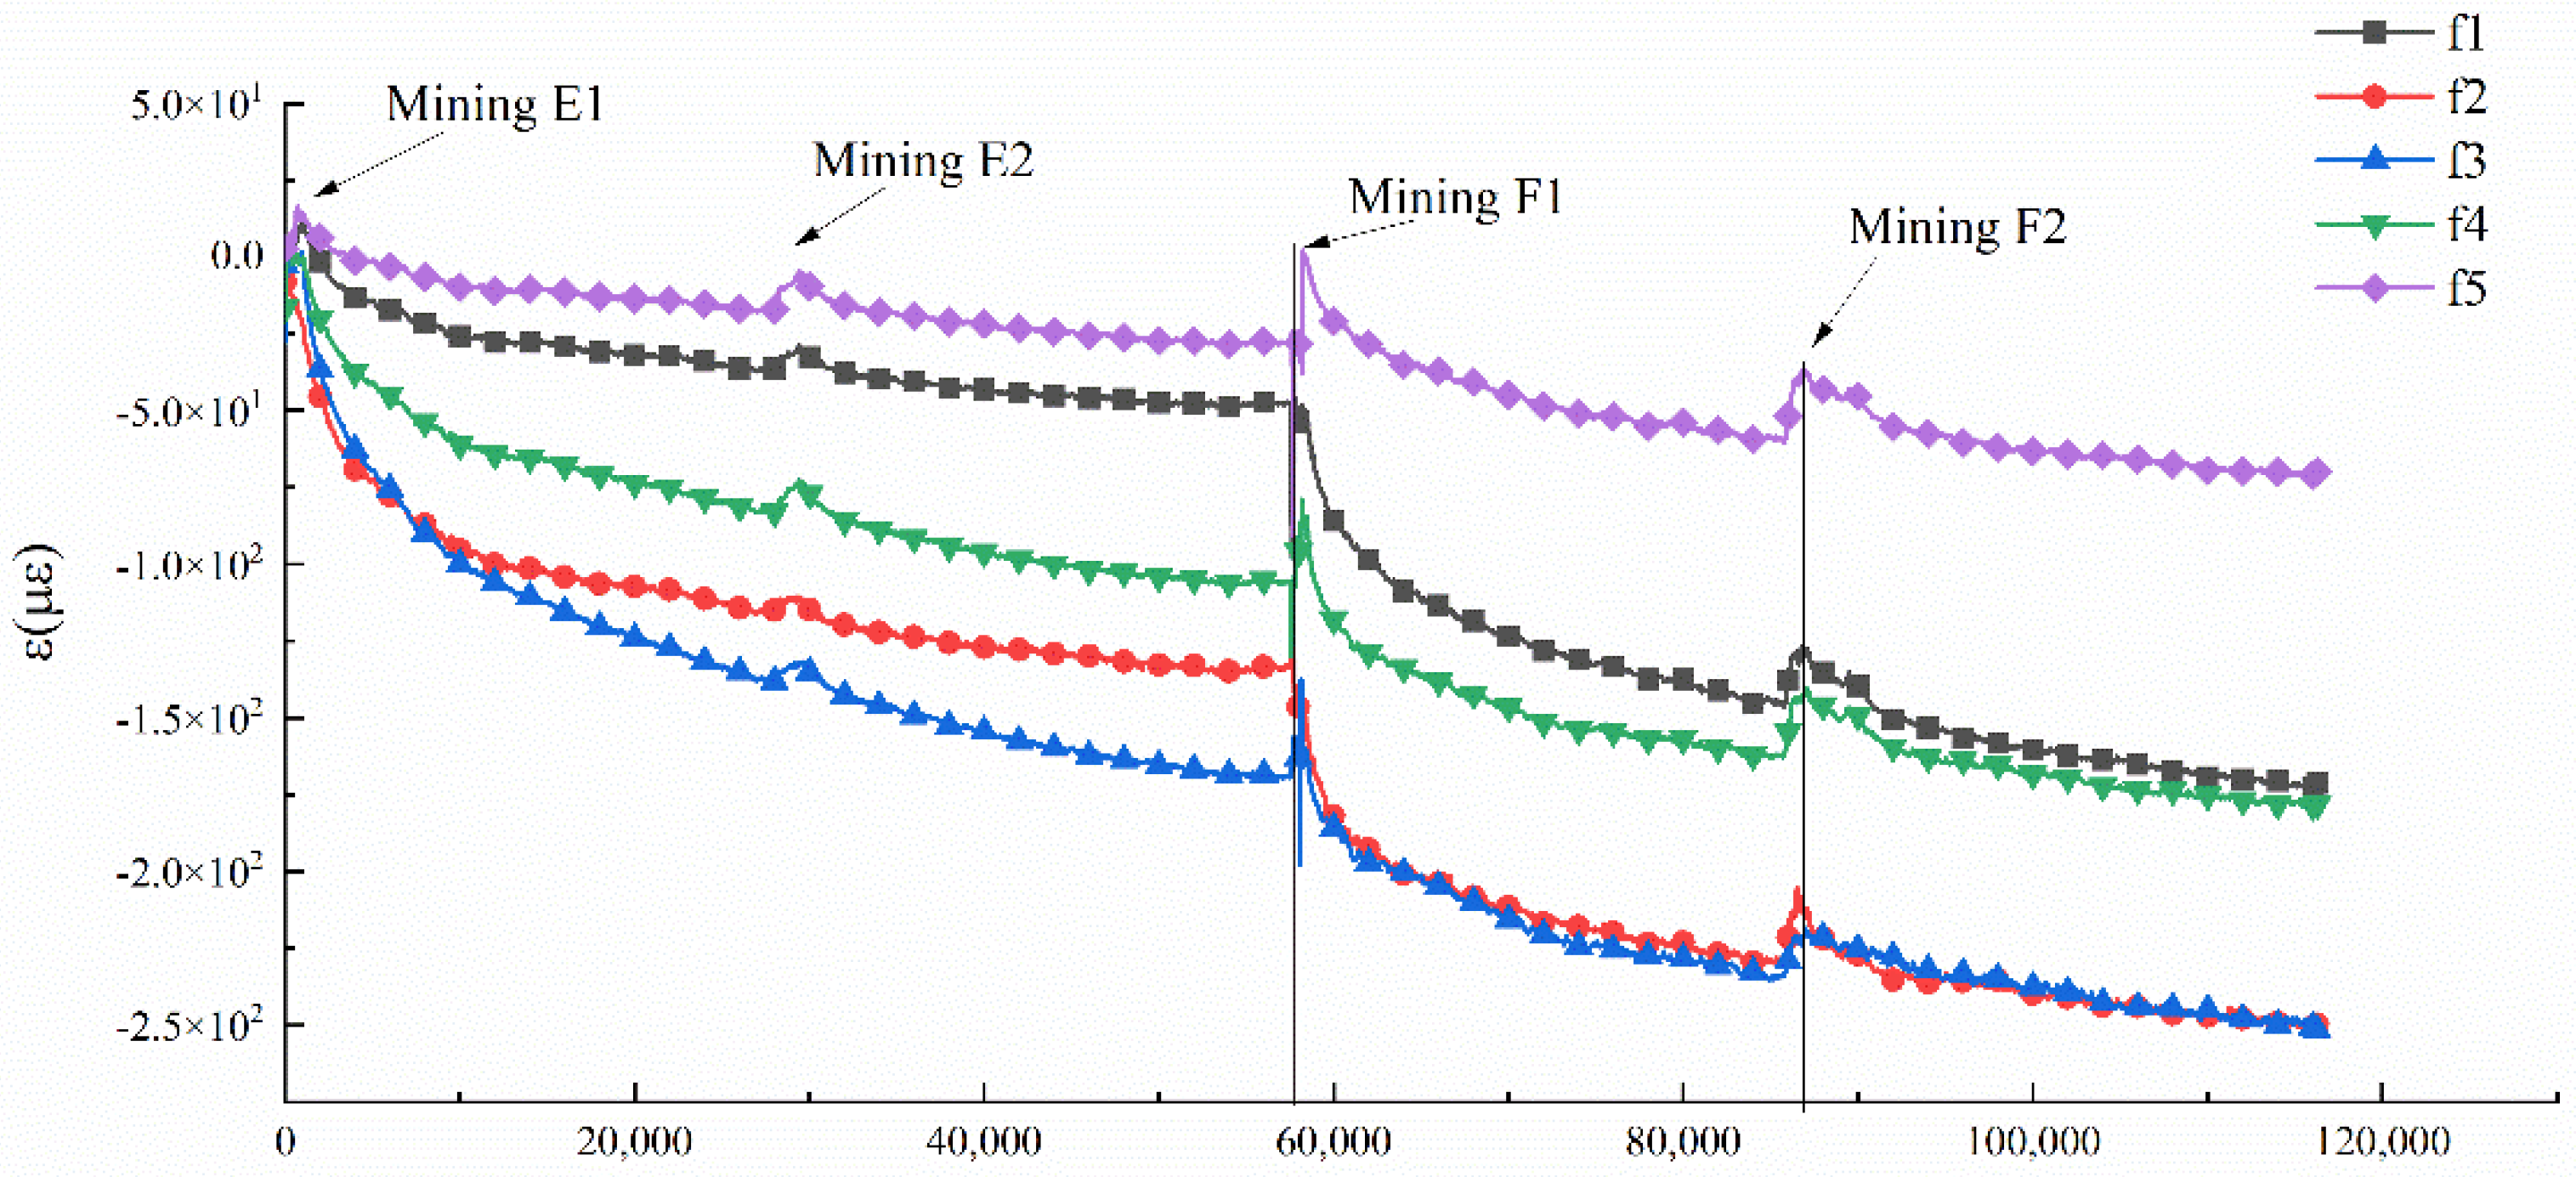
4.2.3. Similarity Experiment 2: Excavation of Double-Layer Ore Body with Support

To simulate different support scenarios, another experiment was carried out. In this experiment, three stopes A1, A2, and A3 were set up for the combined ore layer of v9, v10, and v11 ore bodies, and three stopes rooms B1, B2, and B3 were set up for the combined ore layer of v7 and v8 ore bodies. A1-A3 and B1-B3 stopes completely overlapped in vertical direction, with a width of 20 cm and a width of 5 cm for the pillar. There were totally 32 strain gages, numbered a1-16 and b1-16, for strain measurement, with four strain gages attached to the roof of each stope, and one strain gage pasted on each side of each pillar (shown in Figure 21).
As is shown in Figure 22, stopes A1, A2, and A3 were mined in turn. After two hours of resting, the A1 stope was supported by the bolt-filling support method, the A2 stope was supported only by filling, and the A3 stope was not supported. For the bolt-filling support, two sections of steel wire were inserted as rock bolts into the roof and floor of the goaf and fixed with glue. Then the two sections of steel wire were connected with soft ropes which was used as cable bolts. The excess soft ropes were connected with each other to form a network of rock bolts (cables). Finally, the same backfill was injected into the goaf as in the A2 goaf (shown in Figure 23). After completing the support of A1 and A2 goafs, the excavation of B1, B2, and B3 stopes were continued, and the strain values of the monitoring points were recorded in real time at a frequency of one time per second.

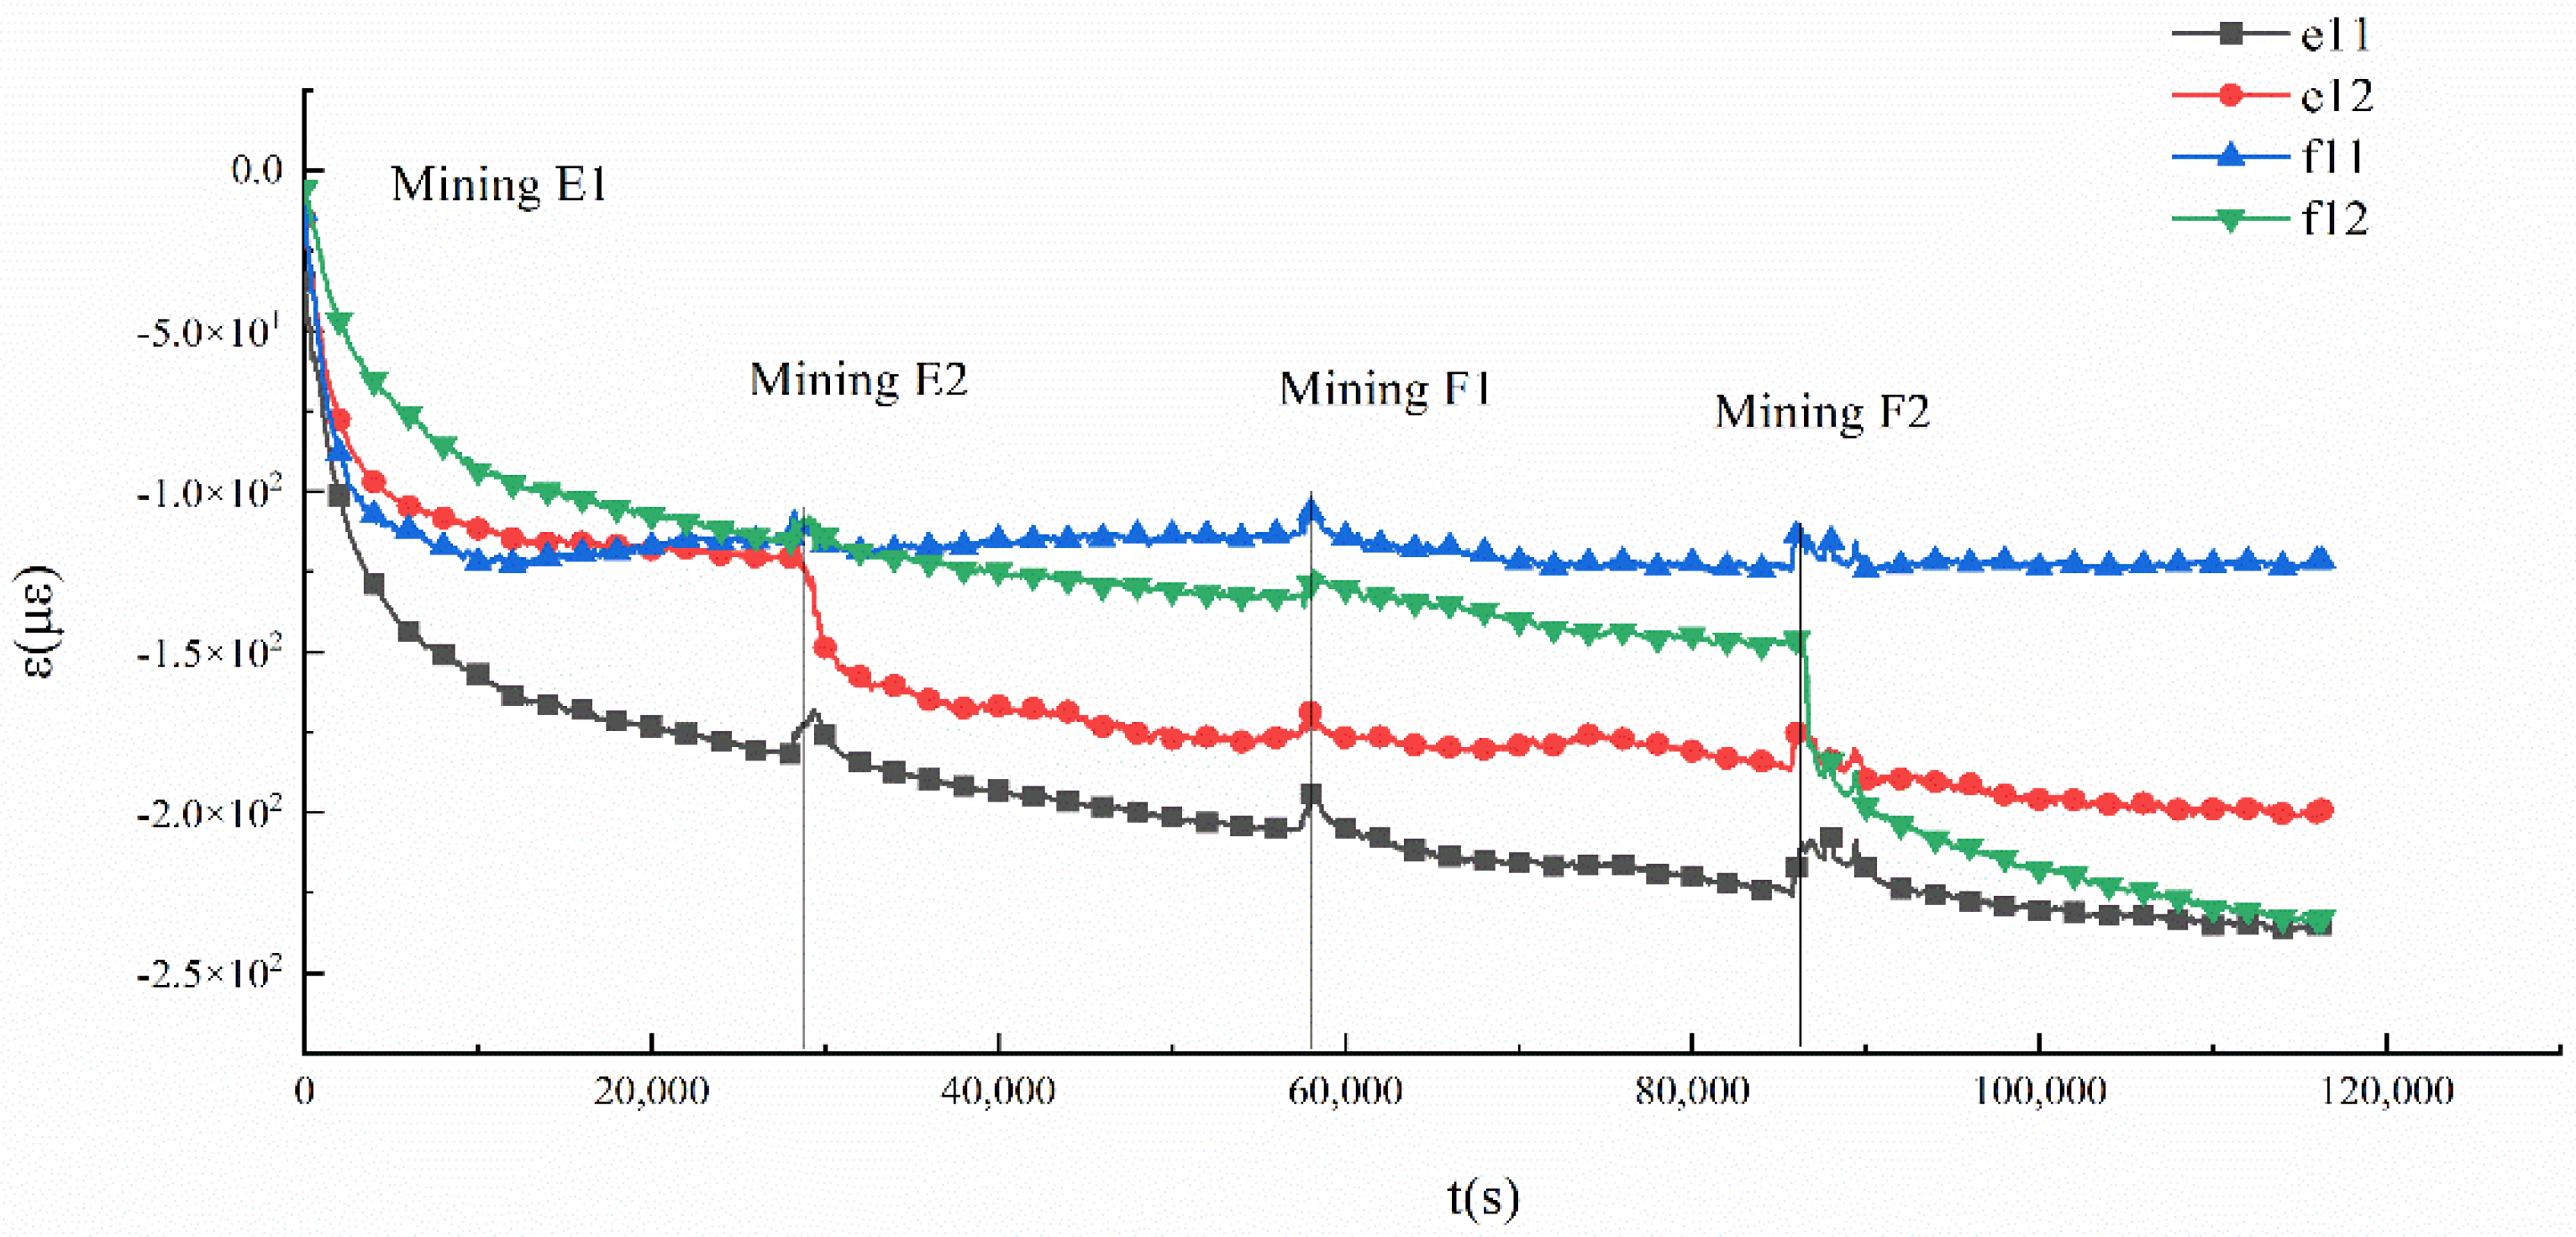
4.3. Experiment Results

4.3.1. Results of Experiment 1

The results from experiment 1 can reveal the change law of strains in the stope roofs and the interlayer. Taking stope E1 and F1 as the observation objects, Figure 24 and Figure 25 show the strain–time curves of five monitoring points of E1 and F1 roof.
The strains (e1–e5) of E1 roof increase rapidly after mining E1, and the strain values fluctuate shortly during the mining of other ore bodies and then increase slowly, and the growth rate remains stable. Note that the strains at each monitoring point are e3, e2, e4, e5, and e1, in descending order, and the maximum strain value of 3.24 × 10⁻⁴ is in the middle of the stope at monitoring point e3. This phenomenon agrees with the simulation results in Figure 9c, where the force chains are denser in the middle of the roof. The results show that the strain value in the middle of the roof of the stope is larger than the strain values on both sides, and it gradually increases by the influence of mining in adjacent stopes. Similar as E1, the strain of each monitoring point (f1–f5) of the F1 roof (indeed the interlayer between E1 and F1) also increases rapidly after the mining of E1, and fluctuates shortly during the mining of E2, and then increase slowly. After completing the mining of F1, the strain of each point increases sharply again, and the increase fall back again when mining F2. The strains at each monitoring point are f3, f2, f4, f5, and f1 in descending order, and the maximum strain value of 2.52 × 10⁻⁴ also appears at monitoring point f3 in the middle of the stope.
The peak strain at the roof of the upper stope is higher than that at the roof of the lower stope (interlayer) in the double-layer mining, which reveals that the interlayer is comprehensively influenced by the mining of the upper and lower stopes. Without loss of generality, if the roof of a stope is simplified as a simply supported beam, the interlayer between two goafs will only endure the load from its own weight, while the roof of the upper stope has to bear the load due to the weight of the overburden rock. It is this situation that leads to higher tensile strains in the roof of the upper stope than in the interlayer, which coincides with the distribution of the force chains in Figure 9c where the force chains are less dense in the interlayer than in the roof of the upper stope. This observation is also similar to the stress comparison between the roof of upper goaf and the interlayer in a stability study of low-grade backfill [46].
The strains on the pillars also follow similar trends as E1 and F1. In general, the largest strain is produced on the side wall of the stope after mining, and the strain value decreases from the side wall to the inner surrounding rock (shown in Figure 26). After E1 mining, different degrees of strain are generated at each monitoring point. The strain at e11 closest to E1 stope is the largest, and the strain at furthest f12 point is the smallest. After E2 is mined, the upper pillar is completely formed. At this time, the strain at e12 monitoring point close to E2 stope increases rapidly to a value slightly less than e11. Similarly, f11 should produce a large strain after the mining of F1 stope, and f12 should produce a large strain after the mining of F2 stope. However, only the train change trend at f12 meets the expectation, while the monitored strain at f11 remains the same with only slight fluctuations. The reason may be that damage may have happened at f11 after F1 is mined, which makes this part of rock cannot produce further deformation. It is possible for this situation to happen just like the fractures produced at the pillars in the simulation in Figure 9b.

4.3.2. Results of Experiment 2

Now that the larges strain appears in the middle of the roof, the monitoring points a2, a6, and a10 at the roof of the upper stope and b2, b6, and b10 at the roof of the lower stope are selected as the observation objects. A set of strain data is selected every 40 s to draw the strain, as shown in Figure 27. It can be seen from Figure 27 that all six monitoring points are deformed after the upper ore body is mined, and the strains at the same layer are almost the same. The strains of the upper monitoring points and lower monitoring points are stable at about −3.85 × 10⁻⁴ and 2.60 × 10⁻⁴, respectively. That is, the deformation of the roof of the upper goaf is greater than that of the floor. During the filling process, the deformation of the roof and floor is slightly reset due to disturbance, while the strain value of the unfilled goaf remains unchanged. After the lower ore body is mined, the strain values of all the monitoring points further increase, and the strain values of points a2, a6 and a10 are still greater than those of points b2, b6 and b10. The support methods influence the final strains obviously if we observe A1 and B1, A2 and B2 and A3 and B3 in pairs. The monitoring points a2 (roof of A1) and b2 (roof of B1 in interlayer) are corresponding to the bolt-filling support, and they have the smallest strains which are 4.03 × 10⁻⁴ and 3.02 × 10⁻⁴, respectively. The monitoring points a6 (roof of A2) and b6 (roof of B2 in interlayer) are corresponding to the conventional filling support, and they have the second smallest strains which are 4.61 × 10⁻⁴ and 3.31 × 10⁻⁴, respectively. The strains of a10 (roof of A3) and b10 (roof of B3 in interlayer) without support measures are the largest, which are 5.37 × 10⁻⁴ and 7.73 × 10⁻⁴, respectively. The smallest deformation proves that the support effect of bolt-filling support is better than that of pure filling support. The experiment results agree with the fracture and force chain analysis in Figure 9,Figure 11, and Figure 12 very well.

5. Discussion

The multilayer goaf is composed of large-scale layered weak rock mass structure, and the unstable rock strata in the middle, especially the interlayer of two goafs, cannot be anchored to the stable rock mass. The traditional support method has not only poor effect on such ore bodies but also high cost, which makes it not suitable for large-scale mining of closely spaced multilayer ore bodies. The new support method, bolt-filling support, has been proposed to solve the above problems. Its effectiveness in mining closely spaced multilayer orebodies has been analyzed by numerical simulation and similarity experiments. Indeed, the effect of bolt-filling support is also related to the rock bolt density, backfill material, filling rate, surrounding rock properties, etc. However, the effect of these factors on bolt-filling support is beyond the scope of this research, which is mainly focused on the comparison of deformation and mechanics between the bolt-filling and other support option. Analysis of those factors will be conducted next step in future research, so that to formulate a reasonable method of matching rock bolt density and filling parameters, and optimize the synergy between them, which finally leads to a good support effect and reduction in material loss at the same time.
From an application perspective, the proposed bolt-filling support method can be used to improve the stability of closely spaced multilayer goafs and make up for the shortage of purely filling support, which further improves the safety and efficiency of multilayered mining in vanadium shale ore and increases the revenue of the enterprise.

6. Conclusions

All the above numerical and experimental analysis contributes to the following conclusions:
(1)
A novel bolt-filling support method is proposed in this research.
(2)
It is revealed that, by numerical simulation of fracture distribution and force chains, bolt-filling support not only reduces the roof load of the lower goaf, but also helps to relieve the tensile stress concentration in the roof of the upper goaf caused by incomplete filling, which is effective for the support of closely spaced multilayer goaf.
(3)
It is found that, by similarity experiments, the deformation of the roof and interlayer under bolt-filling support is the smallest, which has a high consistency with the numerical simulation results.
(4)
Therefore, it is safe to say that the bolt-filling support performs better than other conventional support methods for mining closely spaced multilayer orebodies, so that to promote mining safety and the stability of the roof and interlayer.

7. Patents

Chi, X.; Wang, Z. Bolt-filling support method and system for multilayer close ore bodies. 202111636192.1.
Chi, X.; Xie, Y.; Wang, Z. A similar simulated vibration experiment device with adjustable volume. 202111495829.X.

Author Contributions

Conceptualization, X.C.; Data curation, Z.W.; Formal analysis, Z.Z. and Z.W.; Funding acquisition, X.C. and Q.W.; Investigation, H.D.; Methodology, X.C. and Q.W.; Resources, X.C.; Supervision, X.C.; Validation, Z.Z. and Y.X.; Writing—original draft, Z.Z.; Writing—review and editing, L.L. All authors have read and agreed to the published version of the manuscript.

Funding

This research was funded by the National Natural Science Foundation of China (Grant No.51874218).

Data Availability Statement

Not applicable.

Acknowledgments

Thanks to the relevant departments for funding and the mining companies that provided the experiment.

Conflicts of Interest

The authors declare no conflict of interest.

References

  1. Li, A. Caving spacing study for the flat inclined layered ore-body by mathews method. China Min. Mag. 2007, 16, 67–69. [Google Scholar]
  2. Merad, M.M.; Verdel, T.; Roy, B.; Kouniali, S. Use of multi-criteria decision-aids for risk zoning and management of large area subjected to mining-induced hazards. Tunn. Undergr. Space Technol. 2004, 19, 125–138. [Google Scholar]
  3. Yan, B.; Wang, P.; Ren, F.; Guo, Q.; Cai, M. A Review of Mechanical Properties and Constitutive Theory of Rock Mass Anisotropy. Arab. J. Geosci. 2020, 13, 487. [Google Scholar]
  4. Burtan, Z.; Chlebowski, D. The Effect of Mining Remnants on Elastic Strain Energy Arising in the Tremor-Inducing Layer. Energies 2022, 15, 6031. [Google Scholar]
  5. Zhang, C.; Wang, Y.; Ruan, H.; Ke, B.; Lin, H. The Strain Characteristics and Corresponding Model of Rock Materials under Uniaxial Cyclic Load/Unload Compression and Their Deformation and Fatigue Damage Analysis. Arch. Appl. Mech. 2021, 91, 2481–2496. [Google Scholar]
  6. Cai, W.; Dou, L.; Ju, Y.; Cao, W.; Yuan, S.; Si, G. A Plastic Strain-Based Damage Model for Heterogeneous Coal Using Cohesion and Dilation Angle. Int. J. Rock Mech. Min. Sci. 2018, 110, 151–160. [Google Scholar]
  7. Zhao, Y.; Zhang, L.; Wang, W.; Wan, W.; Ma, W. Separation of elastoviscoplastic strains of rock and a nonlinear creep model. Int. J. Geomech. 2018, 18, 04017129. [Google Scholar]
  8. Zhang, C.; Wang, Y.; Jiang, T. The Propagation Mechanism of an Oblique Straight Crack in a Rock Sample and the Effect of Osmotic Pressure under In-Plane Biaxial Compression. Arab. J. Geosci. 2020, 13, 736. [Google Scholar]
  9. Al-Shayea, N.A. Crack Propagation Trajectories for Rocks under Mixed Mode I–II Fracture. Eng. Geol. 2005, 81, 84–97. [Google Scholar]
  10. Zhao, Y.; Zhang, L.; Liao, J.; Wang, W.; Liu, Q.; Tang, L. Experimental study of fracture toughness and subcritical crack growth of three rocks under different environments. Int. J. Geomech. 2020, 20, 04020128. [Google Scholar]
  11. Yang, H.; Lin, H.; Chen, Y.; Wang, Y.; Zhao, Y.; Yong, W.; Gao, F. Influence of Wing Crack Propagation on the Failure Process and Strength of Fractured Specimens. Bull. Eng. Geol. Environ. 2022, 81, 71. [Google Scholar]
  12. Gontarz, J.; Podgórski, J. Numerical Analysis of Crack Propagation in a Pull-out Test. MATEC Web Conf. 2019, 252, 08001. [Google Scholar]
  13. Sher, E.N. Numerical Evaluation of Wedge Penetration Resistance in Brittle Rock Mass with Regard to Equilibrium Propagation of Main Crack. J. Min. Sci. 2021, 57, 955–964. [Google Scholar]
  14. Yang, H.; Lin, H.; Wang, Y.; Cao, R.; Li, J.; Zhao, Y. Investigation of the Correlation between Crack Propagation Process and the Peak Strength for the Specimen Containing a Single Pre-Existing Flaw Made of Rock-like Material. Arch. Civ. Mech. Eng. 2021, 21, 68. [Google Scholar]
  15. Lin, H.; Yang, H.; Wang, Y.; Zhao, Y.; Cao, R. Determination of the Stress Field and Crack Initiation Angle of an Open Flaw Tip under Uniaxial Compression. Theor. Appl. Fract. Mech. 2019, 104, 102358. [Google Scholar]
  16. Zhao, Y.; Wang, Y.; Wang, W.; Tang, L.; Liu, Q.; Cheng, G. Modeling of Rheological Fracture Behavior of Rock Cracks Subjected to Hydraulic Pressure and Far Field Stresses. Theor. Appl. Fract. Mech. 2019, 101, 59–66. [Google Scholar]
  17. Wang, Y.; Zhang, H.; Lin, H.; Zhao, Y.; Liu, Y. Fracture Behaviour of Central-Flawed Rock Plate under Uniaxial Compression. Theor. Appl. Fract. Mech. 2020, 106, 102503. [Google Scholar]
  18. Li, X.; Peng, J.; Xie, Y.; Li, Q.; Zhou, T.; Wang, J.; Zheng, W. Influence of High-Temperature Treatment on Strength and Failure Behaviors of a Quartz-Rich Sandstone under True Triaxial Condition. Lithosphere 2022, 2022, 3086647. [Google Scholar]
  19. Zhang, S.; Lin, H.; Chen, Y.; Wang, Y.; Zhao, Y. Acoustic Emission and Failure Characteristics of Cracked Rock under Freezing-Thawing and Shearing. Theor. Appl. Fract. Mech. 2022, 121, 103537. [Google Scholar]
  20. Jonak, J.; Siegmund, M.; Karpiński, R.; Wójcik, A. Three-Dimensional Finite Element Analysis of the Undercut Anchor Group Effect in Rock Cone Failure. Materials 2020, 13, 1332. [Google Scholar]
  21. Zhao, Y.; Zhao, G.; Zhou, J.; Ma, J.; Cai, X. Failure mechanism analysis of rock in particle discrete element method simulation based on moment tensors. Comput. Geotech. 2021, 136, 104215. [Google Scholar]
  22. Ghorbani, M.; Shahriar, K.; Sharifzadeh, M.; Masoudi, R.A. Critical Review on the Developments of Rock Support Systems in High Stress Ground Conditions. Int. J. Min. Sci. Technol. 2020, 30, 555–572. [Google Scholar]
  23. Yasuda, N. An Analytical Model for Ground Support by Bolting. Int. J. Numer. Anal. Methods Geomech. 2022, 46, 3425–3441. [Google Scholar]
  24. Wu, K.; Shao, Z.; Li, C.; Qin, S. Theoretical Investigation to the Effect of Bolt Reinforcement on Tunnel Viscoelastic Behavior. Arab. J. Sci. Eng. 2020, 45, 3707–3718. [Google Scholar]
  25. Herezy, Ł.; Korzeniowski, W.; Skrzypkowski, K. Laboratory Method for Evaluating the Characteristics of Expansion Rock Bolts Subjected to Axial Tension. Arch. Min. Sci. 2015, 1, 209–224. [Google Scholar]
  26. Haile, A.T.; Le Bron, K. Simulated Rockburst Experiment—Evaluation of Rock Bolt Reinforcement Performance. J. S. Afr. Inst. Min. Metall. 2001, 101, 247–251. [Google Scholar]
  27. Zakharov, V.N.; Trofimov, V.A.; Filippov, Y.A. Numerical Modeling of Rock Bolt Support in Case of Rheological Behavior of Rock Mass in Deformation. J. Min. Sci. 2021, 57, 883–893. [Google Scholar]
  28. Boon, C.W. Study of Reinforcement Support Mechanisms for Wide-Span Horse-Shoe-Shaped Openings in Horizontally Layered Jointed Rock Using the Distinct Element Method. Rock Mech. Rock Eng. 2019, 52, 1179–1191. [Google Scholar]
  29. Nguyen, T.; Ghabraie, K.; Tran-Cong, T. Simultaneous Pattern and Size Optimisation of Rock Bolts for Underground Excavations. Comput. Geotech. 2015, 66, 264–277. [Google Scholar]
  30. Zhang, C.; Pu, C.; Cao, R.; Jiang, T.; Huang, G. The Stability and Roof-Support Optimization of Roadways Passing through Unfavorable Geological Bodies Using Advanced Detection and Monitoring Methods, among Others, in the Sanmenxia Bauxite Mine in China’s Henan Province. Bull. Eng. Geol. Environ. 2019, 78, 5087–5099. [Google Scholar]
  31. Ito, F.; Nakahara, F.; Kawano, R.; Kang, S.-S.; Obara, Y. Visualization of Failure in a Pull-out Test of Cable Bolts Using X-Ray CT. Constr. Build. Mater. 2001, 15, 263–270. [Google Scholar]
  32. Tahmasebinia, F.; Zhang, C.; Canbulat, I.; Vardar, O.; Saydam, S. Numerical and Analytical Simulation of the Structural Behaviour of Fully Grouted Cable Bolts under Impulsive Loading. Int. J. Min. Sci. Technol. 2018, 28, 807–811. [Google Scholar]
  33. Singh, S.K.; Raval, S.; Banerjee, B. A Robust Approach to Identify Roof Bolts in 3D Point Cloud Data Captured from a Mobile Laser Scanner. Int. J. Min. Sci. Technol. 2021, 31, 303–312. [Google Scholar]
  34. Sui, Q.; He, M.; He, P.; Xia, M.; Tao, Z. State of the Art Review of the Large Deformation Rock Bolts. Undergr. Space 2022, 7, 465–482. [Google Scholar]
  35. Lv, W.Y.; Zhang, Z.H. Current Situation and Prospect of Coal Backfill Mining Technology. Adv. Mater. Res. 2012, 524, 421–425. [Google Scholar]
  36. Bazaluk, O.; Petlovanyi, M.; Lozynskyi, V.; Zubko, S.; Sai, K.; Saik, P. Sustainable Underground Iron Ore Mining in Ukraine with Backfilling Worked-Out Area. Sustainability 2021, 13, 834. [Google Scholar]
  37. Seryakov, V.M. Stress Determination in Rock Mass with Regard to Sequence of Deep-Level Cut-and-Fill. J. Min. Sci. 2021, 57, 894–900. [Google Scholar]
  38. Yang, K.; Zhao, X.; Wei, Z.; Zhang, J. Development Overview of Paste Backfill Technology in China’s Coal Mines: A Review. Environ. Sci. Pollut. Res. 2021, 28, 67957–67969. [Google Scholar]
  39. Yin, S.; Shao, Y.; Wu, A.; Wang, H.; Liu, X.; Wang, Y. A Systematic Review of Paste Technology in Metal Mines for Cleaner Production in China. J. Clean. Prod. 2020, 247, 119590. [Google Scholar]
  40. Benzaazoua, M.; Fall, M.; Belem, T. A contribution to understanding the hardening process of cemented pastefill. Miner. Eng. 2004, 17, 141–152. [Google Scholar]
  41. Raffaldi, M.J.; Seymour, J.B.; Richardson, J.; Zahl, E.; Board, M. Cemented Paste Backfill Geomechanics at a Narrow-Vein Underhand Cut-and-Fill Mine. Rock Mech. Rock Eng. 2019, 52, 4925–4940. [Google Scholar]
  42. Belem, T.; Benzaazoua, M. Design and application of underground mine paste backfill technology. Geotech. Geol. Eng. 2008, 26, 147–174. [Google Scholar]
  43. Shaposhnik, Y.N.; Konurin, A.I.; Neverov, A.A.; Neverov, S.A.; Usol’tseva, O.M.; Shaposhnik, S.N. Validation of Friction-Anchored Rock Bolt Supports for Underground Excavations in Backfill. J. Min. Sci. 2021, 57, 775–786. [Google Scholar]
  44. Wuhan University of Technology. Bolt-Filling Support Method and System for Closely Spaced Multiplayer Orebody. CN114294032A, 4 August 2022.
  45. Chi, X.; Xie, Y.; Chen, D.; Wang, Z.; Deng, X.; Zhao, L. Study on Meso-Parameter Calibration and Roof Fracture Law of Vanadium-Bearing Shale Ore. Min. Res. Dev. 2022, in press. [Google Scholar]
  46. Chen, Q.; Zhou, K. Action mechanism of low-grade backfill on stability of mining environment structure. Rock Soil Mech. 2010, 31, 2811–2816. [Google Scholar]
Figure 1. Demonstration of the bolt-filling support system. (a) Schematic diagram of bolt-filling support; (b) Longitudinal section of drill hole arrangement for closely spaced multilayer orebodies; (c) Cross-sectional view of drill hole arrangement for closely spaced multilayer orebodies; (d) Longitudinal section of bolt-filling support system for closely spaced multilayer orebodies; (e) Top view of cable bolt network. 1—Surrounding rock, 2—Roof hole, 3—Goaf, 4—Floor hole, 5—Rock bolt, 6—Cable bolt, 7—Pre-loop, 8—Cable bolt network, 9—Backfill, 10—Ore body, 11—Ore pile.
Minerals 12 01523 g001aMinerals 12 01523 g001b
Figure 2. Correlation between Poisson’s ratio and stiffness ratio and friction coefficient. (a) Relationship between stiffness ratio k n / k s and Poisson’s ratio ν ; (b) Relationship between friction coefficient μ and Poisson’s ratio ν .
Minerals 12 01523 g002
Figure 3. Correlation between elastic modulus and effective modulus of contact, friction coefficient, and stiffness ratio. (a) Relationship between effective modulus of contact E c elastic modulus E ; (b) Relationship between square of friction coefficient μ 2 and elastic modulus E ; (c) Relationship between logarithm of stiffness ratio ln ( k n / k s ) and elastic modulus E .
Minerals 12 01523 g003
Figure 4. Correlation between uniaxial compressive strength and the tensile strength, cohesion of bonds, and friction coefficient. (a) Relationship between tensile strength   σ n and uniaxial compressive strength σ c ; (b) Relationship between cohesion of bonds c and uniaxial compressive strength   σ c ; (c) Relationship between friction coefficient μ and uniaxial compressive strength   σ c .
Minerals 12 01523 g004
Figure 5. Variation curve of rock’s tensile strength with cohesion and tensile strength of bonds. (a) σ t − c; (b) σ t σ n .
Minerals 12 01523 g005
Figure 6. Uniaxial compressive experiment of surrounding rock and ore. (a) Uniaxial compression experiment of carbonaceous shale; (b) Uniaxial compression experiment of Vanadium-bearing shale.
Minerals 12 01523 g006
Figure 7. Stress–strain curve of surrounding rock and ore (1—Simulation curve, 2—Test curve). (a) Surrounding rock; (b) ore.
Minerals 12 01523 g007
Figure 8. PFC2D numerical simulation model of double-layer ore.
Minerals 12 01523 g008
Figure 9. Mechanics simulation of surrounding rock without support. (a) No support in the upper goaf; (b) Distribution of fractures when the upper goaf is not supported; (c) Distribution of the force chains when the upper goaf is not supported.
Minerals 12 01523 g009
Figure 10. Mechanics simulation of surrounding rock with the upper goaf 100% filled. (a) Filling support in the upper goaf (100%); (b) Distribution of fractures when the upper goaf is 100% filled; (c) Distribution of the force chains when the upper goaf is 100% filled.
Minerals 12 01523 g010
Figure 11. Mechanics simulation of surrounding rock with the upper goaf 95% filled. (a) Filling support in the upper goaf (95%); (b) Distribution of fractures when the upper goaf is 95% filled; (c) Distribution of the force chains when the upper goaf is 95% filled.
Minerals 12 01523 g011
Figure 12. Mechanics simulation of surrounding rock with bolt-fill support. (a) Bolt-filling support in the upper goaf; (b) Distribution of fractures with upper bolt-filling support; (c) Distribution of the force chains with upper bolt-filling support.
Minerals 12 01523 g012
Figure 13. River sand screening.
Minerals 12 01523 g013
Figure 14. Specimen of similar material model.
Minerals 12 01523 g014
Figure 15. Similarity model plan.
Minerals 12 01523 g015
Figure 16. Model building process. (a) Paste the model background image; (b) Mixing materials; (c) Filling materials in layer; (d) Finished model.
Minerals 12 01523 g016
Figure 17. Pre-experimental system test.
Minerals 12 01523 g017
Figure 18. Sensor Installation. (a) Fixing strain gages; (b) Connecting strain gages to monitoring system.
Minerals 12 01523 g018aMinerals 12 01523 g018b
Figure 19. Layout of the stopes and monitoring points for the double-layer ore body mining experiment.
Minerals 12 01523 g019
Figure 20. Excavation process of experiment 1. (a) Excavation of E1; (b) Excavation of E2; (c) Excavation of F1; (d) Excavation of F2.
Minerals 12 01523 g020
Figure 21. Stope and monitoring point arrangement.
Minerals 12 01523 g021
Figure 22. Mining process of experiment 2. (a) Excavation of A1, A2, A3; (b) Excavation of B1, B2, B3 and support of A1, A2.
Minerals 12 01523 g022
Figure 23. Picture of bolt-filling support. (a) Similar experimental bolt-filling support diagram; (b) Rock bolt and cable bolt connection diagram.
Minerals 12 01523 g023
Figure 24. Strain-time curve of E1 stope roof.
Minerals 12 01523 g024
Figure 25. Strain-time curve of F1 stope roof (interlayer).
Minerals 12 01523 g025
Figure 26. Strain–time curve of the pillars.
Minerals 12 01523 g026
Figure 27. Strain–time curve of the roofs in experiment 2.
Minerals 12 01523 g027
Table 1. Macroscopic mechanical parameters of similar models.
RocksE (GPa) ν σ c   ( Pa ) σ t   ( MPa )
Ore1.090.221.330.23
Surrounding Rock1.480.202.350.30
Table 2. Microscopic parameters of particle of similar model.
Rocks σ n   ( Mpa ) C (Mpa)Ec (Gpa) μ k n / k s
Ore0.370.750.560.701.84
Surrounding Rock0.561.130.750.301.39
Table 3. Comprehensive comparison of support effects.
Support MethodNumber of FracturesFractures on the Roof of Upper GoafTensile Force Chains on the Roof of Upper GoafFractures on the Roof of Lower GoafTensile Force Chains on the Roof of Lower Goaf
Unsupported1311Extremely developedDenseExtremely developednot so dense
Complete filling (100%)379Not developedSparseDevelopeddense
Incomplete filling (95%)652Slightly developedNot sparseDevelopeddense
Bolt-filling support410Not developedSparseNot developedsparse
Table 4. Rock proportion numbers and properties.
Rock LayerDensity/(kg/m3)Compressive Strength/MPaModulus of Elasticity/GPaPoisson’s RatioProportion Number
Vanadium-bearing shale1661.740.510.390.21964
Carbonaceous shale1620.980.330.340.201037
Siliceous shale1704.410.750.400.21837
Backfill1232.390.02————1019
Table 5. Similarity model material dosage table.
Rock LayerVolume/m3Total amount/kgCement/kgGypsum/kgRiver Sand/kg
Vanadium-bearing shale0.119198.1911.30 7.53 169.45
Carbonaceous shale0.588953.1024.69 57.62 823.13
Siliceous shale1.2372107.9366.75 155.75 1780.03
Backfill0.01113.610.12 1.06 11.76
Total1.9553272.83102.86 221.96 2784.37
Preparation quantity2.3503927.40123.43 266.35 3341.24
Publisher’s Note: MDPI stays neutral with regard to jurisdictional claims in published maps and institutional affiliations.

