
Geological Constraints on the Genesis of Jagpura Au-Cu Deposit NW India: Implications from Magnetite-Apatite Mineral Chemistry, Fluid Inclusion and Sulfur Isotope Study
 ,
,
Abstract
1. Introduction
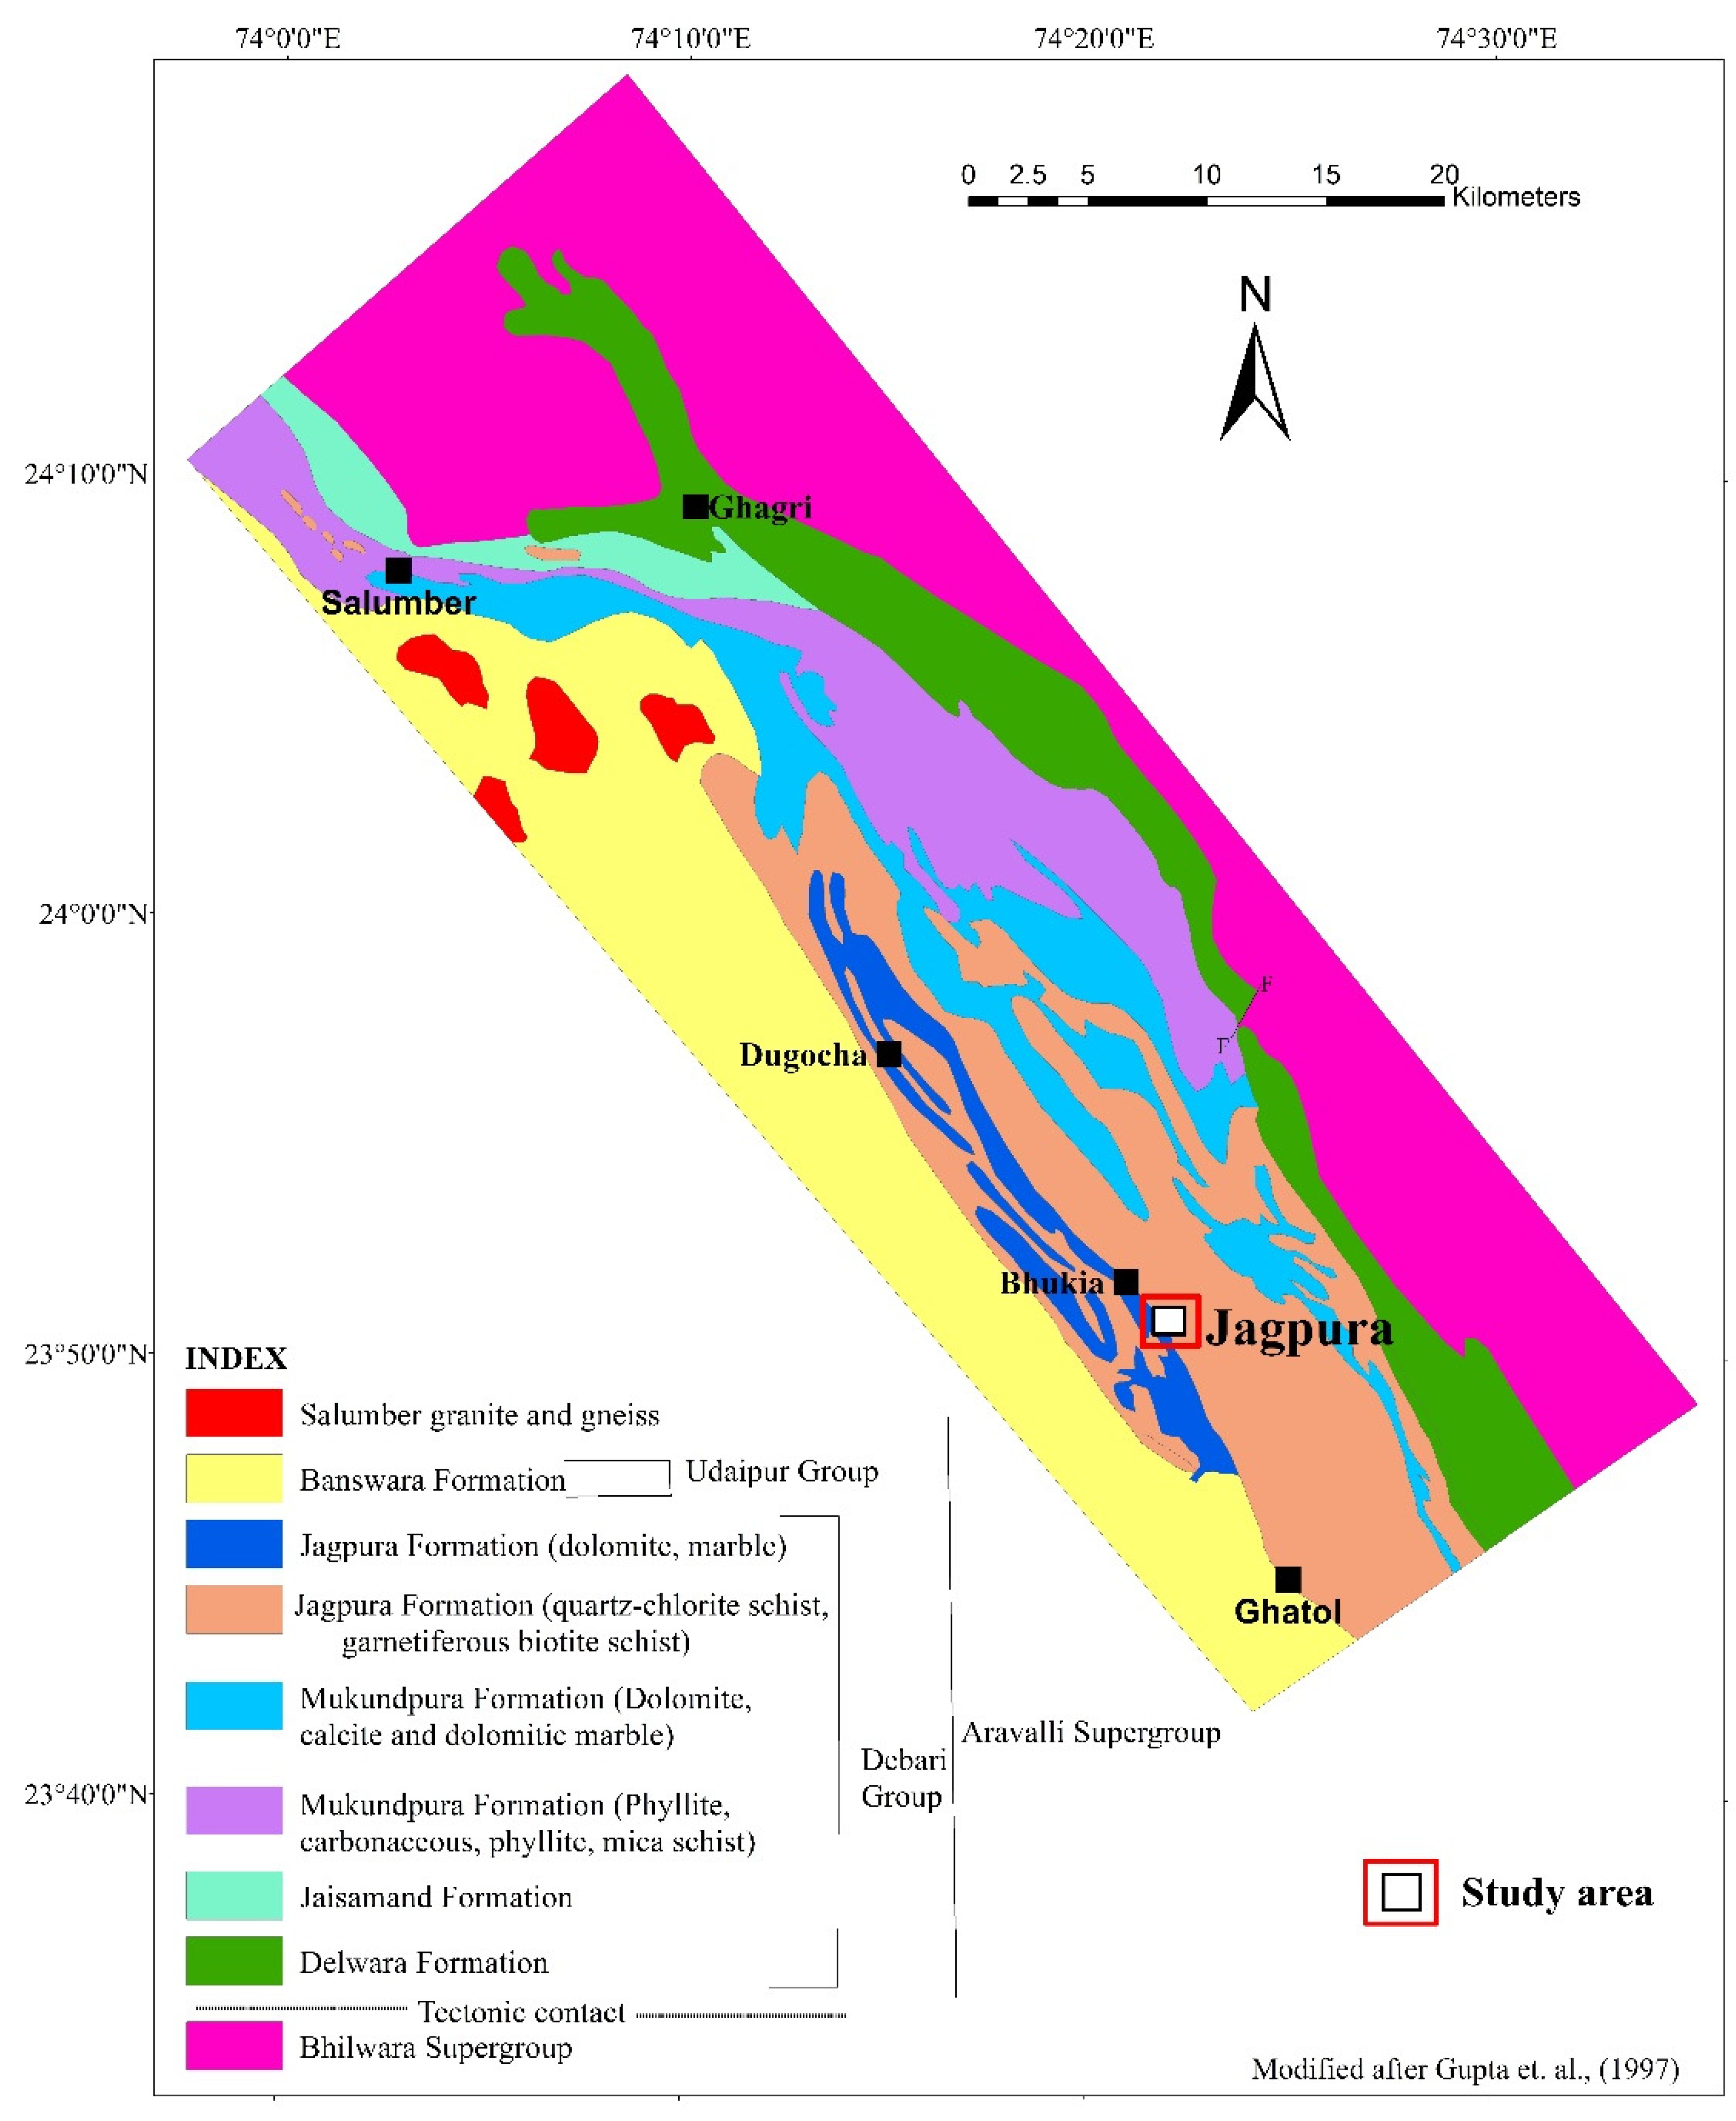
2. Regional Geological Setting
3. Deposit Geology
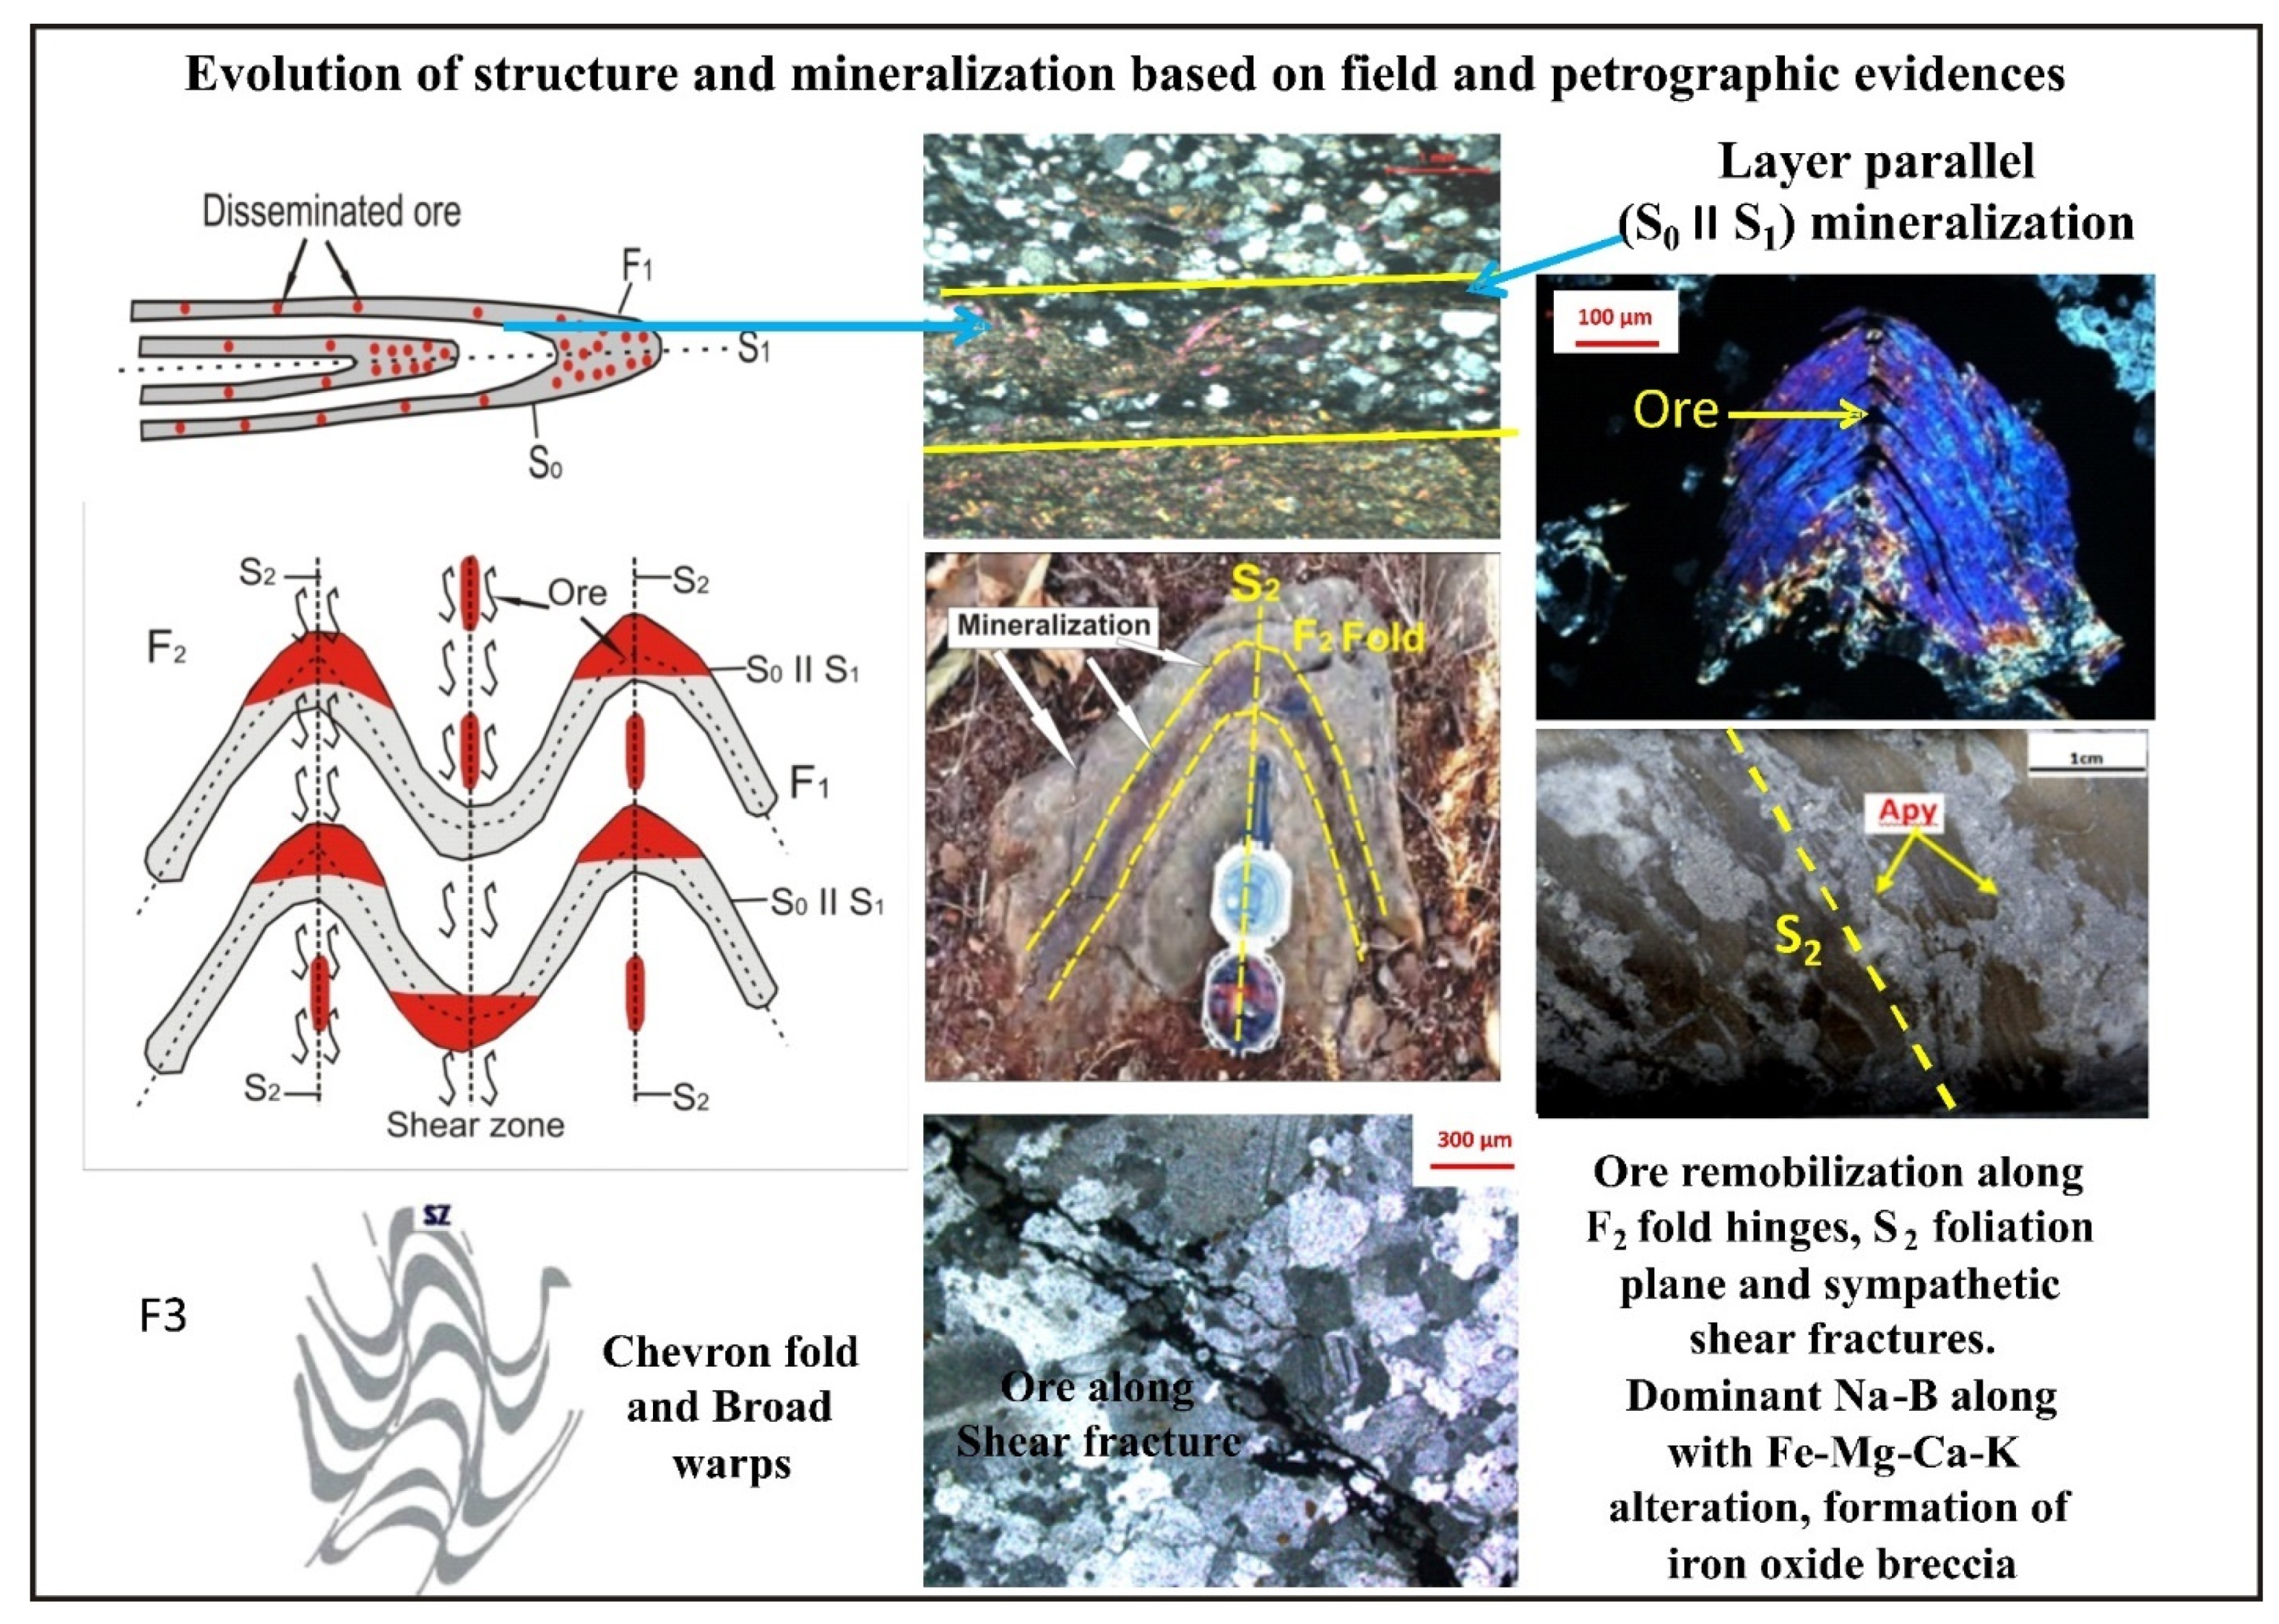
3.1. Structure
3.2. Mineralization
3.3. Alteration Pattern
4. Materials and Methods
4.1. Sampling
4.2. Petrography and EPMA
4.3. Fluid Inclusion Micro Thermometry
4.4. Sulfur Isotopic Composition
4.5. Geochemical Analysis
5. Results
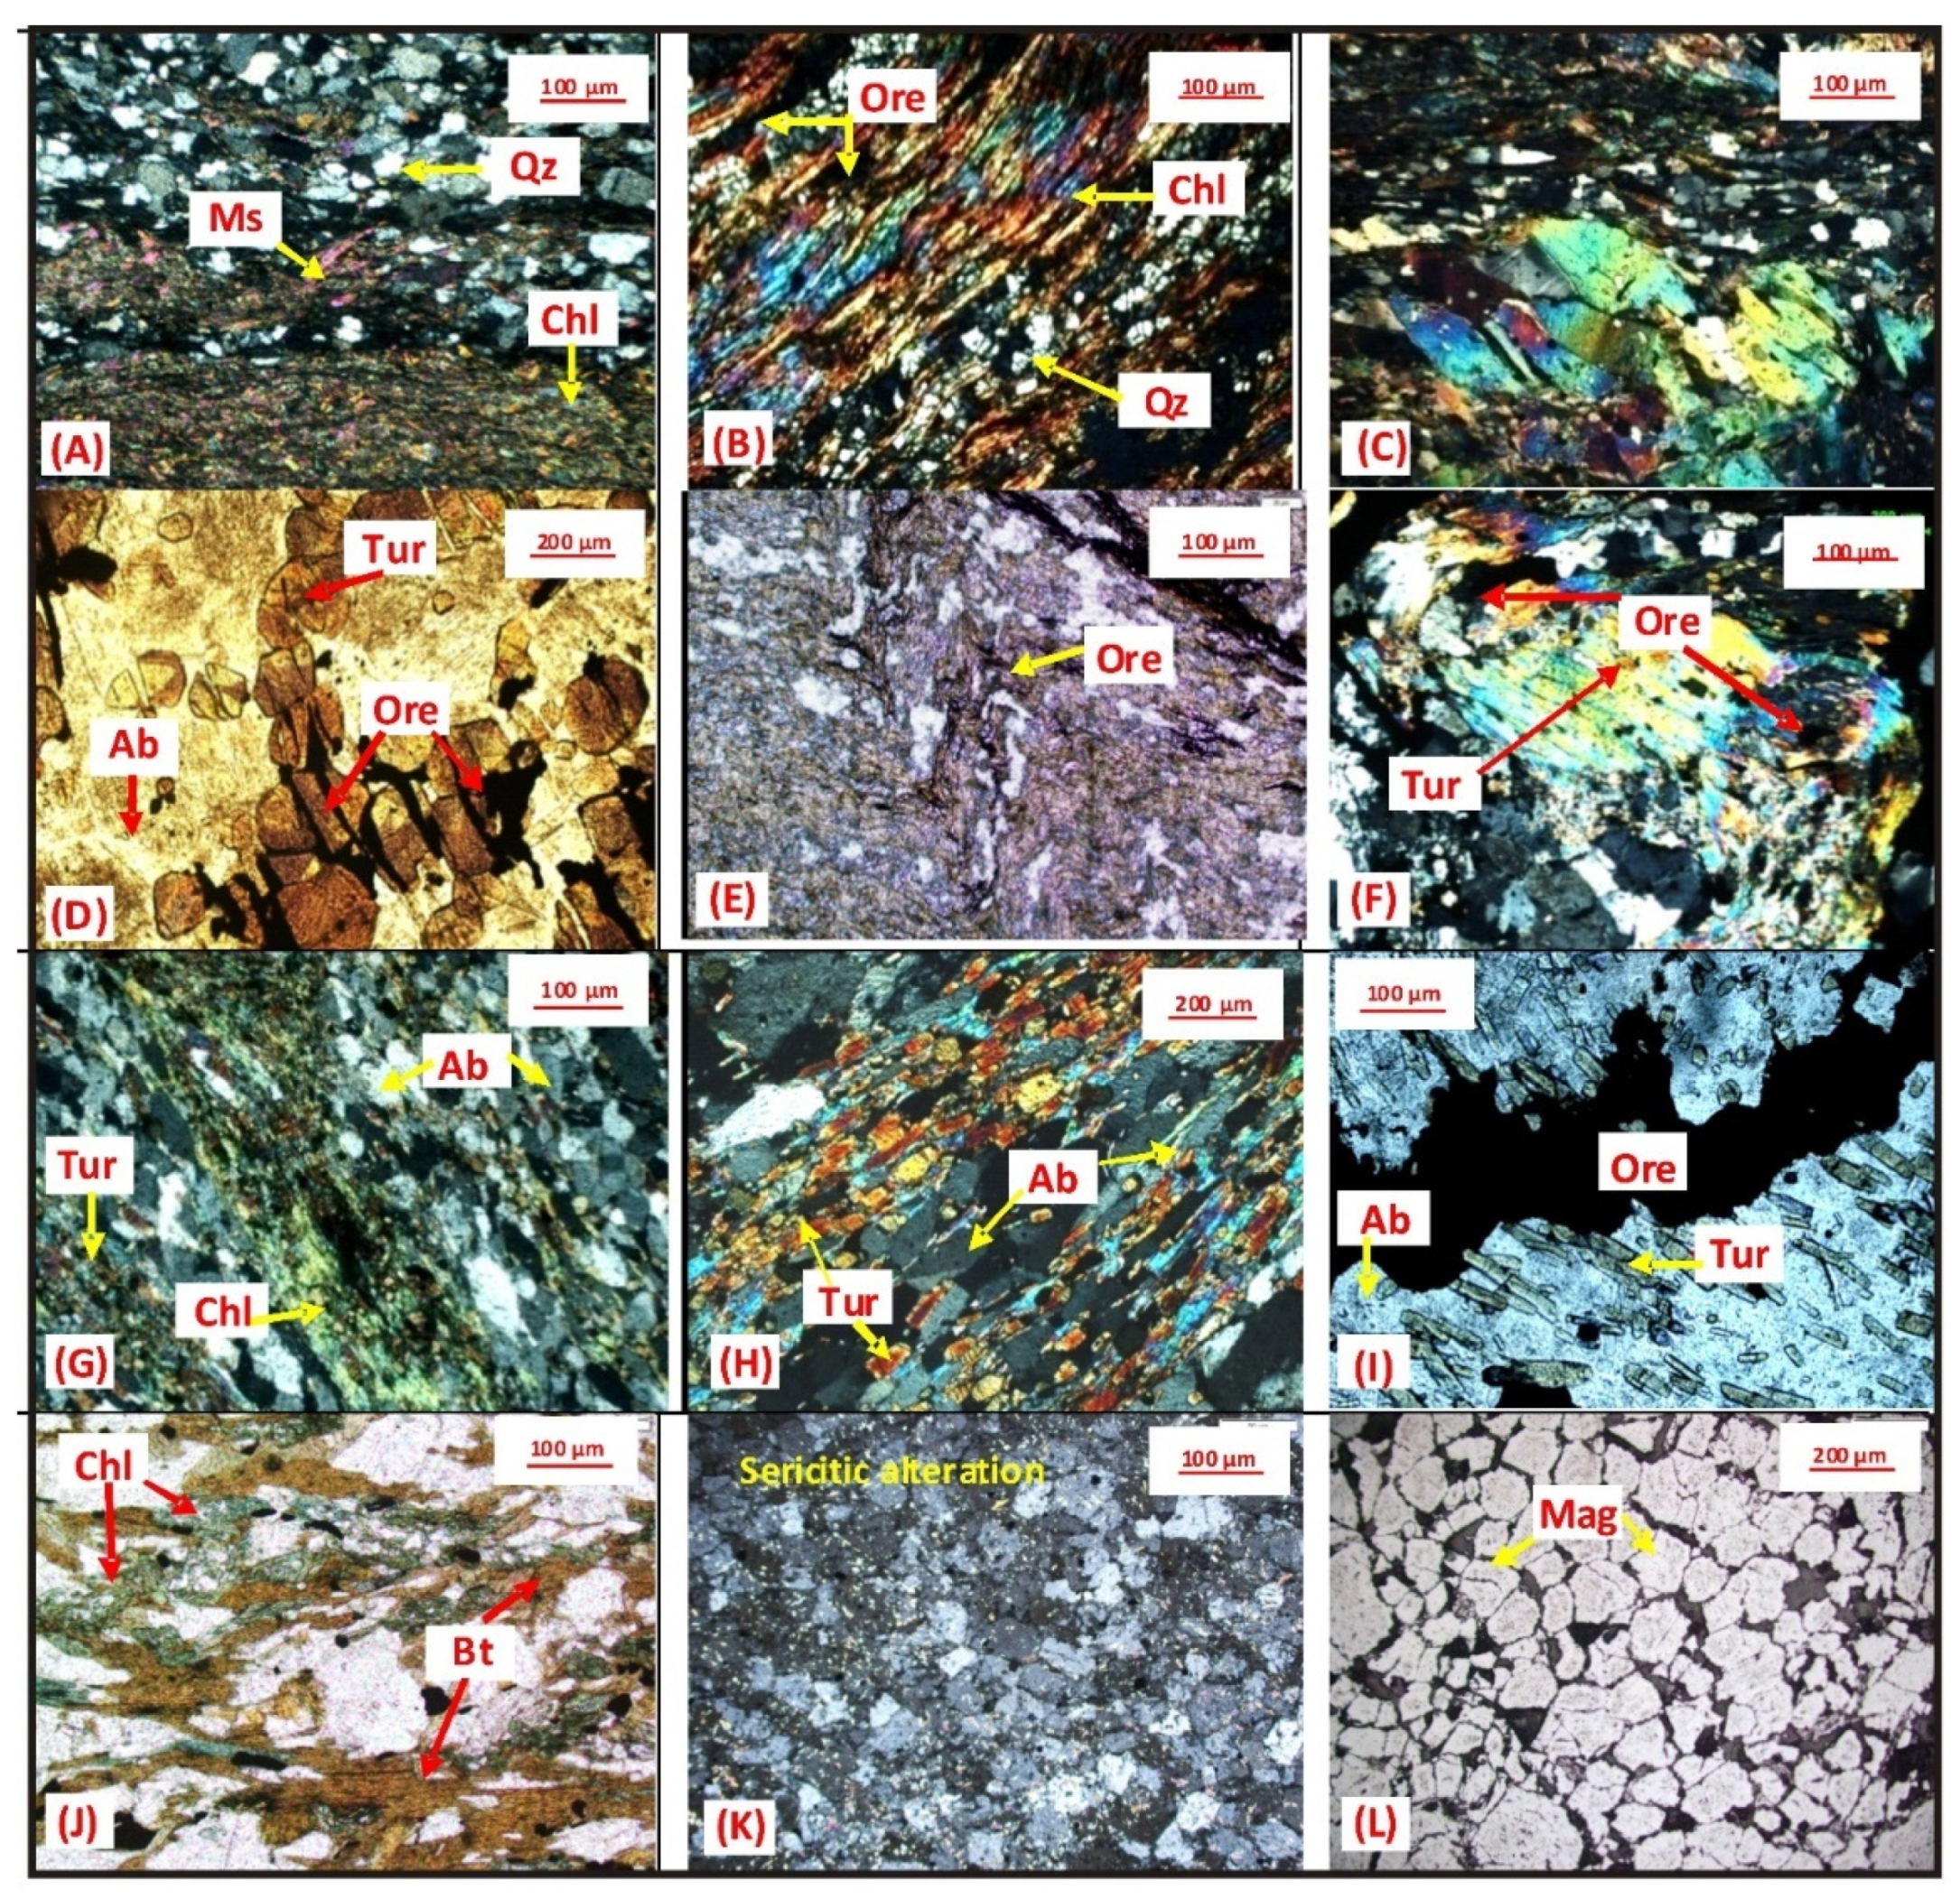
5.1. Petrography and EPMA Study
5.1.1. Petrography of Host Rocks
5.1.2. Ore Petrography and Ore Chemistry

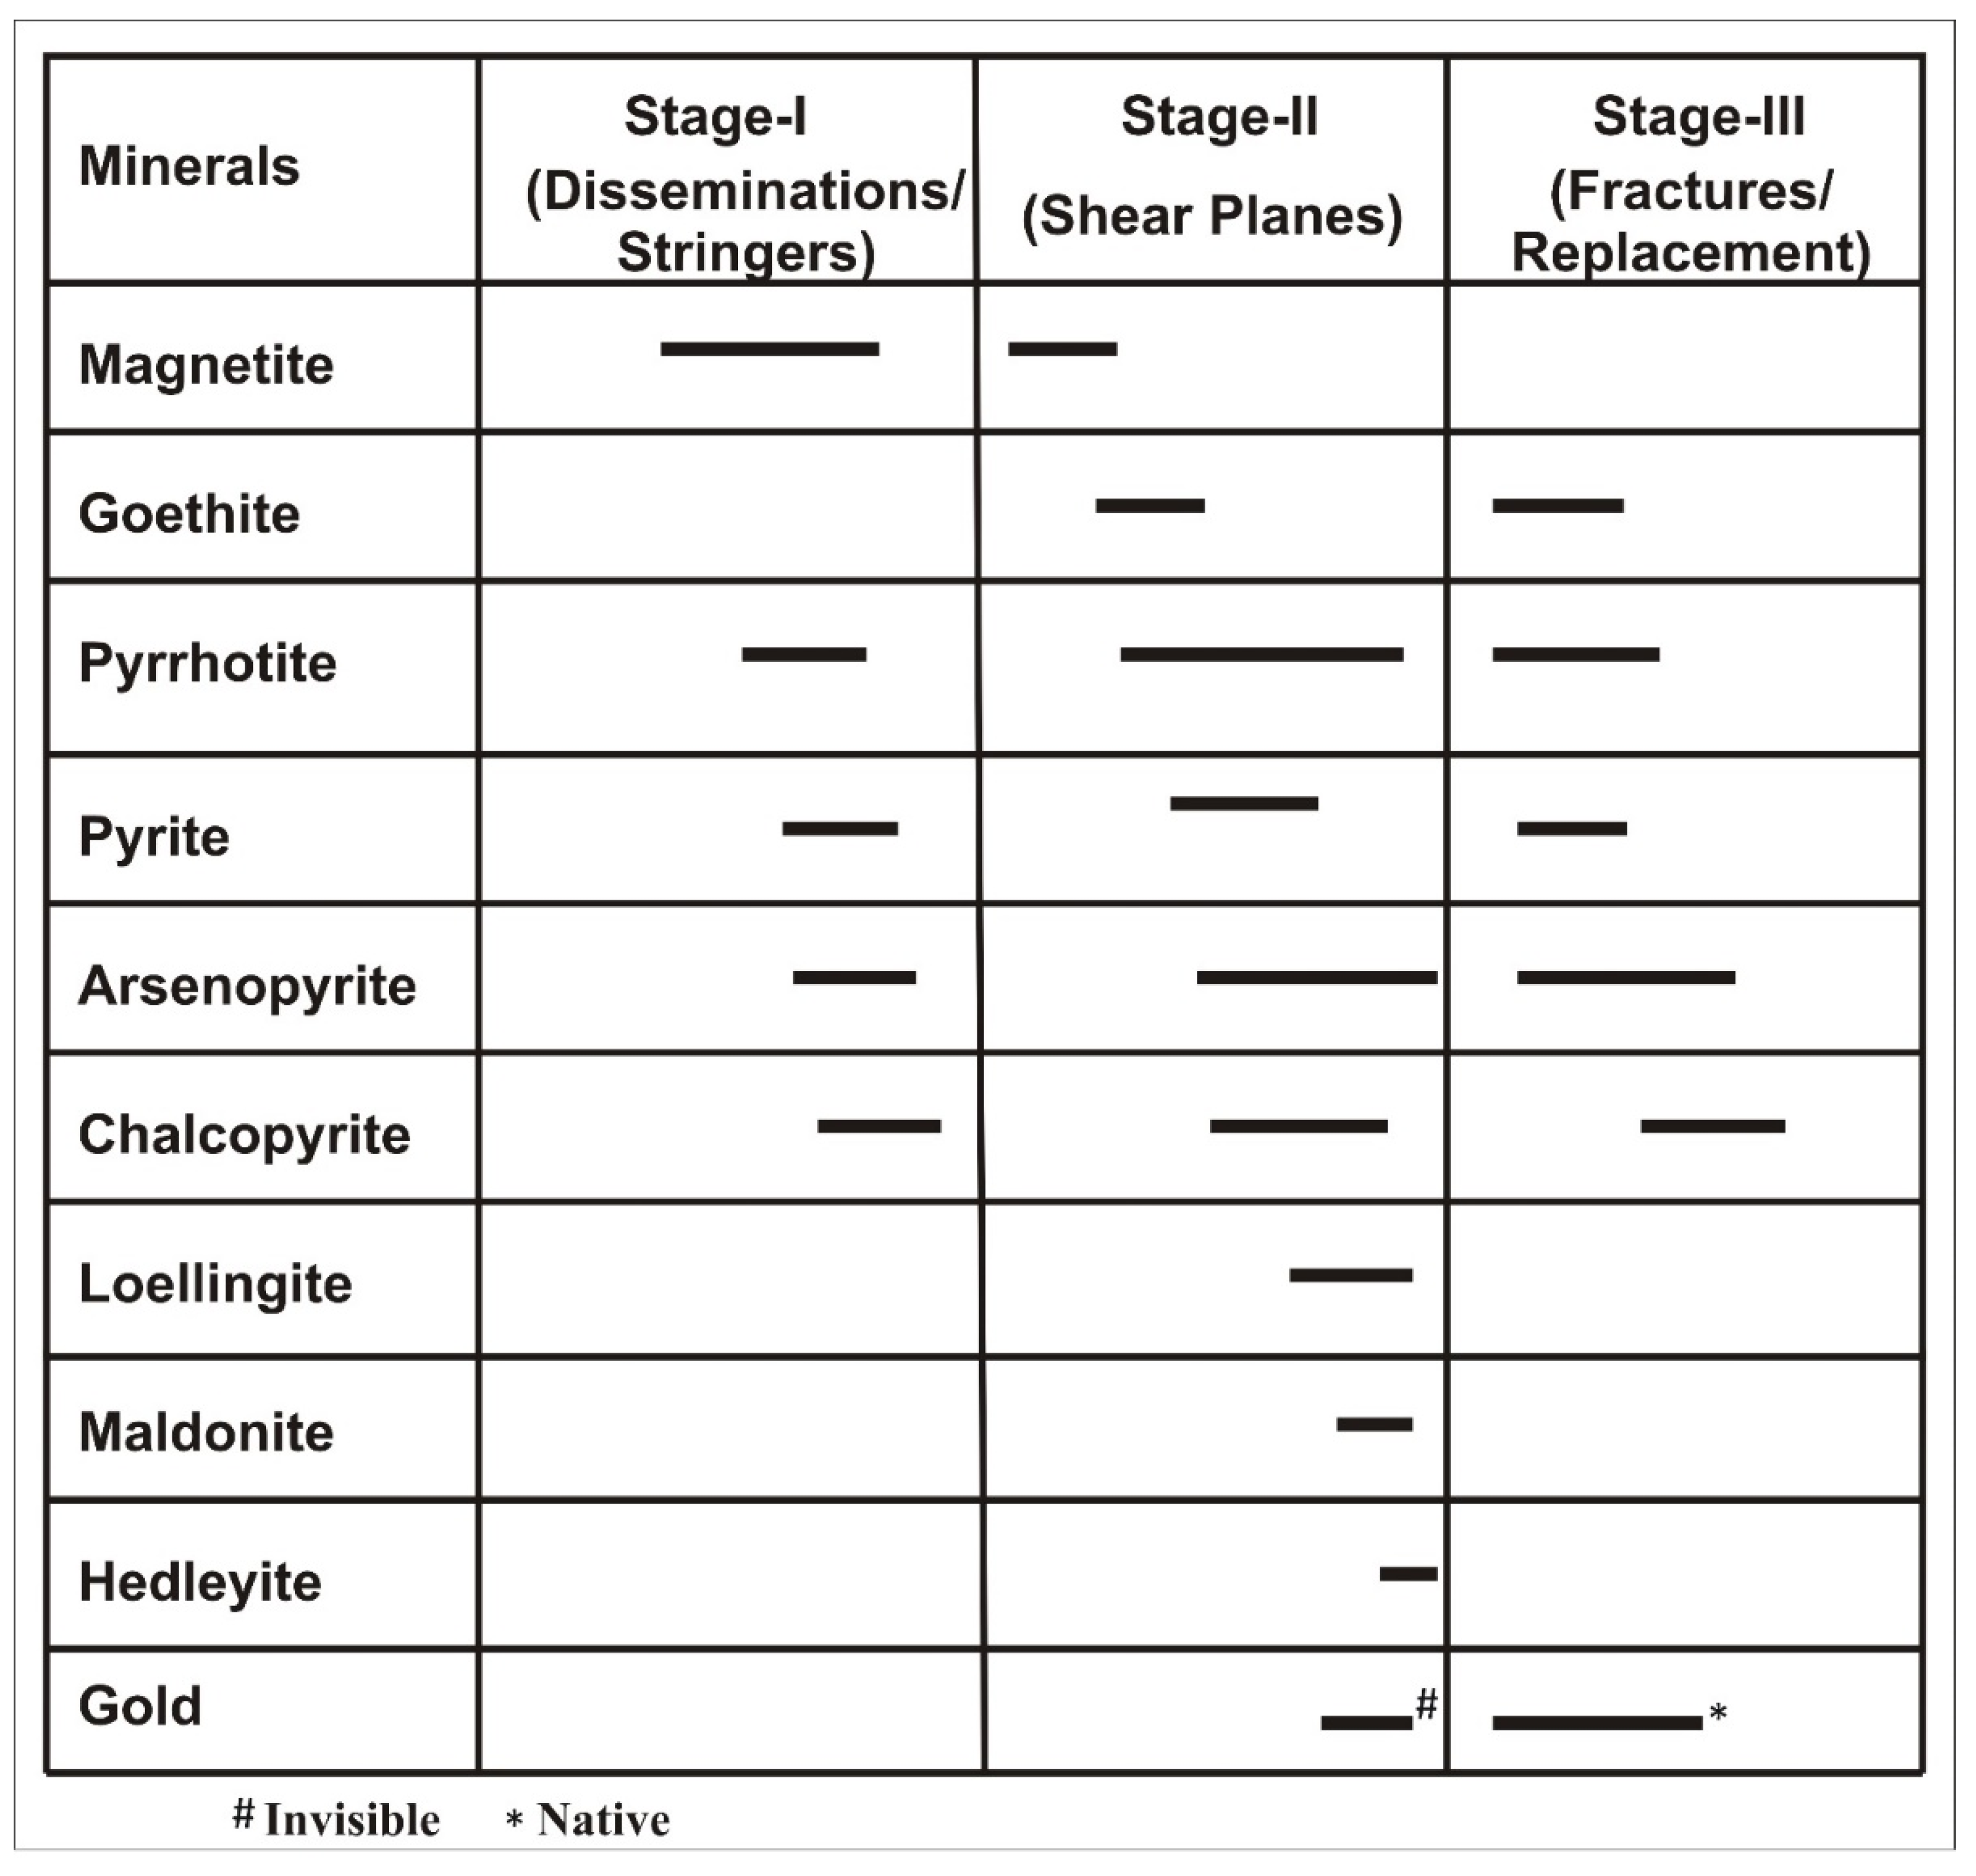
5.1.3. Paragenesis Study
5.2. Fluid Inclusion Study
5.2.1. Fluid Inclusion Petrography
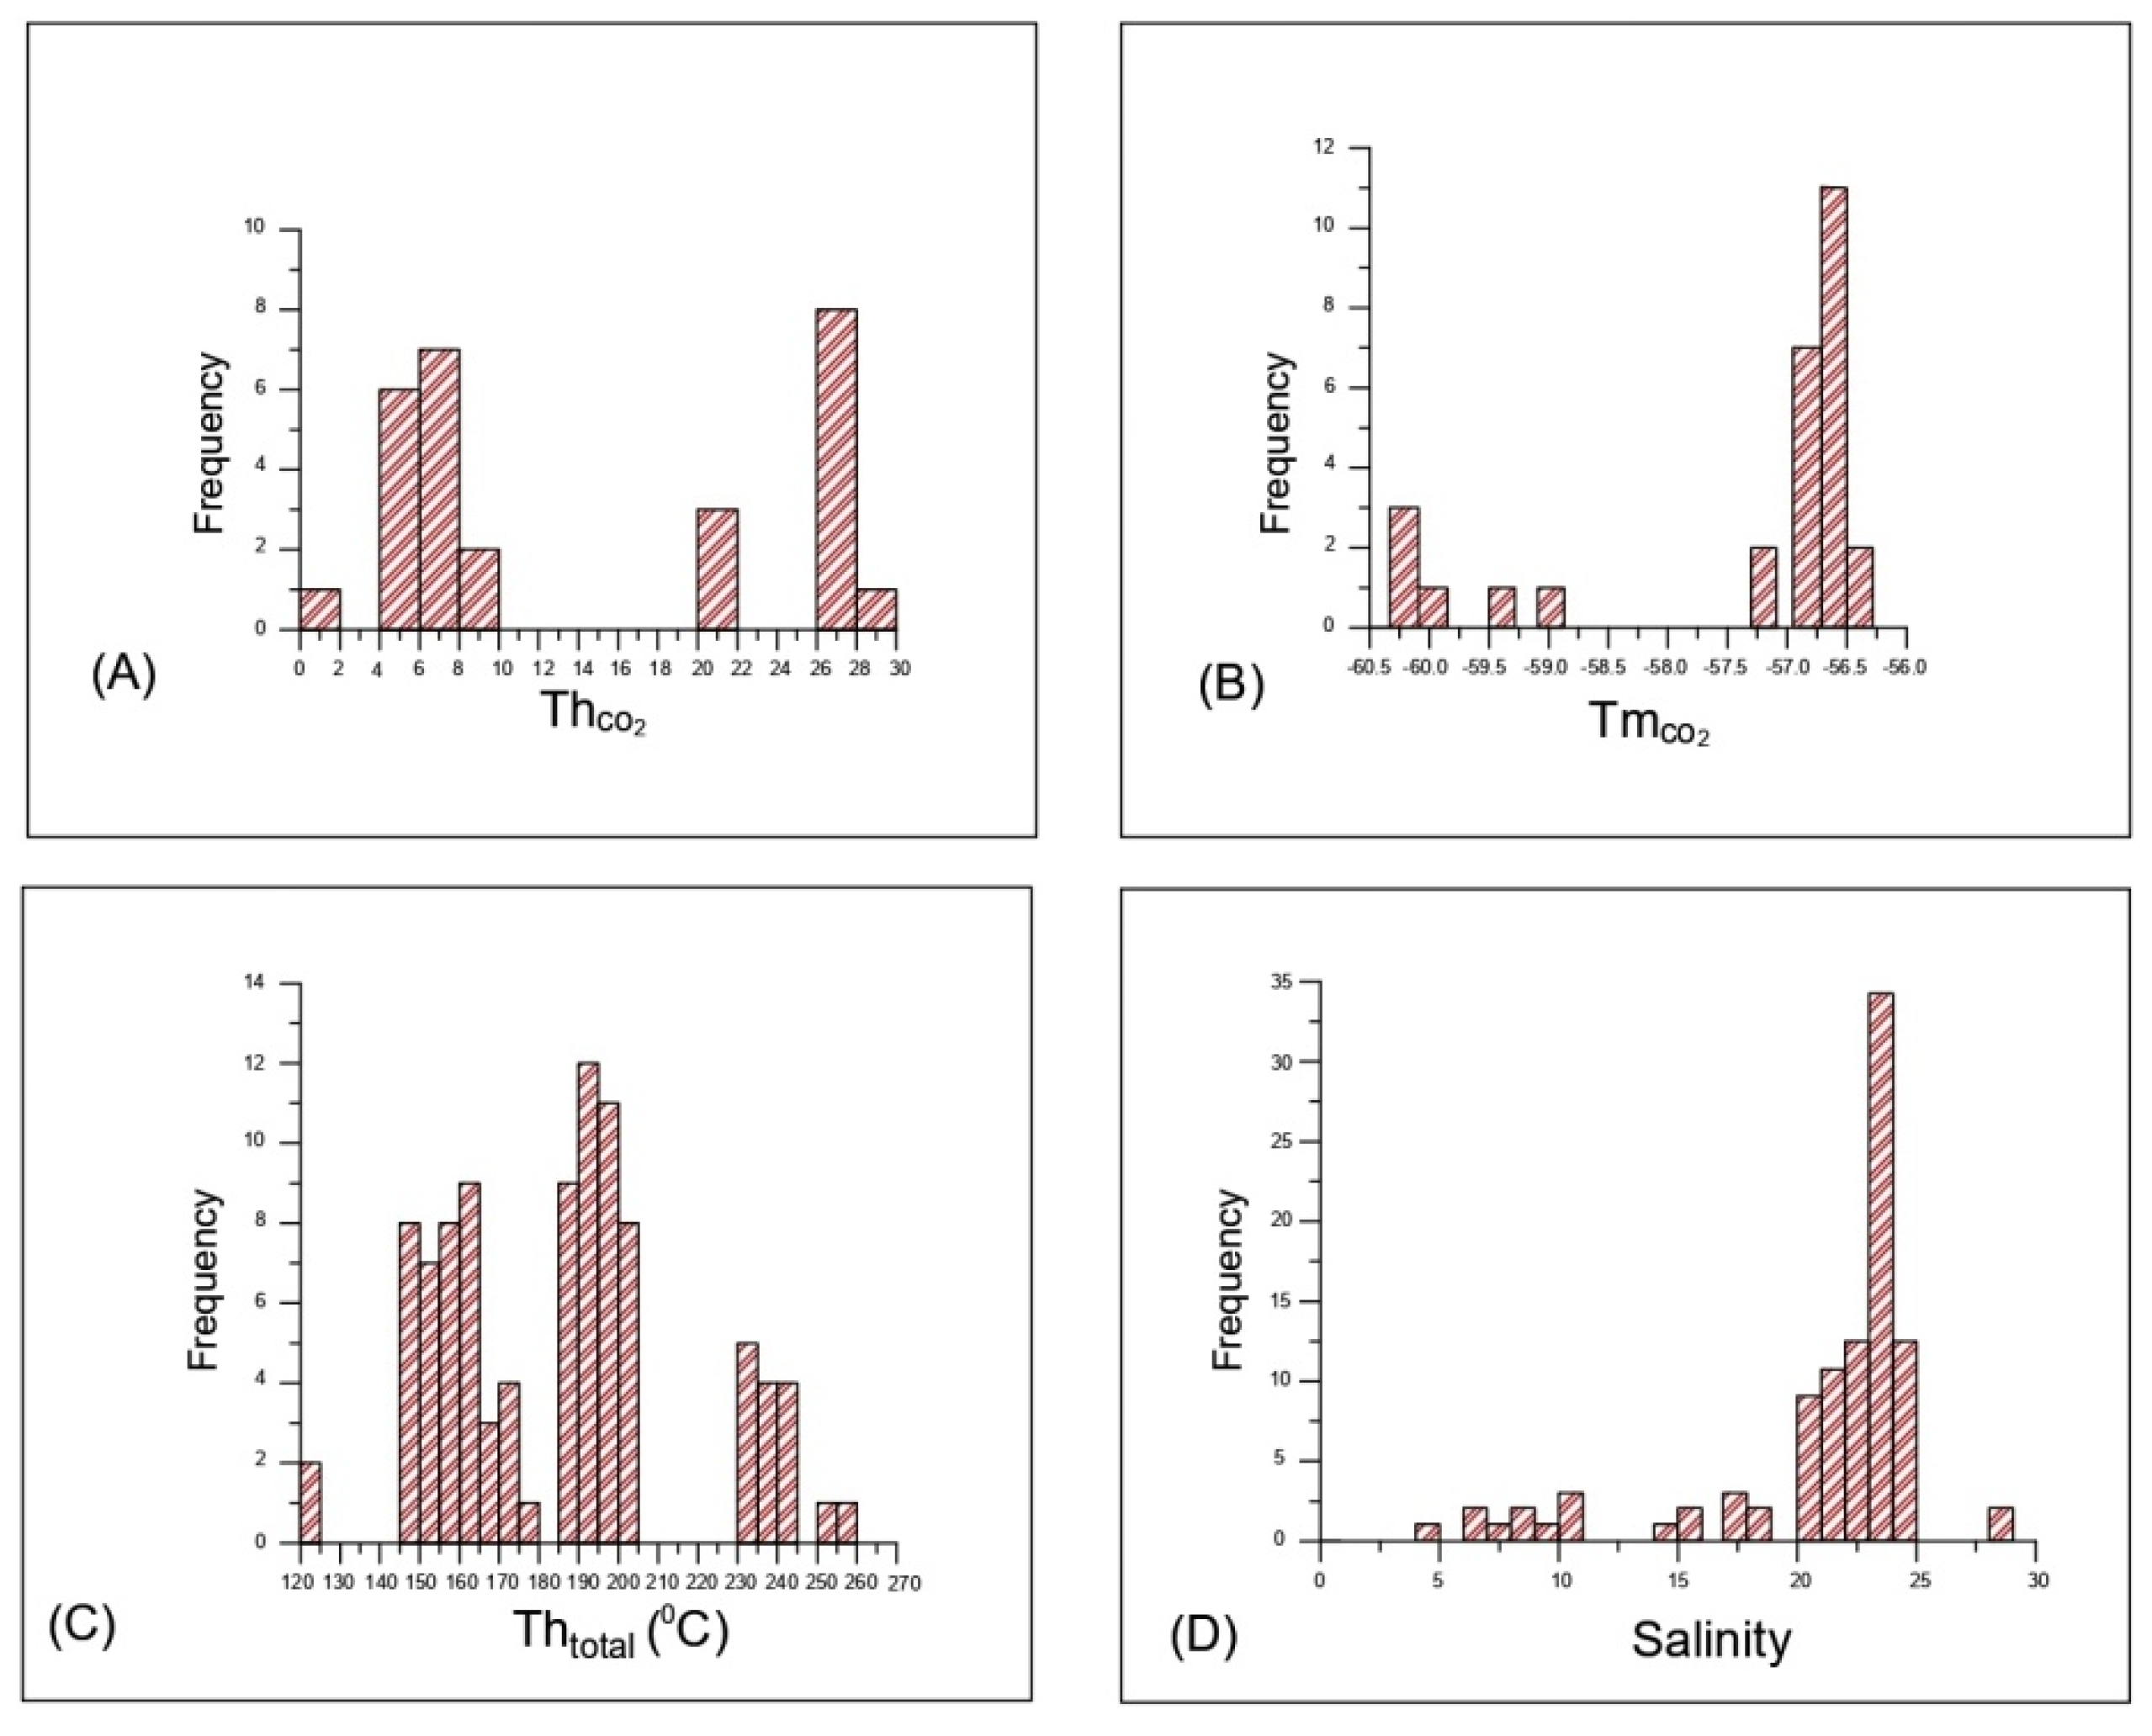
5.2.2. Microthermometry
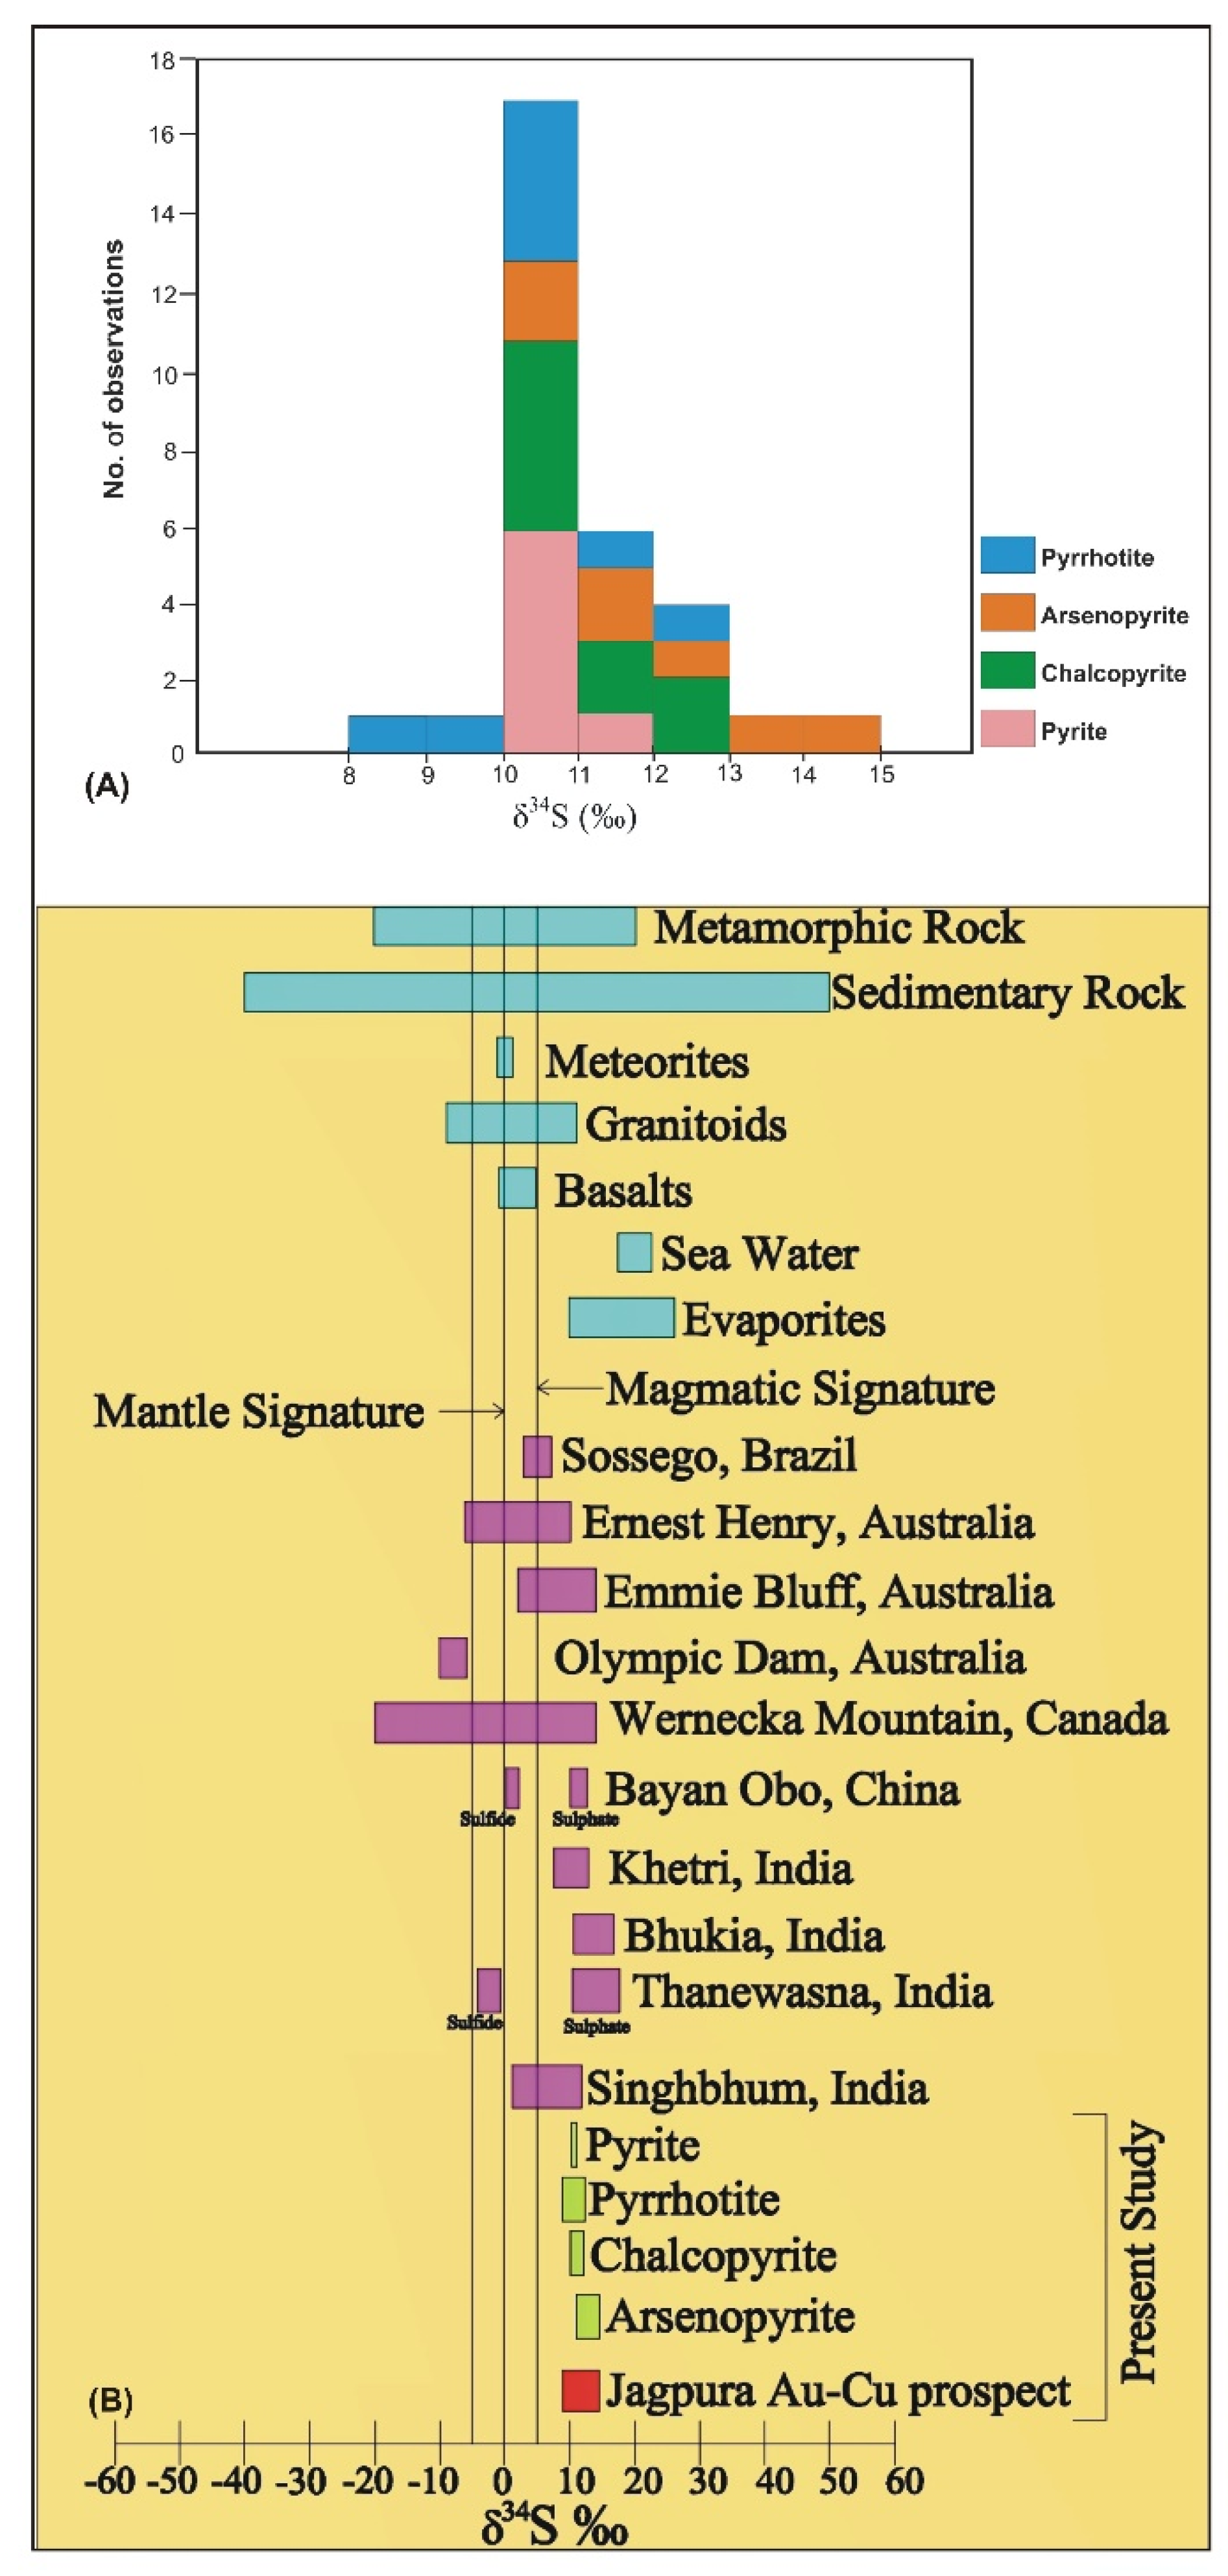
5.3. Sulfur Isotopic Composition
5.4. Geochemical Results
6. Discussion
6.1. Nature and Control of Mineralization
6.2. Geochemistry of Native Gold, Pyrite, Magnetite, Apatite and Their Implications
6.3. Evolution of Ore Fluids
6.4. Source of Metals, Sulfur and Ore-Forming Fluids
6.5. Geochemical Characterization of the Jagpura Deposit
6.6. Genesis of the Jagpura Au-Cu Deposit
7. Conclusions
Author Contributions
Funding
Institutional Review Board Statement
Informed Consent Statement
Data Availability Statement
Acknowledgments
Conflicts of Interest
References
- Palyanova, G.; Murzin, V.; Borovikov, A.; Karmanov, N.; Kuznetsov, S. Native Gold in the Chudnoe Au-Pd-REE Deposit (Subpolar Urals, Russia): Composition, Minerals in Intergrowth and Genesis. Minerals 2021, 11, 451. [Google Scholar] [CrossRef]
- Liu, H.; Beaudoin, G. Geochemical signatures in native gold derived from Au-bearing ore deposits. Ore Geol. Rev. 2021, 132, 104066. [Google Scholar] [CrossRef]
- Savva, N.E.; Kravtsova, R.G.; Anisimova, G.S.; Palyanova, G.A. Typomorphism of Native Gold (Geological-Industrial Types of Gold Deposits in the North-East of Russia). Minerals 2022, 12, 561. [Google Scholar] [CrossRef]
- Groves, D.I.; Goldfarb, R.J.; Gebre-Mariam, M.; Hagemann, S.G.; Robert, F. Orogenic gold deposits: A proposed classification in the context of their crustal distribution and relationship to other gold deposit types. Ore Geol. Rev. 1998, 13, 7–27. [Google Scholar] [CrossRef]
- Goldfarb, R.J.; Groves, D.I.; Gardoll, I. Orogenic gold and geologic time: A global synthesis. Ore Geol. Rev. 2001, 18, 1–75. [Google Scholar] [CrossRef]
- Cline, J.S.; Hofstra, A.H.; Muntean, J.L.; Tosdal, R.M.; Hickey, K.A. Carlin-type gold deposits in Nevada: Critical geologic characteristics and viable models. In Economic Geology 100th Anniversary Volume 2005; Society of Economic Geologists: Littleton, CO, USA, 2005; pp. 451–484. [Google Scholar]
- Sinclair, W.D. Porphyry deposits. Mineral Deposits of Canada: A Synthesis of Major Deposit-Types, District Metallogeny, the Evolution of Geological Provinces, and Exploration Methods. In Geological Association of Canada, Mineral Deposits Division, Special Publication; Geological Association of Canada: St. John’s, NL, Canada, 2007; Volume 5, pp. 223–243. [Google Scholar]
- Sillitoe, R.H. Porphyry copper systems. Econ. Geol. 2010, 105, 3–41. [Google Scholar] [CrossRef]
- Groves, D.I.; Bierlein, F.P.; Meinert, L.D.; Hitzman, M.W. Iron oxide copper-gold (IOCG) deposits through Earth history: Implications for origin, lithospheric setting, and distinction from other epigenetic iron oxide deposits. Econ. Geol. 2010, 105, 641–654. [Google Scholar] [CrossRef]
- Goldfarb, R.J.; Groves, D.I. Orogenic gold: Common or evolving fluid and metal sources through time. Lithos 2015. [Google Scholar] [CrossRef]
- Frimmel, H.E. Earth’s continental crustal gold endowment. Earth Planet. Sci. Lett. 2008, 267, 45–55. [Google Scholar] [CrossRef]
- Klemm, D.D.; Henckel, J.; Dehm, R.M.; Von Gruenewaldt, G. The geochemistry of titanomagnetite in magnetite layers and their host rocks of the eastern Bushveld Complex. Econ. Geol. 1985, 80, 1075–1088. [Google Scholar] [CrossRef]
- Nadoll, P.; Koenig, A.E. LA-ICP-MS of magnetite: Methods and reference materials. J. Anal. At. Spectrom. 2011, 26, 1872–1877. [Google Scholar] [CrossRef]
- Dare, S.A.S.; Barnes, S.J.; Beaudoin, G. Variation in trace element content of magnetite crystallized from a fractionating sulfide liquid, Sudbury, Canada: Implications for provenance discrimination. Geochim. Cosmochim. Acta. 2012, 88, 27–50. [Google Scholar] [CrossRef]
- Dare, S.A.S.; Bames, S.J.; Beaudoin, G.; Meric, J.; Boutroy, E.; Potvin-Doucet, C. Trace elements in magnetite as petrogenetic indicators. Miner. Depos. 2014, 49, 785–796. [Google Scholar] [CrossRef]
- Huang, X.W.; Beaudoin, G. Textures and chemical composition of magnetite from iron oxide-copper-gold (IOCG) and Kiruna-type iron oxide-apatite (IOA) deposits and their implications for ore genesis and magnetite classification schemes. Econ. Geol. 2019, 114, 953–979. [Google Scholar] [CrossRef]
- Carew, M.J.; Mark, G.; Oliver, N.H.S.; Pearson, N. Trace element geochemistry of magnetite and pyrite in Fe oxide (+/−Cu–Au) mineralised systems: Insights into thegeochemistry of ore-forming fluids. Geochim. Cosmochim. Acta. 2006, 70, 5. [Google Scholar] [CrossRef]
- Dupuis, C.; Beaudoin, G. Discriminant diagrams for iron oxide trace element fingerprinting of mineral deposit types. Miner. Depos. 2011, 46, 319–335. [Google Scholar] [CrossRef]
- Angerer, T.; Hagemann, S.G.; Danyushevsky, L. High-grade iron ore at Windarling, Yilgarn Craton: A product of syn-orogenic deformation, hypogene hydrothermal alteration and supergene modification in an Archean BIF-basalt lithostratigraphy. Miner. Depos. 2013, 48, 697–728. [Google Scholar] [CrossRef]
- Nadoll, P.; Mauk, J.L.; Hayes, T.S.; Koenig, A.E.; Box, S.E. Geochemistry of magnetite from hydrothermal ore deposits and host rocks of Mesoproterozoic Belt Supergroup, United States. Econ. Geol. 2012, 107, 1275–1292. [Google Scholar] [CrossRef]
- Boutroy, E.; Dare, S.A.S.; Beaudoin, G.; Barnes, S.J.; Lightfoot, P.C. Magnetite composition in Ni-Cu-PGE deposits worldwide and its application to mineral exploration. J. Geochem. Explor. 2014, 145, 64–81. [Google Scholar] [CrossRef]
- Huang, X.W.; Qi, L.; Meng, Y. Trace element geochemistry of magnetite from the Fe (-Cu) deposits in the Hami region, Eastern Tianshan Orogenic Belt, NW China. Acta. Geol. Sin. 2014, 88, 176–195. [Google Scholar] [CrossRef]
- Ciobanu, C.L.; Cook, N.J. Skarn textures and a case study: The Ocna de Fier-Dognecea ore field, Banat, Romania. Ore Geol. Rev. 2004, 24, 315–370. [Google Scholar] [CrossRef]
- Monteiro, L.V.S.; Xavier, R.P.; de Carvalho, E.R.; Hitzman, M.W.; Johnson, C.A.; Filho, C.R.D.S.; Torresi, I. Spatial and temporal zoning of hydrothermal alteration and mineralization in the Sossego iron oxide–copper-gold deposit, Carajas Mineral Province, Brazil: Paragenesis and stable isotope constraints. Miner. Depos. 2008, 43, 129–159. [Google Scholar] [CrossRef]
- Skirrow, R. “Hematite-group” IOCG± U ore systems: Tectonic settings, hydrothermal characteristics, and Cu-Au and U mineralizing processes. In Exploring for Iron Oxide Copper-Gold Deposits: Canada and Global Analogues; Corriveau, L., Mumin, H., Eds.; Geological Association of Canada: St. John’s, NL, Canada, 2010; Volume 20, pp. 39–58. [Google Scholar]
- Nadoll, P.; Angerer, T.; Mauk, J.L.; French, D.; Walshe, J. The chemistry of hydrothermal magnetite: A review. Ore Geol. Rev. 2014, 61, 1–32. [Google Scholar] [CrossRef]
- Mukherjee, R.; Venkatesh, A.S. Chemistry of magnetite-apatite from albitite and carbonate hosted Bhukia Gold Deposit, Rajasthan, western India–An IOCG-IOA analogue from Paleoproterozoic Aravalli Supergroup: Evidence from petrographic, LAICPMS and EPMA studies. Ore Geol. Rev. 2017, 91, 509–529. [Google Scholar] [CrossRef]
- Dora, M.L.; Upadhyay, D.; Randive, K.R.; Shareef, M.; Baswani, S.R.; Ranjan, S. Trace element geochemistry of magnetite and pyrite and sulfur isotope geochemistry of pyrite and barite from the Thanewasna Cu-(Au) deposit, western Bastar Craton, central India: Implication for ore genesis. Ore Geol. Rev. 2020, 117, 103262. [Google Scholar] [CrossRef]
- Belousova, E.A.; Griffin, W.L.; O’Reilly, S.Y.; Fisher, N.I. Apatite as an indicator mineral for mineral exploration: Trace-element composition and their relationship to host rock type. J. Geochem. Explor. 2002, 76, 45–69. [Google Scholar] [CrossRef]
- Imai, A. Variation of Cl and SO3 contents of micropheno-crystic apatite in intermediate to silicic igneous rocks of Cenozoic Japanese island arcs: Implications for porphyry Cu metallogenesis in the Western Pacific Island arcs. Res. Geol. 2004, 54, 357–372. [Google Scholar] [CrossRef]
- FareeduddinKirmani, I.R.; Chander, S. Petrology, geochemistry and fluid inclusion studies of Cu-Au mineralization in paleoproterozoicSalumber-Ghatol belt, Aravalli Supergroup, Rajasthan. J. Geol. Soc. India 2012, 80, 5–38. [Google Scholar] [CrossRef]
- Mukherjee, R.; Venkatesh, A.S.; Fareeduddi. Albitite hosted gold-sulfide mineralization: An example from Paleoproterozoic Aravalli supracrustal sequence, Bhukia area, Western India. Episodes 2016, 39, 590–598. [Google Scholar] [CrossRef]
- Deol, S.; Deb, M.; Large, R.R.; Gilbert, S. LA-ICPMS and EPMA studies of pyrite, arsenopyrite and loellingite from the Bhukia-Jagpura gold deposit, southern Rajasthan, India: Implications for ore genesis and gold remobilization. Chem. Geol. 2012, 326–327, 72–87. [Google Scholar] [CrossRef]
- Kumar, M. Report on Exploration for Gold-Copper Mineralization in Jagpura Area, Banswara District, Rajasthan; Unpublished Report; Geological Survey of India: Kolkata, India, 2014. [Google Scholar]
- Anand, A. Report on Ore Microscopic, Petrographic and Metamorphic Studies of Prospect Sequence of Bhukia-Jagpura Area, Banswara District, Rajasthan; Unpublished Report; Geological Survey of India: Kolkata, India, 2016. [Google Scholar]
- Skirrow, R.G. Iron oxide copper-gold (IOCG) deposits—A review (part 1): Settings, mineralogy, ore geochemistry and classification. Ore Geol. Rev. 2021, 140, 104569. [Google Scholar] [CrossRef]
- Gopalan, K.; Macdougall, J.; Roy, A.; Murali, A. Sm-Nd evidence for 3.3 Ga old rocks in Rajasthan, northwestern India. Precambrian Res. 1990, 48, 287–297. [Google Scholar] [CrossRef]
- Roy, A.B.; Kröner, A. Single zircon evaporation ages constraining the growth of the Archaean Aravalli craton, northwestern Indian Shield. Geol. Mag. 1996, 133, 333–342. [Google Scholar] [CrossRef]
- Golani, P.R.; Pandit, M.K.; Sial, A.; Fallick, A.E.; Ferreira, V.P.; Roy, A.B. B-Na rich Paleoproterozoic Aravalli metsediments of evaporitic association, NW India: A new repository of gold mineralization. Precambr. Res. 2002, 116, 183–198. [Google Scholar] [CrossRef]
- Kaur, P.; Chaudhri, N.; Raczek, I.; Kröner, A.; Hofmann, A.W.; Okrusch, M. Zircon ages of late Palaeoproterozoic (ca. 1.72–1.70 Ga) extension-related granitoids in NE Rajasthan, India: Regional and tectonic significance. Gondwana Res. 2011, 19, 1040–1053. [Google Scholar] [CrossRef]
- Banerjee, D.M. Aravalli Craton and its Mobile Belts: An Update. Episodes 2019, 43, 88–108. [Google Scholar] [CrossRef]
- Roy, A.B.; Sharma, B.L.; Paliwal, B.S.; Chauhan, N.K.; Nagori, D.K.; Golani, P.R.; Bejarniya, B.R.; Bhu, H.; Ali Sabah, M. Lithostratigraphy and tectonic evolution of the Aravalli Supergroup: A proto geosynclinal sequence. In Rift Basins and Aulacogens; Casshyap, S.M., Ed.; GyanodayaPrakashan: Naini Tal, India, 1993; pp. 73–90. [Google Scholar]
- Pradhan, V.R.; Meert, J.G.; Pandit, M.K.; Kamenov, G.; Gregory, L.C.; Malone, S.J. India’s changing place in global Proterozoic reconstructions: A review of geochronologic constraints and Paleomagnetic poles from the Dharwar, Bundelkhand and Marwar cratons. J. Geodyn. 2009, 50, 224–242. [Google Scholar] [CrossRef]
- Deb, M.; Sarkar, S.C. Proterozoic tectonic evolution and metallogenesis in the Aravalli Delhi Orogenic belt, northwest India. Precambr. Res. 1990, 46, 115–137. [Google Scholar] [CrossRef]
- Singh, S.P. Stratigraphy and sedimentation pattern in the Proterozoic Delhi Supergroup, Northwestern India. Mem. Geol. Soc. India 1988, 7, 193–206. [Google Scholar]
- Bhattacharya, H.N.; Bull, S. Tectono-sedimentary setting of the Paleoproterozoic Zawar Pb–Zn deposits, Rajasthan, India. Precambr. Res. 2010, 177, 323–338. [Google Scholar] [CrossRef]
- Ahmad, T.; Dragusanu, C.; Tanaka, T. Provenance of Proterozoic Basal Aravalli mafic volcanic rocks from Rajasthan, Northwestern India: Nd isotopes evidence for enriched mantle reservoirs. Precambr. Res. 2008, 162, 150–159. [Google Scholar] [CrossRef]
- McKenzie, N.R.; Hughes, N.C.; Myrow, P.M.; Banerjee, D.M.; Deb, M.; Planavsky, N.J. New age constraints for the Proterozoic Aravalli-Delhi successions of India and their implications. Precambr. Res. 2013, 238, 120–128. [Google Scholar] [CrossRef]
- Grover, A.K.; Verma, R.G. Gold mineralization in the Precambrian (Bhukia Area) of southeastern Rajasthan—A new discovery. J. Geol. Soc. India 1993, 42, 281–288. [Google Scholar]
- Chander, S.; Sisodia, C.P. Gold mineralization in the Palaeoproterozoic rocks of Sanjela-Manpur-Dugocha belt, Salumber area, Udaipur district, Rajasthan. J. Geol. Soc. India 2003, 61, 463–470. [Google Scholar]
- Gupta, S.N.; Arora, Y.K.; Mathur, R.K.; Iqbaluddin Prasad, B.; Sahai, T.N.; Sharma, S.B. The Precambrian geology of the Aravalli region, southern Rajasthan and northeastern Gujarat. Mem. Geol. Surv. India 1997, 123, 262. [Google Scholar]
- Sengupta, S. Structures and stratigraphic relations of Aravallis, southeastern Rajasthan. J. Geol. Soc. India. 1976, 4, 461–470. [Google Scholar]
- Sharma, R.S. Patterns of metamorphism in the Precambrian rocks of the Aravalli Mountain Belt. Mem. Geol. Soc. India 1988, 7, 33–75. [Google Scholar]
- Geological Survey of India. Base Document on Precious Metals and Minerals: Gold, Diamond, PGE and Precious Stones for CGPB Committee–II; Geological Survey of India: Kolkata, India, 2020; Unpublished Report. [Google Scholar]
- Deb, M.; Goldfarb, R.J. Gold metallogeny: India and beyond. Miner. Depos. 2010, 46, 835–836. [Google Scholar]
- Deb, M. Some key issues of gold metallogeny in India. In International Workshop in Gold Metallogeny; Abstract; Delhi University: Delhi, India, 2008; pp. 50–53. [Google Scholar]
- Singh, S. Report on Investigation for Gold and Associated Basemetal Mineralization in Jagpura Block, Banswara District, Rajasthan; Geological Survey of India: Kolkata, India, 2012; Unpublished Report. [Google Scholar]
- Kumar, M.; Mohan, L. Exploration for Gold-Copper Mineralisation in Jagpura Area, Banswara District, Rajasthan; Geological Survey of India: Kolkata, India, 2016; Unpublished Report. [Google Scholar]
- Hoefs, J. Stable Isotope Geochemistry; Springer: Berlin/Heidelberg, Germany, 2009; p. 288. [Google Scholar]
- De Groot, P.A. Handbook of Stable Isotope Analytical Techniques; Elsevier: Amsterdam, The Netherlands, 2009; Volume 2, p. 1372. [Google Scholar]
- Zhang, Q.L.; Ding, T.P. Analysis of the reference material NBS-123 and the atomic weight of sulfur. Chinese Sci. Bull. 1989, 34, 1086–1089. [Google Scholar]
- Boyle, R.W. Gold History and Genesis of Deposits; Van Nostrand-Reinhold Company: New York, NY, USA, 1987; pp. 583–585. [Google Scholar]
- Fleet, M.E.; Chryssoulis, S.L.; MacLean, P.J.; Davidson, R.; Weisener, G. Arsenian pyrite from gold deposits: Au and As distribution investigated by SIMS and EP, and color staining and surface oxidation by XPS and LIMS. Can. Mineral. 1993, 31, 1–17. [Google Scholar]
- Bajwah, Z.U.; Seccombe, P.K.; Offler, R. Trace element distribution, Co/Ni ratios and genesis of the Big Cadia iron-copper deposit, New South Wales, Australia. Miner. Depos. 1987, 22, 292–300. [Google Scholar] [CrossRef]
- Canil, D.; Grondahl, C.; Lacourse, T.; Pisiak, L.K. Trace elements in magnetitefrom porphyry Cu-Mo-Audeposits in British Columbia, Canada. Ore Geol. Rev. 2016, 72, 1116–1128. [Google Scholar] [CrossRef]
- Roedder, E. Fluid Inclusions. Reviews in mineralogy. Min. Soc. Am. 1984, 12, 644. [Google Scholar]
- Brown, P.E.; Lamb, W.M. P-V-T properties of fluids in the system H2O-CO2-NaCl: New graphical presentation and implications for fluid inclusion studies. Geochim. Cosmochim. Acta. 1989, 53, 1209–1221. [Google Scholar] [CrossRef]
- Van den kerkhof, A.M. The System CO2–CH4–N2 in Fluid Inclusions: Theoretical Modelling and Geological Applications. Ph.D. Thesis, Vrije Universiteit Amsterdam, Amsterdam, The Netherland, 1988; p. 206. [Google Scholar]
- Shepherd, T.J.; Rankin, A.H.; Alderton, D.H.M. A Practical Guide to Fluid Inclusion Studies; Blackie: Glasgow/London, UK, 1985; p. 239. [Google Scholar]
- Cook, N.J.; Ciobanu, C.L.; Mao, J. Textural control on gold distribution in As-free pyrite from the Dongping, Huangtuliang and Hougou gold deposits, North China Craton (Hebei Province, China). Chem. Geol. 2009, 264, 101–121. [Google Scholar] [CrossRef]
- Zhao, H.X.; Frimmel, H.E.; Jiang, S.Y.; Dai, B.Z. LA-ICP-MS trace element analysis of pyrite from the Xiaoqinling gold district, China: Implications for ore genesis. Ore Geol. Rev. 2011, 43, 142–153. [Google Scholar] [CrossRef]
- Liu, W.; Zhang, J.; Sun, J.; Zhou, L.; Liu, A. Low-Ti iron oxide deposits in the Emeishan large igneous province related to low-Ti basalts and gabbroic intrusions. Ore Geol. Rev. 2015, 65, 180–197. [Google Scholar] [CrossRef]
- Zhou, M.F.; Chen, W.T.; Wang, C.Y.; Prevec, S.A.; Liu, P.P.; Howarth, G.H. Two stages of immiscible liquid separation in the formation of Panzhihua-type Fe–Ti–Voxide deposits, SW China. Geosci. Front. 2013, 4, 481–502. [Google Scholar] [CrossRef]
- Ray, G.; Webster, I. Geology and chemistry of the low Ti magnetite-bearing Heff Cu-Au skarn and its associated plutonic rocks, Heffley Lake, south-central British Columbia. Explor. Min. Geol. 2007, 16, 159–186. [Google Scholar] [CrossRef]
- Blanc, P.P. Distinction between magmatic and hydrothermal signature in apatite from north Portugal Cathodoluminescence, SEM and electron microscopic study. Bull. Soc. Geol. France. 1994, 165, 329–339. [Google Scholar]
- Gehrig, M.; Lentz, H.; Franck, E.U. Thermodynamic properties of water–carbon dioxide–sodium chloride mixtures at high temperatures and pressures. In High Pressure Science and Technology; Timmerhaus, K.D., Barber, M.S., Eds.; Physical Properties and Material Synthesis; Springer: Berlin/Heidelberg, Germany, 1979; Volume 1, pp. 539–542. [Google Scholar]
- Vityk, M.O.; Bodnar, R.J.; Schmidt, C.S. Fluid inclusions as tectonothermobarometers: Relation between pressure–temperature history and re-equilibration morphology during crustal thickening. Geology 1994, 22, 731–734. [Google Scholar] [CrossRef]
- Wilkinson, J.J. Fluid inclusions in hydrothermal ore deposits. Lithos 2001, 55, 229–272. [Google Scholar] [CrossRef]
- Kesler, S.E.; Haynes, P.S.; Creech, M.Z.; Gorman, J.A. Application of fluid inclusion and rock gas analysis in mineral exploration. J. Geochem. Explor. 1986, 25, 201–215. [Google Scholar] [CrossRef]
- Kesler, S.E. Ore forming fluids. Elements 2005, 1, 13–18. [Google Scholar] [CrossRef]
- Seal, R.R. Sulfur Isotope Geochemistry of Sulfide Minerals. Rev. Mineral. Geochem. 2006, 61, 633–677. [Google Scholar] [CrossRef]
- Holser, W.T. Catastrophic chemical events in the history of the ocean. Nature 1977, 267, 402–408. [Google Scholar] [CrossRef]
- Zhao, L.; Chen, H.; Zhang, L.; Xiaoping, X.; Zhang, W.; Li, D.; Lu, W.; Liang, P.; Li, R.; Yang, J.; et al. Geology and ore genesis of the late PaleozoicHeijianshan Fe oxide–Cu (–Au) deposit in the Eastern Tianshan, NW China. Ore Geol. Rev. 2017, 91, 110–132. [Google Scholar] [CrossRef]
- Pal, D.C.; Barton, M.D.; Sarangi, A.K. Deciphering a multistage history affecting U-Cu (–Fe) mineralization in the Singhbhum Shear Zone, eastern India using pyrite textures and compositions in the Turamdih U–Cu (–Fe) deposit. Miner. Depos. 2009, 44, 61–80. [Google Scholar] [CrossRef]
- Neilsen, H. Sulfur isotopes. In Lectures in Isotope Geology; Jager, E., Hunziher, J.E., Eds.; Springer: Berlin/Heidelberg, Germany, 1979; pp. 283–312. [Google Scholar]
- Ohmoto, H.; Goldhaber, M.B. Sulfur and carbon isotopes. In Geochemistry of Hydrothermal Ore Deposits; Barnes, H.L., Ed.; John Wiley and Sons: Hoboken, NJ, USA, 1997; pp. 517–611. [Google Scholar]
- Eldridge, C.S.; Compston, W.; Williams, I.S.; Harris, J.W.; Bristow, J.W. Isotope evidence for the involvement of recycled sediments in the diamond formation. Nature 1991, 353, 649–653. [Google Scholar] [CrossRef]
- Bastrakov, E.N.; Skirrow, R.G.; Davidson, G.J. Fluid Evolution and origins of iron oxide Cu-Au prospects in the Olympic Dam District, Gawler Craton, South Australia. Econ. Geol. 2007, 102, 1415–1440. [Google Scholar] [CrossRef]
- De Haller, A.; Fontboté, L. The Raul-Condestable iron oxide copper-gold deposit, central coast of Peru: Ore and related hydrothermal alteration, sulfur isotopes, and thermodynamic constraints. Econ. Geol. 2009, 104, 365–384. [Google Scholar] [CrossRef]
- Chen, H.Y. External sulfur in IOCG mineralization: Implications on the definition and classification of the IOCG clan. Ore Geol. Rev. 2013, 51, 74–78. [Google Scholar] [CrossRef]
- Ault, K.M.; Williams-Jones, A.E. Sulfur and lead isotope study of the EL Mochito Zn-Pb-Ag deposit. Econ. Geol. 2004, 99, 1223–1231. [Google Scholar] [CrossRef]
- Hutchison, W.; Finch, A.A.; Boyce, A.J. The sulfur isotope evolution of magmatic-hydrothermal fluids: Insights into ore-forming processes. Geochim. Cosmochim. Acta. 2020, 288, 176–198. [Google Scholar] [CrossRef]
- Rollinson, H.R. Using Geochemical Data: Evaluation, Presentation, Interpretation; Longman: London, UK, 1993. [Google Scholar]
- Hitzman, M.W. Iron oxide-Cu-Au deposits: What, where, when, and why. In Hydrothermal Iron Oxide Copper-Gold and Related Deposits; A Global Perspective; Porter, T.M., Ed.; Australian Mineral Foundation: Adelaide, Australia, 2000; Volume 1, pp. 9–25. [Google Scholar]
- Williams, P.J.; Skirrow, R.G. Overview of iron oxide–copper–gold deposits in the Curnamona Province and Cloncurry District (Eastern Mount Isa Block). In A Global Perspective; Porter, T.M., Ed.; PGC Publishing: Brisbane, Australia, 2000; Volume 1, pp. 105–122. [Google Scholar]
- Williams, P.J.; Barton, M.D.; Johnson, D.A.; Fontbote, L.; De Haller, A.; Mark, G.; Oliver, N.H.S.; Marschik, R. Iron oxide copper-gold deposits: Geology, space-time distribution and possible modes of origin. Econ. Geol. 2005, 100, 371–405. [Google Scholar]
- Davidson, G.J.; Hamish, P.; Sebastien, M.; Ron, F.B. Characteristics and origin of the Oak Dam East breccia-hosted, iron oxide Cu–U–(Au) deposit: Olympic Dam region, Gawler Craton, South Australia. Econ. Geol. 2007, 102, 1471–1498. [Google Scholar] [CrossRef]
- Barton, M.D. Iron oxide (-Cu-Au-REE-P-Ag-U-Co) systems. In Treatise on Geochemistry, 2nd ed.; Elsevier Inc.: Amsterdam, The Netherlands, 2014; pp. 515–541. [Google Scholar]


| Lithology: Albitite, Sample No. JGB-10 | |||||||||||||
|---|---|---|---|---|---|---|---|---|---|---|---|---|---|
| Mineral Name | Gold (Au) | Arsenopyrite (FeAsS) | Pyrrhotite (FeS) | Chalcopyrite (CuFeS2) | |||||||||
| EPMA Analysis No. | 1/1 | 1/2 | 1/3 | 1/4 | 1/5 | 1/6 | 1/7 | 1/8 | 1/9 | 1/10 | 1/11 | 1/12 | 1/13 |
| S | 0.09 | 0.02 | 0.02 | 17.74 | 17.70 | 17.33 | 38.27 | 39.04 | 39.17 | 34.14 | 34.18 | 34.03 | 33.88 |
| Fe | 0.68 | 0.12 | 0.12 | 31.10 | 31.60 | 34.68 | 59.85 | 58.75 | 59.22 | 30.08 | 29.35 | 30.02 | 29.92 |
| Co | bdl | bdl | 0.02 | 2.22 | 0.88 | 0.39 | 0.01 | 0.03 | bdl | bdl | 0.01 | bdl | 0.03 |
| Ni | 0.10 | bdl | bdl | 0.40 | 0.29 | bdl | 0.07 | 0.04 | bdl | bdl | 0.03 | bdl | bdl |
| Cu | 0.08 | 0.02 | 0.01 | bdl | 0.02 | 0.03 | 0.01 | 0.01 | 0.01 | 32.66 | 33.79 | 32.6 | 33.02 |
| Zn | bdl | 0.10 | 0.02 | bdl | bdl | bdl | bdl | bdl | bdl | bdl | 0.02 | 0.05 | 0.02 |
| As | 0.25 | 0.08 | 0.01 | 48.10 | 49.14 | 47.07 | bdl | 0.02 | bdl | bdl | 0.04 | bdl | bdl |
| Mo | bdl | bdl | bdl | bdl | 0.24 | 0.22 | 0.51 | 0.56 | 0.49 | 0.46 | 0.50 | 0.43 | 0.58 |
| Ag | 7.20 | 6.15 | 6.58 | 0.03 | bdl | 0.04 | bdl | bdl | 0.02 | 0.08 | bdl | bdl | bdl |
| Cd | 0.14 | 0.02 | 0.08 | bdl | 0.01 | bdl | bdl | 0.02 | bdl | bdl | 0.06 | bdl | bdl |
| Te | bdl | bdl | bdl | bdl | bdl | bdl | bdl | 0.02 | bdl | 2.44 | bdl | 2.42 | 2.19 |
| Au | 89.95 | 92.12 | 92.21 | 0.13 | 0.06 | 0.07 | 0.11 | 0.08 | 0.10 | 0.10 | 0.20 | 0.06 | 0.02 |
| Pb | bdl | bdl | bdl | 0.15 | bdl | 0.13 | bdl | bdl | bdl | bdl | 0.13 | bdl | bdl |
| Bi | bdl | bdl | bdl | 0.10 | bdl | bdl | bdl | bdl | bdl | bdl | bdl | bdl | bdl |
| Total | 98.49 | 98.63 | 99.07 | 99.97 | 99.94 | 99.96 | 98.83 | 98.57 | 99.01 | 99.96 | 98.31 | 99.61 | 99.66 |
| Lithology: Quartz-mica schist, Sample No. JGB-7 | |||||||||||||
| Mineral Name | Gold (Au) | Loellingite (FeAs2) | Maldonite (Au2Bi) | Hedleyite (Bi7Te3) | Arsenopyrite (FeAsS) | ||||||||
| EPMA Analysis No. | 1/1 | 1/2 | 1/3 | 1/4 | 1/5 | 1/6 | 1/7 | 1/8 | 1/9 | 1/10 | 1/11 | 1/12 | |
| S | 0.05 | 0.07 | 0.01 | 1.29 | 1.17 | 1.30 | 0.07 | bdl | 0.04 | 0.02 | 16.65 | 18.25 | |
| Fe | 0.22 | 0.72 | 0.21 | 24.71 | 24.06 | 24.38 | 1.52 | 0.32 | 0.32 | 0.30 | 31.03 | 32.13 | |
| Co | bdl | bdl | bdl | 1.08 | 1.44 | 1.41 | 0.06 | 0.04 | 0.07 | 0.09 | 0.69 | 0.67 | |
| Ni | 0.01 | 0.11 | 0.05 | 2.45 | 2.50 | 2.10 | 0.11 | 0.06 | 0.14 | 0.15 | 0.29 | 0.18 | |
| Cu | 0.03 | 0.07 | 0.04 | bdl | bdl | bdl | bdl | bdl | bdl | bdl | bdl | bdl | |
| Zn | bdl | bdl | bdl | bdl | bdl | bdl | bdl | bdl | bdl | bdl | bdl | 0.02 | |
| As | 0.08 | 0.21 | 0.03 | 70.36 | 70.20 | 70.34 | 0.32 | 0.22 | 0.49 | 0.42 | 47.55 | 48.32 | |
| Mo | bdl | bdl | bdl | 0.02 | bdl | 0.04 | bdl | bdl | bdl | bdl | 0.19 | 0.28 | |
| Ag | 8.46 | 7.60 | 7.12 | bdl | 0.08 | bdl | 0.12 | 0.09 | bdl | bdl | 0.02 | bdl | |
| Cd | 0.03 | 0.12 | bdl | bdl | bdl | bdl | 0.19 | 0.12 | bdl | bdl | bdl | 0.07 | |
| Te | bdl | bdl | bdl | bdl | bdl | bdl | bdl | bdl | 20.39 | 21.30 | 0.05 | bdl | |
| Au | 89.93 | 89.25 | 91.12 | bdl | bdl | 0.17 | 64.71 | 66.47 | bdl | bdl | 2.58 | 0.02 | |
| Pb | bdl | bdl | bdl | bdl | bdl | 0.11 | bdl | bdl | 0.10 | 0.08 | bdl | bdl | |
| Bi | bdl | bdl | bdl | bdl | bdl | bdl | 32.68 | 31.52 | 78.11 | 77.18 | 0.80 | bdl | |
| Total | 98.81 | 98.15 | 98.58 | 99.91 | 99.45 | 99.85 | 99.78 | 98.84 | 99.66 | 99.54 | 99.85 | 99.94 | |
| Lithology: Quartz-mica schist, Sample No. JGB-8 | |||||||||||||
| Mineral Name | Pyrite (FeS2) | ||||||||||||
| EPMA Analysis No. | 1/1 | 1/2 | 1/3 | 1/4 | 1/5 | 1/6 | 1/7 | 1/8 | 1/9 | 1/10 | 1/11 | ||
| S | 53.00 | 53.25 | 53.11 | 53.25 | 52.49 | 53.15 | 52.86 | 53.13 | 53.00 | 53.11 | 53.25 | ||
| Fe | 45.88 | 45.62 | 46.25 | 45.62 | 46.33 | 46.36 | 45.80 | 46.34 | 45.88 | 45.25 | 45.62 | ||
| Co | 0.06 | 0.15 | 0.10 | 0.15 | 0.04 | 0.03 | 0.19 | 0.07 | 0.06 | 0.10 | 0.15 | ||
| Ni | 0.03 | 0.06 | 0.04 | 0.06 | 0.03 | 0.02 | 0.10 | 0.06 | 0.03 | 0.03 | 0.06 | ||
| Cu | bdl | bdl | 0.02 | bdl | bdl | 0.02 | 0.02 | 0.01 | bdl | 0.02 | bdl | ||
| Zn | bdl | 0.04 | bdl | 0.04 | 0.03 | bdl | bdl | bdl | bdl | bdl | 0.04 | ||
| As | bdl | 0.01 | bdl | 0.01 | bdl | 0.01 | 0.01 | 0.02 | bdl | bdl | 0.01 | ||
| Ag | 0.01 | 0.02 | 0.04 | 0.02 | bdl | 0.04 | bdl | 0.03 | 0.01 | 0.04 | 0.02 | ||
| Total | 98.99 | 99.17 | 99.53 | 99.16 | 99.11 | 99.82 | 98.99 | 99.96 | 99.33 | 99.13 | 99.61 | ||
| Co/Ni | 1.96 | 2.54 | 2.40 | 2.54 | 1.17 | 1.76 | 1.89 | 1.17 | 1.96 | 3.20 | 2.54 | ||
| S/Fe | 1.16 | 1.17 | 1.15 | 1.17 | 1.13 | 1.15 | 1.15 | 1.15 | 1.16 | 1.17 | 1.17 | ||
| Fe/(S+As) | 0.87 | 0.86 | 0.87 | 0.86 | 0.88 | 0.87 | 0.87 | 0.87 | 0.87 | 0.85 | 0.86 | ||
| bdl = below detection limit | |||||||||||||
| Lithology: Quartz-mica Schist, Sample No. JGB-8 | ||||||||||
| Mineral Name | Magnetite | |||||||||
| EPMA Analysis No. | 1/1 | 1/2 | 1/3 | 1/4 | 1/5 | 1/6 | 1/7 | 1/8 | 1/9 | 1/10 |
| Wt% | ||||||||||
| SiO2 | 0.02 | 0.17 | 0.06 | 0.10 | 0.02 | bdl | 0.05 | 0.04 | 0.10 | 0.06 |
| TiO2 | 0.05 | 0.01 | 0.05 | 0.07 | 0.01 | 0.10 | 0.05 | 0.09 | 0.01 | 0.05 |
| Al2O3 | 0.12 | 0.14 | 0.13 | 0.11 | 0.10 | 0.28 | 0.15 | 0.27 | 0.26 | 0.21 |
| Cr2O3 | 0.05 | 0.06 | 0.04 | 0.05 | 0.07 | 0.06 | 0.07 | 0.04 | 0.05 | 0.03 |
| V2O3 | 0.20 | 0.17 | 0.18 | 0.07 | 0.17 | 0.15 | 0.08 | 0.15 | 0.19 | 0.17 |
| FeO | 89.02 | 87.69 | 88.49 | 87.88 | 87.82 | 83.39 | 83.82 | 88.57 | 86.63 | 88.98 |
| MnO | bdl | 0.06 | bdl | 0.06 | bdl | 0.01 | 0.03 | bdl | bdl | bdl |
| MgO | 0.05 | 0.08 | bdl | bdl | 0.03 | bdl | 0.01 | bdl | bdl | bdl |
| CaO | bdl | 0.03 | bdl | bdl | bdl | 0.01 | 0.02 | bdl | 0.02 | bdl |
| Na2O | 0.02 | 0.01 | 0.05 | 0.03 | bdl | 0.08 | 0.01 | 0.01 | 0.01 | 0.05 |
| K2O | 0.04 | 0.03 | bdl | bdl | bdl | 0.02 | bdl | 0.01 | 0.02 | bdl |
| NiO | 0.05 | 0.05 | 0.05 | 0.06 | 0.07 | 0.05 | 0.06 | 0.07 | 0.05 | 0.05 |
| CoO | 0.02 | 0.03 | 0.02 | 0.03 | 0.04 | 0.02 | 0.03 | 0.04 | 0.02 | 0.02 |
| Total | 89.64 | 88.53 | 89.07 | 88.46 | 88.33 | 84.17 | 84.38 | 89.29 | 87.36 | 89.62 |
| apfu Number of ions on the basis of 4 (O) | ||||||||||
| Si | 0.01 | 0.08 | 0.03 | 0.05 | 0.01 | bdl | 0.02 | 0.02 | 0.05 | 0.03 |
| Ti | 0.03 | 0.01 | 0.03 | 0.04 | 0.01 | 0.06 | 0.03 | 0.05 | 0.01 | 0.03 |
| Al | 0.06 | 0.07 | 0.07 | 0.06 | 0.05 | 0.15 | 0.08 | 0.14 | 0.14 | 0.11 |
| Cr | 0.03 | 0.04 | 0.03 | 0.03 | 0.05 | 0.04 | 0.05 | 0.03 | 0.03 | 0.02 |
| V | 0.11 | 0.10 | 0.10 | 0.04 | 0.10 | 0.08 | 0.04 | 0.08 | 0.11 | 0.10 |
| Fe | 69.20 | 68.16 | 68.78 | 68.31 | 68.26 | 64.82 | 65.15 | 68.85 | 67.34 | 69.17 |
| Mn | bdl | 0.05 | bdl | 0.05 | bdl | 0.01 | 0.02 | bdl | bdl | bdl |
| Mg | 0.03 | 0.05 | bdl | bdl | 0.02 | bdl | 0.01 | bdl | bdl | bdl |
| Ca | bdl | 0.02 | bdl | bdl | bdl | 0.01 | 0.01 | bdl | 0.01 | bdl |
| Na | 0.01 | 0.01 | 0.04 | 0.02 | bdl | 0.06 | 0.01 | 0.01 | 0.01 | 0.04 |
| K | 0.03 | 0.02 | bdl | bdl | bdl | 0.02 | bdl | 0.01 | 0.02 | bdl |
| Ni | 0.04 | 0.04 | 0.04 | 0.05 | 0.06 | 0.04 | 0.05 | 0.06 | 0.04 | 0.04 |
| Co | 0.01 | 0.02 | 0.01 | 0.02 | 0.03 | 0.01 | 0.02 | 0.03 | 0.01 | 0.01 |
| Co/Ni | 0.25 | 0.50 | 0.25 | 0.40 | 0.50 | 0.25 | 0.40 | 0.50 | 0.25 | 0.25 |
| Ni/Cr | 1.18 | 1.00 | 1.48 | 1.67 | 1.20 | 1.00 | 1.06 | 2.00 | 1.18 | 1.95 |
| Lithology: Albitite No. JGB-10 | ||||||||||
| Mineral name | Magnetite | |||||||||
| EPMA Analysis No. | 1/1 | 1/2 | 1/3 | 1/4 | 1/5 | 1/6 | 1/7 | 1/8 | 1/9 | |
| Wt% | ||||||||||
| SiO2 | 0.10 | 0.10 | 0.02 | 0.04 | 0.01 | 0.03 | 0.03 | 0.09 | 0.03 | |
| SiO2 | 0.10 | 0.10 | 0.02 | 0.04 | 0.01 | 0.03 | 0.03 | 0.09 | 0.03 | |
| TiO2 | 0.03 | 0.03 | 0.06 | 0.04 | 0.11 | 0.02 | 0.03 | 0.07 | 0.01 | |
| Al2O3 | 0.17 | 0.19 | 0.19 | 0.08 | 0.25 | 0.09 | 0.06 | 0.25 | 0.17 | |
| Cr2O3 | 0.04 | 0.08 | 0.07 | 0.01 | 0.06 | 0.09 | 0.04 | 0.09 | 0.09 | |
| V2O3 | 0.15 | 0.12 | 0.26 | 0.20 | 0.13 | 0.13 | 0.16 | 0.03 | 0.08 | |
| FeO | 86.27 | 88.91 | 85.43 | 88.23 | 87.69 | 87.28 | 88.19 | 84.06 | 88.37 | |
| MnO | bdl | bdl | bdl | bdl | 0.10 | 0.06 | 0.03 | bdl | 0.09 | |
| MgO | 0.04 | bdl | 0.01 | bdl | bdl | bdl | bdl | 0.01 | bdl | |
| CaO | 0.04 | bdl | 0.04 | bdl | bdl | 0.01 | bdl | 0.05 | bdl | |
| Na2O | bdl | 0.08 | 0.03 | 0.03 | 0.02 | bdl | 0.01 | 0.02 | 0.01 | |
| K2O | bdl | bdl | 0.02 | bdl | bdl | 0.01 | 0.03 | bdl | 0.01 | |
| NiO | 0.04 | 0.07 | 0.09 | 0.05 | 0.09 | 0.09 | 0.04 | 0.31 | 0.14 | |
| CoO | 0.02 | 0.05 | 0.02 | 0.03 | 0.05 | 0.04 | 0.02 | 0.02 | 0.04 | |
| Total | 86.90 | 89.63 | 86.24 | 88.71 | 88.51 | 87.85 | 88.64 | 85.00 | 89.04 | |
| apfu Number of ions on the basis of 4 (O) | ||||||||||
| Si | 0.05 | 0.05 | 0.01 | 0.02 | bdl | 0.01 | 0.01 | 0.04 | 0.01 | |
| Ti | 0.02 | 0.02 | 0.04 | 0.02 | 0.07 | 0.01 | 0.02 | 0.04 | 0.01 | |
| Al | 0.09 | 0.10 | 0.10 | 0.04 | 0.13 | 0.05 | 0.03 | 0.13 | 0.09 | |
| Cr | 0.02 | 0.05 | 0.05 | 0.01 | 0.04 | 0.06 | 0.02 | 0.06 | 0.06 | |
| V | 0.08 | 0.07 | 0.15 | 0.11 | 0.07 | 0.07 | 0.09 | 0.02 | 0.04 | |
| Fe | 67.06 | 69.11 | 66.41 | 68.58 | 68.16 | 67.84 | 68.55 | 65.34 | 68.69 | |
| Mn | bdl | bdl | bdl | bdl | 0.08 | 0.05 | 0.02 | bdl | 0.07 | |
| Mg | 0.02 | bdl | 0.01 | bdl | bdl | bdl | bdl | 0.01 | bdl | |
| Ca | 0.03 | bdl | 0.03 | bdl | bdl | 0.01 | bdl | 0.04 | bdl | |
| Na | bdl | 0.06 | 0.02 | 0.02 | 0.01 | bdl | 0.01 | 0.01 | 0.01 | |
| K | bdl | bdl | 0.02 | bdl | bdl | 0.01 | 0.02 | bdl | 0.01 | |
| Ni | 0.03 | 0.06 | 0.07 | 0.04 | 0.07 | 0.07 | 0.03 | 0.24 | 0.11 | |
| Co | 0.01 | 0.04 | 0.01 | 0.02 | 0.04 | 0.03 | 0.01 | 0.01 | 0.03 | |
| Co/Ni | 0.33 | 0.67 | 0.14 | 0.50 | 0.57 | 0.43 | 0.33 | 0.04 | 0.27 | |
| Ni/Cr | 1.50 | 1.20 | 1.40 | 4.00 | 1.75 | 1.17 | 1.50 | 4.00 | 1.83 | |
| Mineral Name | Apatite | ||||||
| EPMA Analysis No. | 1/1 | 1/2 | 1/3 | 1/4 | 1/5 | 1/6 | 1/7 |
| SiO2 | 0.04 | 0.21 | 0.04 | 0.06 | 0.53 | 0.04 | 0.23 |
| TiO2 | bdl | bdl | 0.07 | bdl | bdl | 0.19 | bdl |
| Al2O3 | bdl | 0.02 | bdl | 0.01 | 0.07 | 0.01 | 0.03 |
| Cr2O3 | bdl | 0.12 | 0.03 | bdl | bdl | bdl | bdl |
| FeO | 0.15 | 0.01 | 0.04 | 0.04 | 0.28 | 0.13 | bdl |
| MnO | bdl | bdl | 0.07 | 0.05 | 0.01 | bdl | bdl |
| MgO | bdl | bdl | bdl | bdl | bdl | bdl | bdl |
| CaO | 54.42 | 53.55 | 54.34 | 54.10 | 53.45 | 54.46 | 53.23 |
| Na2O | 0.54 | 0.07 | 0.03 | 0.09 | 0.08 | 0.03 | 0.07 |
| K2O | 0.02 | 0.01 | bdl | bdl | 0.01 | 0.02 | 0.02 |
| P2O5 | 38.10 | 39.91 | 39.92 | 41.05 | 41.14 | 38.99 | 41.12 |
| F | 5.89 | 5.20 | 4.74 | 4.32 | 4.23 | 5.97 | 5.10 |
| Cl | 0.73 | 0.14 | 0.12 | 0.29 | 0.16 | 0.08 | 0.16 |
| Total | 99.89 | 99.23 | 99.40 | 100.00 | 99.94 | 99.91 | 99.96 |
| F/Cl | 8.05 | 38.52 | 38.19 | 15.06 | 26.75 | 79.53 | 32.28 |
| bdl = below detection limit | |||||||
| Samples | Descriptions | Type | Origin | Size (µm) | TmCO2 | Te | Tmice | ThCO2 | Th Total | Salinity | Density |
|---|---|---|---|---|---|---|---|---|---|---|---|
| Mineralized Quartz veins | Mono phase carbonic inclusions | I | Primary | 2–15 | −56.6 to −60.2 °C | - | - | 1.9 to 28 °C | - | - | 0.66 to 0.92 g/cc |
| Aqueous carbonic inclusions | II | Primary | 6–30 | −56.6 to 58.8 °C | −26.5 to −32 °C | −3 to −7 °C | 2.5 to 4.2 °C | 235 to 258 °C | 4.86 to 10.48 | 0.87 to 0.98 g/cc | |
| Aqueous inclusion | III | Primary | 2–28 | −30 to −51 °C | −6.9 to −30.0 °C | - | 146 to 252 °C | 10.35 to 28.15 | 0.98 to 1.10 g/cc | ||
| Secondary aqueous inclusions | IV | Secondary | 1–15 | −22.5 to −44 °C | −4.5 to −22.7 °C | - | 120 to 238 °C | 7.10 to 24.09 | 0.93 to 1.11 g/cc |
| Sl. No. | Sample No. | δ34S VCDT‰ | St. dev. | Sulfide Mineral Phase |
|---|---|---|---|---|
| 1. | JPSI-1 | 8.89 | 0.20 | Pyrrhotite |
| 2. | JPSI-2 | 9.80 | 0.17 | |
| 3. | JPSI-3 | 10.87 | 0.37 | |
| 4. | JPSI-4 | 10.67 | 0.16 | |
| 5. | JPSI-5 | 10.52 | 0.27 | |
| 6. | JPSI-6 | 10.82 | 0.31 | |
| 7. | JPSI-7 | 11.36 | 0.14 | |
| 8. | JPSI-8 | 12.34 | 0.37 | |
| 9. | JPSI-9 | 12.81 | 0.11 | Arsenopyrite |
| 10. | JPSI-10 | 10.98 | 0.20 | |
| 11. | JPSI-11 | 11.00 | 0.07 | |
| 12. | JPSI-12 | 11.42 | 0.13 | |
| 13. | JPSI-13 | 11.73 | 0.16 | |
| 14. | JPSI-14 | 13.68 | 0.11 | |
| 15. | JPSI-15 | 14.58 | 0.08 | |
| 16. | JPSI-16 | 10.77 | 0.10 | Chalcopyrite |
| 17. | JPSI-17 | 10.90 | 0.05 | |
| 18. | JPSI-18 | 11.18 | 0.26 | |
| 19. | JPSI-19 | 10.99 | 0.03 | |
| 20. | JPSI-20 | 10.14 | 0.09 | |
| 21. | JPSI-21 | 10.67 | 0.33 | |
| 22. | JPSI-22 | 11.56 | 0.18 | |
| 23. | JPSI-23 | 12.03 | 0.28 | |
| 24. | JPSI-24 | 12.14 | 0.15 | |
| 25. | JPSI-25 | 10.28 | 0.06 | Pyrite |
| 26. | JPSI-26 | 10.39 | 0.16 | |
| 27. | JPSI-27 | 10.29 | 0.05 | |
| 28. | JPSI-28 | 10.71 | 0.46 | |
| 29. | JPSI-29 | 11.05 | 0.52 | |
| 30. | JPSI-30 | 10.62 | 0.30 | |
| 31. | JPSI-31 | 10.87 | 0.59 |
| Lithology: Quartz-Mica Schist | ||||||||||
|---|---|---|---|---|---|---|---|---|---|---|
| Trace Elements & REEs (ppm) | ||||||||||
| Ga | 38 | 31 | 28 | 54 | 69 | 46 | 53 | 46 | 51 | 109 |
| Sc | 10 | 11 | 10 | 23 | 20 | 09 | 09 | 9 | 13 | 11 |
| V | 78 | 85 | 92 | 122 | 90 | 104 | 87 | 88 | 92 | 88 |
| Th | 20 | 21 | 30 | 27 | 26 | 30 | 23 | 21 | 27 | 22 |
| Pb | 120 | 400 | 70 | 40 | 50 | 30 | 25 | 25 | 25 | 40 |
| Ni | 300 | 140 | 100 | 90 | 130 | 70 | 80 | 100 | 70 | 400 |
| Co | 1100 | 950 | 480 | 860 | 480 | 730 | 290 | 330 | 840 | 1600 |
| Cr | 155 | 176 | 179 | 306 | 348 | 223 | 234 | 215 | 218 | 228 |
| Sr | 69 | 70 | 72 | 78 | 64 | 56 | 63 | 68 | 68 | 53 |
| Zr | 142 | 134 | 121 | 97 | 76 | 119 | 102 | 105 | 114 | 60 |
| Cu | 4600 | 2400 | 1200 | 15200 | 4700 | 4600 | 3100 | 7100 | 1100 | 4700 |
| Zn | 20 | 100 | 10 | 40 | 20 | 20 | 10 | 10 | 10 | 10 |
| Be | 3.88 | 4.30 | 3.47 | 2.67 | 2.94 | 3.00 | 2.34 | 1.82 | 2.48 | 1.54 |
| Ge | 1.64 | 1.72 | 1.52 | 1.03 | 0.98 | 1.32 | 1.23 | 1.31 | 1.42 | 1.11 |
| Y | 34.86 | 28.68 | 19.68 | 47.61 | 96.01 | 23.40 | 19.14 | 19.99 | 18.95 | 38.82 |
| Mo | 1.54 | 1.74 | 2.10 | 2.38 | 4.23 | 2.28 | 3.29 | 3.00 | 2.88 | 3.00 |
| Sn | 3.76 | 3.76 | 3.73 | 3.81 | 2.74 | 3.98 | 2.75 | 3.21 | 3.76 | 5.06 |
| La | 50.29 | 75.60 | 34.52 | 10.63 | 32.64 | 31.74 | 21.73 | 19.90 | 16.53 | 24.16 |
| Ce | 89.24 | 133.66 | 59.79 | 0.06 | 4.93 | 56.72 | 39.25 | 35.17 | 65.10 | 6.87 |
| Pr | 10.41 | 15.44 | 6.99 | 0.27 | 0.86 | 6.79 | 4.96 | 4.37 | 7.83 | 1.02 |
| Nd | 40.40 | 59.37 | 28.11 | 1.72 | 4.35 | 27.60 | 19.83 | 17.54 | 31.42 | 4.74 |
| Sm | 6.88 | 9.26 | 4.73 | 0.86 | 1.67 | 4.31 | 3.53 | 2.78 | 5.05 | 1.21 |
| Eu | 1.24 | 1.62 | 0.84 | 0.34 | 0.49 | 0.89 | 0.75 | 0.66 | 0.95 | 0.41 |
| Gd | 6.32 | 7.62 | 4.04 | 2.71 | 5.40 | 3.85 | 3.25 | 2.84 | 4.17 | 2.34 |
| Tb | 1.18 | 1.27 | 0.73 | 1.00 | 1.98 | 0.74 | 0.62 | 0.58 | 0.69 | 0.77 |
| Dy | 7.05 | 6.15 | 4.07 | 8.34 | 17.44 | 4.61 | 3.60 | 3.63 | 3.78 | 6.74 |
| Ho | 1.31 | 1.11 | 0.74 | 1.76 | 3.60 | 0.89 | 0.72 | 0.76 | 0.68 | 1.39 |
| Er | 3.72 | 3.09 | 2.23 | 4.84 | 9.88 | 2.61 | 2.01 | 2.17 | 2.00 | 3.91 |
| Tm | 0.58 | 0.45 | 0.31 | 0.71 | 1.40 | 0.37 | 0.28 | 0.31 | 0.27 | 0.56 |
| Yb | 3.39 | 2.65 | 2.04 | 3.93 | 7.50 | 2.42 | 1.74 | 2.02 | 1.82 | 3.26 |
| Lu | 0.46 | 0.38 | 0.30 | 0.52 | 0.95 | 0.31 | 0.25 | 0.29 | 0.26 | 0.45 |
| Hf | 4.36 | 4.20 | 4.15 | 3.27 | 2.83 | 4.61 | 3.80 | 3.88 | 3.89 | 2.82 |
| Ta | 1.27 | 1.14 | 1.16 | 1.46 | 0.66 | 1.26 | 1.14 | 1.11 | 1.06 | 0.88 |
| W | 27.00 | 6.42 | 6.47 | 6.76 | 4.76 | 14.72 | 11.26 | 11.41 | 11.70 | 10.11 |
| U | 3.15 | 3.31 | 2.42 | 3.62 | 2.98 | 3.83 | 3.48 | 3.39 | 3.16 | 2.89 |
| Bi | 0.16 | 0.27 | 0.38 | 2.65 | 2.94 | 1.31 | 2.17 | 2.33 | 1.05 | 5.46 |
| Te | 1.26 | 1.09 | 1.02 | 0.20 | 0.27 | 1.21 | 0.97 | 0.92 | 1.02 | 1.01 |
| Se | 0.20 | 0.20 | 0.20 | 0.20 | 0.20 | 0.20 | 0.20 | 0.20 | 0.20 | 0.20 |
| Au | 4.62 | 1.70 | 1.20 | 3.10 | 1.70 | 2.20 | 2.40 | 4.30 | 1.40 | 3.30 |
Publisher’s Note: MDPI stays neutral with regard to jurisdictional claims in published maps and institutional affiliations. |
© 2022 by the authors. Licensee MDPI, Basel, Switzerland. This article is an open access article distributed under the terms and conditions of the Creative Commons Attribution (CC BY) license (https://creativecommons.org/licenses/by/4.0/).
Share and Cite
Anand, A.; Singh, S.; Gantait, A.; Srivastava, A.; Mayachar, G.K.; Kumar, M. Geological Constraints on the Genesis of Jagpura Au-Cu Deposit NW India: Implications from Magnetite-Apatite Mineral Chemistry, Fluid Inclusion and Sulfur Isotope Study. Minerals 2022, 12, 1345. https://doi.org/10.3390/min12111345
Anand A, Singh S, Gantait A, Srivastava A, Mayachar GK, Kumar M. Geological Constraints on the Genesis of Jagpura Au-Cu Deposit NW India: Implications from Magnetite-Apatite Mineral Chemistry, Fluid Inclusion and Sulfur Isotope Study. Minerals. 2022; 12(11):1345. https://doi.org/10.3390/min12111345
Chicago/Turabian StyleAnand, Abhishek, Sahendra Singh, Arindam Gantait, Amit Srivastava, Girish Kumar Mayachar, and Manoj Kumar. 2022. "Geological Constraints on the Genesis of Jagpura Au-Cu Deposit NW India: Implications from Magnetite-Apatite Mineral Chemistry, Fluid Inclusion and Sulfur Isotope Study" Minerals 12, no. 11: 1345. https://doi.org/10.3390/min12111345
APA StyleAnand, A., Singh, S., Gantait, A., Srivastava, A., Mayachar, G. K., & Kumar, M. (2022). Geological Constraints on the Genesis of Jagpura Au-Cu Deposit NW India: Implications from Magnetite-Apatite Mineral Chemistry, Fluid Inclusion and Sulfur Isotope Study. Minerals, 12(11), 1345. https://doi.org/10.3390/min12111345