Article

Variation in Iron Ore Sinter Mineralogy with Changes in Basicity

1
Centre for Ironmaking Materials Research, University of Newcastle, Callaghan, NSW 2308, Australia
2
BlueScope Steel, Port Kembla, NSW 2505, Australia
3
CSIRO Mineral Resources, Clayton, VIC 3168, Australia
4
CSIRO Mineral Resources, Pullenvale, QLD 4069, Australia
5
BHP Marketing Iron Ore, Brisbane, QLD 4000, Australia
*
Author to whom correspondence should be addressed.
Minerals 2022, 12(10), 1249; https://doi.org/10.3390/min12101249
Submission received: 22 August 2022 / Revised: 23 September 2022 / Accepted: 26 September 2022 / Published: 30 September 2022
(This article belongs to the Special Issue Mineralogy of Iron Ore Sinters, Volume II)

Abstract

:
The target basicity of iron ore sinter is set by blast furnace slag composition requirements, and therefore varies with the proportion of acid burden such as lump iron ore and pellets. Increasing the lump proportion of the burden will increase the target sinter basicity. The mineralogy of sinter produced with a range of basicity between 1.0 and 3.0 was analysed using optical point counting under reflected light microscopy. Sinter from BlueScope Steel’s industrial sinter strand was analysed over a 30-year period, during which time a wide range of iron ore fines blends were utilised and several significant process modifications made. These data were compared with the mineralogy of sinters produced in a pilot-scale sinter pot, a laboratory-scale milli-pot, and small-scale sinter analogues. The mineralogy of the sinters from all scales followed a predictable trend with basicity, generally following the diagram proposed by Bagnall. At a basicity of 1.0, high temperatures were required to produce sinter with adequate strength, resulting in bonding phases dominated by magnetite and glass. Increasing basicity to 2.0 decreased the required sintering temperature and changed the mineralogy to a majority of hematite and SFCA. Further increases in basicity to 3.0 further decreased the required sintering temperature and increased the SFCA and dicalcium silicate content.

1. Introduction

The main ferrous feed to blast furnaces in the Asia-Pacific region is sinter at levels of 70%, with proportions of lump iron ore and pellets making up the remaining ferrous burden [1,2]. The ratio of lump iron ore is being increased in many operations for economic and environmental reasons, as the energy consumption and greenhouse gas emissions of the agglomeration process are being eliminated. The amount of limestone flux added to the sintering process is usually targeted to obtain a particular operational outcome in the blast furnace, e.g., a desired basicity (CaO/SiO2), slag volume, etc. As the amount of lump and/or number of pellets is varied, the basicity of the sinter is adjusted to suit. Critically, the availability of calcium and silicon in the liquid phase during sintering has a strong influence on the resulting bonding phases and structures in the sintered agglomerates, as well as the temperature required in sintering to produce sinter of an acceptable quality. Sinter plants target sinter with a suitable strength and size, as well as reducibility and reduction disintegration index—with the fuel rate being one of the key control variables along with careful control of the ore blend [3]. In a similar manner, the fuel rate is adjusted in pilot-scale sinter pot experiments to target a particular sinter strength, as well as a balance of returns, fines, input, and generation (balanced tests) [4].
Changes in basicity, ore blend, and fuel rate can be expected to have a significant influence on the mineralogy of the resultant sinters. The mineral phases present in sinter have been studied extensively and have been shown to have a significant influence on sinter quality [5,6,7,8,9,10,11,12,13,14].
Early research (prior to 1977) on sinter mineralogy carried out at BHP’s Newcastle Steelworks, and to a lesser extent Port Kembla and Kwinana sinter plants, found strong relationships between basicity and mineralogy. Bagnall (1977) [15] collated a significant dataset of quantitative mineralogy measurements on sinter from these plants over a four-year period, representing a wide range of basicity (CaO/SiO2) from 0 to 3.2, and published a summary of those relationships—as shown in Figure 1. The chemical constraints that pertain to this dataset were: SiO2 between 4.5% and 6.0%; Al2O3 between 2.0% and 3.0%; and MgO less than 1.0%. Note that in Figure 1, no distinction has been made between primary and secondary hematite/magnetite and the field shown for silico-ferrite of calcium and aluminium (SFCA) refers to the SFCA phase—sensu stricto—as well the broader group of complex Ca ferrites, including the SFCA family of compounds. The data was generated via optical microscopy-based point counting of polished sinter sub-samples. A similar plot was published in Geerdes et al. (2020) [16].
The changes in mineralogy that occur with basicity have major implications for the sintering process as well as for the use of sinter in blast furnaces. For example, the Bagnall data [15] indicates that in sinters with a basicity of 1.0 or less, the main mineral phases present were magnetite—with a small amount of hematite with a bonding phase comprising fayalite and glass. As the basicity increased to ~1.2–1.6, the magnetite generally showed a downward trend and the hematite content increased. Concomitantly, the bonding phase shifted to calcium ferrites (SFCA phases) and the glassy phase decreased. Beyond a basicity of ~1.6–1.8, the magnetite and hematite contents both decreased at the expense of the formation of additional Ca ferrites and Ca silicate. At very high basicities, ~2.8–3.0, the content of glassy material is negligible. These general trends were also noted in the thermodynamic modelling of the FeO-Fe2O3-CaO-Al2O3-SiO2 system by [17], although the exact proportions of the different expected mineral phases were different. At 1373 K and an oxygen partial pressure of 10−3 atm, silicates decrease and the SFCA phase(s) increase with increases in the basicity in the raw material. This is because more CaO will react with hematite and silica in the silicates to form SFCA phases, causing the levels of the hematite and silicates to decrease.
Due to the heterogeneous nature of the sinter produced on a sinter strand, or even in a pilot-scale sinter pot, it can be difficult to directly study the formation of mineral phases. More fundamental studies have therefore been conducted at the laboratory scale with analogue tablet tests, which enable a greater control of temperature and gas composition and sample mixtures [5,7]. Experiments at these scales have demonstrated that sintering conditions such as maximum temperature, holding time at high temperature, and gas composition can result in significant changes in sinter mineralogy [18,19]. The challenge for these analogue tests is to define an appropriate temperature, time, and gas composition profile to accurately simulate a real sintering process.
The authors’ previous paper used a range of techniques to analyse the mineralogy of a small range of sinters with a basicity between 1.7 and 2.0 [8,20], which is typical of modern blast furnace operational requirements [2]. In this work, we extend that analysis to a much wider range of sinter basicities and to samples sintered at four different test scales: industrial-scale sinter, a range of pot test scales, and laboratory-scale tablet analogues. The results of which are then interpreted and compared in the framework of mineralogy versus basicity, as presented by [15].

2. Experimental

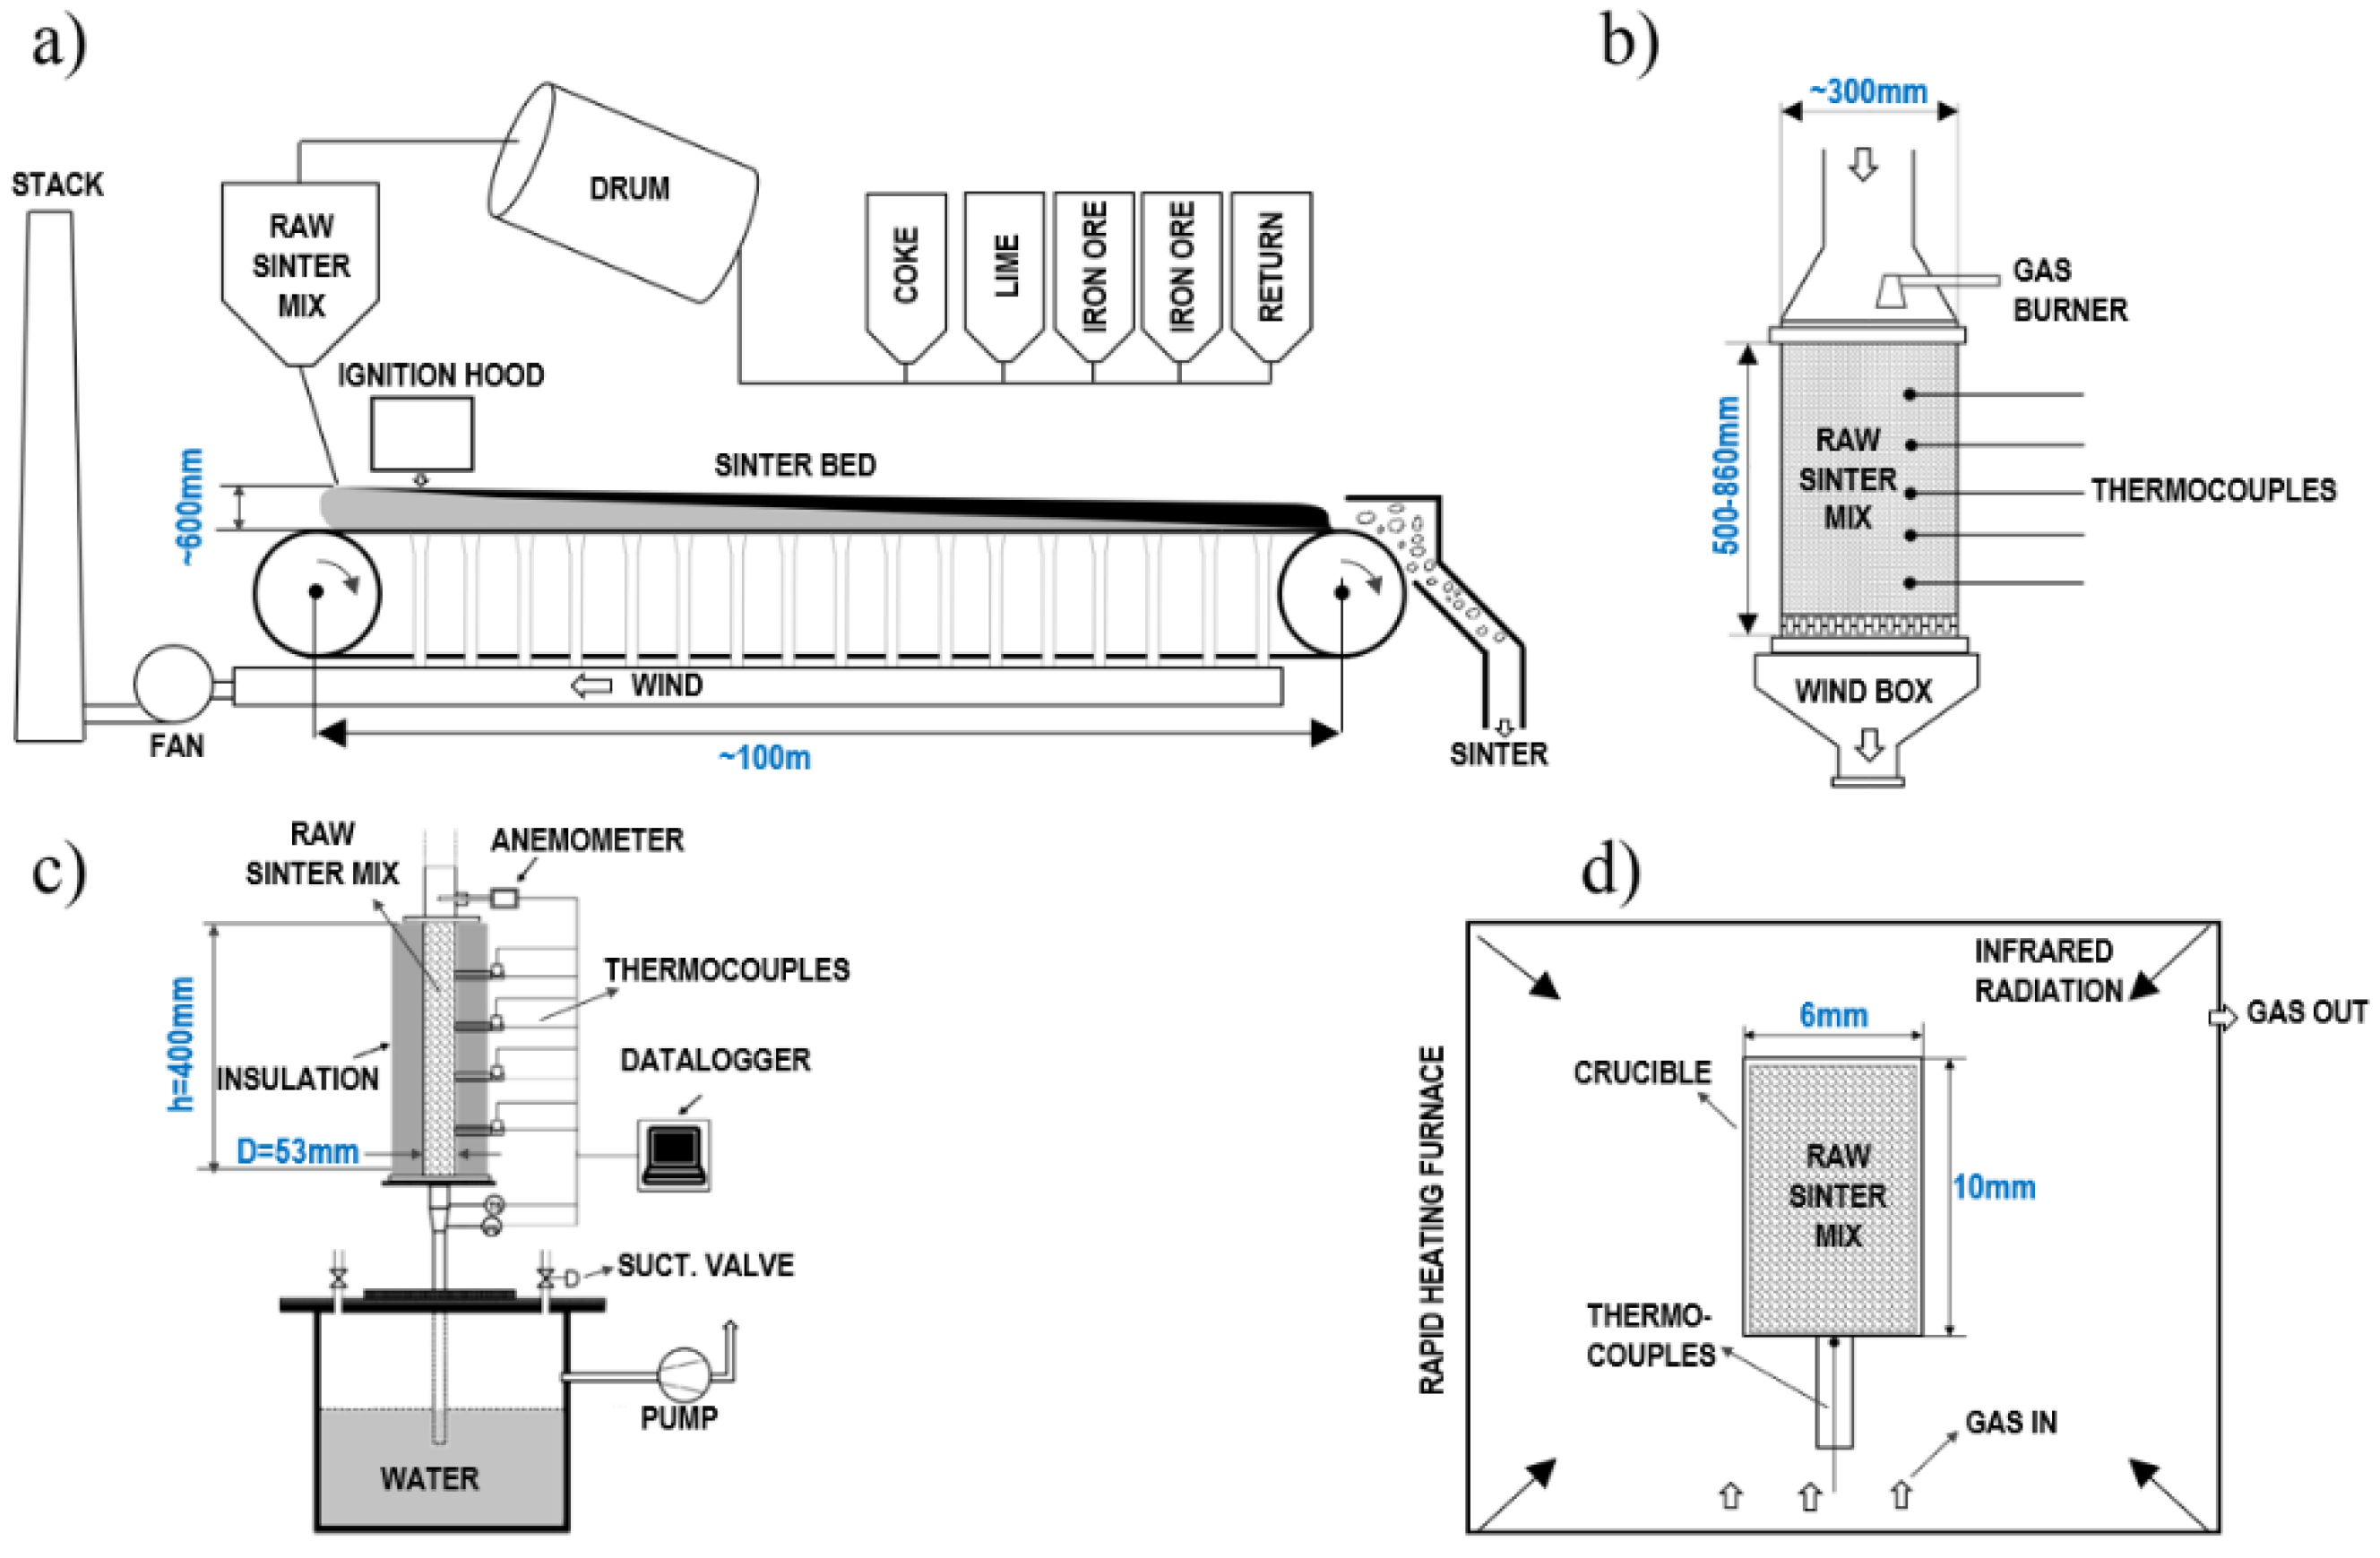
The relationship between sinter mineralogy and basicity (CaO/SiO2) was examined across iron ore sinter produced at four different reaction scales, which are shown in Figure 2. Pot tests were used to study the impact of basicity on productivity, fuel rate, and yield. Tablet scale analogue tests and thermodynamic modelling were used to probe melt behaviour and subsequent mineral outcomes. Equipment details and experimental procedures for each reaction scale are described in the following sub-sections.

2.1. Industrial Scale—Sinter Strand (BlueScope Steel Australia)

BlueScope Steel operates an industrial sinter strand in Australia, using a blend of Australian and imported iron ore fines. Over the period of 1986–2021, the mineralogy of the product sinter was regularly determined by optical microscopy—largely by a single microscopist. Over this period, the basicity of the sinter varied over the range 1.4–2.3. The MgO varied over the range 0.6%–1.7% and the alumina over the range 1.3%–2.4%. Furthermore, several operational changes occurred:
  • 1986–2009: 420 m2 strand area with 500 mm side plates.
  • 2009–2021: 480 m2 strand area with 700 mm side plates.
  • Pre 2011: Western Australian, South Australian, and Brazilian hematite dominated the blend.
  • Post 2011: Western Australian goethite-rich ores dominated the ore blend and the steelworks moved to single blast furnace operations, resulting in the sinter plant being operated at significantly lower productivity (20–25 t/m2/day compared to previous 35–40 t/m2/day).

2.2. Pilot Scale—Pot Tests

2.2.1. CSIRO Pot Test (65–120 kg)

Pilot-scale sinter pot tests were carried out on a range of iron ore fines blends at CSIRO Mineral Resources. Details of the sinter pot test equipment and procedure have been reported previously [21]; a summary is given here for convenience. The sinter pot has a grate area of 0.075 m2 and its depth can be varied between 0.5 and 0.86 m; in this case 0.6 m was used, a typical depth used for a sinter plant. A suction pressure of up to 20 kPa could be obtained using the sinter fan. About 65–120 kg of green granules were used for each standard pilot-scale sinter pot test. After granulation, the sinter mixture was loaded into the cylindrical sinter pot; the ignition was started using a natural gas burner at the top of the sinter pot for 90 s, during which time air was drawn down through the bed under negative 6 kPa pressure. At the end of the ignition period, the suction was increased to negative 16 kPa to force the flame front down through the bed. The sintering process is considered complete when the flame front has travelled through the bed, as evidenced by the peak temperature of the waste gas. The sinter was removed when it had cooled to below 200 °C for further processing and evaluation.
The sinter product was stabilised using a drop tower to produce the product sinter and return fines, and sinter process parameters such as the productivity and yield of product sinter were obtained. The tests were conducted so that the ratio of return fines generated in the test to the return fines used in the raw mix was between 0.95 and 1.05, known as the “return fines balance”. The product sinter was then tested for quality indices such as the tumble index (TI), relative reducibility (RI), and reduction disintegration index (RDI), as well as for the particle size distribution assay and mineralogy.

2.2.2. University of Newcastle Milli-Pot Test (1–2 kg)

Data generated from a smaller diameter milli-pot was also used. The milli-pot equipment and procedure are described in the authors’ earlier work [22]; it is briefly summarised here for convenience. The milli-pot sintering equipment consists of a steel tube (diameter 53 mm, height 400 mm, insulated by 100 mm thick ceramic fibre), vacuum pump, suction controlling valve, flow measuring tube, waste gas scrubbing tank, pressure and temperature probes, and data logger. To create suction in the wind-box, a water ring vacuum pump was used, with an automatic controlled bleed valve to control the suction. A blend of five types of iron ore fines (Australian and Brazilian) mixed with coke for fuel, dolomite, limestone, and return fines was prepared maintaining a basicity (CaO/SiO2 ratio) of 1.9. Samples of sinter product (+5 mm) from the upper half and lower half of the milli-pot were crushed to <2.0 mm size and mounted in epoxy resin blocks.

2.3. Laboratory Scale—Rapid Heating Furnace (University of Newcastle Australia)

Sinter analogues designed to simulate the bonding phase in iron ore sinter were prepared from Australian iron ore fines using an infra-red rapid heating furnace. The equipment and procedure are described in the authors’ previous work [5].
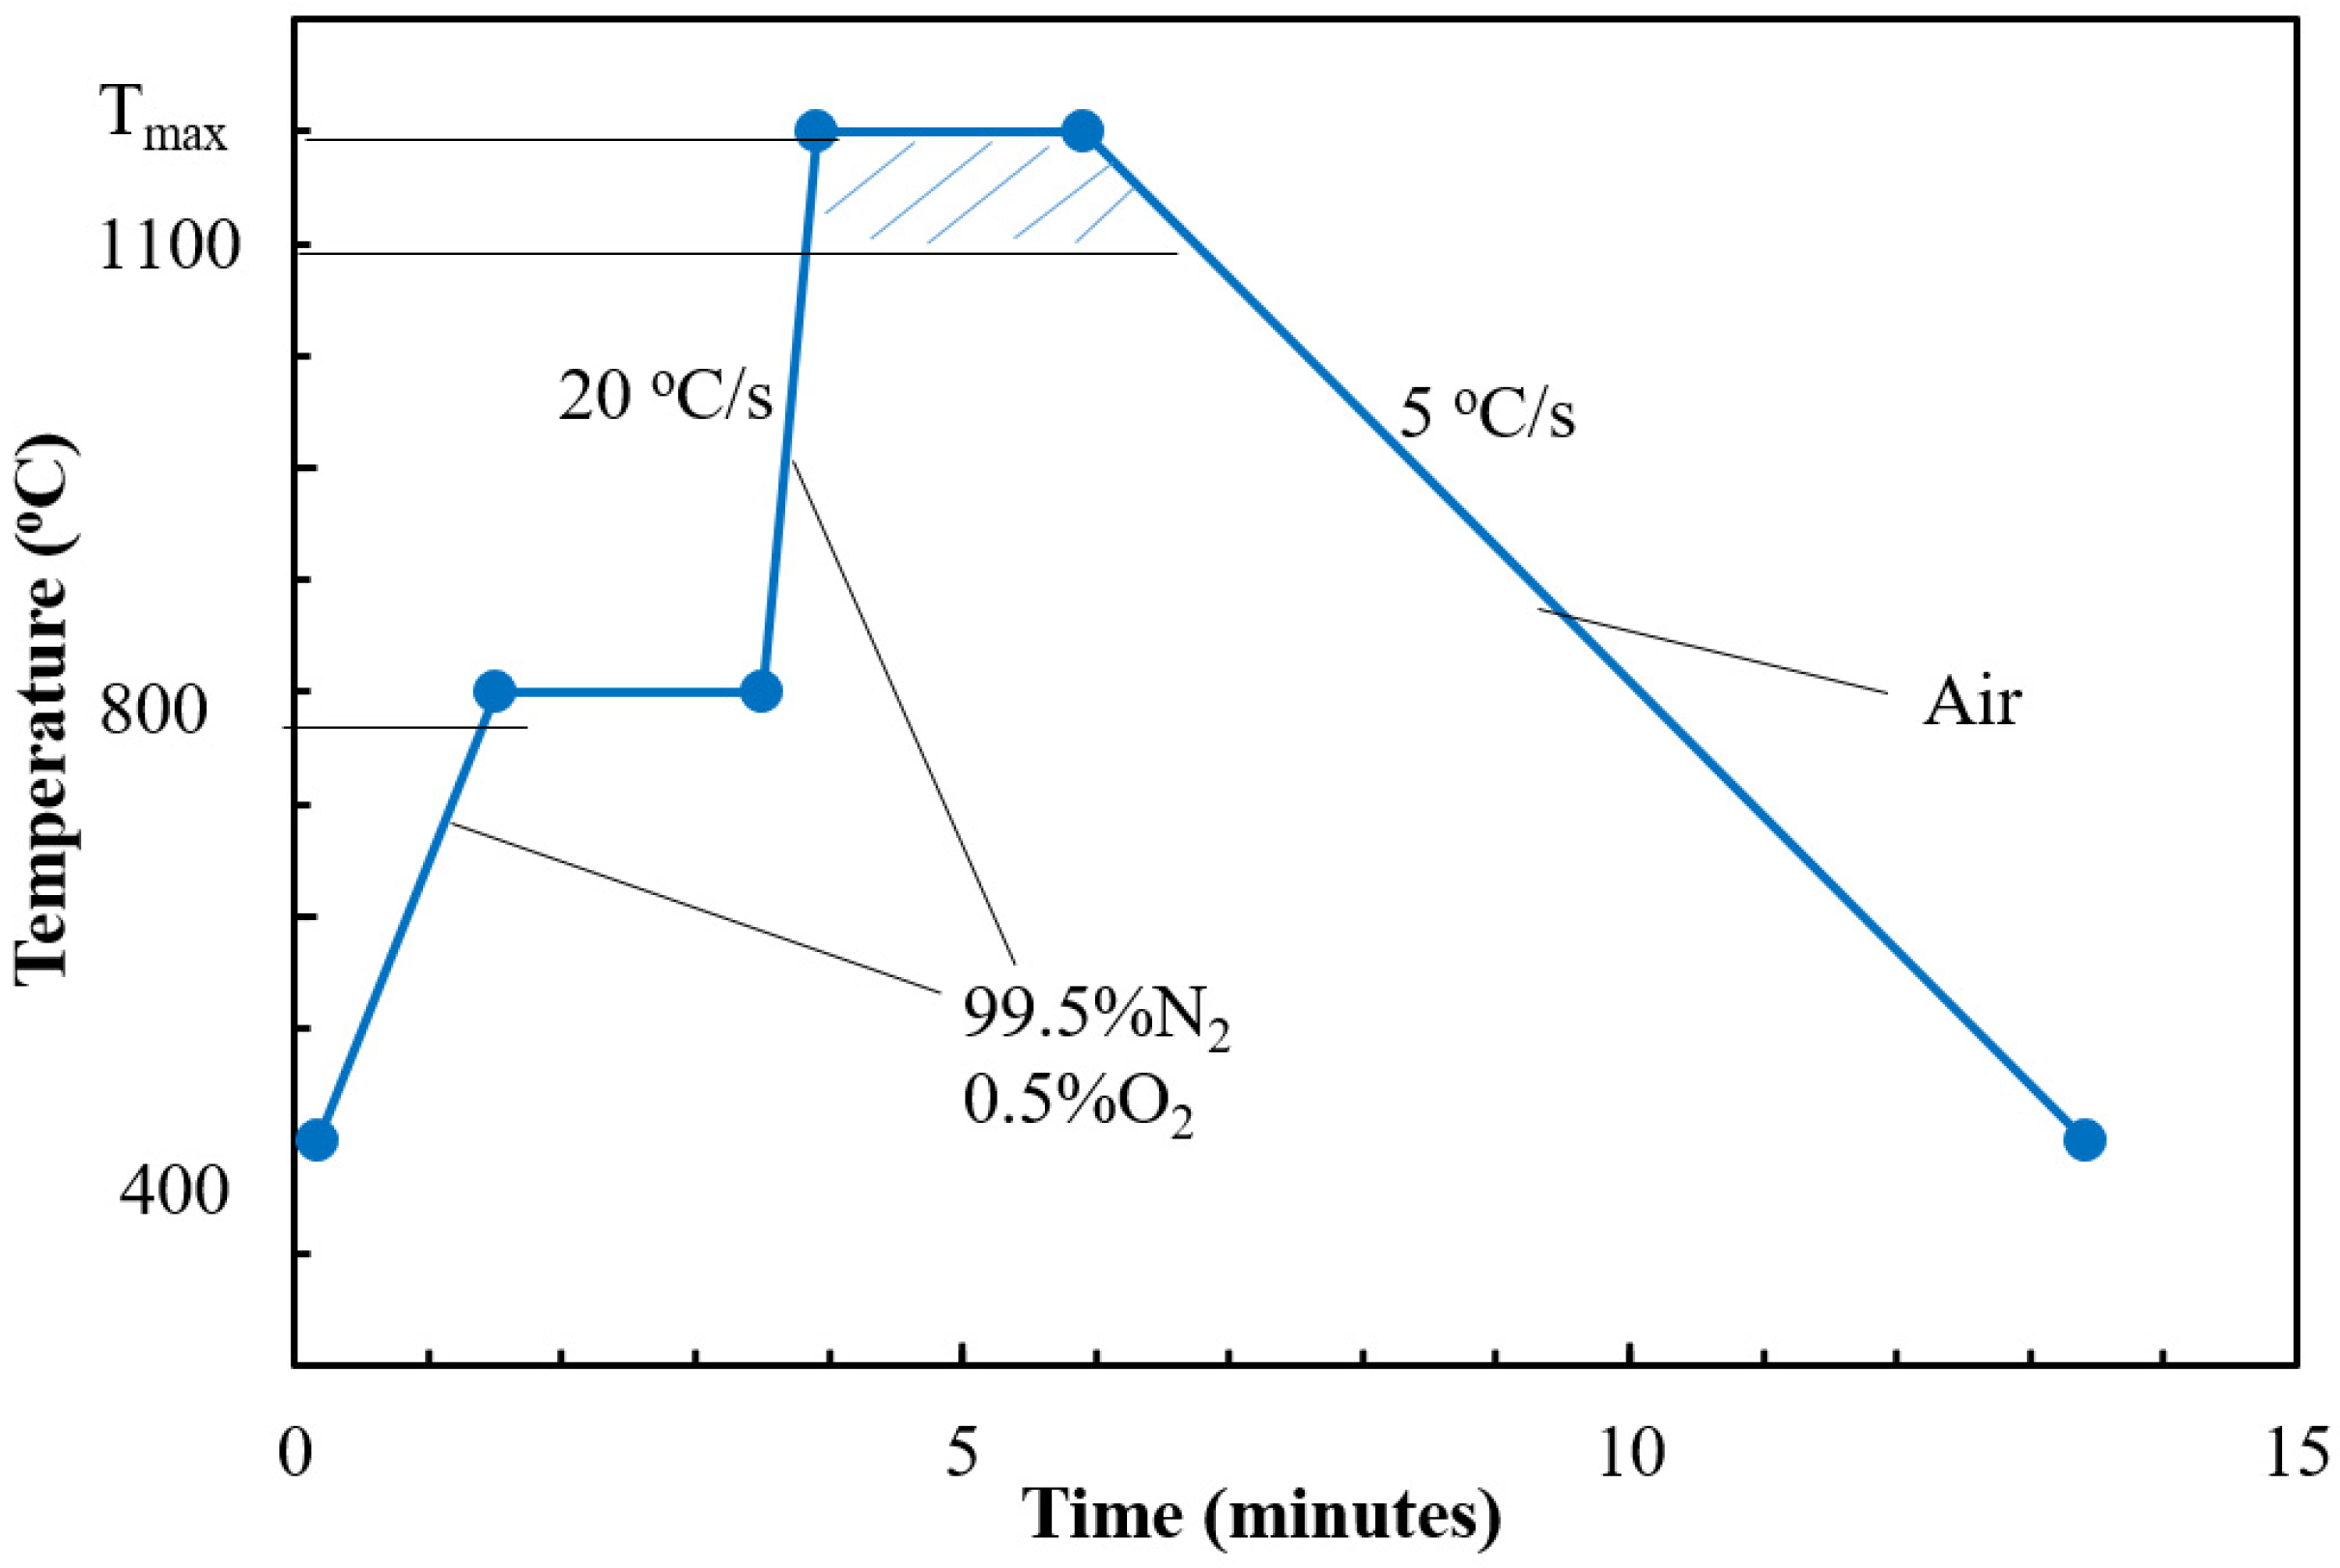
In these experiments, the −1 mm fraction of the iron ore was fluxed to a basicity (CaO/SiO2 ratio) ranging between 1 and 3 using reagent-grade CaCO3 with 5.4% SiO2, 1.8% MgO, 2.5% Al2O3, and the remainder being Fe2O3. The analogue tablets were heated following the temperature profile given in Figure 3, which is based on temperature measurements from sinter pot tests [23]. The rapid heating furnace allowed independent control of the maximum temperature (Tmax was varied from 1230 to 1480 °C, depending on the binary basicity), hold time (t = 1 min), and cooling rate (5 °C/s) for each experiment.
To find the appropriate Tmax when varying the basicity, several experimental attempts were made to develop the reference condition (Tmax and basicity) based on acceptable sinter strength. The liquid amount at Tmax of this “reference” condition was obtained using the thermodynamic modelling package FactSage v.8.0. This liquid amount was used to calculate the Tmax for other basicity analogues, as discussed in more detail in Section 3.3. Bottled gas with 0.5% O2 in N2 (pO2 = 5 × 10⁻³ atm) was injected into the furnace at 0.5 L/min during heating and for the hold time at the maximum temperature [24]. During cooling, the gas was switched to air at the same flow rate. The fired samples were then cooled in air down to room temperature for subsequent mineralogy evaluation.

2.4. Sinter Mineralogy Determination

Samples of sinter product (5–40 mm) from each of the scales of sintering were crushed to particle sizes less than 2 mm and further sub-sampled to an appropriate volume for a microscopy mount. The crushed sinter was then mounted in epoxy resin, cut, and polished to provide a reflective surface for optical assessment under reflected light. A quantitative assessment of the mineral phases was obtained following the scheme detailed in [8].
The principle of the measurement was to assess the prevalence of mineral phases over a referenced grid, counting the individual phases observed at each point until a quantitative assessment of the mineral content was achieved. The phases present and the microstructure of the sinter are known to have impact on facets of the sinter quality such as its physical strength and reducibility. The main phases identified were:
  • Primary and Secondary hematite
Primary hematite or relict-nuclei is the remnant hematite phase of the intial ore that, to a degree, is un-reacted during sintering. It often appears with the original ore microsctructure, such as in the microporosity and grain boundaries.
Secondary (or recrystallised) hematite is recognised as individual or loosely associated hematite grains that have undergone a significant reaction with a melt phase (or are precipitated from the melt) and are often recrystallised into a euhedral form. Note that in the Bagnall data [15], primary and secondary hematite have not been reported individually—hence in the current study, to provide comparable data, only the total hematite content has been reported.
  • Magnetite:
Magnetite is formed as an ex-solution phase from the melt upon cooling or as a result of reductions in hematite and exhibits a range of forms from euhedral skeletal to anhedral crystals, with a distinct pink colour under reflected light.
  • Silico ferrites of calcium and aluminium (SFCA):
SFCA represents a complex Ca-ferrite and includes platy (or fibrous/acicular) and prismatic (or columnar/blocky) SFCA forms. Platy SFCA’s appearance is fine-textured and microporous under reflected light, while prismatic SFCA typically exhibits either a dense texture with inter-grown crystals or a dendritic texture. In this study, in order to be consistent with the results of Bagnall, no distinction has been made regarding the various SFCA sub-types and total SFCA values have been reported.
  • Dicalcium silicate (C2S)
Dicalcium silicate (Ca2SiO4) characteristically appears as ‘cigar’- or ‘lens’-shaped crystal habit-textured under a reflected light microscope and is usually associated with areas of glass. Losses of dicalcium silicate are likely if water is used for polishing the sample because it is water-soluble. This can be minimised by polishing mounts with non-aqueous-based diamond suspensions.
  • Glass:
Glass is an amorphous phase found in the sinter—typically the result of temperatures above about 1300 °C causing melting of the bonding phases.
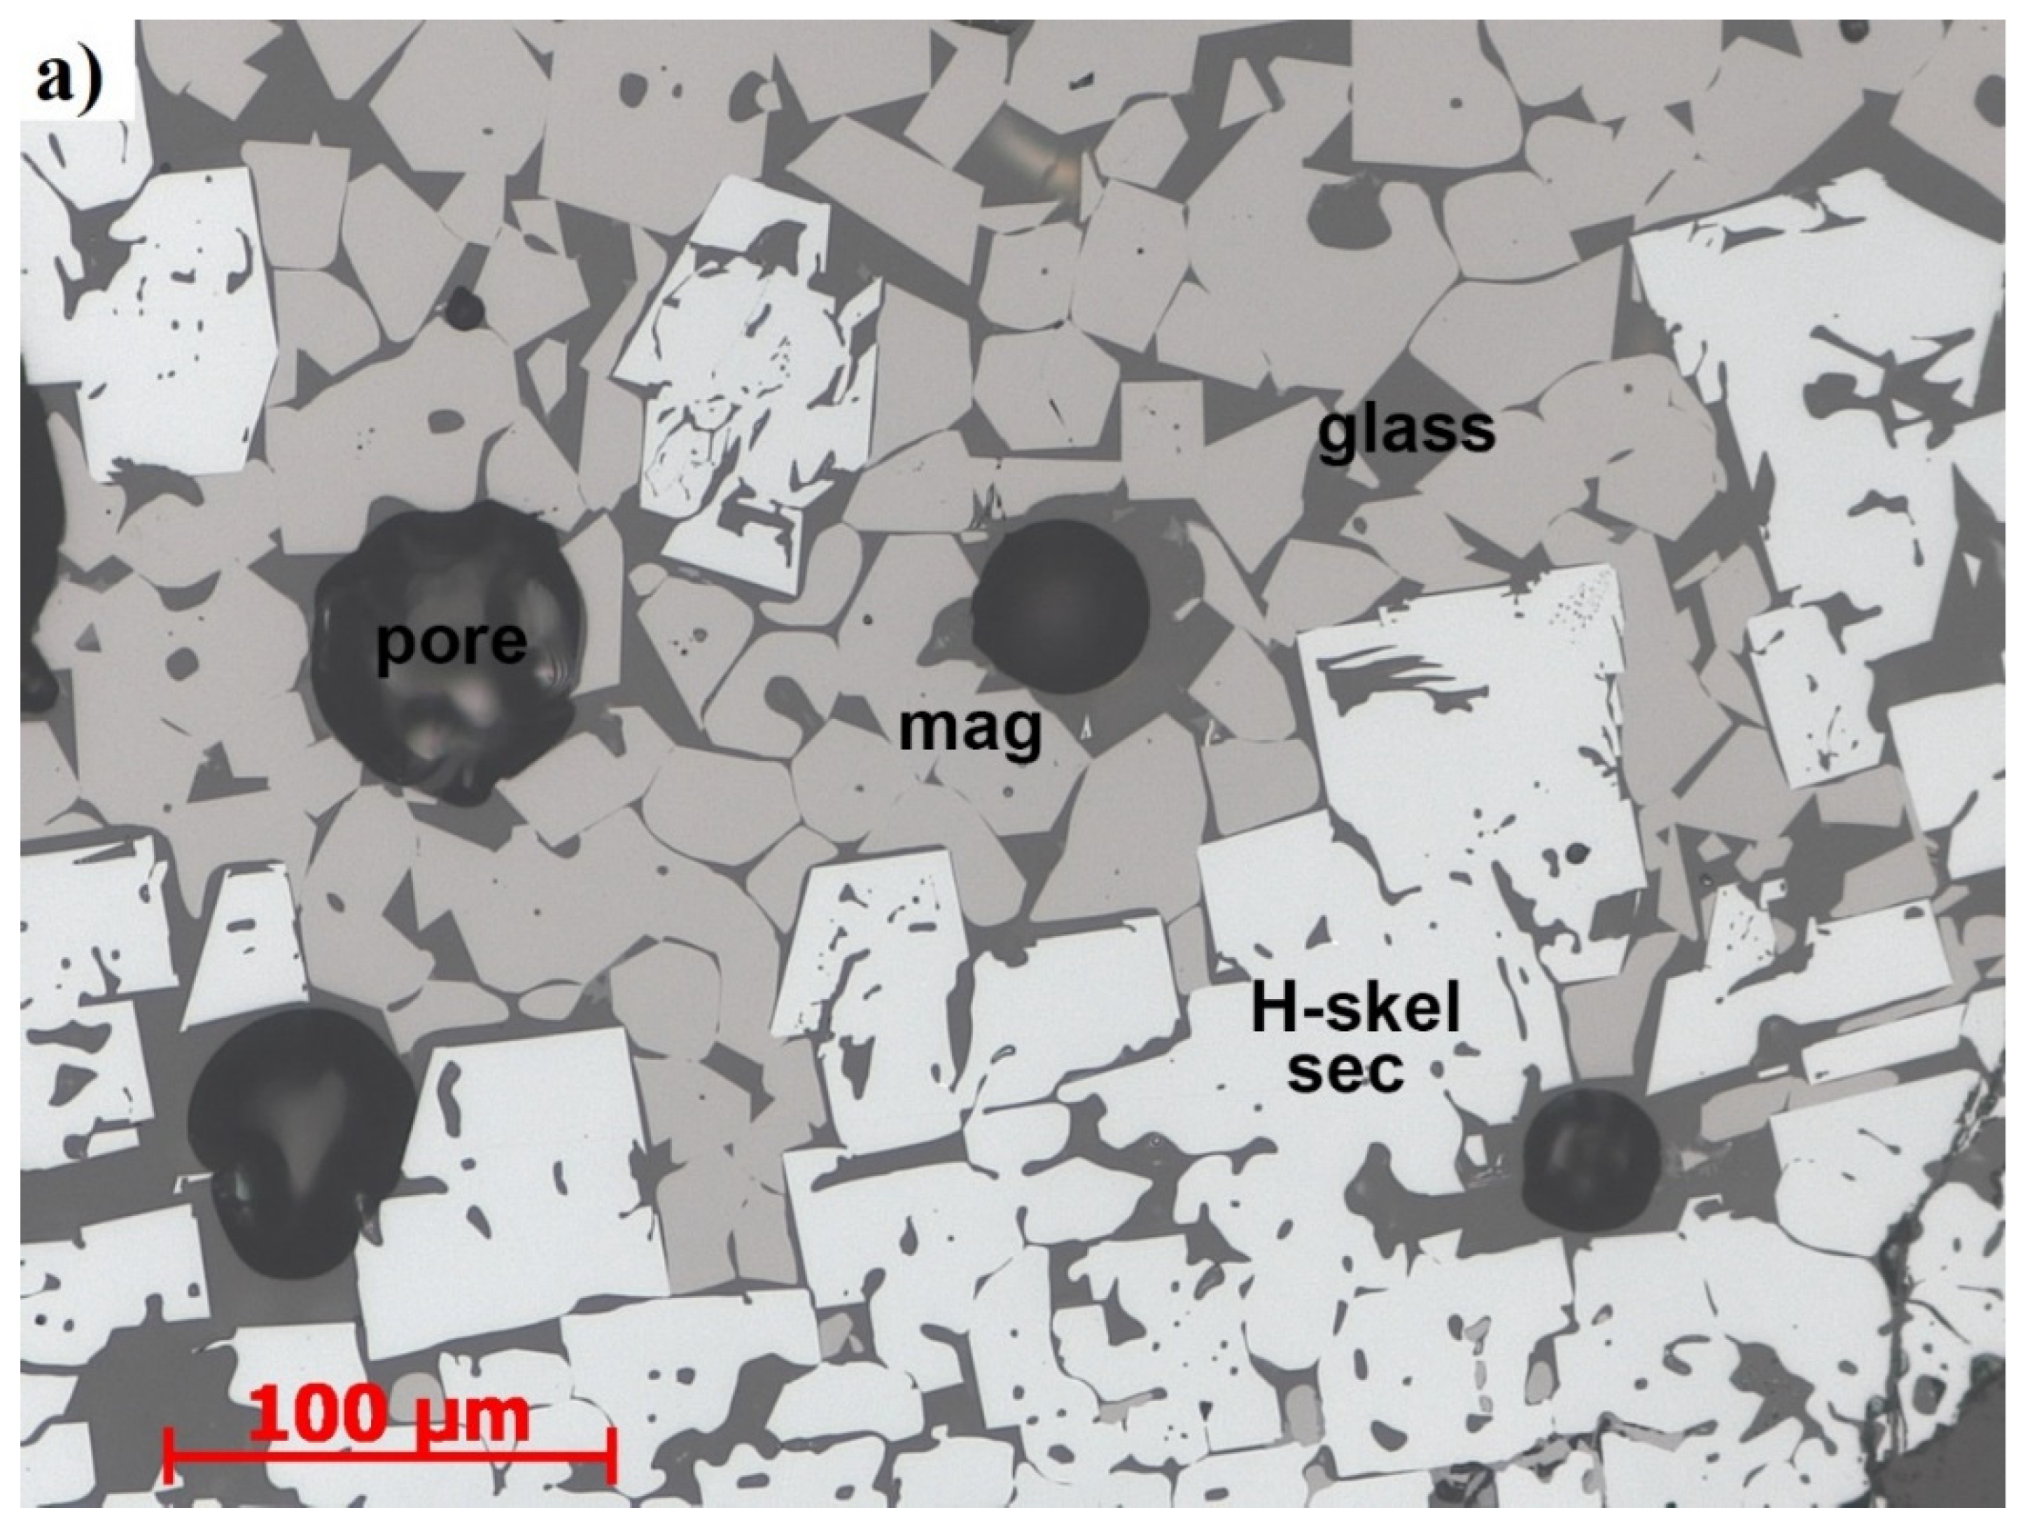
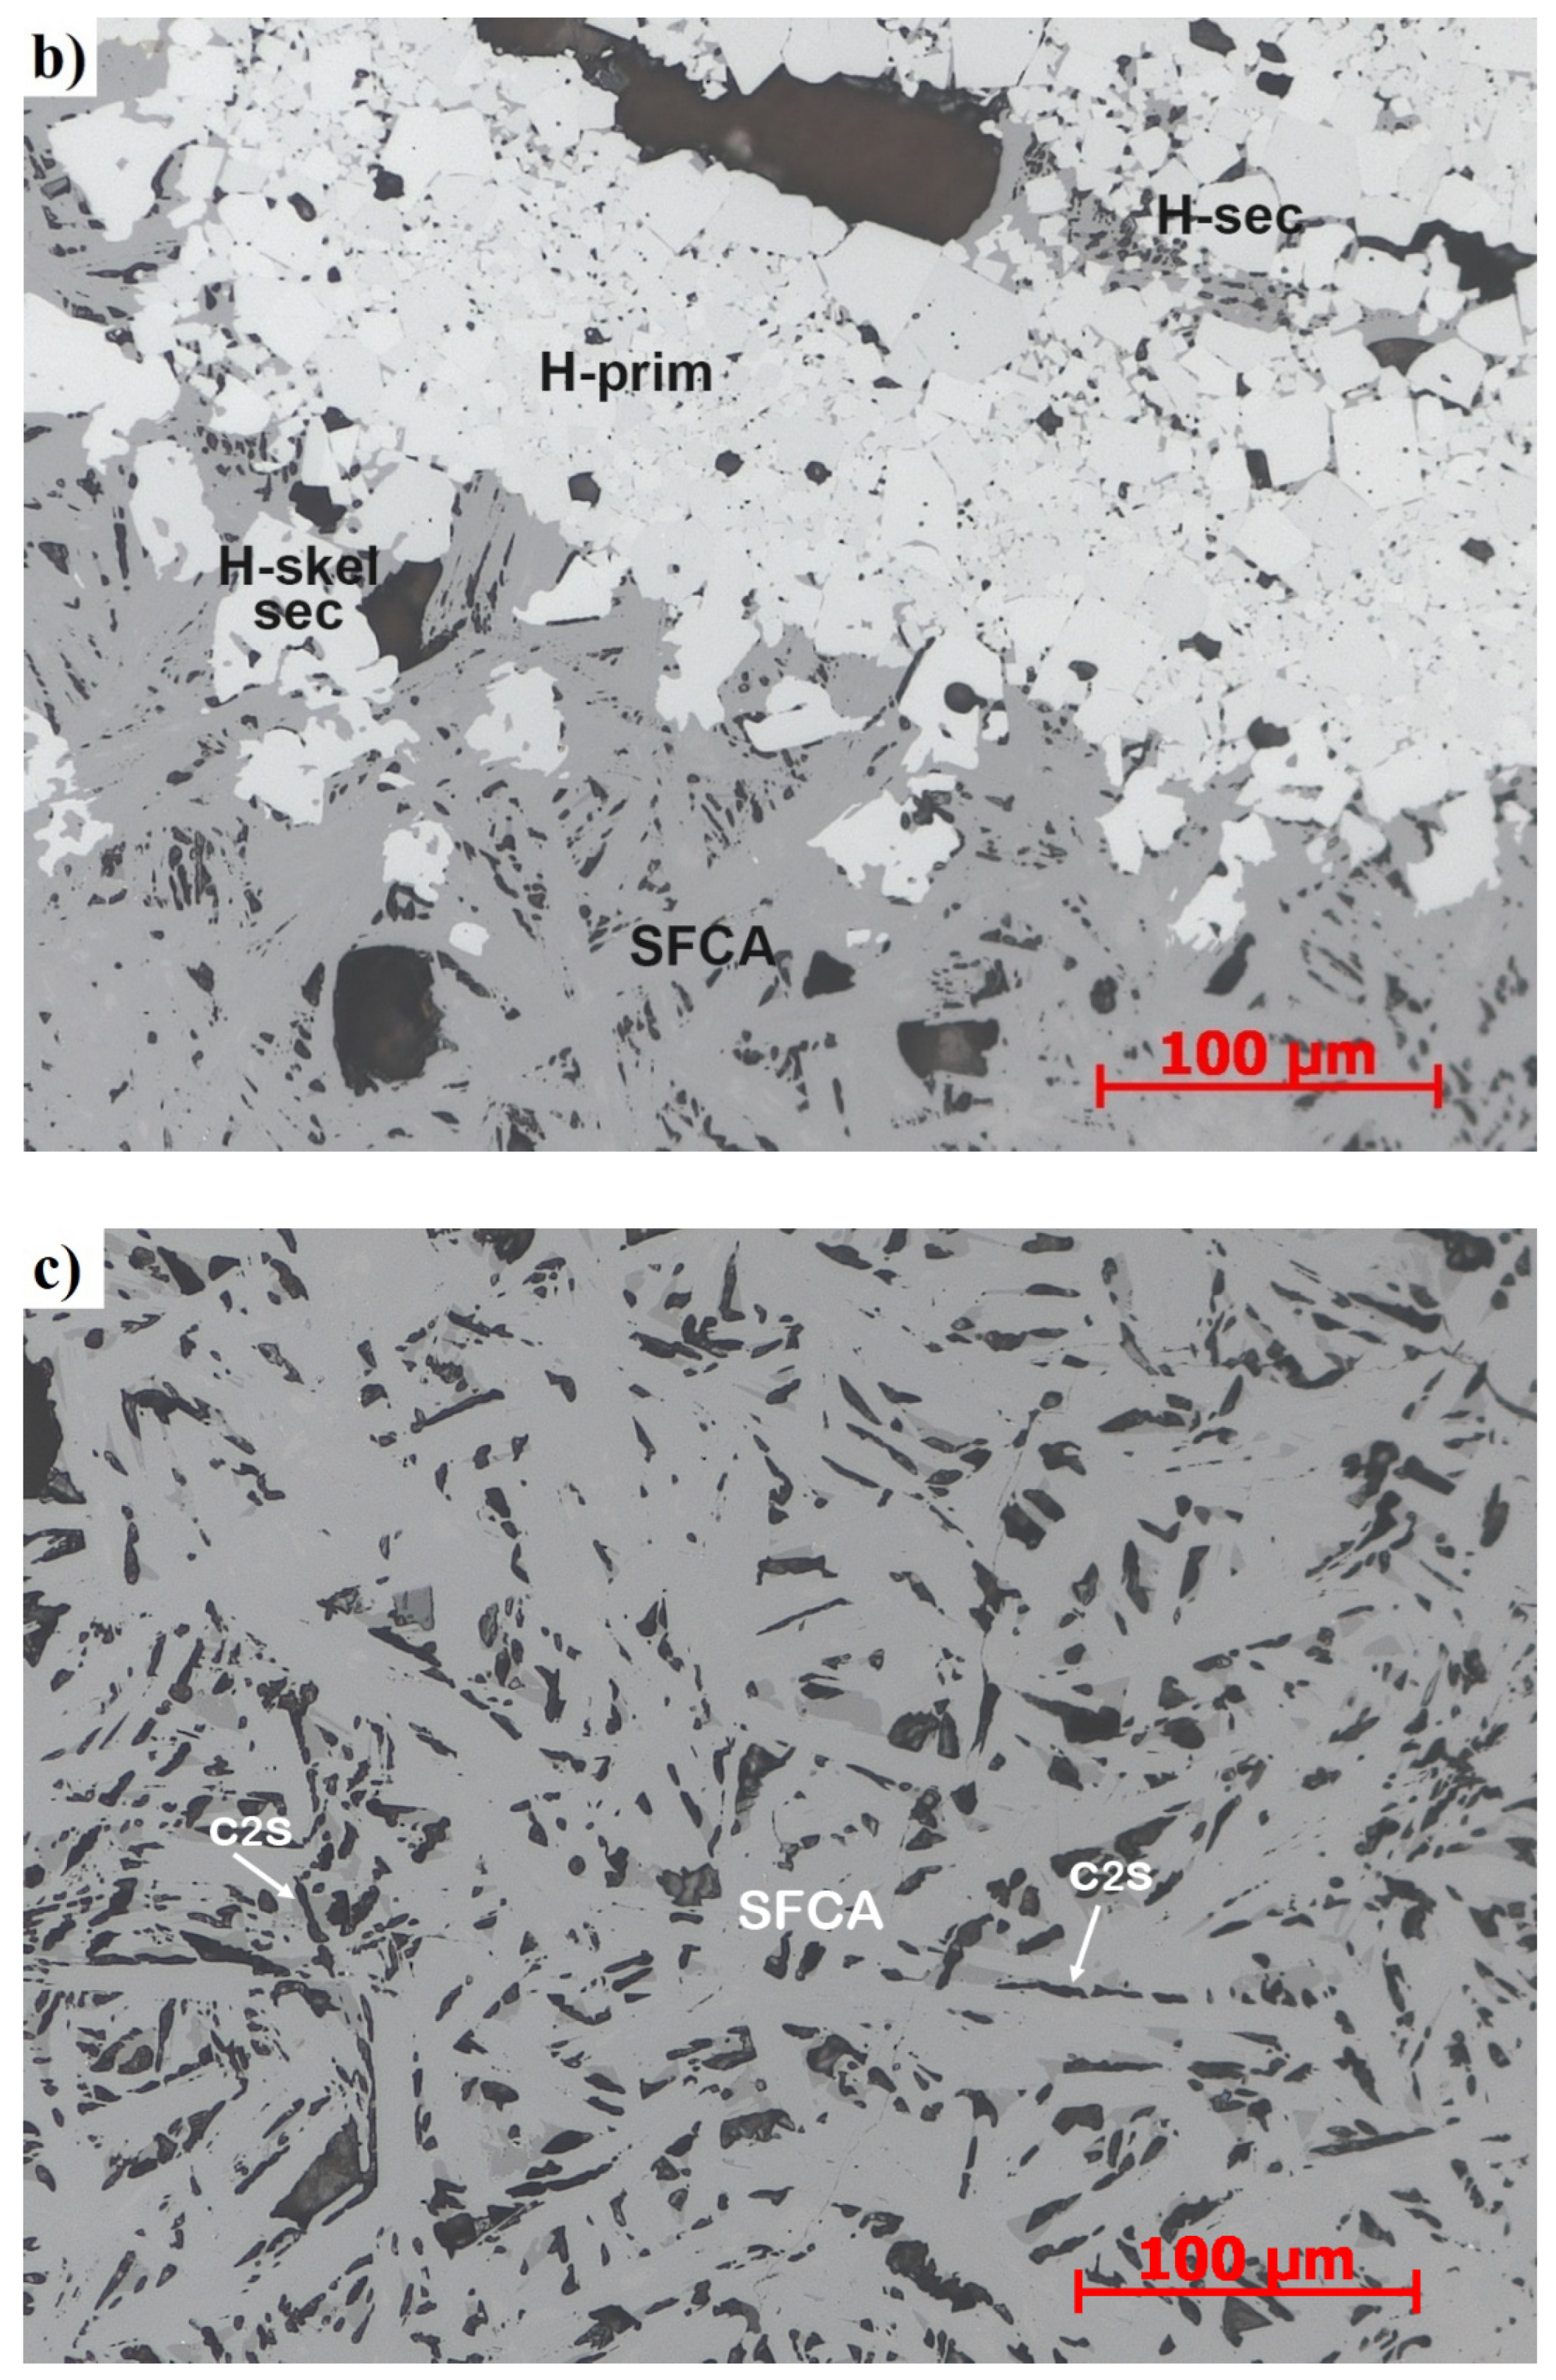
Typical photomicrographs for pot test samples with basicities ranging from 1.2 to 2.8 are given in Figure 4, highlighting the changes in bonding phase that occurred as the basicity was increased. The main bonding phases observed in the sample with a basicity of 1.2 were magnetite, skeletal secondary hematite, and glass. The sample with a basicity of 2.0 exhibited primary and secondary hematite, with SFCA as the main bonding phase. The mineralogy of the sample with a basicity of 2.8 was dominated by SFCA and C2S. The variation of minerals in regard to basicity is discussed in detail in the following section.

3. Results and Discussion

3.1. Comparison of Mineralogy of Sinters from Different Sources

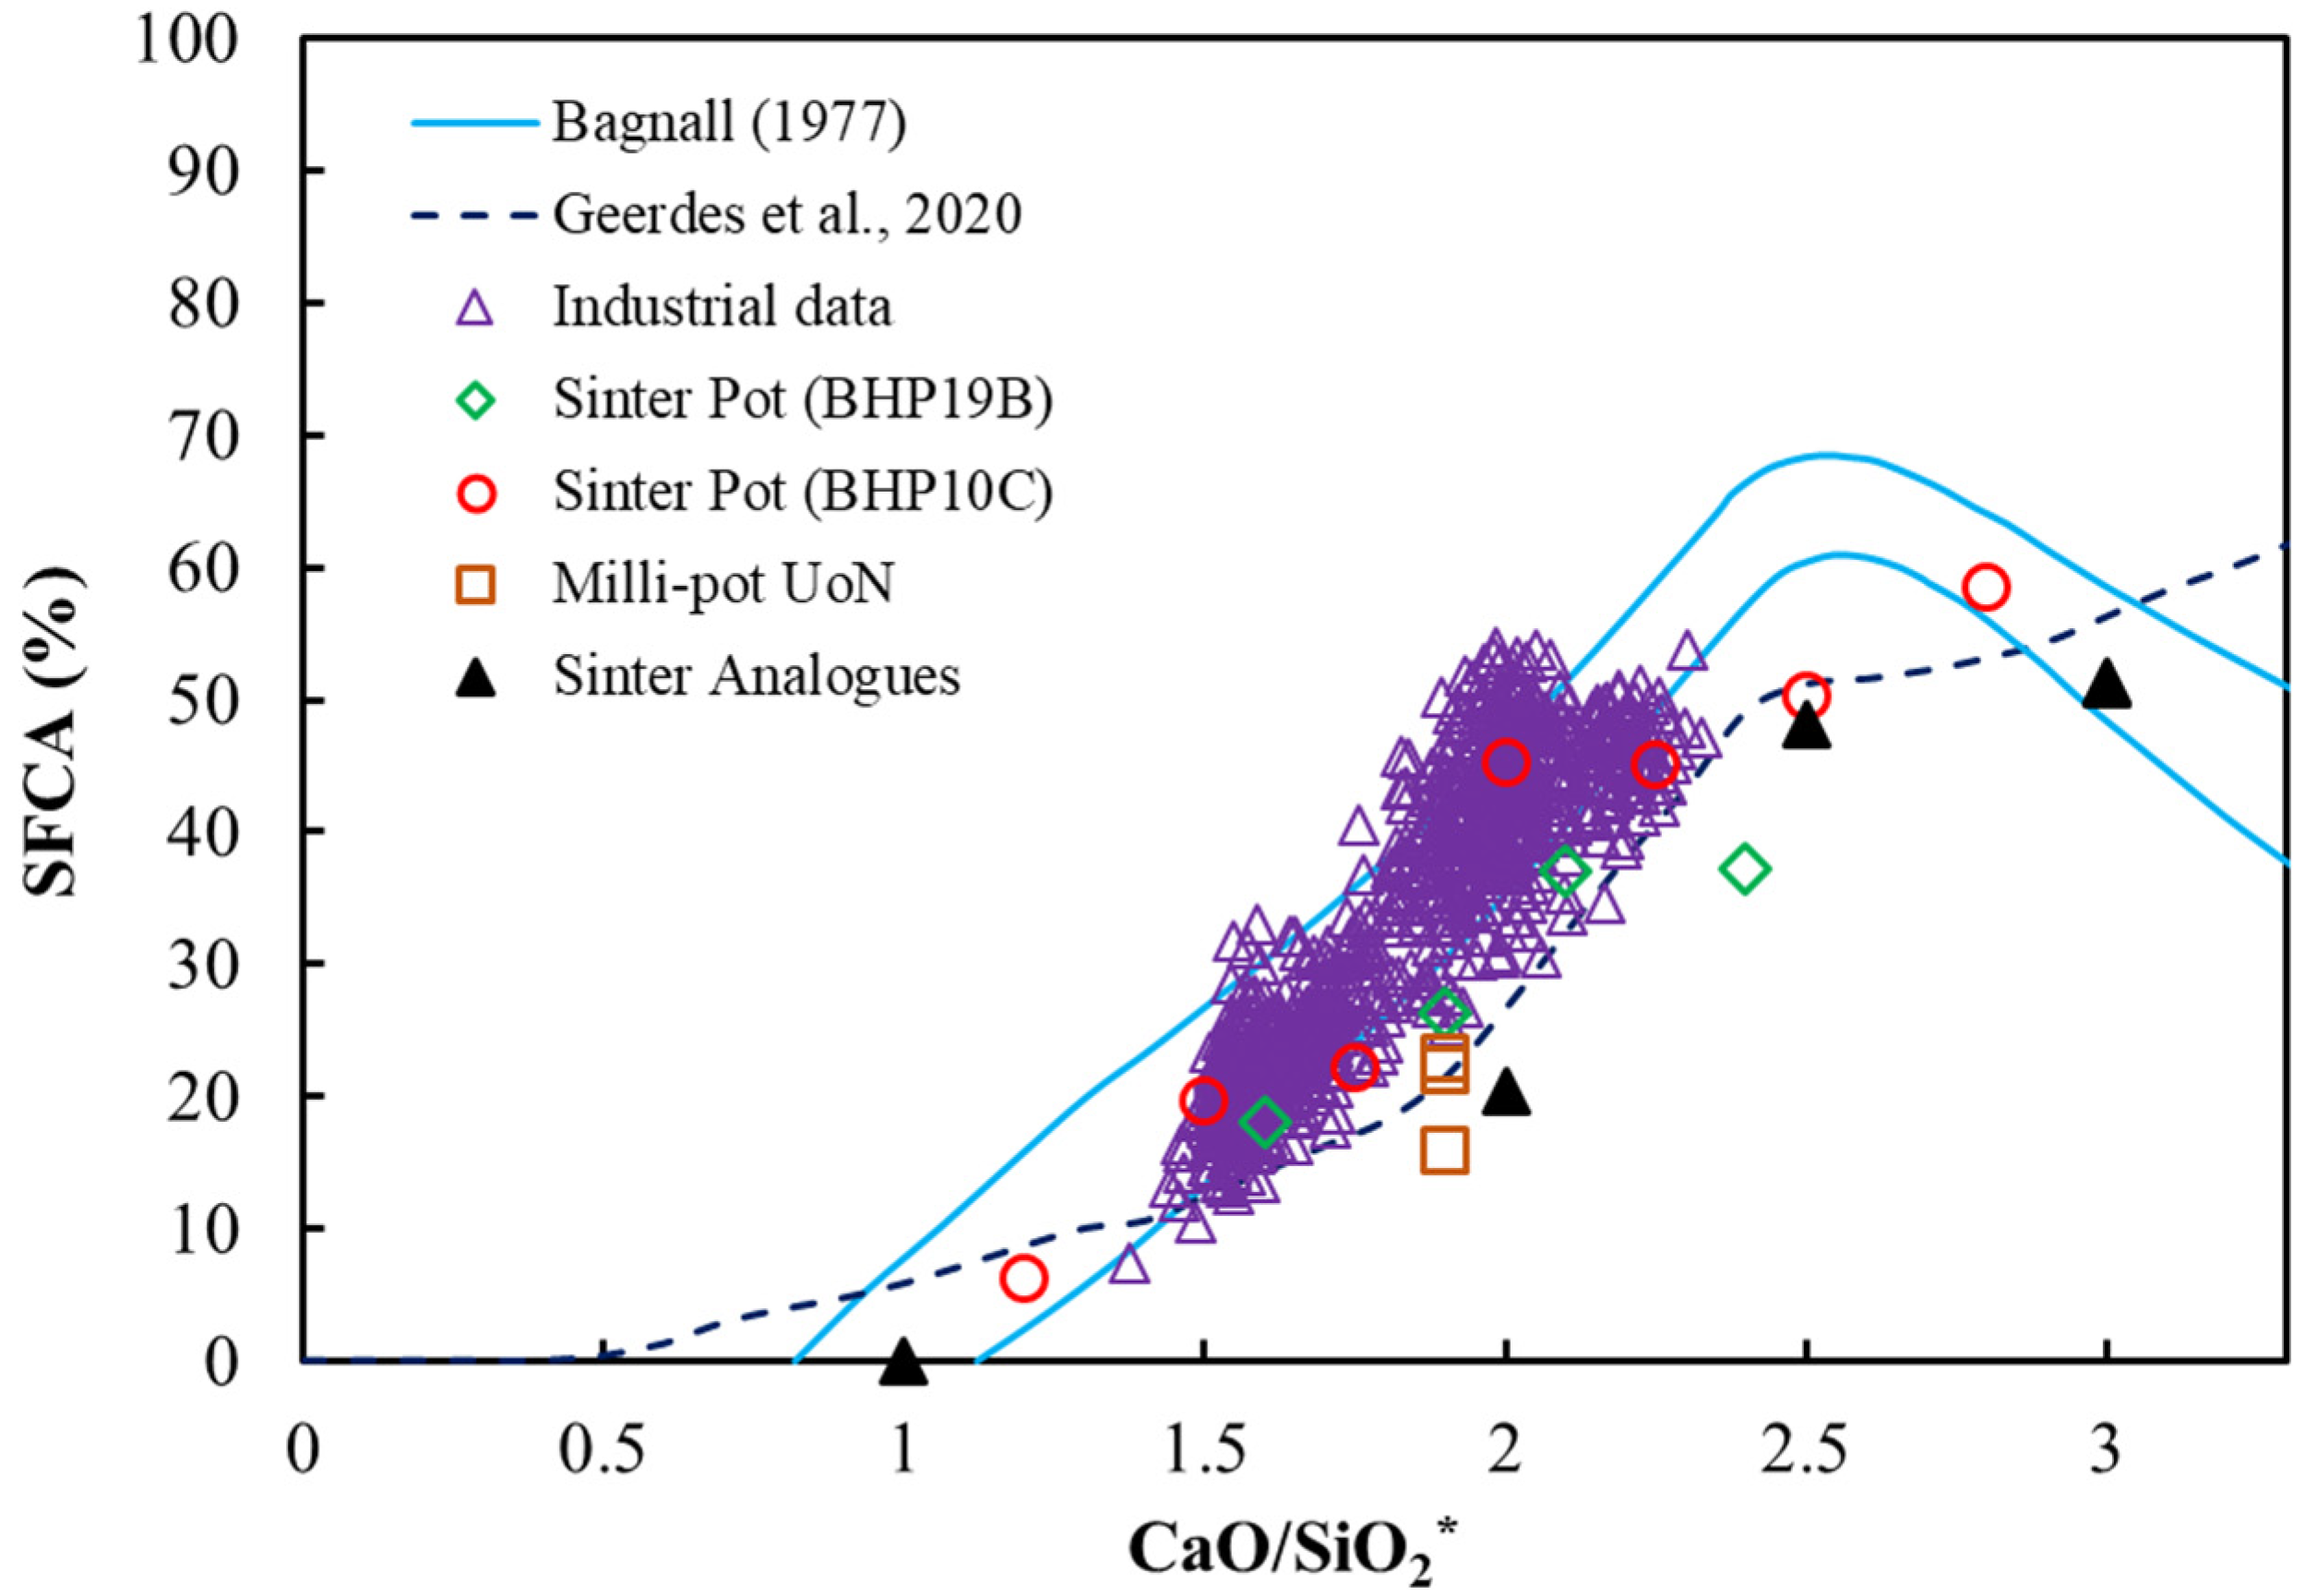
The total SFCA content in each of the different types of sinter samples is plotted in Figure 5. The majority of the data fit within the range defined by Bagnall [15], confirming that basicity is the main determinant of SFCA (Ca ferrite) content for the given silica and alumina contents present in the iron ore blend. Data from Geerdes et al. [16] also presented a similar trend, although with a (CaO + MgO)/SiO2 ratio instead CaO/SiO2. The available calcium obviously increased with basicity and formed additional SFCA and, to a lesser extent, dicalcium silicate at high basicity levels. This observation also supports the conclusions of Webster et al. [13,14], who demonstrated that increasing basicity stabilises SFCA phases. While the Bagnall data [15] only contained information for total SFCA (Ca ferrite), no trends could be seen in the split of the sub-types of SFCA in terms of texture (platy or prismatic). Note that the mineral sub-types SFCA and SFCA-I cannot be accurately determined using optical microscopy and should be measured using an independent, mineral-specific technique such as XRD [6]. Due to the inability to distinguish the mineral SFCA types optically, a comparison of total SFCA phases is therefore appropriate. There are 805 data points for the “Industrial data” set presented in Figure 5, Figure 6, Figure 7, Figure 8 and Figure 9 in which the higher frequency data fall at a basicity of approximately 1.6 and 2.0.
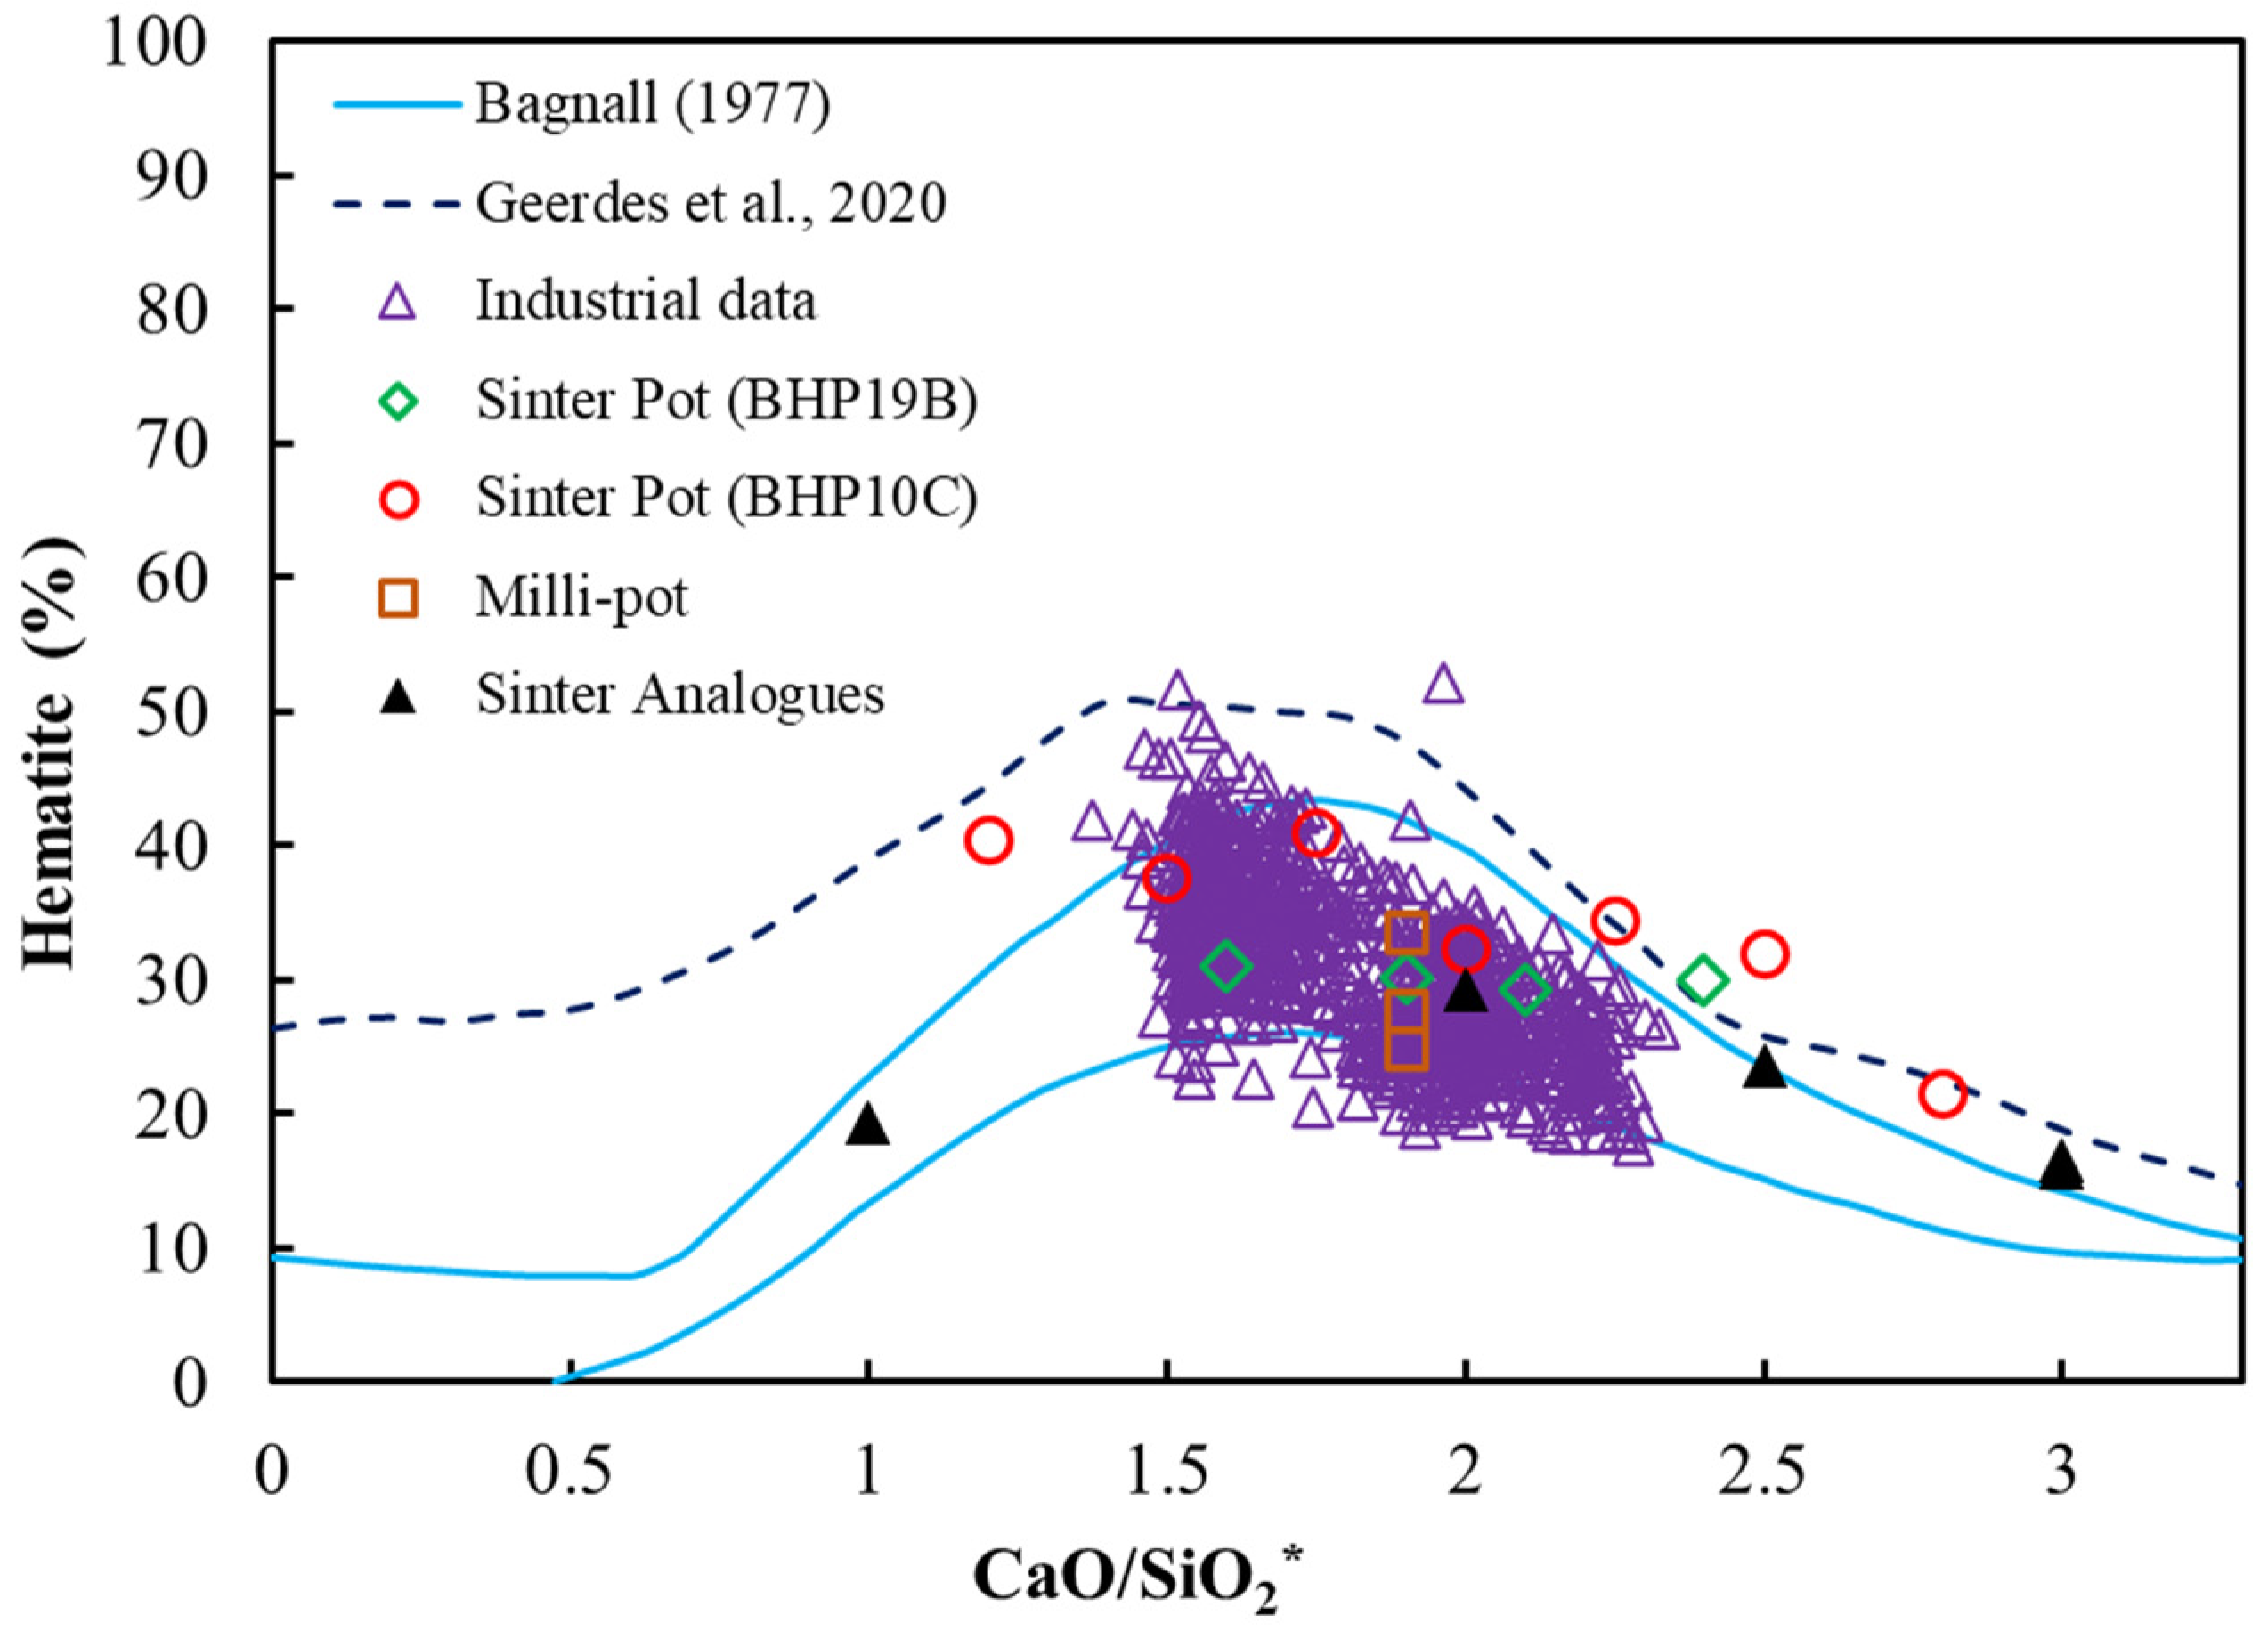
The total hematite content of the sinter samples is plotted in Figure 6. As indicated previously, the total hematite is a combination of primary hematite—which remains relatively unaltered from the original iron ore particles—secondary hematite that has crystallised from the melt during cooling [25], and magnetite that has re-oxidised during cooling of the sinter in air. All of the industrial sinter samples and most of the pilot scale samples fit within the limits defined by Bagnall. In some cases, the pilot scale sinter pot results are higher than the “high” limit defined by Bagnall. Although sinter pot tests are designed to replicate the mineralogy of industrial sinter [4], it is thought that this may be due to the different cooling conditions experienced in the pot tests.
Figure 7 shows the total magnetite content varying with basicity. Magnetite is formed as an ex-solution phase upon cooling or from the reduction of hematite and may be re-oxidised to hematite on cooling. It is not clear from this work which of these mechanisms is dominant in the samples that have been analysed. The data fell slightly below the lower-limit curve by Bagnall [15], which may be due to a combination of effects including chemistry and oxygen partial pressure. MgO introduces another controlling variable, but this should only become significant at higher MgO levels when it starts to significantly affect the sinter magnetite: SFCA ratio by stabilising magnetite at lower temperature, for a given oxygen potential. Bagnall [15] states that increases in MgO content above 1% would shift the curves to the right, i.e., increasing the magnetite content and decreasing hematite and SFCA. The data suggests that the opposite occurred, as much of the BlueScope data was for MgO contents above 1%.
Some significant differences existed in the amount of magnetite seen in the analogue samples at low and high basicity, and this is explored in further detail in Section 3.3.
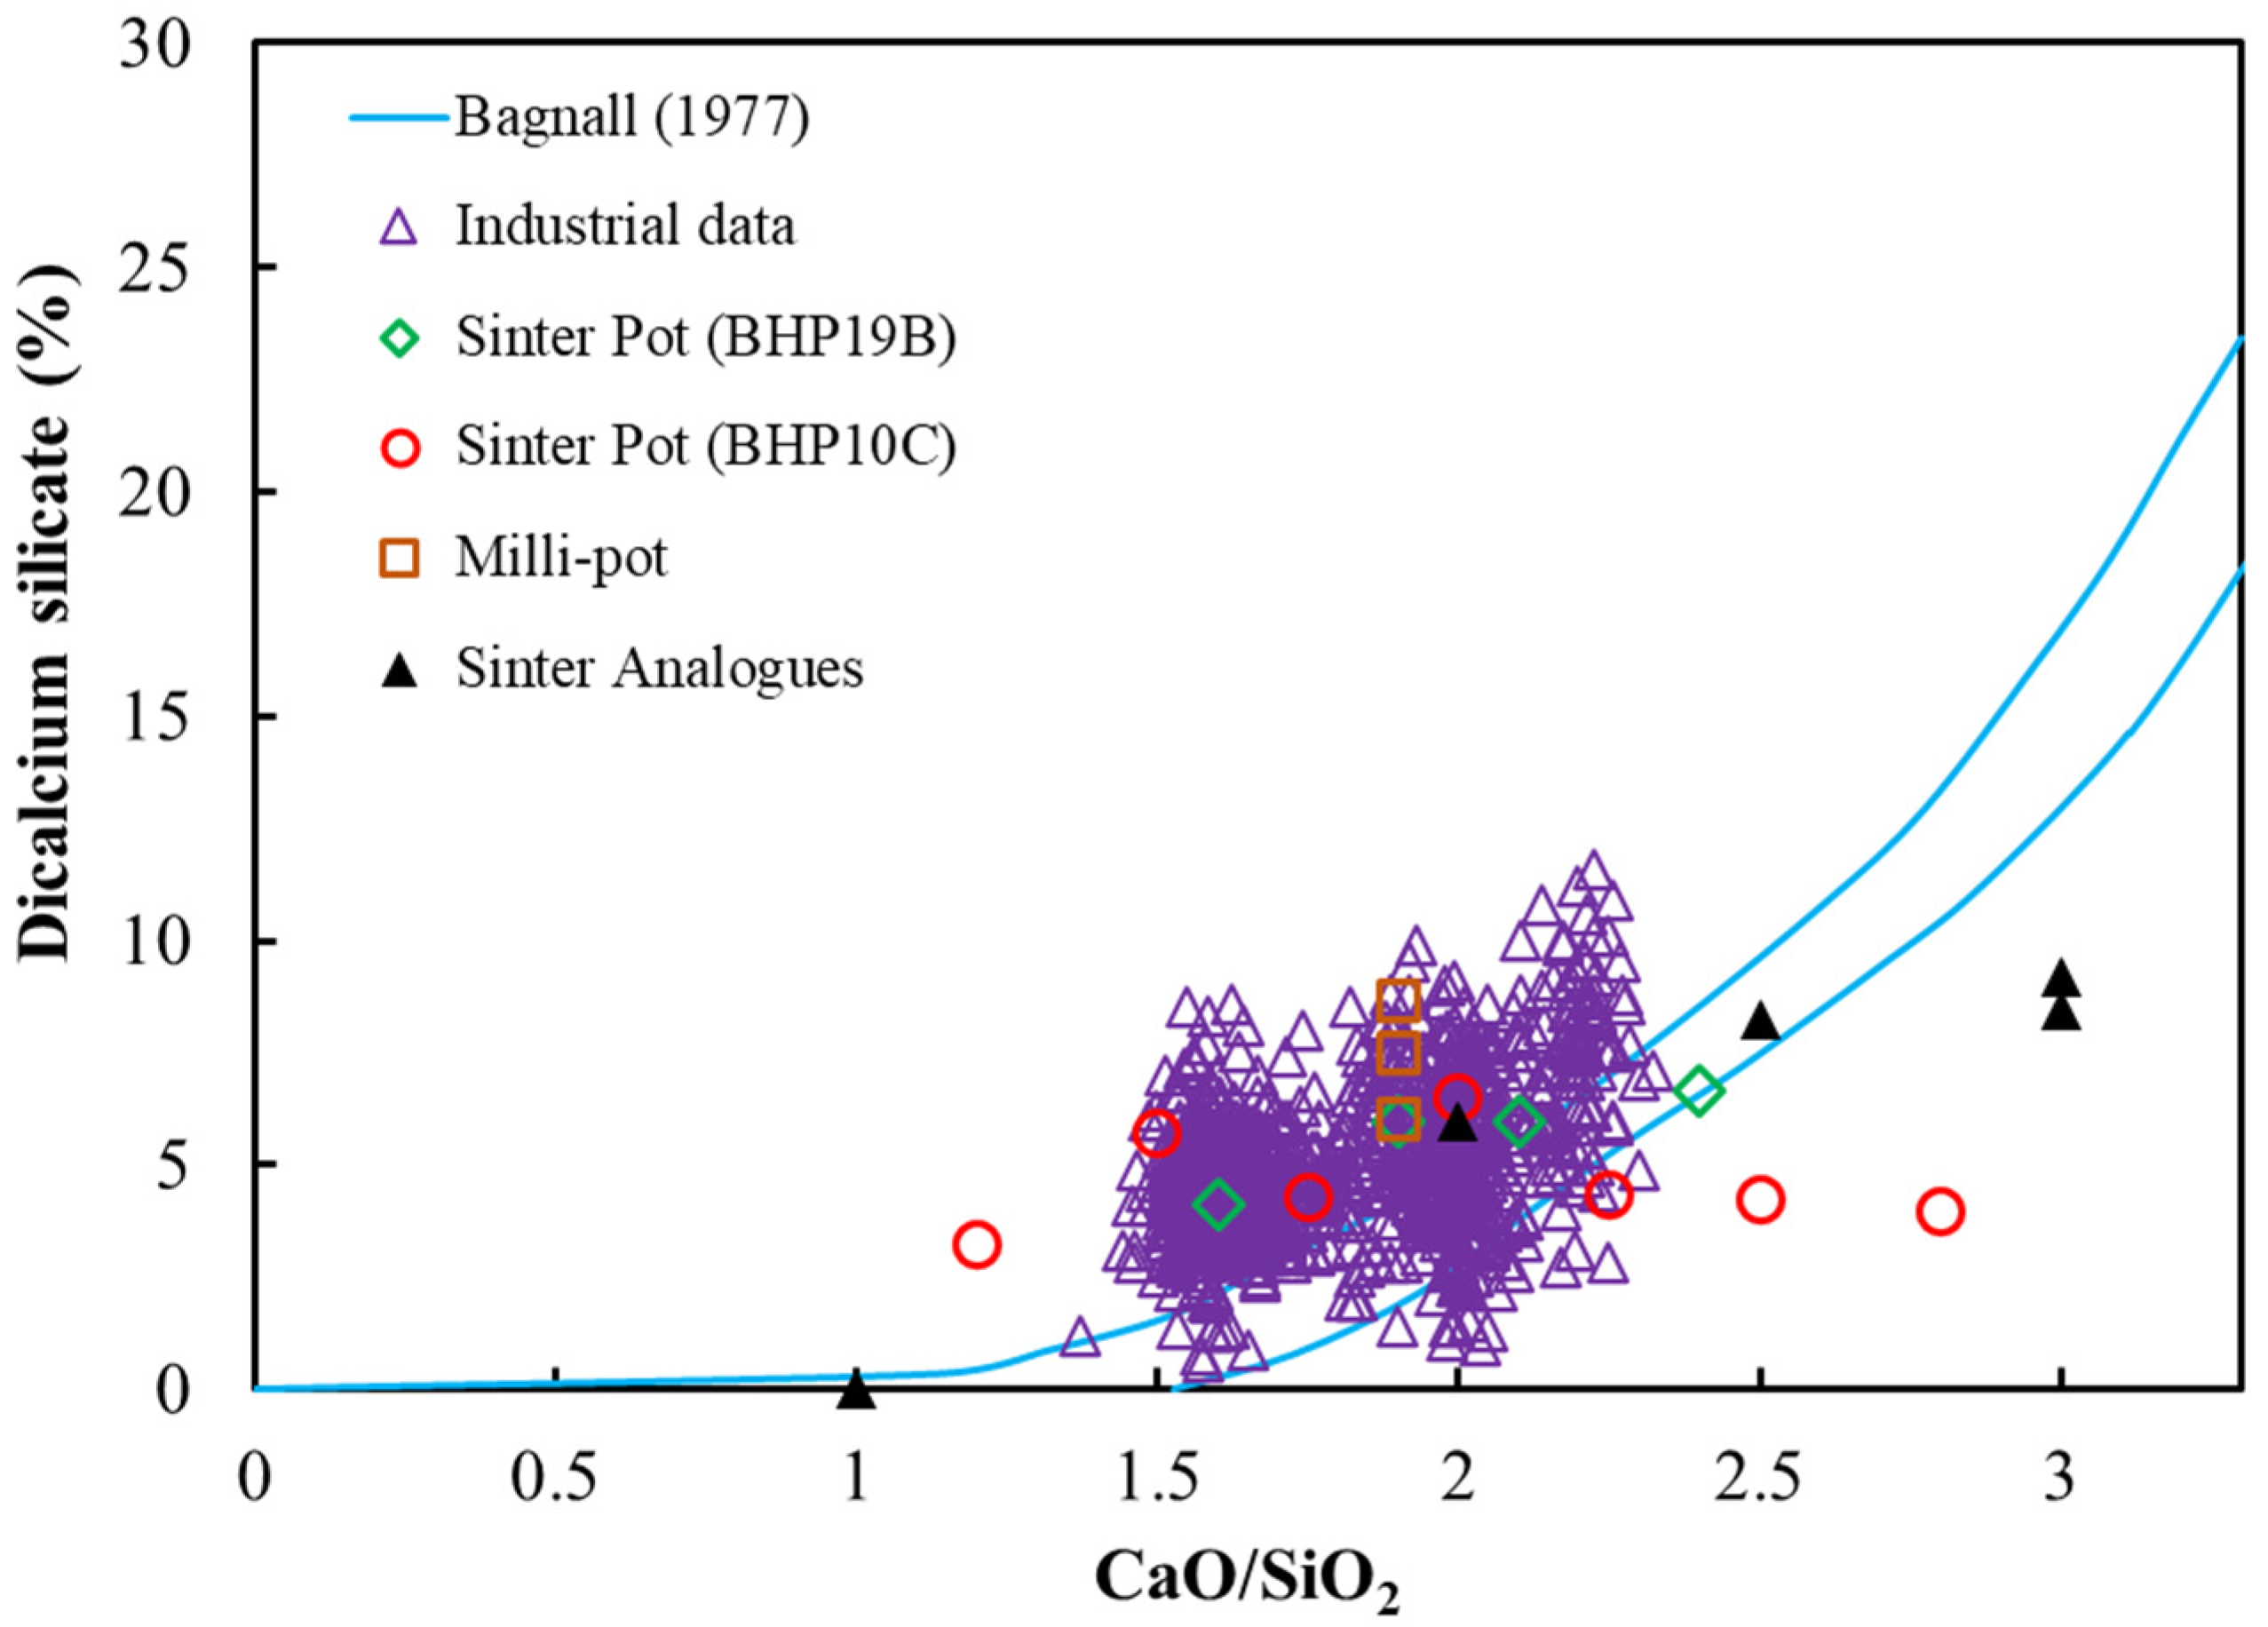
The amount of dicalcium silicate shown in Figure 8 exhibits considerable scatter and no reliable trend can be observed. This may be caused by the use of water for polishing the samples for mineralogical analysis, which is known to be able to dissolve some amount of the C2S, as mentioned earlier.
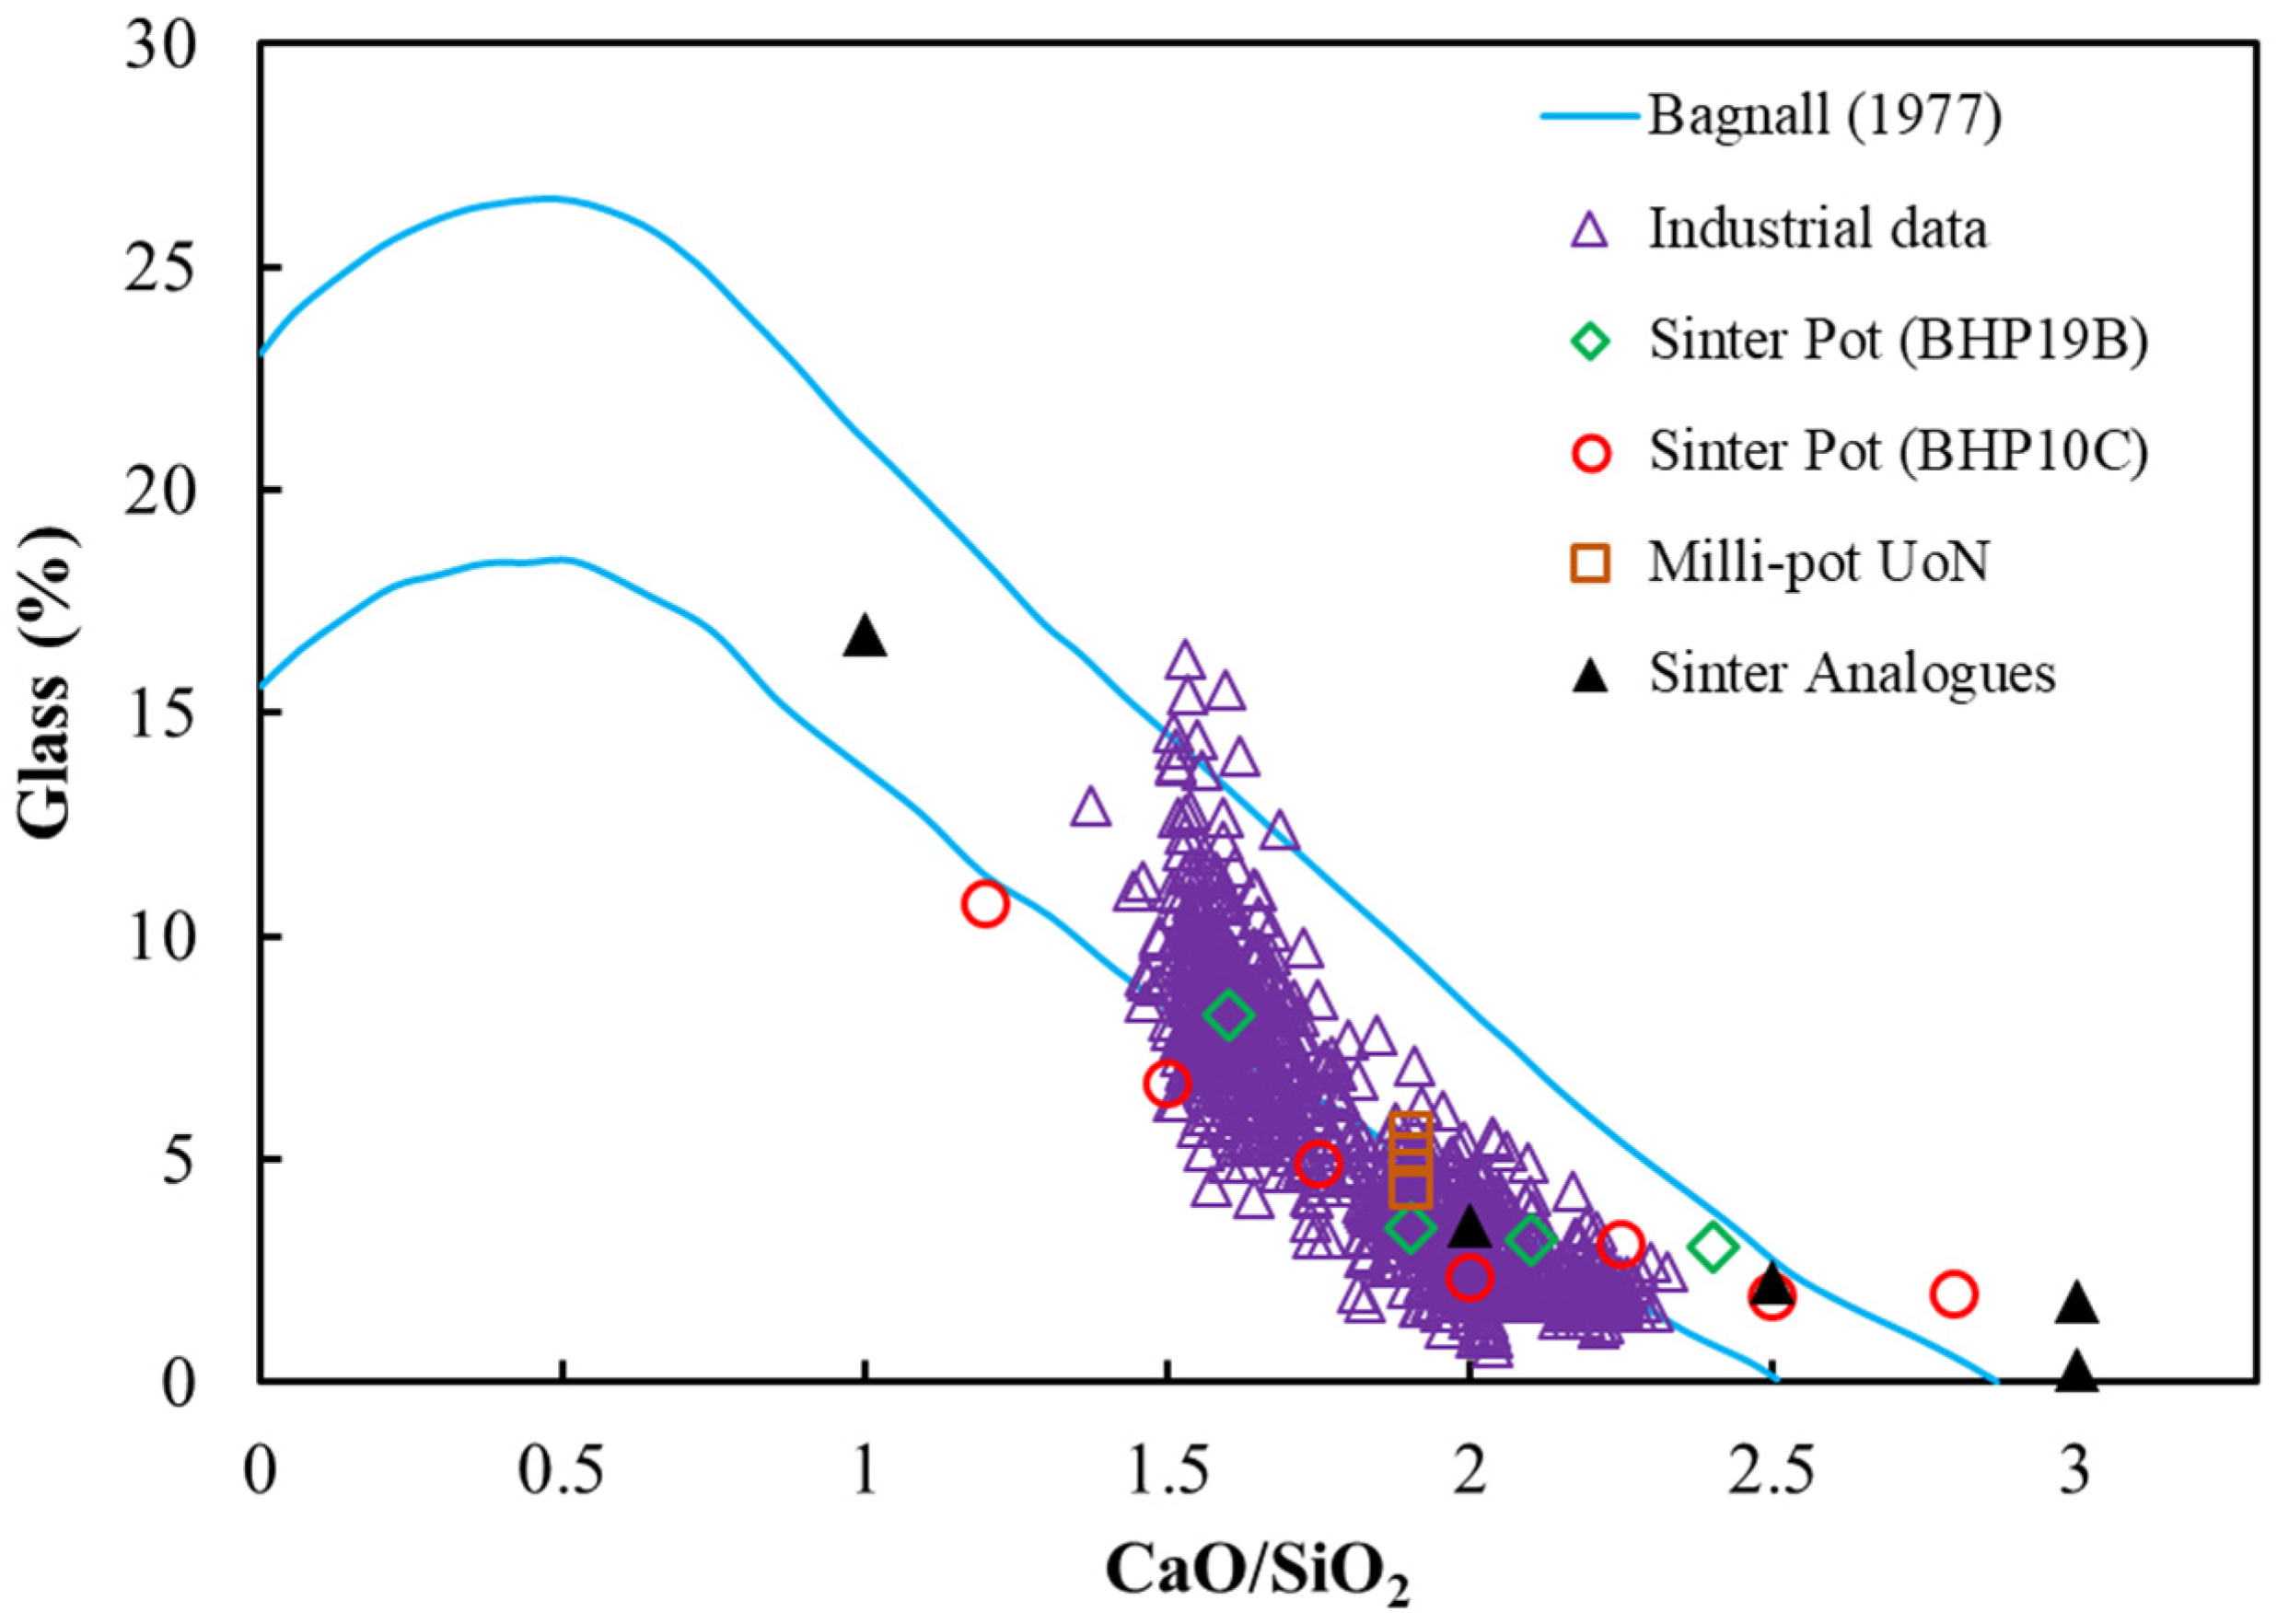
Increasing basicity was found to reduce the proportion of the glass phase remaining in the product sinter, as shown in Figure 9. This is consistent with the increasing proportion of ex-solution phases such as secondary hematite, SFCA, and C2S.
There was a generally good correlation between the ranges defined in the original Bagnall [15] plot and the BlueScope sinter mineralogy data for total SFCA and hematite. In comparison, the magnetite data was offset towards the lower Bagnall limit, to a slightly greater extent at the lower basicity end. Glass also plotted towards the lower limit—although with a wide spread of values around basicity 1.5, which was not evident for other sinter mineralogy phases. C2S was offset towards the higher limit. The majority of the pot grate data spanned a similar range of values to the plant data, although the results were somewhat lower for magnetite.
It also seems likely that varying sinter mineralogy with basicity reflects a converging sinter structure (i.e., pore and sinter neck consolidation towards an ‘ideal’ strong but macroporous structure [26,27]) under different conditions, e.g., ‘low temperature’ sintering of haematitic blends with abundant SFCA versus ‘high temperature’ magnetite sintering with a high proportion of glass, depending on magnetite–magnetite grain bonding for physical strength [19]. In all cases, optimisation is set within the limits defined by the TI, RI, RDI, etc., although with a bias towards strength or productivity depending on the sinter plant operation and within the constraints determined by the blast furnace.
The milli-pot sinter mineralogy data plotted in a low range for SFCA, mid-range for hematite and glass, and high-range for magnetite and C2S. The data were within the range for the pot grate sinter mineralogy data around basicity 1.8, except for SFCA (low). This may reflect the relative over-fuelling required to compensate for the smaller sinter volume and larger wall effects of the small diameter milli-pot [22], although more data would be required to confirm any pattern. A similar effect may influence the pot-grate sinter mineralogy data to a lesser extent, although this is not clear due to the spread of the data and the wider range of blend variation at a given basicity compared with the plant data. Umadevi et al. (2014) [28] observed that plant sinter TI is typically 6–8 points higher than pot grate TI and that this may be attributed to greater wall effects in the pot—so a corresponding range ‘shift’ in the proportions of sinter mineralogy phases is not implausible.
Note that the Bagnall diagram [15] shown in Figure 1 also reports on the presence of other minerals (e.g., fayalite, pyroxene); however, these phases were not observed in this work.

3.2. Basicity Effects on Pot Sinter Production and Quality

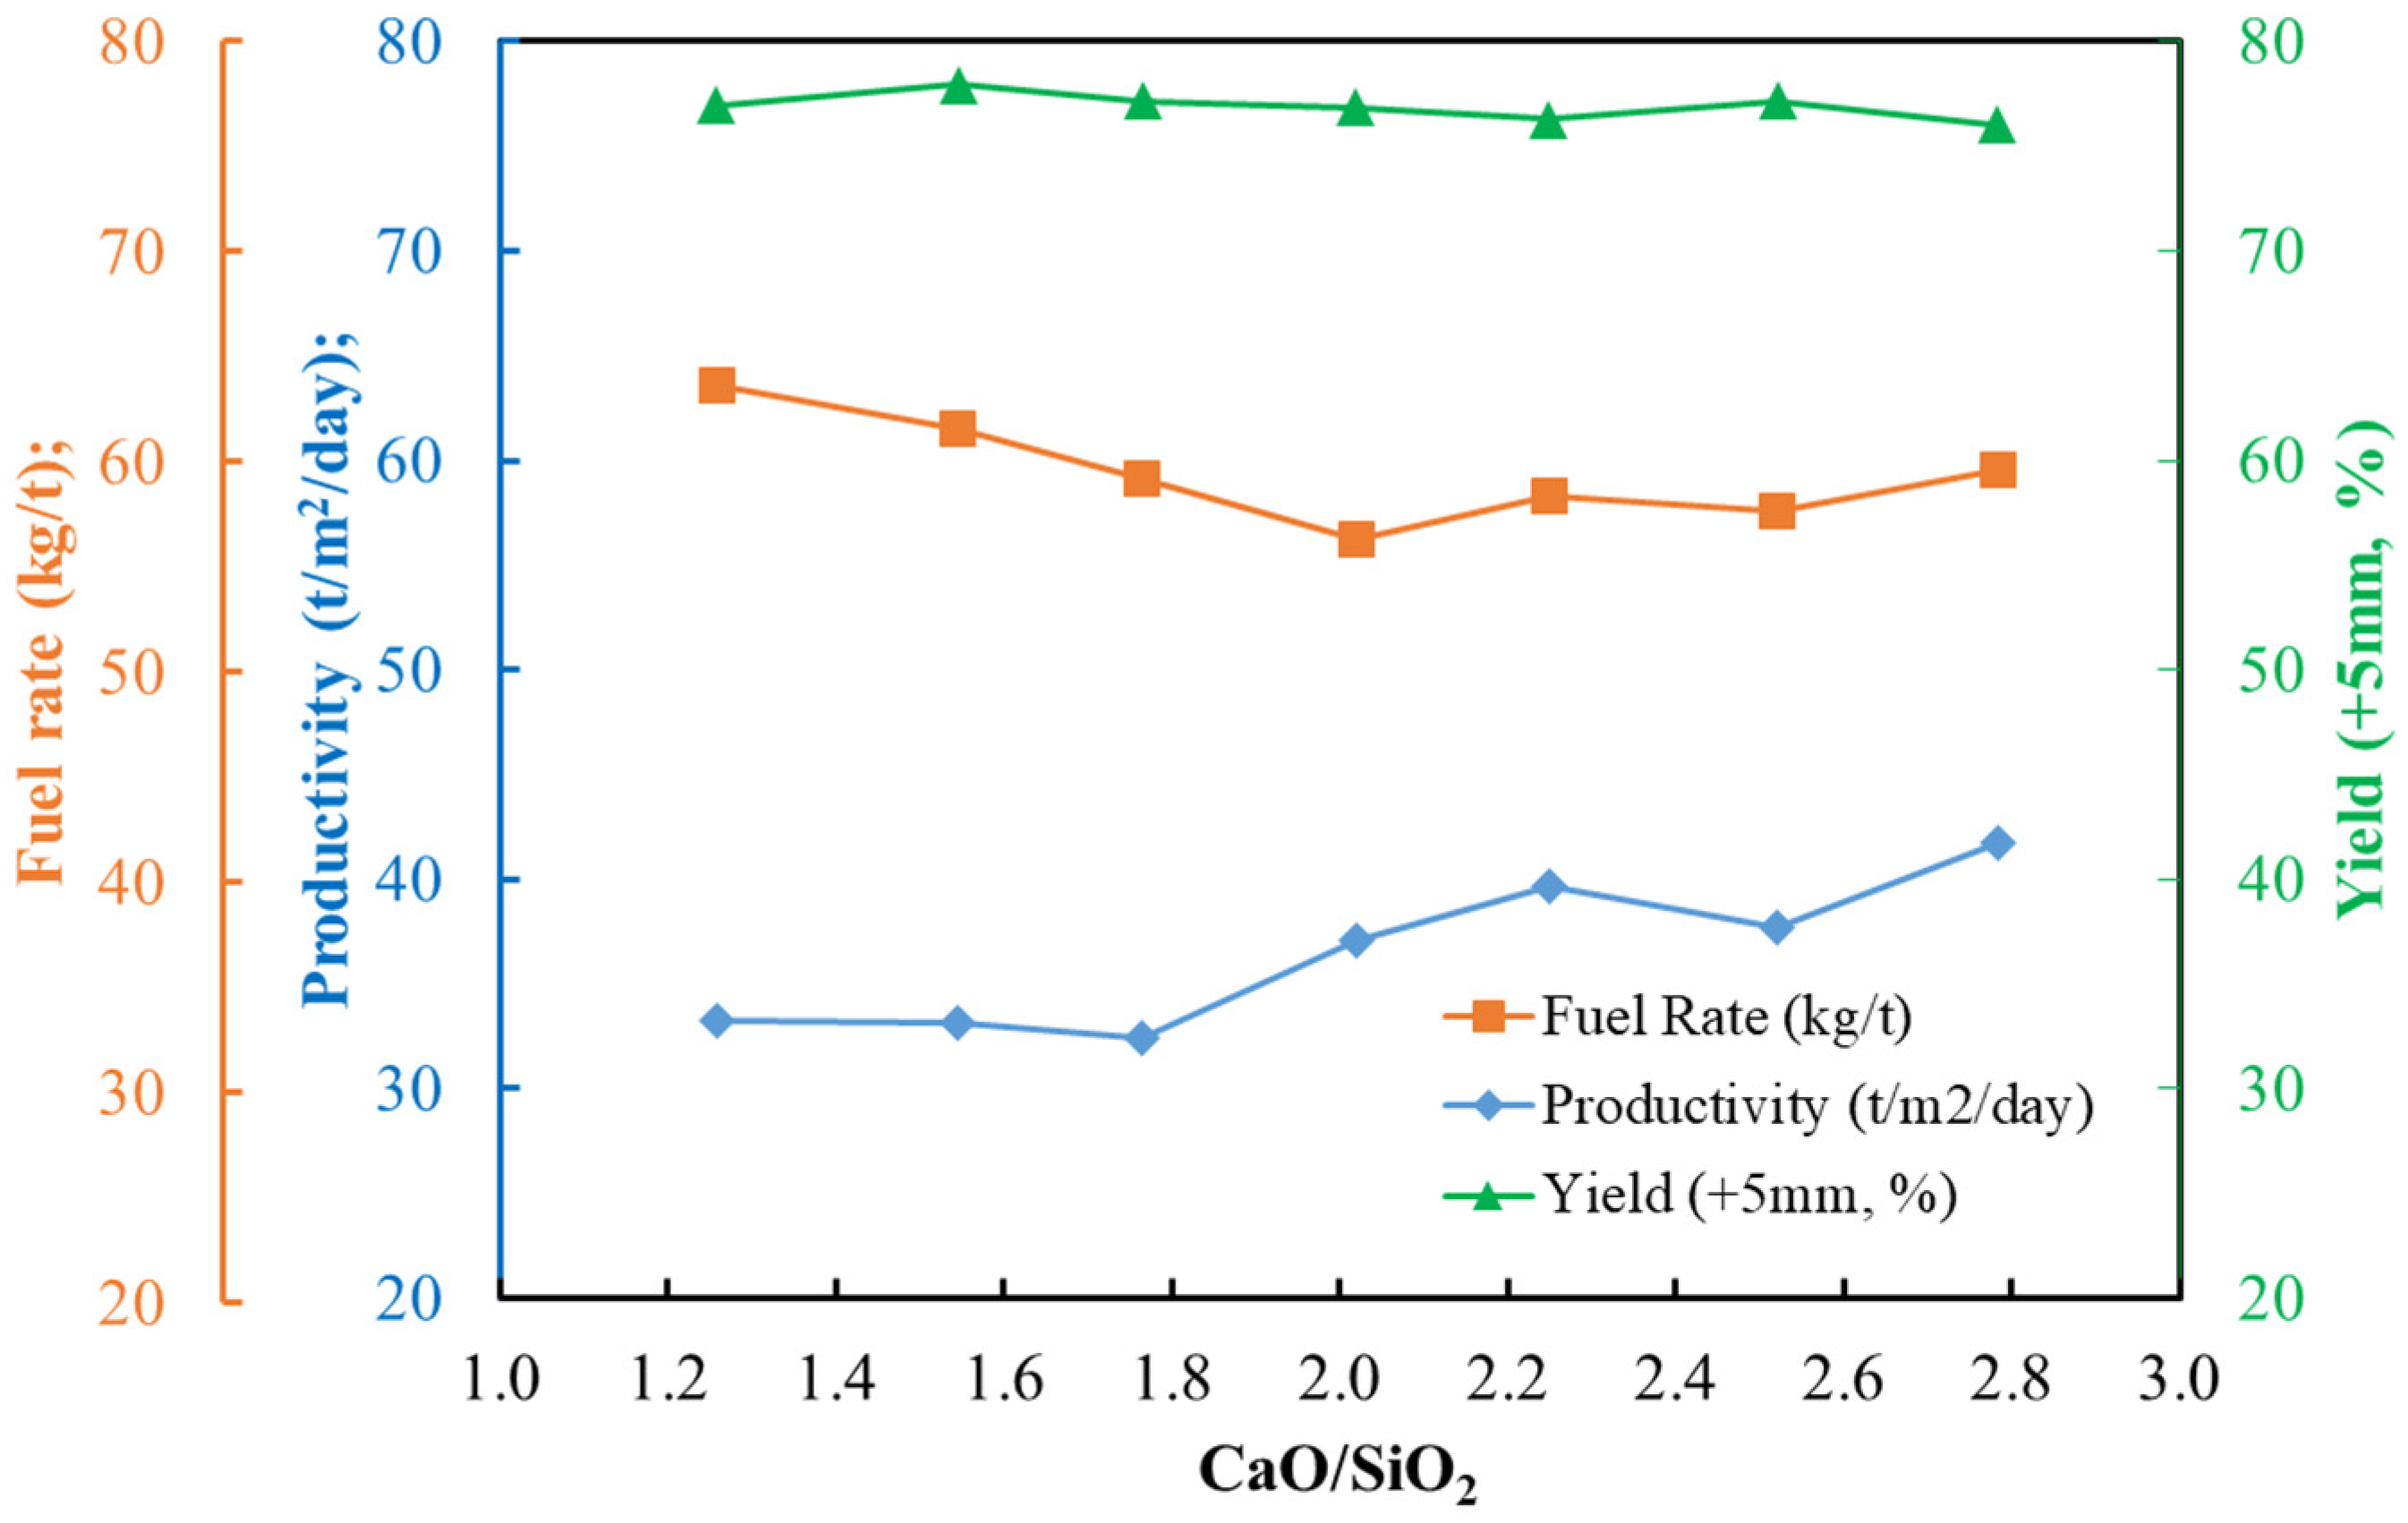
The sinter pot operating results for one program specifically aimed at measuring the impact of basicity on sinter productivity and quality are given in Figure 10. Each point is the average of three or more balanced sinter pot tests. All tests resulted in an acceptable yield of sinter above 75%. The productivity of the sinter pot increased with increasing basicity. The fuel rate initially decreased with increasing basicity, before reaching a minimum at basicity 2.0 and becoming approximately constant. This trend is believed to be due to the decreasing temperature required to form the liquid phase as basicity increases. A further analysis of this is given in Section 3.3. The approximately constant fuel rate above basicity of 2.0 is believed to be due to a trade-off between the change in the liquidus temperature and the additional heat required for the calcination of fluxes.
Unfortunately, a similar trend could not be obtained from the industrial data. Variations in the composition of the fuel, varying amounts of partially reduced recycle materials, and differences in sinter plant size and operating regime overwhelmed any underlying trends.
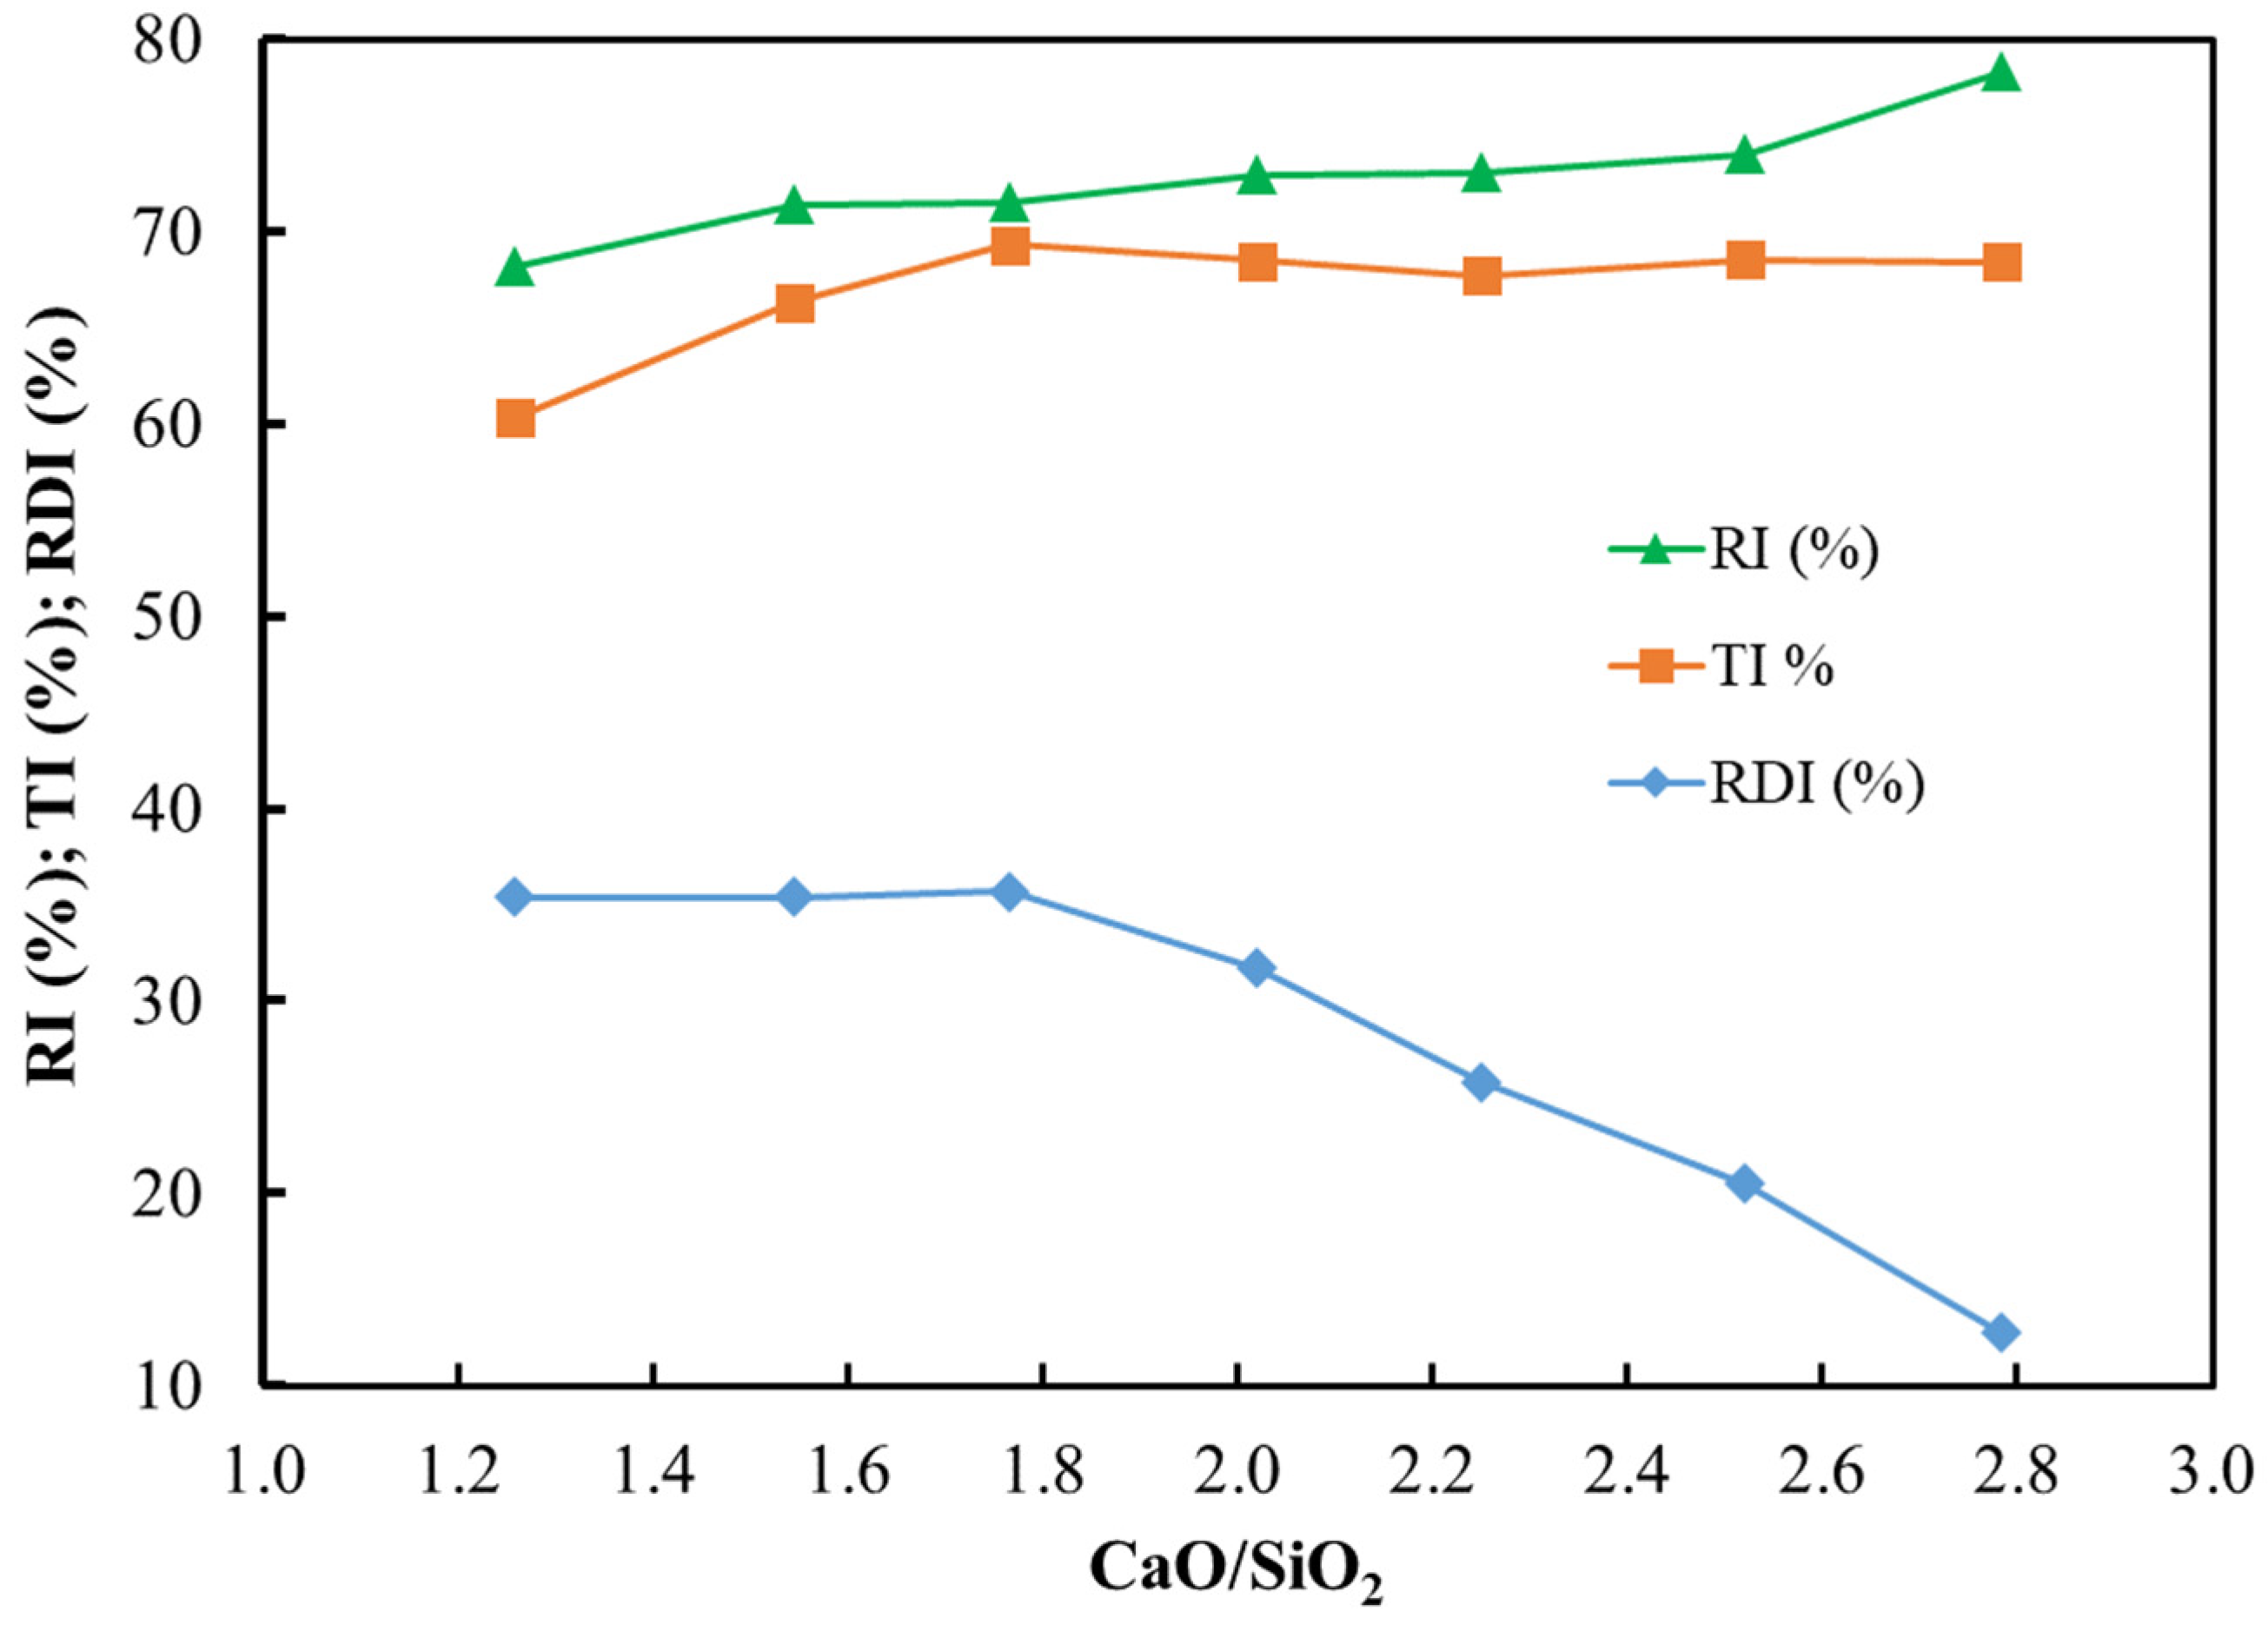
The quality measures for the product sinter are plotted in Figure 11. Sinter pot tests are normally targeted at achieving a return fines balance and a target strength, e.g., a tumble index TI > 65%. In this series of tests, the input coke rate was held approximately constant on an ore feed basis; however, it decreased with increasing basicity on a total dry mix basis due to the increasing limestone additions. The tumble index was allowed to float, leading to the trend seen in Figure 11. The TI increased with increasing basicity up to approximately 1.8, after which it remained constant. The reducibility increased with basicity, and the RDI improved (decreased). There is clearly an advantage to operating at a higher sinter basicity according to the sinter pot productivity and quality results.

3.3. Analysis of Sintering Temperature using Analogue Tests

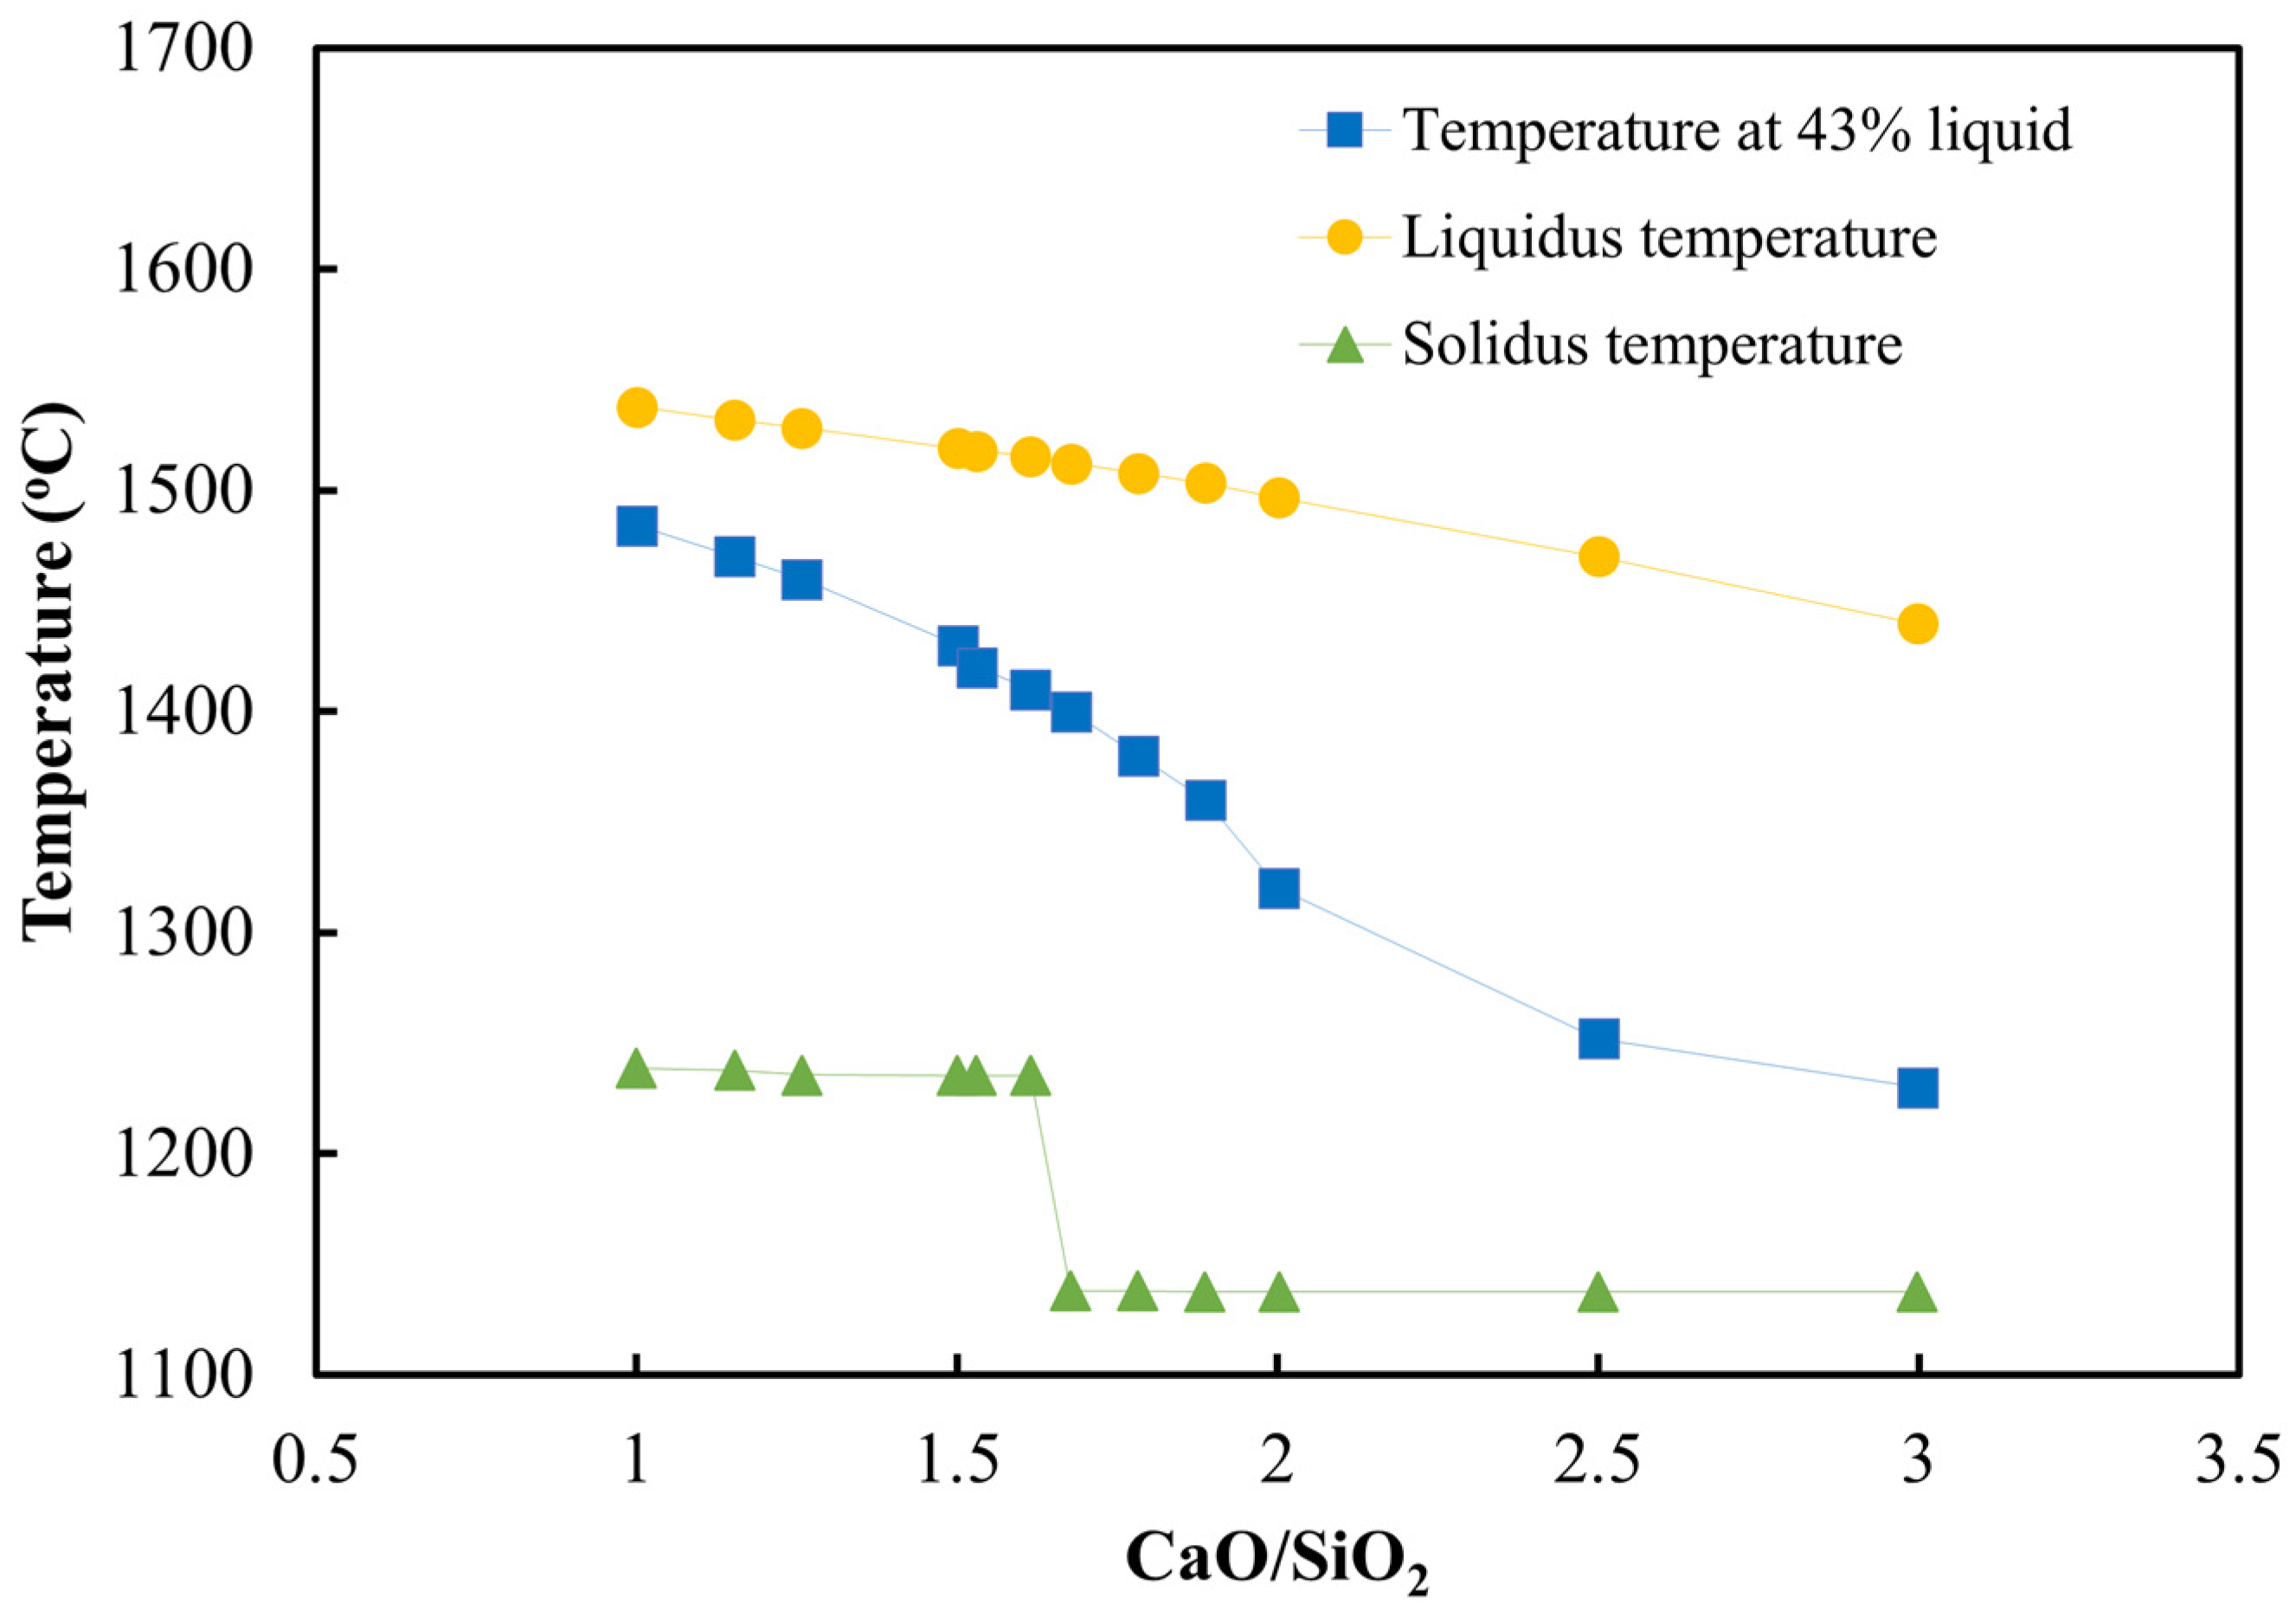
Analogue tests are favoured for fundamental investigations of sintering as it is possible to tightly control the composition, time at temperature, and gas atmosphere. An extensive study was undertaken for the analogues at basicity 2.0, resulting in the selection of a temperature Tmax = 1320 °C to produce a competent sinter tablet. Using the same Tmax = 1320 °C for different basicity tablets resulted in either under or over-sintered tablets. Therefore, an investigation was carried out to find the appropriate Tmax for different basicities based on the calculation of the liquid fraction at equilibrium using FactSage software v.8.0. The stable phases were calculated using the composition of the analogue tablets and a pO2 of 5 × 10⁻³, utilising the FactPS and FTOxid databases. The standard condition at basicity 2.0 (Tmax = 1320 °C) was selected as the base case, with the equilibrium liquid fraction calculated to be 43 %. This liquid fraction was then used together with the basicity to calculate the corresponding Tmax for other basicities. The solidus, liquidus, and a line representing the temperature at which 43% liquid (T43) was predicted to form at equilibrium are all plotted in Figure 12. The results show that the liquidus temperature decreased with increasing CaO levels, with a step change in the solidus temperature between basicity 1.6 and 1.7.
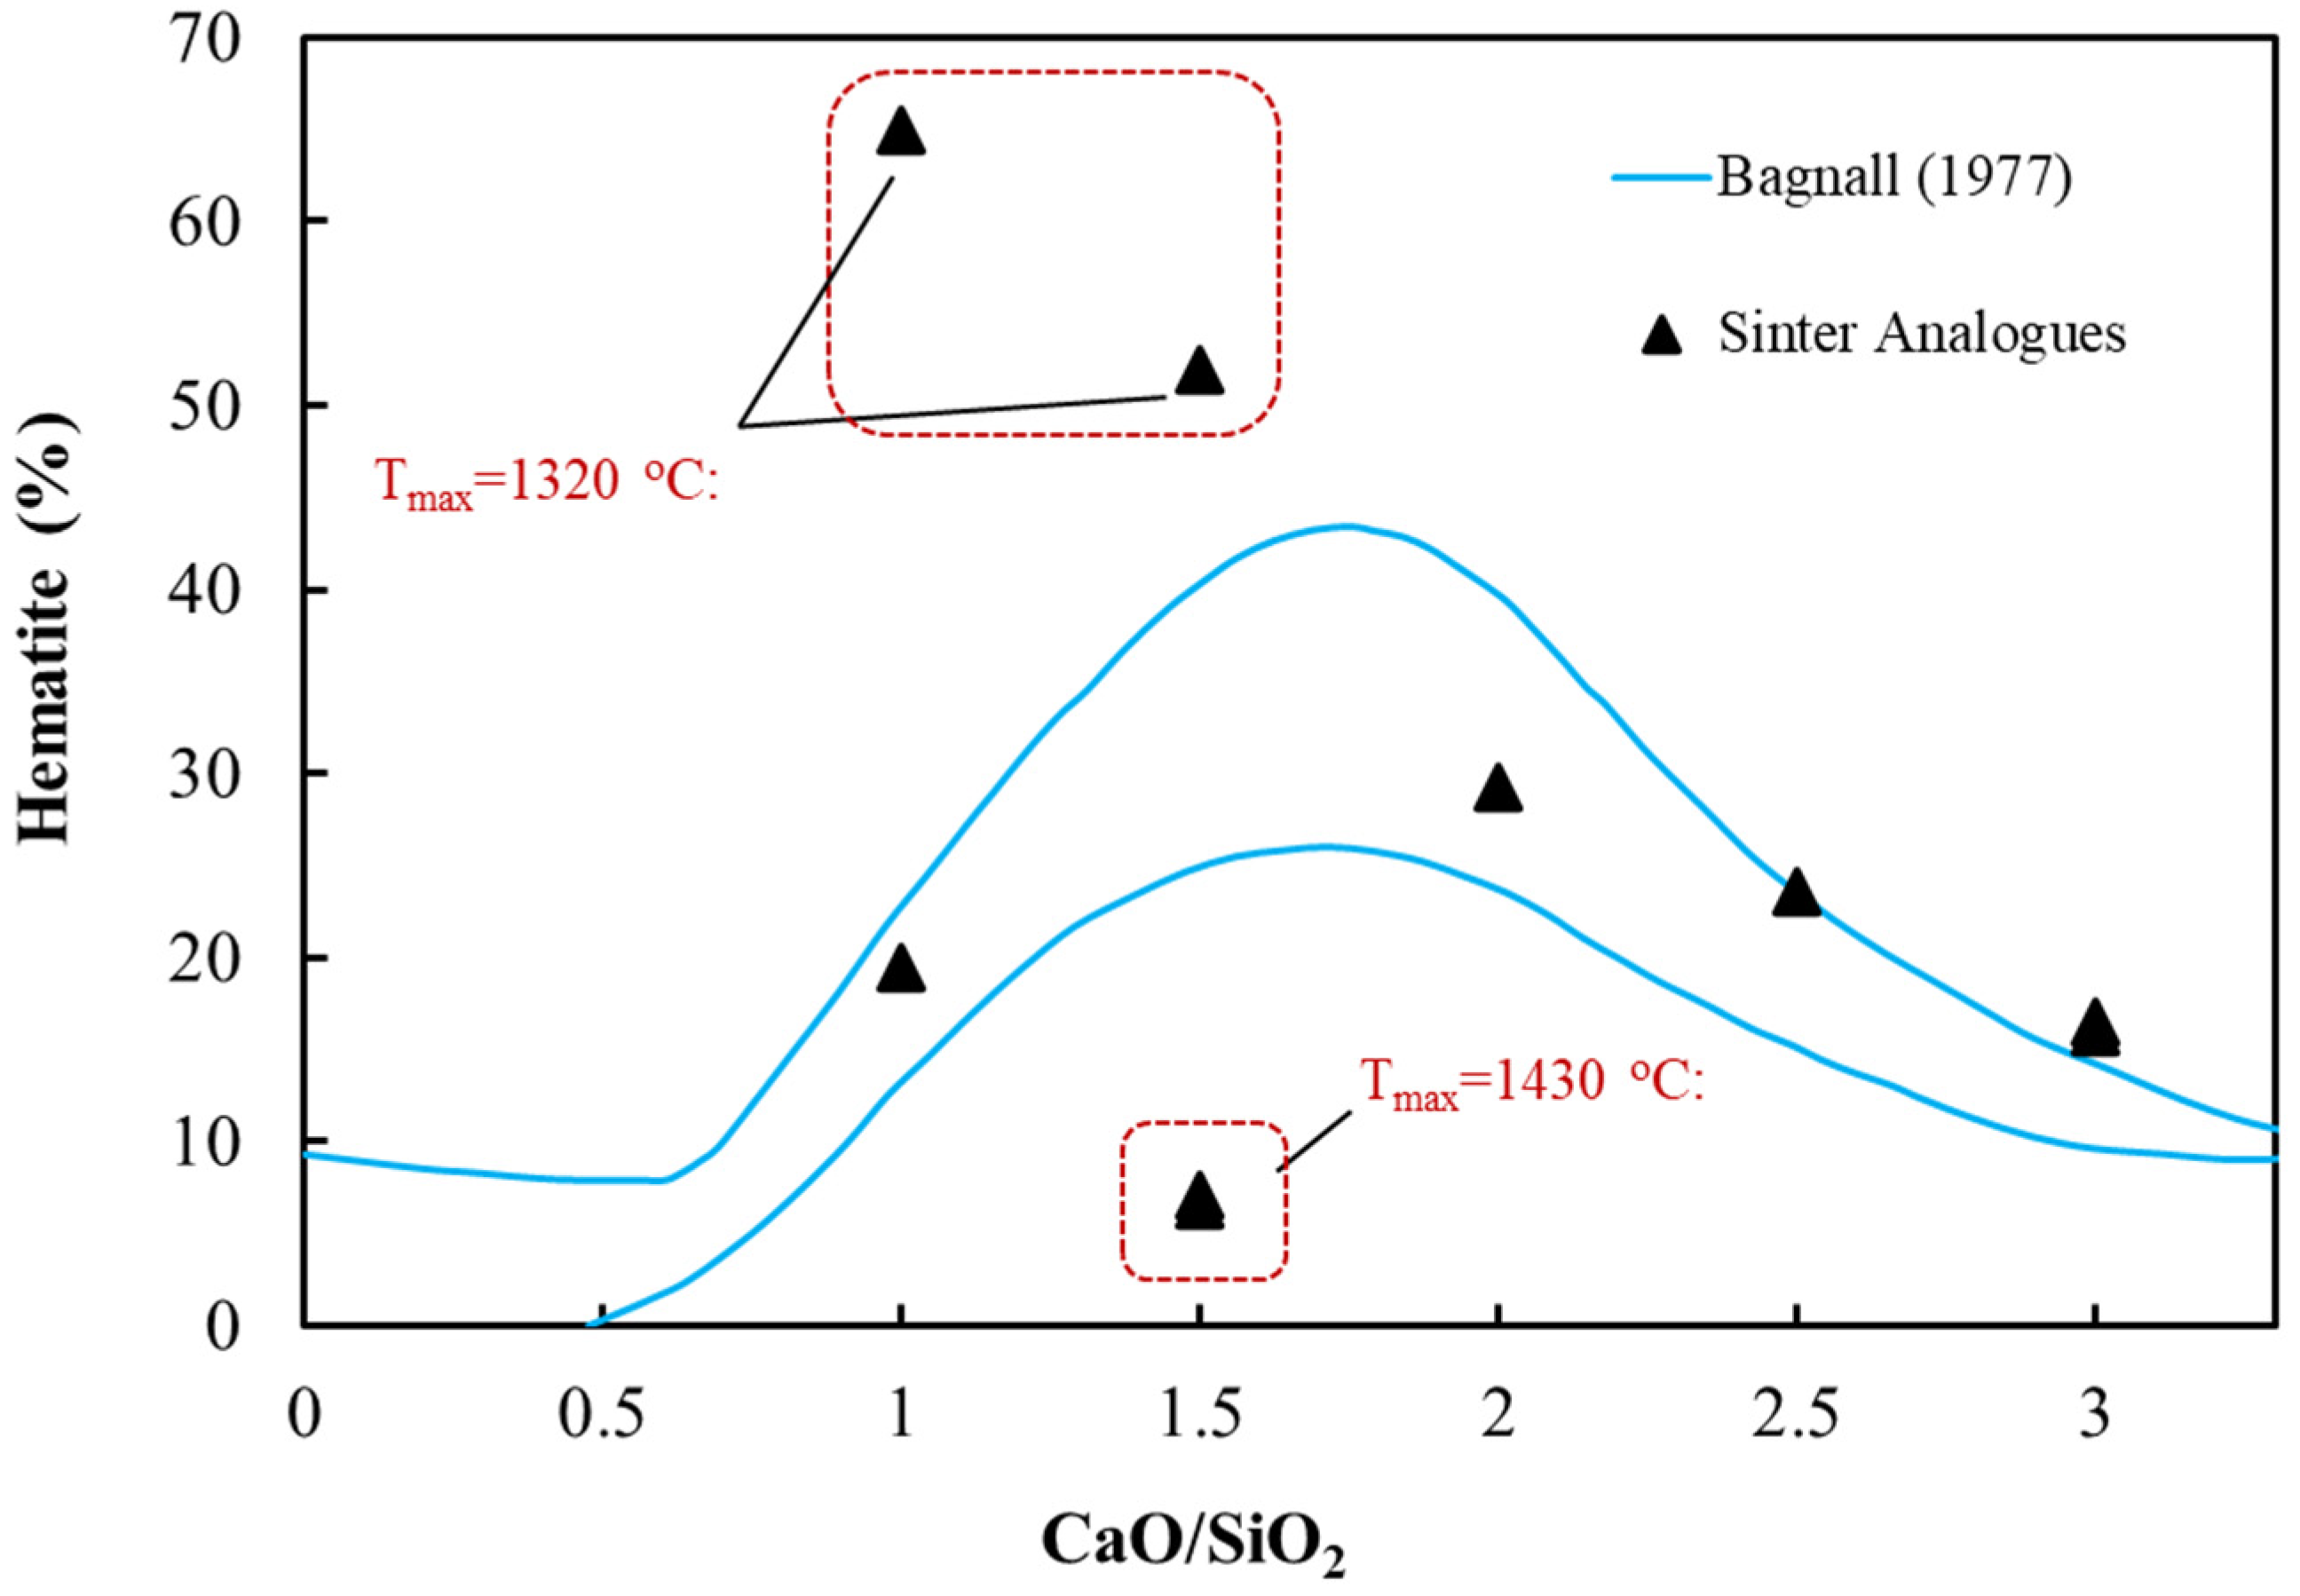
The hematite content for analogues fired with a range of Tmax is plotted in Figure 13. Keeping a constant Tmax = 1320 °C for all basicities resulted in very high hematite contents at basicities less than 1.5, and under-fired analogue tablets with very low strength. Using the predicted T43 from FactSage (T43 = 1480, 1430, 1320, 1252, and 1230 °C for basicities 1.0, 1.5, 2.0, 2.5, and 3.0, respectively) led to the formation of competent analogue tablets with mineralogies that matched the pot and plant sinters.
The exception to this trend was observed at basicity 1.5, where the T43 =1430 °C resulted in an unusually high amount of melt, which was also reflected in the lower hematite content shown in Figure 13. As mentioned earlier, the hematite content for basicity 1.5 and Tmax = 1320 °C was too high. It is thought that this anomaly may be due to the sample’s proximity to the step change in solidus temperature between basicity ≈1.6–1.7. FactSage calculations assume that the sample is well-mixed and reaches equilibrium, whereas even the analogue tablets are heterogeneous in composition and do not reach equilibrium due to kinetic constraints.
The first melt that forms in the sample may be adjacent to flux particles and have a higher effective basicity than suggested by the average chemical composition.

4. Conclusions

Sinter mineralogy data from an operating sinter strand, a pilot-scale sinter pot, laboratory-scale milli-pot, and analogue sinters were all found to follow predictable trends with basicity. These trends are generally consistent with the relationships identified by Bagnall. The bonding phases at low basicity were dominated by magnetite and glass. As more CaO was added, these phases were replaced by hematite and SFCA. At high basicity, SFCA dominated and dicalcium silicate increased.
Sinter from BlueScope Steel’s industrial sinter strand was analysed over a 30-year period, during which time a wide range of iron ore fines blends were utilised and several significant process modifications made. Throughout these changes, a sinter product of acceptable quality for the blast furnace was produced—albeit with a wide range of mineralogy, suggesting that basicity is the primary driver of sinter mineralogy.
The mineralogy of the sinter produced in the pilot-scale sinter pot experiments followed a similar trend to the plant data, although the hematite content was systematically higher and the magnetite content lower—presumably due to the different fuel rate and cooling conditions used in the tests compared to the industrial sinter strand. The fuel rate required to produce sinter with an adequate yield and strength in the pilot-scale sinter pot experiments decreased to a minimum at a basicity of approximately 2.0, after which it remained constant. The sinter TI increased with increasing basicity up to approximately 1.8, then remained constant. The productivity, RI, and RDI of the pot sinter improved with increasing basicity.
The smaller diameter milli-pot produced sinter with a higher magnetite and C2S content due to the higher fuel rate required to compensate for higher heat losses.
The heating profile and gas atmosphere used in the laboratory analogue sinter experiments were tuned to simulate the plant and pilot-scale sintering conditions. The maximum temperature used in analogue tests was varied in agreement with FactSage calculated liquid fractions for each basicity and was found to generate sinter with adequate strength and with mineralogy consistent with the larger-scale sinter experiments.
No relationship was found for the MgO content of the sinter and its magnetite content.

Author Contributions

Writing—original draft preparation by T.H., T.B.T.N., D.P., P.R.J.C., M.I.P., D.P.O. and J.M. Investigation was carried out by T.B.T.N., P.R.J.C., D.P., L.M., J.L., T.S. and D.P.O. Conceptualization was performed by T.H., D.P., D.P.O. and M.I.P. All authors have read and agreed to the published version of the manuscript.

Funding

This research was funded by BHP through the Centre for Ironmaking Materials Research.

Data Availability Statement

The data presented in this study are available on request from the corresponding author. The data are not publicly available due to commercial confidentiality.

Acknowledgments

The authors acknowledge the support of BHP, BlueScope Steel, and CSIRO Mineral Resources for their financial support and permission to publish this paper. We also acknowledge the assistance of Liming Lu for carrying out the sinter pot experiments, Hamid Doostmohammadi for the FactSage equilibrium calculations, and Karen Palolite for firing the sinter analogue tablets.

Conflicts of Interest

The authors declare no conflict of interest.

References

  1. Zhou, D.D.; Cheng, S.S.; Wang, Y.S.; Jiang, X. The production and development of large blast furnaces in China during 2015. Ironmak. Steelmak. 2016, 44, 351–358. [Google Scholar] [CrossRef]
  2. Zhou, D.D.; Xu, K.; Xu, G.; Jiang, X. The production of large blast furnaces of China in 2017. Ironmak. Steelmak. 2018, 47, 316–321. [Google Scholar] [CrossRef]
  3. Geerdes, M.; Chaigneau, R.; Kurunov, I.; Lingiardi, O.; Ritketts, J. Modern Blast Furnace Ironmaking: An Introduction, 3rd ed.; Ios Press: Amsterdam, The Netherlands, 2015. [Google Scholar]
  4. Loo, C.E.; Wong, D.J. Fundamental Factors Determining Laboratory Sintering Results. ISIJ Int. 2005, 45, 449–458. [Google Scholar] [CrossRef]
  5. Harvey, T.; Honeyands, T.; O’Dea, D.; Evans, G. Sinter Strength and Pore Structure Development using Analogue Tests. ISIJ Int. 2020, 60, 73–83. [Google Scholar] [CrossRef]
  6. Harvey, T.; Pownceby, M.I.; Chen, J.; Webster, N.A.S.; Nguyen, T.B.T.; Matthews, L.; O’Dea, D.; Honeyands, T. Effect of Temperature, Time, and Cooling Rate on the Mineralogy, Morphology, and Reducibility of Iron Ore Sinter Analogues. JOM 2020, 73, 345–355. [Google Scholar] [CrossRef]
  7. Higuchi, K.; Okazaki, J.; Nomura, S. Influence of Melting Characteristics of Iron Ores on Strength of Sintered Ores. ISIJ Int. 2020, 60, 674–681. [Google Scholar] [CrossRef]
  8. Honeyands, T.; Manuel, J.; Matthews, L.; O’Dea, D.; Pinson, D.; Leedham, J.; Zhang, G.; Li, H.; Monaghan, B.; Liu, X.; et al. Comparison of the Mineralogy of Iron Ore Sinters Using a Range of Techniques. Minerals 2019, 9, 333. [Google Scholar] [CrossRef]
  9. Ishikawa, Y.; Shimomura, Y.; Sasaki, M.; Hida, Y.; Toda, H. Improvement of sinter quality based on the mineralogical properties of ores. Ironmak. Proc. 1983, 42, 17–29. [Google Scholar]
  10. Ji, Z.; Zhao, Y.; Gan, M.; Fan, X.; Chen, X.; Hu, L. Microstructure and Minerals Evolution of Iron Ore Sinter: Influence of SiO2 and Al2O3. Minerals 2019, 9, 449. [Google Scholar] [CrossRef]
  11. Mežibrický, R.; Csanádi, T.; Vojtko, M.; Fröhlichová, M.; Abart, R. Effect of alumina and silica content in the calcium aluminosilicoferrite Ca2 (Ca, Fe, Mg) 6 (Fe, Si, Al) 6O20 bonding phase on the strength of iron ore sinter. Mater. Chem. Phys. 2021, 257, 123733. [Google Scholar] [CrossRef]
  12. Scarlett, N.V.Y.; Pownceby, M.; Madsen, I.C.; Christensen, A.N. Reaction sequences in the formation of silico-ferrites of calcium and aluminum in iron ore sinter. Met. Mater. Trans. A 2004, 35, 929–936. [Google Scholar] [CrossRef]
  13. Webster, N.A.S.; Pownceby, M.I.; Madsen, I.C. In situ X-ray diffraction investigation of the formation mechanisms of silico-ferrite of calcium and aluminium-I-type (SFCA-I-type) complex calcium ferrites. ISIJ Int. 2013, 53, 1334–1340. [Google Scholar] [CrossRef]
  14. Webster, N.A.S.; Pownceby, M.I.; Madsen, I.C.; Kimpton, J.A. Silico-ferrite of Calcium and Aluminum (SFCA) Iron Ore Sinter Bonding Phases: New Insights into Their Formation During Heating and Cooling. Met. Mater. Trans. A 2012, 43, 1344–1357. [Google Scholar] [CrossRef]
  15. Bagnall, E.J. Influence of feed material properties on sinter for blast furnaces. Agglomeration 1977, 77, 2. [Google Scholar]
  16. Geerdes, M.; Chaigneau, R.; Lingiardi, O. Modern Blast Furnace Ironmaking: An Introduction; Ios Press: Amsterdam, The Netherlands, 2020. [Google Scholar]
  17. Chen, J.; Cheng, S.; Shevchenko, M.; Hayes, P.C.; Jak, E. Investigation of the Thermodynamic Stability of C (A, F) 3 Solid Solution in the FeO-Fe2O3-CaO-Al2O3 System and SFCA Phase in the FeO-Fe2O3-CaO-SiO2-Al2O3 System. Metall. Mater. Trans. B 2021, 52, 517–527. [Google Scholar] [CrossRef]
  18. Harvey, T. Influence of Mineralogy and Pore Structure on the Reducibility and Strength of Iron Ore Sinter; University of Newcastle: Callaghan, Australia, 2020. [Google Scholar]
  19. Clout, J.; Manuel, J. Fundamental investigations of differences in bonding mechanisms in iron ore sinter formed from magnetite concentrates and hematite ores. Powder Technol. 2003, 130, 393–399. [Google Scholar] [CrossRef]
  20. Honeyands, T.; Manuel, J.; Matthews, L.; O’dea, D.; Pinson, D.; Leedham, J.; Monaghan, B.; Li, H.; Chen, J.; Hayes, P.; et al. Characterising the mineralogy of iron ore sinters—State-of-the-art in Australia. Proc. Iron Ore. 2017, 49–60. Available online: https://www.ausimm.com/publications/conference-proceedings/iron-ore-2017/characterising-the-mineralogy-of-iron-ore-sinters---state-of-the-art-in-australia/ (accessed on 21 August 2022).
  21. Lu, L. Iron Ore: Mineralogy, Processing and Environmental Sustainability; Elsevier: Amsterdam, The Netherlands, 2015. [Google Scholar]
  22. Singh, T.; Li, H.; Zhang, G.; Mitra, S.; Evans, G.; O’Dea, D.; Honeyands, T. Iron Ore Sintering in Milli-Pot: Comparison to Pilot Scale and Identification of Maximum Resistance to Air Flow. ISIJ Int. 2021, 61, 1469–1478. [Google Scholar] [CrossRef]
  23. Loo, C.E.; Tame, N.; Penny, G.C. Effect of Iron Ores and Sintering Conditions on Flame Front Properties. ISIJ Int. 2012, 52, 967–976. [Google Scholar] [CrossRef]
  24. Hsieh, L.-H.; Whiteman, J.A. Sintering conditions for simulating the formation of mineral phases in industrial iron ore sinter. ISIJ Int. 1989, 29, 24–32. [Google Scholar] [CrossRef]
  25. Nicol, S.; Jak, E.; Hayes, P.C. Microstructure evolution during controlled solidification of “Fe2O3”-CaO-SiO2 liquids in air. Metall. Mater. Trans. B 2019, 50, 2706–2722. [Google Scholar] [CrossRef]
  26. Liu, D.; Evans, G.; Loo, C.E. Iron ore sinter structure development under realistic thermal conditions. Chem. Eng. Res. Des. 2018, 130, 129–137. [Google Scholar] [CrossRef]
  27. Loo, C.E.; Heikkinen, J. Structural Transformation of Beds during Iron Ore Sintering. ISIJ Int. 2012, 52, 2158–2167. [Google Scholar] [CrossRef] [Green Version]
  28. Umadevi, T.; Brahmacharyulu, A.; Karthik, P.; Mahapatra, P.C.; Prabhu, M.; Ranjan, M. Recycling of steel plant mill scale via iron ore sintering plant. Ironmak. Steelmak. 2012, 39, 222–227. [Google Scholar] [CrossRef]
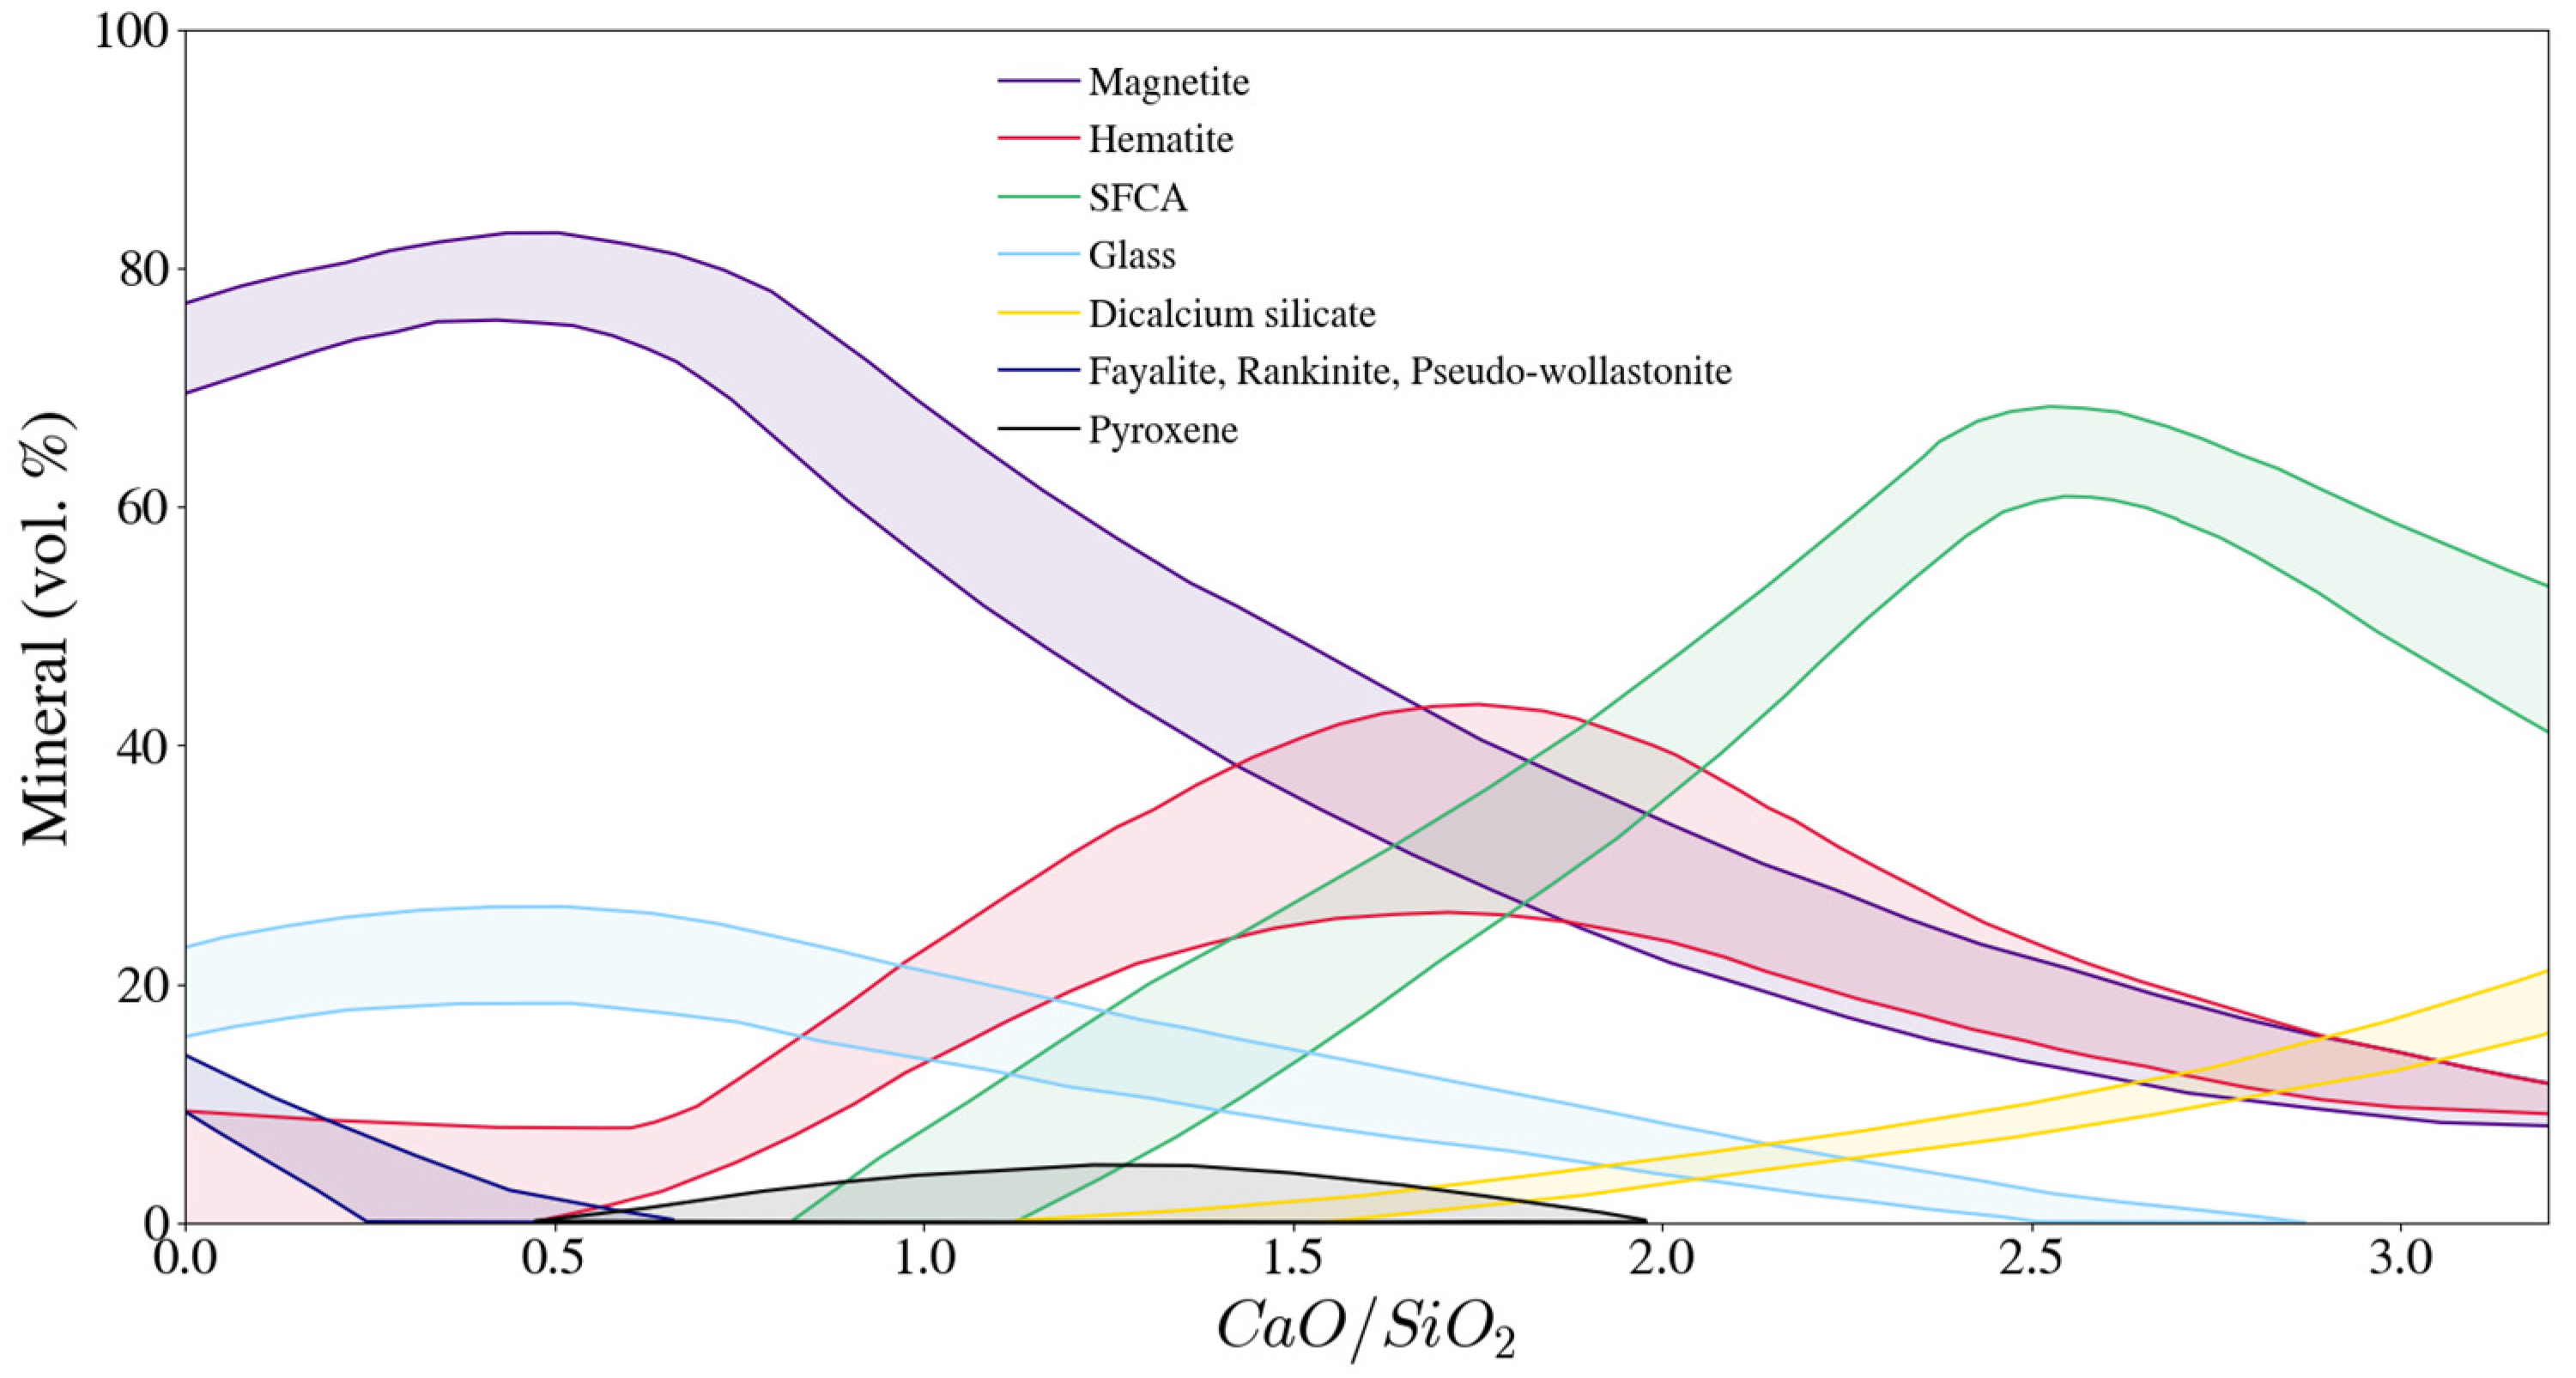
Figure 1. Published data for sinter mineralogy vs basicity [15].
Minerals 12 01249 g001
Figure 2. Schematic diagram of different sinter scales: (a) industrial sinter strand; (b) sinter pot; (c) sinter milli-pot; (d) sinter analogue.
Minerals 12 01249 g002
Figure 3. Set point temperature profile in the rapid heating furnace for the bonding phase tests.
Minerals 12 01249 g003
Figure 4. Typical sinter mineralogy under an optical microscope for basicities (a) 1.2; (b) 2.0; and (c) 2.8 (H-prim means primary hematite; H-skel-sec means skeleton secondary hematite; H-sec means secondary hematite; mag means magnetite).
Minerals 12 01249 g004aMinerals 12 01249 g004b
Figure 5. Total SFCA content vs basicity. * Note that (CaO + MgO)/SiO2 was used for data obtained by Geerdes et al. (2020) [16].
Minerals 12 01249 g005
Figure 6. Total hematite content vs basicity. * Note that (CaO + MgO)/SiO2 was used for data obtained by Geerdes et al. (2020) [16].
Minerals 12 01249 g006
Figure 7. Total magnetite content vs basicity. * Note that (CaO + MgO)/SiO2 was used for data obtained by Geerdes et al. (2020) [16].
Minerals 12 01249 g007
Figure 8. Dicalcium silicate content vs basicity.
Minerals 12 01249 g008
Figure 9. Glass content vs basicity. There are 805 data points for the “Industrial data” set.
Minerals 12 01249 g009
Figure 10. Sinter pot operating results.
Minerals 12 01249 g010
Figure 11. Sinter pot quality results. RDI −2.8 mm is plotted.
Minerals 12 01249 g011
Figure 12. Liquidus and solidus temperatures calculated using FactSage v.8.0 for analogue sinter composition.
Minerals 12 01249 g012
Figure 13. Total hematite content for the analogue sinter at basicity 1.5 is shown to be either too low at Tmax = 1430 °C or too high at Tmax = 1320 °C.
Minerals 12 01249 g013
Publisher’s Note: MDPI stays neutral with regard to jurisdictional claims in published maps and institutional affiliations.