Abstract
Oxygen and carbon isotopes of well-preserved skeletal remains give relevant support to archaeological and environmental reconstructions. However, the preservation of the skeletal remains must be preliminarily checked. About twenty-five years ago, a diagnostic method based on the oxygen isotope ratio in the phosphate, and carbonate, of bioapatite of modern mammals was proposed: for well-preserved samples, the and should plot near the regression line on obtained for modern mammals. In the last twenty years, techniques of analysis have changed. In the past, or were precipitated from dissolved bioapatite and analysed with the fluorination technique, whereas at present, temperature reduction (HTR) in a glassy carbon reactor with release is commonly used. Taking into account the HTR technique, for some modern mammals, we report a new + 1 on + 1 regression line, and related dispersion of the data that, in addition to mineralogical and structural methods, may be used to select samples reliable for archaeological use. In the past, other similar regression lines on modern mammals were defined by several authors. However, statistical results indicate that data used for these regression lines cannot be pooled because the hypothesis of a similar elevation is rejected.
1. Introduction
In this paper, the parameter delta (δ) is defined according to IUPAC (International Union of Pure and Applied Chemistry):
where R is the ratio between the abundances of the isotope and of the isotope present in a chemical species of the material i or of the reference material RM, and ‰ = .
The inorganic portion of bones and teeth of animals and humans mostly consists of bioapatite. Bioapatite ([,,,] and references therein) is a calcium phosphate with the general formula:
where: M = , , …; ; X = , ⎕ = lattice vacancy. Substitution of for and for are called B and A substitutions, respectively, the latter being much lower than the former. Moreover, the total substitution is less than about 4–5% weight as ([] and references therein).
In archaeology and environmental reconstruction, carbon isotopes of the carbonate ( of bone and tooth (enamel and dentine) of bioapatite are commonly used for defining the palaeodiet of ancient populations (e.g.,: [,,]). Moreover, the oxygen isotopes of the phosphate ( and , here indicated as Ph) of apatite are used by archaeologists, in particular, to reconstruct the average isotope values of drinking water ingested directly or indirectly by humans or other animals, and thus, indirectly, the climatic condition of their living area (e.g.,: ([,,,]). A relationship between the ratio of the
and abundances in phosphate and drinking water (W) ingested by modern mammals was demonstrated starting from about four decades by several authors (e.g.,: [,,]). The uncertainty on the δ evaluation from experimental values is high to very high (for the water ingested by humans the uncertainty is about 2.5‰ []). In spite of it, this correlation and similar correlations for animals (e.g.,: []) are still in use for palaeclimate and archaeological reconstructions.
Bioapatite, however, may suffer post mortem low-temperature transformations (diagenetic processes), that may change its value both in phosphate and carbonate and the value in carbonate. Therefore, before using these data, an investigation of the possible diagenetic changes is necessary. In particular, bioapatite recrystallization may lead to loss of the carbonate group of bioapatite (e.g.,: []); thus, an evaluation of its structural features may be useful. A control of apatite crystallinity for the assessment of bone integrity has been recently proposed by Del Sasso [] combining vibrational spectroscopies and X-ray diffraction methods. It is noteworthy, however, that recrystallization of apatite does not furnish direct evidence of variation in the isotopic distribution (e.g.,: [,,] and references therein), but only suggests that possible changes in the isotopic values could have occurred.
Using the fluorination technique, Bryant et al. [] and Iacumin et al. [] analysed oxygen of the phosphate of bone and tooth bioapatite from different species of modern mammals that lived in different climatic conditions. These authors found a very good correlation between and that, together with structural evidence, has been largely used to evaluate the diagenetic conditions of bone apatite. Actually, post mortem diagenetic processes may lead to increasing scattering around and/or systematic deviation of the isotope data from the on the regression line. If the oxygen of carbonate undergoes an exchange with the environment, this, reasonably, could also occur for carbon. Thus, vs. distribution also assumes relevance as a potential indicator of reliability of values.
Standard enthalpies of the formation of carbonate and phosphate (−677.1 and −1277.4 kJ mole−1, respectively []) suggest that carbonate is less stable in a solution than phosphate, and thus, that an oxygen exchange is easier for carbonate than for phosphate. This is in agreement with kinetic considerations for inorganic water-mineral interaction. Experiments demonstrated that oxygen exchange between phosphate and the environment is extremely slow in inorganic conditions [] but is very rapid in enzyme-catalysed reactions []. If the exchange reaction is bacteria-mediated, the behaviour of the phosphate and carbonate is apparently inverted, the oxygen of phosphate reacting faster than the oxygen of carbonate [].
Taking into account the present common use of the high-temperature reduction technique (HTR) ([,]), in this paper, (1) we report a new + 1 vs. + 1 regression line for modern mammals, for which the data were obtained by HTR using international easily available standards and a defined procedure; (2) we compare the regression lines obtained for modern mammals by different authors; we did not consider ancient remains of mammals since they may be affected by diagenesis; (3) staring from this new regression line, we give an indication for selecting samples used for archaeological and palaeoclimatic inferences.
The scarce number of data at disposal in this paper is a limit for deep theoretical considerations. It is noteworthy, however, that the aim of this paper (point 3) is merely practical, not theoretical.
2. Significance of the Measured
The for carbonate of minerals (in our case bioapatite and low-Mg calcite) is not directly determined but obtained by measuring the isotope ratios of gaseous carbon dioxide, , produced, at the defined temperature T, by the dissolution of the mineral in orthophosphoric acid with the defined concentration of the component. The definition of “oxygen isotope phosphoric acid fractionation factor”, , between , produced by dissolution of bioapatite, and the carbonate of bioapatite at temperature T allows us to understand the significance of the measured . The definition is the following:
where and are the delta values for the generated from apatite and for the of apatite, respectively. Since is unknown, cannot be correctly evaluated. Only an “apparent” value is determined. This value is obtained assuming that during the acid dissolution at the temperature T, bioapatite behaves as low-Mg calcite (Cal) used as the standard for the isotope analysis (see Appendix A); i.e.,:
where
= , is the value for the produced by dissolution of low-Mg calcite and is the value for carbonate of low-Mg calcite.
The oxygen isotopic composition of produced depends on several important factors (e.g., [,,,,,,,,,,,,]). Among these factors, we emphasize the following: (1) pre-treatment of the sample; (2) temperature of reaction of the sample with H3PO4; (3) concentration of the H3PO4 chemical component in the acid; (4) composition of bioapatite; (5) interaction of the new-formed with endogenic water that is generated by the reaction producing ; (6) solution species that formed with phosphorous-bearing anions and cations liberated by the mineral dissolution.
3. Methods and Materials
3.1. Materials
The values for carbonate and phosphate have been determined on tooth (enamel) and bone bioapatite from several modern mammals (Canis aureus, Vulpes vulpes, Vulpes zerda, Vulpes lagopus, Alces alces) that lived in different localities under variable climatic conditions. Only one portion of bone or tooth for each individual was analysed. The data reported are the average of two experimental values obtained during the same analytical run.
3.2. Calibration for Sample Analysis
Calibration is generally done using several international or in-house standards. In the case that the linearity of the final instrumental response is verified, matrix effect, errors on the isotopic measurements and errors on the isotopic values of the standards used for the regression are absent, the standards will be perfectly aligned along the regression line of the form
where is the measured value of a generic standard st referred to the laboratory working standard w (, is the “true” values, and B is the slope. From Equation (1a) we obtain the calibration line which gives the estimate:
for the material i in analysis. We prefer Equation (1b) in place of the usual expression = + a because (1b) may give direct information on instrumental linearity. Linearity of the final instrumental response may be defined as proportionality between the measured (m) isotope abundance ratio, R(18O/16O)i,m, and the “true” value R(18O/16O)i, i.e.,
where R(18O/16O) is referred to the chemical species of interest (e.g.,: C, P), present in generic substance i, and c is a constant. In terms of δ + 1 values referred to the laboratory working standard w, relation (2) is written as:
which represents a straight line passing through the origin.
R(18O/16O)i,m = c R(18O/16O)i
Systematic errors and random errors in the measurements of the standards occur; matrix effect for standards of different material may be present; in general, the instrument response is not perfectly linear. Thus, the scattering of data around the calibration line and the intercept significantly different from zero are frequent. Note that, in this case, intercept is significantly different from zero, only new values of the analysed samples that fall in the range of the delta values of standards may be accepted; practically, only very small extrapolation is allowed.
3.3. Analytical Methods
Since the results obtained in this paper may be compared with data obtained from archaeological and palaeontological samples, in agreement with the Criterion of Identity Treatment, the modern samples of this study were chemically treated as ancient samples.
3.3.1. Oxygen of the Carbonate
Initial considerations. Different procedures of sample preparation frequently give different isotopic results not only on ancient, but also on modern samples. This argument has been widely discussed in the literature (e.g.,: [,,,,,,,]). In particular, Crowley and Wheatley [] suggest that pre-treatment with NaClO or H2O2 and Ca-buffered acetic acid solution produces similar results for enamel carbonate, whereas NaClO is not recommended for tissues with higher organic content, such as bone and dentine. Our experience, however, suggests that it is difficult to obtain complete elimination of high content of organic components using H2O2 and that, on bones, a very low concentration of NaClO (2% solution) allows results that, in the limit of the analytical uncertainty of our analyses, are comparable with those obtained using H2O2. Thus, also for a better comparison with data produced in our laboratory in the past, we preferred to follow our routine procedure with the use of NaClO.
Analysis of our samples. Powdered bioapatite samples were previously treated with 2%wt. NaClO solution for one day to eliminate organic material, later repeatedly rinsed with distilled water, and, finally, treated with Ca-acetic buffer (1 N). About 2 mg of the treated apatite and 0.1 mg of the international standards NBS 18 (low-Mg calcite, = 7.20‰ ± 0.10‰) and NBS 19 (low-Mg calcite, = 28.64‰ by definition) were loaded into reaction vessels of a Finnigan GasBench II automatic sampling system. Reaction vessels were flushed with helium and, later, the samples were reacted at 50 °C for 7–8 h with 0.2 cm3 of H3PO4 acid solution (concentration of the H3PO4 component ≥ 100%, density ≅ 1.90 g cm−3). The CO2gas produced was analysed by a mass spectrometer Finnigan Delta Plus.
3.3.2. Oxygen of the Phosphate
Initial considerations. In the past, was usually determined by conventional fluorination ([] and references therein) of BiPO4 or Ag3PO4 precipitated from dissolved bioapatite. At present, however, is frequently measured by online high-temperature reduction (HTR) in a glassy carbon reactor with CO release ([] and references therein). According to the Identical Treatment Principle [], the HTR method would require standards used for calibration and samples in analysis to be reduced to the same material, namely Ag3PO4. Unfortunately, however, this is not always possible.
Vennemann et al. [], together with other laboratories, prepared several Ag3PO4 samples precipitated from natural or synthetic materials and analysed their oxygen isotopes by fluorination. The accuracy of the obtained results (referred to as VSMOW) was guaranteed by replicate analyses of the quartz standard NBS-28 (9.56‰ ± 0.07‰, standard deviation, 12 data, against the expected value of 9.58‰ ± 0.09‰, []) and of the in-house quartz standard NCSU (11.62‰ ± 0.17‰, 20 data, against the expected value 11.67‰). In addition, the standard NIST SRM 120c (Florida Phosphate Rock) gave a value of 22.58‰ ± 0.05‰. Five of the samples analysed (namely TU-1, 21.11‰ ± 0.07‰, standard error on the average; TU-2, 5.45‰ ± 0.04‰; YR-1, −5.19‰ ± 0.09‰; YR-2, 13.06‰ ± 0.11‰; YR-3, 34.03‰ ± 0.13‰) were considered as standards to be distributed worldwide. The same Ag3PO4 samples were also analysed by HTR and the obtained raw values normalised to the data for the samples GW-1, 130-9, and 130-1 previously analysed by fluorination (TU-1, 21.11‰ ± 0.12‰; TU-2, 5.35‰ ± 0.17‰; YR-1, −5.77‰ ± 0.08‰; YR-2, 13.05‰ ± 0.07‰; YR-3, 33.54 ‰ ± 0.24‰). Fluorination and HTR data for TU-1, TU-2, YR-1, YR-2, and YR-3.1 are very well correlated according to a line passing for the origin (p(slope =1) = 0.86 and p(intercept =0) = 0.29, s(yx) = standard error of estimate = 0.32, p(homoscedastic) = 0.85) suggesting that not significant bias occurs in the HTR analysis. Unfortunately, these samples are no longer available.
Halas et al. [] prepared three new samples of Ag3PO4 (UMCS-1, UMCS-2, and AGPO-SCRI) for inter-laboratory comparison. These samples were analysed in two different laboratories together with the standards NIST SRM 120c and the samples TU-1 and TU-2 mentioned above. The data were normalised to IAEA-601 (benzoic acid), IAEA-602 (benzoic acid), IAEA-CH6 (sucrose), and IAEA-C3 (cellulose) or to IAEA-601 and IAEA-602. In spite of the use of these standards does not match the Principle of the Identical Treatment []; for the standards TU-1 and TU-2, the agreement between data reported by Vennemann et al. [] and by Halas et al. [] (Dundee Laboratory data) was very good (p(same average) ≈ 1) whereas the agreement for the standard NIST SRM 120c, was not so good (p(same average) ≈ 0.10), but still acceptable.
More recently, Watzinger et al. [] reported oxygen isotope analyses carried out in four different laboratories on a new silver phosphate sample (BOKU Ag3PO4) with 13.71‰ ± 0.34‰ (combined standard uncertainty). Calibration was done using the standards IAEA-601, IAEA-602, and NBS 127 (barium sulphate) and the “quality control” using the standard AGPO-SCRI (14.6‰ ± 0.2‰, standard deviation, against 14.58‰ ± 0.13‰ []) and NIST SRM 120c (22.9‰ ± 0.2‰ against 21.79‰ ± 0.15‰, []). The values obtained by Halas et al. [] and by Watzinger et al. [] for NIST SRM 120c are apparently significantly different (p(same average) < 0.005); it is noteworthy, however, that analyses reported in literature for NIST SRM 120c are largely variable ([] and references therein).
Based on the results reported above, we emphasize the following points:
- (1)
- The matrix effect apparently is not largely relevant for calibration; this makes the use of silver phosphate standards not strictly necessary.
- (2)
- Practically, the new phosphate BOKU cannot substitute the use of the standards listed above because calibration with only one standard is risky. Sample BOKU could be used only for “quality control”.
Analysis of our samples. The chemical treatment of the samples to obtain silver phosphate followed the protocol by Stephan []. About 50 mg of powdered sample was placed in 2.5%wt. NaClO solution for 24 h to eliminate organic material. After that, the supernatant was removed and the pellet was washed several times to neutralise it. Then, a 0.125 M NaOH solution was added (this is frequently used to dissolve humic substances possibly present in archaeological samples) and samples were left for 48 h for reacting. After the dissolution of the sample in 2M HF at 25 °C for 24 h, the precipitated CaF2 was separated from the phosphate solution by centrifugation and the solution was neutralized with 3 mL of 2M KOH solution in a 250 cm3 beaker. Doubly distilled water was added to make up the apatite solution to a total volume of 200 cm3. Later, 30 cm3 of buffered silver nitrate solution (AgNO3 0.2 M, NH4NO3 0.3 M, NH3 0.7 M) was added and the solution was gradually warmed to 70 °C for 3 h. The crystals of silver phosphate were collected on a millipore filter, and then washed and air-dried overnight at 50 °C. A total of 0.3 mg of sample was weighed in silver capsules together with 0.3 mg of glassy carbon and 0.5 mg of AgCl (the latter two act as catalysts for the combustion reaction). The oxygen isotope composition was analysed using a thermal conversion-elemental analyser unit (1420 °C) online with a mass spectrometer (Finnigan TC/EA-Delta Plus XP, Thermo Fisher Scientific, Bremen, Germany). The yield for oxygen was checked for all samples.
As discussed above, apparently the matrix effect is not relevant for calibration. Thus, standards IAEA-601 (benzoic acid, = 23.14‰ ± 0.10‰ VSMOW, approximate standard error of the mean better than 0.1‰, []), IAEA-CH-6 (sucrose, = 36.4‰ ± 0.15‰ VSMOW, []) and IAEA-600 (caffeine, = −3.48‰ ± 0.53‰ VSMOW, []) were used for calibration in this paper. Sulphate standards were disregarded because the yield of these substances was generally lower than 100% (down to 80%). As far as the Ag3PO4 from the samples is concerned, we disregarded two samples that gave a yield for oxygen of less than 100%. Unfortunately, the calibration with these three standards did not exactly match the Equation (1). A regression line in the form:
with A ≠ 0 was established. Thus, the calibration line is:
Equation (3) may be due to the absence of linearity of the spectrometric response (actual absence of linearity is not rare, [,]). If linearity is not perfect, the calibration line obtained with more than one standard is not a straight line but a curve. It is noteworthy, however, that the standards used in this paper cover a narrow range of values and, thus, in this range, the calibration curve approaches a straight line. Moreover, the samples of this paper fall in the delta interval of standards, and thus, no extrapolation was done.
3.4. Analytical Uncertainty
Usually, papers only report repeatability and reproducibility, and very rarely the prediction uncertainty related to the calibration line []. This is surprising because prediction uncertainty is the only value which is relevant for the comparison of data obtained in the same laboratory or in different laboratories.
Repeatability and reproducibility. During our routine analysis of carbonate, repeatability for analysis was about 0.15‰ and reproducibility (a different portion of the same sample at different times) was about 0.20‰. For phosphate, repeatability was about 0.20‰ and reproducibility was about 0.30‰ (different portions of different Ag3PO4 precipitates from the same sample, measured at different times).
Prediction uncertainty. Given the OLS (Ordinary Least Square Regression) = + 1 on = ( + 1 for the standards, st, the prediction uncertainty u() on the estimate value corresponding to a new Yj value was calculated as follows []:
where and are average values for the standard; refers to each standard;is the Student’s t-value (two-tailed test); α is the significance level; g, for each individual i, it is the number of experimental values with average value (in our case, two experimental values); n is the number of experimental values for the standards; is the standard error of regression; υ the degree of freedom (υ = n − 2). However, in our case, is affected by some uncertainty, . In this case, Taylor ([], pp. 188–190) suggests adding uncertainty to , i.e., = + B2 . For the standards used is, on average, ≈ 0.25‰ for . Thus, in Equation (4), may be introduced in place of to have a better evaluation of the uncertainty. From several calibration lines, we estimated the analytical prediction uncertainty, u() for : it is about 0.25‰ for carbonate and 0.35‰ for phosphate.
Accuracy. The accuracy of the data was checked using the standard BOKU for which we obtained 13.90‰ ± 0.35‰ (average of two experimental values, ± prediction uncertainty, []) against the declared value of 13.71‰ ± 0.34‰.
4. Results and Discussion
4.1. Results
Table 1 and Figure 1 report the obtained results. The range of delta values is a little bit narrower than the ranges obtained by Bryant et al. [] and Iacumin et al. [] (Table 2).
Table 1.
Oxygen isotope analyses of phosphate, Ph, and carbonate, Carb, from bone and tooth (enamel) bioapatite of modern mammals of different provenance.
Figure 1.
+ 1 on + 1. The regression lines have the same slope but different elevations [,,,].
Table 2.
Statistical data.
4.2. Comparison of + 1 on + 1 Regression Lines for Modern Samples
4.2.1. Data Used for Comparison
We considered data from Bryant et al. [], Iacumin et al. [], Zazzo et al. [], and Miller et al. []. Different authors used different standards and analytical techniques. Bryant et al. [] used laboratory standards; Iacumin et al. [] used a laboratory standard for the analysis of and quartz NBS28 for the oxygen of phosphate analysis; Zazzo et al. [] used international standards NBS18 and NBS19 for the oxygen analysis of . Iacumin et al. [] analysed the oxygen isotope of phosphate by fluorination of BiPO4 precipitated from dissolved bioapatite and Bryant et al. [] by fluorination of Ag3PO4. Zazzo et al. [] analysed Ag3PO4 by graphite method (since with this method the oxygen yield in only 25%, they corrected the data using a constant offset of +0.5‰). Miller et al. [] analysed Ag3PO4 by HTR.
4.2.2. Data Obtained at Different Temperatures
The temperature of the acid dissolution is a critical parameter for the value of the produced by the dissolution of apatite. For instance, using GasBench (Thermo-Finnigan, Bremen, Germany) as a preliminary test, we determined the delta raw values at 50 °C and 72 °C on 46 portions of the same sample of bone bioapatite. The result was the following: Δ = − = (1.0 ± 0.2‰, standard deviation). This suggests an important role of temperature. Obviously, the use of phosphate standards with known values of would eliminate the offset due to the different temperatures. Unfortunately, however, the standards commonly used (this is also our case) are low-Mg calcites, not phosphates. Thus, data obtained at different temperatures must be corrected, as indicated in the Appendix A. The oxygen isotope analyses on the carbonate reported by Iacumin et al. [] and by Zazzo et al. [] refer to produced at 50 °C, whereas the data reported by Bryant et al. [] and Miller et al. [] was of produced at 90 °C. Thus, the values obtained by Bryant et al. [] and Miller et al. [] were reduced to 50 °C. The systematic differences calculated between the estimated values at 50 °C and at 90 °C (about 0.10–0.15‰) are similar to, or lower than, the uncertainty of the data.
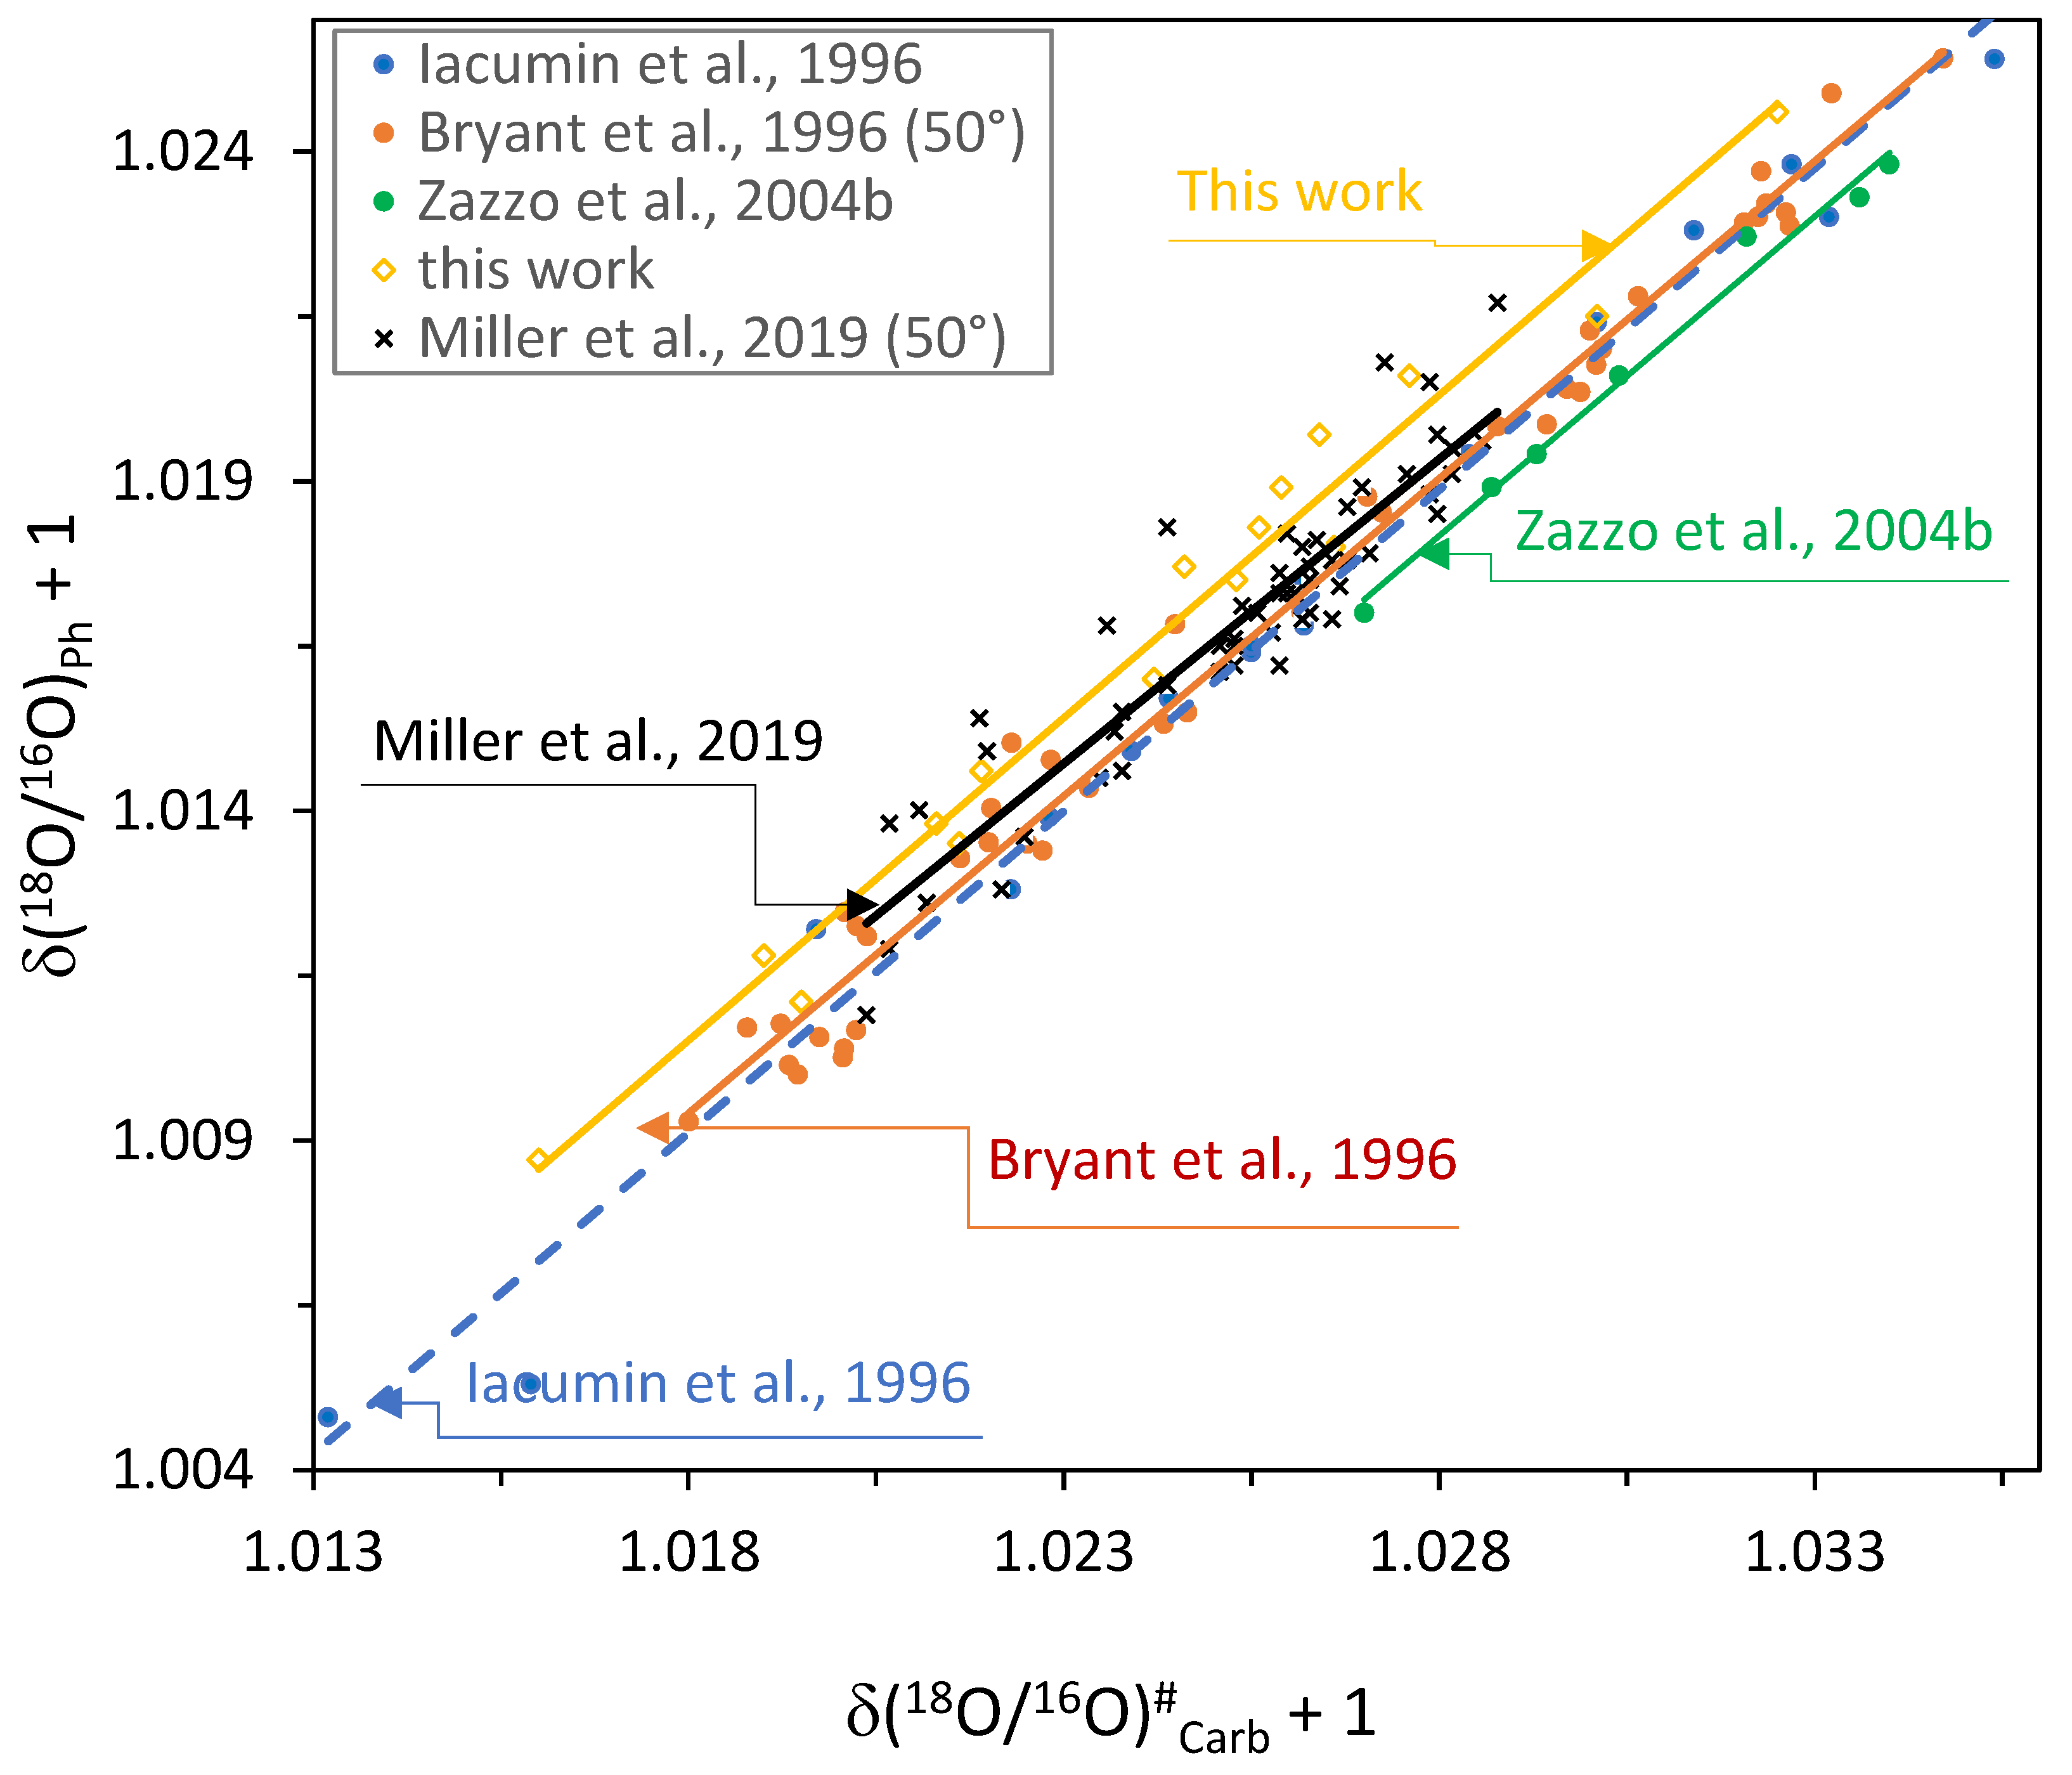
4.2.3. The Regression Lines
For the oxygen isotopes present in phosphate and carbonate of bioapatite, the apparent equilibrium isotope fractionation factor between phosphate and carbonate at a defined temperature is expressed as:
from which we obtain:
Consider the linear equation:
The regression line obtained using the experimental data allows us to verify immediately the agreement of our data with Equation (5) if the obtained regression line has an intercept a not significantly different from zero ( exhibits a very high value). The b value is an estimate of and the uncertainty on is given by the standard error on the slope b. In case the intercept a is significantly different from zero, dividing by , Equation (6b) becomes = + b. The ratio / is not independent of the carbonate delta value, that disagrees with the Equation (5): the ratio is not a correct estimate of . Usually, in the literature, the relationship between and is expressed as linear function = . Using this function, however, we cannot immediately evaluate the independence of / from . Therefore, we preferred to use the regression on in place of the regression on commonly used in the literature.
The regression lines for the data obtained by the different authors on modern bioapatite are reported below and in Figure 1, whereas the related statistics are summarised in Table 2. The regression lines are the following (Equations (7)–(10) [,,,], respectively, and Equation (11) (This work)):
The null hypothesis for the intercept, Ho: A = 0, cannot be rejected at α = 0.1 for all the data groups considered. However, for the data from Bryant et al. [], we obtained a low value for p(homoscedasticity) (0.03); moreover, both for the data from Bryant et al. [] and Miller et al. [], for residuals the value p(normal) is low to very low (0.03 and <0.001, respectively). Thus, the hypotheses reported below (such as differences between slopes and elevation of straight lines) are only tentative. Finally, always in the limit of the analytical uncertainty, we obtained ≥ 0.2 (except for []). The high probability for A = 0 is not in contrast with the hypothesis of equilibrium of oxygen isotope in carbonate and phosphate of bioapatite, this, of course, is within the limit of the analytical errors.
Comparison of slopes and elevations for regression Equations (7)–(11) were done according to Zar [] the different lines exhibit high probability for the same slope (psame slope ≅ 0.9), whereas the null hypothesis for the same elevation is rejected (psame elevation << 0.001). Therefore, theoretically, the data would not be pooled altogether for obtaining a common regression line.
4.2.4. The Role of Different Species and of Tooth (Enamel)/Bone Bioapatite on the Regressions
In the regressions reported in Section 4.2.3, we pooled the data for different genus/species and for bones and teeth. Now the question is: in the limit of our approach, was it correct? The following points must be taken into account in the discussion: (a) The body temperature of the investigated modern mammals is very similar (approximately in the range 35–39 °C, []). (b) Bioapatite is a mineral, its crystallization is a slow process; thus, as commonly occurs for minerals, intra-lattice equilibrium is very probably reached. (c) Material commonly used for isotope determination of modern, recent (Holocene) and fossil mammals is enamel and bone bioapatite. Enamel bioapatite and bone bioapatite have similar crystal lattice and chemical composition; only crystal size and content of organic matter are significantly different. Thus, for a given temperature, teeth and bones are expected to behave similarly as far as the oxygen isotope fractionation between carbonate and phosphate is concerned.
Before comparing genus/species and bones and teeth, we note, that the standard error of the regression, s(yx), for the regression lines (7)–(11) is up to more than twice the prediction uncertainty for (0.00031–0.00085 against 0.00035). This indicates that the scattering of the data around the regression lines is not only due to analytical uncertainty, but also to other reasons, not excluding a priori genus/species and teeth/bones effect. In this work, however, we are not interested in comparing regressions on teeth and bones and on different genus/species, but only to verify if data from teeth and bones and for different genus/species may be pooled to obtain single regression lines. This was tested using data from Iacumin et al. []. The distribution of data for the different genus are so chaotic that we cannot recognize systematic differences between the different genus. As far as the role of bones and teeth are concerned, the two independent regression lines + 1 on + 1, calculated separately for teeth enamel (t) and bones (b), estimate the same statistical population (p(same regression) = 0.84). Therefore, there is a very high probability that regression lines obtained on teeth and bones do not differ significantly and, thus, the data may be pooled.
4.2.5. Final Considerations
The differences among the regression lines obtained using samples dissolved at the same temperature could be prevalently due to the following reasons:
- (a)
- Different standard materials used for calibration.
- (b)
- Difference in technical procedures.
- (c)
- Although the role of standard materials and procedures would need a separate approach, the effect of materials and procedures on the slope and elevation cannot be identified separately. As far as phosphate is concerned, there is no unequivocal answer because different authors frequently used different techniques and did not use international standards, or they did not always indicate the international standards to which the in-house standards used were referred. For instance, Iacumin et al. [] determined oxygen of carbonate using in-house standards and Bryant et al. [] used in-house standards for both carbonate and phosphate. Miller et al. [] used in-house standards for determining the oxygen isotope ratio in precipitated Ag3PO4. (b) For phosphate, this point has been approached and discussed by several authors (e.g.,: [,] and references therein) to which we address the attention of the reader. For carbonate, point (b) has been briefly discussed above (Section 2 and Section 3.3.1).
4.3. Identification of Potential Diagenetic Processes
If diagenetic processes affect bioapatite, two different types of deviations from the on regression line (11) should occur: (a) increase in scattering around the line, (b) systematic deviation from the line. Thus, the comparison of new values with our regression line (11) allows us to recognise samples that possibly underwent diagenesis. This may give support to other mineralogical, spectroscopic, and geochemical methods used to identify diagenetic transformation. The new value, of course, must be obtained using the same standard and the same procedure as this paper.
In addition to the mineralogical and structural investigation, we propose a very simple way for the selection of samples with potential diagenetic transformation affecting bone or tooth remains of animals which lived in the past. Assume that for a new sample i we obtained the experimental value = and = and that, for simplicity, these are not affected by uncertainty. Moreover, is the value estimated from the experimental using the regression line (11) and = 0.00064 is the standard error of the regression (11) (Table 2). Consider the value , where = 2.145 is the Student’s t value (two-tailed) for significance level = 0.05, = 16 = numbers of couples of data used for regression (11), and = n − 2 = 14. Moreover, according to Taylor ([], pp. 188–190), the uncertainty ( = 0.25‰ (Table 2, column “This work”) was added to s(yx). The following values are obtained:
and
Thus:
where is the estimated value. The suspicion of diagenetic transformations could not be rejected for values outside the array defined by ±1.5‰. Figure 2 reports an example referred to Holocene mammal bone remains from Sudan. Based on the selection criteria discussed above, some of the samples could be considered as not reliable for archaeological considerations because they fall outside the array ± 1.5‰ on the y axis around the regression line (11). Obviously, the significance level = 0.05 may be changed according to particular needs.
Figure 2.
+ 1 and + 1 for some Holocen mammal bone remains (Bos and Capra) and from Nile area of Sudan (unpublished data). The two points outside the dotted lines are considered not reliable for archaeological reconstruction. Continuous line represents regression line (11); discontinuous lines define the array ± 1.5‰.
It is noteworthy that if oxygen data are not reliable because they are potentially affected by diagenesis, the values obtained for the carbonate of bioapatite must also be regarded with suspicion and not immediately used to do inference on the diet of the individuals. To summarise, regression line (11) has relevance not only for oxygen, but also for carbon isotopes.
5. Conclusions
- (1)
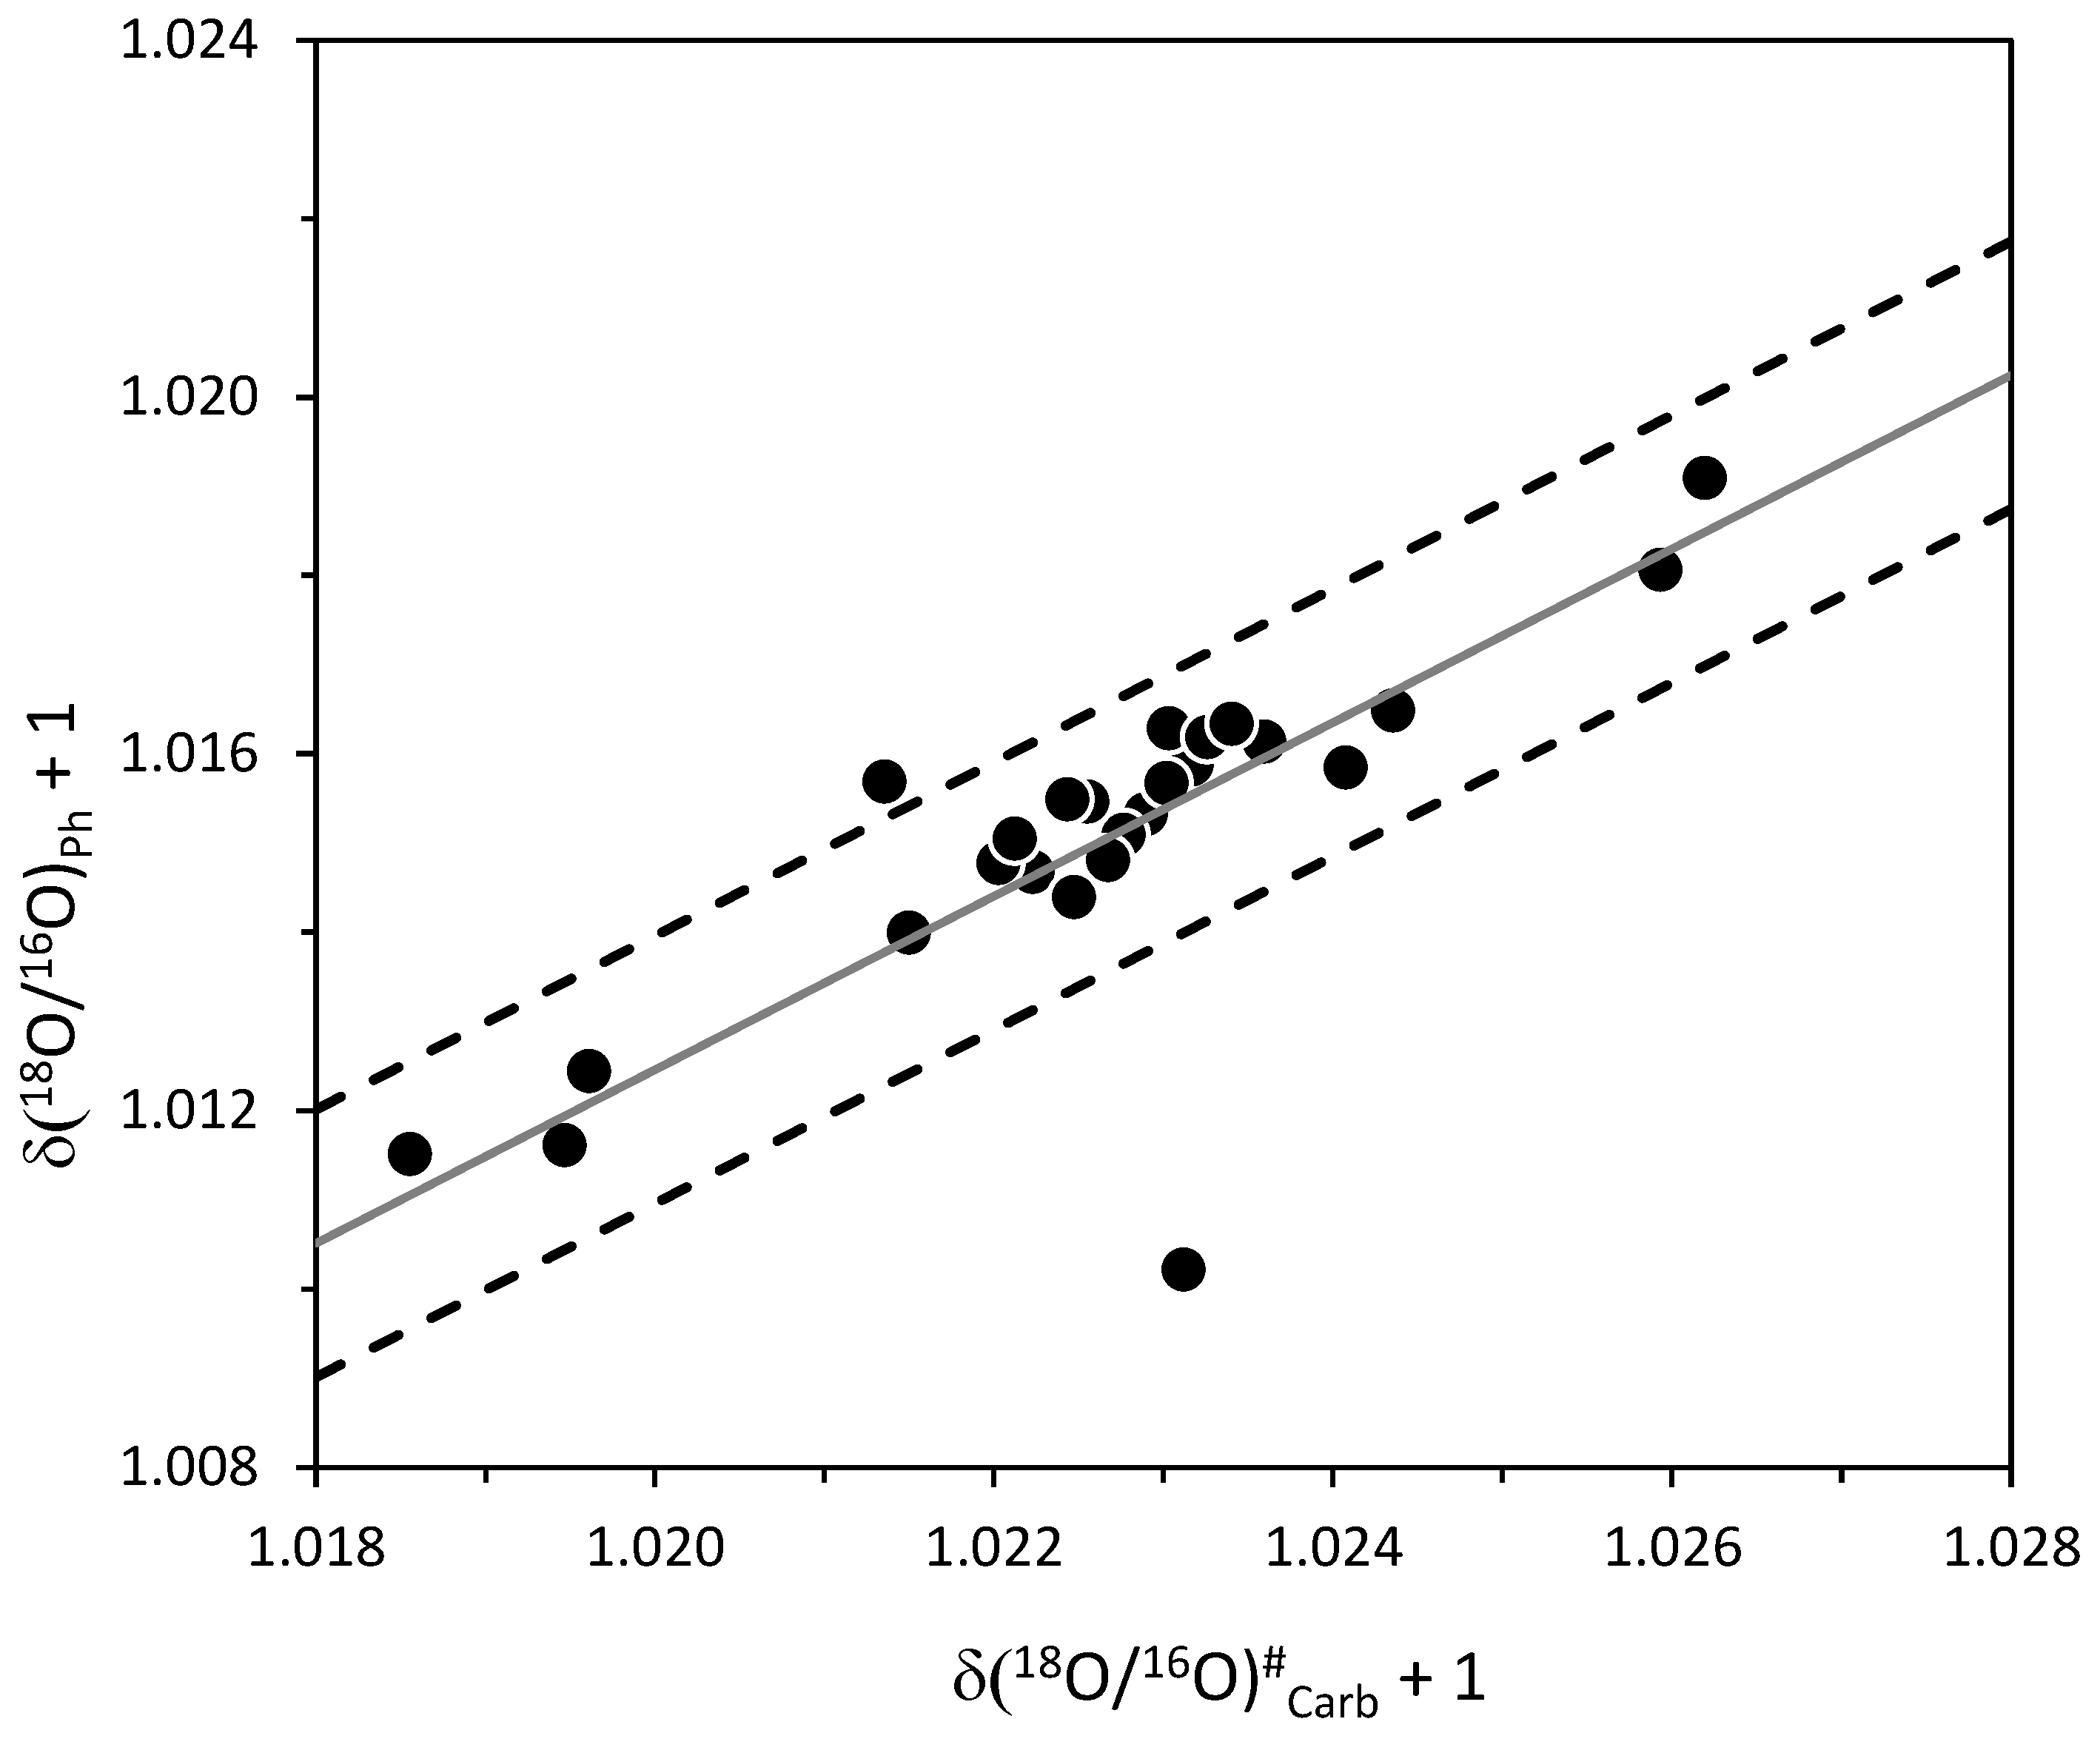
- We compared different on OLS regression lines of data obtained by several authors [,,,] on bioapatite of teeth (enamel) and bones of modern mammals (Ph = , and Carb = of bioapatite). The hypothesis that the slopes of the different regression lines are the same cannot be rejected (psame slope ≅ 0.9); on the contrary, the elevation varies significantly (psame elevation << 0.001). Thus, the data of the different authors considered do not belong to the same statistical population and they cannot be pooled to obtain a total or a common regression line. The new regression line we obtained using the procedure at Section 4.2.3 is the following: = 0.9787 + 0.0142, number of data couples = 16, standard error of regression = 0.00064.
- (2)
- Probably, the systematic difference in the elevation is prevalently due to different methods and standards used in the different laboratories.
- (3)
- The temperature of H3PO4 acid dissolution used for production for spectrometric analyses has some influence on the final isotopic results. Thus, it is better to perform analyses at the same temperature in all laboratories.
- (4)
- The scattering of the data around the values as calculated from the given values using the regression line reported above, is about 0.0015 (1.5‰) at the significance level of 0.05. In addition to other chemical and physical methods, the scattering of the data around the regression line may be used to select isotopic data which are not appropriate for palaeodiet and palaeclimatic reconstruction: values that fall outside the limiting array defined by the estimated values ± 1.5 ‰—where indicates the estimated value for a new sample i must be regarded with suspicion. This, of course, is valid only in the case the scientists use the same standard and analytical procedure as this paper.
Author Contributions
Conceptualization, P.I., M.R. and G.V.; formal analysis, E.S.; investigation, all authors; writing—original draft preparation, P.I., M.R. and G.V.; writing—review and editing, P.I., M.R. and G.V. All authors have read and agreed to the published version of the manuscript.
Funding
This research received no external funding.
Acknowledgments
The authors are grateful to A. Di Matteo for her technical work.
Conflicts of Interest
The authors declare no conflict of interest.
Appendix A
Appendix A.1. General
For a given temperature T, the “oxygen isotope phosphoric acid fractionation factor” for low-Mg calcite and bioapatite, is defined as
and
respectively. and are the isotopic values for of low-Mg calcite and bioapatite, respectively, whereas and are values for the produced by dissolution with at a given temperature T. Unfortunately, for most substances the “oxygen isotope phosphoric acid fractionation factor” is not known (this is the case, for instance, for bioapatite). Thus, usually, Equation (A1) is extended to substances different from low-Mg calcite, i.e., in the case of bioapatite:
where is an “apparent” value.
Appendix A.2. Transformation of Isotopic Value from Temperature T1 to Temperature T2
Consider now Equations (A1) and (A2) at temperature T1 and T2. After simple elaboration, we obtain
From Equation (A4) is evident that it is not possible to transform the value obtained at temperature T1 into value at temperature T2 only knowing the ratio / between the values of “oxygen isotope phosphoric acid fractionation factor” for calcite at temperature T1 and T2; we also need the value of the ratio /.
The dependence of = on temperature may be calculated using the following general equation
for which A = 0 is expected and the value = 1 is expected at T = 298.15 K. On the basis of data reported by Crowley [] for low-Mg calcite the following OLS regression line is obtained:
with T from 298.15 to 373.15 K, number of data = 55, and = 0.79, a high value as expected.
Moreover, on the basis of data reported by Passey [] (samples K98-326-LAI, AMBO-25, K00-AB-303, K00-AS-165, SRM-120, NBS-19), we obtain:
with T from 298.15 to 363.15 K; number of data = 16, = 0.99, a high value as expected.
At the end, the values and are inserted in Equation (A4) to obtain from .
It is noteworthy that comparison between Equations (A6) and (A7) indicates that the two regressions have different slope ( = 0.005). This demonstrates that, at different temperature, bioapatite and low-Mg calcite exhibit different behaviour in acid dissolution.
References
- LeGeros, R.Z. Apatites in biological systems. Prog. Cryst. Growth Charact. 1981, 4, 1–45. [Google Scholar] [CrossRef]
- Elliott, J.C. Calcium phosphate biominerals. Phosphates- Geochemical, geobiological, and materials importance. In Review in Mineralogy & Geochemistry; Mattew, J.K., Rakovan, J., Hughes, J.M., Eds.; Mineral Sociaety of America: Washington, DC, USA, 2002; Volume 48, pp. 427–454. [Google Scholar]
- Gómez-Morales, J.; Iafsco, M.; Delgado-López, J.M.; Sarda, S.; Drouet, C. Progress on the preparation of nanocrystalline apatites and surface characterization: Overview of fundamental and applied aspects. Prog. Cryst. Growth Charact. Mater 2013, 59, 1–46. [Google Scholar] [CrossRef]
- Del Sasso, G.; Asscher, Y.; Angelini, I.; Nodari, L.; Artioli, G. A universal curve of apatite crystallinity for the assessment of bone integrity and preservation. Sci. Rep. 2018, 8, 12025–12038. [Google Scholar] [CrossRef] [PubMed]
- Vogel, J.C.; van der Merwe, N.J. Isotopic evidence for early maize cultivation in New York state. Am. Antiq. 1977, 42, 238–242. [Google Scholar] [CrossRef]
- Ambrose, S.H.; Norr, L. Experimental evidence for the relationship of the carbon isotope ratio of whole diet and dietary protein to those of bone collagen and carbonate. In Prehistoric Human Bone; Lambert, J.B., Groupe, G., Eds.; Springer: New York, NY, USA, 1993; pp. 1–37. [Google Scholar]
- Iacumin, P.; Galli, E.; Cavalli, F.; Cecere, L. C4-consumers in Southern Europe: The case of Friuli, V.G. (NE-Italy) during early and middle Middle Ages. Am. J. Phys. Anthropol. 2014, 154, 561–574. [Google Scholar] [CrossRef] [PubMed]
- D’Angela, D.; Longinelli, A. Oxygen isotopes in living mammal’s bone phosphate: Further results. Chem. Geol. Isot. Geosci. Sect. 1990, 86, 75–82. [Google Scholar] [CrossRef]
- Pietsch, S.J.; Tütken, T. Oxygen isotope composition of North American bobcat (Lynx rufus) and puma (Puma concolor) bone phosphate: Implications for provenance and climate reconstruction. Isot. Environ. Health Stud. 2015. [Google Scholar] [CrossRef]
- Iacumin, P.; Di Matteo, A.; Usai, D.; Salvatori, S.; Venturelli, G. Stable isotope study on ancient population of Central Sudan: Insights on their diet and environment. Am. J. Phys. Antropol. 2016, 160, 498–518. [Google Scholar] [CrossRef]
- Guede, I.; Ortega, L.A.; Zuluaga, M.C.; Alonso-Olazabal, A.; Murelaga, X.; Pina, M.; Gutierrez, F.J.; Iacumin, P. Isotope analyses to explore diet and mobility in a medieval Muslim population at Tauste (NE Spain). PLoS ONE 2017, 12, e0176572. [Google Scholar] [CrossRef]
- Longinelli, A. Oxygen isotopes in mammal bone phosphate: A new tool for paleohydrological and paleoclimatological research? Geochim. Cosmochim. Acta 1984, 48, 385–390. [Google Scholar] [CrossRef]
- Luz, B.; Kolodny, Y.; Horowitz, M. Fractionation of oxygen isotopes beytween mammalian bone phosphate and environmental drinking water. Geochim. Cosmochim. Acta 1984, 48, 1689–1693. [Google Scholar] [CrossRef]
- Luz, B.; Kolodny, Y. Oxygen isotope variation in phosphate of biogenic apatite, IV. Mammal teeth and bones. Earth Planet. Sci. Lett. 1985, 75, 29–36. [Google Scholar] [CrossRef]
- Iacumin, P.; Venturelli, G. The δ18O of phosphate of ancient human biogenic apatite can really be used for quantitative palaeoclimate reconstructions? Eur. Sci. J. 2015, 11, 221–235. [Google Scholar]
- Pucéat, E.; Joachimski, M.M.; Bouilloux, A.; Monna, F.; Bonin, A.; Montreuil, S.; Morinière, P.; Hénard, S.; Mourin, J.; Dera, G. Revised phosphate-water fractionation equation reassessing paleotemperatures derived from biogenic apatite. Earth Planet. Sci. Lett. 2010, 298, 135–142. [Google Scholar] [CrossRef]
- Blake, E.; O’Neil, J.R.; Garcia, G.A. Oxygen isotope systematics of biologically mediated reactions of phosphates: I. Microbial degradation of organophosphorus compounds. Geochim. Cosmochim. Acta 1997, 61, 4411–4422. [Google Scholar] [CrossRef]
- Schoeninger, M.J.; Hallin, K.; Reeser, H.; Valley, J.W.; Fournelle, J. Isotopic alteration of mammalian tooth enamel. Intern. J. Osteoarchaeol. 2003, 13, 11–19. [Google Scholar] [CrossRef]
- Lee-Thorp, J.A. On isotopes and old bones. Archaeometry 2008, 50, 925–950. [Google Scholar] [CrossRef]
- Bryant, J.D.; Koch, P.L.; Froelich, P.N.; Showers, W.J.; Genna, B.J. Oxygen isotope partitioning between phosphate and carbonate in mammalia apatite. Geochim. Cosmochim. Acta 1996, 60, 5145–5148. [Google Scholar] [CrossRef]
- Iacumin, P.; Bocherens, H.; Mariotti, A.; Longinelli, A. Oxygen isotope analysis of co-existing carbonate and phosphate in biogenic apatite: A way to monitor diagenetic alteration of bone phosphate? Earth Planet Sci. Lett. 1996, 142, 1–6. [Google Scholar] [CrossRef]
- Stumm, W.; Morgan, J.J. Aquatic Chemistry: Chemical Equilibria and Rates in Natural Waters, 3rd ed.; Wiley & Sons: New York, NY, USA, 1996. [Google Scholar]
- Winter, E.R.S.; Carlton, M.; Briscoe, H.V.A. The interchange of heavy oxygen between water and inorganic oxy-anions. J. Chem. Soc. 1940, 131–138. [Google Scholar] [CrossRef]
- Kolodny, Y.; Luz, B.; Navon, O. Oxygen isotope variations in phosphate of biogenic apatite. I. Fish bone apatite—Rechecking the rules of the game. Earth Planet. Sci. Lett. 1996, 64, 398–404. [Google Scholar] [CrossRef]
- Zazzo, A.; Lécuyer, C.; Mariotti, A. Experimentally-controlled carbon and oxygen isotope exchange between bioapatite and water under inorganic and microbially-mediated conditions. Geochim. Comochim. Acta 2004, 68, 1–12. [Google Scholar] [CrossRef]
- O’Neil, J.R.; Roe, L.J.; Reinhard, E.; Blake, R.E. A rapid and precise method of oxygen isotope analysis of biogenic phosphate. Isr. J. Earth Sci. 1994, 43, 203–212. [Google Scholar]
- Vennemann, T.W.; Fricke, H.C.; Blake, R.E.; O’Neil, J.R.; Colmann, A. Oxygen isotope analysis of phosphates: A comparison of techniques for analysis of Ag3PO4. Chem. Geol. 2002, 185, 321–336. [Google Scholar] [CrossRef]
- McCrea, J.M. On the isotopic chemistry of carbonate and paleotemperature scale. J. Chem. Phys. 1950, 18, 849–857. [Google Scholar] [CrossRef]
- Keisch, B.; Kennedy, J.W.; Wahl, A.C. The exchange of oxygen between phosphoric acid and water. J. Chem. Soc. 1958, 80, 4778–4782. [Google Scholar] [CrossRef]
- Jameson, R.F. The composition of “strong” phosphoric acids. J. Chem. Soc., Part 1 1959, 1, 752–759. [Google Scholar] [CrossRef]
- Sarma, T.; Clayton, R.N. Measurement of 18O/16O ratios of total oxygen of carbonates. Geochim. Cosmochim. Acta 1965, 29, 1347–1353. [Google Scholar] [CrossRef]
- Wachter, E.A.; Hayes, J.M. Exchange of oxygen isotopes in carbon dioxide-phosphoric acid system. Chem. Geol. 1985, 52, 365–374. [Google Scholar]
- Swart, P.K.; Burns, S.J.; Leder, J.J. Fractionation of stable isotopes of oxygen and carbon in carbon dioxide during the reaction of calcite in acid as a function of temperature and technique. Chem. Geol. 1991, 86, 89–96. [Google Scholar] [CrossRef]
- Boettcher, M.E. 18O/16O and 13C/12C fractionation during the reaction of carbonates with phosphoric acid: Effect of cation substitution and reaction temperature. Isot. Environ. Health Stud. 1996, 32, 299–305. [Google Scholar] [CrossRef] [PubMed]
- Koch, P.L.; Tuross, N.; Fogel, M.L. The Effects of Sample Treatment and Diagenesis on the Isotopic Integrity of Carbonate in Biogenic Hydroxylapatite. J. Archaeol. Sci. 1997, 24, 417–429. [Google Scholar] [CrossRef]
- Garvie-Lok, S.J.; Varney, T.L.; Katzenberg, M.A. Preparation of bone carbonate for stable isotope analysis: The effect of treatment time and acid concentration. J. Archaeol. Sci. 2004, 31, 761–776. [Google Scholar] [CrossRef]
- Kim, S.-T.; Mucci, A.; Taylor, B.E. Phosphoric acid fractionation for calcite and aragonite between 25 and 75 °C: Revisited. Chem. Geol. 2007, 246, 135–146. [Google Scholar] [CrossRef]
- Wendeberg, M.; Richter, J.M.; Rothe, M.; Brand, W. δ18O anchoring to VPDB: Calcite digestion with 18O-adjusted ortho-phosphoric acid. Rapid Comm. Mass Spectrom. 2011, 25, 851–860. [Google Scholar] [CrossRef]
- Pellegrini, M.; Snoeck, C. Comparing bioapatite carbonate pre-treatment for isotopic mesurements: Part 2–Impact on carbon and oxygen isotope composition. Chem. Geol. 2016, 420, 88–96. [Google Scholar] [CrossRef]
- Passey, B.H.; Cerling, T.E.; Levin, N.E. Temperature dependence of oxygen isotope acid fractionation for modern and fossil tooth enamels. Rapid Comm. Mass Spectrom. 2007, 21, 2853–2859. [Google Scholar] [CrossRef]
- Wiedemann-Bidlack, F.B.; Colman, A.S.; Fogel, M.L. Phosphate oxygen isotope analysis on microsamples of bioapatite: Removal of organic contamination and minimization of sample size. Rapid Commun. Mass Spectrom. 2008, 22, 1807–1816. [Google Scholar] [CrossRef]
- Pestle, W.J.; Crowley, B.E.; Weirauch, M.T. Quantifying inter-laboratory variability in stable isotope analysis of ancient skeletal remains. PLoS ONE 2014, 9, e102844. [Google Scholar] [CrossRef]
- Crowley, B.E.; Wheatley, P.V. To bleach or not to bleach? Comparing treatment methods for isolating biogenic carbonate. Chem. Geol. 2014, 381, 234–242. [Google Scholar] [CrossRef]
- Snoeck, C.; Pellegrini, M. Comparing bioapatite carbonate pre-treatment for isotopic mesurements: Part 1—Impact on structure and chemical composition. Chem. Geol. 2015, 417, 394–403. [Google Scholar] [CrossRef]
- Demény, A.; Gugora, A.D.; Kesiar, D.; Lécuyer, C.; Fourel, F. Stable isotope analyses of the carbonate component of bones and teeth: The need of method standardization. J. Archaeol. Sci. 2019, 109, 104979. [Google Scholar] [CrossRef]
- Werner, R.A.; Brand, W.A. Referencing strategies and techniques in stable isotope ratio analysis. Rapid Comm. Mass Spectrom. 2001, 15, 501–519. [Google Scholar] [CrossRef] [PubMed]
- Gonfiantini, R.; Stichler, K.; Rozanski, K. Standards and intercomparison materials distributed by the International Atomic Energy Agency for stable isotope measurements. In References and intercomparison materials for stable isotopes of light elements. In Proceedings of the consultants meeting IAEA-TECDOC-825, Vienna, Austria, 1–3 December 1993. [Google Scholar]
- Halas, S.; Skrzypec, G.; Meier-Augenstein, W.; Pelc, A.; Kemp, H.F. Inter-laboratory calibration of new silver orthophosphate comparison materials for the stable oxygen isotope analysis of phosphates. Rapid Comm. Mass Spectrom. 2010, 25, 579–584. [Google Scholar] [CrossRef] [PubMed]
- Watzinger, A.; Schott, K.; Hood-Nowotny, R.; Tamburini, F.; Arppe, L.; Cristini, D.; Knöller, K.; Skrzypek, G. New Ag3PO4 comparison material for stable oxygen isotope analysis. Rapid. Comm.Mass. Spectrom. 2021, 35, e9101. [Google Scholar] [CrossRef]
- Stephan, E. Oxygen isotope analysis of animal bone phosphate: Method refinement, influence of consolidants, and reconstruction of palaeotemperatures for Holocene sites. J. Archaeol. Sci. 2000, 27, 523–535. [Google Scholar] [CrossRef]
- Brand, W.; Coplen, T.B.; Aerts-Bijma, A.T.; Boelke, J.K.; Gehre, M.; Grilmann, H.; Groening, M.; Jsansen, H.G.; Meijr, H.A.J.; Mroczkowski, S.J.; et al. Comprehensive inter-laboratory calibration of reference materials for δ18O versus VSMOW using various on-line high-temperature techniques. Rapid Comm. Mass Spectrom. 2009, 23, 999–1019. [Google Scholar] [CrossRef]
- Kornexl, B.E.; Werner, R.E.; Gehre, M. Standardization for oxygen isotope ratio measurement—Still an unsolved problem. Rapid Comm. Mass. Spectrom. 1999, 13, 1248–1251. [Google Scholar] [CrossRef]
- Fourel, F.; Martineau, F.; Lecuyer, C.; Kupta, H.-J.; Lange, L.; Ojeimi, C.; Seed, M. 18O/16O ratio measurements of inorganic and organic materials by elemental analysis-pyrolysis-isotope ratio mass spectrometry continuous-flow techniques. Rapid Commun. Mass Spectrom. 2011, 25, 2691–2696. [Google Scholar] [CrossRef]
- Snedecor, G.W.; Cochran, W.G. Statistical Methods; Iowa State University Press: Ames, IA, USA, 1968. [Google Scholar]
- Taylor, J.R. An Introduction to Error Analysis, 2nd ed.; Univ Sci. Books: Sausalito, CA, USA, 1997. [Google Scholar]
- Zazzo, A.; Lécuyer, C.; Sheppard, S.M.F.; Grandjean, P.; Mariotti, A. Diagenesis and reconstruction of paleoenvironments: A method to restore original δ18O values of carbonate and phosphate from fossil tooth enamel. Geochim. Cosmochim. Acta 2004, 68, 2245–2258. [Google Scholar] [CrossRef]
- Miller, H.; Chenery, C.; Lamb, A.L.; Sloane, H.; Carden, R.F.; Atici, L.; Sykes, N. The relationship between the phosphate and structural carbonate fractionation of fallow deer bioapatite in tooth enamel. Rapid Comm. Mass Spectrom. 2019, 33, 151–164. [Google Scholar] [CrossRef] [PubMed]
- Zar, J.H. Biostatistical Analysis, 5th ed.; Pearson Prentice Hall: London, UK, 2010. [Google Scholar]
- Ivanov, K. The development of the concepts of homeothermy and thermoregulation. J. Therm. Biol. 2006, 31, 24–29. [Google Scholar] [CrossRef]
- Chenery, C.A.; Pashley, V.; Lamb, A.L.; Sloane, H.J.; Evans, J.A. The oxygen isotope relationship between the phosphate and structural carbonate fractions of human bioapatite. Rapid Commun. Mass Spectrom. 2012, 26, 309–319. [Google Scholar] [CrossRef] [PubMed]
- Crowley, S.F. Effect of temperature on the oxygen isotope composition for carbon dioxide (δCO218O) prepared from carbonate minerals by reaction with phosphoric acid: An example of the rhombohedral CaCO3- MgCO3 group minerals. Geochim. Cosmochim. Acta 2011, 74, 6406–6421. [Google Scholar] [CrossRef]
Publisher’s Note: MDPI stays neutral with regard to jurisdictional claims in published maps and institutional affiliations. |
© 2022 by the authors. Licensee MDPI, Basel, Switzerland. This article is an open access article distributed under the terms and conditions of the Creative Commons Attribution (CC BY) license (https://creativecommons.org/licenses/by/4.0/).