Article

Microstructural Characteristics of Graphite Microcrystals in Graphitized Coal: Insights from Petrology, Mineralogy and Spectroscopy

1
School of Resources and Geoscience, China University of Mining and Technology, Xuzhou 221008, China
2
Key Laboratory of Coalbed Methane Resources and Reservoir Formation Process, Ministry of Education, China University of Mining and Technology, Xuzhou 221008, China
*
Author to whom correspondence should be addressed.
Minerals 2022, 12(10), 1189; https://doi.org/10.3390/min12101189
Submission received: 31 August 2022 / Revised: 18 September 2022 / Accepted: 19 September 2022 / Published: 22 September 2022
(This article belongs to the Special Issue Graphite Minerals and Graphene)

Abstract

:
Graphite microcrystals are the product of coal graphitization and widely exist in the graphitized coal of Yongan Coalfield, Fujian Province, China, which is direct mineralogical evidence for the transformation of coal to graphite. Optical microscopy, scanning electron microscopy (SEM) and micro-Raman spectroscopy were used to detect the morphology and microstructure of the in situ graphite microcrystals. The results show that the volume proportion of graphite microcrystals in graphitized coal samples is between 2.39% and 7.32%, and the optical anisotropy of graphite microcrystals is stronger than that of coal macerals. Graphite microcrystals show the occurrence of attached microcrack inner walls or infilling the cell cavity, with several forms of flakes, needles or aggregates. Under optical microscopy of polarized light and with a retarder plate of 1λ, graphite microcrystals show the color of primary yellow and secondary blue, and the two kinds of colors appear alternately when the microscope is rotating. Additionally, flake-like graphite microcrystals with an isochromatic zone diameter of 10−50 μm are the most widely distributed in graphitized coal. Under SEM, graphite microcrystals show a rough and irregular edge and are characterized by flow or bubble film structures along with several pores, which is the product of cooling crystallization after the softening and melting of carbon-containing substances. Moreover, flake-like graphite microcrystals developed interlayer pores with a clear outline of loose stacking and were almost entirely composed of pure carbon; a small amount of oxygen is related to oxygen-containing functional groups or structural defects. The micro-Raman spectra of graphite microcrystals in the first-order region are characterized by low-intensity D1 and D2 bands and a high-intensity G band, and the parameters R1 and R2 vary from 0.21–0.39 and 0.60–0.74, respectively. The second-order micro-Raman spectra of graphite microcrystals are characterized by a higher intensity of the 2D1 band and a lower intensity of the other three bands. The parameter R3, derived from the area ratio of the 2D1 band to all the bands in the second-order region, was proposed. The value of R3 ranges between 0.78 and 0.86, and both of them indicate a higher percentage of graphene plane with a highly internal crystallographic structure. Similar to the parameters R1 and R2 in the first-order micro-Raman spectrum, the parameter R3 is an effective parameter to characterize the ordering degree of the microstructure, which may be used to evaluate the graphitization degree of graphitization coal.

1. Introduction

Irreversible changes in coal microstructure and chemical structure caused by magma intrusion into coal measure strata have been widely reported [1,2,3,4]. The metamorphism of coal increased under magmatic intrusion and tectonic compression, forming anthracite, meta-anthracite, semi-graphite and coaly graphite [5]. Graphitized coal formed in the natural graphitization process of coal with certain amounts of graphite microcrystals with a clear outline, strong optical anisotropy, diverse occurrences and different morphologies [6,7], which is also named coaly graphite [8], coal-based graphite [9] or thermally altered coals [10]. The metamorphic degree of graphitized coal is between anthracite and graphite, which is the product of late coalification or graphitization from the precursor of coal. Limited by understanding its structure and properties, approximately half of graphitized coal is erroneously assumed to be normal coal burned as fuel, resulting in a significant waste of resources [8]. The higher carbon content and ordered structure of graphitized coal make it an obvious advantage in the preparation of new carbon materials, such as ideal raw materials for preparing graphene as an anode and isotropic graphite filler-particles for lithium-ion batteries [11,12]. The rational development of graphitized coal resources is an effective way to realize high value-added utilization from coal to carbon and fuel to raw materials.
According to their reactivity, the macerals in coal are divided into active macerals, which include liptinite and vitrinite and one-third of semi-inert macerals, and inert content, which includes inertinite macerals and two-thirds of semi-inert macerals as well as mineral matter [13]. Due to the complexity of coal composition and the reactivity of different macerals to temperature and pressure, the graphitization degree of different macerals varies under the same temperature and pressure [3]. The natural graphitization process of coal is accompanied by the differential evolution of macerals; compared with vitrinite, the evolution of liptinite occurs earlier, while the evolution of inertinite has an obvious hysteresis effect, with an overall trend of the transition from organic macerals to inorganic mineral graphite [7,14]. The microstructure is characterized by the formation of a series of newly formed macerals, and the account varies with the degree of coal metamorphism [15]. Under the observation of optical microscopy, Stach et al. summarized the newly formed constituents after magma intrusion into coal seams into four categories: tar, bituminous solid, small spheres and pyrolytic carbon [16]. Qin and Jiang systematically studied the evolution characteristics of the micropetrology of high-rank coals in China and identified several newly generated macerals with inheritance relationships with the original macerals, classifying them into liptinite according to the optical characteristics [17,18]. Li et al. performed a detailed petrographic analysis of graphitized coals from central Hunan, China, and reported newly formed microscopic components, including pyrolytic carbon, needle graphite and flake graphite, in graphitized samples [15]. Needle and flake graphite microcrystals in graphitized coal were also observed in Fujian coal [7]. Recently, flake graphite, crystalline aggregates and matrix graphite in coal-derived natural graphite were described in detail to reveal the transitions from anthracite to natural graphite [5].
Several scholars have focused on bulk graphitized coal samples and have conducted a series of investigations to assess the transition process from anthracite to graphite, such as proximate analysis and ultimate analysis, X-ray diffraction, high-resolution transmission electron microscopy, Fourier transform infrared spectrometry and thermogravimetric analysis [19,20,21,22,23,24,25], which have enhanced the understanding of the macromolecular structure of graphitized coal. Generally, coal is an organic matter dominated by an amorphous carbon structure, graphite belongs to inorganic minerals, σ-bonds and π-bonds make carbon atoms in a hexagonal two-dimensional network and the carbon layers are bound by van der Waals forces [26]. The composition of graphitized coal coexists with organic macerals and inorganic mineral graphite microcrystals, and the optical properties and physicochemical properties of organic macerals have been investigated in a previous study [7,15]; however, few studies can be found in the literature describing the microstructural characteristics of in situ graphite microcrystals in natural graphitized coal, which may provide supplemental information for understanding coal graphitization.
Micro-Raman spectroscopy with a high-efficiency, high-precision and nondestructive nature allows for the analysis of carbonaceous matter, which provides information on the degree of structural ordering and lattice vibrations and is an important and suitable method for studying subtle structural characterization of carbonaceous materials [27], such as graphene, carbon nanotubes (CNTs), carbon black and amorphous carbons such as coal, char and kerogen [27,28,29]. Scanning electron microscopy (SEM) can directly observe the microstructure of materials from the micron to submicron level, and the elemental composition can be detected with energy dispersive X-ray spectrometry (EDS). In the current study, the microplot analysis methods of optical microscopy, SEM and micro-Raman spectroscopy were used to investigate the microstructure of in situ graphite microcrystals in graphitized coal. The purpose is to understand the transformation process of organic carbon (coal) to an inorganic graphite structure from the perspective of petrology, mineralogy and spectroscopy and deepen the knowledge of graphitized coal. The results will benefit the high value-added utilization and application of naturally graphitized coals.

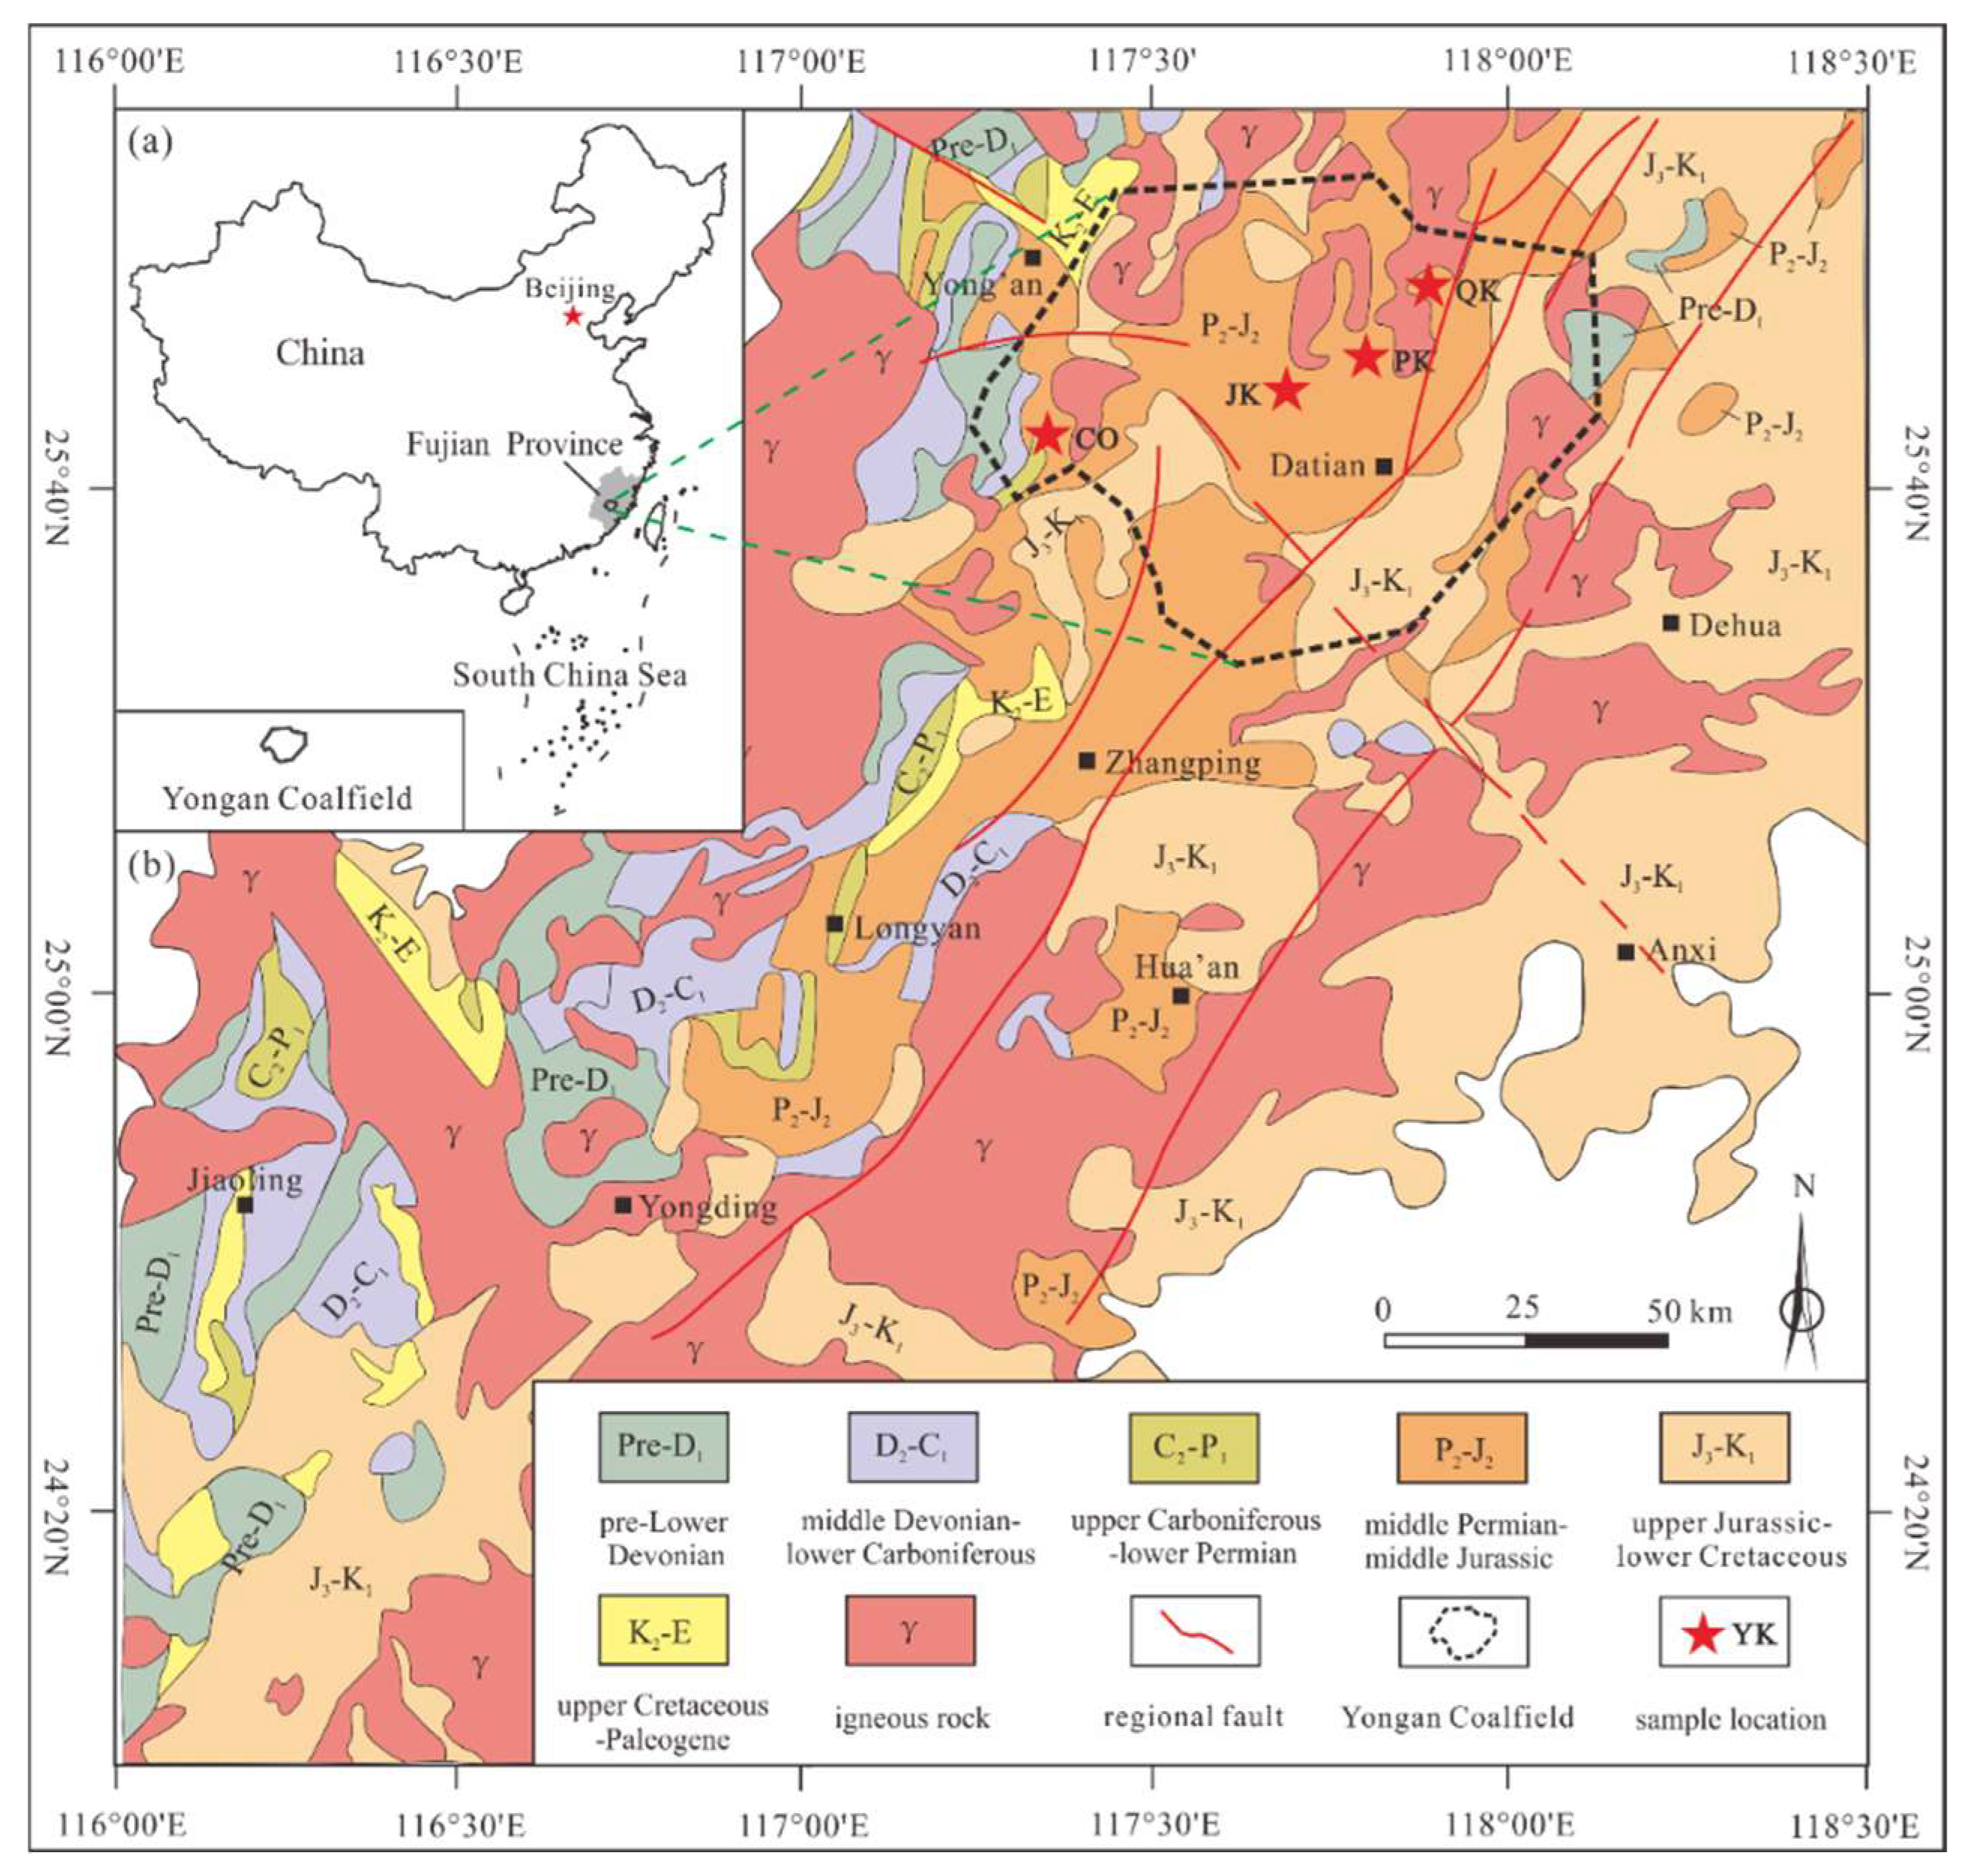
2. Geological Setting

The Yongan Coalfield is located in southwestern Fujian Province, China (Figure 1a), and the coalfield forms an important part of the late Paleozoic Yongan Basin and the late Mesozoic granite belt along the southeastern coast of China [30]. The main coal-bearing strata are in the Middle Permian Tongziyan Formation, which comprises marine deposits of terrigenous origin. The lithology is mainly mudstone and siltstone, followed by fine sandstone with thin coal seams, characterized by a thin single layer of coal and multiple layers at depth [31]. Based on the lithology and sedimentary environment, three lithological subunits from the bottom up are divided [32]. The lower subunit is composed of siltstone, carbonaceous mudstone and a thin coal seam of barrier island to lagoon facies; the middle section, consisting of thick neritic siltstone with siderite nodules, lacks a coal seam; and the upper section comprises thick layers of siltstone interbedded with carbonaceous mudstone and coal seams of marine origin [33].
The multiperiod large-scale tectonic movements of the Yongan Coalfield are controlled by the Zhenghe-Dapu fault in the NE–NNE direction and the Yongan-Jinjiang fault in the NW direction (Figure 1b). Secondary faults in the same direction developed along both sides of the fault zone, and multidirectional and multigroup faults intersect to form a grid structure pattern in the study area [34]. The tectonic movements with strong intensity induced a series of structural deformations with different scales, especially extensional and compressional gliding nappe structures characterized by multilevel and multistage features [31]. The coal-bearing strata were strongly deformed by compressional stress that caused local thickening or thinning of the coal seams, which provided additional strain energy for coal graphitization [34].
In addition, regional magmatic intrusions during the Indosinian, Yanshanian and Himalayan orogenies associated with tectonic movements are common in the Yongan Coalfield, especially in the Yanshanian period [35], which led to the formation of large quantities of granitoids whose distribution was controlled by NNE-striking faults (Figure 1b). The magmatic intrusions invade coal-bearing strata in the form of dikes or dykes, and the single layer thickness varies from centimeters to meters, showing zonality and directionality and wide exposure in the Yongan Coalfield. Thermal and strong emplacement pressures caused by magmatic intrusion have a great influence on the structure pattern and mineralization of metal deposits [36] and are also the main geological controlling factor for the high degree of coal metamorphism in the Yongan Coalfield.

3. Samples and Analytical Procedures

3.1. Sampling

A total of five graphitized coal samples were collected from the upper section of the Tongziyan Formation at four coal mines in the Yongan Coalfield, of which CO1 and CO3 from the Changao mine, QK, JK and PK form the Qiongkou mine, Jiakui mine and Peikeng mine, respectively. The samples were collected in accordance with the Chinese Standard for Collecting Channel Samples GB/T 482-2008 [37] and stored in polyethylene bags immediately to reduce contamination and oxidation as much as possible. Under the observation of the naked eye, the samples were steel gray, soft, fragile and strongly deformed, with irregular friction mirror surfaces and scaly structures that provided a broken and smooth texture.

3.2. Analytical Methods

3.2.1. Proximate and Ultimate Analyses

Proximate and ultimate analyses were carried out by crushing graphitized coal samples to 80 mesh (~180 μm). Proximate analysis, including moisture content, ash yield and volatile matter, was performed in accordance with Chinese National Standard GB/T 3521-2008 [38], while the ultimate analyses, including C, H, O and N content, were conducted in accordance with Chinese National Standard GB/T 31391-2015 [39].

3.2.2. Optical Microscopy

The petrographic and reflectance analyses of macerals along with graphite microcrystals were performed on particulate pellets with randomly oriented particles using a Leica DM2500P microscope (at a magnification of 500×) with a CRAIC microscope photometer system. The petrographic analysis was conducted under reflected light, polarized light with a gypsum test plate (1λ) and cross-polarized light using a rotating microscope stage. Petrological composition statistics were undertaken using the point counting method with a total of 500 points per sample in accordance with Chinese National Standard GB/T 8899-2013 [40]. The maximum and minimum reflectances of each particle (vitrinite and flake-like graphite microcrystals) were measured under polarized light by rotating the microscope stage through 360° [7]. A minimum of 30 particles were measured for each maceral. The reflectance measurement system was linearly calibrated with standards of known reflectance (sapphire, Ro = 0.589%, gadolinium–gallium–garnet, Ro = 1.725%, cubic zirconia, Ro = 3.08%, strontium titanate, Ro = 5.36%, and silicon carbide, Ro = 7.46%).

3.2.3. Scanning Electron Microscopy

Scanning electron microscopy (SEM; ZEISS SIGMA) equipped with an energy dispersive X-ray spectrometer (EDS, OxfordX-Max20; Oxford Instruments, Abingdon, UK) was used to observe the morphology and determine the elemental distribution of graphite microcrystals. The selected sample briquettes were gold-coated before SEM–EDS analyses. SEM images were captured by a retractable solid-state backscatter electron detector with a 20.0-kV beam voltage, 10-mm working distance and a 5.0-spot size setting.

3.2.4. Raman Spectroscopy

Raman spectroscopy of graphite microcrystals was conducted on polished pellets using a Senterra Laser Raman spectrometer (Bruker, Bremen, Germany) equipped with a Leica microscope under a laser wavelength of 532 nm. A 50 × objective lens was used to focus the excitation laser beam with a diameter of ~2 μm. The power of the laser was set to 5 mW to avoid burning of the carbonaceous materials, and the Raman analysis system was calibrated using a standard silicon wafer. Ten different spots were scanned for each graphite microcrystal in the range of 1000–3400 cm−1, and each spectrum was subjected to peak fitting with Origin 8.5 software (Version Origin 8.5.0, Originlab, Massachusetts, USA) to resolve the curve using a Gaussian-curve-fitting module. The parameters obtained included the peak position, full width at half maximum (FWHM), R1 = AD1/AG (intensity ratio of bands), R2 = AD1/(AD1 + AD2 + AG) (area ratio of bands) and R3 = A2D1/(A2D4 + A2D1 + A(D1 + G) + A2D2) (area ratio of bands), which were used to characterize the structure of graphite microcrystals.

4. Results and Discussions

4.1. Geochemistry Characterization of Graphitized Coal

The geochemical data of graphitized coal samples are shown in Table 1. The organic elemental composition of coal samples shows a carbon content (daf) ranging from 89.25% to 96.88 wt.%, hydrogen content (daf) less than 0.10% in all samples except CO1 (0.94%), nitrogen content (daf) ranging from 0.14 to 0.27% and oxygen content (daf) lower than the detection limit in CO1 and QK, ranging from 2.94% to 5.76% in the other three samples, indicating that the element composition of graphitized coal is mainly carbon. Volatile matter yields (daf) range from 1.55% to 8.79% and are less than 5.0% in most samples, indicating that samples are all high rank with a metamorphic grade commensurate with anthracite or above [41]. The mean maximum reflectance of vitrinite (VRmax) varies from 7.01% to 8.95%; on the basis of VRmax values, the samples are generally coalified at the semi-graphite stage [42].

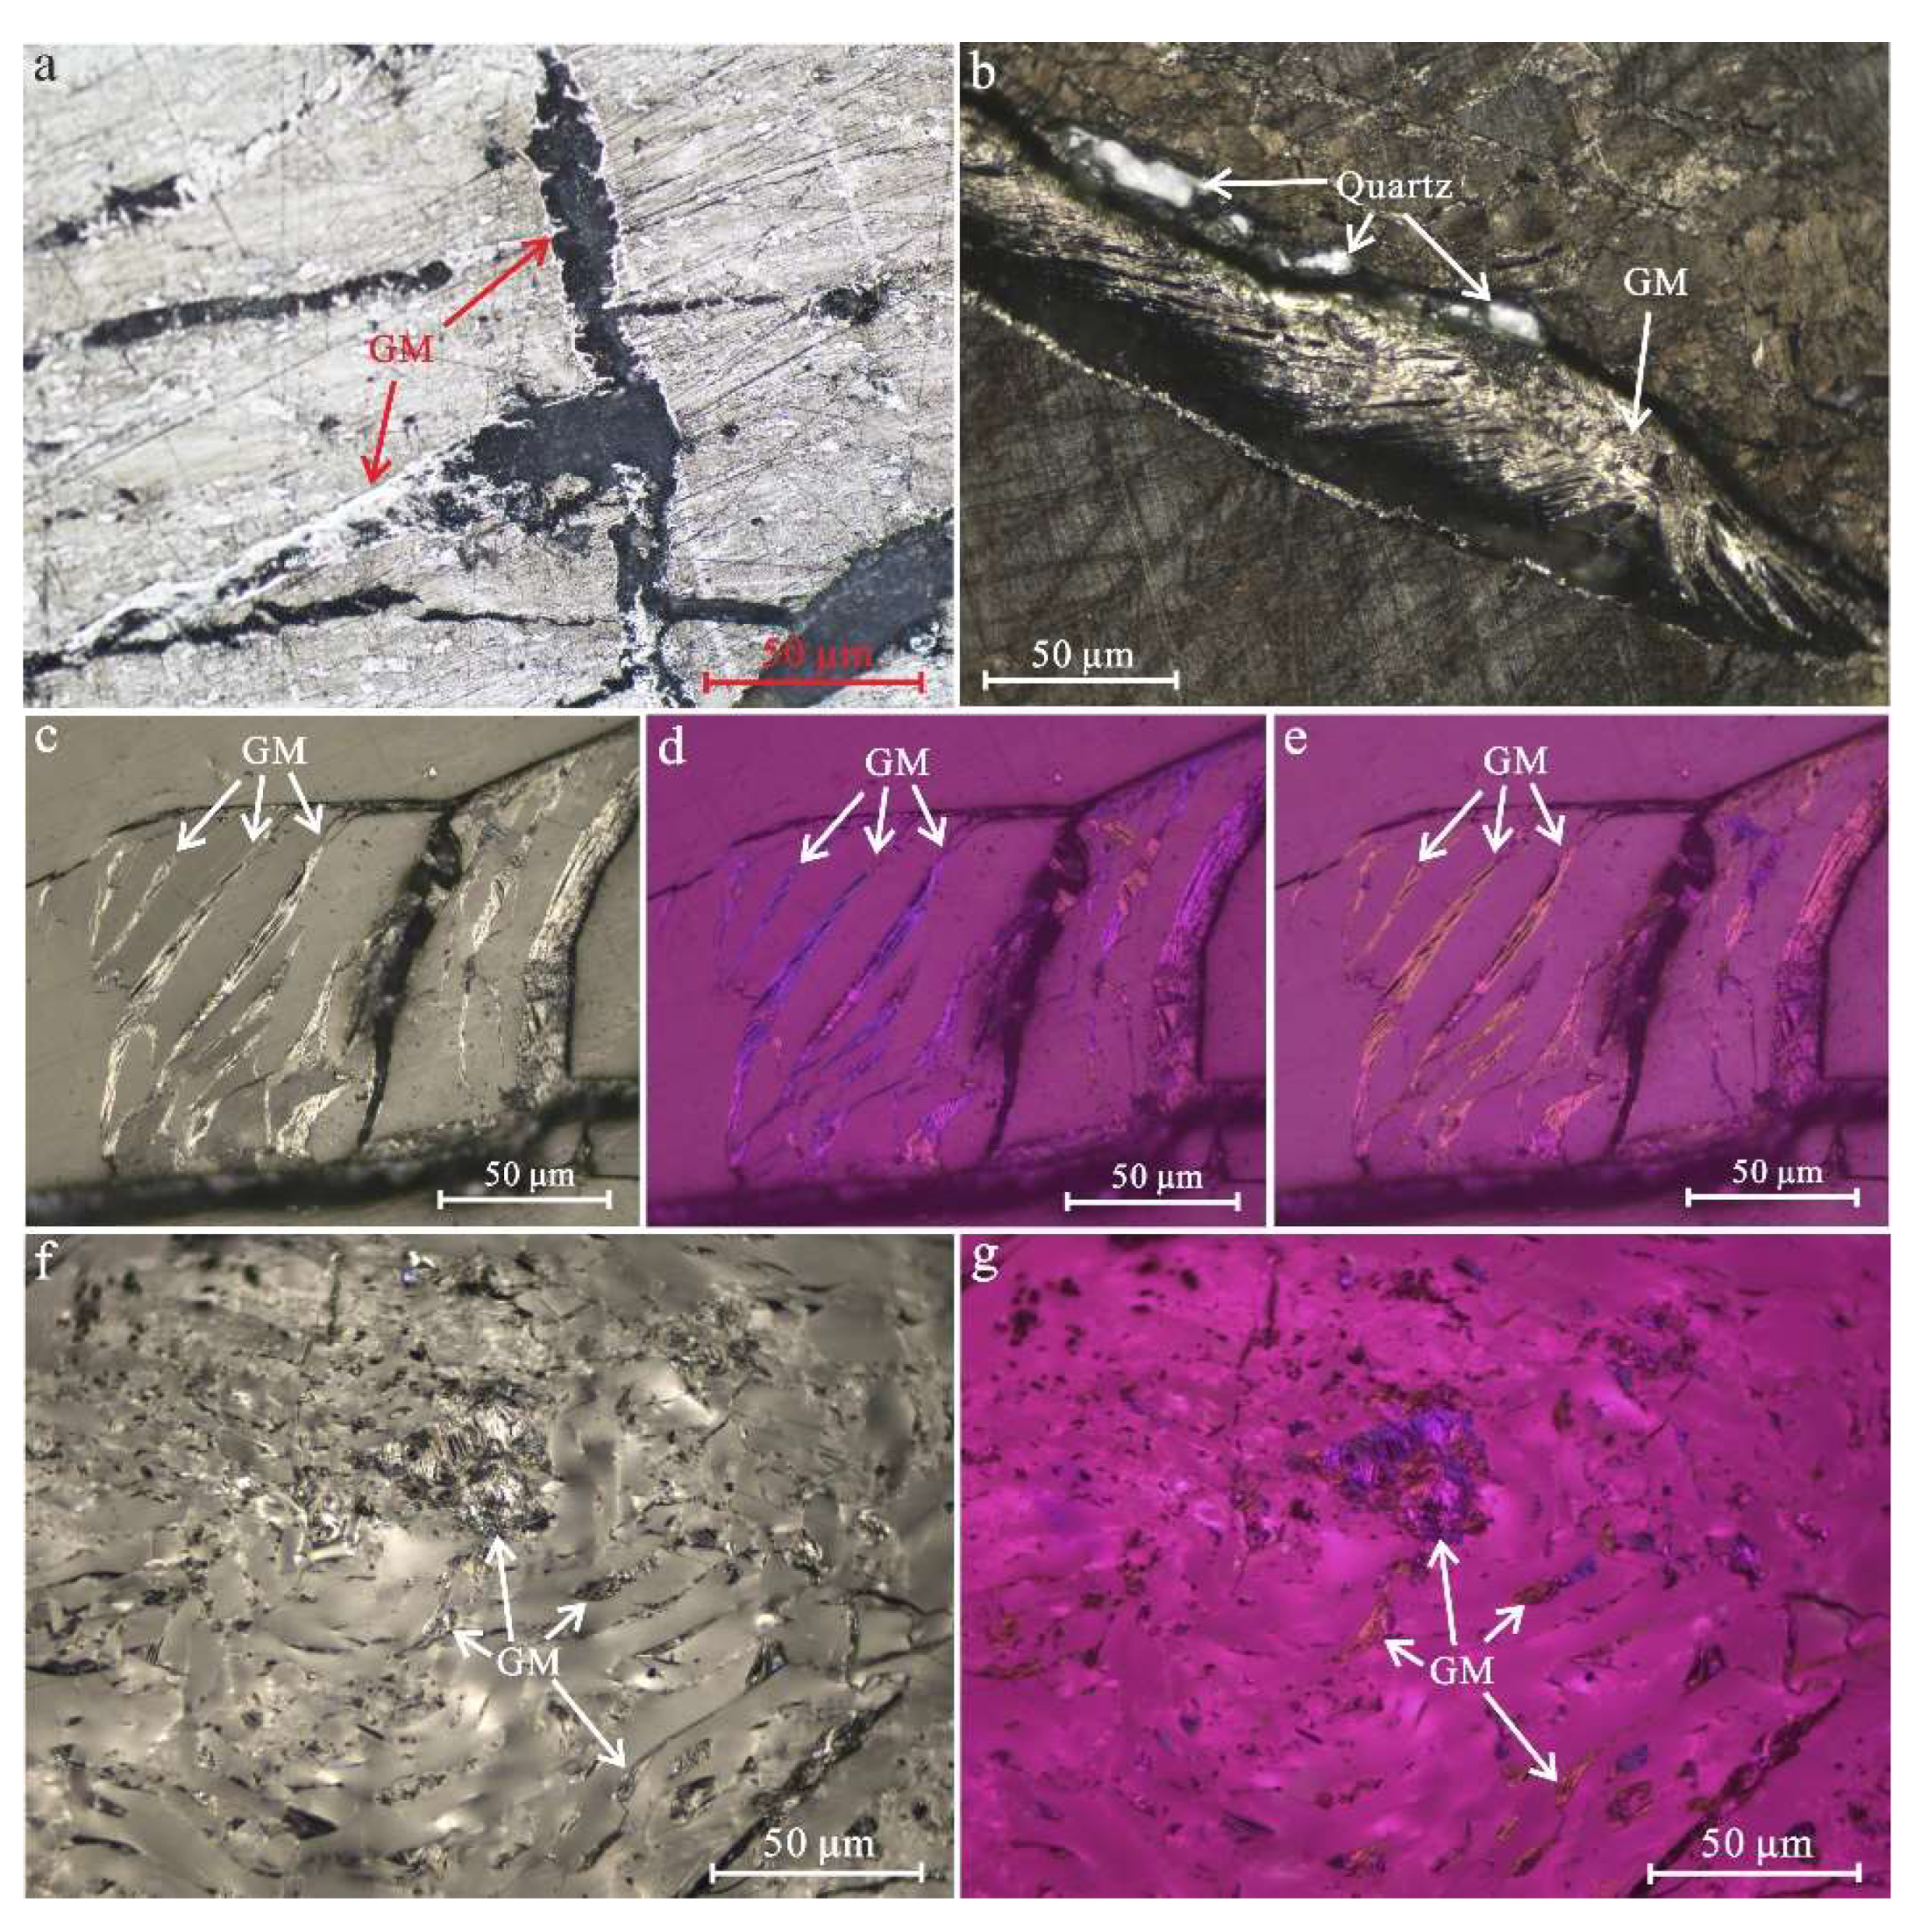
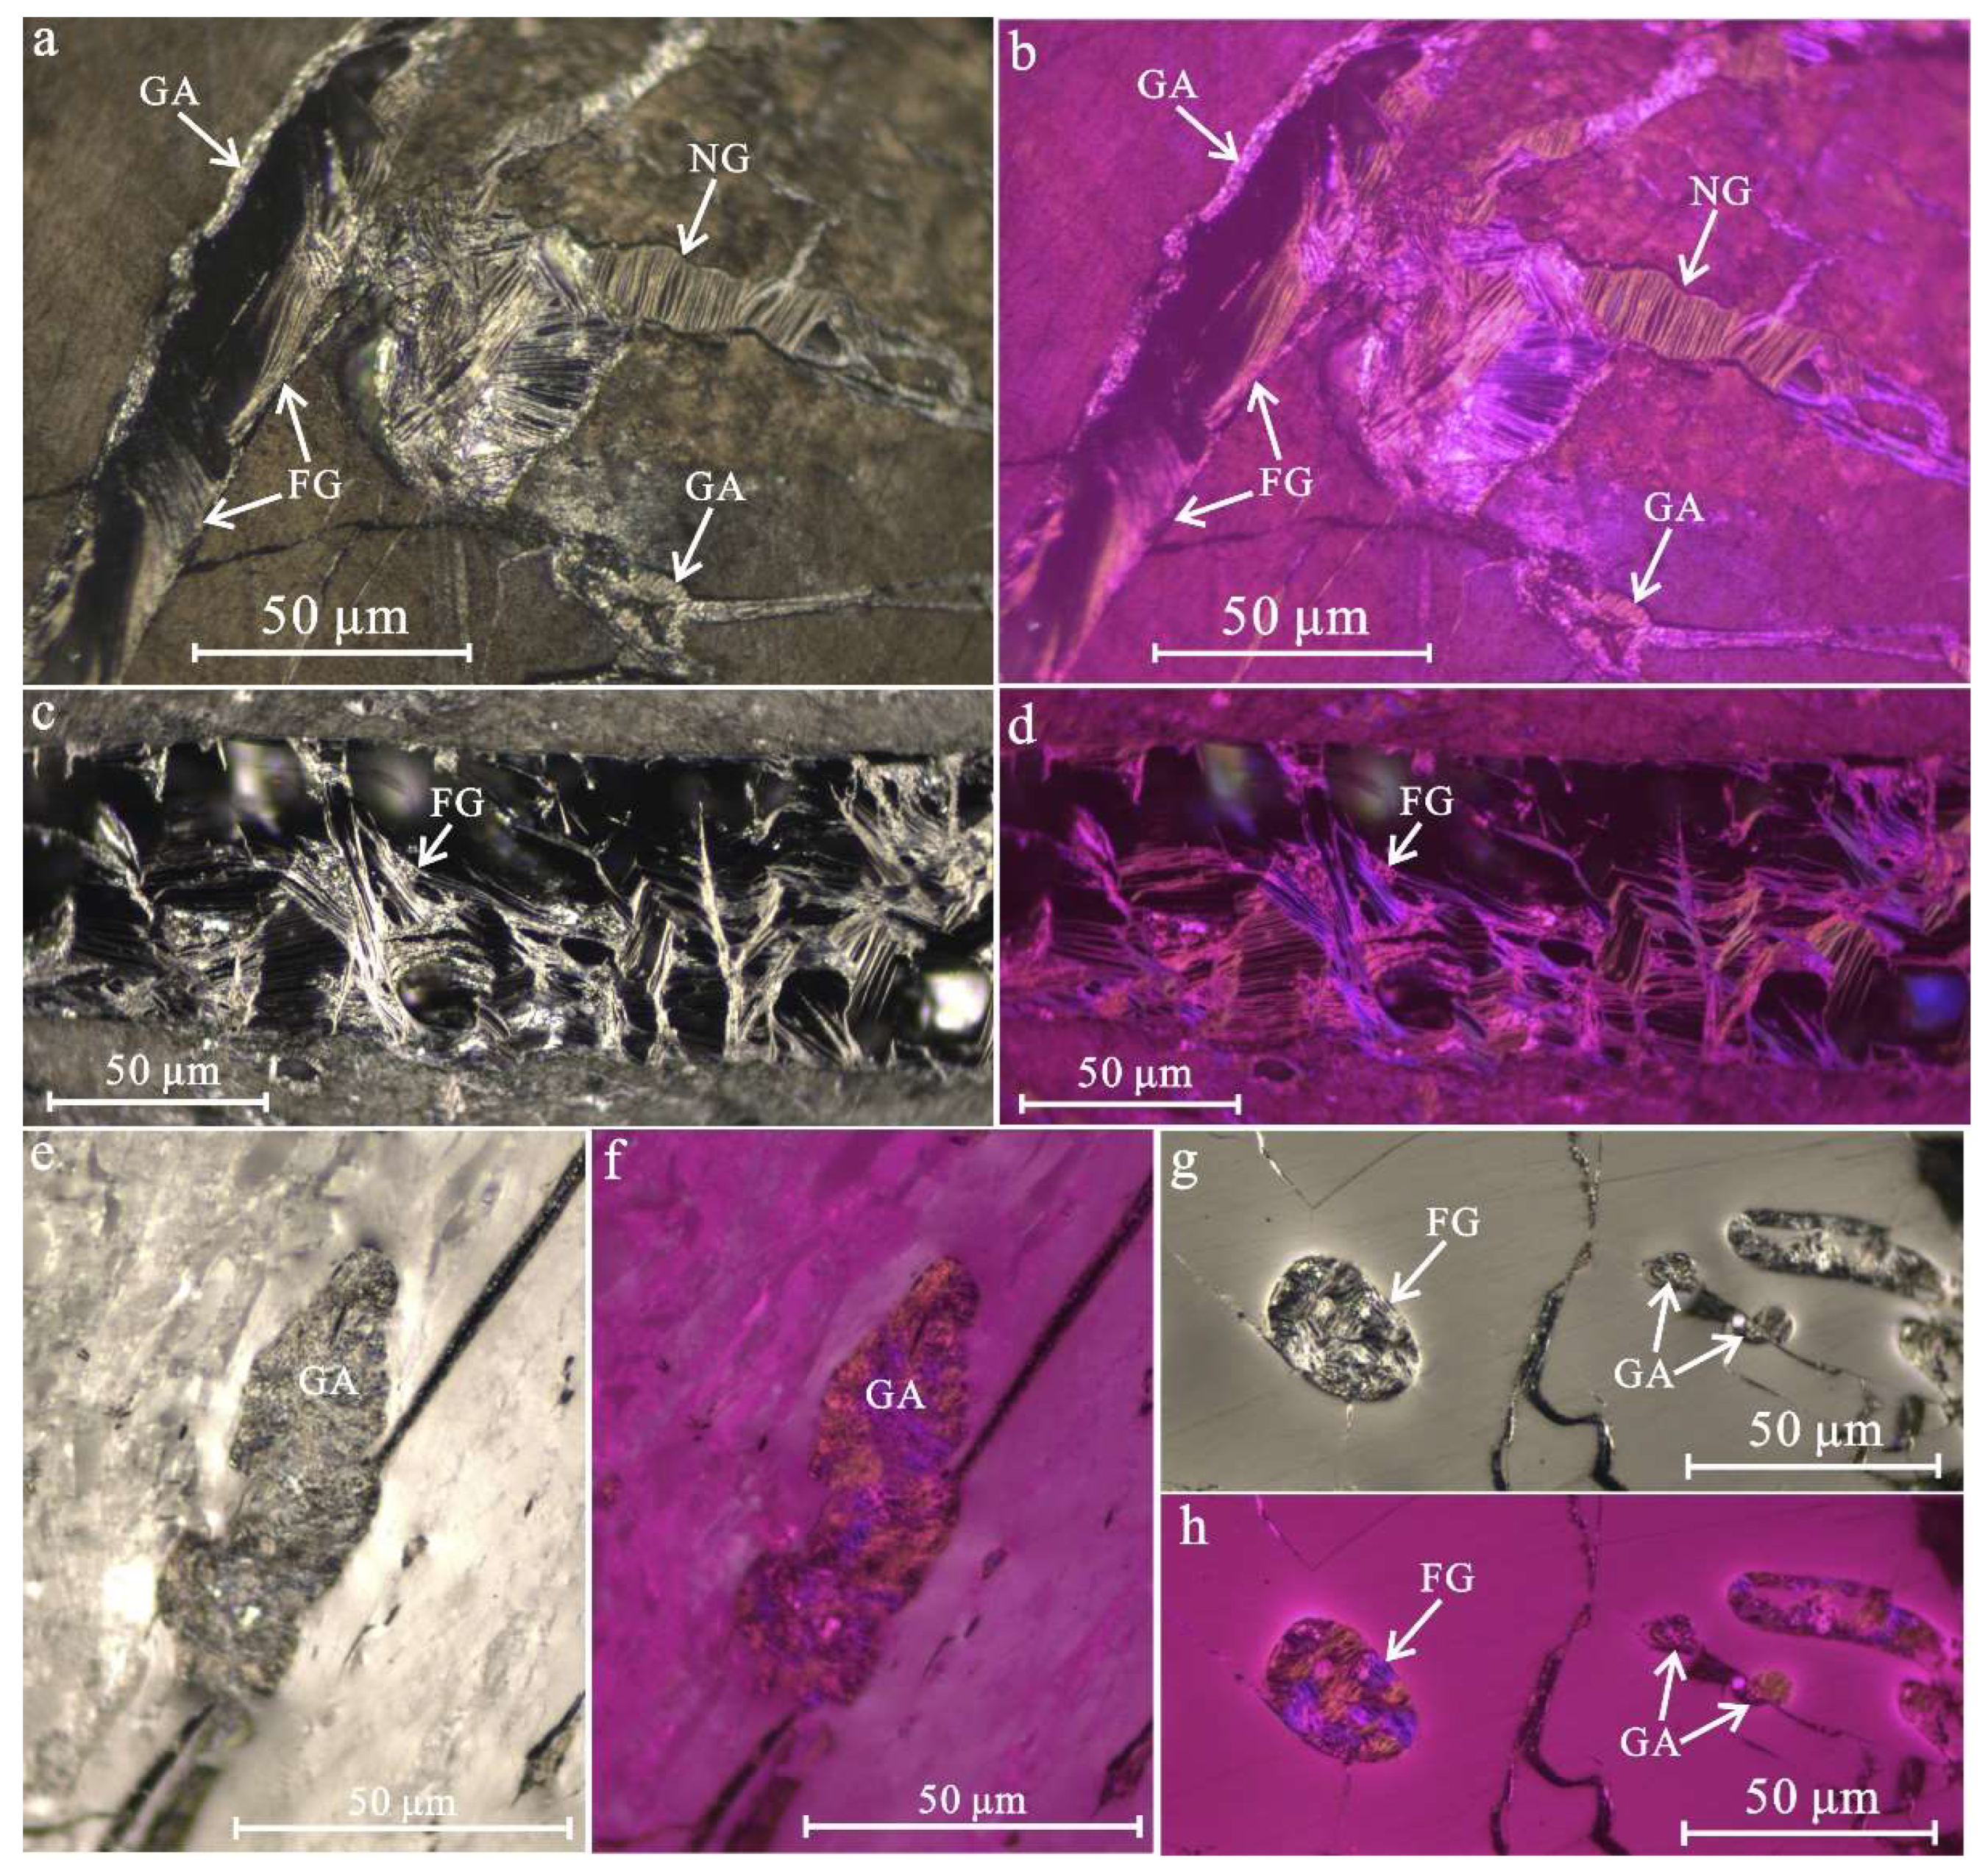
4.2. Petrography Characterization of Graphite Microcrystals

The petrographic composition measurements showed that all the graphitized coal samples were predominantly composed of vitrinite, with a total volume percentage of 86.15%−90.21%, with minor quantities of inertinite and very rare liptinite, graphite microcrystals with a proportion of 2.39%−7.32% (Table 1). Although the volume ratio of graphite microcrystals is relatively low, as a new type of maceral widely existing in graphitized coal, graphite microcrystals provide reliable mineralogical evidence for the transformation of coal to graphite.
Under the microscope, graphite microcrystals show the occurrence of microcrack filling and cell cavity filling, and the former is the most common (Figure 2). The microcrack-filled graphite microcrystals are attached to or grow along the inner wall of the fracture, and their size is controlled by the morphology and dimension of microcracks, showing flake, needle-like and mosaic morphology and occurrence by a cluster aggregate (Figure 2a–e). The cell-cavity-filled graphite microcrystals are limited by volume, and most of them occur as aggregates (Figure 2f,g). As shown in Figure 2a, graphite microcrystals are characterized by bright white under reflected-light microscopy, which is slightly distinguished from the original macerals (e.g., vitrinite, inertinite, and liptinite). Notable optical anisotropy is exhibited under reflected single-polarized light observation (Figure 2b,c). Using polarized light and with a retarder plate of 1λ (Figure 2d,e), the graphite microcrystals show the color of primary yellow and secondary blue and only one kind of color along the microcrack, indicating the consistent arrangement direction of graphite microcrystals [26]. The two kinds of colors (primary yellow and secondary blue) exchange with each other when the stage is rotating for 90°, similar to the mosaic structure shown in coke [13]. Graphite microcrystals filled in the cell cavity of fusinite with a smaller size and showed the same color in different cell cavities, indicating the consistent arrangement of graphite microcrystals in a small range of aggregates (Figure 2f,g).
As shown in Figure 3, at least three morphologies of graphite microcrystals of flake-like graphite microcrystals, needle-like graphite microcrystals and graphite microcrystal aggregates were observed in the microcracks of graphitized coal. Flake- and needle-like graphite microcrystals are common in microcracks with large spaces, and graphite microcrystal aggregates are mainly at the edges of microcracks or small cell cavities. The morphology of graphite microcrystals observed by polarized light and with a retarder plate of 1λ is clearer than single-polarized light observation, which provides more details combined with the two kinds of colors and is a better method to identify graphite microcrystals. The length of the isochromatic region under polarized light and with a retarder plate of 1λ ranges between 10 μm and 50 μm, and the flake-like graphite microcrystals show a flow structure in the microcrack and a lower filling degree of microcracks (Figure 3a–d). However, both the needle-like graphite microcrystals and graphite microcrystal aggregates had a relatively dense structure (Figure 3e–h).
Due to the strong tectonic deformation of graphitized coal, microcracks are extremely developed, the flake-like graphite microcrystals are common in different graphitized coal samples, and the size of the flake-like graphite microcrystals is large enough to meet the reflectance measurement. As shown in Table 1, the mean maximum reflectance of the flake-like graphite microcrystals ranges between 8.49% and 10.83%, higher than the mean maximum reflectance of vitrinite in the same sample. However, the mean minimum reflectance of flake-like graphite microcrystals ranges between 0.85% and 1.33%; that is, a higher bireflectance value of flake-like graphite microcrystals is characterized, coinciding with the extremely strong optical anisotropy observed in Figure 3. Based on the observation of the occurrence and types of graphite microcrystals, the formation of graphite microcrystals is probably by the methods of vapor deposition as described by “gas graphite” [16], similar to pyrolytic carbon. A similar phenomenon of pyrolytic carbon can be observed in the data published by Li et al. [15] for graphitized coal and in Yuan et al. [5] for a set of coal-based graphite samples.

4.3. Mineralogy Characterization of Graphite Microcrystals

The graphite microcrystals infilling the microcrack under the observation of SEM are shown in Figure 4. A clear boundary between the cracks and the coal matrix is observed, and the flake-like graphite microcrystals with irregular morphology and uneven surfaces are attached to microcracks with a width of 5−20 μm (Figure 4a,c,e). After local enlargement, it was observed that the graphite microcrystals were attached to the inner wall of the fracture in the form of bubble film, showing an obvious flow structure, and several nanoscale pores were seen on the surface of the graphite microcrystals (Figure 4b,d,f). Several voids with different sizes and shapes between the graphite microcrystals exist, showing a low degree of filling. These characteristics are indicative of cooling crystallization after softening and melting of carbonaceous materials, coinciding with the occurrence observed under the optical microscope (Figure 3). The morphology of graphite microcrystals shows the embryonic form of lamellae, indicating an intermediate state of carbon crystallization.
Under the observation of SEM, flake-like graphite microcrystals with a higher crystallization degree were also observed in the graphitized coal, showing a nearly parallel arrangement and loose stacking in the bedding direction (Figure 5a). A smooth and flat surface of graphite microcrystals was observed under local enlargement, with a diameter ranging between 1 μm and 3 μm and tabular shape, and interlayer pores were also developed between the graphite microcrystal particles (Figure 5b). In addition, irregular flake-like graphite microcrystals with a diameter larger than 5 μm occurred in clusters with a rough edge (Figure 5c). Elongated flake-like graphite microcrystals stacked at random were also observed (Figure 5d), both of which had a flat surface. As shown in Figure 5e,f, the EDS of graphite microcrystals shows that the element composition is almost pure carbon, the existence of rare O elements may be related to the oxygen functional groups at the edge or defects of the graphite microcrystal structure, and minor Si elements are mainly clay minerals adhered to the surface of graphite microcrystals.

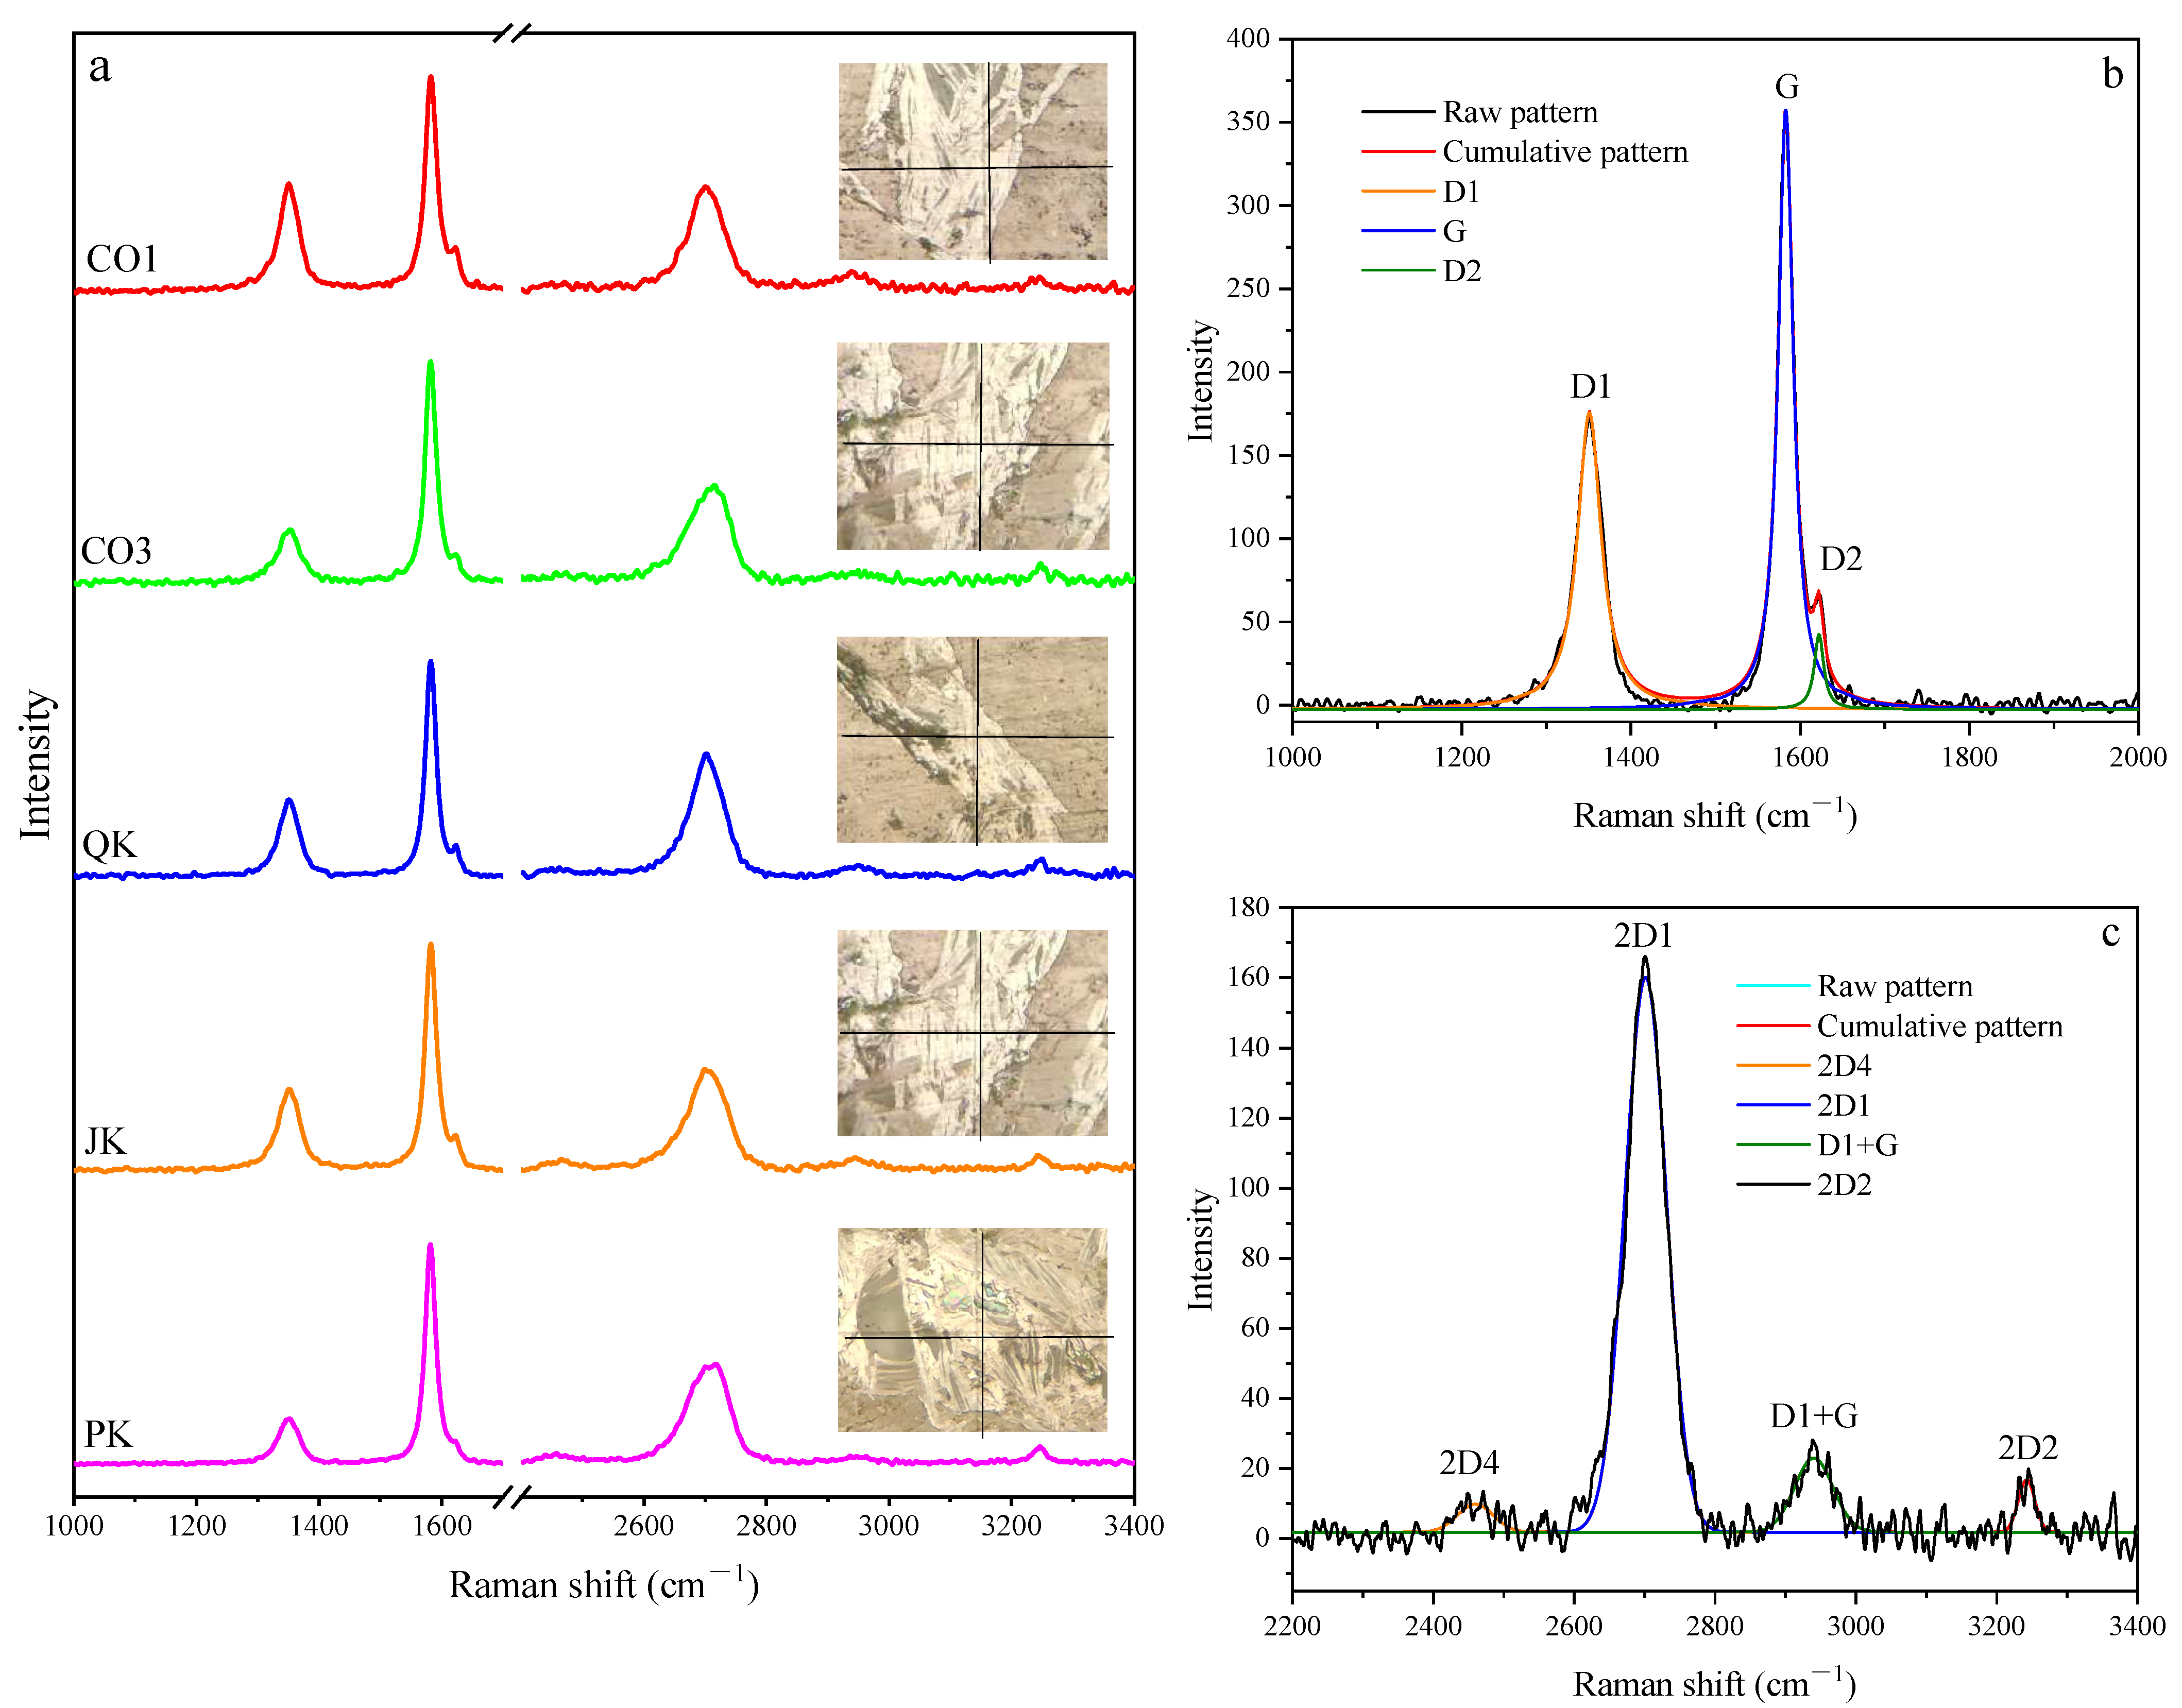
4.4. Raman Characterization of Graphite Microcrystals

Figure 6 shows the Raman shape and profile of graphite microcrystals in graphitized coal samples, and the first-order Raman spectral parameters are listed in Table 2. The pronounced and well-resolved band in the first-order Raman spectral profiles is the G band located in the position of 1582–1583 cm−1 (Figure 6a,b and Table 2), which coincides with the pure-carbon graphite that shows only one band in their Raman spectra located at approximately 1582 cm−1 [43] and is also called the graphite band in the literature [27]. The G band is usually attributed to the E2g vibrational mode of a graphene plane or polyaromatic carbon atoms [44,45], indicating the existence of a polyaromatic structure in carbonaceous matter. Another well-resolved band is the D1 band in the position of 1350–1351 cm−1; however, the intensity of the D1 band is prominently lower than that of the G band, which characterizes the formation of graphite microcrystals during the graphitization process [46] or crystal growth from coal to graphite [47]. The D1 band is usually attributed to in-plane defects in the polyaromatic layers or edge of the sp2 graphene plane [44,48,49], and it disappears in pure graphite [27,43]. Moreover, a third poorly defined band, D2, is clearly distinguished as a shoulder on the right side of the G band at approximately 1622–1624 cm−1 in the spectra of almost all graphite microcrystal samples (Figure 6a,b and Table 2). The D2 band is always induced by defects and indicates a perfect structure of graphite microcrystals. Generally, another two disordered bands (D3 and D4 bands) at ~1500 cm−1 and 1350 cm−1 were observed in graphitized coal samples [46]; however, the two bands disappeared in graphite microcrystals, indicating that the aliphatic moieties on the carbon skeleton and amorphous carbon were almost removed.
The full width at half maximum (FWHM) for the D1 and G bands ranges from 33 to 37 cm−1 and 20 to 22 cm−1, respectively (Table 2), and both show a narrow value similar to semi-graphite and graphite samples [27]. The values of R1 (intensity ratios) obtained from the D1 and G bands are used to assess the degree of disordering of the graphite crystalline structure, and the value of R1 ranges from 0.21 to 0.39 in graphite microcrystals, indicating a higher structure crystallographic order [27]. The parameter R2 (area ratio of the G band and all the first-order Raman spectra) is an indicator for determining the improvement in the order degree of structure. The R2 of graphite microcrystals ranges from 0.60 to 0.74, which coincides with the lower intensity of the defect band (D1 and D2 bands), indicating graphite microcrystals with a higher percentage of graphene planes. The weaker D1 band intensity and narrow FWHM of the G band in graphite microcrystals are related to the high condensation of aromatic rings and the shortening of alkyl chains [28,50], suggesting a highly internal crystallographic structure. Moreover, the coexistence of a higher G band and lower D1 and D2 bands indicate a heterogeneous structure of graphite microcrystals and a state of transformation from coal to pure graphite. Actually, the structure coincides with the results that graphite microcrystals are the transition products from coal to graphite.
The bands in the second-order region (2200−3400 cm−1) of Raman spectra originate from the overtone and combination of the first-order vibration modes, providing additional and useful information of structural and crystallographic order [9]. Figure 6 shows the Raman shape and profile of graphite microcrystals in graphitized coal samples, and the second-order Raman spectral parameters are listed in Table 3. The most prominent feature in second-order Raman spectra is the 2D1 band located in the position of 2701–2707 cm−1, which is assigned to the overtone of the D1 band in the first-order Raman spectra [51,52]. The 2D1 band is related to the number of graphene layers and represents the sensitivity of the π–π bond in the graphitic structure [53], but it does not reflect any disorder or defect structure of the graphite crystal as the D1 band [54]. The higher intensity of the 2D1 band indicates that graphite microcrystals with a higher composition of π–π bonds and better crystallinity, demonstrating that layered graphite structures are gradually produced. The 2D1 band split into two adjacent overlapping bands in graphite indicates a triperiodic organization [55,56]; however, it does not appear in the present study, suggesting that the evolution of graphitized coal may not reach pure graphite but a middle transition from coal to graphite.
In addition, there are three bands in the second-order Raman spectrum with a weaker intensity compared with the 2D1 band. As shown in Table 3, the 2D4 band located in the position range between 2555 and 2464 cm−1 is attributed to the overtone of the D4 band, and the 2D2 band range between 3242 and 3248 cm−1 is the overtone of the D2 band, both of which are related to the defects between the graphene layer. The disordered structure is represented by the D1 + G band at 2940−2947 cm−1 and is always attributed to the combination of the D1 and G bands [57]. The lower intensity of the three bands above in graphite microcrystals coincides with the semi-graphite and graphite that undergo graphitization processes [46], indicating that graphite microcrystals are products of graphitization. In contrast to the first-order Raman spectra, the band position is relatively fixed but fluctuates in a relatively narrow range in second-order Raman spectra, as does the FWHM, mainly because second-order Raman spectra are the overtones or combinations of bands in the first-order region, and the distance between bands in the second-order region is larger than that in the first-order region.
Based on the attribution and characteristics of second-order Raman bands in the present study, the parameter R3 obtained from the area ratio of 2D1 to all the second-order Raman bands is proposed to evaluate the degree of ordering of the crystalline structure. As shown in Table 3, graphite microcrystals with R3 values ranging between 0.78 and 0.86 indicate a high area ratio of the 2D1 band. Lünsdorf et al. [58] proposed that there is no single Raman parameter that shows a steady change throughout the transformation from low maturity materials through maturation to meta-anthracite and graphite; however, Li et al. [28] studied different coal ranks and concluded that for the specific maturation stages, it may be meaningful. Moreover, the increase in the intensity of the 2D1 band in the second-order Raman spectrum suggests that the evolution degree has reached the graphitization stage [2]. Compared with band intensity, the band area involves more information about the morphology of the Raman spectrum, such as FWHM and band intensity. In the current study, both of the graphite microcrystals have higher R3 values, similar to the parameters of R1 and R2, and the parameter R3 indicates a relatively high degree of structural order. Furthermore, as a fast and non-destructive approach to characterize carbonaceous materials, R3 may be an indicator for assessing the graphitization degree of graphitized coal.

5. Conclusions

Graphite microcrystals in graphitized coal are direct mineralogical evidence of coal graphitization. The microstructure characteristics of in situ graphite microcrystals in graphitized coal of Yongan Coalfield, Fujian Province, China, were investigated by optical microscopy, scanning electron microscopy and micro-Raman spectroscopy. The following conclusions can be drawn:
(1)
Graphite microcrystals are characterized by filling microcracks and cell cavities in graphitized coal, with the morphology of flake, needle and aggregates. The volume proportion of graphite microcrystals is between 2.39% and 7.32%, and the optical anisotropy is stronger than that of coal macerals. Under polarized light with a retarder plate of 1λ, graphite microcrystals show the color of primary yellow and secondary blue, and the two kinds of color appear alternately when rotating the microscope stage. The isochromatic zone of flake-like graphite microcrystals with a diameter of 10−50 μm shows an arrangement order along the microcracks;
(2)
The morphology of graphite microcrystals filled with microcracks shows a rough and irregular edge, flow-like or bubble film-like structures along with several pores, indicating a formation mode similar to vapor deposition as cooling crystallization after softening and melting of carbon-containing substances. Moreover, flake-like graphite microcrystals that developed interlayer pores with a clear outline of loose stacking were also observed. The elemental composition was almost pure carbon, and a small amount of oxygen was related to oxygen-containing functional groups or structural defects;
(3)
The micro-Raman spectra of graphite microcrystals show low-intensity D1 and D2 bands and high-intensity G bands in the first-order region and a higher intensity of the 2D1 band and a lower intensity of the other three bands in the second-order region. The parameters R1 and R2 range from 0.21−0.39 and 0.60−0.74, respectively, and the parameter R3 proposed in this paper ranges between 0.78 and 0.86, both of them indicate a higher percentage of graphene plane with a highly internal crystallographic structure.

Author Contributions

Software, J.L.; writing—original draft, J.L. and Y.Q.; supervision, Y.Q. and Y.C.; formal analysis, J.L. and J.S.; data curation, J.L. and Y.C. All authors have read and agreed to the published version of the manuscript.

Funding

This research was supported by the National Natural Science Foundation of China (No. 42130802).

Data Availability Statement

Not applicable.

Acknowledgments

Special thanks are given to Ningning Zhong and Qingyong Luo of China University of Petroleum (Beijing) for their help in using reflected-light microscopy and Ruijin Deng of Fujian Administration of Coal Geology for sample collection. We are also particularly grateful to the editors and two anonymous reviewers for providing useful suggestions and comments on the manuscript.

Conflicts of Interest

The authors declare no conflict of interest.

References

  1. Dai, S.; Ren, D. Effects of magmatic intrusion on mineralogy and geochemistry of coals from the Fengfeng−Handan Coalfield, Hebei, China. Energy Fuels 2007, 21, 1663–1673. [Google Scholar] [CrossRef]
  2. Li, K.; Rimmer, S.M.; Liu, Q.; Zhang, Y. Micro-Raman spectroscopy of microscopically distinguishable components of naturally graphitized coals from central Hunan Province, China. Energy Fuels 2019, 33, 1037–1048. [Google Scholar] [CrossRef]
  3. Wang, L.; Cao, D.; Peng, Y.; Ding, Z.; Li, Y. Strain-induced graphitization mechanism of coal-based graphite from Lutang, Hunan Province, China. Minerals 2019, 9, 617. [Google Scholar] [CrossRef]
  4. Wu, Y.; Li, K.; Wang, Z.; Hu, M.; Cao, H.; Liu, Q. Fluctuations in graphitization of coal seam-derived natural graphite upon approaching the Qitianling granite intrusion, Hunan, China. Minerals 2021, 11, 1147. [Google Scholar] [CrossRef]
  5. Yuan, L.; Liu, Q.; Li, K.; Quan, Y.; Li, X.; Mathews, J.P. The evolution of coal, examining the transitions from anthracite to natural graphite: A spectroscopy and optical microscopy evaluation. Front. Earth Sci. 2022, 1–13. [Google Scholar] [CrossRef]
  6. Li, J. Composition and Optical Proporty Evolution of Macerals in Meta-Anthracite from Yongan, Fujian, China. Master’s Thesis, China University of Mining and Technology, Xuzhou, China, 2019. [Google Scholar]
  7. Li, J.; Qin, Y.; Chen, Y.; Luo, Q.; Deng, R.; Guo, S.; Zhong, N.; Chen, Q. Differential graphitization of organic matter in coal: Some new understandings from reflectance evolution of meta-anthracite macerals. Int. J. Coal Geol. 2021, 240, 103747. [Google Scholar] [CrossRef]
  8. Cao, D.; Zhang, H.; Dong, Y.; Wu, G.; Ning, S.; Mo, J.; Li, X. Research status and key orientation of coal-based graphite mineral geology. Front. Earth Sci. 2017, 24, 317–327. [Google Scholar]
  9. Zhang, S.; Liu, Q.; Zhang, H.; Ma, R.; Li, K.; Wu, Y.; Teppen, B.J. Structural order evaluation and structural evolution of coal derived natural graphite during graphitization. Carbon 2020, 157, 714–723. [Google Scholar] [CrossRef]
  10. Chen, H.; Wang, S.; Zhang, X.; Zhang, X.; Zhao, Y.; Zhang, H. A study of chemical structural evolution of thermally altered coal and its effect on graphitization. Fuel 2021, 283, 119295. [Google Scholar] [CrossRef]
  11. Shi, Y.; Zang, W.; Nan, D.; Huang, Z.; Liu, X.; Zheng, Y.; Shen, W. Preparation of graphitized Taixi coal and its electrochemical properties. J. China Coal Soc. 2012, 37, 1925–1929. [Google Scholar]
  12. Shen, K.; Cao, X.; Huang, Z.H.; Shen, W.; Kang, F. Microstructure and thermal expansion behavior of natural microcrystalline graphite. Carbon 2021, 177, 90–96. [Google Scholar] [CrossRef]
  13. Suarez-Ruiz, I.; Crelling, J.C. Applied Coal Petrology: The Role of Petrology in Coal Utilization; Academic Press: New York, NY, USA, 2008; pp. 180–186. [Google Scholar]
  14. Taylor, G.; Teichmüller, M.; Davis, A.; Diessel, G.F.K.; Littke, R.; Robert, P. Organic Petrology; Gebruder Borntraeger: Berlin, Germany, 1998; pp. 162–174. [Google Scholar]
  15. Li, K.; Rimmer, S.M.; Liu, Q. Geochemical and petrographic analysis of graphitized coals from Central Hunan, China. Int. J. Coal Geol. 2018, 195, 267–279. [Google Scholar] [CrossRef]
  16. Stach, E.; Mackowsky, M.-H.; Teichmüller, M.; Taylor, G.H.; Chandra, D.; Teichmüller, R. Stach’s Textbook of Coal Petrology; Gebruder Borntraeger: Berlin, Germany, 1982. [Google Scholar]
  17. Qin, Y. Micropetrology and Structural Evolution of High-Rank Coals in China; China University of Mining and Technology Press: Xuzhou, China, 1994. [Google Scholar]
  18. Qin, Y.; Jiang, B. Coalification jumps, stages and mechanism of high-rank coals in China. In Geology of Fossil Fuels–Coal; CRC Press: Boca Raton, FL, USA, 2020; pp. 99–122. [Google Scholar]
  19. Beyssac, O.; Goffé, B.; Chopin, C.; Rouzaud, J.N. Raman spectra of carbonaceous material in metasediments: A new geothermometer. J. Metamorph. Geol. 2002, 20, 859–871. [Google Scholar] [CrossRef]
  20. Oberlin, A. Carbonization and graphitization. Carbon 1984, 22, 521–541. [Google Scholar] [CrossRef]
  21. Zheng, Z.; Zhang, J.; Huang, J.Y. Observations of microstructure and reflectivity of coal graphites for two locations in China. Int. J. Coal Geol. 1996, 30, 277–284. [Google Scholar] [CrossRef]
  22. Mathews, J.P.; Fernandez-Also, V.; Jones, A.D.; Schobert, H.H. Determining the molecular weight distribution of Pocahontas No. 3 low-volatile bituminous coal utilizing HRTEM and laser desorption ionization mass spectra data. Fuel 2010, 89, 1461–1469. [Google Scholar] [CrossRef]
  23. Liu, Q.; Yuan, L.; Li, K.; Cui, X.; Yu, L. Structure characteristics of different metamorphic grade coal-based graphites. Earth Sci. 2018, 43, 1663–1669. [Google Scholar]
  24. Li, K.; Liu, Q.; Hou, D.; Wang, Z.; Zhang, S. Quantitative investigation on the structural characteristics and evolution of high-rank coals from Xinhua, Hunan Province, China. Fuel 2021, 289, 119945. [Google Scholar] [CrossRef]
  25. Li, J.; Qin, Y.; Chen, Y.; Song, Y.; Wang, Z. HRTEM observation of morphological and structural evolution of aromatic fringes during the transition from coal to graphite. Carbon 2022, 187, 133–144. [Google Scholar] [CrossRef]
  26. Marsh, H. Introduction to Carbon Science; Butterworth Publishers: London, UK, 1989. [Google Scholar]
  27. Kwiecinska, B.; Suarez-Ruiz, I.; Paluszkiewicz, C.; Rodriques, S. Raman spectroscopy of selected carbonaceous samples. Int. J. Coal Geol. 2010, 84, 206–212. [Google Scholar] [CrossRef]
  28. Li, K.; Rimmer, S.M.; Presswood, S.M.; Liu, Q. Raman spectroscopy of intruded coals from the Illinois Basin: Correlation with rank and estimated alteration temperature. Int. J. Coal Geol. 2020, 219, 103369. [Google Scholar] [CrossRef]
  29. Wopenka, B.; Pasteris, J.D. Structural characterization of kerogens to granulitefacies graphite: Applicability of Raman microprobe spectroscopy. Am. Mineral. 1993, 78, 533–557. [Google Scholar]
  30. Zu, F.; Shu, L.; Li, C. Evolution features of depositional and tectonic setting from late Paleozoic to Meso–Cenozoic in the Yong’an Basin. Int. Geol. Rev. 2012, 50, 126–148. [Google Scholar]
  31. Chen, Q.; Deng, R.; He, Z.; Wang, R. Occurrence Characteristics and Coal Prospecting Mode of Deep Coal Resources in Permian Coal-Bearing Area of Fujian Province; Geological Publishing House: Beijing, China, 2016; pp. 35–41. [Google Scholar]
  32. Shu, L.; Faure, M.; Wang, B.; Zhou, X.; Song, B. Late Palaeozoic–early Mesozoic geological features of South China: Response to the Indosinian collision events in Southeast Asia. Compt. Rendus Geosci. 2008, 340, 151–165. [Google Scholar] [CrossRef]
  33. Huang, N. The characteristics of sedimentary structure of Lower Permian series Tongzi petrofabic of Permian system in Fujian and the range of coal–finding. J. Jiaozuo Inst. Technol. 1998, 17, 34–38. [Google Scholar]
  34. Wang, L.; Cao, D.; Ding, Z.; Chen, Q.; Deng, R.; Lin, X.; Li, Y.; Du, X. Controlling factors and metallogenic belts of coal-based graphite in the South-weatern Fujian province. J. China Coal Soc. 2020, 45, 2865–2871. [Google Scholar]
  35. Zhang, Z.; Zuo, R. Tectonic Evolution of southwestern Fujian Province and spatial–temporal distribution regularity of mineral deposits. Acta Petrol. Sin. 2015, 31, 217–229. [Google Scholar]
  36. Zhang, Y.; Xu, X.; Jia, D.; Shu, L. Deformation record of the change from Indosinian collision-related tectonic system to Yanshanian subduction-related tectonic system in South China during the Early Mesozoic. Front. Earth Sci. 2009, 16, 234–247. [Google Scholar]
  37. GB/T 482-2008; Sampling of Coal Seams. Standardization Administration of the P.R.C.: Beijing, China, 2008.
  38. GB/T 3521-2008; Method for Chemical Analysis of Graphite. Standardization Administration of the P.R.C.: Beijing, China, 2008.
  39. GB/T 31391-2015; Ultimate Analysis of Coal. Standardization Administration of the P.R.C.: Beijing, China, 2015.
  40. GB/T 8899-2013; Determination of Maceral Group Composition and Minerals in Coal. Standardization Administration of the P.R.C.: Beijing, China, 2013.
  41. GB/T 5751-2009; Chinese Classification of Coals. Standardization Administration of the P.R.C.: Beijing, China, 2009.
  42. Kwiecińska, B.; Petersen, H.I. Graphite, semi-graphite, natural coke, and natural char classification—ICCP system. Int. J. Coal Geol. 2004, 57, 99–116. [Google Scholar] [CrossRef]
  43. Pasteris, J.D.; Wopenka, B. Raman spectra of graphite as indicators of degree of metamorphism. Can. Mineralog. 1991, 29, 1–9. [Google Scholar]
  44. Tuinstra, F.; Koenig, J.L. Raman Spectrum of Graphite. J. Chem. Phys. 1970, 53, 1126–1130. [Google Scholar] [CrossRef]
  45. Ammar, M.R.; Galy, N.; Rouzaud, J.N.; Toulhoat, N.; Vaudey, C.E.; Simon, P.; Moncoffre, N. Characterizing various types of defects in nuclear graphite using Raman scattering: Heat treatment, ion irradiation and polishing. Carbon 2015, 95, 364–373. [Google Scholar] [CrossRef]
  46. Zhang, S.; Song, B.; Cao, C.; Zhang, H.; Liu, Q.; Li, K.; Teppen, B.J. Structural evolution of high-rank coals during coalification and graphitization: X-ray diffraction, Raman spectroscopy, high-resolution transmission electron microscopy, and reactive force field molecular dynamics simulation study. Energy Fuels 2021, 35, 2087–2097. [Google Scholar] [CrossRef]
  47. Bernard, S.; Beyssac, O.; Benzerara, K.; Findling, N.; Tzvetkov, G.; Brown, G.E. XANES, Raman and XRD Study of Anthracenebased Cokes and Saccharose-based Chars Submitted to HighTemperature Pyrolysis. Carbon 2010, 48, 2506–2516. [Google Scholar] [CrossRef]
  48. Pocsik, I.; Hundhausen, M.; Koós, M.; Ley, L. Origin of the D Peak in the Raman Spectrum of Microcrystalline Graphite. J. Non-Cryst. Solids 1998, 227–230, 1083–1086. [Google Scholar] [CrossRef]
  49. Pimenta, M.A.; Dresselhaus, G.; Dresselhaus, M.S.; Cancado, L.G.; Jorio, A.; Saito, R. Studying Disorder in Graphite-Based Systems by Raman Spectroscopy. Phys. Chem. Chem. Phys. 2007, 9, 1276–1290. [Google Scholar] [CrossRef]
  50. Ferrari, A.C.; Robertson, J. Interpretation of Raman spectra of disordered and amorphous carbon. Phys. Rev. B 2000, 61, 14095–14107. [Google Scholar] [CrossRef]
  51. Nemanich, R.J.; Solin, S.A. First- and second-order Raman scattering from finite-size crystals of graphite. Phys. Rev. B. 1979, 20, 392–401. [Google Scholar] [CrossRef]
  52. Sato, Y.; Kamo, M.; Setaka, N. Raman spectra of carbons at 2600–3300 cm−1 region. Carbon 1978, 16, 279–280. [Google Scholar] [CrossRef]
  53. Zhang, H.; Li, K.; Sun, J.; Sun, Z.; Yuan, L.; Liu, Q. The structural evolution and mutation of graphite derived from coal under the influence of natural igneous plutonic intrusion. Fuel 2022, 322, 124066. [Google Scholar] [CrossRef]
  54. Wang, S.; Li, T.; Wu, L.; Zhang, L.; Dong, L.; Hu, X.; Li, C. Second-order Raman spectroscopy of char during gasification. Fuel Process. Technol. 2015, 135, 105–111. [Google Scholar] [CrossRef]
  55. Rodrigues, S.; Marques, M.; Suárez-Ruiz, I.; Camean, I.; Flores, D.; Kwiecinska, B. Microstructural investigations of natural and synthetic graphites and semi-graphites. Int. J. Coal Geol. 2013, 111, 67–79. [Google Scholar] [CrossRef]
  56. Rantitsch, G.; Lämmerer, W.; Fisslthaler, E.; Mitsche, S.; Kaltenböck, H. On the discrimination of semi-graphite and graphite by Raman spectroscopy. Int. J. Coal Geol. 2016, 159, 48–56. [Google Scholar] [CrossRef]
  57. Sadezky, A.; Muckenhuber, H.; Grothe, H.; Niessner, R.; Pöschl, U. Raman microspectroscopy of soot and related carbonaceous materials: Spectral analysis and structural information. Carbon 2005, 43, 1731–1742. [Google Scholar] [CrossRef]
  58. Lünsdorf, N.K.; Dunkl, I.; Schmidt, B.C.; Rantitsch, G.; Eynatten, H. Towards a higher comparability of geothermometric data obtained by raman spectroscopy of carbonaceous material. Part 2: A revised geothermometer. Geostand. Geoanal. Res. 2017, 41, 593–612. [Google Scholar] [CrossRef]
Figure 1. (a) The location of Yongan Coalfield; (b) Sampling locations and structural outline of the Yongan Coalfield, South China (modified from [7]).
Minerals 12 01189 g001
Figure 2. Occurrence characteristics of graphite microcrystals in graphitized coal samples. (a) Film-like graphite microcrystals as microcrack filling in sample CO1, non-polarized light; (b) graphite microcrystals attached fracture wall in sample JK, reflected single-polarized light; (ce), graphite microcrystals as fracture-filling in PK, reflected single-polarized light for (c) and polarized light and with a retarder plate of 1λ for (d,e), (e) is the same field of view as (d) but after stage rotation of 90°; (f,g) graphite microcrystals as cell-infillings in sample QK, plane-polarized light for (f) and polarized light and with a retarder plate of 1λ for (g).
Minerals 12 01189 g002
Figure 3. Morphology of graphite microcrystals in graphitized coal samples. (a) Flake-like graphite microcrystals (FG), needle-like graphite microcrystals (NG) and graphite microcrystal aggregates (GA) in sample PK, reflected single-polarized light; (b) the same field of view as a, polarized light and with a retarder plate of 1λ; (c) FG infilling the fracture in sample CO1, reflected single-polarized light; (d) the same field of view as (c) polarized light and with a retarder plate of 1λ; (e) GA infilling the cell, plane-polarized light in sample CO3; (f) the same field of view as (e), polarized light and with a retarder plate of 1λ; (g) FG and GA infilling the cell in sample QK, reflected single-polarized light; (h) the same field of view as (g) polarized light and with a retarder plate of 1λ.
Minerals 12 01189 g003
Figure 4. Occurrence of graphite microcrystals in graphitized coal samples under SEM. (a) graphite microcrystals as fracture-filling in sample CO1; (b) enlargement of rectangle in (a) with flowing and pore structure; (c) graphite microcrystals as fracture-filling in sample CO3; (d) enlargement of rectangle in (c) with several pore structure in the boundary of fracture; (e) graphite microcrystals as fracture-filling in sample CO1; (f) enlargement of rectangle in (e) with flake and flowing structure and several pores.
Minerals 12 01189 g004
Figure 5. SEM images of graphite microcrystals in graphitized coal samples. (a) Flake-like graphite microcrystals in sample CO1; (b) enlargement of rectangle in (a); (c) irregular flake graphite microcrystals in sample CO3; (d) flake-like graphite microcrystals in sample QK; (e) EDS spectrum of point in (c); (f) EDS spectrum of point in (d).
Minerals 12 01189 g005
Figure 6. (a) Raman spectra of graphite microcrystals in graphitized coal; (b) peak fitting of Raman spectrum in the first-order region of sample CO1; (c) peak fitting of Raman spectrum in the second-order region of sample CO1.
Minerals 12 01189 g006
Table 1. Basic properties of graphitized coal samples in the Yongan Coalfield.
SamplesReflectance/%Proximate Analysis/%Ultimate Analysis/%Maceral Composition/%
VRmax s.d. GMmax s.d. GMmins.d.MadAdVdafCdafHdafOdafNdafVILGM
CO17.940.4210.210.540.870.162.2421.908.7989.250.94nd0.1490.111.680.907.32
CO37.170.5210.830.460.850.166.8822.515.2993.870.005.760.2687.986.712.123.18
QK8.950.47ndndndnd7.2613.951.5596.190.09nd0.2786.159.741.732.39
JK7.010.438.490.441.330.2512.9014.542.6196.880.002.940.1590.216.110.003.68
PK7.320.399.750.471.250.199.6211.642.8596.660.012.980.1589.374.551.824.26
Note: VRmax—mean maximum reflectance of vitrinite; GMmax—mean maximum reflectance of flake-like graphite microcrystals; GMmin—mean minimum reflectance of graphite microcrystals; s.d.—standard deviation; V—vitrinite; I—inertinite; L—liptinite; nd—not detected.
Table 2. First-order Raman spectral parameters of graphite microcrystals derived from peak fitting.
SamplesD1/cm−1G/cm−1D2/cm−1R1R2
Positions.d.FWHMs.d.Positions.d.FWHMs.d.Positions.d.FWHMs.d.
CO113511.48341.9715831.86221.5216221.34131.660.390.64
CO313511.26371.3915821.25201.1916241.0970.810.210.74
QK13511.55341.8415832.03201.8716240.7590.970.360.60
JK13512.18351.0815831.17211.5916231.16111.620.350.62
PK13501.13331.5215821.28201.6416220.9281.060.210.74
Table 3. Second-order Raman spectral parameters of graphite microcrystals derived from peak fitting.
Samples2D4/cm−12D1/cm−1D1+G/cm−12D2/cm−1R3
Positions.d.FWHMs.d.Positions.d.FWHMs.d.Positions.d.FWHMs.d.Positions.d.FWHMs.d.
CO124602.26601.2627011.96691.3629402.16651.0932422.26280.930.83
CO324611.85541.5827072.25821.8629471.85701.2632481.92371.160.78
QK24551.61561.8627031.54691.0829451.67661.6532462.16381.350.84
JK24642.08511.6727041.71780.9429471.39641.3832461.66290.860.86
PK24542.59592.2427051.63801.3929462.04751.2432451.59330.970.86
Publisher’s Note: MDPI stays neutral with regard to jurisdictional claims in published maps and institutional affiliations.

