Article

Discrimination of Different AE and EMR Signals during Excavation of Coal Roadway Based on Wavelet Transform

1
Key Laboratory of Gas and Fire Control for Coal Mines, China University of Mining and Technology, Ministry of Education, Xuzhou 221116, China
2
National Engineering Research Center for Coal Gas Control, China University of Mining and Technology, Xuzhou 221116, China
3
State Key Laboratory of Coal Resources and Safe Mining, China University of Mining and Technology, Xuzhou 221116, China
4
School of Safety Engineering, China University of Mining and Technology, Xuzhou 221116, China
5
School of Mines, China University of Mining and Technology, Xuzhou 221116, China
6
Safety Technology Center, Sichuan Coal Mine Safety Administration, Chengdu 610046, China
7
State Key Laboratory for Geomechanics and Deep Underground Engineering, China University of Mining and Technology, Xuzhou 221116, China
*
Author to whom correspondence should be addressed.
Minerals 2022, 12(1), 63; https://doi.org/10.3390/min12010063
Submission received: 31 October 2021 / Revised: 25 December 2021 / Accepted: 1 January 2022 / Published: 3 January 2022

Abstract

:
During the process of coal road excavation, various interference signals, induced by environmental noise, drilling, and scraper loader, will affect the risk assessment of coal and gas outburst using acoustic emission (AE) and electromagnetic radiation (EMR) monitoring technology. To distinguish between different interference signals and danger signals, discrete wavelet transform (DWT) was used to decompose and reconstruct signals, and continuous wavelet transform (CWT) was used to obtain the time-frequency plane. The research results show that: (1) interference signals generally exhibit fluctuating changes within small ranges; in comparison, the intensity of AE and EMR signals caused by coal and rock fracture is found to continuously rise for a long period (longer than 2 h). (2) Different interference signals and danger signals differ significantly in their time-frequency plane. (3) Through decomposition and reconstruction of original signal, obvious precursor information can be found in the time-frequency plane of reconstructed signals.

1. Introduction

With the increase in the mining depth and intensity of coal resources, coal and rock dynamic disaster, such as rockburst, coal and gas outburst, and water inrush, are becoming more and more serious and complicated, which seriously threatens the safe and efficient production of coal resources [1,2,3,4]. Therefore, it is of great importance for the accurate monitoring and early warning of coal and rock dynamic disaster. The drill cuttings method is the most commonly used traditional prediction method. The main indicators include borehole gas emission initial velocity q, cuttings amount S, drill cuttings gas desorption index (K1 and ∆h2), etc. [5]. However, this method cannot predict the disaster in real-time. Currently, geophysical monitoring methods, such as microseismic (MS), acoustic emission (AE), electromagnetic radiation (EMR), etc., have been widely used in the monitoring of coal and rock dynamic disaster [6,7,8]. Among them, the MS monitoring technology mainly locates the seismic source and calculates the energy through the elastic waves released by the coal and rock fractures, and the monitoring range can cover the entire coal mine. It is more used for monitoring and early warning of rockburst [9,10,11,12]. EMR is a physical phenomenon that radiates electromagnetic energy outward during the deformation and fracture process of coal and rock masses. Moreover, the magnitude of electromagnetic energy is closely related to the loading condition of the coal and rock masses, the degree of deformation and fracture, and the rate of gas emission [13,14,15,16,17,18]. Therefore, it can be used in mines that are threatened by rockburst and coal and gas outburst [19,20,21,22,23,24]. Obviously, different monitoring technologies have different signals and ranges, and each has its own advantages. In the actual monitoring of coal and rock dynamic disaster, it is more inclined to use multiple monitoring methods at the same time [25,26,27].
Coal and gas outburst accidents mostly occur in the process of coal tunnel excavation. In addition to the traditional drill cuttings method for prediction, the most widely used geophysical monitoring technology is the AE and EMR synchronous monitoring technology. AE and EMR sensors are generally arranged on the side or middle of the roadway 5–15 m away from the tunneling face and move forward regularly with the tunneling direction. The collected AE and EMR monitoring signals are transmitted to the ground monitoring server in real-time through local area network. Then, the risk of coal and gas outburst can be predicted through the critical value and change trend of the AE and EMR monitoring indicators. However, owing to various interference during the excavation of coal roadways, such as drilling, scraper loader, blasting, etc., it has affected the risk judgment of coal and gas outburst and may result in erroneous warning. Therefore, effective discrimination for AE and EMR interference signals and danger signals and signal noise filtering are very important for the promotion and application of this technology and equipment.
For the monitoring and early warning of coal and gas outburst using AE and EMR, the research on the precursor laws and early warning methods occupies the majority [5,28]. Besides, some studies have found that there is a difference in frequency distribution between interference signals and AE and EMR signals induced by coal and rock fracture. Rabinovitch et al. found EMR signals caused by quarry blasting and laboratory drilling consist of many individual pulses. Moreover, the duration of the EMR pulse caused by drilling is shorter than that of blasting, i.e., the frequency is higher [29]. Zhu et al. found that the dominant frequency of background noise is higher than that of EMR signals caused by coal rupture. The EMR signals released by coal samples under different level of stress have different frequency bands [30]. Qiu et al. found that the frequency spectrum of the dangerous EMR signals monitored during the coal roadway excavation was more scattered than the no danger EMR signals [31]. Zhang et al. compared the vibration signal intensity caused by drilling, belt conveyor, roofbolter compression, and roadheader, founding that the vibration signals intensity caused by roadheader is the largest (400 mV) [32]. Therefore, it is feasible to distinguish different AE and EMR monitoring interference signals and dangerous signals from the perspective of frequency. Fast Fourier transform (FFT) and wavelet transformation (WT) are commonly used frequency analysis methods. FFT is based on a sine function and is mainly suitable for processing stationary signals. WT gradually refines the signal in multiple scales through the expansion and translation operation, and finally achieves high time-frequency resolution. Therefore, it can be used to process non-stationary signals [33,34]. Currently, it has been widely used in the analysis of vibration signal spectrum [35,36]. However, there are no relevant studies on the identification of various interference and dangerous signals (AE and EMR monitoring signals) using the WT method during the excavation of coal roadway.
Therefore, the AE-EMR monitoring system was used to monitor the excavation of coal roadway continuously for a long time with a large number of AE and EMR signals collected. Then, the time-frequency plane was obtained and compared between interference signals caused by environmental noise, drilling, and scraper loader and danger signals caused by coal and rock fractures using the WT method. Besides, WT was also used to filter the noise and extract the precursory information of coal and gas outburst. The research results lay the foundation for the automatic identification and filtering of different types of AE and EMR monitoring signals in the future, as well as have important guiding significance and application value for the monitoring and early warning of coal and gas outburst.

2. Site

2.1. Coal Mine

The test site, named Shiping first coal mine, is located 21 km to the east of Gulin County, Luzhou City, Sichuan Province, China (Figure 1a). The mine has a designed annual productive capacity of 1.2 million ton with an area of 15.4945 km2. It was officially put into production in August 2012. Currently, there are eight minable seams in the coalfield, in which three seams, C19up, C19, and C24, are minable in the whole coalfield. From top down, the spacing between adjacent C19up, C19, and C24 is 4 m and 11.6 m, respectively. The type of the three seams is anthracite without explosibility, and their spontaneous combustion tendency belongs to Type III non-spontaneous combustion. The coal seam C19up is 0.8–1.8 m thick, which is 1.5 m on average, with a dip angle of 12–24°, density of 1.45 m3/t, hardness of 1–2. The immediate roof and main roof of the coal seam C19up separately appear as sandy mudstone and fine sandstone (Figure 1b), with poor surrounding rock at class Ⅳ–Ⅴ. The 13019up conveyor roadway in the coal seam is constructed in the first section of 13# mining area, to the north, south, east, and west located the 12313 auxiliary bottom drainage roadway, 13019up airway, face-separated pillars of the mining area, and 13019up working face. Above the 13019up conveyor roadway, there is no overlying roadway, while underlying it is the 13124 working face (goaf), and the 13019up conveyor roadway is tunneled through blasting excavation. Due to the huge gas pressure and high gas content in the coal seam, as well as the presence of faults, the excavation of the 13019up conveyor roadway faced serious coal and gas outburst risks. In such a context, conventional outburst prediction methods have shortcomings, including huge testing workload and failure in real-time monitoring. To solve the problem, a KJ838(A) AE-EMR monitoring system for coal and gas outburst was introduced in the coal mine to monitor the risk during the excavation of the roadway.

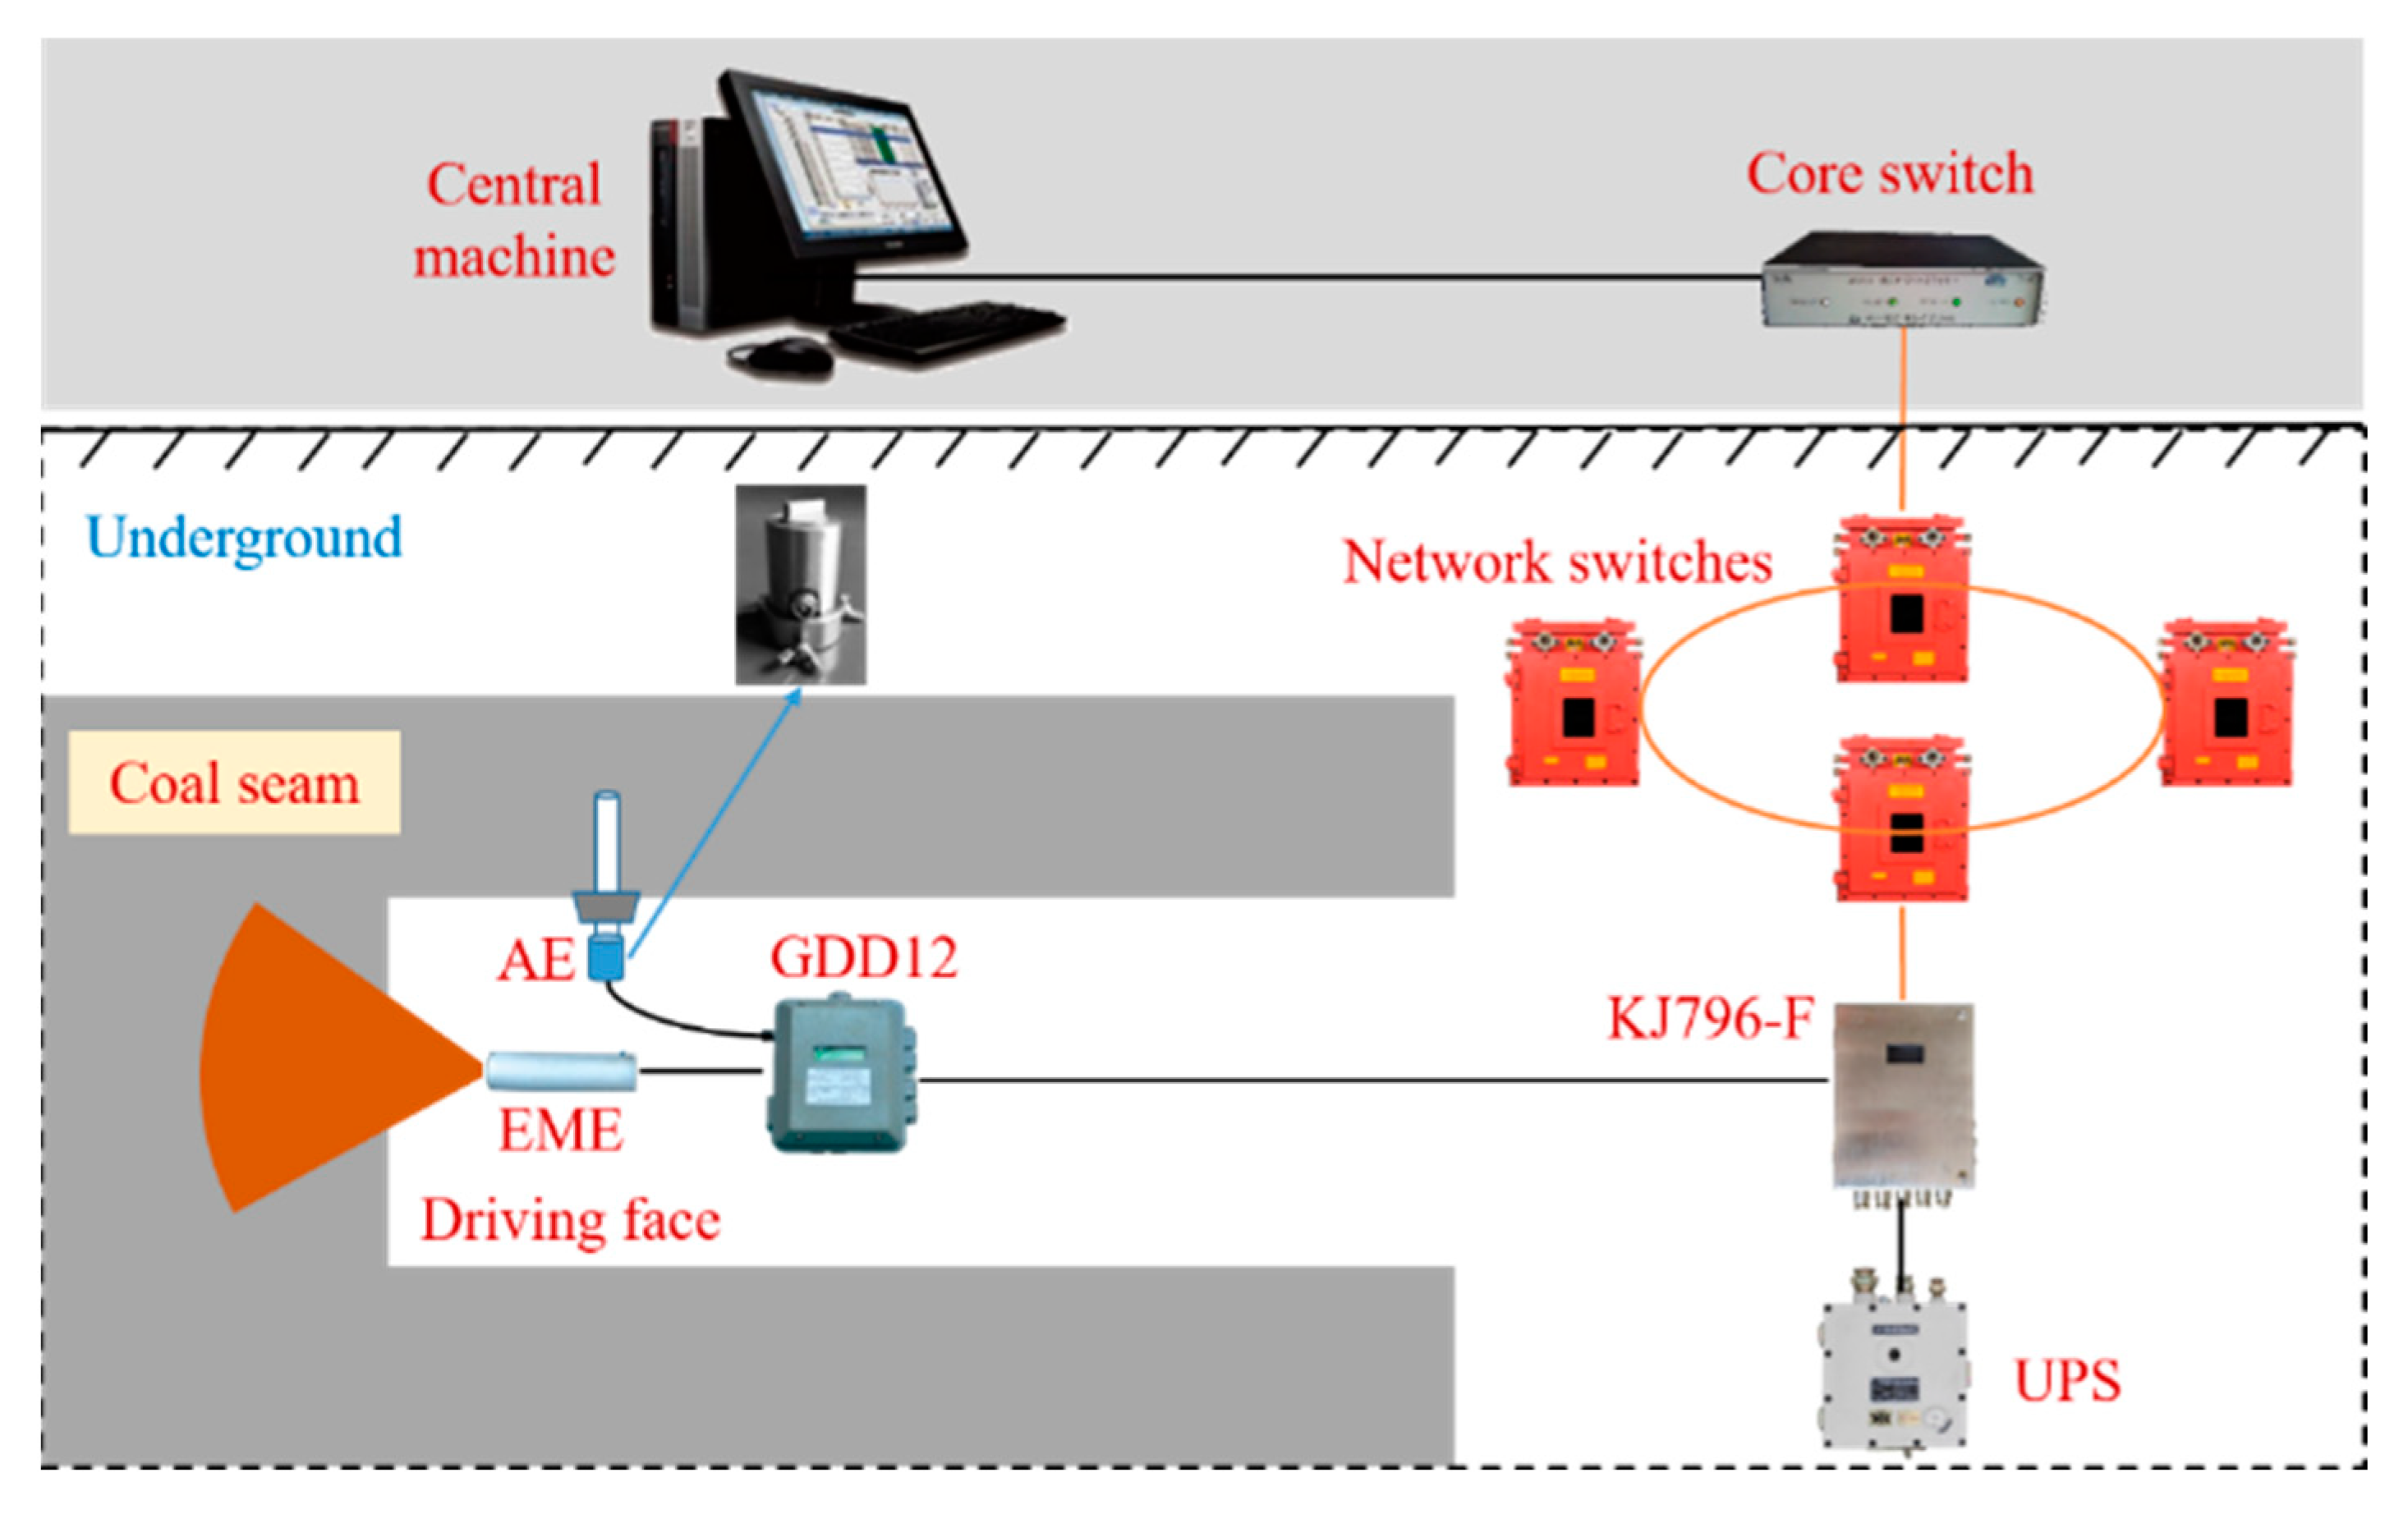
2.2. AE-EMR Monitoring System and Sensors Layout

The KJ838(A) AE-EMR monitoring system for coal and gas outburst, as shown in Figure 2, is an online system that mainly comprises the following hardware components: a KJ796-F intrinsically-safe monitoring substation (Xuzhou Fuan Technology Co., Ltd., Xuzhou, China) for mine use, a flame-proof intrinsically-safe uninterruptible power supply (UPS) for mine use, a GDD12 AE-EMR monitoring device (Xuzhou Fuan Technology Co., Ltd., Xuzhou City, Jiangsu Province, China) for coal-rock dynamic disasters, an acoustic emission (AE) sensor, an EMR sensor, a monitoring center machine, and several flame-retardant communication cables for mine use. The GDD12 AE-EMR monitoring device was mainly used to collect AE and EMR monitoring signals, and each has two channels: one is connected to the AE sensor, while the other to the EMR sensor. The sampling frequency tunable in the range of 1–50 kHz was set as 20 kHz in the field. The main output parameters of the device include the EMR intensity, EMR pulse, AE intensity, and AE ring-down count. Among them, the EMR intensity and AE intensity are both represented by voltage values (mV). In field monitoring, the EMR intensity and AE intensity were taken as the main indicators, complemented with the EMR pulse and AE ring-down count. It is worth noting that huge data were sampled at 20 kHz. Therefore, for the convenience of analysis, the output parameters of the GDD12 AE-EMR monitoring device were averages of all data collected in a fixed period (set as 15 s), i.e., a statistic was attained every 15 s, which is equivalent to a sampling frequency of 1/15 Hz. The KJ796-F intrinsically-safe monitoring substation for mine use was mainly linked to the GDD12 AE-EMR monitoring device and an underground switcher, enabling the transmission of data output by the GDD12 device to the ground-based monitoring center machine.
The AE sensor and the EMR sensor were 5–15 m from the roadway head. As the roadway was excavated forward, they were moved forward every 10 m. The EMR sensor was suspended below the roadway roof, directly facing the heading face. The AE sensor was directly fixed on the end of a rock bolt supporting the roadway through a fixture. The two sensors were connected to the GDD12 AE-EMR monitoring device for coal-rock dynamic disasters through 2-m-long cables, and the monitoring device was also hung at the sidewall of the roadway. The KJ796-F substation was placed in a power distribution chamber and linked to the GDD12 AE-EMR monitoring device through a flame-retardant communication cable for mine use. The KJ796-F substation was powered by the flame-proof intrinsically-safe UPS for mine use.

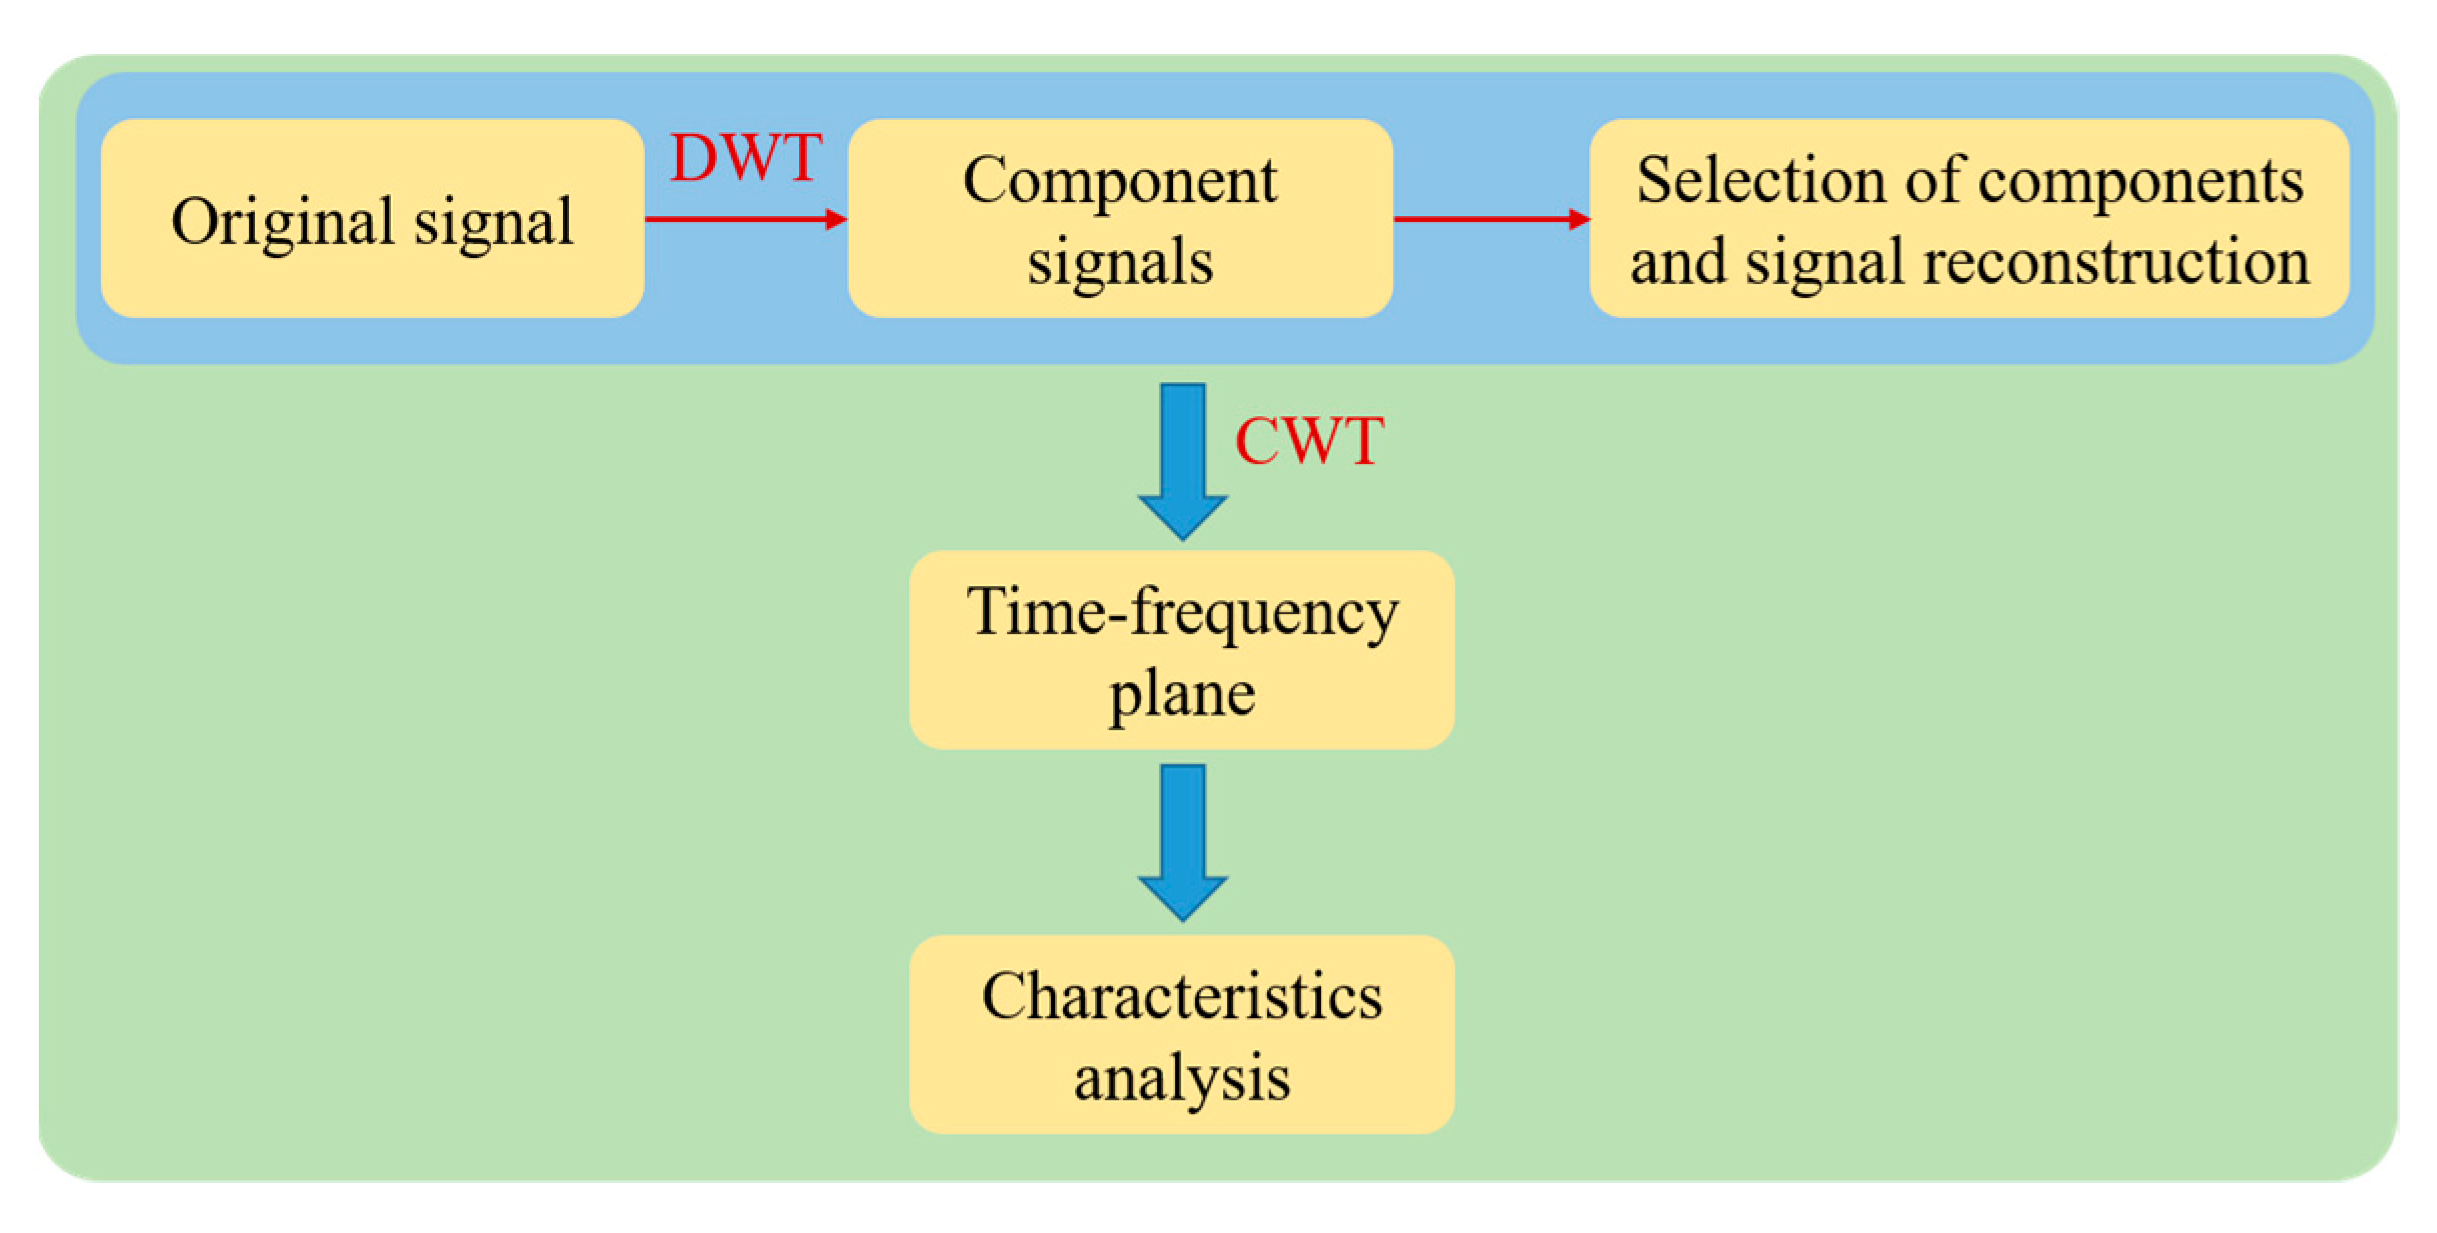
3. Wavelet Transformation

To compare the time-frequency plane of intensity curves of AE and EMR signals during the excavation of the coal roadway, the wavelet transformation (WT) was used. WT is a time-scale (time-frequency) analysis of signals that is characterized by multi-resolution analysis and is able to describe local characteristics of signals in both the time and frequency domains. WT is a time-frequency local analysis method with variable time and frequency windows, i.e., it has high time-frequency resolution, so it is suitable for analyzing non-stationary signals and extracting local features of signals. The commonly used WT methods include discrete wavelet transformation (DWT) [37,38] and continuous wavelet transformation (CWT) [39,40,41,42].
WT gradually refines the signal in multiple scales through the expansion and translation operation, and finally achieves high time-frequency resolution. Therefore, it can be used to process non-stationary signals
A mother wavelet is defined as a function ψ(t) which satisfied the zero mean condition. Through certain scale and translation transform of the mother wavelet ψ(t), a series of new waves ψσ,τ(t) with a similar waveform, while different wave widths, to the mother wavelet are obtained.
ψ σ , τ ( t ) = 1 σ ψ ( t τ σ ) ,
where σ ≠ 0 is a scale parameter for controlling the scale of the wavelet function. The wavelet is scaled under σ > 1, while compressed under σ < 1. τ is a translation parameter to control the translation of the wavelet function. CWT is defined as the inner product of ψσ,τ(t) and the original signal f(t).
W f ( σ , τ ) = f ( t ) ψ σ , τ * ( t ) d t ,
where ψ* is a complex conjugate function of ψ, and Wf(σ,τ) is the time-scale map. The WT of signals is, in essence, the linear combination of inner products between signals and different scales of wavelet functions. Calculating the coefficients of CWT in each σ and τ results in a larger amount of data. DWT is the solution to this problem because it is dualistic. It can be defined as:
W f ( j , k ) = f ( t ) ψ j , k * ( t ) d t ,
where:
ψ j , k ( t ) = σ 0 j / 2 ψ ( σ 0 j t τ 0 k ) ,
where σ0 and τ0 are the constants, j is the decomposition level, and k is the factor of time translation. Generally, σ0 and τ0 are often set as 2 and 1. Therefore, the Equation (4) can be expressed as:
ψ j , k ( t ) = 2 j / 2 ψ ( 2 j t k ) .
The scale factor changes with the signal frequency and signals in different frequency bands correspond to different scales of wavelet functions, so as to reach the goal of self-adaption. In the low frequency band of signals, the waveform changes slowly, so a wide window is needed, which corresponds to a larger scale parameter; in the high frequency band of signals, the waveform varies violently, so a narrow window is required, corresponding to a smaller scale parameter. Therefore, for time-frequency analysis of signals, it needs to convert the scale factor onto the Fourier frequency. Previous research has demonstrated that the scale factor has the following relationship with the dominant frequency of WT:
f = f c a ,
where a is the scale parameter, fc is the center frequency of mother wavelet, i.e., the dominant frequency, and f denotes the Fourier frequency corresponding to the scale. The wavelet analysis benefits from the completeness, self-similarity, and multi-resolution of the mother wavelet. The application effect of wavelet analysis is affected if inappropriate mother wavelet is chosen. According to characteristics of AE and EMR signals, we choose db5 as mother wavelet for DWT, while that for CWT is Morlet wavelet. Morlet wavelet is a complex, single-frequency, sinusoidally-modulated Gaussian wave that has favorable time and frequency resolution. It can be expressed as:
ψ ( t ) = 1 2 π e t 2 / 2 e i ω 0 t ,
where ω0 is the modulation frequency of the wavelet and is generally larger or equal to 5. The symbol e is the natural constant.
The AE and EMR signals collected in the excavation process of coal roadways are typical non-stationary signals with complex compositions that may include high-frequency noise, or low-frequency trend-change term, which may interfere with the time-frequency analysis of signals. CWT has advantages in signal characteristic extraction, but it is easily affected by noise. DWT can decompose a signal into different frequency bands, which has advantages in signal denoising. Therefore, a combination of two methods is used for the research. Firstly, DWT is used to decompose the signal into different components, and then effective components are selected for signal reconstruction. Therefore, the influences of noise and the trend-change term can be shielded. Finally, CWT is used to obtain the time-frequency plane of the reconstructed signal. Different types of signals can be distinguished from the time-frequency plane. The time-frequency analysis process is shown as Figure 3.

4. Results

4.1. Different Interference Signals and Danger Signals

The KJ838(A) AE-EMR monitoring system for coal and gas outburst was used to monitor the whole excavation process of the 13019up conveyor roadway in Shiping first coal mine. According to interference of different working processes during roadway excavation on the monitoring signals, the interference signals can be divided into several types: environmental noise, drilling signals, and operating signals of scraper loader. Relative to interference signals, signals caused by coal and rock fracture and showing a continuous rise trend are defined as danger signals, whose appearance indicates the coal and gas outburst is likely to occur. When there is no mechanical work on site, the collected AE and EMR signals are regarded as environmental noise. When on-site drilling or scraper loader operation, the AE and EMR signals will be marked separately. Danger signals mainly correspond to dynamic phenomena on-site, such as drill stuck, gas blowout, coal and gas outburst, etc. After a large number of statistics, typical interference signals and danger signals of EMR (Figure 4) and AE (Figure 5) were selected. It is evident that, either for the EMR or AE signals, the environmental noise is characterized by fluctuations in a small range, without obvious trend change. The EMR and AE signals of environmental noise fluctuate in 4–11 mV (Figure 4a) and 16–26 mV (Figure 5a), respectively.
For drilling signals, their intensity fluctuates apparently in a larger range than that of the environmental noise. The intensity of drilling signals fluctuates between 9–130 mV as measured by EMR (Figure 4b), and more significantly in AE detection, with the maximum amplitude reaching 500 mV (Figure 5b). It is mainly because the drilling directly acts on coal, and the process is accompanied by the rapid coal fracture and gas emission. In general cases, the larger the scale and the faster the coal fracture, the higher the intensity of the produced EMR signals; the faster the gas is emitted, the higher the intensity of EMR signals. This explains why the EMR signals increase locally in the drilling process, which mainly corresponds to remarkable coal fracture or gas emission. As shown in Figure 4b, the EMR signals caused by drilling show local high values as high as 130 mV at about 2800 s, while they mainly fluctuate between 9 and 70 mV in other time periods. For AE signals caused by drilling (Figure 5b), they mainly exhibit intermittent, local high values, which is associated with the fact that intermittent coal fracture of different intensities may occur during the drilling. Meanwhile, the comparison of EMR and AE signals indicates that the AE signals are more significantly affected by drilling.
The operating signals of scraper loader highly resemble the drilling signals, while have more stable fluctuation ranges and laws. For EMR signals caused by operation of scraper loader (Figure 4c), they fluctuate in the range of 5–40 mV. This is mainly because the scraper loader mainly works on loose coal generated by blasting, and coal and rock fracture and gas emission in the process are lower than those during drilling, so they have less interference on the EMR. As for the AE signal (Figure 5c), they fluctuate more frequently and regularly because the scraper loader works more regularly. As the noise during operation of the machine has a larger amplitude than drilling, the lower limit for fluctuations of intensity of AE signals is higher, and the intensity is basically above 210 mV.
The EMR danger signals caused by coal and rock fracture are mainly influenced by increase in stress or gas pressure, as evinced by the long-period continuous rise. For example, the EMR danger signal in Figure 4d continuously increases for 168 h. The AE danger signal also shows a continuous increase trend, while, for a shorter time, as exemplified by the increase between 15,000–22,500 s (for 2.1 h) in Figure 5d. The phenomenon is related to the AE and EMR monitoring principles. It is the elastic waves that are mainly monitored by AE, and they cannot be recorded unless their intensity exceeds the threshold set for the device, so the increase of intensity of AE signals lasts for a short period. However, the following remarkable characteristic exists: the AE intensity has local high values during its increase process, which mainly correspond to large coal fracture events. In comparison, the EMR intensity reflects not only the amplitude of coal and rock fracture but also the rate of gas emission, and it has high sensitivity. For instance, the EMR signals are produced as early as in the compaction stage during the loading of coal, so EMR signals respond preceding coal and rock fracture [18], with a longer continuous increase period.

4.2. Signal Reconstruction

The AE and EMR signals collected during excavation of the coal roadway are very complex and change non-stationarily. They may contain high-frequency noise or low-frequency trend-change term, such as EMR and AE danger signals caused by coal and rock fracture, which is unfavorable for the extraction and discrimination of main characteristics in time-frequency plane of different interference signals and danger signals. The research applied DWT to extract the main information of signals. DWT can decompose an original signal into components of different frequencies and influences of the interference noise, and the trend term can be eliminated by selecting effective components for signal reconstruction. In the research, db5 was selected as the mother wavelet to decompose signals into six levels. The EMR signal of environmental interference (EMR-EN) and the AE signal of drilling (AE-Drill) were taken as the research objects, and their decomposition results through DWT (Equations (3)–(5)) are shown in Figure 6. The decomposition results from the first to the sixth level are shown from d1 to d6, which become increasingly loose, i.e., the frequency of signals becomes lower and lower. In Figure 6, a represents the final residual component that mainly reflects the change trend of the signal, so it can be directly removed in signal reconstruction. Obviously, different decomposed signals have different similarities with the original signal. Here, to select effective components for signal reconstruction, the signal similarity is introduced to screen signals. The original signal is set as S(t), and the decomposed signal of S(t) at the ith level is di. Then, the similarity of the component di with the original signal S(t) is expressed as [43]:
η i = C o v ( d i , S ( t ) ) S D ( d i ) S D ( S ( t ) ) ,
where ηi represents the similarity, Cov(di,S(t)) is the covariance of the ith component and the original signal, and S D ( d i ) is the standard deviation of the ith component signal. For the threshold ηTH for the similarity, we can refer to the following formula [44]:
η T H = max ( η i ) 10 × max ( η i ) 3 .
The decomposed components with similarity ηi larger than ηTH are reserved, while those lower than ηTH are removed. For the decomposition results of the EMR signal of environmental interference and AE signal of drilling in Figure 6, the similarities of different components with the original signals are calculated using Equation (8), as listed in Table 1. It is calculated using Equation (9) that the similarity thresholds ηTH of the two signals are 0.2401 and 0.3279, respectively. Therefore, for the EMR signal caused by environmental noise, its components d1d5 are retained. For the AE signal caused by drilling, its d1d3 components are reserved. By using the reserved components, the new signals are reconstructed, as shown in Figure 7a (EMR signal) and Figure 7b (AE signal). The reconstructed signals differ greatly from the original signals, in their fluctuations mainly around the 0 axis and absence of a wide range of change trends, so they better reflect the density of fluctuations and display the frequency domain better. Moreover, from the perspective of time, the reconstructed signals have large amplitudes at time moments when the original signals have large amplitudes.

4.3. Time-Frequency Plane

After obtaining the reconstructed signals, CWT (Equations (1), (2), (6), and (7)) can be used to calculate the time-frequency plane thereof. In this way, the time-frequency plane of different interference signals and danger signals in Figure 4 and Figure 5 are attained, as separately displayed in Figure 8 (EMR) and Figure 9 (AE). The time-frequency plane (I) intuitively shows the changes of signals with time and instantaneous frequency. Different colors in the time-frequency plane represent different energy amplitudes, which gradually increase from blue to yellow. The summation of signal energy at the same frequency in the time-frequency plane yields the marginal spectrum of signals (II), while the instantaneous energy spectrum (III) can be obtained through the summation of signal energy at the same time moment. According to the sampling theorem, the distribution range of frequency in the time-frequency plane should be a half of the sampling frequency, namely 0.033 Hz, as shown in the time-frequency plane of AE signals. However, considering the main energy distribution ranges of signals, the frequency range of the time-frequency plane of EMR signals is defined as 0–0.01 Hz. It is worth noting that the frequency here refers to the relative frequency and is mainly determined based on sampling interval of AE and EMR signals. Differences in time-frequency characteristics of different interference signals and danger signals are analyzed below.
For the EMR signal caused by environmental noise, the time-frequency plane is mainly characterized by an obvious frequency component at about 0.001 Hz over the whole time frame, while disperse energy distribution at other frequency components (Figure 8a). This can also be observed from the marginal spectrum of the signal, i.e., there is an obvious peak frequency (dominant frequency). For the AE signals triggered by environmental noise, the signal energy is mainly distributed between 0.005 and 0.02 Hz, without an obvious peak frequency (Figure 9a). In the range, the signal energy is distributed quite disperse and no obvious high-energy zone is found.
For the interference signal caused by drilling, its EMR and AE signals have energy distributed in wider frequency ranges (0–0.01 Hz and 0–0.033 Hz) without obvious peak frequency, and show a multi-modal structure (marginal spectrum of signals). They have a remarkable characteristic that there are local high-energy zones in their time-frequency plane, which is related to the coal and rock fracture and gas emission in the drilling process. For example, there are high-energy zones in ranges of 0.001–0.002 Hz and 0.003–0.004 Hz in the time-frequency plane of the EMR signal (Figure 8b), and in ranges of 0.005–0.01 Hz and 0.03–0.033 Hz in the time-frequency plane of the AE signal (Figure 9b). The high-energy zones are not distributed throughout the time frame. Relatively, the high-energy zone lasts for a shorter time (0.03–0.033 Hz) in the time-frequency plane of the AE signal, mainly because the high-frequency signals caused by coal and rock fracture attenuate faster than low-frequency signals.
The energy of the EMR interference signal caused by the operation of scraper loader has a simple distribution manner in the frequency range and is mainly concentrated in the range of 0–0.003 Hz (Figure 8c). In the time-frequency plane of the signal, there are two obvious high-energy zones over the whole time frame, corresponding to the two obvious peak frequencies in the marginal spectrum of the signal. This is mainly because the EMR mainly monitors coal and rock fracture of sidewalls and gas emission in roadways, while a scraper loader mainly works on loose coal in the middle part of the roadways and, therefore, slightly interferes with the EMR. Similar to the EMR signal, the time-frequency plane of AE signal (Figure 9c) also has two obvious energy bands (below 0.003 Hz), with the difference laying in the presence of disperse energy distribution in other frequency components (0.01–0.033 Hz). This is mainly because except for acting on loose coal, the scraper loader also produces mechanical noise, which interferes with the AE signals (as evinced by energy distribution in 0.01–0.033 Hz). However, the noise does not interfere with the EMR, which explains why the time-frequency plane of the EMR signal is simpler. In addition, although the signals caused by drilling and operation of the scraper loader are similar, they can be clearly distinguished based on the time-frequency plane, which represents the advantage of time-frequency plane in distinguishing different signals.
For time-frequency plane of either EMR (Figure 8d) or AE danger signals (Figure 9d) caused by fracture of coal and rock, the most obvious characteristic is the devoid of an obvious high-energy zone, which is remarkably different from time-frequency plane of other interference signals. As shown in the marginal spectrum of the signals, the energy is distributed mainly in a small frequency range (below 0.002 Hz), which is apparently lower than the dominant frequency of interference signals. From the instantaneous energy spectrum, the energy of the EMR signal changes non-obviously but only shows a slow increase trend, with a high value at the end. Nevertheless, there are two local high energy values in the instantaneous energy spectrum of the AE signal, mainly resulting from the large coal fracture, which corresponds to the original waveform.

5. Discussion

5.1. Signal Filtering

The above analysis reveals that the interference signals caused by environmental noise, drilling, and operation of the scraper loader differ significantly from the danger signals caused by coal and rock fracture in their time-frequency plane. It is an effective approach for distinguishing different interference signals from danger signals using time-frequency plane. In addition, WT has a role in denoising signals. This is particularly applicable to the original danger signals caused by coal and rock fracture, which also show some small local fluctuations that, however, are not of concern. Instead, what should be concerned most is the large increase trend of the signal intensity with time. The wavelet decomposition results indicate that it is the final residual component that displays the main change trend of the signal. Using db5 as the wavelet basis, the AE danger signals induced by coal and rock fracture were decomposed into six levels using DWT, and the decomposition results are shown in Figure 10a. It was verified that the residual component after six-level decomposition of the EMR danger signal still had some burrs. Therefore, the EMR signal was decomposed into eight levels, and the results are shown in Figure 10b. The final residual component was compared with the original signal, as displayed in Figure 11 and Figure 12. The result unveils that the noise of the filtered signal is reduced significantly, so that the curve is smoother and better highlights the overall rising trend of the signal.

5.2. Precursor Information of Time-Frequency Plane Based on Wavelet Transformation

The time-frequency plane of danger signals caused by coal and rock fracture also contains abundant precursor information for the occurrence of coal and gas outburst, which is of great significance for the monitoring of such disaster. However, the extraction of such precursor information calls for deep learning. For example, the precursor information is unapparent in the time-frequency plane of danger signals in Figure 8d and Figure 9d. In addition, we also used components other than residual component to reconstruct the signal and calculate the time-frequency plane. The time-frequency plane of EMR and AE danger signals are shown in Figure 13a,b, respectively. The precursor information of coal and gas outburst is also not obvious. From Figure 10, it can be obtained the wavelet decomposition results of signals that the local fluctuations are more obvious in the components obtained in the later stage of decomposition. Moreover, considering that AE and EMR signals caused by coal and rock fracture generally have lower frequency than the interference signals, these signals were reconstructed using several components that were decomposed in the late stage. In terms of the selection of specific components, it needs to be tried and verified. Through verification, it is most appropriate to reconstruct the AE danger signal caused by coal and rock fracture using its d3, d4, and d5 components, and the time-frequency plane is shown in Figure 13c. It was observed in the field that the gas blowout happened at about 22,500 s, before which there are two obvious high-energy zones in the time-frequency plane of the signal (I and II), corresponding to two large coal fracture events in the original signal. It can also be seen from the time-frequency plane that more low-frequency components are involved in the second coal fracture event, indicating that the fracture of high-strength coal corresponds to a low frequency. In addition, since occurrence, the low-frequency component (0.0013 Hz) persists to the appearance of danger. In subsequent monitoring, the persistence of the low-frequency component can be used as a precursor for coal-rock dynamic disasters.
For the EMR danger signal caused by coal and rock fracture, it was reconstructed using the d6 and d7 components, and its time-frequency plane was calculated; the results are shown in Figure 13d. The gas blowout happened at about 550,000 s, through on-site verification, when the EMR intensity also reached the peak correspondingly (Figure 4d). It can be seen from the time-frequency plane of the signal that there are also two obvious high-energy zones, and the last one corresponds to the abnormal gas emission. The two zones correspond to a low signal frequency, at about 0.0004 Hz. The instantaneous energy spectrum of the signal unveils that the second high-energy zone lasts for a longer time, and the first (III) and second high-energy zones are apart for a time interval of 69 h. Therefore, the occurrence of such low-frequency high-energy zones can be deemed as a precursor for coal-rock dynamic disasters. By contrast, the signal intensity does not show obvious abnormity at the moment when the first high-energy zone appears. This also reflects the advantage of time-frequency plane, i.e., they provide precursor information other than the change of signal intensity.

6. Conclusions

The AE-EMR monitoring system was used to monitor the danger of coal and gas outburst during the excavation of coal roadway. Then, the time-frequency plane was obtained and compared between interference signals caused by environmental noise, drilling, and scraper loader and danger signals caused by coal and rock fractures using the WT method. Besides, WT is also used to filter the noise and extract the precursory information of coal and gas outburst. The main conclusions are drawn as follows.
(1)
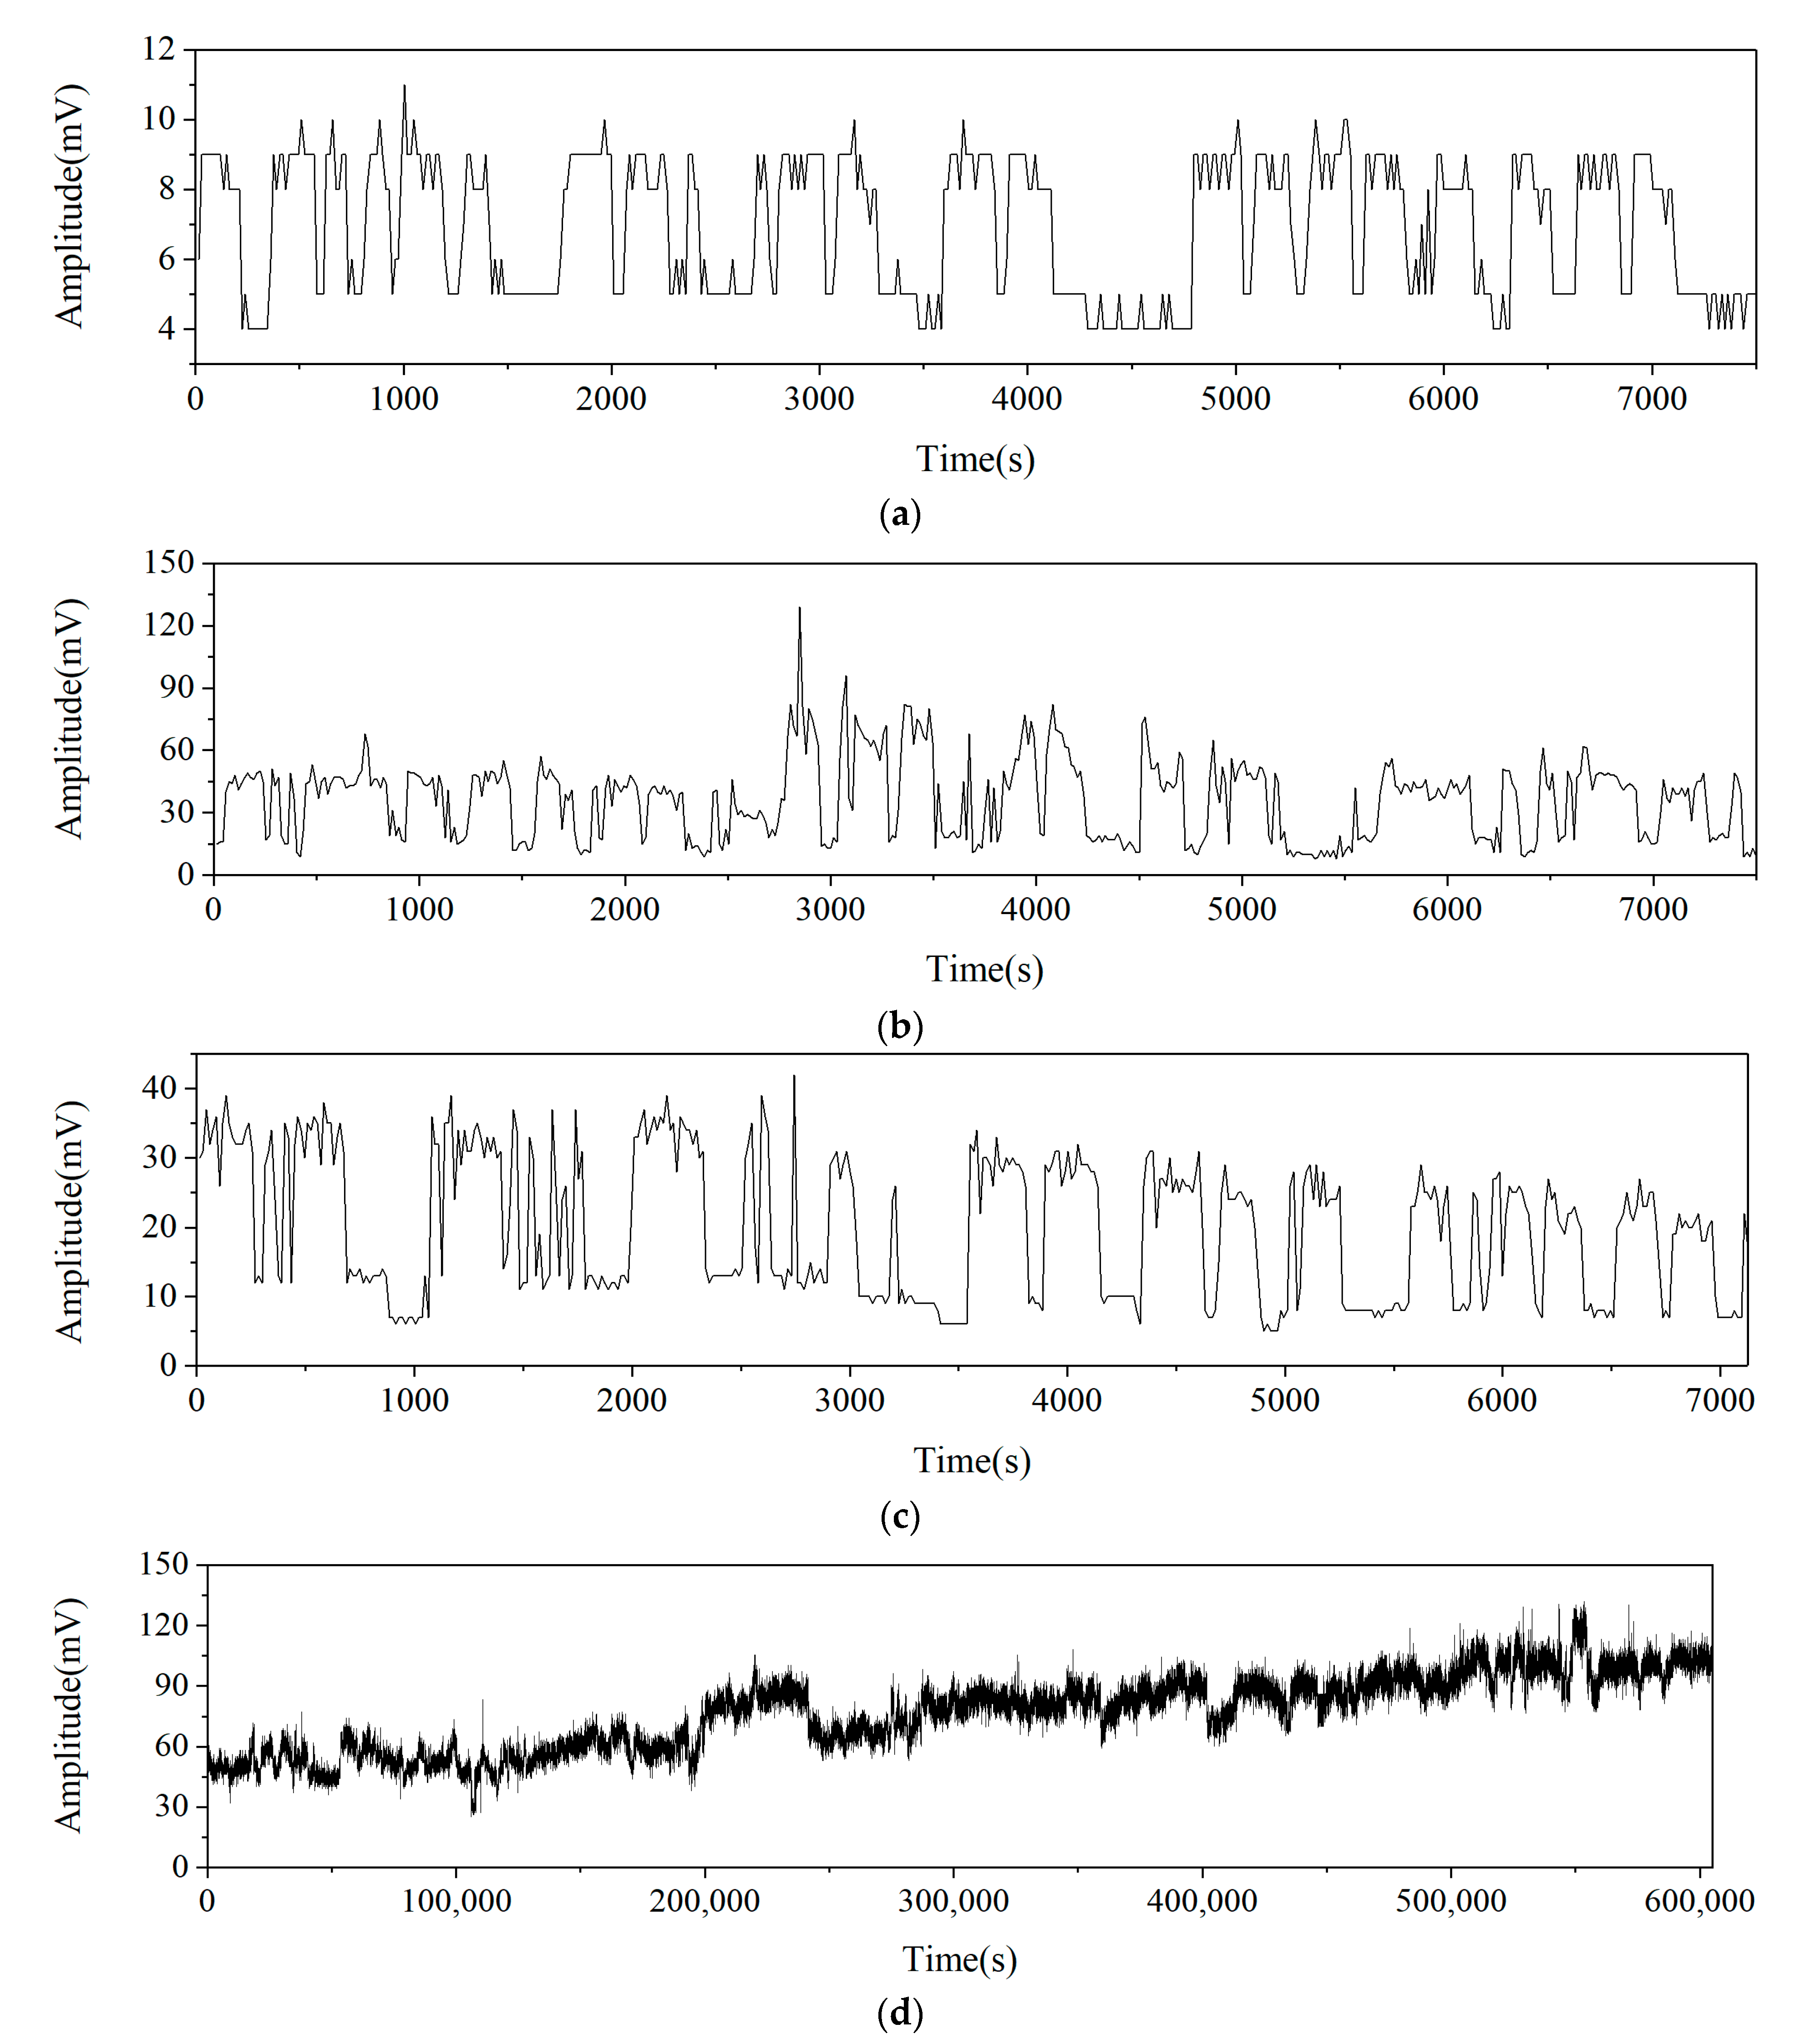
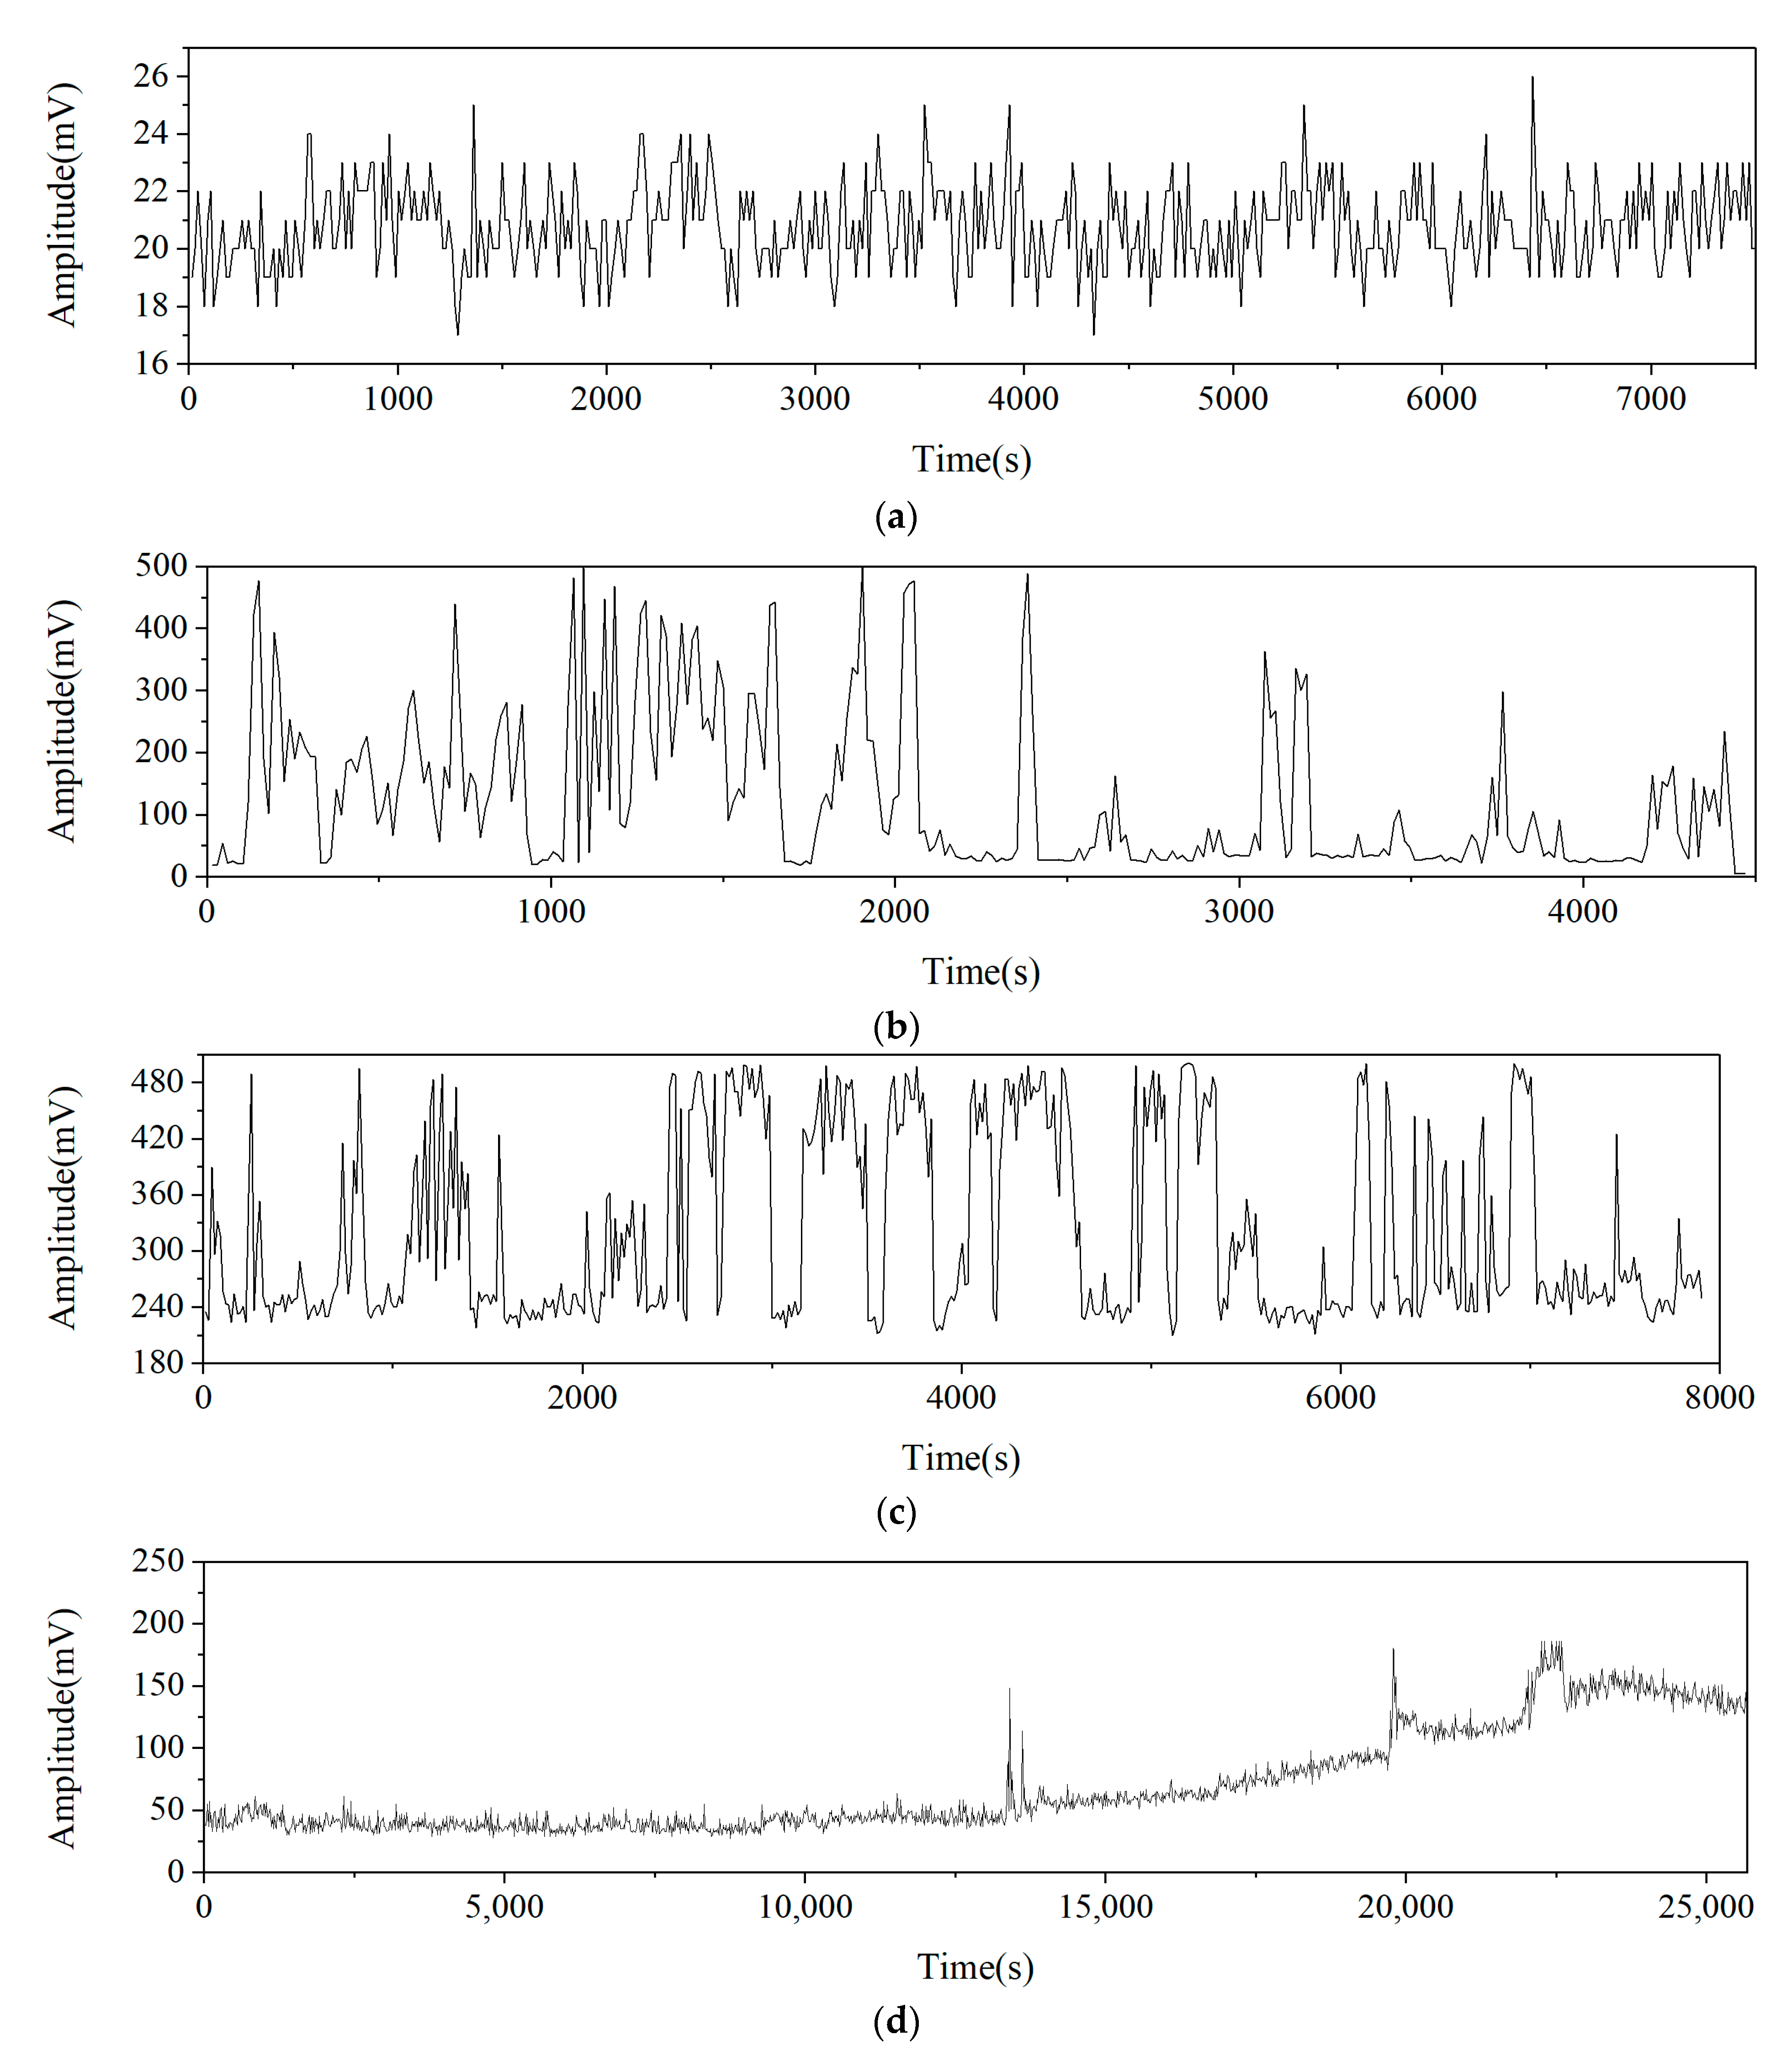
Either for AE or EMR signals, the amplitude of the environmental noise fluctuates in a small range without obvious trend change. The drilling signal is very similar to the signals caused by the scraper loader, and the signal fluctuation range is much larger than the environmental noise. The difference between them is that the drilling signal has a local high value, which is mainly caused by coal fracture during the drilling process. Besides, the impact of drilling and scraper loader on AE is significantly greater than EMR. Danger signals caused by coal rock fracture often show a long-period fluctuation (more than 2 h).
(2)
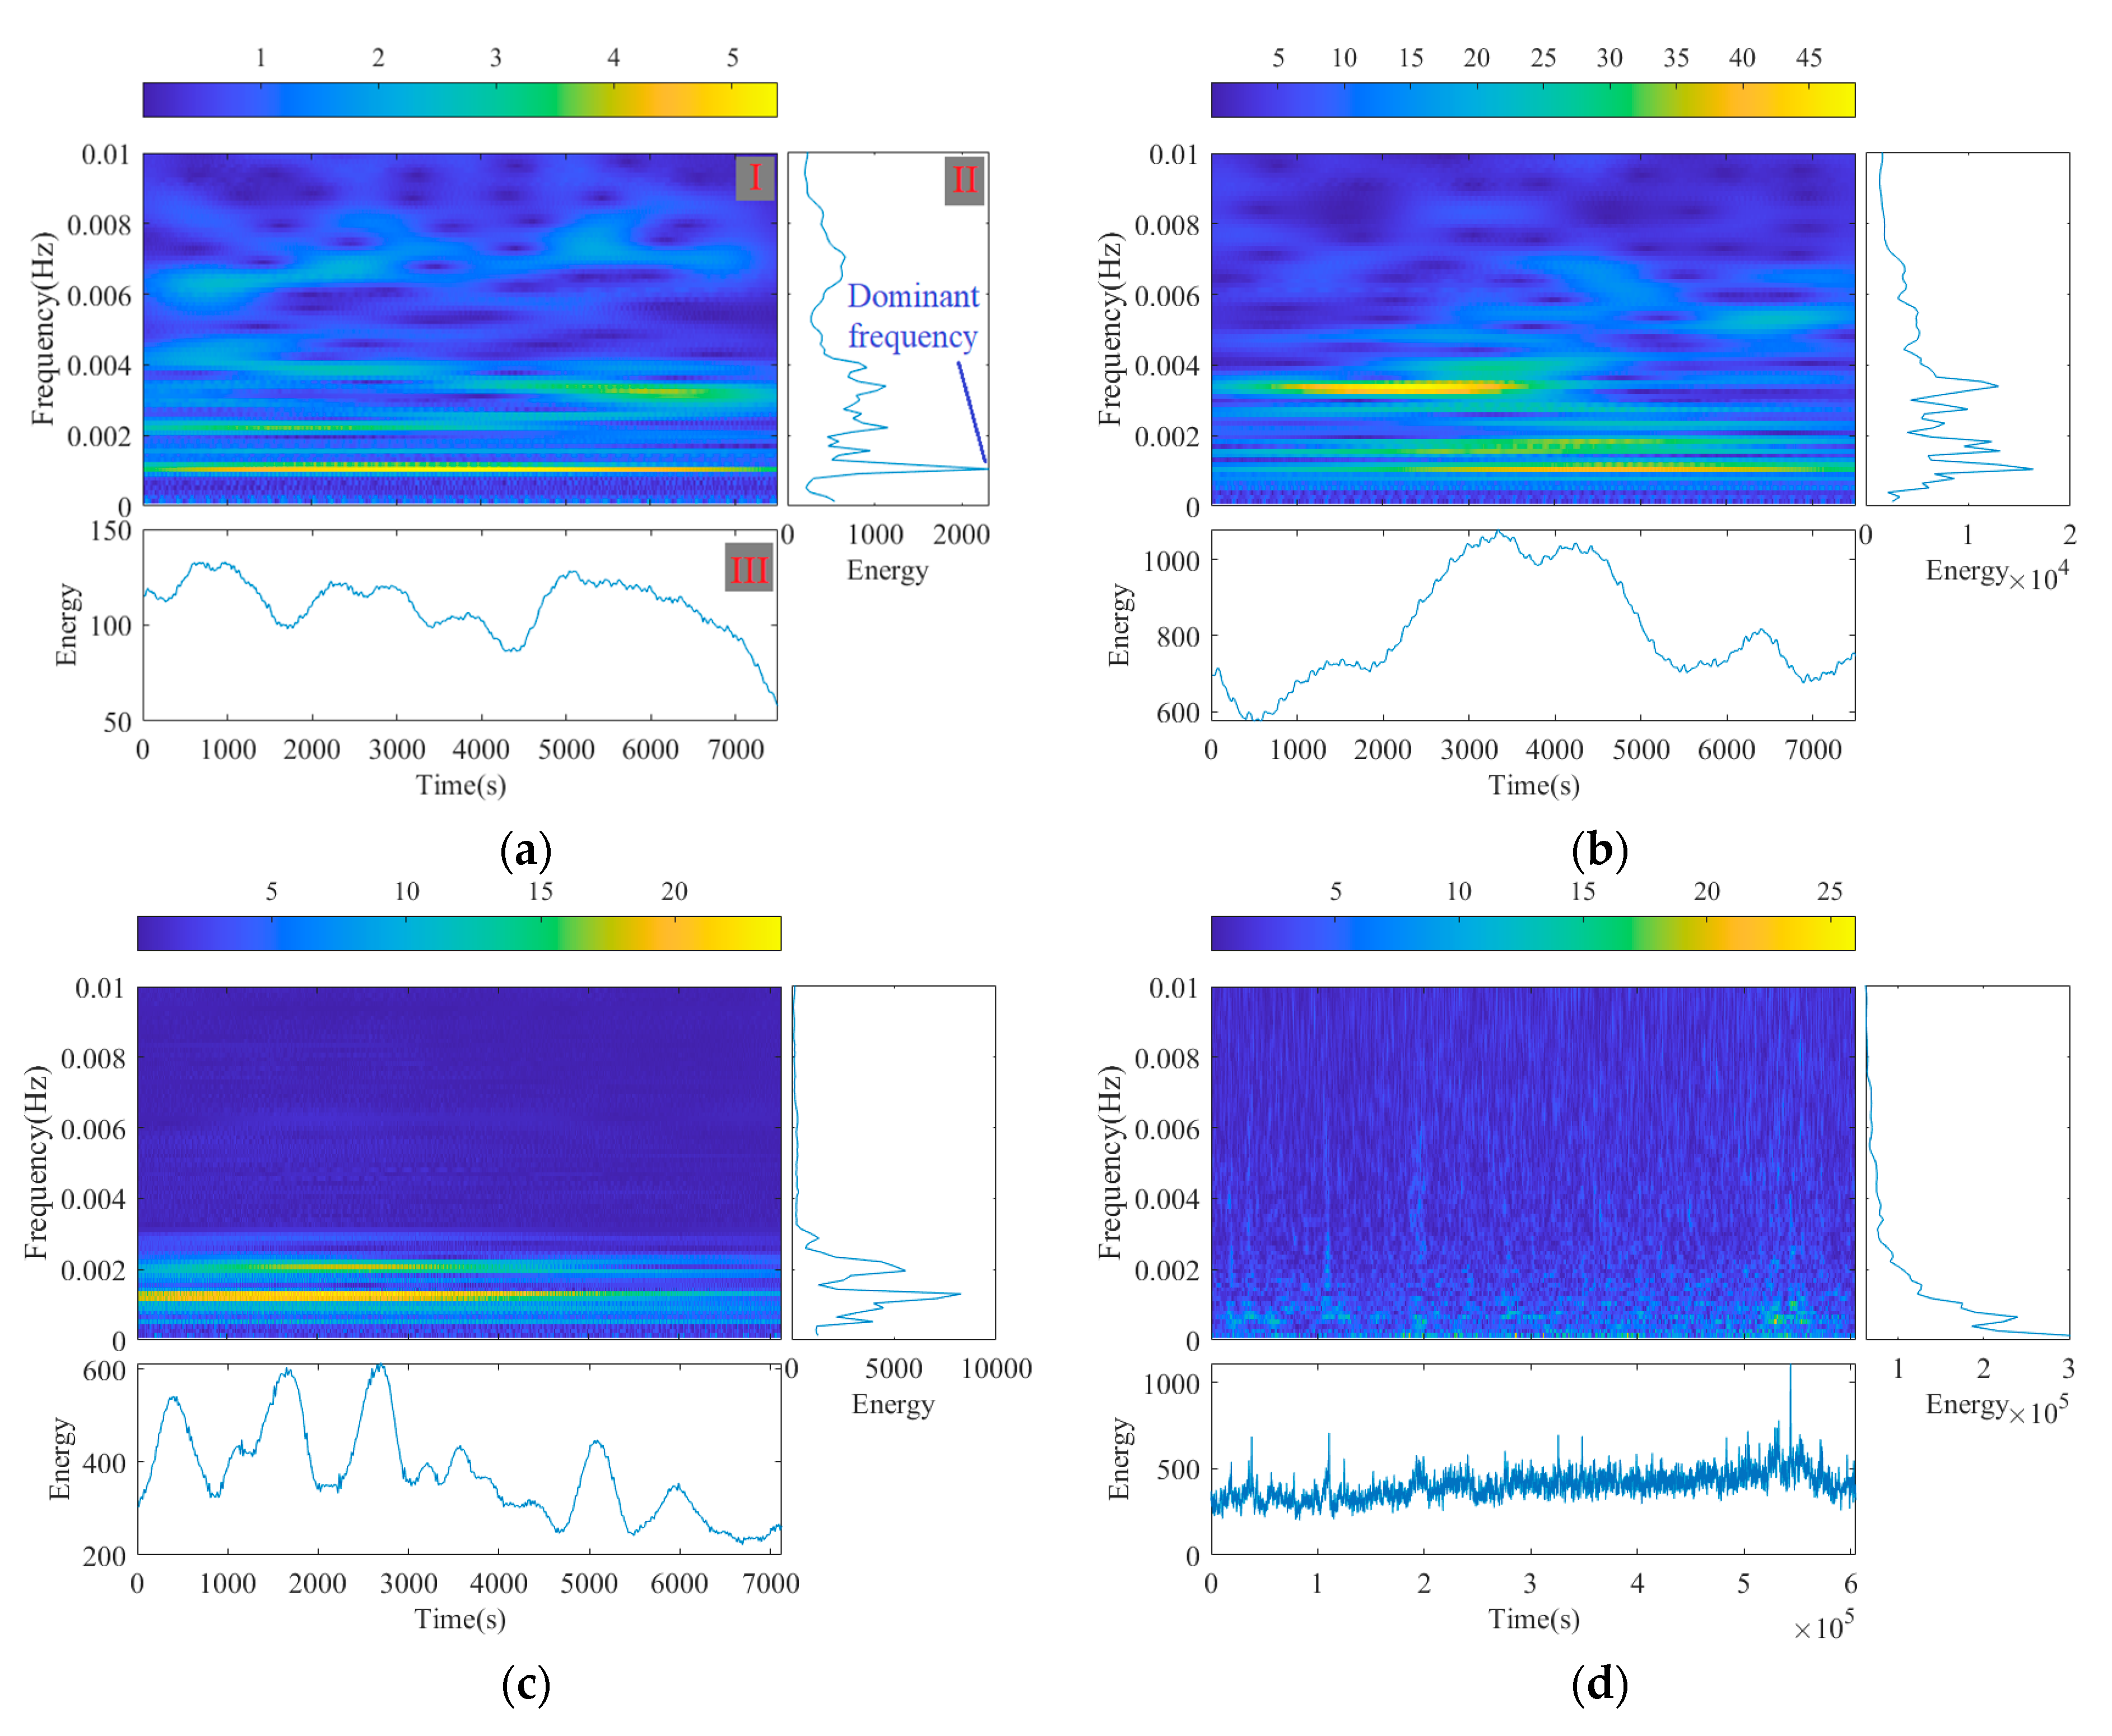
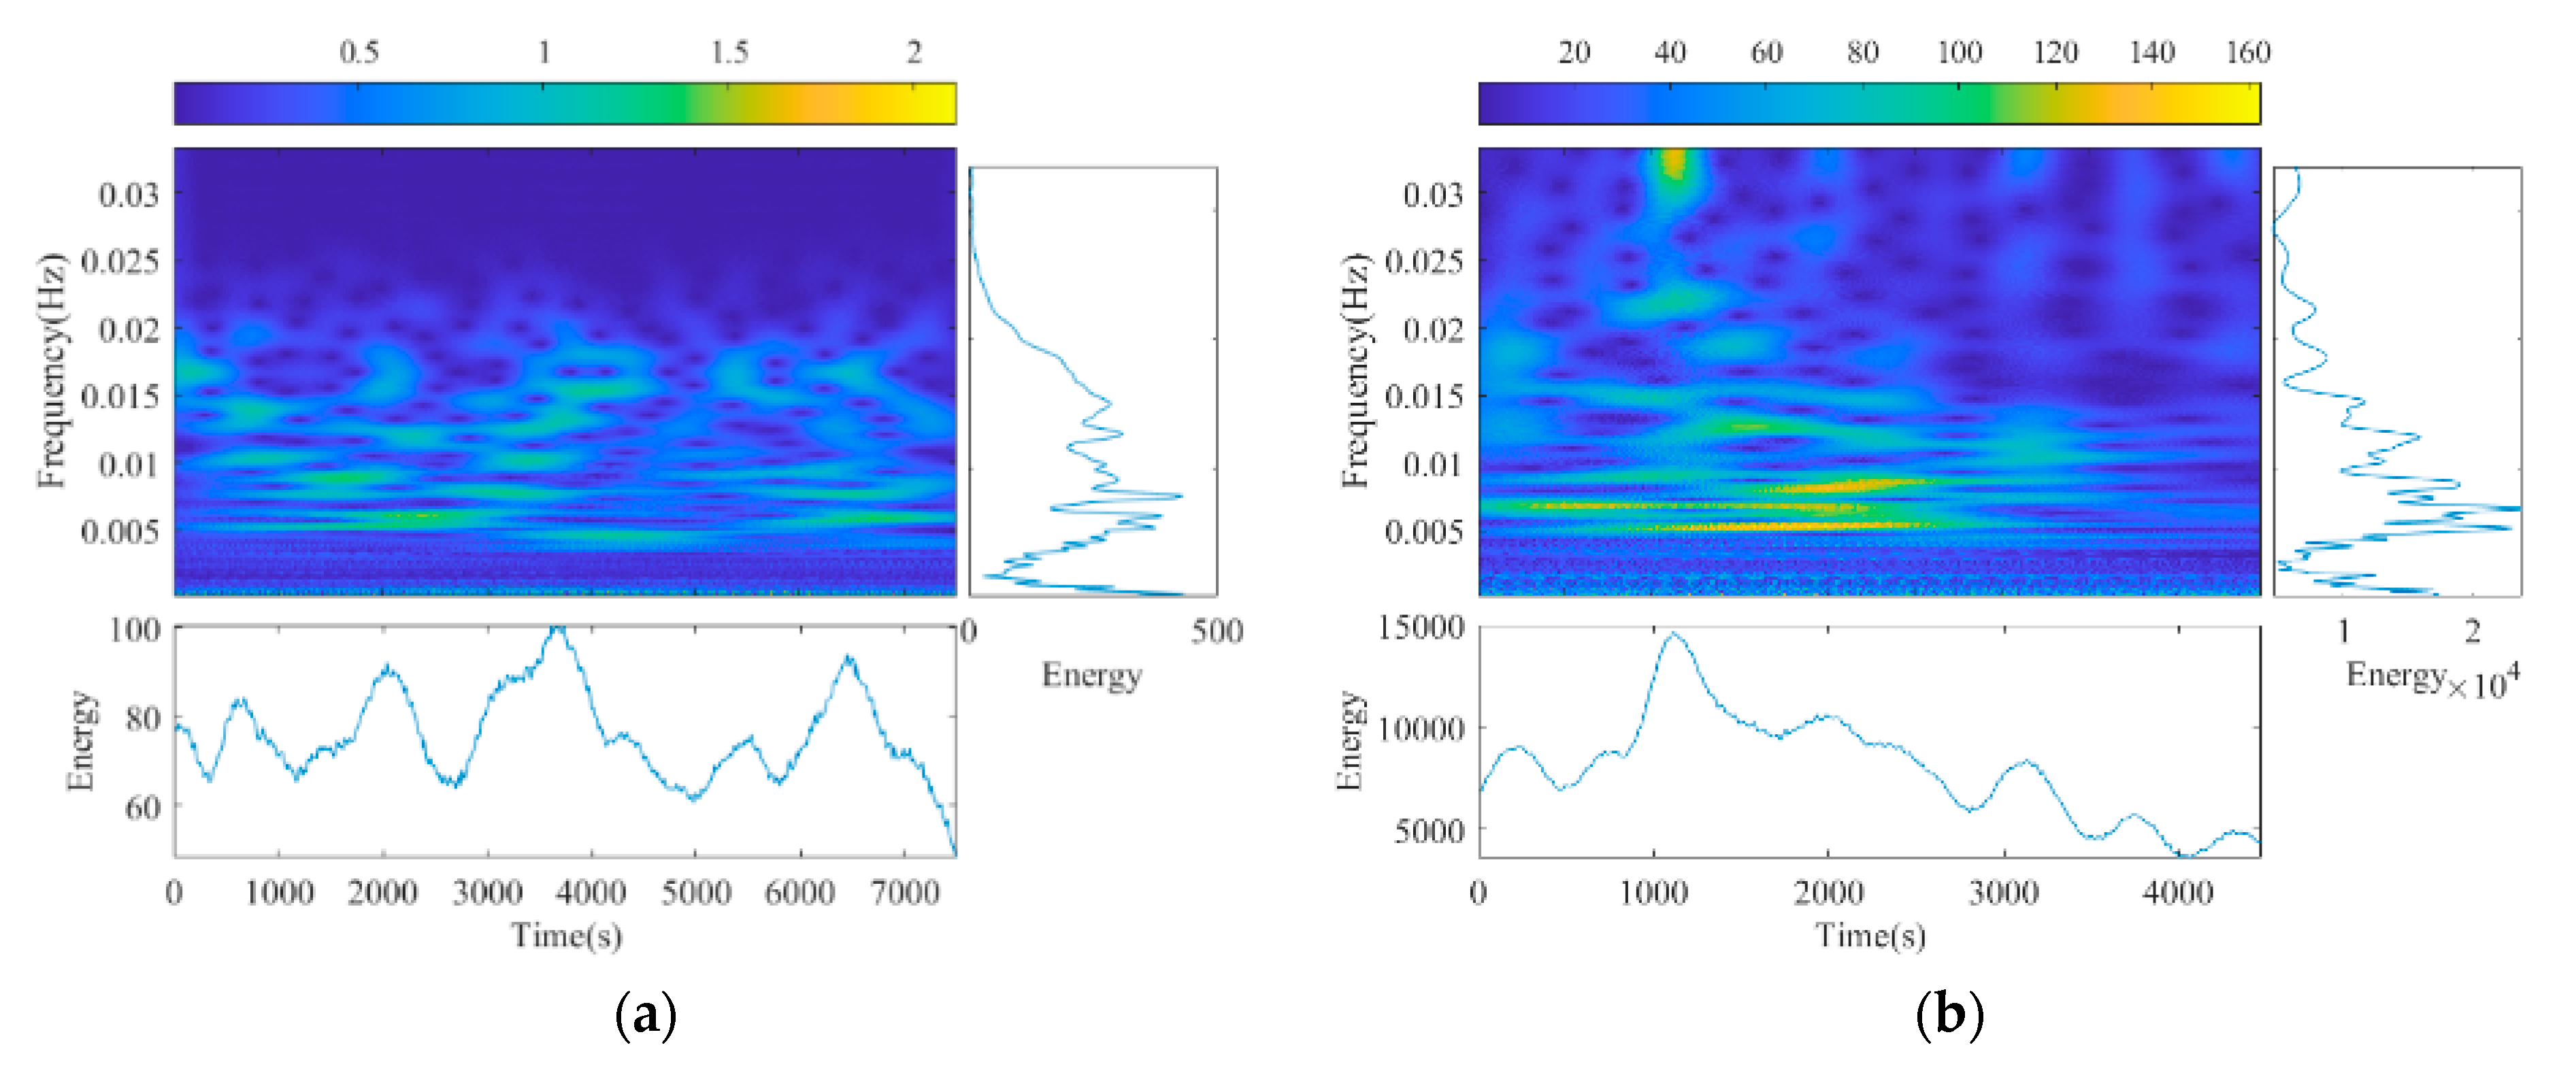
For the time-frequency plane of EMR signals, the environmental noise has obvious frequency component around 0.001 Hz throughout the entire time period, while the energy distribution of other frequency components is very scattered. The drilling signal has a wider frequency distribution range without obvious peak frequency, but there are some local high-energy zones, which are mainly related to the coal and rock fracture and gas emission during the drilling process. The signal caused by a scraper loader is relatively concentrated in the frequency range 0–0.003 Hz, and there are two obvious high-energy bands appearance through the entire time period. For the danger signal caused by coal and rock fractures, the obvious feature is that there are no obvious high-energy zones in the time-frequency plane, which is different from other interference signals.
(3)
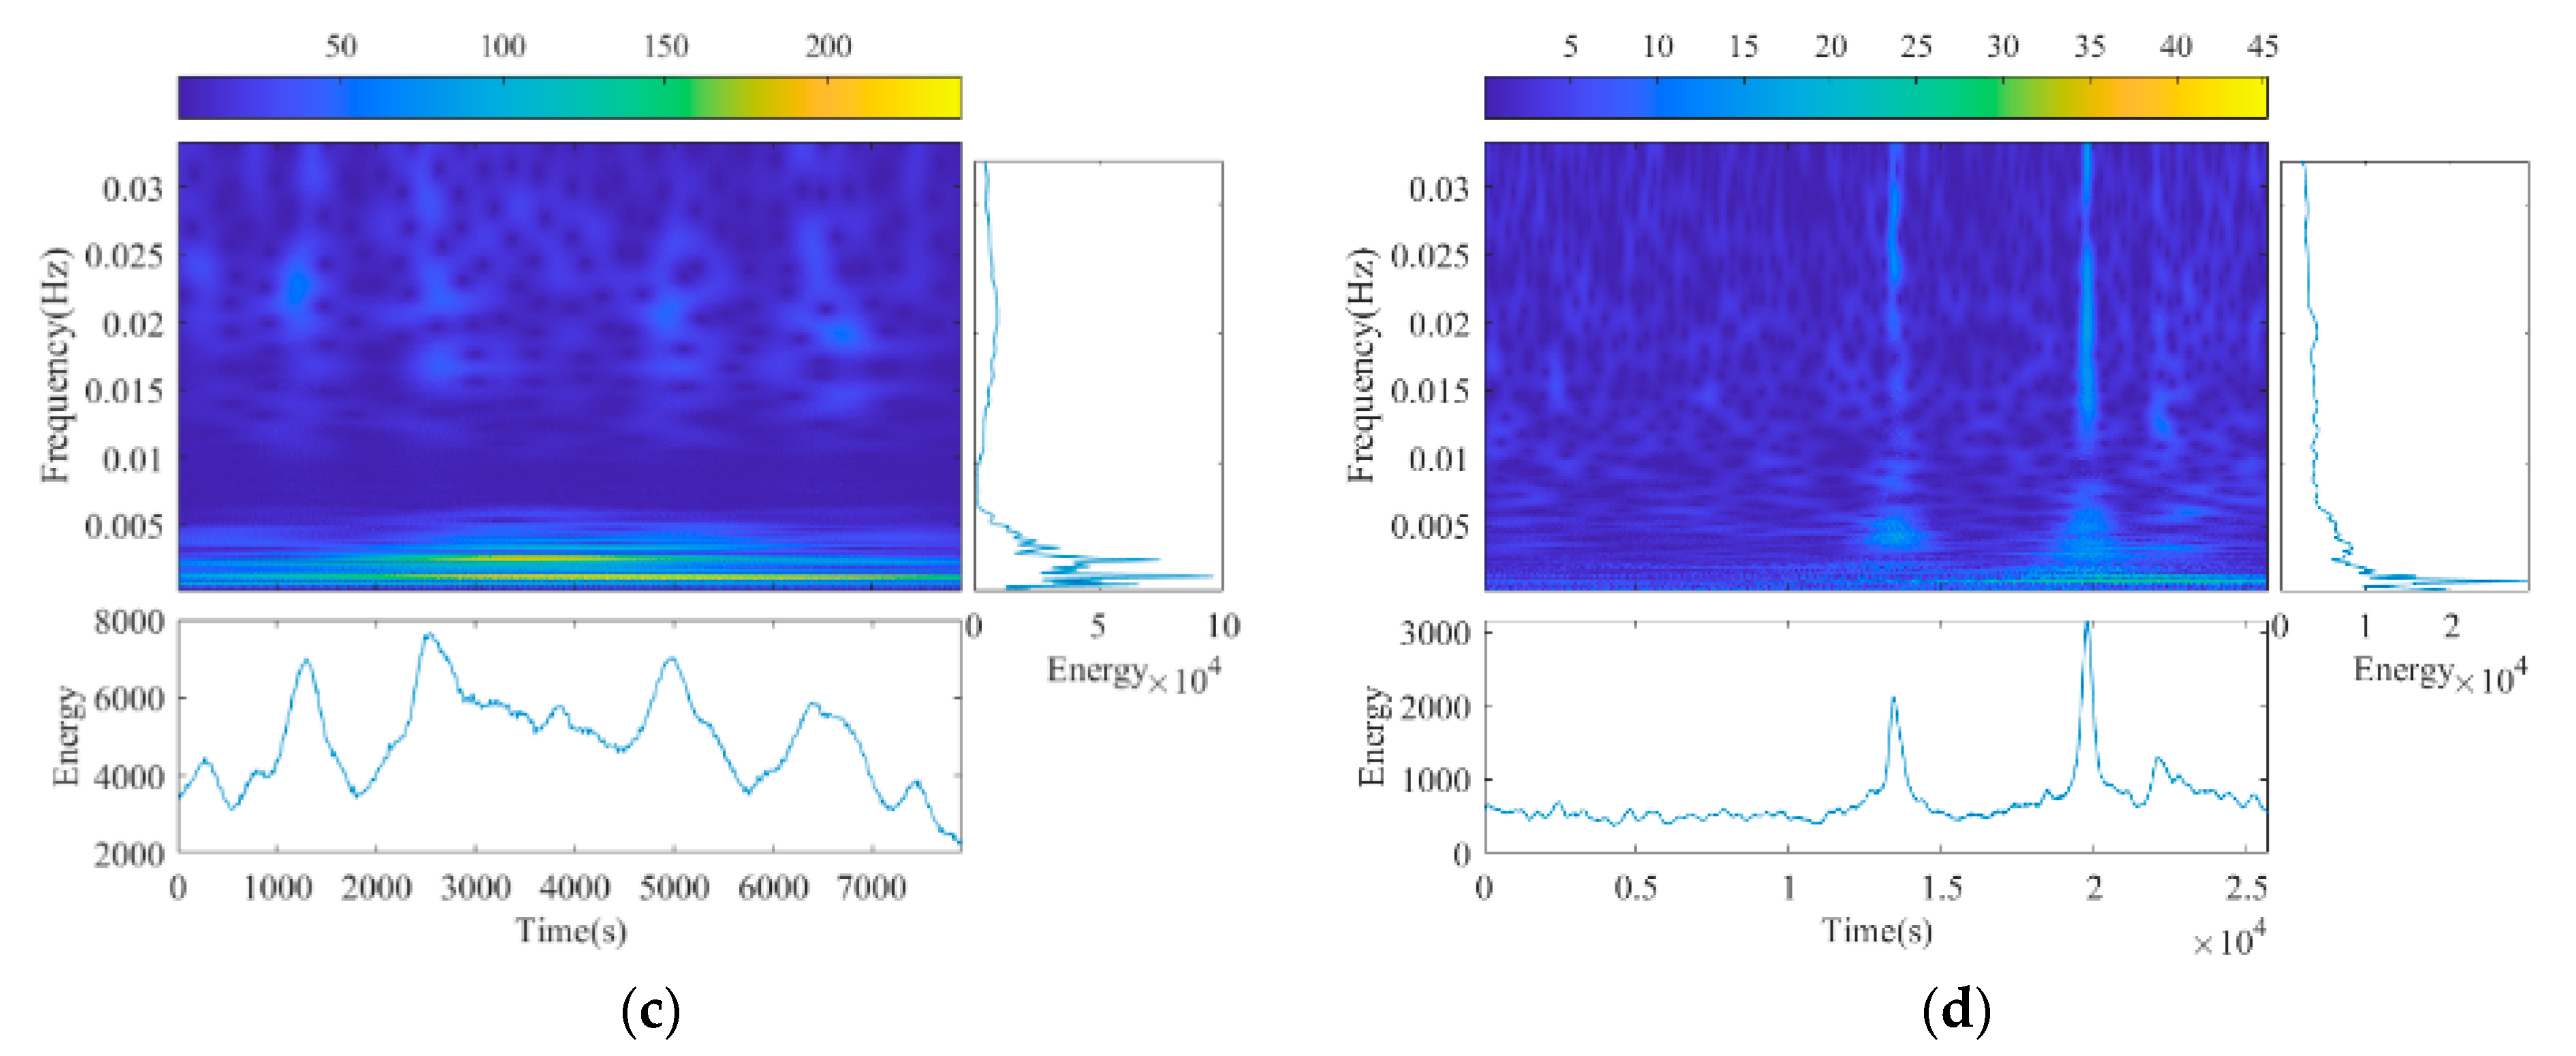
For the time-frequency plane of AE signals, the energy of environmental noise is relatively scattered in the frequency range (0.005–0.02 Hz) without obvious peak frequency. For the interference signal caused by drilling, there are local high-energy zones in both low frequency (0.005–0.01 Hz) and high frequency (0.03–0.033 Hz), and the duration of the high-frequency zone is shorter. For the interference signal caused by the scraper loader, in addition to two obvious energy bands in the time-frequency plane (below 0.003 Hz), there are also scattered energy distributed in other frequency components (0.01–0.033 Hz). For the danger signal caused by coal and rock fracture, there are no obvious high-energy zones.
(4)
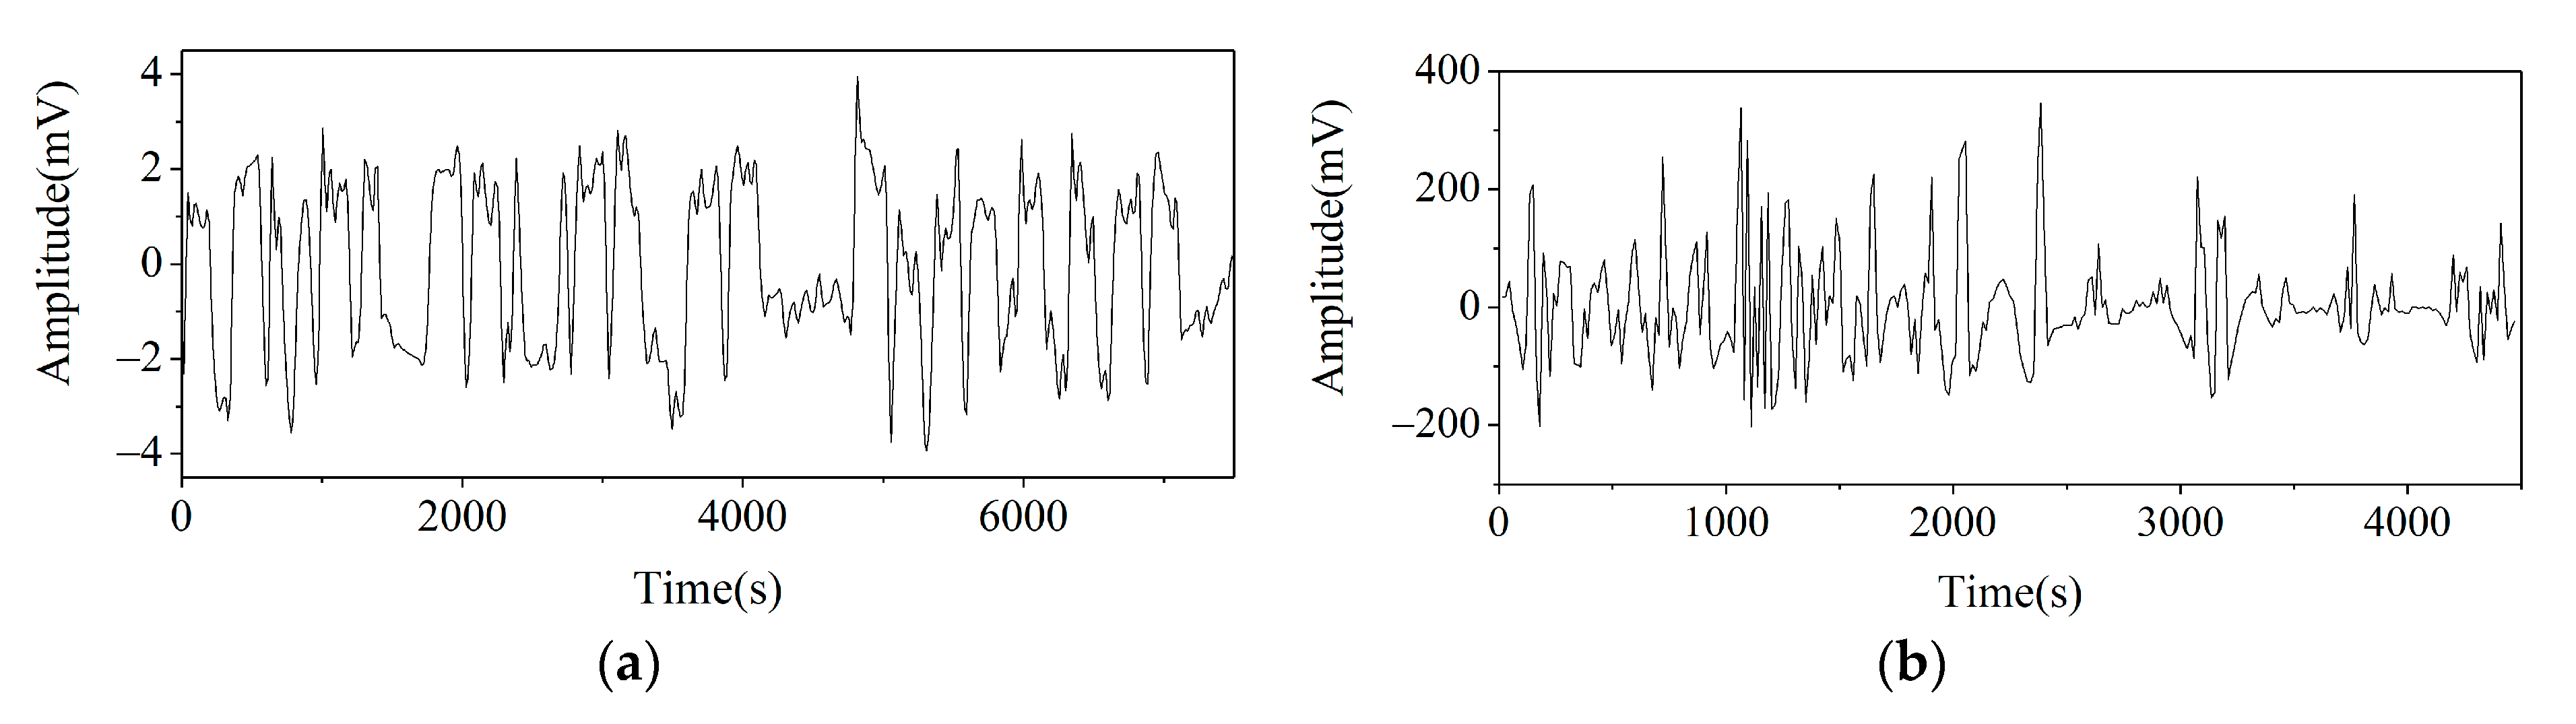
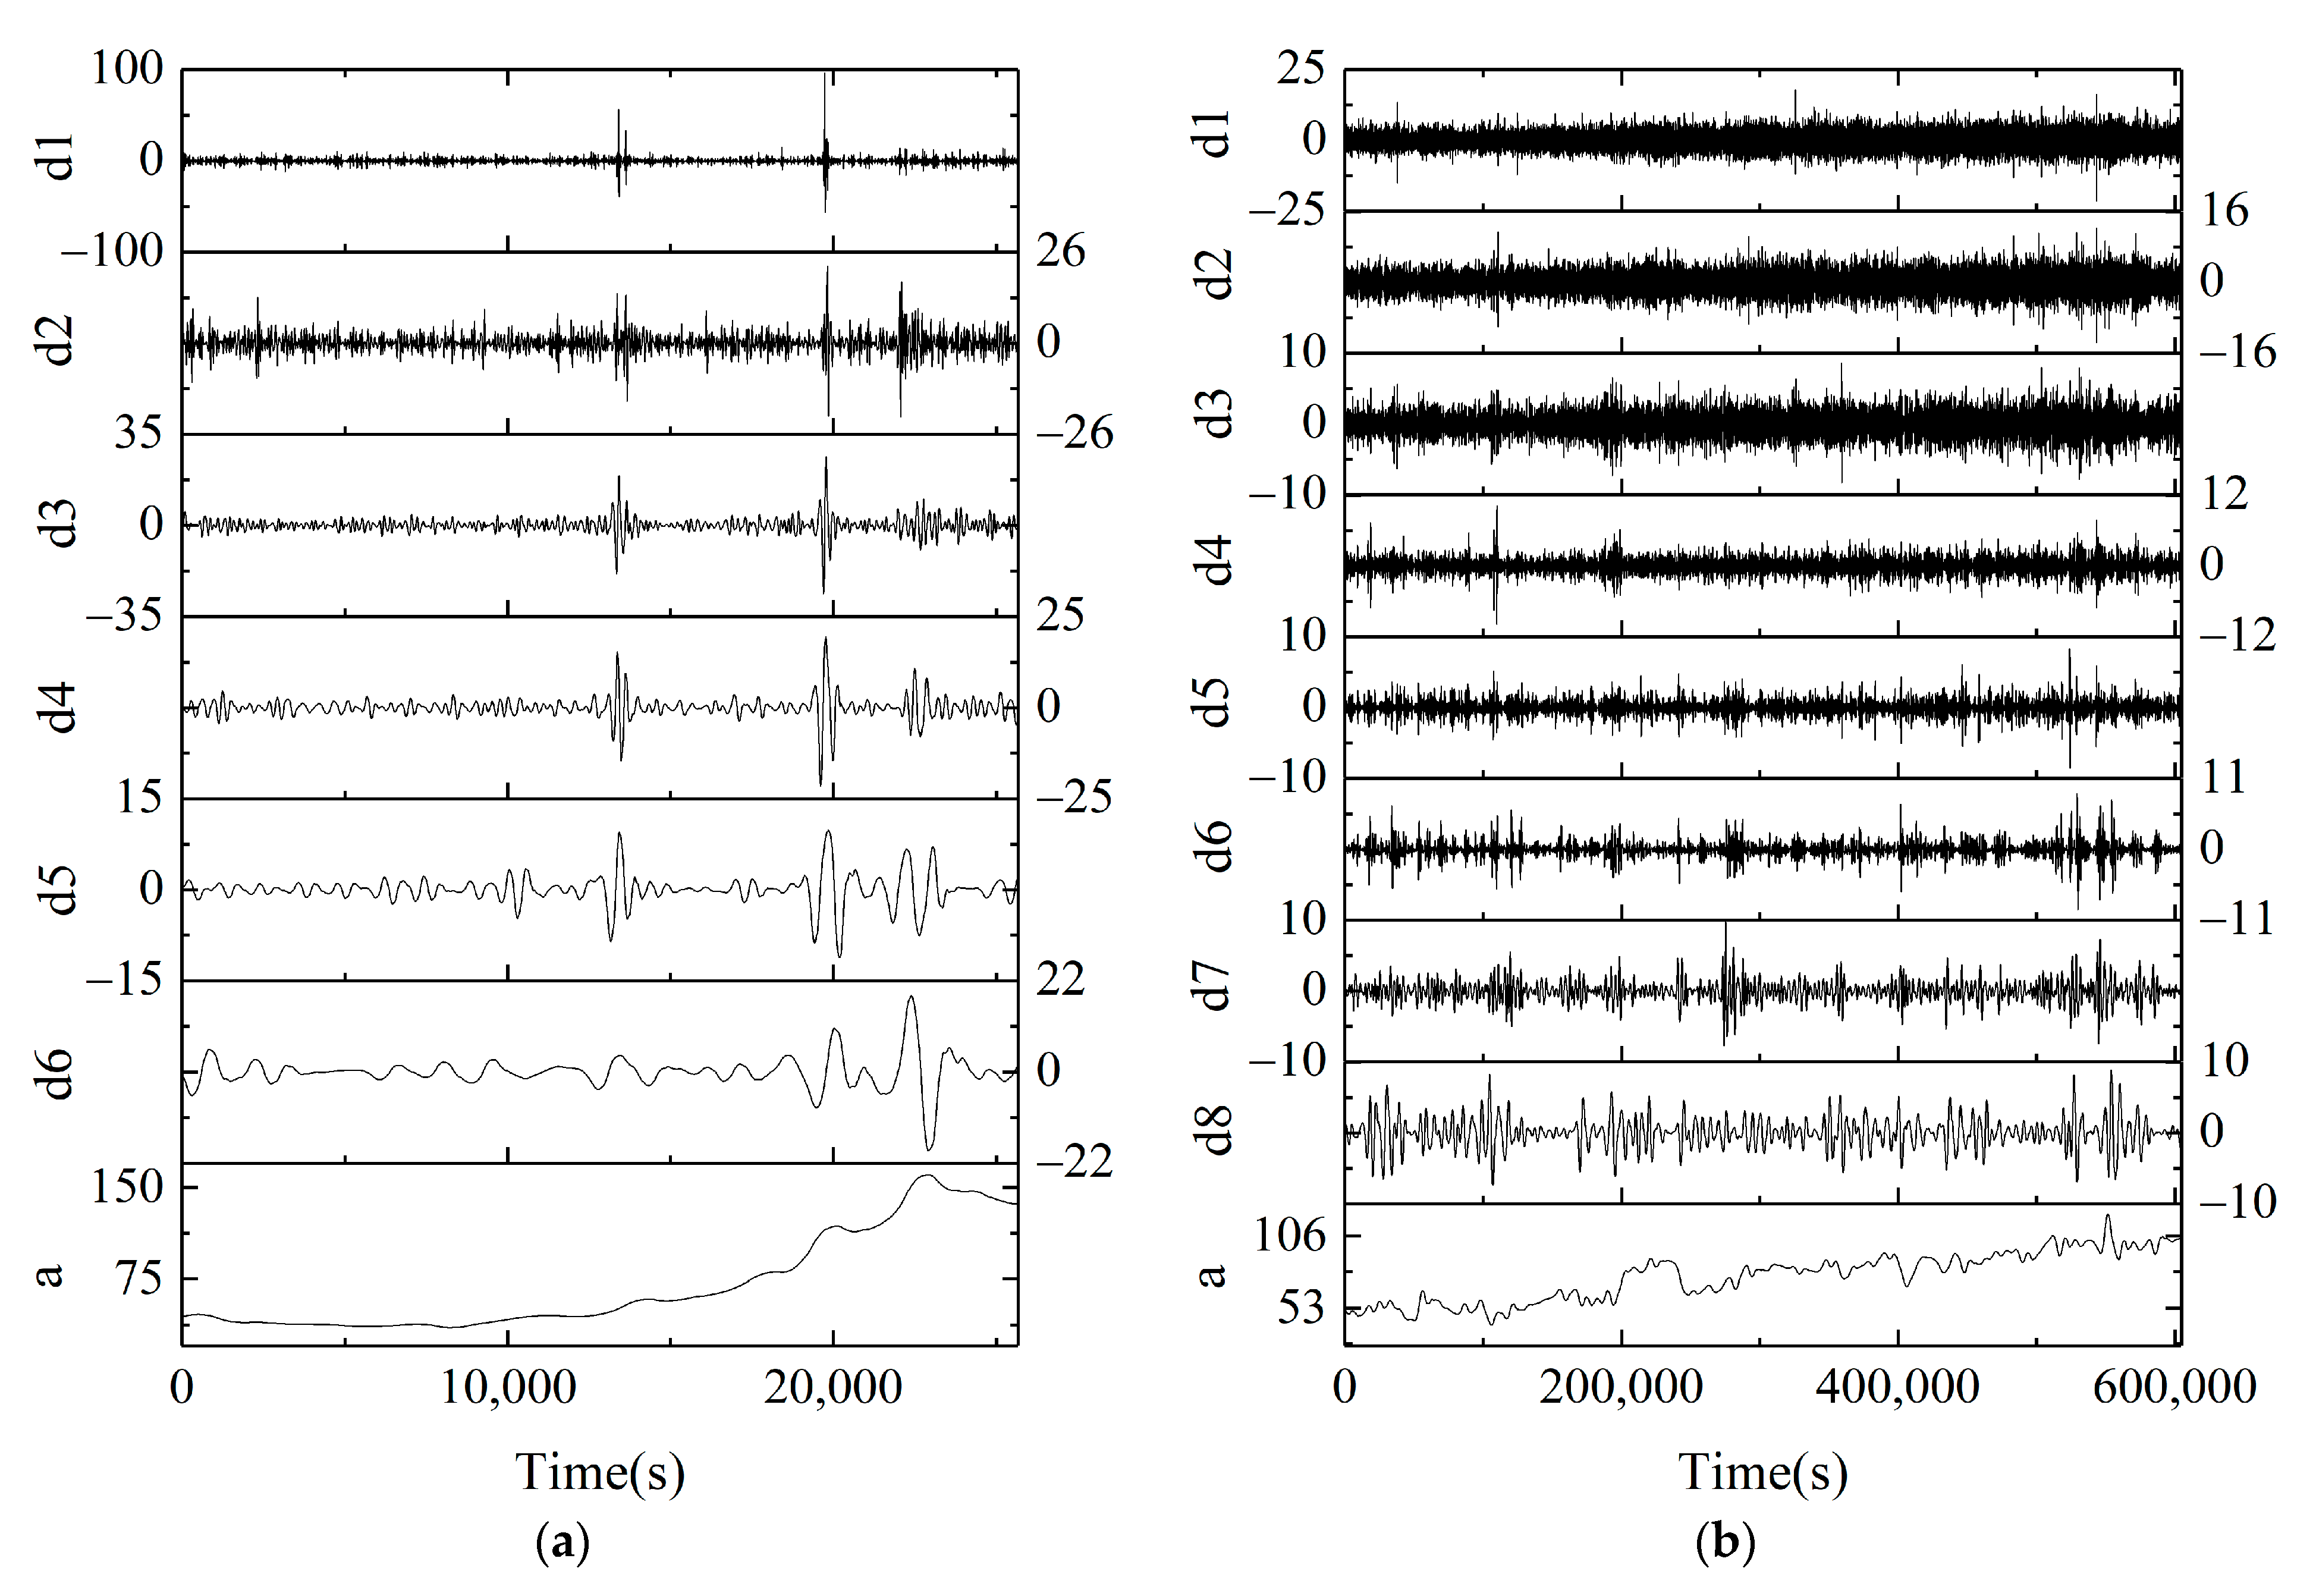
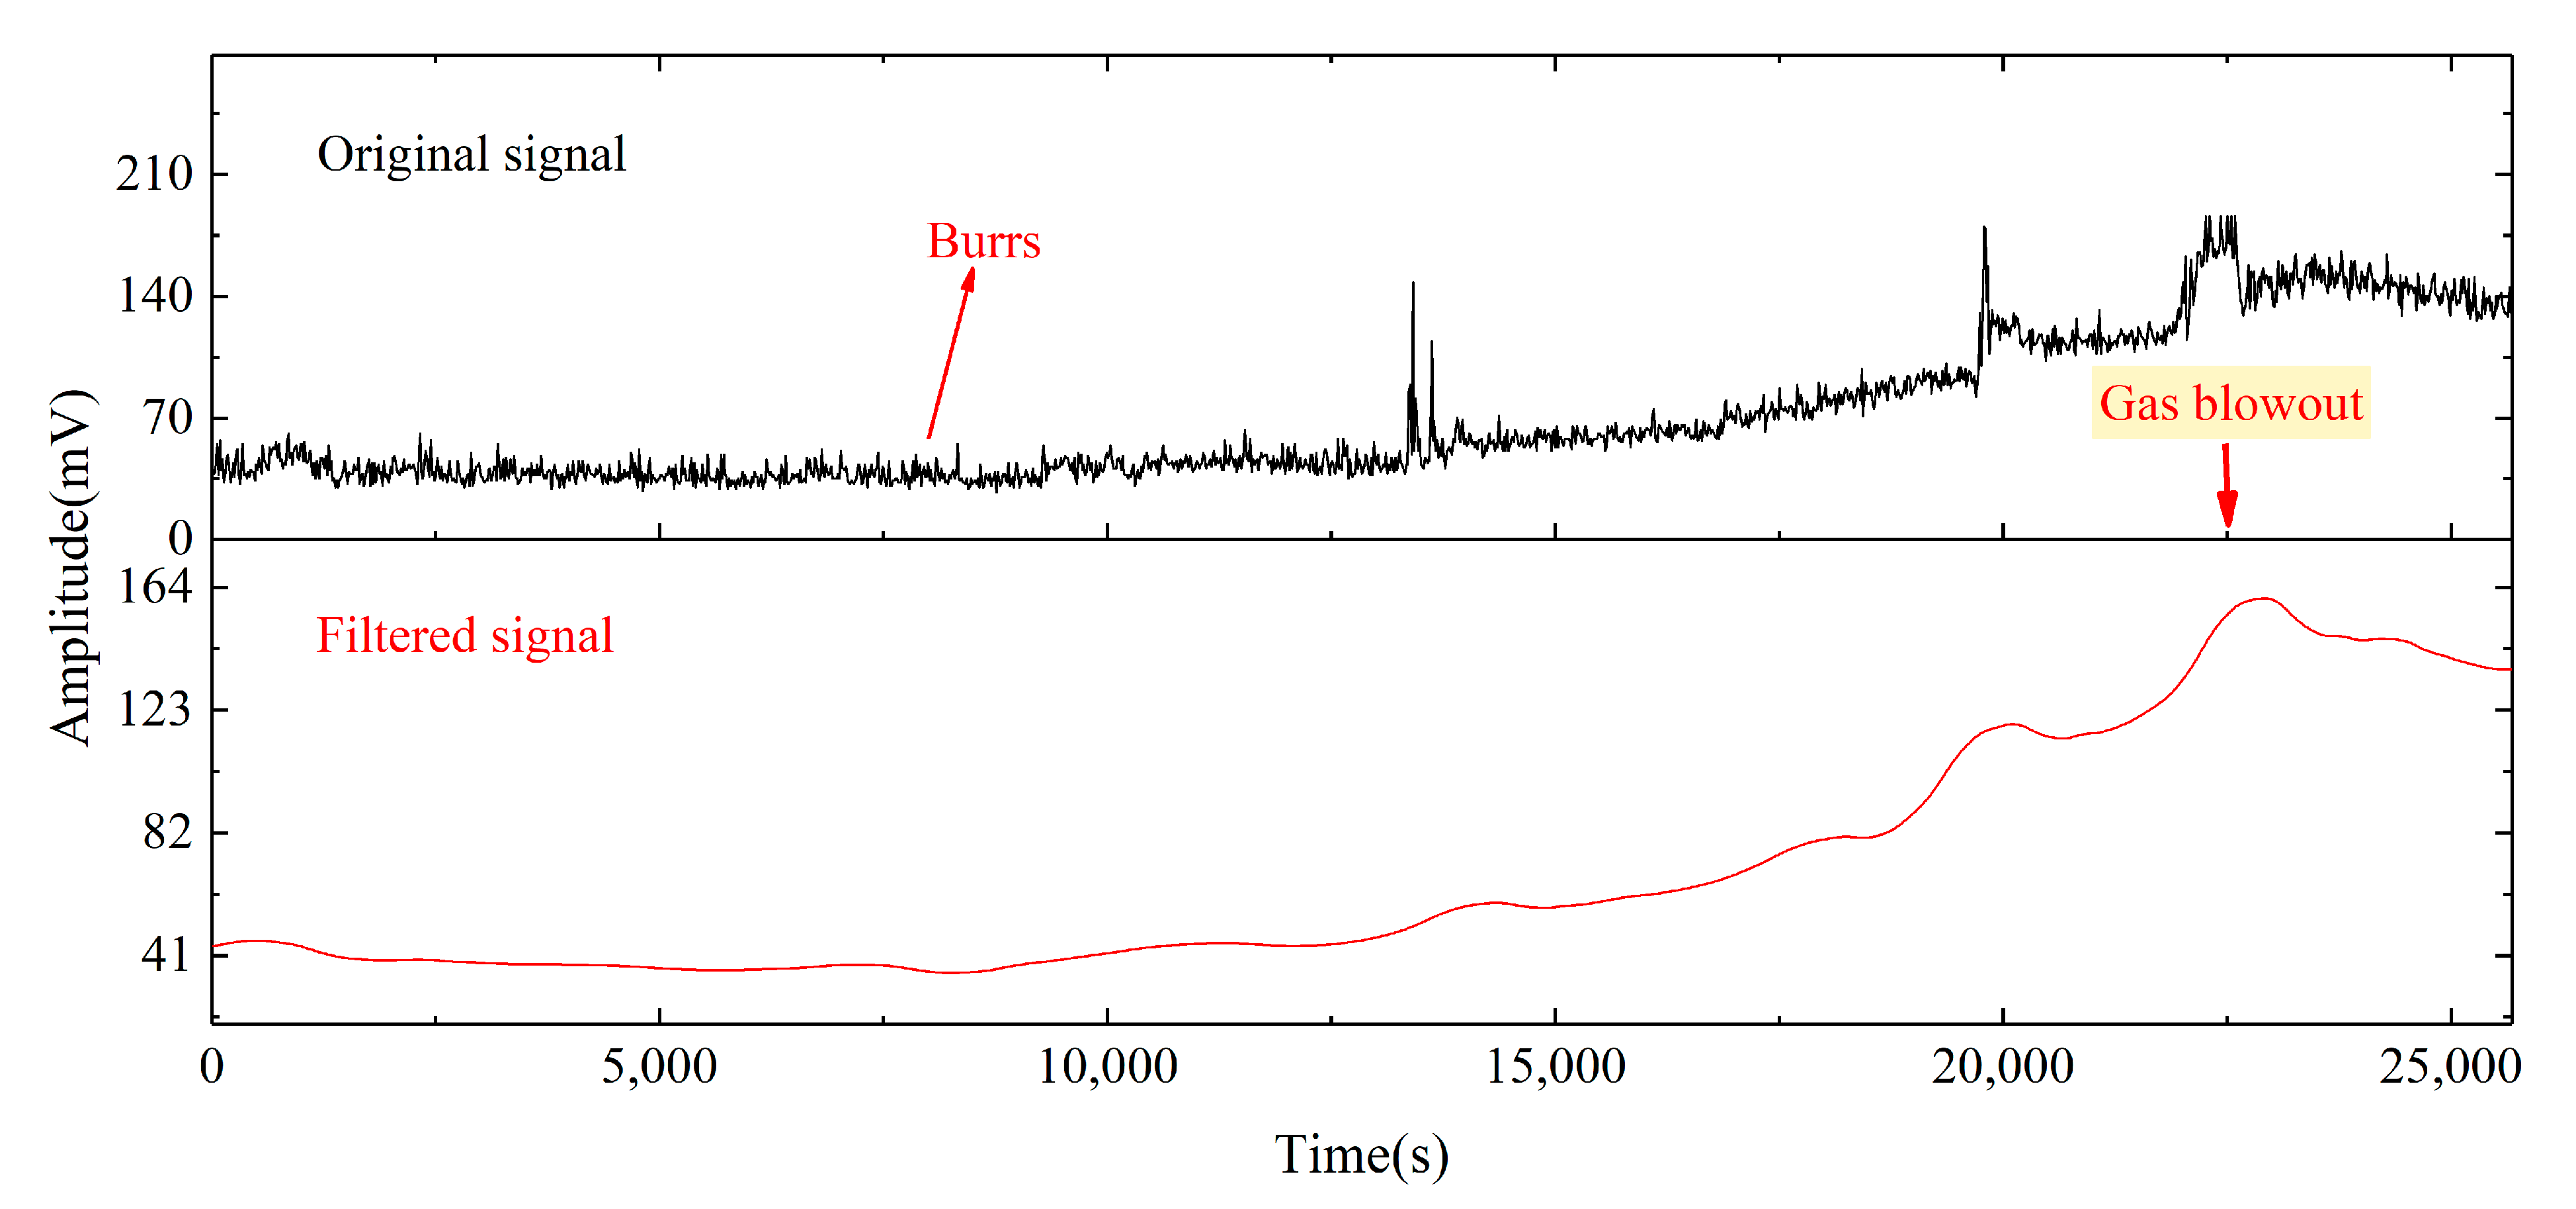
WT can be used to filter the AE and EMR signals. In the result of wavelet decomposition, the final component signal mainly shows the main change trend of the original signal and can be used as a filtered signal. After comparing the original signal with the filtered signal, it is found that the burr of the filtered signal is significantly reduced, and the curve is smoother.
(5)
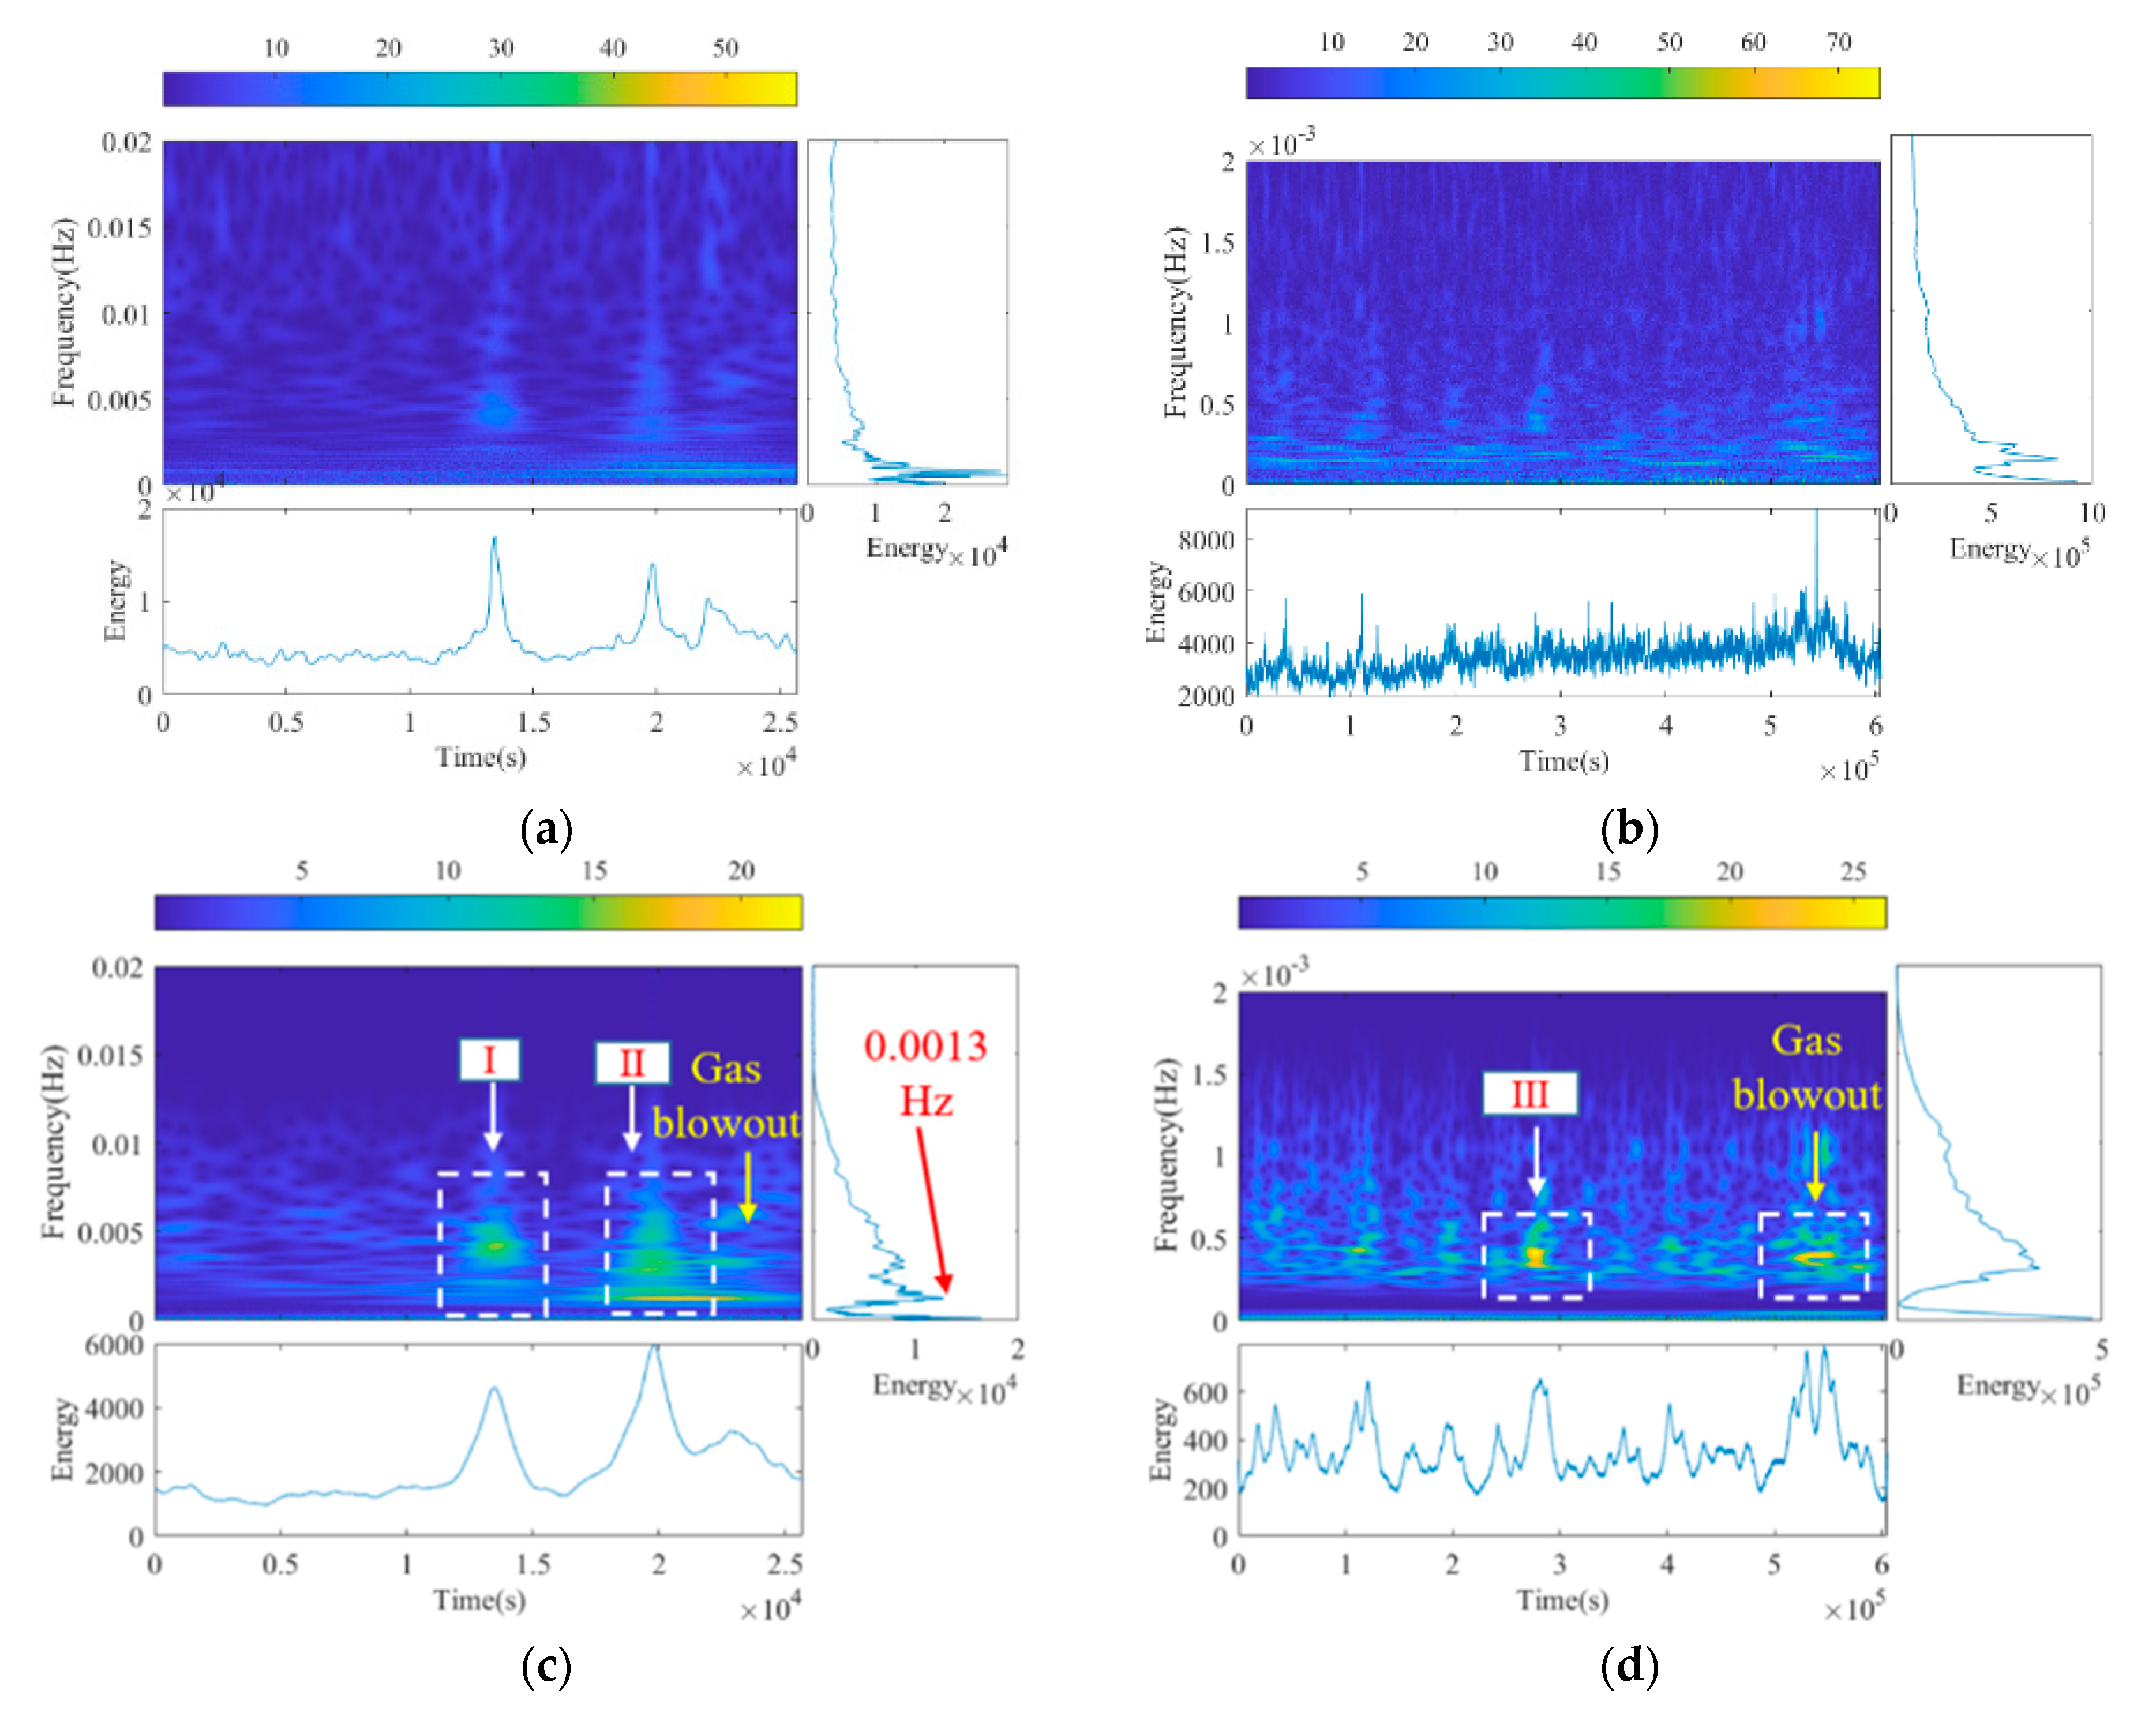
Either for AE or EMR signals, there are obvious low-frequency and high-energy zones appearance before the occurrence of coal and rock dynamic disaster, which can be regarded as a precursor information. This is very important for the early warning of coal and gas outburst. Moreover, the frequency corresponding to this area is related to the fracture strength of coal rock. The higher the fracture strength of coal rock, the lower the frequency.

Author Contributions

B.L.: methodology, software, formal analysis, writing—original draft preparation. Z.L.: conceptualization, resources, funding acquisition. E.W.: funding acquisition, project administration, supervision. N.L.: visualization, validation. J.H.: data curation, validation. Y.J.: investigation, visualization. Y.N.: writing—reviewing and editing. All authors have read and agreed to the published version of the manuscript.

Funding

This work is supported by the National Natural Science Foundation of China (52074280, 51934007, 51874296, 5210040424), the Major Scientific and Technological Innovation Program in Shandong Province (2019JZZY020505), a Project Funded by the Priority Academic Program Development of Jiangsu Higher Education Institutions (PAPD), and the Natural Science Foundation of Jiangsu Province (BK20190080).

Data Availability Statement

Not applicable.

Acknowledgments

The authors would like to thank the reviewers and editors who presented critical and constructive comments for the improvement of this paper.

Conflicts of Interest

The authors declare no conflict of interest.

References

  1. Wold, M.; Connell, L.; Choi, S. The role of spatial variability in coal seam parameters on gas outburst behaviour during coal mining. Int. J. Coal Geol. 2008, 75, 1–14. [Google Scholar] [CrossRef]
  2. Li, J.; Guo, P.; Cui, H.; Song, S.; Zhao, W.; Chu, J.; Xie, W. Dynamic Response Mechanism of Impact Instability Induced by Dynamic Load Disturbance to Surrounding Rock in High Static Loading Roadway. Minerals 2021, 11, 971. [Google Scholar] [CrossRef]
  3. Kong, X.G.; Li, S.G.; Wang, E.Y.; Wang, X.; Zhou, Y.X.; Ji, P.F.; Shuang, H.Q.; Li, S.R.; Wei, Z.Y. Experimental and nu-merical investigations on dynamic mechanical responses and failure process of gas-bearing coal under impact load. Soil Dyn. Earthq. Eng. 2021, 142, 106579. [Google Scholar] [CrossRef]
  4. Zheng, Z.; Xu, Y.; Li, D.; Dong, J. Numerical Analysis and Experimental Study of Hard Roofs in Fully Mechanized Mining Faces under Sleeve Fracturing. Minerals 2015, 5, 758–777. [Google Scholar] [CrossRef]
  5. Li, J.; Hu, Q.; Yu, M.; Li, X.; Hu, J.; Yang, H. Acoustic emission monitoring technology for coal and gas outburst. Energy Sci. Eng. 2019, 7, 443–456. [Google Scholar] [CrossRef] [Green Version]
  6. Mansurov, V. Prediction of rockbursts by analysis of induced seismicity data. Int. J. Rock Mech. Min. Sci. 2001, 38, 893–901. [Google Scholar] [CrossRef]
  7. Si, G.Y.; Cai, W.; Wang, S.Y.; Li, X. Prediction of Relatively High-Energy Seismic Events Using Spatial-Temporal Para-metrisation of Mining-Induced Seismicity. Rock Mech. Rock Eng. 2020, 53, 5111–5132. [Google Scholar] [CrossRef]
  8. Brady, B.T. Anomalous seismicity prior to rock bursts: Implications for earthquake prediction. Pure Appl. Geophys. PAGEOPH 1977, 115, 357–374. [Google Scholar] [CrossRef]
  9. Cai, W.; Dou, L.; Zhang, M.; Cao, W.; Shi, J.-Q.; Feng, L. A fuzzy comprehensive evaluation methodology for rock burst forecasting using microseismic monitoring. Tunn. Undergr. Space Technol. 2018, 80, 232–245. [Google Scholar] [CrossRef]
  10. Li, B.; Li, N.; Wang, E.; Li, X.; Niu, Y.; Zhang, X. Characteristics of coal mining microseismic and blasting signals at Qianqiu coal mine. Environ. Earth Sci. 2017, 76, 722. [Google Scholar] [CrossRef]
  11. Ge, M. Efficient mine microseismic monitoring. Int. J. Coal Geol. 2005, 64, 44–56. [Google Scholar] [CrossRef]
  12. Cao, A.Y.; Dou, L.M.; Luo, X.; Zheng, Y.D.; Huang, J.L.; Andrew, K. Seismic effort of blasting wave transmitted in coal-rock mass associated with mining operation. J. Cent. South Univ. 2012, 19, 2604–2610. [Google Scholar] [CrossRef]
  13. Wang, E.Y.; He, X.Q.; Dou, L.M.; Zhou, S.N.; Nie, B.S.; Liu, Z.T. Electromagnetic radiation characteristics of coal and rocks during excavation in coal mine and their application. Chin. J. Geophys. 2005, 48, 216–221. [Google Scholar] [CrossRef]
  14. Koktavy, P.; Pavelka, J.; Sikula, J. Characterization of acoustic and electromagnetic emission sources. Meas. Sci. Technol. 2004, 15, 973–977. [Google Scholar] [CrossRef]
  15. Frid, V.; Vozoff, K. Electromagnetic radiation induced by mining rock failure. Int. J. Coal Geol. 2005, 64, 57–65. [Google Scholar] [CrossRef]
  16. Potirakis, S.M.; Mastrogiannis, D. Critical features revealed in acoustic and electromagnetic emissions during fracture experiments on LiF. Phys. A Stat. Mech. Appl. 2017, 485, 11–22. [Google Scholar] [CrossRef]
  17. Sedlak, P.; Sikula, J.; Lokajíček, T.; Mori, Y. Acoustic and electromagnetic emission as a tool for crack localization. Meas. Sci. Technol. 2008, 19, 045701. [Google Scholar] [CrossRef]
  18. Lacidogna, G.; Carpinteri, A.; Manuello, A.; Durin, G.; Schiavi, A.; Niccolini, G.; Agosto, A. Acoustic and Electromagnetic Emissions as Precursor Phenomena in Failure Processes. Strain 2010, 47, 144–152. [Google Scholar] [CrossRef]
  19. Frid, V. Electromagnetic radiation method for rock and gas outburst forecast. J. Appl. Geophys. 1997, 38, 97–104. [Google Scholar] [CrossRef]
  20. Li, Z.; Niu, Y.; Wang, E.; Liu, L.; Wang, H.; Wang, M.; Ali, M. Experimental Study on Electric Potential Response Characteristics of Gas-Bearing Coal During Deformation and Fracturing Process. Processes 2019, 7, 72. [Google Scholar] [CrossRef] [Green Version]
  21. Liu, G.J.; Lu, C.P.; Wang, H.Y.; Liu, P.F.; Liu, Y. Warning method of coal bursting failure danger by electromagnetic radiation. Shock. Vib. 2015, 2015, 583862. [Google Scholar] [CrossRef]
  22. Wang, E.Y.; He, X.Q.; Liu, X.F.; Li, Z.H.; Wang, C.; Xiao, D. A non-contact mine pressure evaluation method by electro-magnetic radiation. J. Appl. Geophys. 2011, 75, 338–344. [Google Scholar] [CrossRef]
  23. Qiu, L.; Liu, Z.; Wang, E.; He, X.; Feng, J.; Li, B. Early-warning of rock burst in coal mine by low-frequency electromagnetic radiation. Eng. Geol. 2020, 279, 105755. [Google Scholar] [CrossRef]
  24. Qiu, L.; Song, D.; Li, Z.; Liu, B.; Liu, J. Research on AE and EMR response law of the driving face passing through the fault. Saf. Sci. 2019, 117, 184–193. [Google Scholar] [CrossRef]
  25. Zhao, F.; Li, Y.; Ye, Z.; Fan, Y.; Zhang, S.; Wang, H.; Liu, Y. Research on Acoustic Emission and Electromagnetic Emission Characteristics of Rock Fragmentation at Different Loading Rates. Shock. Vib. 2018, 2018, 1–8. [Google Scholar] [CrossRef] [Green Version]
  26. He, X.-Q.; Zhou, C.; Song, D.-Z.; Li, Z.-L.; Cao, A.-Y.; He, S.-Q.; Khan, M. Mechanism and monitoring and early warning technology for rockburst in coal mines. Int. J. Miner. Met. Mater. 2021, 28, 1097–1111. [Google Scholar] [CrossRef]
  27. Li, X.; Chen, S.; Wang, E.; Li, Z. Rockburst mechanism in coal rock with structural surface and the microseismic (MS) and electromagnetic radiation (EMR) response. Eng. Fail. Anal. 2021, 124, 105396. [Google Scholar] [CrossRef]
  28. Wang, E.; He, X.; Wei, J.; Nie, B.; Song, D. Electromagnetic emission graded warning model and its applications against coal rock dynamic collapses. Int. J. Rock Mech. Min. Sci. 2011, 48, 556–564. [Google Scholar] [CrossRef]
  29. Rabinovitch, A.; Bahat, D.; Frid, V. Similarity and dissimilarity of electromagnetic radiation from carbonate rocks under compression, drilling and blasting. Int. J. Rock Mech. Min. Sci. 2002, 39, 125–129. [Google Scholar] [CrossRef]
  30. Zhu, C.W.; Nie, B.S. Spectrum and Energy Distribution Characteristic of Electromagnetic Emission Signals during Fracture of Coal. Procedia Eng. 2011, 26, 1447–1455. [Google Scholar]
  31. Qiu, L.; Li, Z.; Wang, E.; Liu, Z.; Ou, J.; Li, X.; Ali, M.; Zhang, Y.; Xia, S. Characteristics and precursor information of electromagnetic signals of mining-induced coal and gas outburst. J. Loss Prev. Process. Ind. 2018, 54, 206–215. [Google Scholar] [CrossRef]
  32. Zhang, W.; Li, C.; Huo, T.; Qu, X.; Xin, C. Vibration events in underground heading face and useful index for rock burst monitoring. Measurement 2021, 180, 109501. [Google Scholar] [CrossRef]
  33. Das, S.; Gupta, V.K. A wavelet-based parametric characterization of temporal features of earthquake accelerograms. Eng. Struct. 2011, 33, 2173–2185. [Google Scholar] [CrossRef]
  34. Majak, J.; Shvartsman, B.; Kirs, M.; Pohlak, M.; Herranen, H. Convergence theorem for the Haar wavelet based discretization method. Compos. Struct. 2015, 126, 227–232. [Google Scholar] [CrossRef]
  35. Huang, L.; Hao, H.; Li, X.; Li, J. Source identification of microseismic events in underground mines with interferometric imaging and cross wavelet transform. Tunn. Undergr. Space Technol. 2018, 71, 318–328. [Google Scholar] [CrossRef]
  36. Mousavi, S.M.; Langston, C.A.; Horton, S.P. Automatic microseismic denoising and onset detection using the syn-chrosqueezed continuous wavelet transform. Geophysics 2016, 81, 341–355. [Google Scholar] [CrossRef]
  37. Subasi, A. EEG signal classification using wavelet feature extraction and a mixture of expert model. Expert Syst. Appl. 2007, 32, 1084–1093. [Google Scholar] [CrossRef]
  38. Saravanan, N.; Ramachandran, K.I. Incipient gear box fault diagnosis using discrete wavelet transform (DWT) for feature extraction and classification using artificial neural network (ANN). Expert Syst. Appl. 2010, 37, 4168–4181. [Google Scholar] [CrossRef]
  39. Jasim, H.S.; Mustafa, T. Streamflow forecasting using four wavelet transformation combinations approaches with data-driven models: A comparative study. Water Resour. Manag. 2018, 32, 4661–4679. [Google Scholar]
  40. Kim, Y.Y.; Kim, E.-H. Effectiveness of the continuous wavelet transform in the analysis of some dispersive elastic waves. J. Acoust. Soc. Am. 2001, 110, 86–94. [Google Scholar] [CrossRef]
  41. Sinha, S.; Routh, P.S.; Anno, P.D.; Castagna, J.P. Spectral decomposition of seismic data with continuous-wavelet transform. Geophysics 2005, 70, P19–P25. [Google Scholar] [CrossRef]
  42. Liu, S.; Wang, D.; Li, T.; Chen, G.; Li, Z.; Peng, Q. Analysis of photonic Doppler velocimetry data based on the continuous wavelet transform. Rev. Sci. Instrum. 2011, 82, 23103. [Google Scholar] [CrossRef] [PubMed]
  43. Yu, C.; Yue, H.; Li, H.; Xia, X.; Liu, B. Scale model test study of influence of joints on blasting vibration attenuation. Bull. Int. Assoc. Eng. Geol. 2020, 80, 533–550. [Google Scholar] [CrossRef]
  44. Ayenu-Prah, A.; Attoh-Okine, N. A criterion for selecting relevant intrinsic mode functions in empirical mode decomposition. Adv. Adapt. Data Anal. 2010, 2, 1–24. [Google Scholar] [CrossRef]
Figure 1. Position of coal mine and lithology histogram. (a) Position of coal mine. (b) Lithology histogram.
Minerals 12 00063 g001
Figure 2. AE and EMR monitoring system and sensors layout.
Minerals 12 00063 g002
Figure 3. Time-frequency analysis process.
Minerals 12 00063 g003
Figure 4. Different types of EMR signals. (a) EMR signal of environmental noise (EMR-EN). (b) EMR signal induced by drilling (EMR-Drill). (c) EMR signal induced by scraper loader (EMR-SL). (d) EMR signal with danger of coal and gas outburst (EMR-Danger).
Minerals 12 00063 g004
Figure 5. Different types of AE signals. (a) AE signal of environmental noise (AE-EN). (b) AE signal induced by drilling (AE-Drill). (c) AE signal induced by scraper loader (AE-SL). (d) AE signal with danger of coal and gas outburst (AE-Danger).
Minerals 12 00063 g005
Figure 6. Decomposition signals. (a) EMR signal. (b) AE signal.
Minerals 12 00063 g006
Figure 7. Reconstructed signals. (a) EMR signal. (b) AE signal.
Minerals 12 00063 g007
Figure 8. Time-frequency plane of EMR signals. (a) Environmental noise. (b) Drilling. (c) Scraper loader. (d) Danger signal.
Minerals 12 00063 g008
Figure 9. Time-frequency plane of AE signals. (a) Environmental noise. (b) Drilling. (c) Scraper loader. (d) Danger signal.
Minerals 12 00063 g009aMinerals 12 00063 g009b
Figure 10. Decomposition result of the two dangerous signals. (a) AE signal. (b) EMR signal.
Minerals 12 00063 g010
Figure 11. Comparison between the original signal and the filtered signal (AE).
Minerals 12 00063 g011
Figure 12. Comparison between the original signal and the filtered signal (EMR).
Minerals 12 00063 g012
Figure 13. Time-frequency plane of danger signals. (a) Reconstructed AE signal based on d1d6 components. (b) Reconstructed EMR signal based on d1d8 components. (c) Reconstructed AE signal based on d3d5 components. (d) Reconstructed EMR signal based on d6d7 components.
Minerals 12 00063 g013
Table 1. Similarity and critical value of the decomposed signals and the original signal.
Signal Numberd1d2d3d4d5d6Critical Value
EMR-EN0.24300.30470.39670.50170.51420.22770.2401
AE-Drill0.42030.43160.38190.32160.31620.15710.3279
Publisher’s Note: MDPI stays neutral with regard to jurisdictional claims in published maps and institutional affiliations.

