Abstract
Thermodynamic modeling was undertaken of hypergene processes in loparite ore concentration tailings at a temperature of 3 °C and 20 °C. We investigated water evaporation in the top layers of tailings in the summer months at low filtration coefficients. It was found that the main anions of pore solutions are CO32−, HCO3−, SO42−, HSiO3−, and cations—Na+ and K+. The main forms of REE migration have been revealed: lanthanum and cerium. Dominant newly formed phases in the system were shown to be gibbsite and goethite, minerals of the smectite group, muscovite, feldspars, silica, mica, apatite, secondary nepheline minerals, and strontianite.
1. Introduction
The Murmansk Region is one of the most developed mining regions of the Russian Federation’s Arctic zone and is home to major mining and mineral processing operations. Almost all operations have been active for decades. Mining industry’s activity in Russia’s Murmansk Region has not only laid the foundation for the region’s prosperity, but also led to a range of problems associated with itsnegative impact on the environment and public health.
Lovozerskiy GOK LLC is currently processing the lower horizons of the Karnasurt and Kedykvyrpakhk blocks of its Karnasurt Mine at the Lovozeroloparite ore deposit. The ores contain predominantly cerium lanthanides. The mine has enough commercial ore reserves to support more than 70 years of operation. The loparite ore with an average loparite grade of 2.4% is processed at the Karnasurt Concentrator in a gravity circuit, followed by cleaner flotation and upgrading of the rougher concentrate by electric and magnetic separation. The salable product is a loparite concentrate containing an average of 35–38% TiO2, 28–30% REE oxides, 7.5–8.0% Nb2O5, and 0.5–0.8% Ta2O5.
When loparite ores are concentrated, processing wastes are formed, including concentration tailings, which are sent as part of the slurry to a tailings storage facility. Concentration tailings are known to pose a threat to the environment due to the processes of weathering and transition into a soluble form of environmentally hazardous elements [1]. Observed and predicted climate change is likely to affect the mechanisms and intensity of hypergene processes during tailings storage and their impact on the environment. Studying the impact of climate change on the activities of mining operations in the Arctic is an urgent research and applied task.
Various modeling methods are widely used to study hypergene transformations of minerals, as well as to assess and predict environmental pollution during ore mining and storage of mining and ore processing waste [2,3,4,5,6,7,8,9,10], etc.
Such programs as PHREEQC andGeochemist’s Workbench (GWB) are known abroad. In Russia, the most famous software products are based on minimizing the Gibbs free energy: HCh (GIBBS) Yu.A. Shvarov, Moscow State University, Moscow and “Selektor” I.K. Karpov et al., Institute of Geochemistry SB RAS, Irkutsk.
The theoretical foundations of physical and chemical modeling include equilibrium conditions in heterogeneous multicomponent systems with restrictions in the form of linear mass balance equations. Mathematically, the calculation of multicomponent systems is reduced to solving the convex programming problem, thermodynamically—to finding the minimum Gibbs energy of an equilibrium thermodynamic system.
The main difference between the Gibbs free energy minimization method and calculations based on equilibrium constants is that there is no need to draw up reaction equations, which is of decisive importance in the study of complex systems in which all reactions may be unknown or not taken into account.
Thermodynamic calculation has a great advantage, because the mechanism of water-rock interaction, in addition to solid phases, includes a wide range of water particles of various forms of existence of elements and their complexes. All this makes it possible to obtain completely new genetic information that is not available using other methods.
The software suite Selektor is widely used in Russia [11]. Selektor PC is a universal tool for solving physical and chemical problems based on the calculation of complete, metastable and intermediate equilibria in systems and mega-systems. At present, the Selektor software uses a modification of the interior point method (MVT-2), which allows obtaining ultra-precise calculation results. In particular, in recent years, the software was used to conduct a number of interesting studies of anthropogenic systems in Siberia and the Far East [12,13,14].
Thermodynamic modeling of hypergenesis of the Allarechenskoye deposit overburden dumps and copper-nickel ore concentration tailings located in the Pechenga region of the Murmansk region is presented in [15,16].
Previously, we carried out studies of different-age tailings of loparite ore dressing [17,18,19]. The geotechnical characteristics of the selected samples have been determined and their material composition and radiation characteristics have been investigated. However, these data do not allow full determination of the features of hypergene processes, or the forms of migration of elements, including REE, passing into the aqueous phase. At the same time, these data are useful not only for assessing and predicting the ecological hazard of tailings, but also for developing promising technologies for extracting valuable metals. That is why the purpose of this work was to study the hypergene processes in the tailings of loparite ores under the conditions of various temperatures and modes of moistening using the method of thermodynamic modeling using the Selektor software package.
2. Materials and Methods
2.1. Study Area
The tailings storage facility at the Karnasurt Concentrator is made up of two sites (Figure 1). The first site was active from 1951 to 1985. Loparite ore concentration tailings deposited over those years amounted to 6.7 million tons. Since 1985, the slurry has been discharged into the second site of the tailings storage facility, which currently holds approximately 11 million tons and grows by 400–450 thousand tons annually.
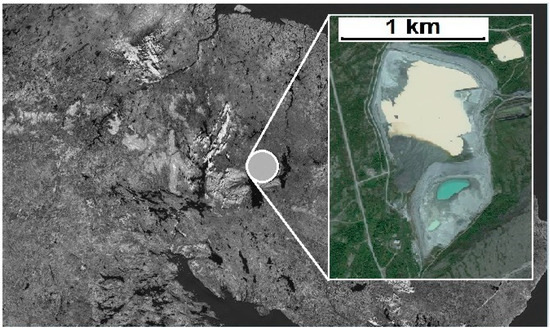
Figure 1.
Tailings pond.
The predominant minerals are nepheline, feldspar, and aegirine. The average loparite grade of the tailings is 0.63–0.94%, and the eudialyte grade is 0.01–0.09%.
The climate at the tailings storage facility location is characterized by long (up to 7 months) but relatively mild winters. The temperature regime during the year is unstable, causing frequent thaws in the winter and sudden cooling in the summer. The average annual air temperature is −1.5 °C.
2.2. Thermodynamic Modeling
Physicochemical modeling of hypergene processes in the tailings minerals was carried out using the Selektor software suite [11]. Selektor has built-in thermodynamic databases and a module for building models of varying complexity. The algorithm used, based on minimizing the Gibbs potential of the system being modeled by convex programming, supports calculations of complex chemical equilibria in isobaric-isothermal, isochemical, and adiabatic conditions in multisystems with the simultaneous presence of an aqueous electrolyte solution, gas mixture, liquid and solid hydrocarbons, and minerals in the form of solid solutions and single-component phases.
In this study,the basic water-rock-gas model was applied, which includes a wide range of independent components (Al—Ba—Ar—He—Ne–C—Ca—Cl—F—Fe—K—Mg—Mn—N—Na—P—S—Si—Sr—Ce—La—Th—Ti—Nb—Zr—H—O–e−), where e− is an electron. The model included 996 dependent variables, including 369 in the aqueous solution, 76 in the gaseous phase, 111 liquid hydrocarbons, 440 solid phases, and organic and mineral substances. The necessary thermodynamic information was adopted from the built-in databases (Table 1).

Table 1.
A quick reference to the thermodynamic databases included in the model.
The necessary steps for the development of the model were sampling and studying the properties of the current production tailings. Since the heterogeneity of the engineering-geological characteristics and the material composition of the tailings was previously established, samples were taken directly from the sump at the concentrator before the slurry was unloaded at the tailings dump.
For sieve analysis, a 200 g sample was taken by quartering and dried to an air-dry state. The prepared sample was weighed with an accuracy of 0.1 g. Then, the material was sieved on an AS-200U impact sieve analyzer using sieves 1 mm, 0.5 mm, 0.25 mm, 0.1 mm, and 0.05 mm in size and a tray. A complete mineralogical analysis of the selected samples was carried out in accordance with the requirements of the guidelines and guidelines of the Scientific Council for Mineralogical Research Methods (MU NSOMMI) No. 41 “Quality management of mineralogical works”, “Preparation of samples for mineralogical analyzes”, and MR NSOMMI No. 89 “Semi-quantitative mineralogical analysis of schlich and crushed samples”.
Based on the results of the analysis of the granulometric composition of the selected samples, it can be concluded that they are classified as fine and medium-grained sands. The predominant fractions are −0.5 + 0.25 mm and −0.25 + 0.1 mm. The coefficient of variation for almost all fractions exceeds 0.33, which indicates the inhomogeneity of the relative content of particles of a given size in certain samples. Taking into account the relatively high content of fine particles (the yield of the fraction is −0.1 + 0.05 mm on average 11.9%, −0.05 mm is about 5%), when the surface of the tailings dumps dries up in summer and the rapid loss of moisture in the upper layers of tailings due to wind erosion, there is a high probability of dusting.
Aeolian transport, along with the hypergenesis of minerals, the transition to soluble forms and the migration of pollutants, must be taken into account as one of the mechanisms for the spread of pollutants in the environment.
Table 2 shows the mineral composition of the tailings used in the model to calculate the equilibrium in the water-rock-gas system, where water isatmospheric precipitation, rock is a 100 g tailings sample, and gas is atmospheric air.
Table 2.
Average mineral composition of the loparite ore concentration tailings.
Composition of 1 kg of atmosphere, mol: Ar 0.3209, C 0.01036, N 53.9478, Ne 0.000616, and O 14.48472 [11]. The boundary conditions of the model are the rock composition, the amount of water, and 1 kg of the atmosphere.
The calculations were carried out at temperatures of 3 °C and 20 °C and a total pressure of 105 Pa. The amount of water in the system was 0.5 L. The estimated model values of the rainwater pH at the indicated temperatures were 5.60 and 5.65, respectively. The evaporation process was studied at 0.05 and 0.01 L of water.
A temperature of 3 °C was chosen as the average temperature in May and fall months (September, October). In the spring, the snow cover melts at this time, and in the fall a new one forms in October. The temperature of 20 °C corresponds to the average maximum temperature of the warmest month of the year—July.
At the stage of water transport and storage, there is already a differentiation of the tailings material in terms of size and density, which then continues during storage as a result of suffusion and hypergene processes. This leads to a significant heterogeneity of the mineral composition of the tailings.
Due to the heterogeneous composition of the tailings, a hypothetical averaged mineral composition was used in the model. The processes developing in the tailings are much more complicated.
Thus, the model shows general trends in the course of hypergene processes, changes in the mineral composition and pore solutions of tailings, depending on external conditions.
The mole number of the solid phase v participating in the interaction, or the degree of interaction, i.e., the number of tailings that have reacted, simulates the course of a chemical process by varying the proportion of the reacting substance. The mole number varied from 10−6 to 1. In the figures, the relationships are shown using a logarithmic scale: v = 10ξ or lg v = ξ.
In order to verify the model, the simulation results were compared with the data of the analysis of loparite ore dressing tailings aqueous leaching solutions at 20 °C [17]. The selected tailings samples were treated with distilled water in the ratio Solid:Liquid = 1:10; the resulting solutions were filtered through an MFAS OS—2 membrane filter (pore size 0.45 µm). Water leach solutions were analyzed by different methods: inductively coupled plasma mass spectrometry (REE), ion exchange chromatography (SO42−), and flame atomic adsorption spectrometry (K, Na, Al, Si et al.), direct potentiometry (F−). Comparison of the contents of elements in the model and experimental solutions is presented in Section 3.
The thermodynamic model makes it possible to establish equilibrium mineral associations under given environmental conditions; that is, in the end result, we obtaina list of the most stable minerals from potentially possible ones. In our work, we specified secondary materials of hypergene transformation in accordance with the results of mineralogical analysis of stale tailings stored in open conditions for more than 30 years. These data are presented in our publications [17,18].
3. Results and Discussion
Table 3 presents the values of the redox potential (Eh) and pH of the system at different ξ and temperature values. The redox potential is at maximum when the degree of interaction is equal to 10−6 moles of solid phase, then decreases monotonically. Eh-ξ curve shape is identical at 3 °C and 20 °C, while the redox potential of the system at 3 °C is 0.02–0.04 V more positive than at 20 °C.
Table 3.
Change in Eh, pH and concentrations of prevailing ions depending on the degree of interaction at temperatures of 3 °C and 20 °C.
The pH values of the system at 3 °C and 20 °C are practically the same. The lowest pH value is observed at ξ = −6, followed first by a smooth, then a more significant, shift of the pH to the alkaline region.
In the earlier conducted field and laboratory studies, the pH of pore solutions in loparite ore concentration tailings at 20 °C was 8.3 ± 0.2. These values correspond to the degree of interaction in the range from 10−3.0 to 10−2.5 solid phase mole.
Changes in the concentrations of anions prevailing in the system depending on ξ at 3 °C and 20 °C are shown in Table 3.
One of the main anions in the system is CO32−. C-ξ curves are identical at 3 °C and 20 °C. C -ξ curves show maxima at ξ = −1 at 3 °C and 20 °C.
The bicarbonate ion is also characterized by high concentrations. C -ξ curves show maxima at ξ = −1.5 at 3 °C and 20 °C. Starting from ξ = −1, the concentration of HCO3− in the solution is lower at a temperature of 3 °C.
Concentration of metasilicic acid anion HSiO3− grows with an increase in the degree of interaction. However, the concentration in the solution is lower at a temperature of 3 °C.
Lower concentrations of polysilicic acid SiO2* are also observed at a temperature of 3 °C.
The concentration of sulfate ions increases with the degree of interaction. C-ξ curves are identical at 3 °C and 20 °C.
The same applies to fluorine ions—concentration thereof increases with increasing ξ.
Changes in the concentrations of metals depending on ξ at 3 °C and 20 °C are shown in Table 3.
Concentration of sodium ions—the dominant cation—naturally grows with an increase in the degree of interaction, while the C-ξ patterns for a given metal are identical at 3 °C and 20 °C.
More interesting C-ξ patterns were observed at temperatures of 3 °C and 20 °C in potassium ions. Starting from ξ = −4, the increase in the concentration of metal ions slows down significantly and stops at ξ = −1.5, and then resumes. The transition of potassium ions is more intense at 20 °C.
The concentration of calcium and magnesium ions increases with an increase in the degree of interaction, reaching a maximum at ξ = −1.5, and then decreases. C-ξ curves for these metals are similar at 3 °C and 20 °C.
The C-ξ curve for strontium ions is similar, with the maximum concentration observed at ξ = −3.
Aluminum in solution is present mainly as the Al(OH)4− anion. It is characterized by an increase in concentration with increasing ξ. Further, the concentrations are significantly (sometimes by an order of magnitude) higher at 20 °C.
The behavior of REEs is also of interest. Figure 2 and Figure 3 show changes in the concentrations of dissolved forms of lanthanum and cerium as a function of ξ at 3 °C and 20 °C.
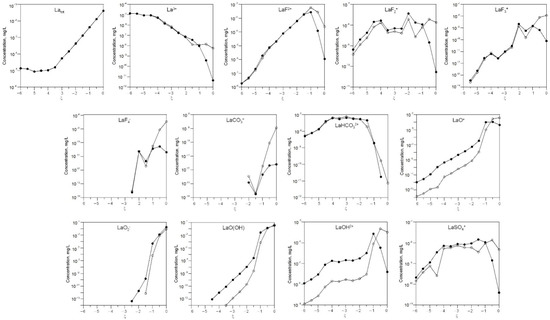
Figure 2.
Change in the concentrations of dissolved lanthanum depending on ξ at 3 °C (white) and 20 °C (black).
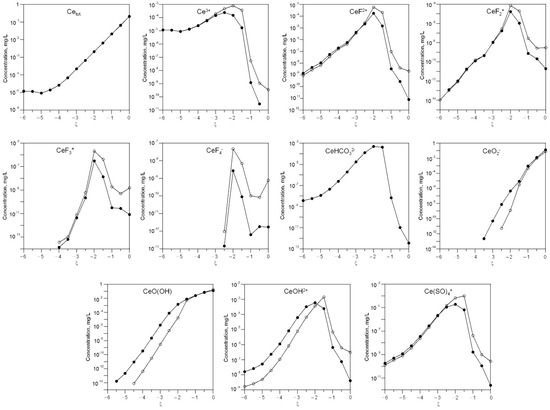
Figure 3.
Change in the concentrations of dissolved cerium depending on ξ at 3 °C (white) and 20 °C (black).
As can be seen, the gross concentrations of lanthanum and cerium are the same at 3 °C and 20 °C.
At low ξ, the predominant dissolved forms are La3+ and Ce3+, while LaO(OH)and CeO(OH), LaO2− and CeO2− dominate at high ξ.
Figure 4 shows the content of the main newly formed mineral phases depending on ξ.
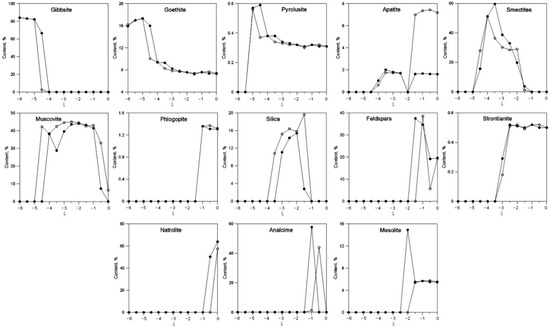
Figure 4.
Change in the contents of newly formed minerals depending on ξ at 3 °C (white) and 20 °C (black).
Gibbsite forms at −6 < ξ < −4. At low ξ, this is the dominant mineral in the system. Goethite content increases slightly at −6 < ξ < −5, then sharply decreases and remains approximately at the same level. Note that the dependences of the content of these hydroxides on ξ are similar at 3 °C and 20 °C. Pyrolusite, a manganese oxide, forms in extremely small quantities.
The main layered hydrosilicates in the system are minerals from the smectite group and muscovite. Smectites form at −5 < ξ < −1. Maximum content exceeds 50%. Muscovite forms at −4.5 < ξ < 0 at 3 °C and at −4 < ξ < −0.5 at 20 °C. Note that the content of this mineral is higher at lower temperatures.
Higher contents of apatite are observed at 3 °C at high ξ levels.
Silica forms at −4 < ξ < −1 at 3 °C and at −3.5 < ξ < −1 at 20 °C. Its maximum content is also higher at 3 °C.
Feldspars form at high ξ values. The same applies to phlogopite and minerals secondary to nepheline—natrolite, analcime, and mesolite.
We also note the formation of strontium carbonate—strontianite.
In Figure 5 as an example, the concentrations of the main cations in the resulting solutions obtained during the experiments are shown in comparison with the model data. Comparison of data in Table 2 and Figure 4 allows us to conclude that the model adequately describes the composition of tailings solutions after long-term storage. Probably, under these conditions the system “solution–rock–atmosphere” is closer to the achievement of equilibrium. The degree of interaction v is in the range from 10–3.5 to 10–2.5 mole of the solid phase. The same v regions correspond to the experimentally recorded pH values.
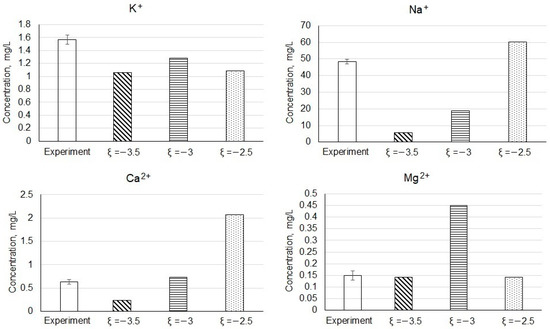
Figure 5.
Comparison of the concentrations of the main cations in the resulting solutions obtained in the course of experiments with the simulation data.
The concentrations of cerium and lanthanum in the experimental solutions are 0.036 ± 0.009 and 0.019 ± 0.006 mg/L, respectively. These concentrations correspond to model values of the degree of interaction in the range from 10–1 to 10–0.5 mole of the solid phase. It is interesting to note that REEs of the light group are concentrated mainly in the finely dispersed material of the tailings [18,19]. In our model, the reduction in the particle size of the tailings can be taken into account by increasing v.
The behavior of the system during evaporation was further examined.
Table 4 presents the values of Eh and pH of the system at different ξ and water content.
Table 4.
Change in Eh, pH, and concentrations of prevailing ions at 0.05 and 0.01 L of water in the system.
The redox potential is at maximum when the degree of interaction is equal to 10−6 moles of solid phase. The redox potential curves of the solution are qualitatively similar and have a pronounced inflection at ξ = −1. At 0.05 L of water in the system, the Eh values are slightly more positive.
With an increase in ξ, the pH of the solution increases with an inflection in the curves at ξ = −1. The pH values are slightly more positive when the amount of water in the system is 0.01 L.
Table 4 presentsthe changes in the concentrations of the anions prevailing in the system depending on ξ and the amount of water.
With a decrease in the amount of water in the system and with an increase in the degree of interaction, the main anions become more concentrated in the solutions: CO32−, HCO3−, SO42−, HSiO3−. Carbonate and bicarbonate ion curves have maxima at ξ = −1 and −1.5, respectively. As the degree of interaction increases, the concentrations decrease, which is associated with the formation of carbonates. Attention is drawn to a significant increase in the concentration of fluorine ions in the solutions.
Table 4 presentsthe concentration of metal ions in the solution depending on the degree of interaction ξ and the amount of water in the system.
The concentrations of the predominant metals—sodium and potassium ions—increase with increasing ξ. The concentrations of alkaline earth metals—calcium, magnesium, and strontium—are related to the maxima. At the same time, in a certain range of ξ values, their concentrations are higher when the amount of water in the system is 0.05 L. Finally, the concentration of aluminum (the predominant soluble form Al(OH)4−) grows with increasing ξ.
Figure 6 and Figure 7 show the change in the concentration of the dissolved forms of lanthanum and cerium depending on the degree of interaction ξ and the amount of water in the system.
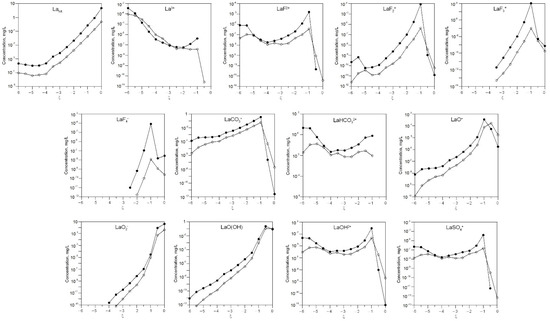
Figure 6.
Change in the concentration of the dissolved forms of lanthanum in the solution depending on the degree of interaction ξ and 0.05 L (white) and 0.01 L (black) of water in the system.
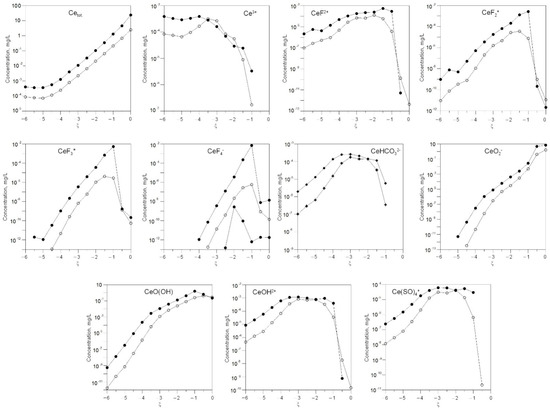
Figure 7.
Change in the concentration of the dissolved forms of cerium in the solution depending on the degree of interaction ξ and 0.05 L (white) and 0.01 L (black) of water in the system.
With a decrease in the amount of water in the system, the gross concentrations of lanthanum and cerium increase. At low ξ, La3+ and Ce3+ ions dominate. At high ξ, LaO2− and CeO2− become the main water-soluble forms.
Figure 8 shows the content of newly formed mineral phasesdepending on the degree of interaction ξ and the amount of water in the system.
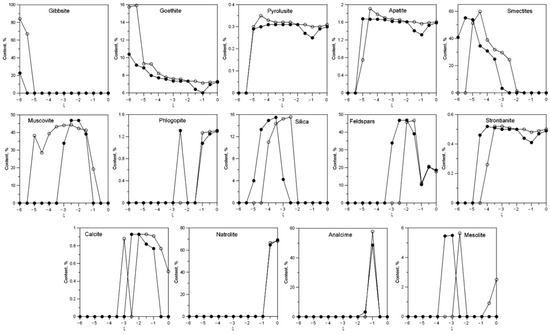
Figure 8.
Content of newly formed mineral phases depending on the degree of interaction ξ and the amount of water in the system: 0.05 (white) and 0.01 (black).
Gibbsite forms at −6 < ξ < −5.5 and 0.05 L of water, and at −6 < ξ < −5.5 and 0.01 L of water. Its content is much higher when the amount of water in the system is 0.05 L. Goethite is stable in the entire ξ range, and the content is higher when the amount of water in the system is 0.05 L. Small amounts of pyrolusite also form.
The main layered hydrosilicates are smectites and muscovite. Smectites forms at −5.5 < ξ < −2 and 0.05 L of water, and at −6 < ξ < −2.5 and 0.01 L of water. At low ξ, these are the main newly formed mineral phases in the system. Muscovite forms at −4.5 < ξ < 0 and 0.05 L of water and at −4 < ξ < −0.5 and 0.01 L of water. The maximum content of this mineral is over 40%.
Apatite forms at −4 < ξ < −1 and 0.05 L of water, and at −3.5 < ξ < −1 and 0.01 L of water. Higher contents of apatite are observed at 3 °C at high ξ.
Silica forms at −4 < ξ < −1 and 0.05 L of water and at −3.5 < ξ < −1 at 20 °C.
Calcite forms at −3 < ξ < 0 and 0.05 L of water and at −2.5 < ξ < −0.5 and 0.01 L of water.Strontianite forms at −4.5 < ξ < 0 and 0.05 L of water and at −5 < ξ < −0 and 0.01 L of water. In addition, at high ξ, other carbonates also formnatrite Na2CO3 10H2O and trona Na2Ca (CO3)2(H2O)2 (not shown in Figure 8).
At the initial stages of interaction, La and Ce ions are in solution in the form of trivalent ions. Considering the strong ability of REEs to complex formation with many organic and inorganic ligands, it is in this form that they pose a particular danger when migrating to adjacent media. When in ionic form in the soil and when interacting with solutions containing natural organic matter, REEs will undergo a wide range of chemical transformations, and can both be deposited in soils and bottom sediments, and migrate further in the form of complexes.
Modeling has shown that the more precipitation of newly formed stable phases and, accordingly, the removal of matter from a highly unstable solution into the sediment, the greater the ratio of water to rock. Accordingly, with an increase in the amount of atmospheric precipitation and flood waters, lanthanum and cerium will be actively removed from the tailing dump in solutions, with the possibility of being deposited in nearby soils. In our previous work [23], elevated concentrations of REEs, including lanthanum and cerium, were found along the perimeter of the tailing dump, which confirms this assumption.
4. Conclusions
Thermodynamic modeling of hypergene processes in loparite ore concentration tailings supports the following conclusions:
- (1)
- The predominant anions in the pore solutions are CO32−, HCO3−, SO42−, and HSiO3−. With an increase in ξ and a decrease in the amount of water in the system to 0.05 and 0.01 L, the concentration of fluorine ions in the solutions increases significantly.
- (2)
- The concentrations of the predominant metals—sodium and potassium ions—increase with increasing ξ. The predominant soluble form of aluminum is Al(OH)4−, anion concentrations grow with increasing ξ. At low ξ, La3+ and Ce3+ ions dominate. At high ξ, LaO(OH) и CeO(OH), LaO2−, and CeO2− become the main water-soluble forms.
- (3)
- With a decrease in the amount of water in the system, the solutions become more concentrated in terms of basic ions.
- (4)
- Dominant newly formed phases in the system are gibbsite and goethite, minerals of the smectite group, muscovite, feldspars, silica, mica, apatite, secondary nepheline minerals, and strontianite. With evaporation and a low filtration rate of water in the top layers of the tailings (an increase in ξ and a decrease in the amount of water in the system), the composition and ratio of newly formed mineral phases change.
- (5)
- Our modeling showed that the processes progress qualitatively similarly in the system at 3 °C and 20 °C. Thus, chemical weathering can occur in both spring and fall. Increase in average seasonal temperatures and the duration of the frost-free and snowless periods will lead to a longer period with active hypergene processes and negative environmental impacts on the surrounding areas.
Author Contributions
Conceptualization, S.M., E.K., D.M. and V.M.; methodology, S.M., E.K. and D.M.; software, S.M., E.K. and D.M.; investigation, S.M., E.K. and D.M.; writing—original draft preparation, S.M., E.K., D.M. and V.M.; writing—review and editing, S.M., E.K., D.M. and V.M.; funding acquisition, D.M. All authors have read and agreed to the published version of the manuscript.
Funding
This research was funded by Russian government grant nos. 0226-2019-0011 and 0226-2019-0047. The research was financially supported by the Russian Foundation for Basic Research (projects No. 18-05-60142 Arctic and No. 19-05-50065 Microcosm) and by the Kolarctic CBC 2014–2020 programme, project no. KO1030 Supporting Environmental Economic and Social Impacts of Mining Activity.
Data Availability Statement
Not applicable.
Conflicts of Interest
The authors declare no conflict of interest.
References
- Lottermoser, B.G. Mine Wastes. Characterization, Treatment and Environmental Impacts; Springer: Berlin/Heidelberg, Germany, 2010; 400p. [Google Scholar]
- Heikkinen, P.M.; Räisänen, M.L.; Johnson, R.H. Geochemical characterisation of seepage and drainage water quality from two sulphide mine tailings impoundments: Acid mine drainage versus neutral mine drainage. Mine Water Environ. 2009, 28, 30–49. [Google Scholar] [CrossRef]
- Flores, A.N.; Rubio, L.M.D. Arsenic and metal mobility from Au mine tailings in Rodalquilar (Almería, SE Spain). Environ. Earth Sci. 2010, 60, 121–138. [Google Scholar] [CrossRef]
- Plante, B.; Benzaazoua, M.; Bussière, B. Predicting geochemical behaviour of waste rock with low acid generating potential using laboratory kinetic tests. Mine Water Environ. 2011, 30, 2–21. [Google Scholar] [CrossRef]
- Meima, J.A.; Graupner, T.; Rammlmair, D. Modeling the effect of stratification on cemented layer formation in sulfide-bearing mine tailings. Appl. Geochem. 2012, 27, 124–137. [Google Scholar] [CrossRef]
- Moncur, M.C.; Ptacek, C.J.; Hayashi, M.; Blowes, D.W.; Birks, S.J. Seasonal cycling and mass-loading of dissolved metals and sulfate discharging from an abandoned mine site in northern Canada. Appl. Geochem. 2014, 41, 176–188. [Google Scholar] [CrossRef]
- Maest, A.S.; Nordstrom, D.K. A geochemical examination of humidity cell tests. Appl. Geochem. 2017, 81, 109–131. [Google Scholar] [CrossRef] [Green Version]
- Muniruzzaman, M.; Karlsson, T.; Kauppila, P.M. Modelling tools for the prediction of drainage quality from mine wastes. In Improving the Environmental Properties, Utilisation Potential and Long-Term Prediction of Mining Wastes; Kauppila, P.M., Tarvainen, T., Eds.; Bulletin 408; Geological Survey of Finland: Espoo, Finland, 2018; pp. 27–42. [Google Scholar]
- Battistela, M.; Muniruzzamana, M.; Onsesa, F.; Lee, J.; Rolle, M. Reactive fronts in chemically heterogeneous porous media: Experimentaland modeling investigation of pyrite oxidation. Appl. Geochem. 2019, 100, 77–89. [Google Scholar] [CrossRef]
- Drapeau, C.; Argane, R.; Delolme, C.; Blanc, D.; Benzaazoua, M.; Hakkou, R.; Baumgartl, T.; Edraki, M.; Lassabatere, L. Lead Mobilization and Speciation in Mining Waste: Experiments and Modeling. Minerals 2021, 11, 606. [Google Scholar] [CrossRef]
- Chudnenko, K.V. Thermodynamic Modeling in Geochemistry: Theory, Algorithms, Software, Applications; Academic Publishing House GEO: Novosibirsk, Russia, 2010; 287p. (In Russian) [Google Scholar]
- Kemkina, R.A.; Kemkin, I.V. Chemical Composition of Ores and Mineralogical and Geochemical Assessment of Potential Environmental Pollution by Toxic Elements (a Case Study of the Prasolovskoye Au-Ag Deposit); Dalnauka: Vladivostok, Russia, 2007; 212p. (In Russian) [Google Scholar]
- Kemkin, I.V.; Kemkina, R.A. Assessment of the degree of negative impact of ore concentration waste on the drainage system by computer modeling. Min. Inf. Anal. Bull. 2019, 11, 94–105. (In Russian) [Google Scholar] [CrossRef]
- Zvereva, V.P.; Kostina, A.M.; Lysenko, A.I. The origin of hypergene and anthropogenic minerals in the mining industry’s engineered systems (a case study of Dalnegorsk District, Primorye Region of Russia). Proc. RMO 2019, CXLVII, 50–60. (In Russian) [Google Scholar]
- Mazukhina, S.I.; Sandimirov, S.S.; Makarov, D.V. Thermodynamic modeling of the hypergenesis of the Allarechensk deposit tailing dumps when exposed to different temperatures and moisture levels. Chem. Sustain. Dev. 2019, 27, 489–498. (In Russian) [Google Scholar]
- Mazukhina, S.I.; Masloboev, V.A.; Makarov, D.V. Thermodynamic modeling of hypergene processes in copper-nickel ore concentration tailings when exposed to different temperatures and moisture levels. Chem. Sustain. Dev. 2021, 29, 69–79. (In Russian) [Google Scholar]
- Krasavtseva, E.A.; Makarov, D.V.; Selivanova, E.A.; Maksimova, V.V.; Svetlov, A.V. Mobilization of ecologically hazardous elements from the tailings of loparite ore concentration under the influence of atmospheric precipitation. Geoecology. Eng. Geol. Hydrogeol. Geocryol. 2021, 3, 69–78. (In Russian) [Google Scholar]
- Krasavtseva, E.A.; Makarov, D.V.; Maksimova, V.V.; Selivanova, E.A.; Ikkonen, P.V. Studies of properties and composition of loparite ore mill tailings. Fiz.-TekhnicheskieProbl. Razrab. Polezn. Iskop. 2021, 57, 190–198. (In Russian) [Google Scholar]
- Krasavtseva, E.; Maksimova, V.; Makarov, D. Conditions affecting the release of heavy and rare earth metals from the mine tailings Kola Subarctic. Toxics 2021, 9, 163. [Google Scholar] [CrossRef] [PubMed]
- Yokokawa, H. Tables of thermodynamic properties of inorganic compounds. J. Nat. Chem. Lab. Indust. 1988, 83, 27–121. [Google Scholar]
- Reid, R.; Prausnic, D.; Shervud, T. Gases and Liquids Properties; Himija: Leningrad, Russia, 1982; 592p. (In Russian) [Google Scholar]
- Johnson, J.W.; Oelkers, E.H.; Helgeson, H.C. SUPCRT92: Software package for calculating the standard molal thermodynamic properties of mineral, gases, aqueous species, and reactions from 1 to 5000 bars and 0 to 1000 °C. Comput. Geo-Sci. 1992, 18, 899–947. [Google Scholar] [CrossRef]
- Krasavtseva, E.A.; Maksimova, V.V.; Gorbacheva, T.T.; Makarov, D.V.; Alfertyev, N.L. Evaluation of soils and plants chemical pollution within the area affected by storages of loparite ore processing waste. Mine Surv. Subsurf. Use 2021, 2, 52–58. (In Russian) [Google Scholar]
Publisher’s Note: MDPI stays neutral with regard to jurisdictional claims in published maps and institutional affiliations. |
© 2021 by the authors. Licensee MDPI, Basel, Switzerland. This article is an open access article distributed under the terms and conditions of the Creative Commons Attribution (CC BY) license (https://creativecommons.org/licenses/by/4.0/).